1. Introduction
Nowadays, Big Data is ubiquitous [
1] and, by definition, the term refers to the enormous amounts of data that is digitally generated by the global population through tools and machines [
2]. According to [
5], at the beginning of 2023 the entire digital universe contained over 44 zettabytes of data, while approximately 2.5 quintillion bytes of data is generated each day. For a decade, Doug Laney's 3Vs model defined Big Data considering the Volume, Variety and Velocity characteristics as the three main challenges when dealing with Big Data [
6]. It became obvious that the 3Vs model was incomplete after continuous work on Big Data [
7], and three more Vs were added to it: IBM introduced Veracity, which represents the unreliability of some data sources [
8]. Oracle introduced Value in 2012 as a defining characteristic of Big Data [
9]. Finally, SAS coined Variability, which refers to the variation of data rates as an additional dimension to Big Data characteristics [
10]. Additional characteristics, such as Viscosity, Virality and Ambiguity, were later proposed by other authors [
4].
A vast amount of Big Data originates from heterogeneous sources with atypical patterns, which produce various kinds of structured, semi-structured, and unstructured data in high frequencies [
11]. This heterogeneous data needs to be treated differently than normal production speed data and be stored in more flexible and/or higher servicing speed data storage architectures or structures compared to classic Relational Databases and Data Warehouses, such as Big Data Warehouses, Data Lakes and Data Meshes. Current literature also shows a trend towards more decentralized data exchange architectures/structures, such as Data Markets and Data Meshes [
12]. The latter two were key targets for many (large) companies and organizations to achieve, which adopted initiatives to facilitate transition from their existing, monolithic data platforms [
13]. One of the main challenges for this transition, in addition to the novelty of the concepts, is how to divide up the data landscape into domains and identify data assets that should be turned into data products [
12]. These organizational challenges are in fact often perceived to be more daunting than the technical challenges associated with Data Mesh design [
14].
The main research contribution of this paper lies with the utilization of Semantic Data Blueprints (SDB) for discovering Data Products and Domains in Data Meshes. Additionally, this work offers a standardized way to transform a Data Lake into a Data Mesh. The set of SDB essentially describes properties of data via stable attributes, such as variety, value, velocity, veracity, and attributes that are not stable over time, such as volume, last source update and keywords. The proposed approach builds upon previous work on the topic that introduced a semantic metadata enrichment mechanism for Data Lakes [
15], which allows for the efficient storing and retrieval of data belonging to dispersed and heterogenous data sources. The same concepts are extended, modified and adapted in this work to match the characteristics of Data Meshes. A Data Mesh is conceived here as the evolution of a Data Lake in terms of organizing huge volumes of information (i.e., Big Data) expressed in multiple data forms (structured, unstructured and semi-structured), but, most importantly, for tracing this information easily, quickly and efficiently. Although both Data Lakes and Data Meshes can offer the backbone for software analytics with useful insights, a Data Mesh provides a more narrowly focused and domain-centric approach. Users can have more control over their data and improve analytics skills, as well as provide more precise insights for software products and procedures by utilizing the Data Mesh principles [
27]. In this context, we propose a new set of semantic blueprints to facilitate the creation of Data Products through a domain-driven approach which allows us to retrieve information directly from its stored location. The proposed approach is demonstrated using real-world manufacturing data collected from a major local industrial player in Cyprus, namely Paradisiotis Group (PARG). Performance is then assessed via the construction of Data Meshes based on various data products and the execution of SPARQL queries that vary in complexity, that is, granularity of information sought and number of data sources.
The remainder of the paper is structured as follows:
Section 2 and 3 discuss the technical background and the related work respectively in the areas of Data Lakes and Data Meshes.
Section 4 presents the extended Data Meshes framework and discusses its main components. This is followed by a qualitative evaluation between Data Lakes and Data Meshed in
Section 5 based on a set of qualitative criteria.
Section 6 demonstrates the applicability and assesses the performance of the proposed framework through a series of experiments conducted using real-world data collected at PARG. Finally, Section 7 concludes the paper and highlights future research directions.
3. Methodology
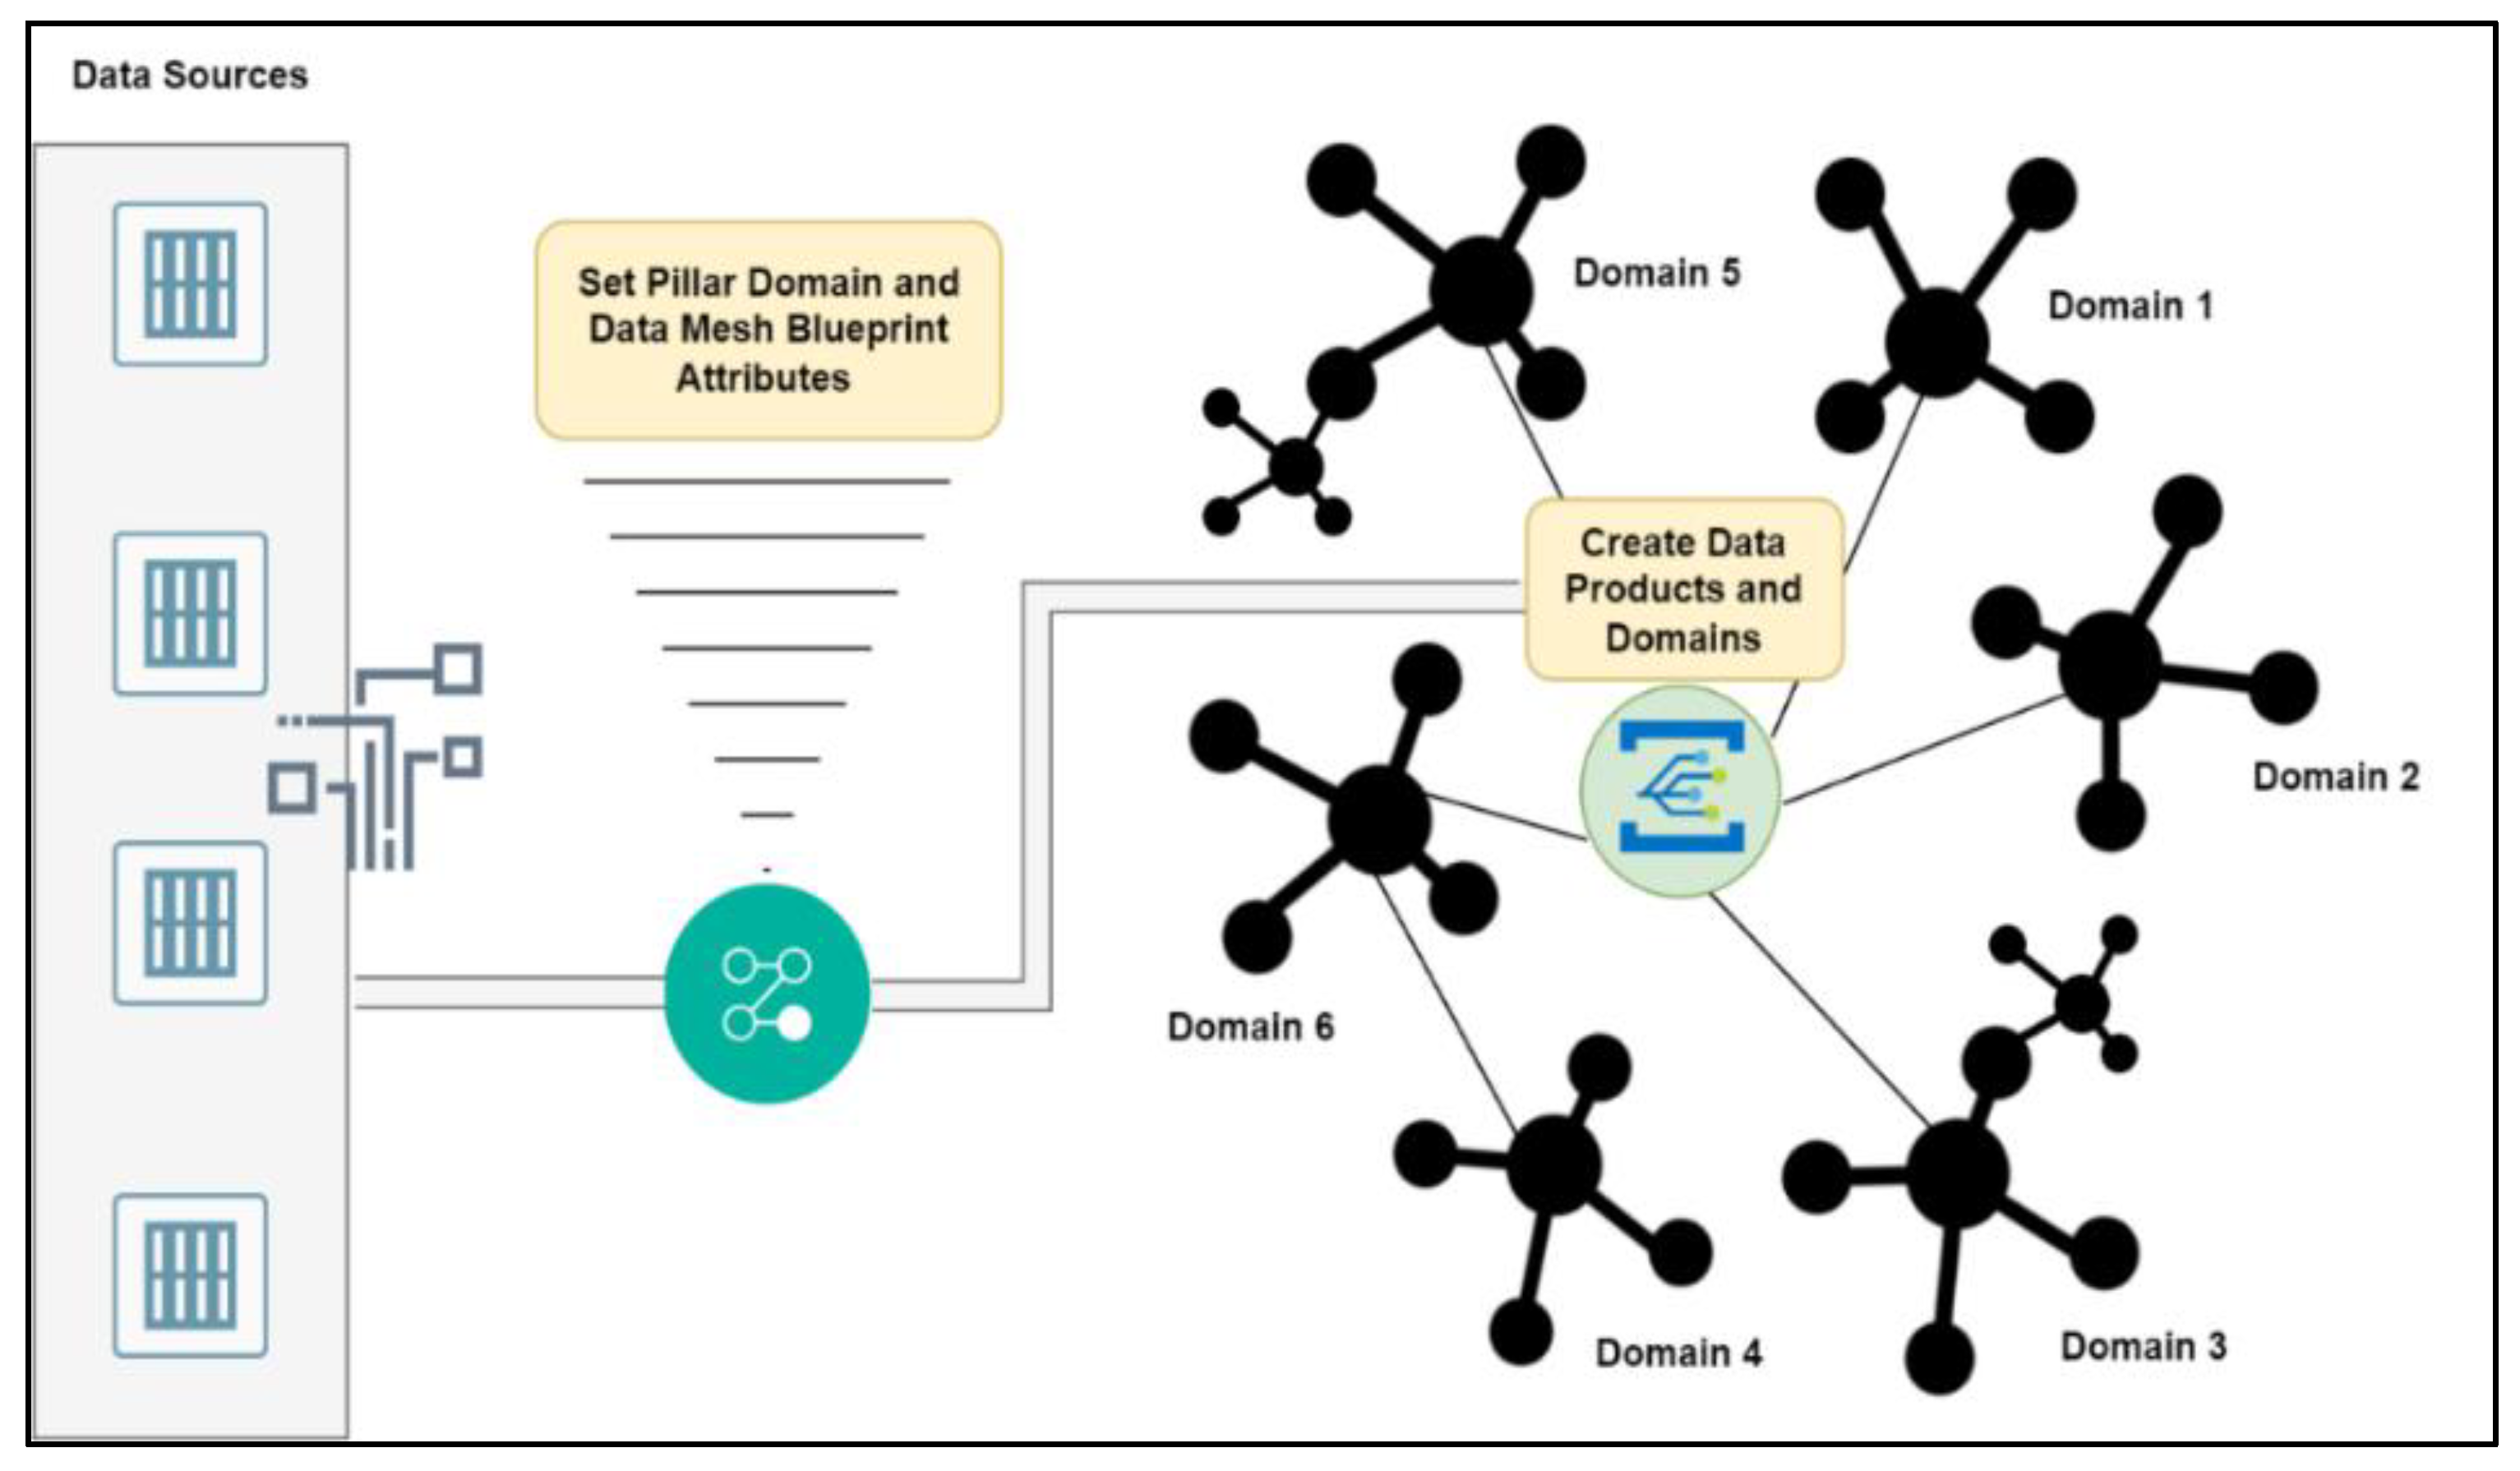
A novel approach for storing and retrieving large amounts of data is proposed here that aims to best serve efficient storing to and retrieval from DLs, while at the same time offering the means to transform a DL to a DM when needed. More precisely, a unique metadata mechanism is established that enables blueprinting to characterize and describe the data sources and data items that are kept in a DL. A novel standardization framework based on this mechanism is also introduced to convert a DL into DMs by discovering Data Products and Domains using Semantic Data Blueprints (see
Figure 2). The framework utilizes standardized descriptions in the form of blueprints to create data products using a domain driven approach. A real-world case-study from the domain of manufacturing is formed to demonstrate the proposed approach.
The data utilized is accessible via this link
https://github.com/mfpingos/TechnologiesMDPI and was collected within the PARG factory (
https://paradisiotis.com/). PARG is one of the most significant local companies and experts in the field of poultry farming and trading of poultry meat in Cyprus. It provides a large assortment of items which are delivered to local supermarkets. The operational procedures and production data of the factory are confidential. Consequently, this paper discloses only a portion of the processes, providing limited details, and utilizes a masked and downgraded version of the data. Nevertheless, the case study sufficiently illustrates the fundamental principles of the proposed framework, validating its applicability and effectiveness.
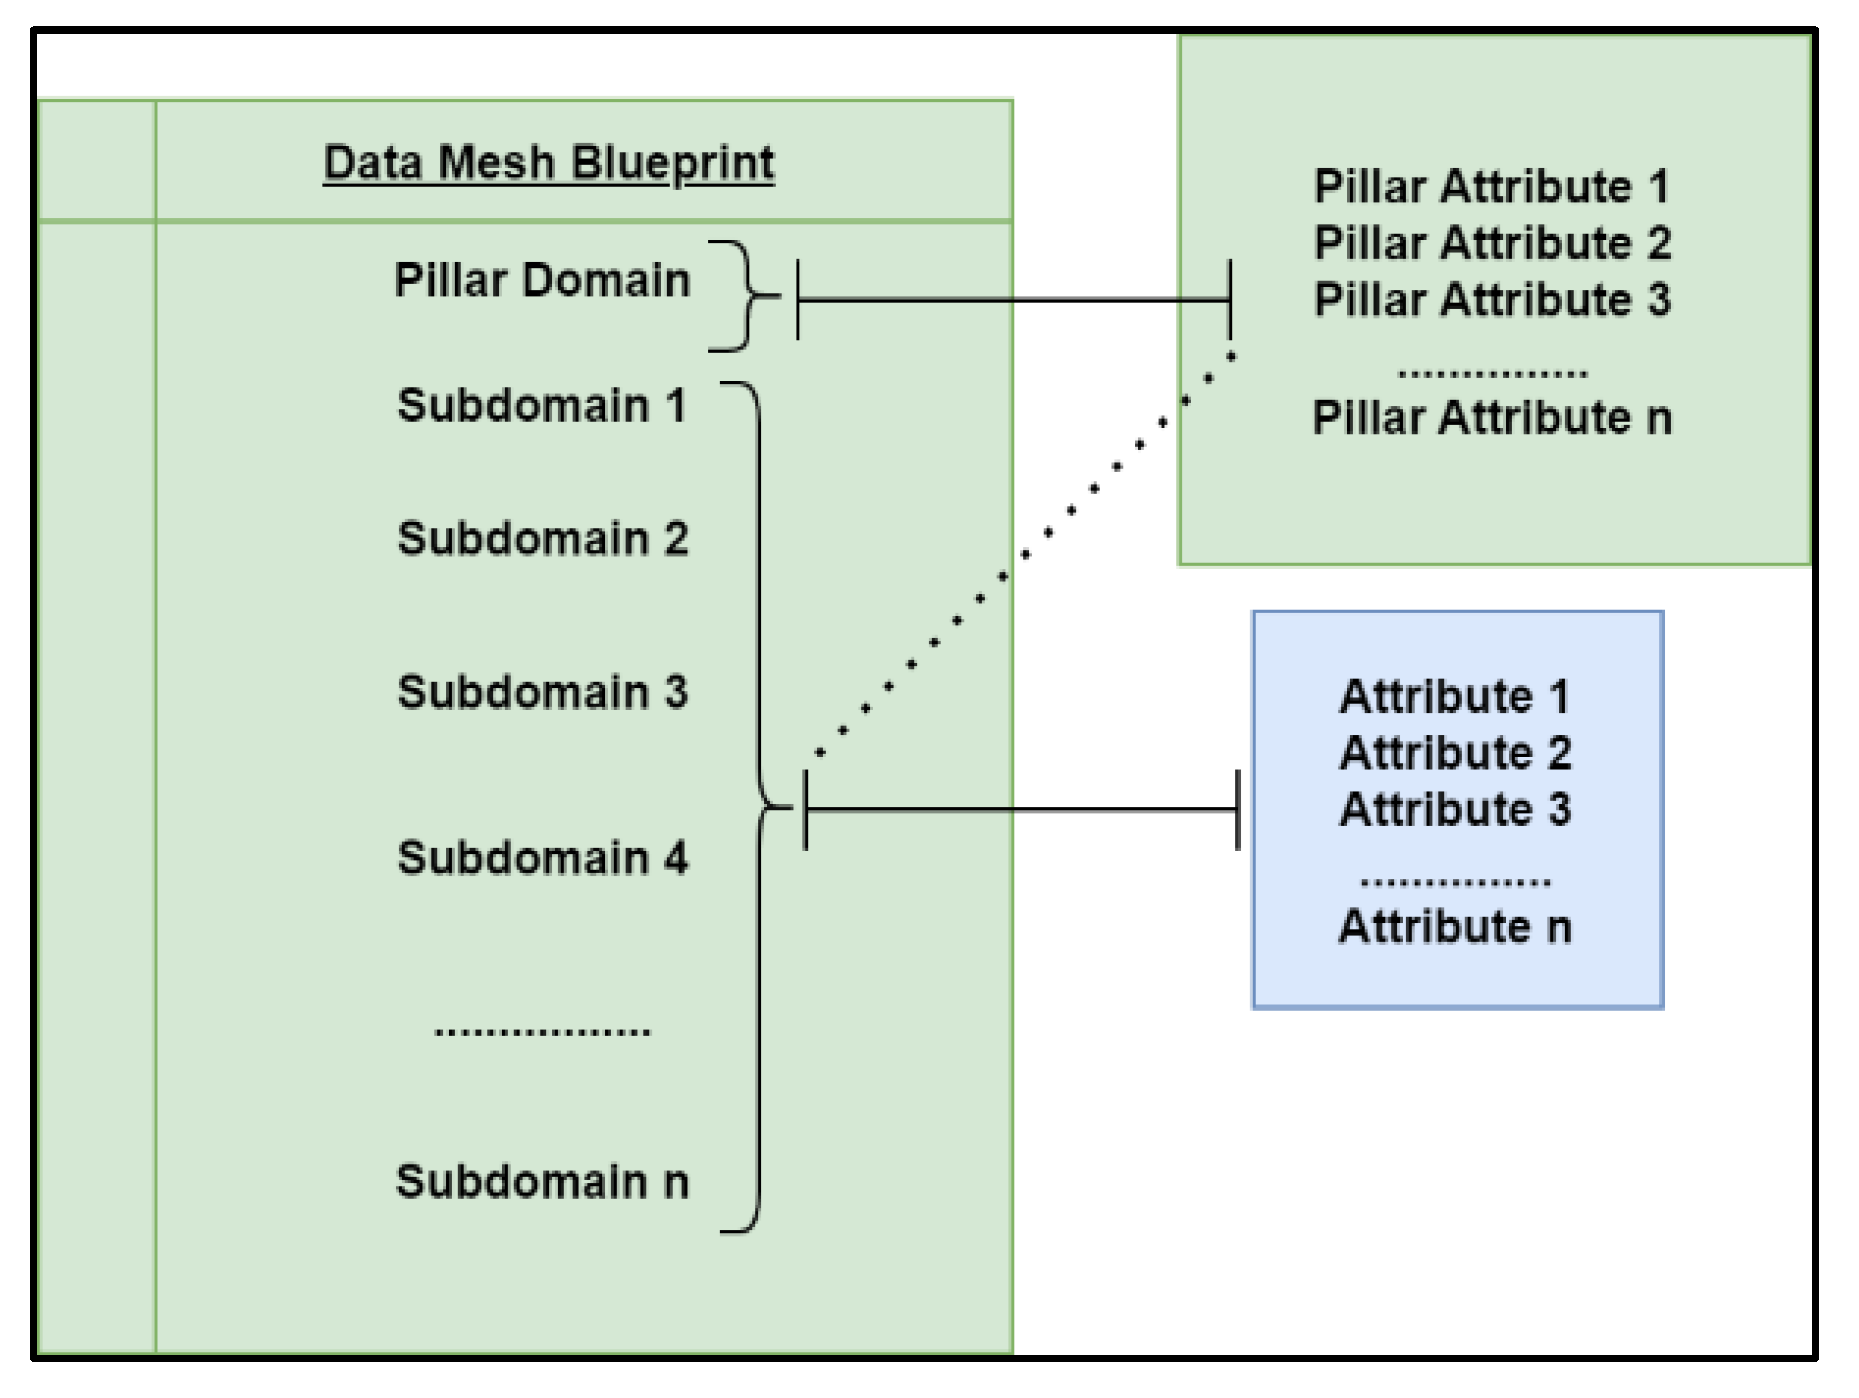
The ability to discover Data Products and Domains while creating DMs is based on a dedicated form of blueprint depicted in
Figure 3. Actually, this may be regarded as a global blueprint that can be applied to any application domain and type of data, not only in the manufacturing area. Specifically, the blueprint provides a standardized form of describing data constituents and contains as a starting point the Pillar Domain, followed by subdomains. Domain attributes are considered the more granular parts of the DM. A Terse RDF Triple Language (TTL) file is created for each level, which is written in XML format and describes the DM blueprint (see sample code provided in GitHub link
https://github.com/mfpingos/TechnologiesMDPI). Using the manufacturing data as example, it will be demonstrated how the DM is constructed by creating appropriate Data Products and Domains using the DM blueprint of
Figure 3. A dedicate Python script (
finalpyoptfinal.py file in GitHub) is developed which utilizes the DL metadata enrichment mechanism to create semantic annotation and enrichment and produce data products according to owner/user needs. The sample data originates from PARG’s systems operating in different locations of the factory and monitoring or facilitating chicken farming. These systems can be considered as data sources collecting data and managing measurements from various sensors within the facilities of the factory. For example, the Flock Daily files contain daily measurements of a specific poultry farming unit's cycle. A typical farming cycle usually spans from 1 to 60 days. These files include daily battery temperatures, minimum/maximum/required temperatures and humidity measurements, with specific timestamps indicating when the sensor readings were captured/sent. Moving to the Flock Hourly files, these consist of hourly measurements for a particular day of the facilities and provide data on hourly required temperature, temperatures of specific sensors, temperatures outside the facility, as well as measurements of humidity and carbon dioxide levels, all with corresponding timestamps for sensor data transmission. Examples of these data are also uploaded on GitHub (
https://github.com/mfpingos/TechnologiesMDPI).
Each data source in the PARG environment is described via an RDF using TTL format. In order to demonstrate the proposed DM framework, we have selected the following metadata characteristics to describe a source: (i) Source Name; (ii) Location; (iii) Feed cycle start; (iv) Feed cycle end; (v) Keywords; (vi) Variety; (vii) Velocity; (viii) Volume, and, (ix) Source Path. The corresponding description may be found at
https://github.com/mfpingos/TechnologiesMDPI.
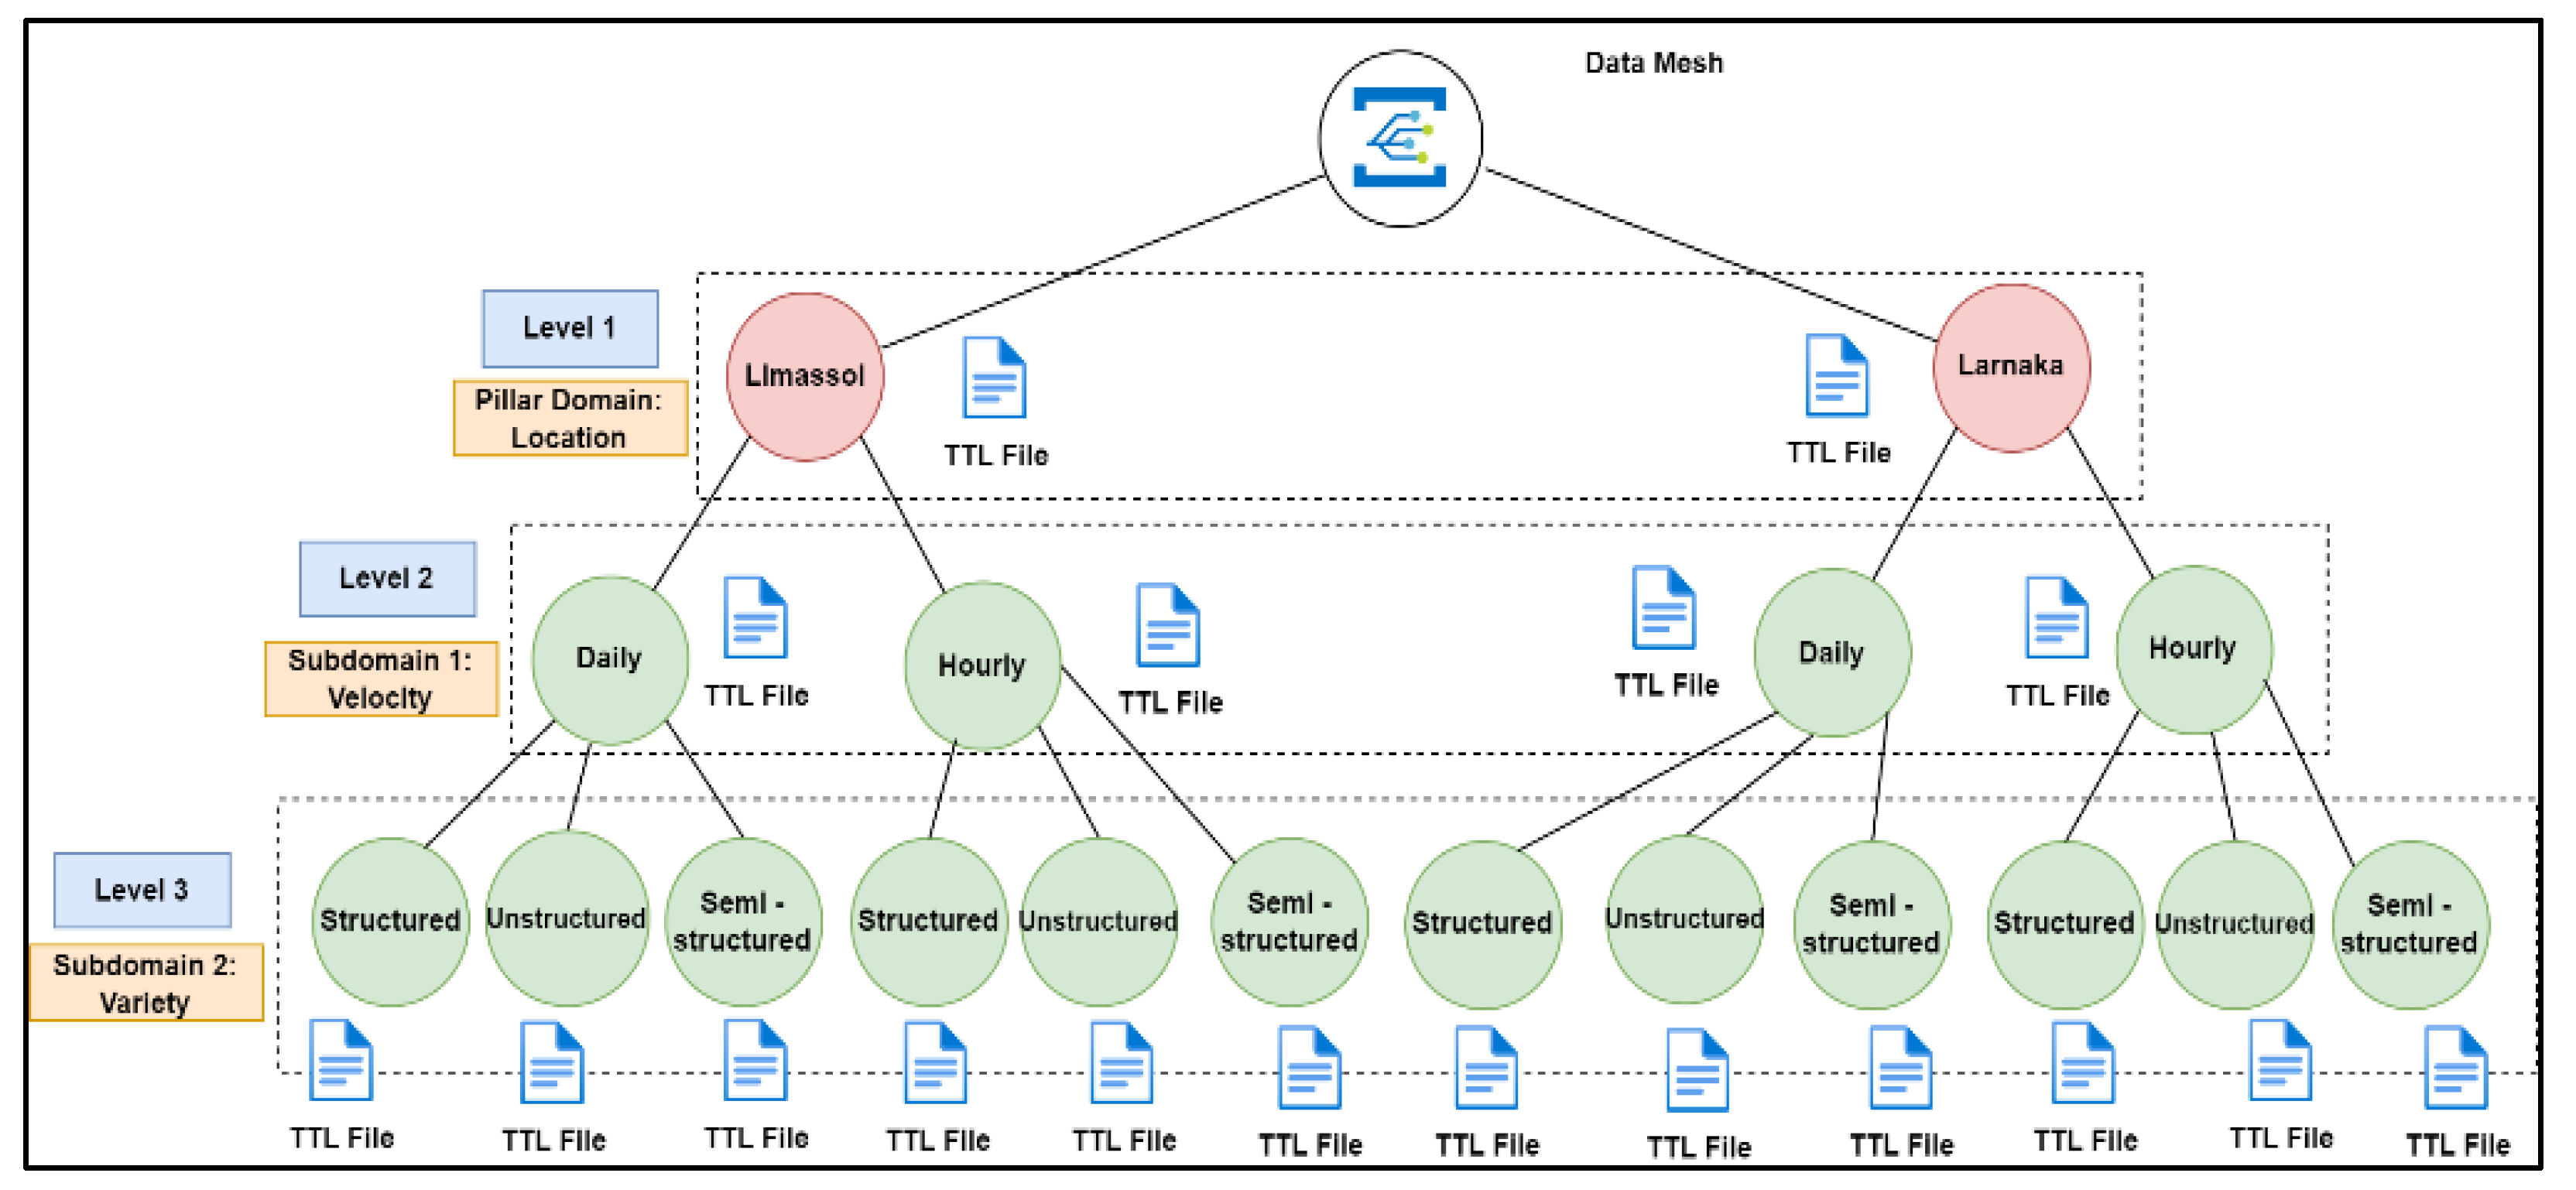
Figure 4 shows an example of how the DM Blueprint and DM architecture are constructed taking into consideration the metadata characteristics listed above: The Pillar Domain attribute (
Location as Level 1) constitutes the main part of the DM architecture, while selected subdomains (
Velocity as Level 2 and
Variety as Level 3) define the second and third level of refinement in the creation of the data products. The latter are treated as the next components of the DM architecture providing the ability to create domains according to selected attributes expressed via the blueprint mechanism introduced in
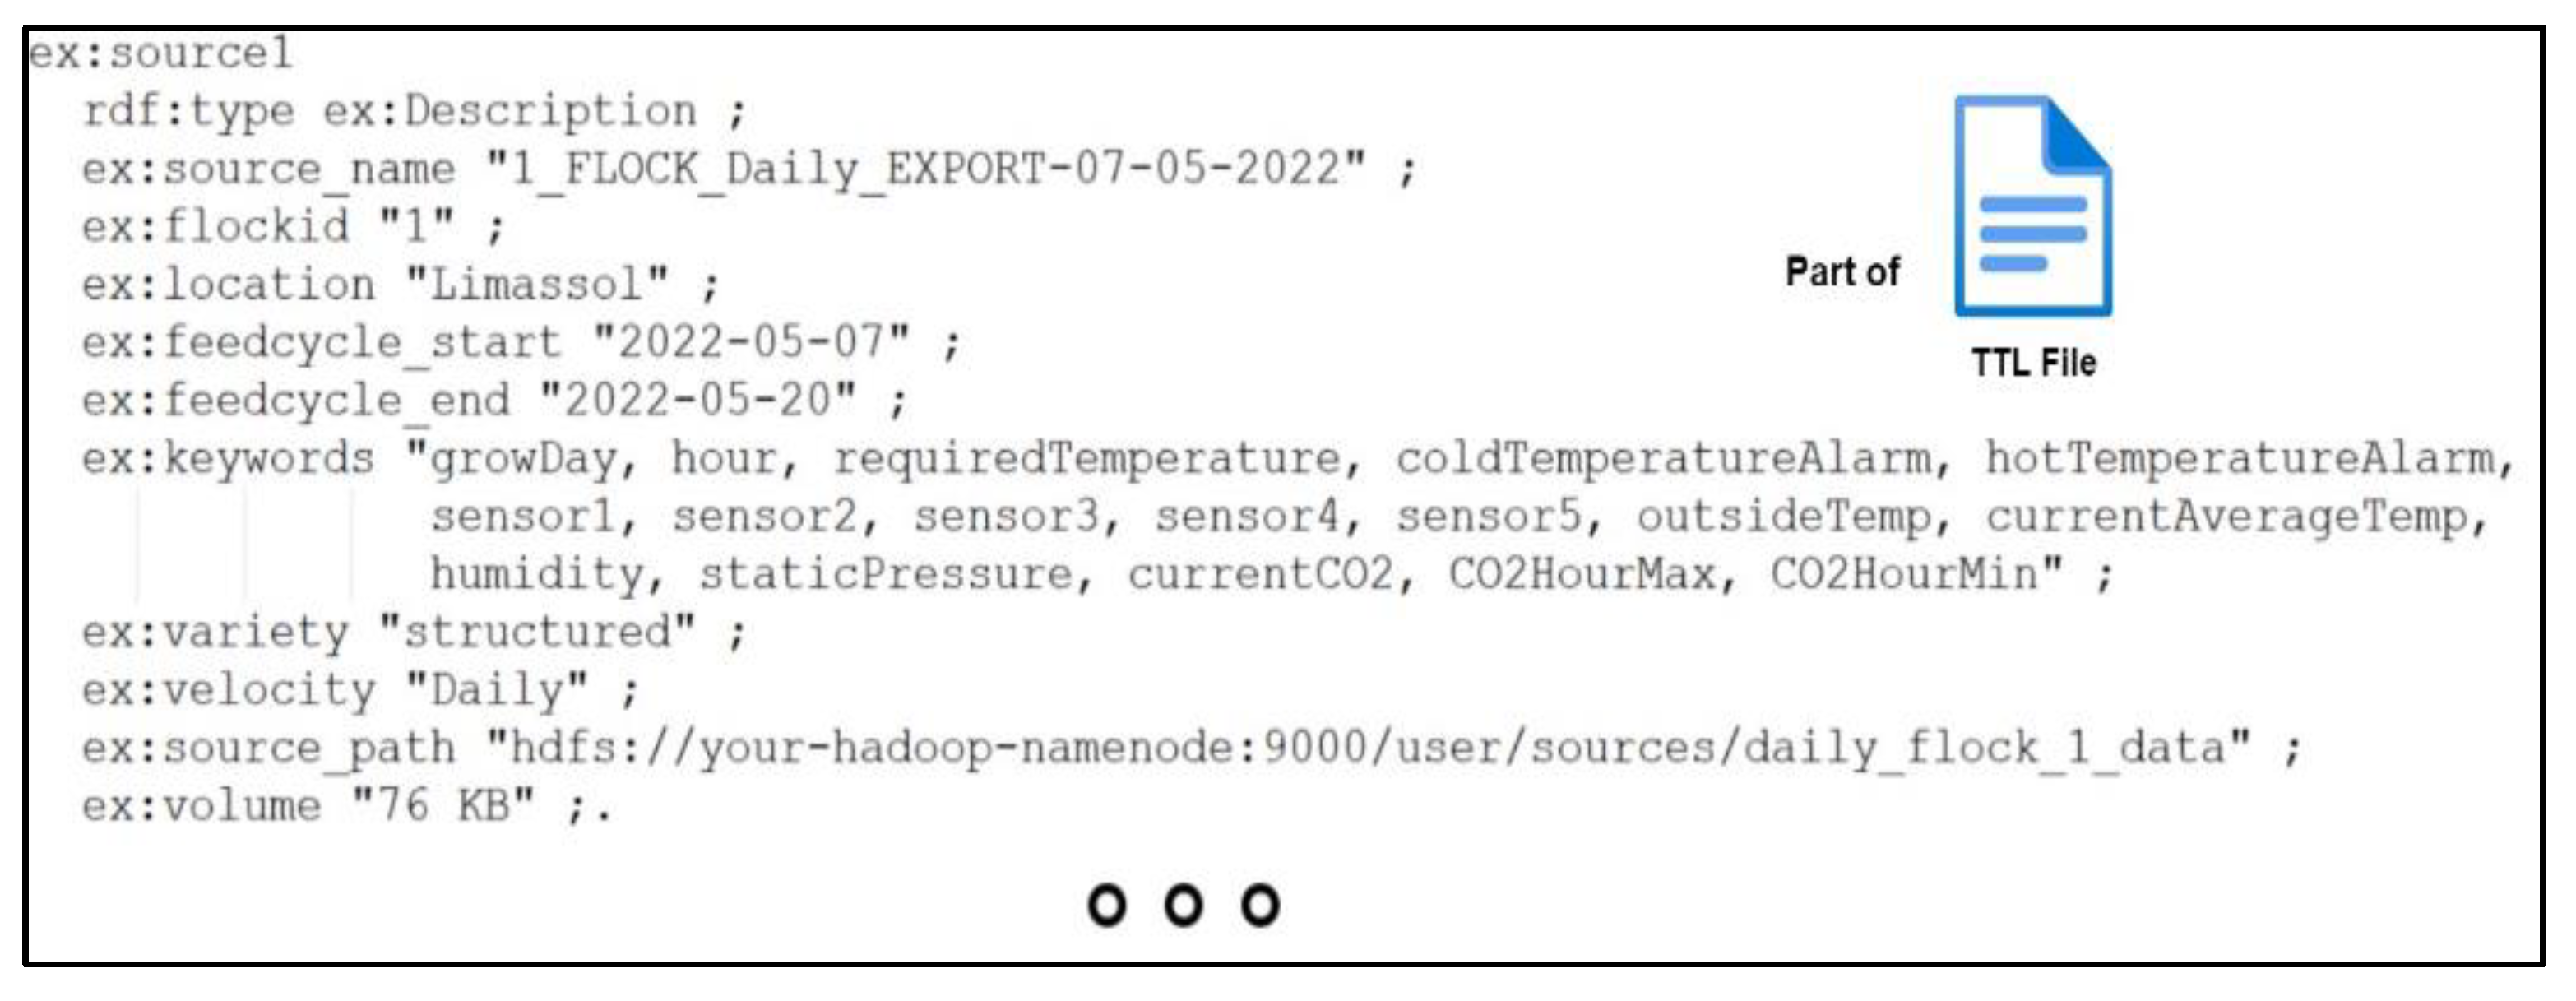
Figure 3. Each Level of the DM consists of a TTL file that includes all the descriptions of the sources which are filtered according to the level. A sample TTL description for Source 1 is presented in
Figure 5. Let us now assume that we want to retrieve all the sources in the DM for the Data Product <<
Limassol | Daily | Structured >>. The semantic Web framework Apache Jena is fed with the preferred characteristics of the attributes and executes the following SPARQL query:
SELECT ?flockid ?source_name ?source_path
WHERE {?source rdf:type ex:Description ;
ex:flockid ?flockid ;
ex:source_name ?source_name ;
ex:source_path ?source_path ;
ex:location "Limassol" ;
ex:variety "Structured" ;
ex:velocity "Daily" . }
The result of the above query execution consists of the metadata (
flock-ID, source name, source path), which satisfies the query parameters (
Location:
Limassol,
Variety:
Structured,
Velocity:
Daily). According to the level at which the SPARQL query is executed, the execution time differs as demonstrated in the experiments section. As we move to including more data products (levels) more fine-grained information is produced and the execution time of the query becomes shorter. Therefore, the proposed DM architecture offers the ability to treat data as a list of data products according to specific business needs, while the Pillar Domains and Subdomains are defined to reflect these needs via the DM Blueprint presented in
Figure 3.
The next section demonstrates the effectiveness of the proposed framework through its evaluation and comparison with other forms of a DL architecture, which are considered rivals or predecessors of DMs.
4. Qualitative Evaluation
This section aims to investigate in general the ability of creating data products via comparison between the proposed DM architecture and the following data structures of storage architectures:
The selection of DLs as the counterapproach serves two purposes: The first is to show the differences between the widely known and used architecture of DLs and DMs. This will provide some indications about whether DMs can be regarded as the natural evolution of DLs in Big Data management. The second, since there is limited work on the topic, to provide a comparison with the closest approaches, that is, with similar studies that introduced the same concept of semantic enrichment and blueprints. This comparison will enable identifying potential pros and cons of the two approaches.
The following characteristics/metrics were selected to facilitate comparison between the alternative architectures: (i) Data domain readiness and alignment; (ii) Granularity; (iii) Decentralization; (iv) Ease of storing and retrieval; (v) Agility.
Data domain Readiness and alignment refers to the level of preparation of a particular data domain or set of data for analysis or processing. It involves ensuring that the data is accurate, complete, consistent, properly formatted, and related to a specific domain. Once the data domain is deemed ready, a data product may be created and used for various purposes, such as building models, making predictions, generating reports, or creating visualizations. Overall, ensuring data domain readiness is crucial for achieving accurate and meaningful results from business data analysis or processing tasks. Without proper preparation, the data could lead to incorrect or misleading insights and decisions.
Granularity refers to the level of detail at which data is collected, processed and analyzed. Granularity can be defined at different levels depending on the specific use-case, business requirements and data sources. To support different levels of granularity in a DL or DM, the data must be structured in a way that allows for easy querying, aggregation and analysis. This can be achieved through techniques such as data modeling, normalization and partitioning. By supporting different levels of granularity in a data storage architecture, organizations can ensure that each domain has access to the specific data they need to drive business outcomes. This can help to improve data quality, reduce data redundancy and promote collaboration across different teams and domains.
Decentralization in data architectures refers to the distribution of data across multiple nodes or storage systems instead of relying on a central data repository. This approach offers several advantages, including increased fault tolerance, improved scalability and greater flexibility in data management. In a decentralized storage architecture, data is distributed across multiple nodes or storage systems. Each node may contain a subset of the data or a complete copy. Nodes are connected to a network and can communicate with each other to exchange data and perform computations. This architecture can be organized in a variety of ways, such as peer-to-peer networks, distributed file systems or Blockchain-based systems. Decentralization can improve fault tolerance by reducing the risk of a single point of failure. In a centralized architecture, if the central repository goes down, all access to the data is lost. In a decentralized architecture the data is distributed across multiple nodes, so if one node goes down the others can continue to operate and serve data. Decentralization can also improve scalability by allowing data to be stored and processed in parallel across multiple nodes. This can improve the performance of data-intensive applications and enable them to handle larger volumes of data. Finally, Decentralization can offer greater flexibility in data management by allowing data to be stored and processed closer to where it is being generated or used. This can reduce the latency and costs associated with transferring data to a central repository.
Agility in data storage architectures refers to the ability of an organization to quickly and easily adapt its infrastructure to meet changing business needs. This includes the ability to scale up or down, change data formats or structures, and integrate with new data sources or systems. Agility is important because it allows organizations to respond quickly to changes in their business environment, such as new regulations, new markets, or new opportunities. To achieve agility in data storage architectures, organizations must adopt flexible and scalable storage technologies and data management structures and practices that can be tailored to meet new business needs.
The characteristics described above are evaluated using a Likert Linguistic scale including the values Low, Medium and High.
Table 1 provides a definition of these linguistic values for each characteristic introduced.
A traditional DL without semantic metadata enrichment can be characterized with Low
Data domain readiness and alignment as more than 5 actions are needed to prepare the data to create Data Domains and Data Products through existing data residing in the DL. Naturally, this characteristic depends on whether semantic annotation is used in the DL. If not, then the DL is highly likely to become a Data Swamp where data domains are not distinct. A scheme with metadata enrichment, on the other hand, greatly benefits data domain readiness as it efficiently guides the retrieval process.
Granularity also ranges according to the metadata semantic enrichment of the DL. When a DL does not follow any semantic enrichment policy it may be characterized with Low
Granularity.
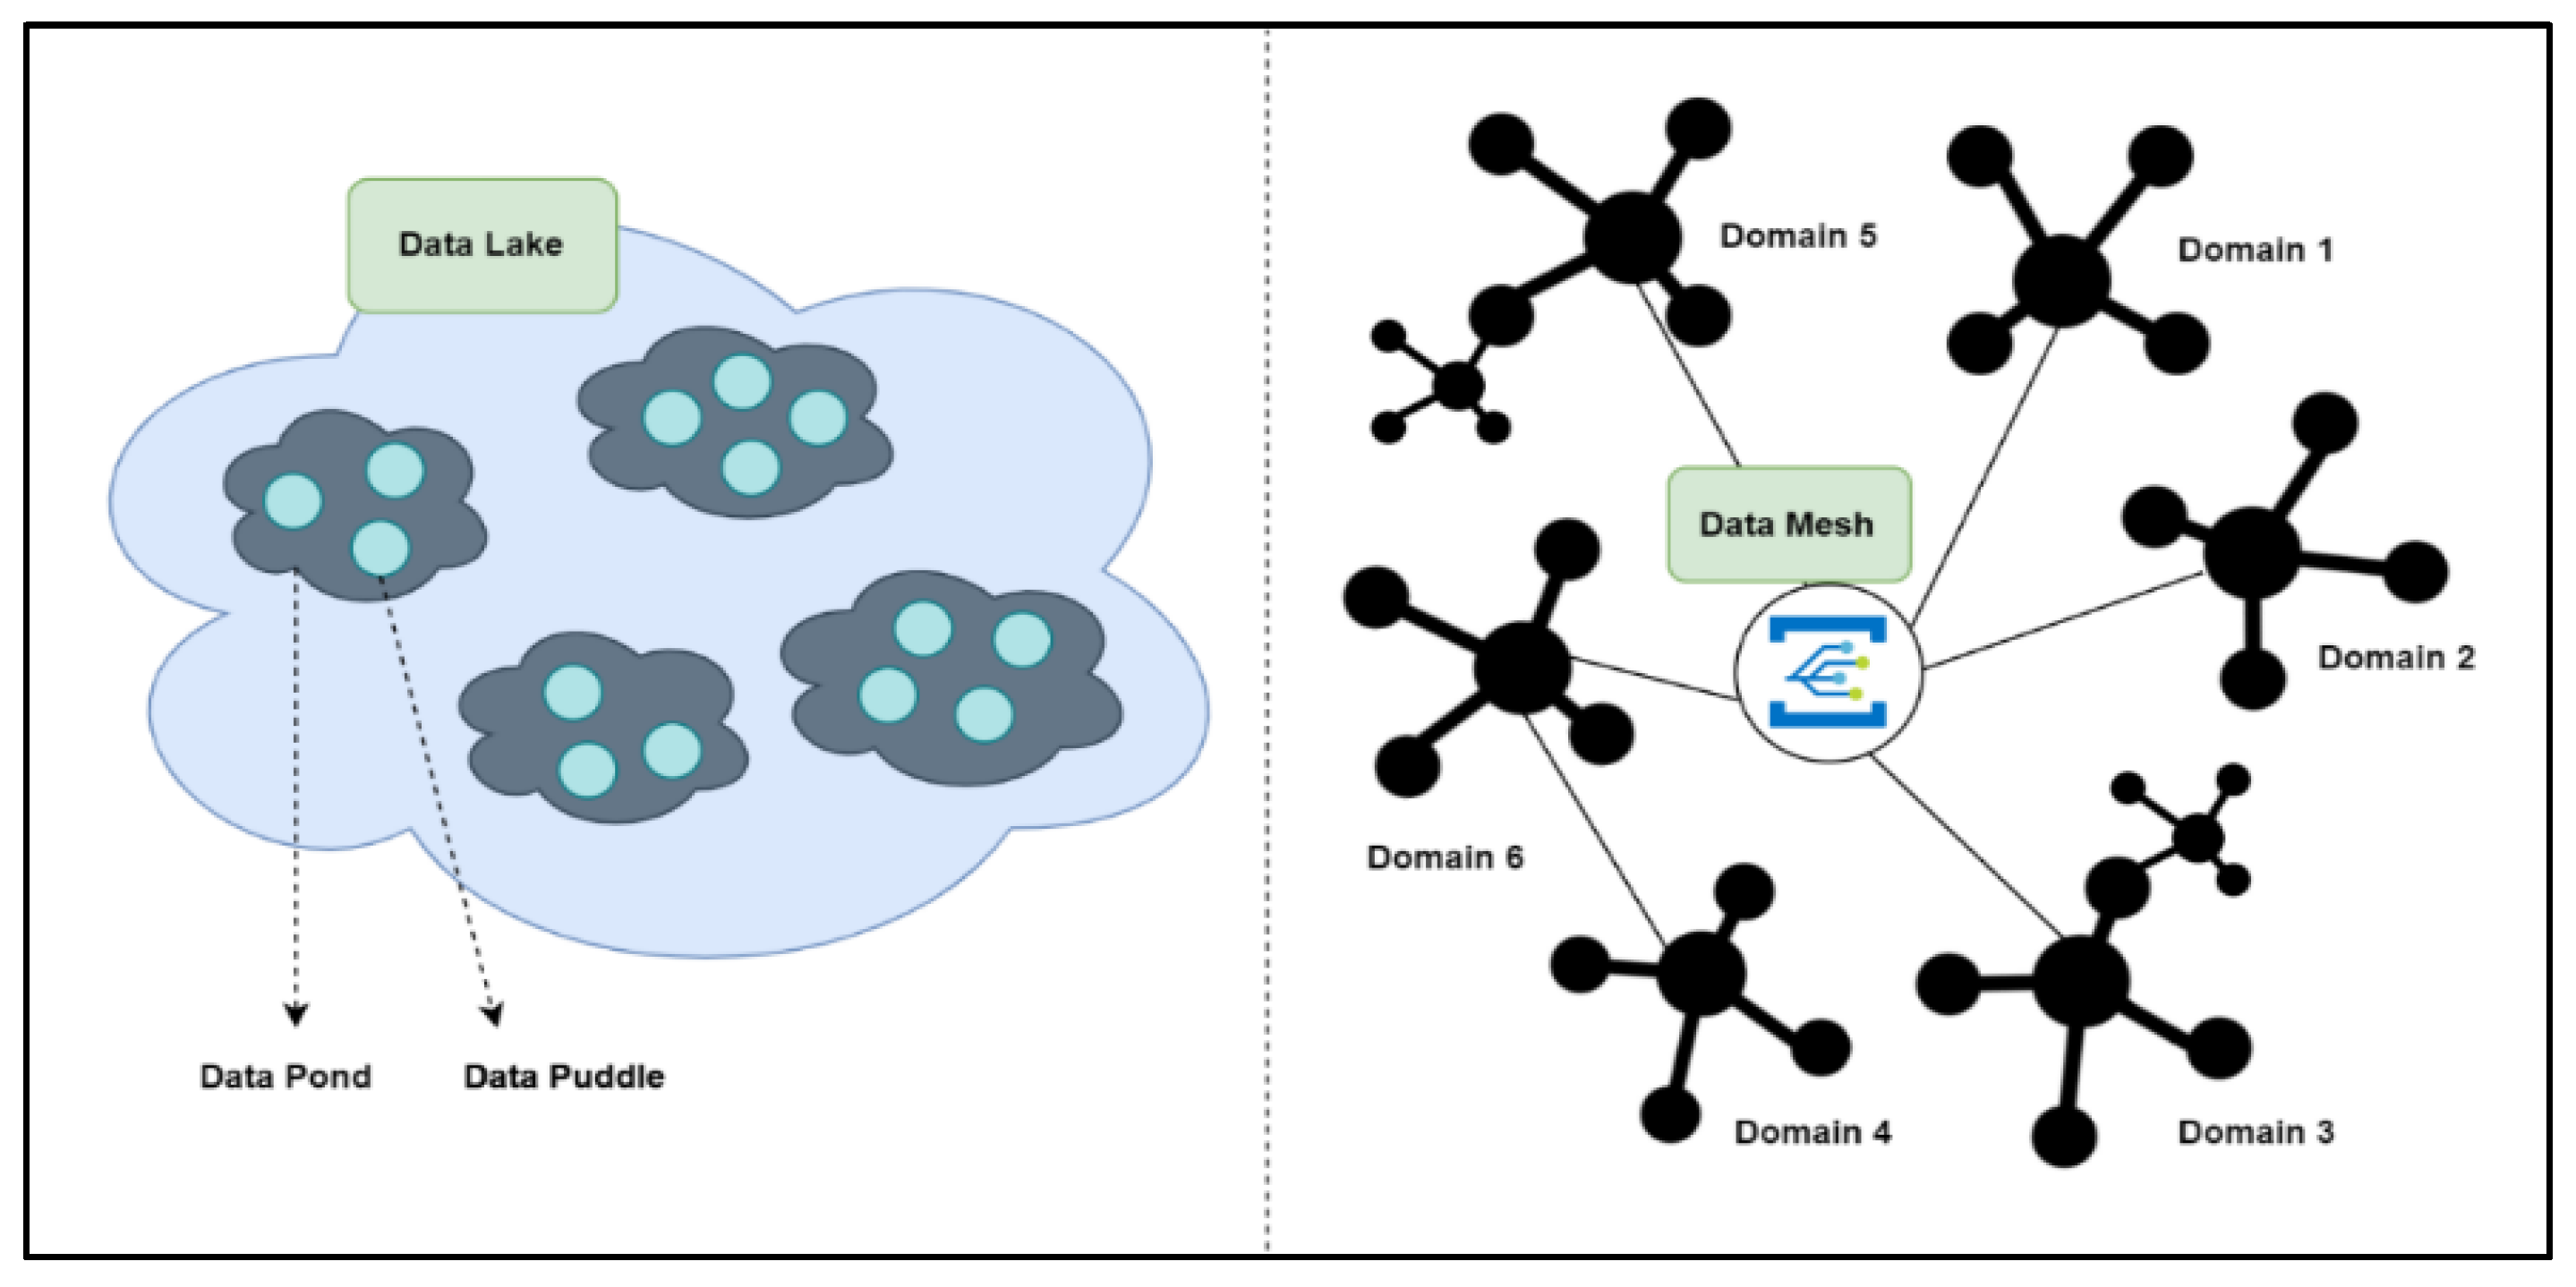
Decentralization in DLs can be provided somehow only through data ponds and data puddles [
26]. If a DL follows a flat architecture, then it can be characterized with Low
Decentralization and Low
Agility as it is quite difficult to adjust quickly to changes of business needs. The traditional DL without a metadata architecture was deliberately selected as an alternative approach for comparison purposes in order to demonstrate that without a metadata mechanism a DL can indeed end up being a Data Swamp. Similarly, we argue here that a DM may suffer from a similar weakness which may lead to becoming what we call here a Data Κnot, that is, a route to a data product that is obstructed at some point before the full utilization of the relevant information is concluded due to the inability to combine semantics that lead to the product.
A DL with semantic enrichment, such as the one relying on blueprint metadata proposed in [
15], can be characterized with Medium
Data domain readiness and alignment as 2-3 actions are needed to prepare the data in the DL to create Data Domains. These actions are basically creating data ponds and data puddles inside the DL using a domain driven approach. The metadata mechanism in [
15] also presents High
Granularity because of the metadata enrichment included in the DL, and specifically the Blueprint metadata history. High levels of
Granularity are also achieved by using the data puddles, which are smaller portions of organized data.
Decentralization as described above can somehow be provided in DLs only through data ponds and data puddles as the framework in [
26] suggests, and, of course, if distributed across multiple nodes or storage systems instead of relying on a central data repository as the original DL concept dictates. Finally, a DL enhanced with the blueprint semantic mechanism may be characterized with High
Agility due to the fact that it can quickly adopt changes in business needs by utilizing the keywords attribute in the relevant blueprint mechanism. On the contrary, a flat DL architecture does not offer such a flexibility and thus it is characterized with Low
Agility.
The proposed DM architecture presented here achieves High
Data domain readiness and alignment,
Granularity and
Agility due to the proposed DM Blueprint presented in
Figure 3 and applied as demonstrated in
Figure 4, which drives the creation of Data Domains and Data Products.
Decentralization is one of the main characteristics of a DM architecture as presented in
Section 2, while the proposed mechanism can be characterized with the value High for this feature.
Table 2 summarizes the points of the short comparison presented above between the DLs and DMs architectures and the utilization of the metadata enrichment mechanism proposed in this paper. It is evident that the use of the mechanism offers significant benefits to the underlying data structures used in storage architectures which outperform their rivals (i.e., without the mechanism) in all characteristics used. What is most important, though, is that DMs enhanced with the Data Blueprint mechanism improve their performance even further in terms of the
Data Domain Readiness and alignment and
Decentralization characteristics compared to the counter approach of a DL with the same mechanism.
5. Experimental Assessment
This section provides a short and concise description of the experiments conducted, starting with the design of the experiments and ending with discussing the results obtained.
5.1. Design of Experiments
Experimentation here aims to investigate on one hand the ability of the proposed approach to create refined data products and on the other to assess its performance and effectiveness with the execution of queries. In this context a series of experiments were designed and executed to support the above targets. This sub-section describes the rationale behind their design.
Two alternative data structures of storage architectures were constructed to compare with the DM: The first one is a basic DL enhanced with a similar semantic enrichment mechanism based on blueprints as the one reported in [
15]. The second one is an upgraded version of the first, that is, a DL using the semantic enrichment mechanism but also structured with Ponds and Puddles as presented in [
27] and depicted in
Figure 1. The selection of DLs as the counterapproach serves two purposes: The first is to show the differences between the widely known and used architecture of DLs and DMs. This will provide some indications about whether DMs can be regarded as the natural evolution of DLs in Big Data management. Since there is limited work on the topic, the second purpose is to provide a comparison with the closest approaches, that is, with similar studies that introduced the same concept of semantic enrichment and blueprints. This comparison will enable identifying potential pros and cons of the two approaches.
Performance was assessed by varying the complexity of the experiments in terms of two factors, the number of sources producing data and the number of data products required. The former was set equal to three distinct levels, 100, 10000 and 100000, while the latter used five different values, that is, 2, 3, 4, 5 and 7. The value ranges of both factors were selected so that scaling up serves as a complexity rising factor, but at the same time the lower and upper boundaries are reasonable for addressing real-world needs, and even exceeding reality expectations (i.e. above 100 data sources) just to measure or compare performance. Data products for the PARG datasets were constructed at each level using the following characteristics: Level 2 – Location and Variety; Level 3 – Location, Variety and Velocity; Level 4 – Location, Variety, Velocity and Feed-cycle Start; Level 5 – Location, Variety, Velocity, Feed-cycle Start and Feed-cycle End; Level 7 – Location, Variety, Velocity, Feed-cycle Start, Feed-cycle End, Volume and Flock ID. The varying complexity targeted at investigating performance and efficiency of the proposed approach in terms of the time required for constructing the mesh (data products), as well as the ability and time for locating the appropriate sources to retrieve data from.
Description of the sources and their characteristics was performed using TTL files (uploaded on GitHub) and reflected the data characteristics provided by the PARG factory. The TTL files were created automatically by Python scripts that also masked the confidential data. Increasing the number of sources directly affects (increases proportionally) the size of the corresponding TTL file, which is the main element parsed to return sources matching a query. Indicatively, 100 sources described in a TTL file resulted in a size of 62KB, 10000 sources of 6.1MB and 100000 sources of 61.2MB. Additionally, the DL architecture with ponds and puddles was created for the same datasets to facilitate direct comparison with the DMs at the same level (level 2 of data products). All DL and DM constructs were implemented by splitting information in different layers of granularity using the metadata characteristics of the TTL files.
Experiments were executed on a server computer with three virtual machines, a CPU with 4 x dedicated cores (the base server hosting the machines had 48 cores), memory size of 8192MB and hard disk capacity of 80GB. The software stack included Hadoop (version 3.3.6) for distributed computing, Python (version 2.7.5) for scripting, generation of data based on PARG’s raw real-world data, and creation of the data products (DM level), and Apache Jena for SPARQL query processing.
Various queries were constructed and executed: (i) One reference query (Query#1), which requires all description data to be returned for each relevant source and its purpose is to measure response time (i.e., the time to locate the relevant sources), (ii) Three performance assessment queries: Query#2 retrieves source names, velocity, feed-cycle start, and feed-cycle end for all descriptions; Query#3 adds a filter to Query#2 to select only descriptions with a specific velocity (Monthly); Query#4 retrieves the source names, velocity (Monthly), and calculates the duration of each feed cycle in days for descriptions with a specific velocity.
5.2. Experimental Results
Table 3 presents the execution time required to construct a DL with a metadata enrichment mechanism and ponds & puddles structure, and various forms of DMs in terms of data products (granularity levels), while, at the same time, varying the number of data sources. The simple DL structure (i.e., without ponds/paddles) was not included in
Table 3 as the comparison with the other two alternatives would not be “fair” since it cannot semantically categorize information upfront and hence by default it would fall short. As can be observed in
Table 3, creation time increases according to the number of sources and granularity: DL and DM with 2 data products require the minimum time to create, with time steadily increasing as more data products are created, something which is expected. Construction time for DMs with the maximum level used (7 data products) is substantially higher compared to lower levels, with an increase of 10 to 15 times more than the previous value of the number of sources for the same level. It is worth noting that the maximum DM construction time is less than 3 minutes, which may be considered a quite satisfactory performance taking into account the extreme conditions tested with values equal to 100000 for the sources and 7 for granularity level, which, in practice, are very rare to meet.
The reference SPARQL query (Query#1) was then executed using the various DM structures for comparison purposes. The execution times of the query are listed in
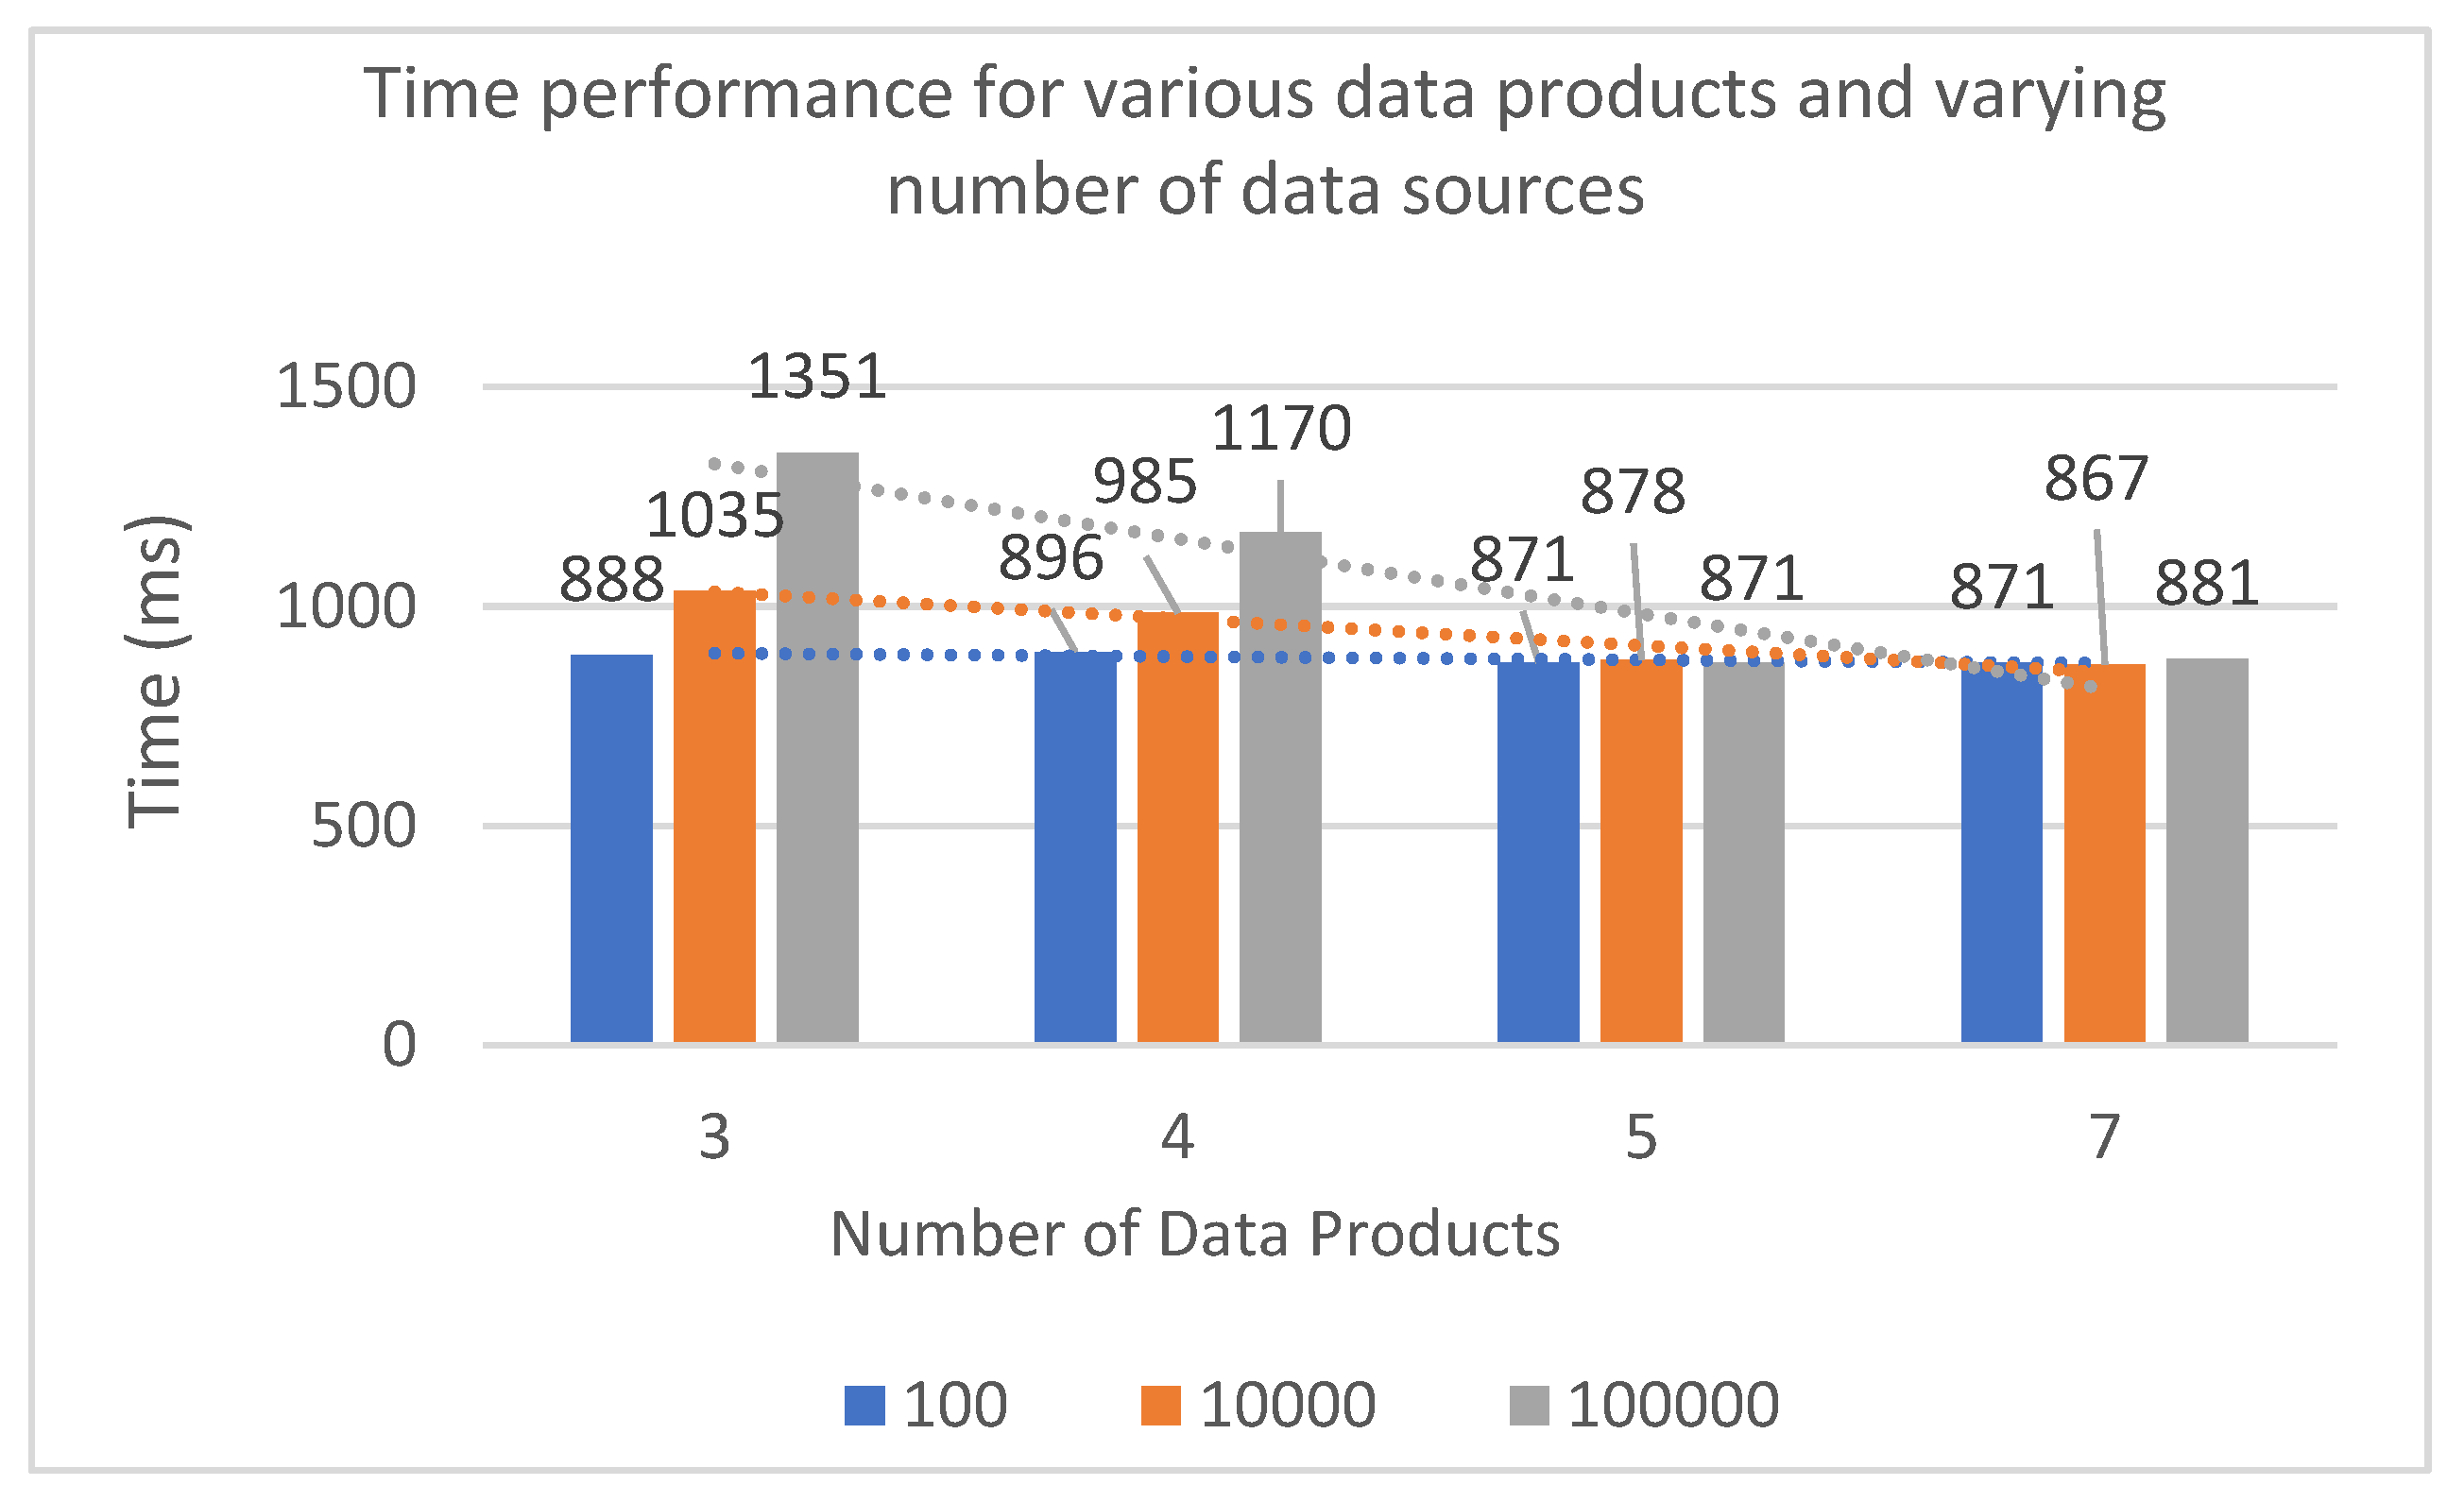
Figure 6, along with the number of sources returned. As may be observed, query execution time is dependent on the overall number of sources used and is analogous to the number of sources returned when there exist various sources satisfying the query (levels 3 and 4). When granularity increases above level 4, only a limited number of resources is returned (1 in this case), which leads to executing the query rapidly and stably, irrespective of the number of underlying data sources level (see
Figure 7). This is actually the most significant benefit of using the proposed DM structure, that is, to restrain the range of information categorized in the data product levels and retrieve data in an immediate and direct way.
Finally, the same DM structures and data sources as above were utilized to execute the last experiments that used 3 SPARQL queries with varying complexity as previously described (uploaded also on GitHub).
Figure 7 graphically depicts the results, which indicate consistent behavior across the queries: The average execution time after 100 iterations is quite low even with the maximum number of data sources tested, it increases proportionally to the number of available data sources, and it stabilizes as the number of sources returned saturates to 1 (data products equal to 5 and 7).
6. Discussion and Conclusions
This paper investigated the transformation of DLs into DMs by proposing a standardized approach to easily discover and construct Data Products. This approach modified and extended earlier work on DLs and their metadata enrichment achieved through Semantic Data Blueprints [
15,
25,
26]. This was performed by following a domain-driven approach and providing a new set of blueprints able to identify and describe data products. The proposed approach was demonstrated and validated in two ways: The first involved comparison with alternative DL-based structures which indicated superiority of DMs over a set of qualitative features. The second involved using real-world data collected within the environment of a poultry meat factory. A set of experiments was designed and executed which revealed a successful performance both when compared to DLs with similar semantic enrichment mechanisms and by varying complexity in terms of available data sources, number of data products created, and type of queries run.
One may argue that since a DM requires some time to create, which depends on the type and number of data products required, as well as the number of sources producing the data utilized, this may constitute a drawback hindering its wider adoption as the data products must be available before the execution of any queries. This could lead to characterizing the nature of DMs as rather static in the sense that if data products need to change according to new business needs, then the DM must be recreated to accommodate changes. Nevertheless, as shown in the experiments conducted, the time it takes to create the mesh and the corresponding data products is very short. In addition, and more importantly, the execution of the queries once the data products are in place is far quicker than other similar storage architecture structures. Therefore, even with very large volumes of data, DMs prove adequate to handle efficiently data retrieval. This advocates in favor of using DMs as the underlying data management structure for practically any real-world application domain.
Combining a DM with software analytics may offer useful information on software processes and products, such as:
• Granular Insights: A DM enables individual teams to own their data, allowing them to use software analytics methods unique to their software systems. This strategy offers fine-grained insights into usage patterns, team-specific utilization performance, and other pertinent indicators.
• Contextual Awareness: By utilizing DM principles, teams increase their awareness of the context of the data they produce and how it relates to their software processes and products. This context gives a greater understanding of the variables affecting software performance and behavior, which improves the usefulness of software analytics.
• Rapid Iteration and Improvement: A DM provides teams with control and autonomy over their data, allowing them to iterate and enhance software products and procedures quickly using the knowledge gleaned from software analytics. Continuous improvement and agility are fostered by this iterative methodology.
Future research steps will include the following: The DM architecture with the semantic metadata enrichment mechanism presented in this paper was built by primarily suing independent software modules built in Python as needed to support experimentation. Therefore, future work will aim at implementing an integrated software environment to facilitate the creation of data products and defining the level of granularity in a user-friendly and uniform manner. This will enable us to assess our framework more thoroughly and, in particular, to compare it more closely to other current DM systems using specific performance measures, although this data structure storage architecture is quite new. Additionally, we plan to utilize Blockchain technology and smart contracts to enhance privacy, security and data governance in DMs. Finally, we will investigate how machine learning models may be applied to enhance the efficiency of the proposed framework, and more specifically, how such models may be trained via queries created by users to suggest better DM structures to DM owners. Along these lines, we will also investigate the potential of integrating DM blueprints with recommendation engines so that historical data describing user preferences when interacting with the mesh in the past dictate the upfront creation of new data products foreseen to be useful for serving future needs.
