Preprint
Article

A Functional Analysis of Inflorescence Architecture in Musa (Musaceae)

Altmetrics

Downloads

233

Views

153

Comments

0

A peer-reviewed article of this preprint also exists.

Submitted:

04 June 2024

Posted:

05 June 2024

You are already at the latest version

Alerts
Abstract
Inflorescence architecture underpins sexual reproduction in wild Musa species and productivity in edible banana cultivars. In a functional analysis we identified the apical inflorescence and lateral ‘cushion’ meristems and the change in flower type as the three primary components of inflorescence architecture. Five genotypes of two clone-sets of edible plantains (Musa AAB), were grown for four generations along an elevation gradient (1100 m to 2200 m, 16°C to 24°C) straddling the equator in the humid highlands of East Africa. The data consisted of peduncle length at harvest, fruit per hand (Fh) and hands per bunch (Hb). The activity of the apical inflorescence meristem drives peduncle length and lateral ‘cushion’ meristems determine fruit per hand. However, Hb is determined by a change in flower type – from fruit-forming to non-fruit forming. Site temperature affected Hb more than Fh, while development of the genet (rhizome) changed the allocation of resources between Hb and Fh, independently of the effect of site temperature. Clone-sets differed in their response to genet development. Cooler temperatures reduced the number of fruit-forming flowers in an inflorescence and changed the balance away from female towards male flowers. In banana breeding schemes, manipulating inflorescence components independently raises options for producing genotypes better suited to markets, environments, and cultural practices.
Keywords: 
Subject: Biology and Life Sciences  -   Plant Sciences

1. Introduction

1.1. Inflorescence Architecture

Inflorescences of Musa L. (Musaceae), whether of the wild species or edible cultivars, are spectacular because of their characteristic form, large size and variety of colours. The fruits of edible cultivars contribute to our diet and are important in smallholder agriculture and in commerce.
Morphologically, the inflorescence is a thyrse. The main axis, or peduncle, is a raceme with the inflorescence meristem at its apex. It supports lateral branches or nodes that originate from the activity of the inflorescence meristem. Each lateral node is called a ‘hand’ and is itself an inflorescence: a scorpioid cyme or cincinnus (Fahn, 1953; Kirchoff, 2017). The cincinni arise from a lateral ‘cushion’ meristem subtended by a bract. The basal section of the reproductive peduncle contains fruit-forming flowers that are female, or in some wild species, may be hermaphrodite (perfect). The distal section has cincinni of non-fruit-forming flowers that are either neuter or male (Fahn, 1953; Simmonds, 1966; Argent, 1976).
The change in flower type from female to neuter or male sets the limit of the fruit-forming flowers and defines the ‘bunch’ of commerce. Following the ABC model of flower development, changes in flower type involve a change in gene expression in the androecium and gynoecium of developing flowers, including the whorls of male flowers in the Musaceae (Bartlett and Specht, 2010). Dodsworth (2017), Irish (2017) and Bowman and Moyroud (2024) present recent reviews of the ABC model. The changes in flower type in Musa are significant as the ovaries of neuter and male flowers are greatly reduced and do not contain ovules, compared with female flowers (Fahn, 1953). Male flowers are short-lived and usually abscise, leaving a ‘clean’ male peduncle where they occur. The inflorescence meristem at the apex of the peduncle terminates when it forms a final cincinnus, or flower, of neuter or male flowers (White, 1928; Simmonds, 1954; Adheka and De Langhe, 2018; Adheka et al., 2018).
Conveniently, the endpoint of activities of the three primary components of inflorescence architecture can be measured at fruit maturity. The length of the peduncle (Pr), with its female and male sections, the number of flowers in individual nodes of the female peduncle (fruit per hand, Fh) and the number of nodes of fruit-bearing flowers on the peduncle (hands per bunch, Hb) can be easily measured. Termination of the peduncle may occur either well before flowering immediately after female flowers have formed, or at an intermediate stage to coincide with flowering, or well after flowering, after hundreds of nodes of male flowers have formed (White, 1928; De Langhe, 1961). Resulting differences in the length of the male peduncle, which occurs among the wild Musa species (Argent, 1976) as well as cultivated genotypes (De Langhe, 1961), contributes to changes in the sex ratio within an inflorescence.
The product of Fh and Hb within the female peduncle determines the total fruit-forming flowers per bunch, Fb. The number and arrangement of female flowers in the wild seeded bananas describe the spread of receptive flowers in space and time. In the edible bananas, where the development of fruit is the focus, the number and arrangement of female flowers is important in productivity and marketing.

1.2. Genotypes, Genes and Development of the Genet

Clone-sets of plantains (Musa AAB) differ in their inflorescence architecture (De Langhe, 1961; Tezenas du Montcel et al., 1983; Swennen et al., 1995). For example, the French and False Horn clone sets differ in the number of fruit per bunch (Fb) and in the length of the male peduncle. The differences in Fb are caused more by differences in fruit per hand (Fh), than in hand number (Hb). These differences make them suitable for examining changes in inflorescence architecture across environments. At the molecular level, in the East African Highland bananas (AAA), Nyine et al., (2019) established associations between Hb and loci on chromosome 9 and Fb at two loci on chromosome 10, reinforcing the genetic component of inflorescence architecture. They did not include the number of fruit per hand (Fh) as a separate trait despite it being a component of Fb. Molecular studies indicate an association between a trait and genetic loci, but other studies are needed to show how these associations may be expressed differently across environments or during genet development. Nyine et al. (2017) pointed out the need to understand variation in the expression of traits in different environments to increase the accuracy of models used in genomic selection.
The first generation of a banana plant has few resources immediately available from the parent mat or genet (Turner et al., 2020). Rather, lateral buds (suckers) grow from the newly established plant, forming the next generation and the new genet. In a functioning genet, the rhizome of a previous generation provides reserves for subsequent generations (Walmsley and Twyford, 1968; Robinson and Nel, 1985; Daniells and O’Farrell, 1987), and influences gene expression in the inflorescence. In cultivation the genet usually contributes more fruit-forming flowers than present in the plant crop (Simmonds, 1966). By comparing data from the plant crop (C1) with those of ratoon crops (>C1), the contribution of the genet to the architecture of the inflorescence can be evaluated, especially where environments are relatively stable within and between years.

1.3. Inflorescence Architecture and Environment

Over the last 130 years, studies of the inflorescence of Musa have described its features and interpreted these in developmental and botanical terms (Baker, 1893; White, 1928; Fahn, 1953; Alexandrowicz, 1955; Ram et al., 1962; Ganry, 1977; Kirchoff, 2017). Other studies have linked bunch formation to a single environment (Summerville, 1944; Ganry, 1977; Robinson and Nel, 1985) but to our knowledge, the relationships between the functional components of inflorescence architecture across different environments has not been explored. The magnitude of Hb, Fh and peduncle lengths are expected to be affected differently by environmental and plant resources because of their different origins. Together, they produce inflorescence architectures that are quantitatively different between environments, crop cycles and clone-sets.
Our hypothesis was that the independent components Hb, Fh and peduncle length will respond differently to environment and genet development in different genotypes.
Previous publications, arising from the experiment reported here, examined the yield, agronomic (Sikyolo et al., 2013) and developmental aspects (Turner et al., 2016) of the plant crop cycle. Sivirihauma et al. (2016) examined the yield and agronomic performance of the ratoon crop cycles while Turner et al. (2020) examined vegetative reproduction across all cycles. Here, we evaluate our hypothesis about how environment and genet development functionally change inflorescence architecture in Musa.

2. Materials and Methods

2.1. Data and Its Analysis

Here, we establish relationships between the functional components of inflorescence architecture and site characteristics, particularly mean annual temperature. At the equator site temperature is seasonally stable at each site but varies from one location to another associated with their different elevations. Edaphic factors differed between sites, particularly soil P and, to a lesser extent, K concentrations (Sikyolo et al., 2013). Consequently, data were modified to account for these differences. We used ANOVAs to determine the significance of the effect of sites, cultivars, and crop cycles on measured variables and regressions to determine the association between site temperature and each modified variable. At Ndihira, the highest site, cool temperatures affected fruit development and thus counts of Fb and Hb made at harvest did not reflect these values at flowering. Adjustments were made to arrive at a set of calculated values of Fh and Hb at flowering for Ndihira.

2.2. Sites, Cultivars and Clone-Sets

The field experiment in North Kivu Province, Democratic Republic of Congo, straddled the equator and began in 2008 (Sikyolo et al., 2013). The sites were at Mavivi, elevation 1066 m, mean annual temperature 23.5°C; Maboya, (1412 m, 21.4°C); Butembo (1815 m, 18.8°C); and Ndihira (2172 m, 16.1°C). Mavivi is the most northerly site at Lat. 0.569°N and Ndihira the most southerly site at Lat. -0.250°S (Figure 1) (Sikyolo et al., 2013).
The five plantain cultivars (Musa AAB Plantain subgroup) represented two Plantain clone-sets, French and False Horn (Sikyolo et al., 2013; Sivirihauma et al., 2016). Each cultivar grows commonly in North Kivu but not across the range of elevations included here (Sikyolo et al., 2013). The morphological features of the inflorescence used to classify clone-sets (Tezenas du Montcel et al., 1983; Swennen et al., 1995) varied across sites and so we reassessed the accepted clonal grouping of the cultivars. Here, we grouped ‘Kotina’ and ‘Vuhembe’ with the False Horn clone set; and ‘Musilongo’, ‘Nguma’ and ‘Vuhindi’ with the French clone set. This differed from the arrangement used by Sikyolo et al. (2013); Sivirihauma et al. (2016); and Turner et al. (2016, 2020) who placed ‘Musilongo’ in the False Horn clone-set and ‘Vuhembe’ in the French clone-set.
The clone-sets differ in their inflorescence architecture. Genotypes in the French clone-set usually have more fruit/bunch (Fb = 70 to 130 cf 23 to 70) and longer male peduncles, than those of the False Horn clone-set, however Hb is similar in both (5 to 11) (Tezenas du Montcel et al., 1983). Thus, French genotypes have more fruit per hand than False Horn. The shorter male peduncle of the False Horn genotypes arises from early termination of the inflorescence meristem. Early cultivators may have selected for this difference, but it is also seen in the wild Musa, for example in Musa monticola found at elevations of 1200 to 1700 m in Sabah (Argent, 2000).

2.3. The ‘Modified’ Data Set and a Calculated Data Set for Ndihira

We took account of the soil concentrations of P and K (Sikyolo et al., 2013) and ‘modified’ Fh, Hb, Fb and Pr as described in Turner et al. (2020) and Blomme et al. (2020). The supply indices for P for each site were: Mavivi 0.68, Maboya 0.71, Butembo 0.78 and Ndihira 0.93; and for K: Mavivi 0.91, Maboya 0.90, Butembo 1.00, and Ndihira 0.94. Less soil P was available at lower than at higher elevations, but K supply was close to ‘adequate’ at most sites. K supply was less likely to constrain growth than P supply. As Fb = Fh x Hb (Eqn. 1), the values of Hb and Fh were modified by dividing the measured values by SQRT(P or K) of the respective nutrient supply indices, as appropriate and Fb calculated. Reproductive peduncle length was modified in the same way.
At Ndihira, the highest and coolest site, each bunch had numerous fruit but only those of commercial size at maturity were counted in the main experiment (C1 – C4). This excluded deformed fruit arising from female flowers which did not grow under the cool conditions, but were present at flowering (Sivirihauma et al., 2016). These data excluded Ndihira for determining the association between site temperature and parameters Fb, Hb and Fh. Rather, we required the total number of fruit formed per bunch at Ndihira, whether they had grown or not. Counts of total fruit and hand numbers on bunches in ratoon crop cycles (C>4) at Butembo and Ndihira were used to calculate the Ndhi ratio (= value at Ndihira/value at Butembo) for each parameter (Table 1). The measured values of Fh, Hb or Fb from Butembo, multiplied by the relevant Ndhi ratio (Table 1), gave the calculated data for Ndihira for each cultivar.
‘Measured’ data collected in the main experiment at fruit maturity were length of the female and male sections of the peduncle (C2 to C4), and for the female peduncle, the total number of fruit per bunch, Fb, and number of hands per bunch, Hb (C1 to C4). We calculated fruit/hand, Fh, (Eqn. 1) the length of the reproductive peduncle, and the proportion of it that supported fruit.
The number of fruit on an inflorescence of Musa, Fb, is:
Fb = Hb x Fh

2.4. The Exponential Reciprocal Function and the Curvature Coefficient

Regression analyses of the modified data of clone-sets (individual cultivars were used in the ANOVAs) established the relationships between site temperature and inflorescence variables Fh, Hb, Fb, Pr and Pf. The exponential reciprocal function provided the best fit for the data based on F ratio, probability and r and it fitted all parameters of the inflorescence. The function has the form:
Y = A.exp(-C/(T-Tb)
Where Y is the parameter or variable, T is site temperature, A is a theoretical asymptote or maximum value of Y, and C is a curvature coefficient, which is negative. The asymptote A has little biological meaning in the current context because of the limited range of site temperatures (16.1°C to 23.5°C). The added coefficient, Tb, when varied, allowed the maximum F ratio in the regression ANOVA to be estimated.
We used the correlation coefficient, r, to assess the strength of the relationship between a variable and site temperature, and C to assess its shape in a quantitative way. For 0.0 <r <0.70 the association was weak; moderate when 0.70 <r< 0.90 and strong when r >0.90. An increasingly negative value of C visually indicated a greater displacement of the function from the asymptote, A, and a change in the shape of the relationship between the parameter and site temperature. The values of C were allocated to three categories based on their magnitude. For -0.01 <C< -0.10 the parameter was stable over most of the temperature range, while for -0.10 <C< -1.0 the parameter changed over the temperature range of interest with the change becoming greater as C became increasingly negative (C< -1.0).

2.5. The Effect of the Genet

To examine the effect of the genet on the three parameters of the inflorescence in each clone-set we compared Fh, Hb and Fb for C1 (cycle 1, genet absent) with those of C2 to C4 (genet present) in a graphical form. In this case the values for C1 at Ndihira were calculated from the values at Butembo using the Ndhi ratio derived from ratoon crop cycles (Table 1).

2.6. Statistical Analyses

The experiment at each site was a randomized block design (Sikyolo et al., 2013). For measured data ANOVAs were calculated using R (R Core Team, 2019) and treatment means compared using LSD at P=0.05. The LINEST function in Excel® (v 2203) fitted the regressions of the exponential reciprocal function using a natural log transform of the data (Eqn 3):
ln(Y) = ln(A) -C/(T-Tb)
Differences between values of -C for clone-sets were evaluated with t-tests at P=0.05. The impact of modifying the data was evaluated by comparing variation within the data set before and after modification. For the SQRT(PK) modification, parameter values were divided by the soil supply index, which was less than 1.0 and so the variation within the whole data set increased. Examining the F ratio for sites indicated how the ANOVA had partitioned variation between and within sites (Mead et al., 1993).

3. Results

3.1. The Effect of Site, and Cultivar on Measured Data of Hb, Fh, Fb, Pr and Pf

Increasing elevation decreased Hb, especially at Ndihira (Table 2A). Across the other three sites, with increasing elevation, Hb fell significantly (P=0.05) by about 30% in the two False Horn cultivars but not as much (15%) in two of the three French cultivars. The exception was the French cultivar ‘Nguma’ which had more hands at Butembo (8%) than at the lowest elevation at Mavivi (Table 2A, P=0.05).
False Horn cultivars had fewer fruit per hand (11 to 17) than the French cultivars (17 to 24). Across sites, measured Fh was relatively stable but severely reduced in all cultivars at Ndihira (P=0.05). The False Horn cultivar ‘Kotina’ was an exception because it had 30% fewer fruit per hand at Mavivi, the lowest site, than at Butembo (Table 2A).
The effect of sites on the number of fruit per bunch in different cultivars reflected changes in Fh and Hb, the components of Fb. Usually, Fb declined from Mavivi up to Butembo but these changes, while significant (P=0.05), differed in magnitude according to cultivar. The Fb of ‘Vuhembe’ fell by 24% but ‘Nguma’ had more fruit per bunch at Butembo than at Mavivi, an increase of 9%. In ‘Kotina’, opposing changes of Hb and Fh with increasing elevation stabilized Fb from Mavivi up to Butembo. ‘Musilongo’ and ‘Vuhindi’ had about 8% less Fb at Butembo than at Mavivi (Table 2A). At Maboya, Fb in all cultivars was less than at Mavivi or Butembo.
Across sites and cultivars at fruit maturity, the reproductive peduncle length varied two-fold from about 80 to 160 cm (Table 2B). In False Horn cultivars the inflorescence meristems had terminated by fruit harvest but in the French cultivars were still growing. Differences in Pr between cultivars was greater at lower than at higher elevations and the two False Horn cultivars had a Pr 15 to 60 cm shorter than those of the three French cultivars (P=0.05). The exception was ‘Vuhembe’ which had a much longer reproductive peduncle than expected at Ndihira.
From Mavivi to Butembo the False Horn cultivars had a high Pf (66 to 74%) compared with the French cultivars (52 to 60%) (Table 2B). At Ndihira, the Pf of all cultivars in both clone-sets was reduced to 17 to 26%, only one third of the values reached at sites of lower elevation. At Maboya, for each cultivar, the female proportion of the peduncle, Pf, was like those at Mavivi and Butembo, even though the absolute values of Hb, Fh, Fb and Pr differed greatly between sites.

3.2. Changes to the Data Caused by Modification

As expected, modifying the measured data increased the site means for Hb, Fh and Fb, but to different degrees, depending on the magnitude of the PK supply index at each site (Table 3). At Mavivi and Maboya, modification increased the means of Hb and Fh by about 27%. At Butembo the increase was 14%, about half of this. The calculated data for Ndihira increased Hb by 35% more than the measured value and Fh almost five-fold more. These increases in Hb and Fh flowed through to the Fb data where the increase was 61% at Mavivi and eight-fold for the calculated Ndihira data (Table 3).

3.3. Fitting the Exponential Reciprocal Function to the Modified Data

Exponential reciprocal functions where site temperature was fitted to the data for each architectural parameter were significant at P=0.001, except for Fh of the False Horn clone-set which was not significant (Table 4). Depending on the variable and the clone-set r ranged from 0.08 to 0.94.
In both clone-sets, Hb was more strongly associated with site temperature, T, (r>0.70) than Fh (r<0.51) but Pf had the strongest association (r>0.90). In the French clone-set, Pr had a moderately strong association with T (Table 4). In the False Horn clone-set, Fh had weak associations with T, as did Pr (Table 4).
In this data set, Hb rather than Fh, drove the curved association between Fb and T in both clone-sets. Indeed, Fh was much more stable than Hb over the range of T included here. In the False Horn clone-set Pr was stable across the temperature range of interest, with C = -0.016. In contrast, the French cultivars had a moderate response to T, with C= -0.581.
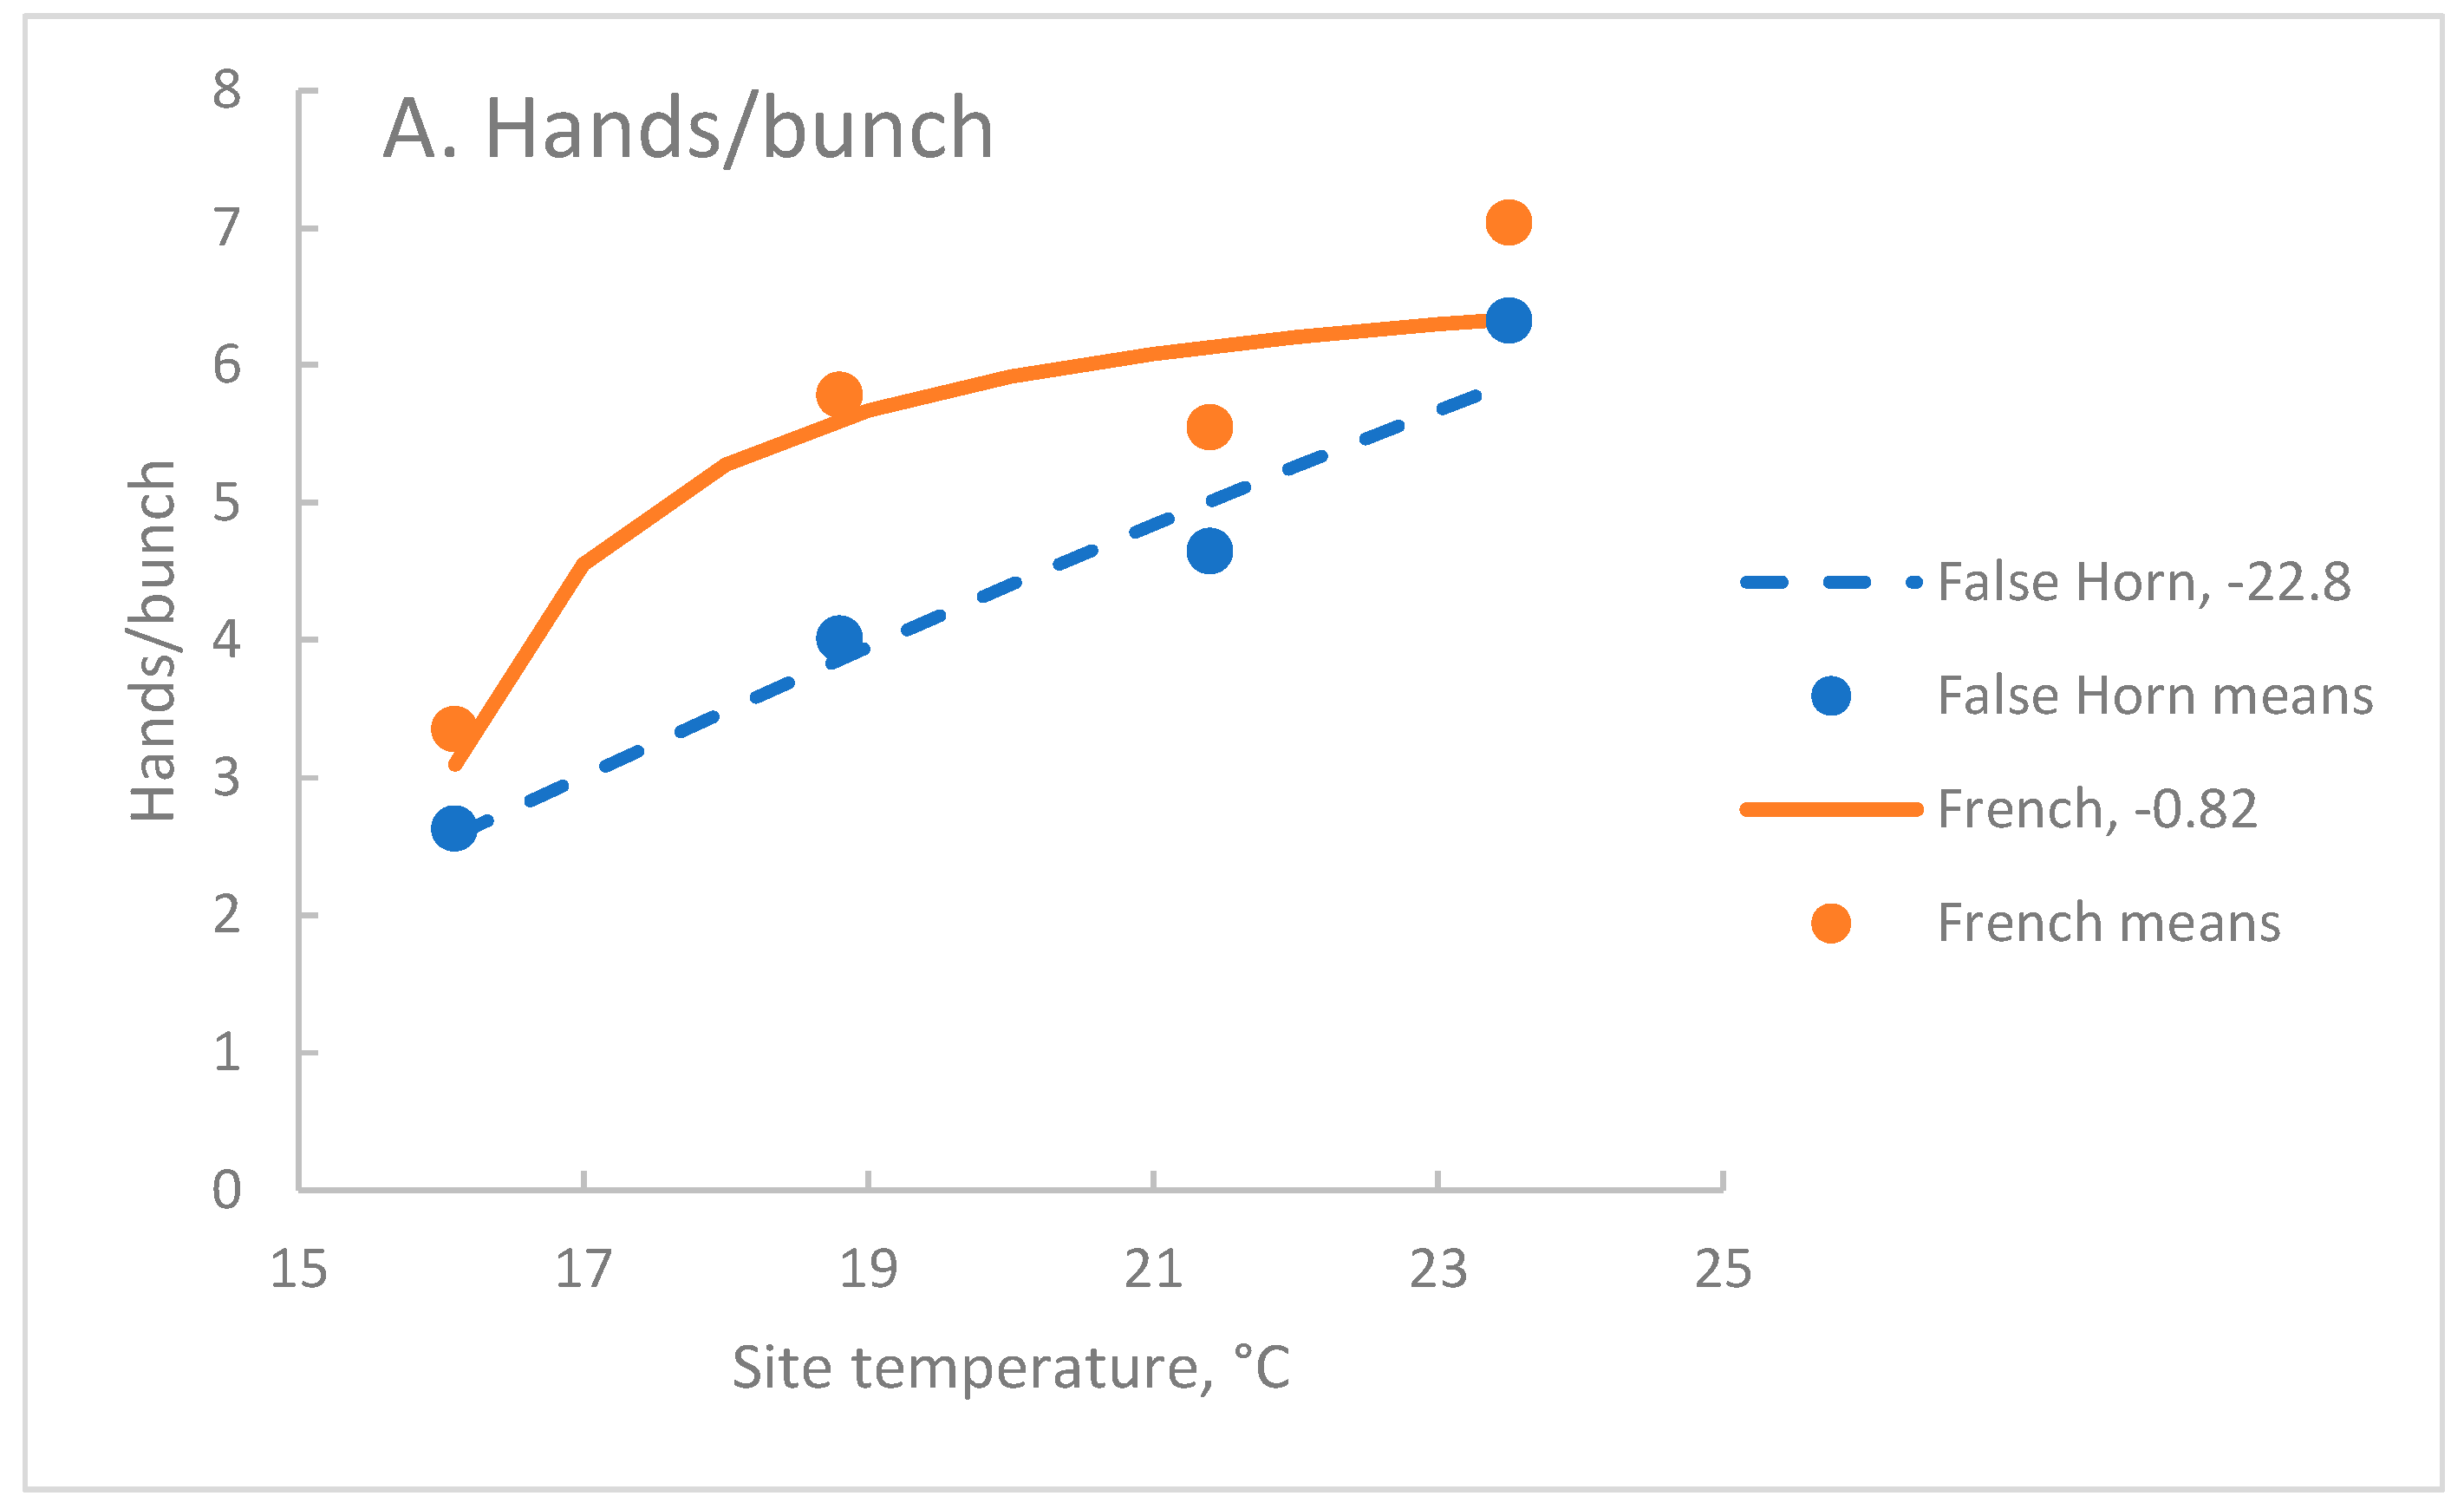
In the modified data, where the Ndihira values were calculated, warming temperatures increased Hb two-fold (Figure 2A). At the coolest temperature, the French and False Horn clone sets had similar Hb, while at higher temperatures the French clone-set had more hands per bunch than the False Horn clone-set. The False Horn clone-set showed an almost linear reduction in Hb as temperature fell, but Hb of the French clone-set was more stable at the warmer temperatures (Figure 2A).
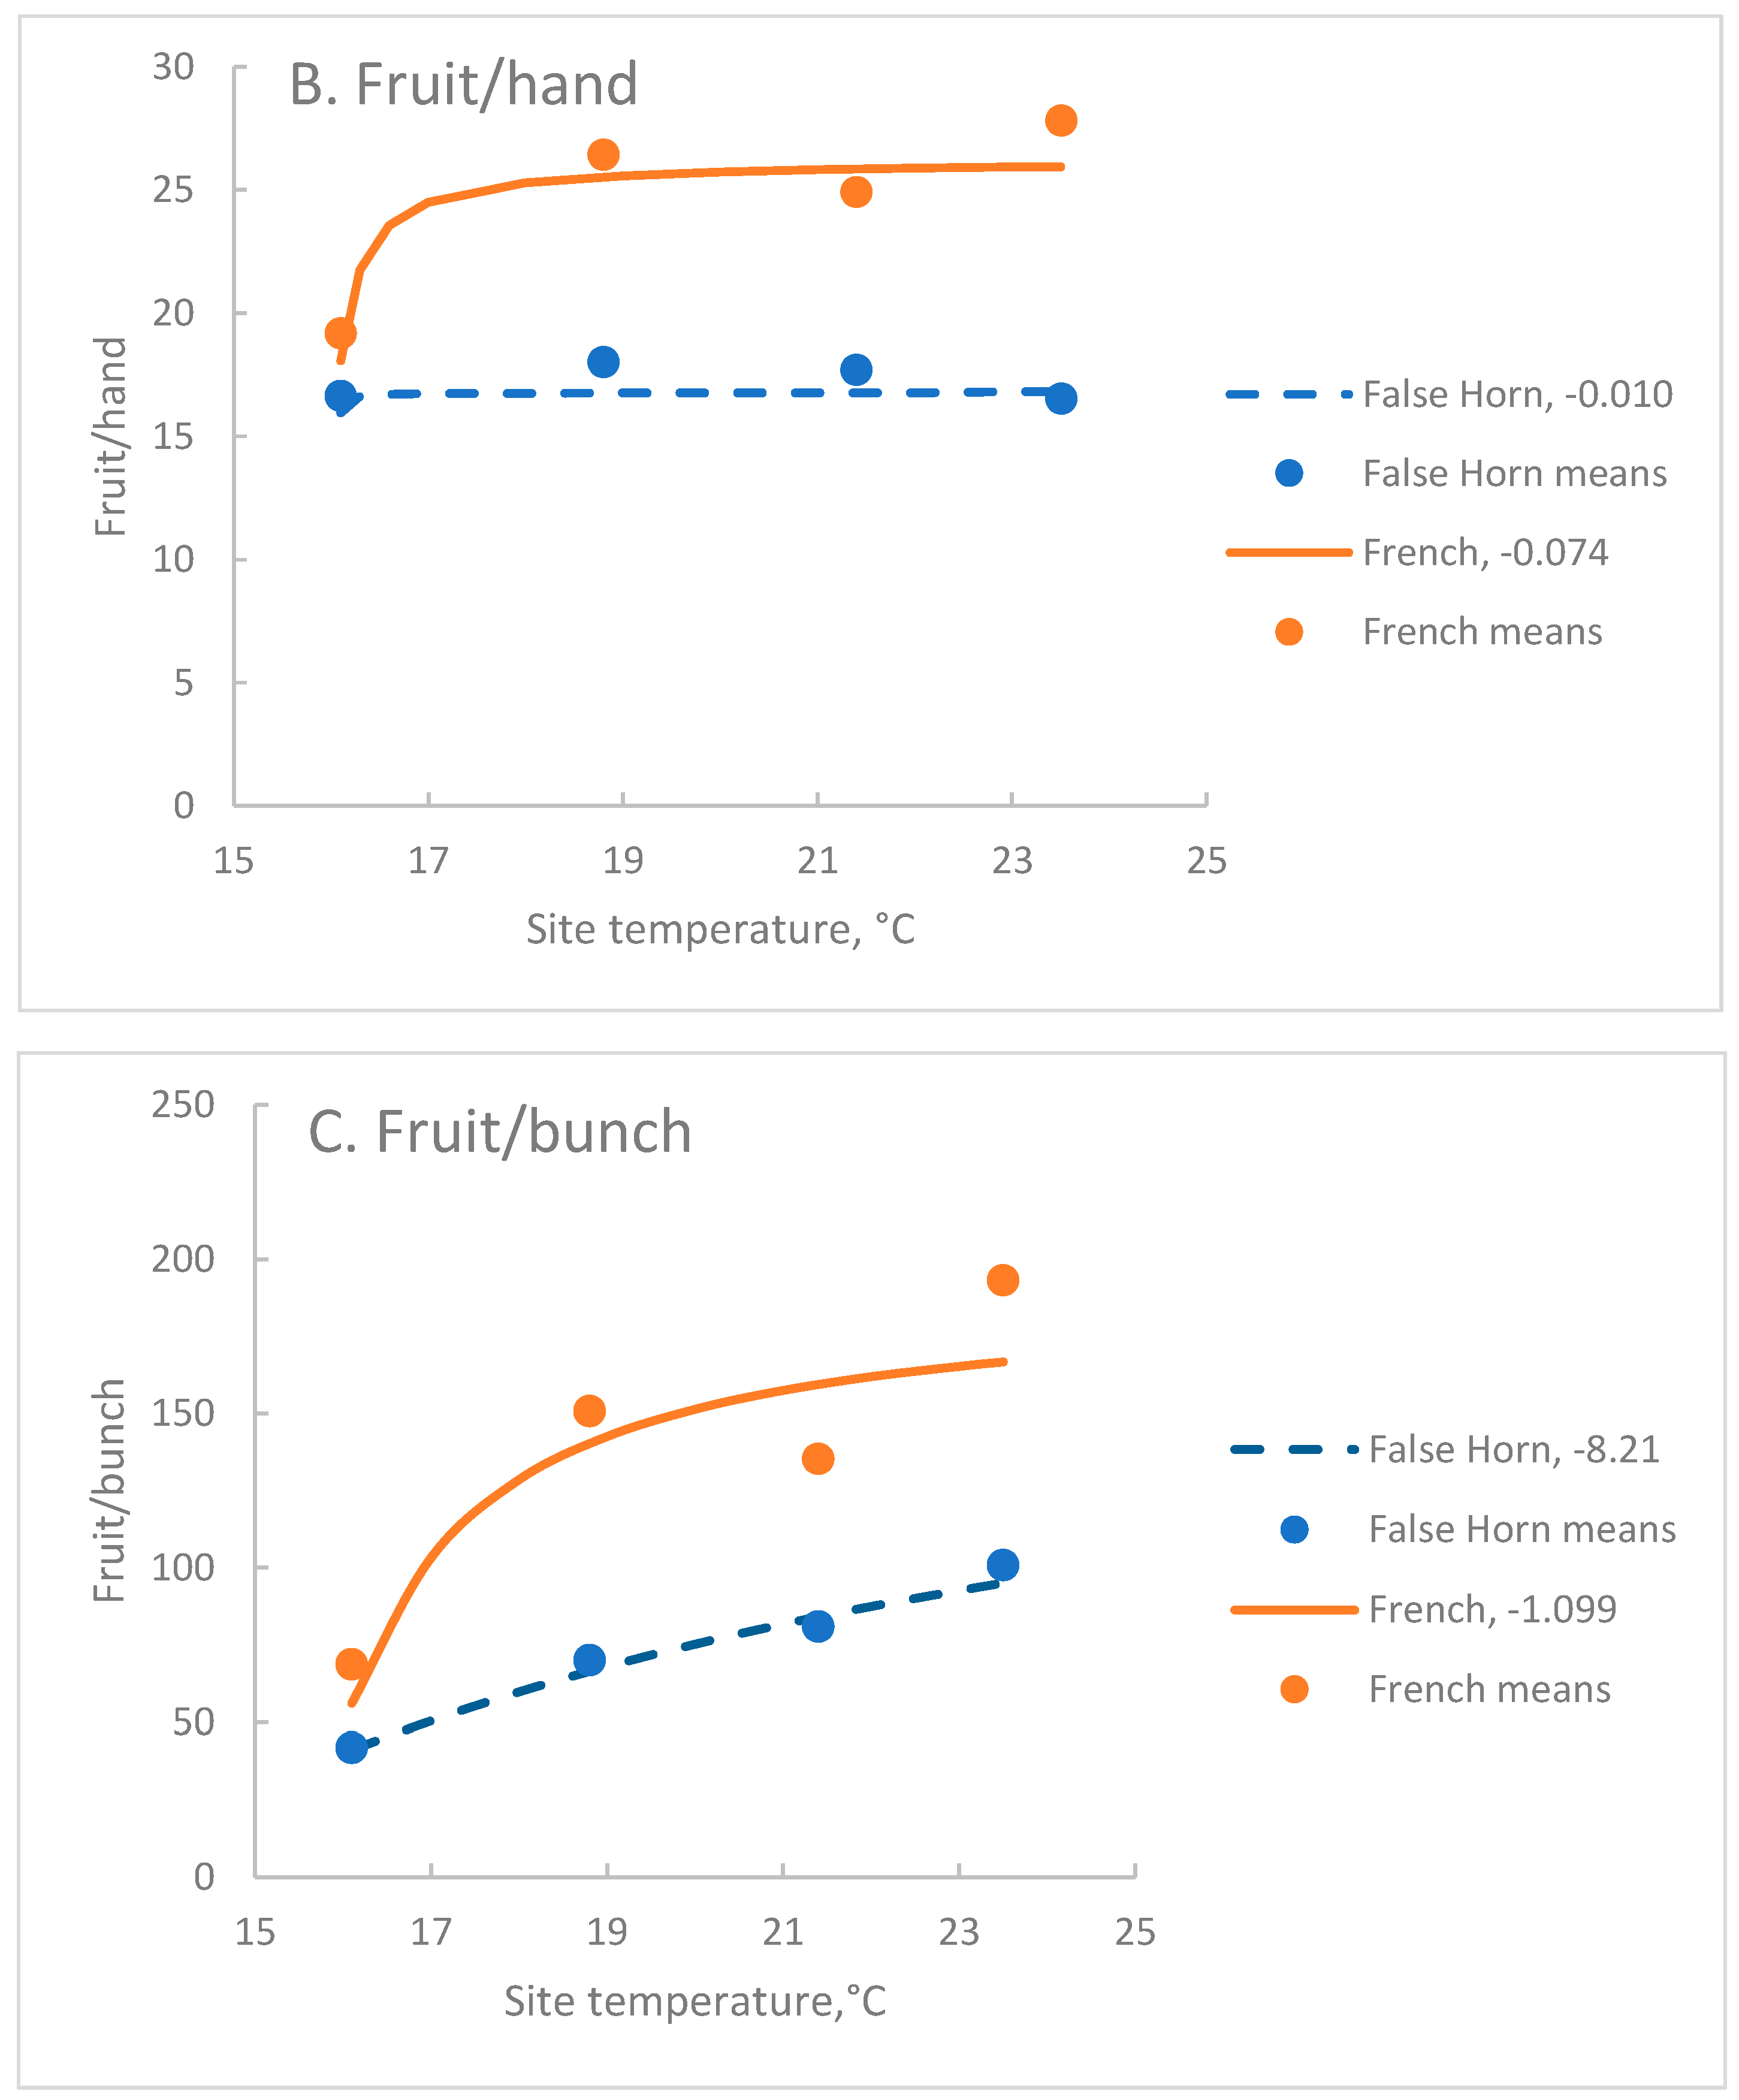
Across the three warmer sites, Fh of the French clone-set was about 50% more than the False Horn and both clone-sets showed a stable relationship with T (Figure 2B). At the coolest site, the Fh of the False Horn clone-set was little affected but was reduced in the French clone-set. Fb reflected the changes of its two components, Fh and Hb. As site temperature rose, Fb increased in the two clone-sets over the range (Figure 2C).
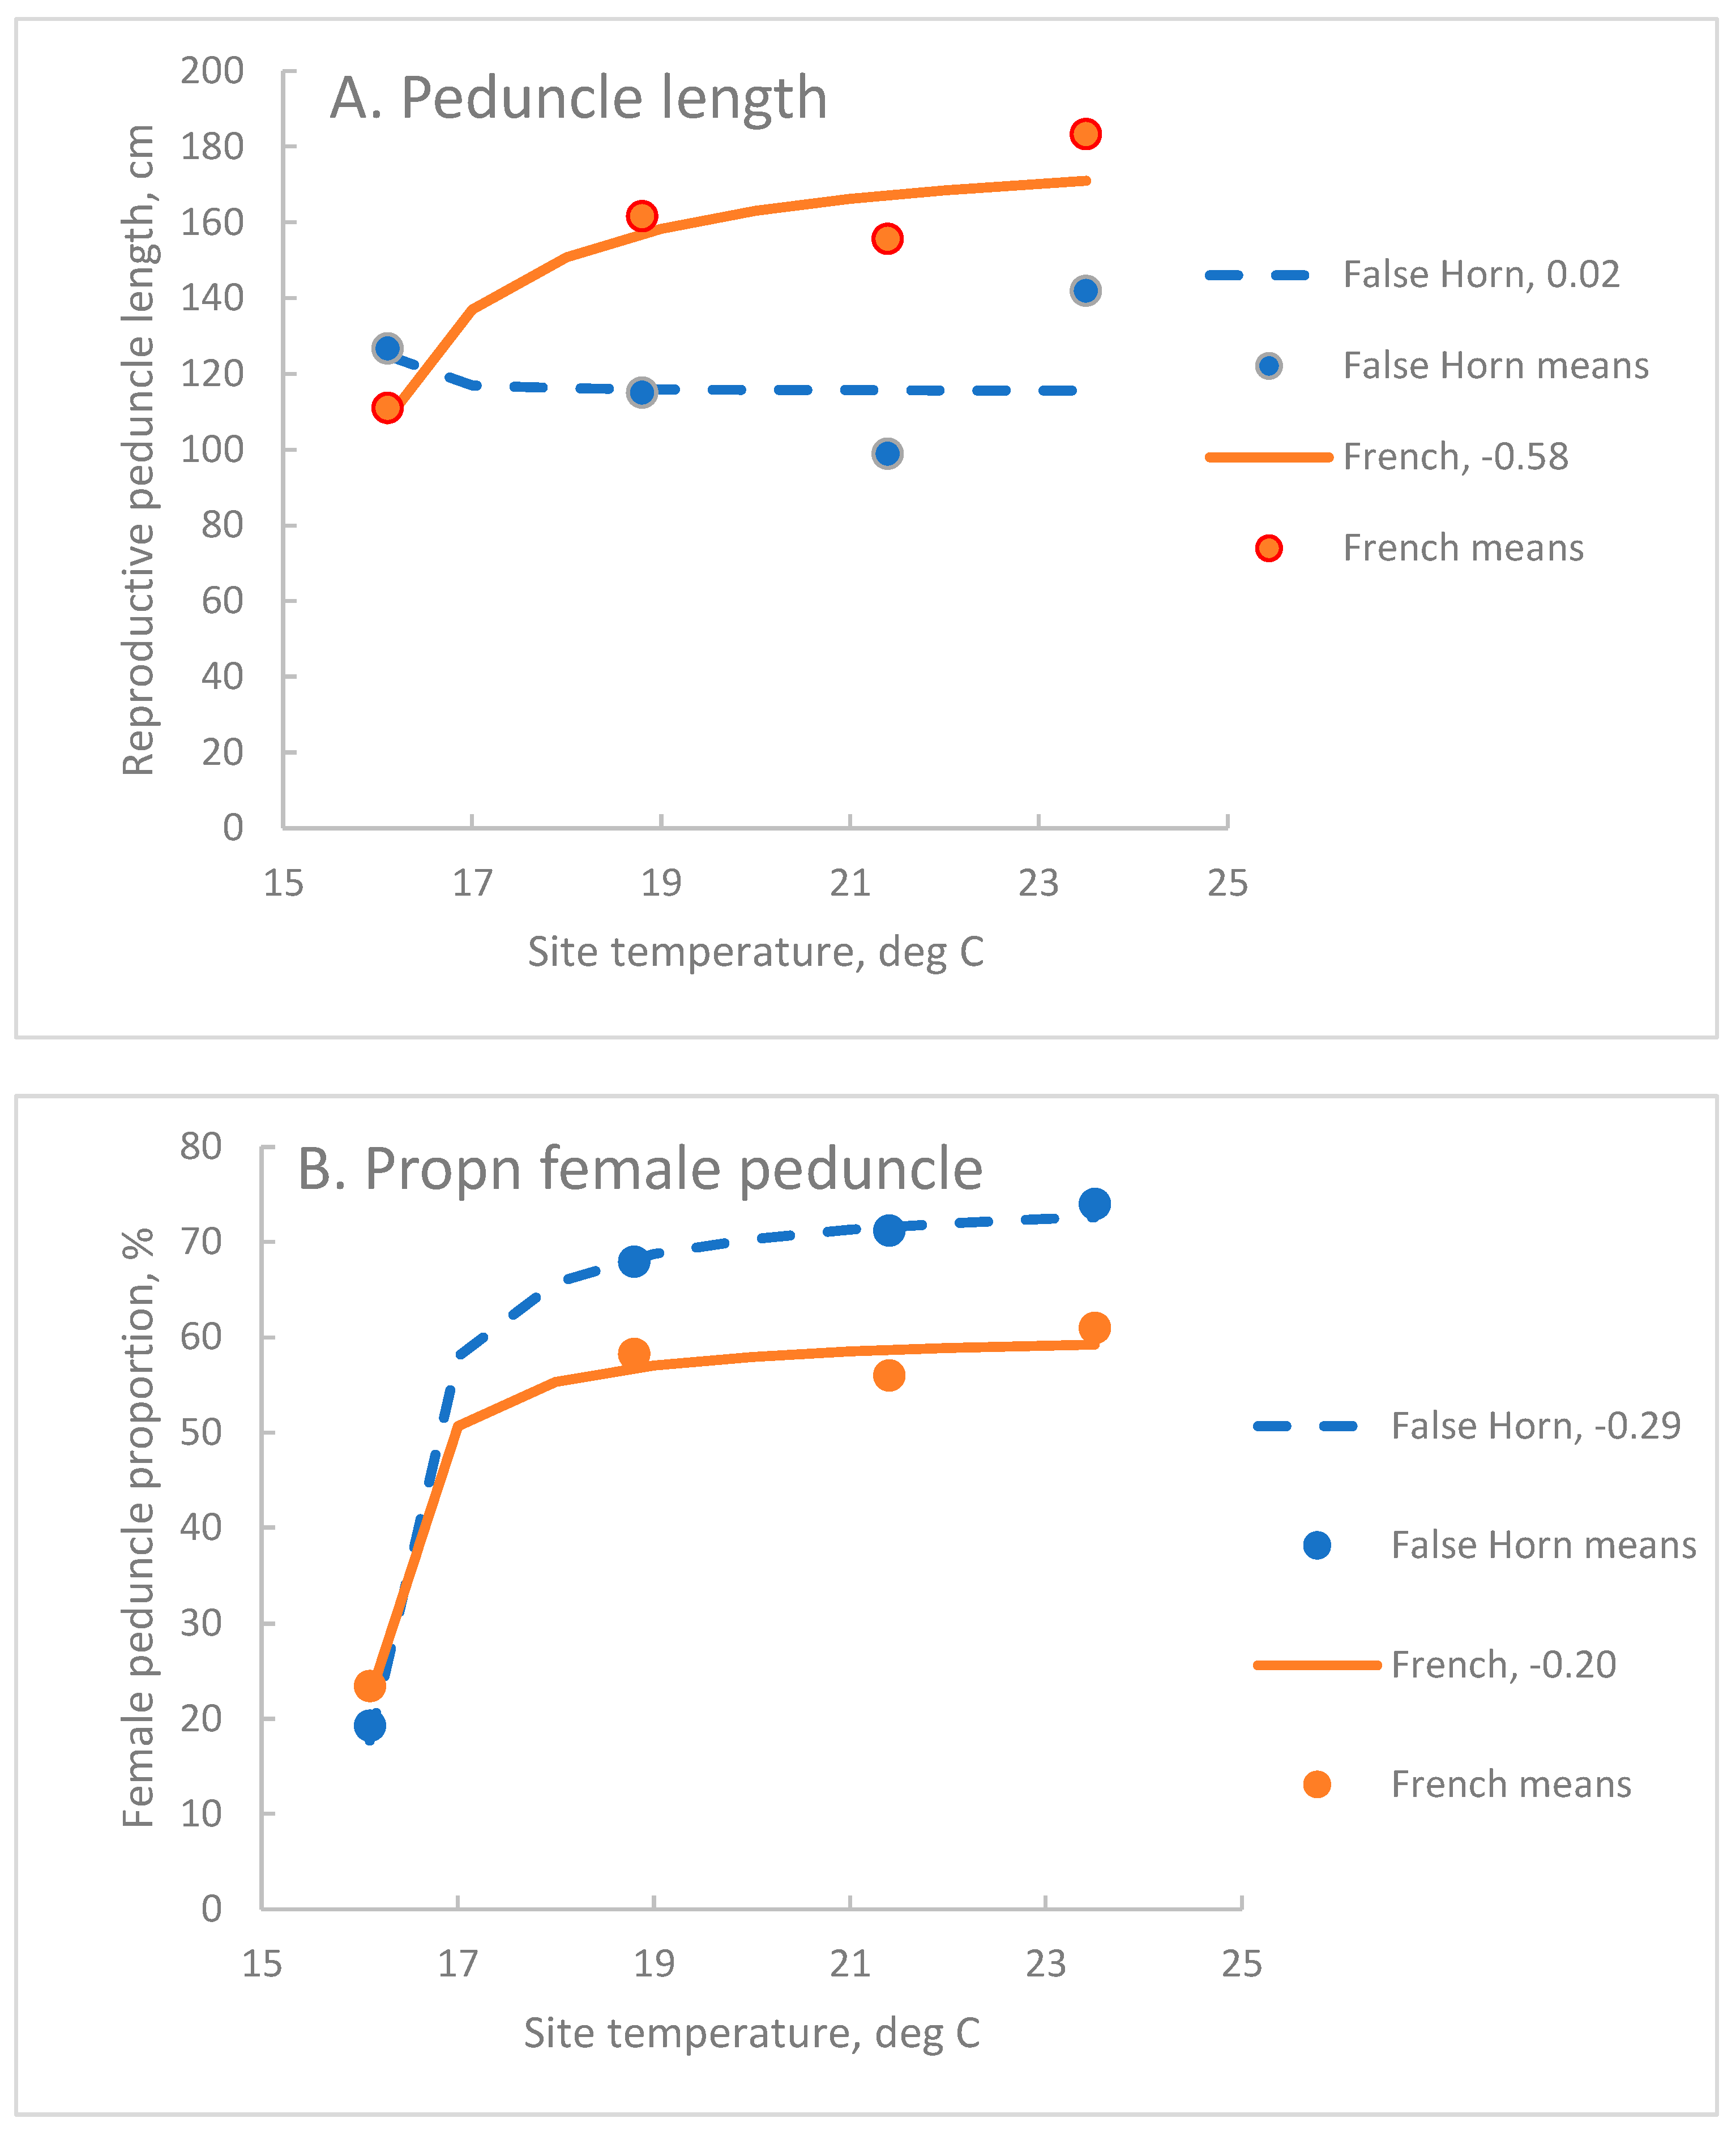
The French clone-set had a longer reproductive peduncle, Pr, than the False Horn clone set (Figure 3A). In the False Horn clone-set, the shorter Pr was stable across the temperature range, but cooler temperatures shortened Pr in the French clone-set such that at the coolest temperature Pr was similar in length in both clone sets (Figure 3A).
The False Horn clone-set had a higher proportion of female reproductive peduncle than in the French clone set (Figure 3B), reflecting in part the differences in total Pr length (Figure 3A). Low temperatures severely reduced the female proportion to a fifth in both clone-sets.

3.4. Effect of the Genet on Hb, Fh and Fb

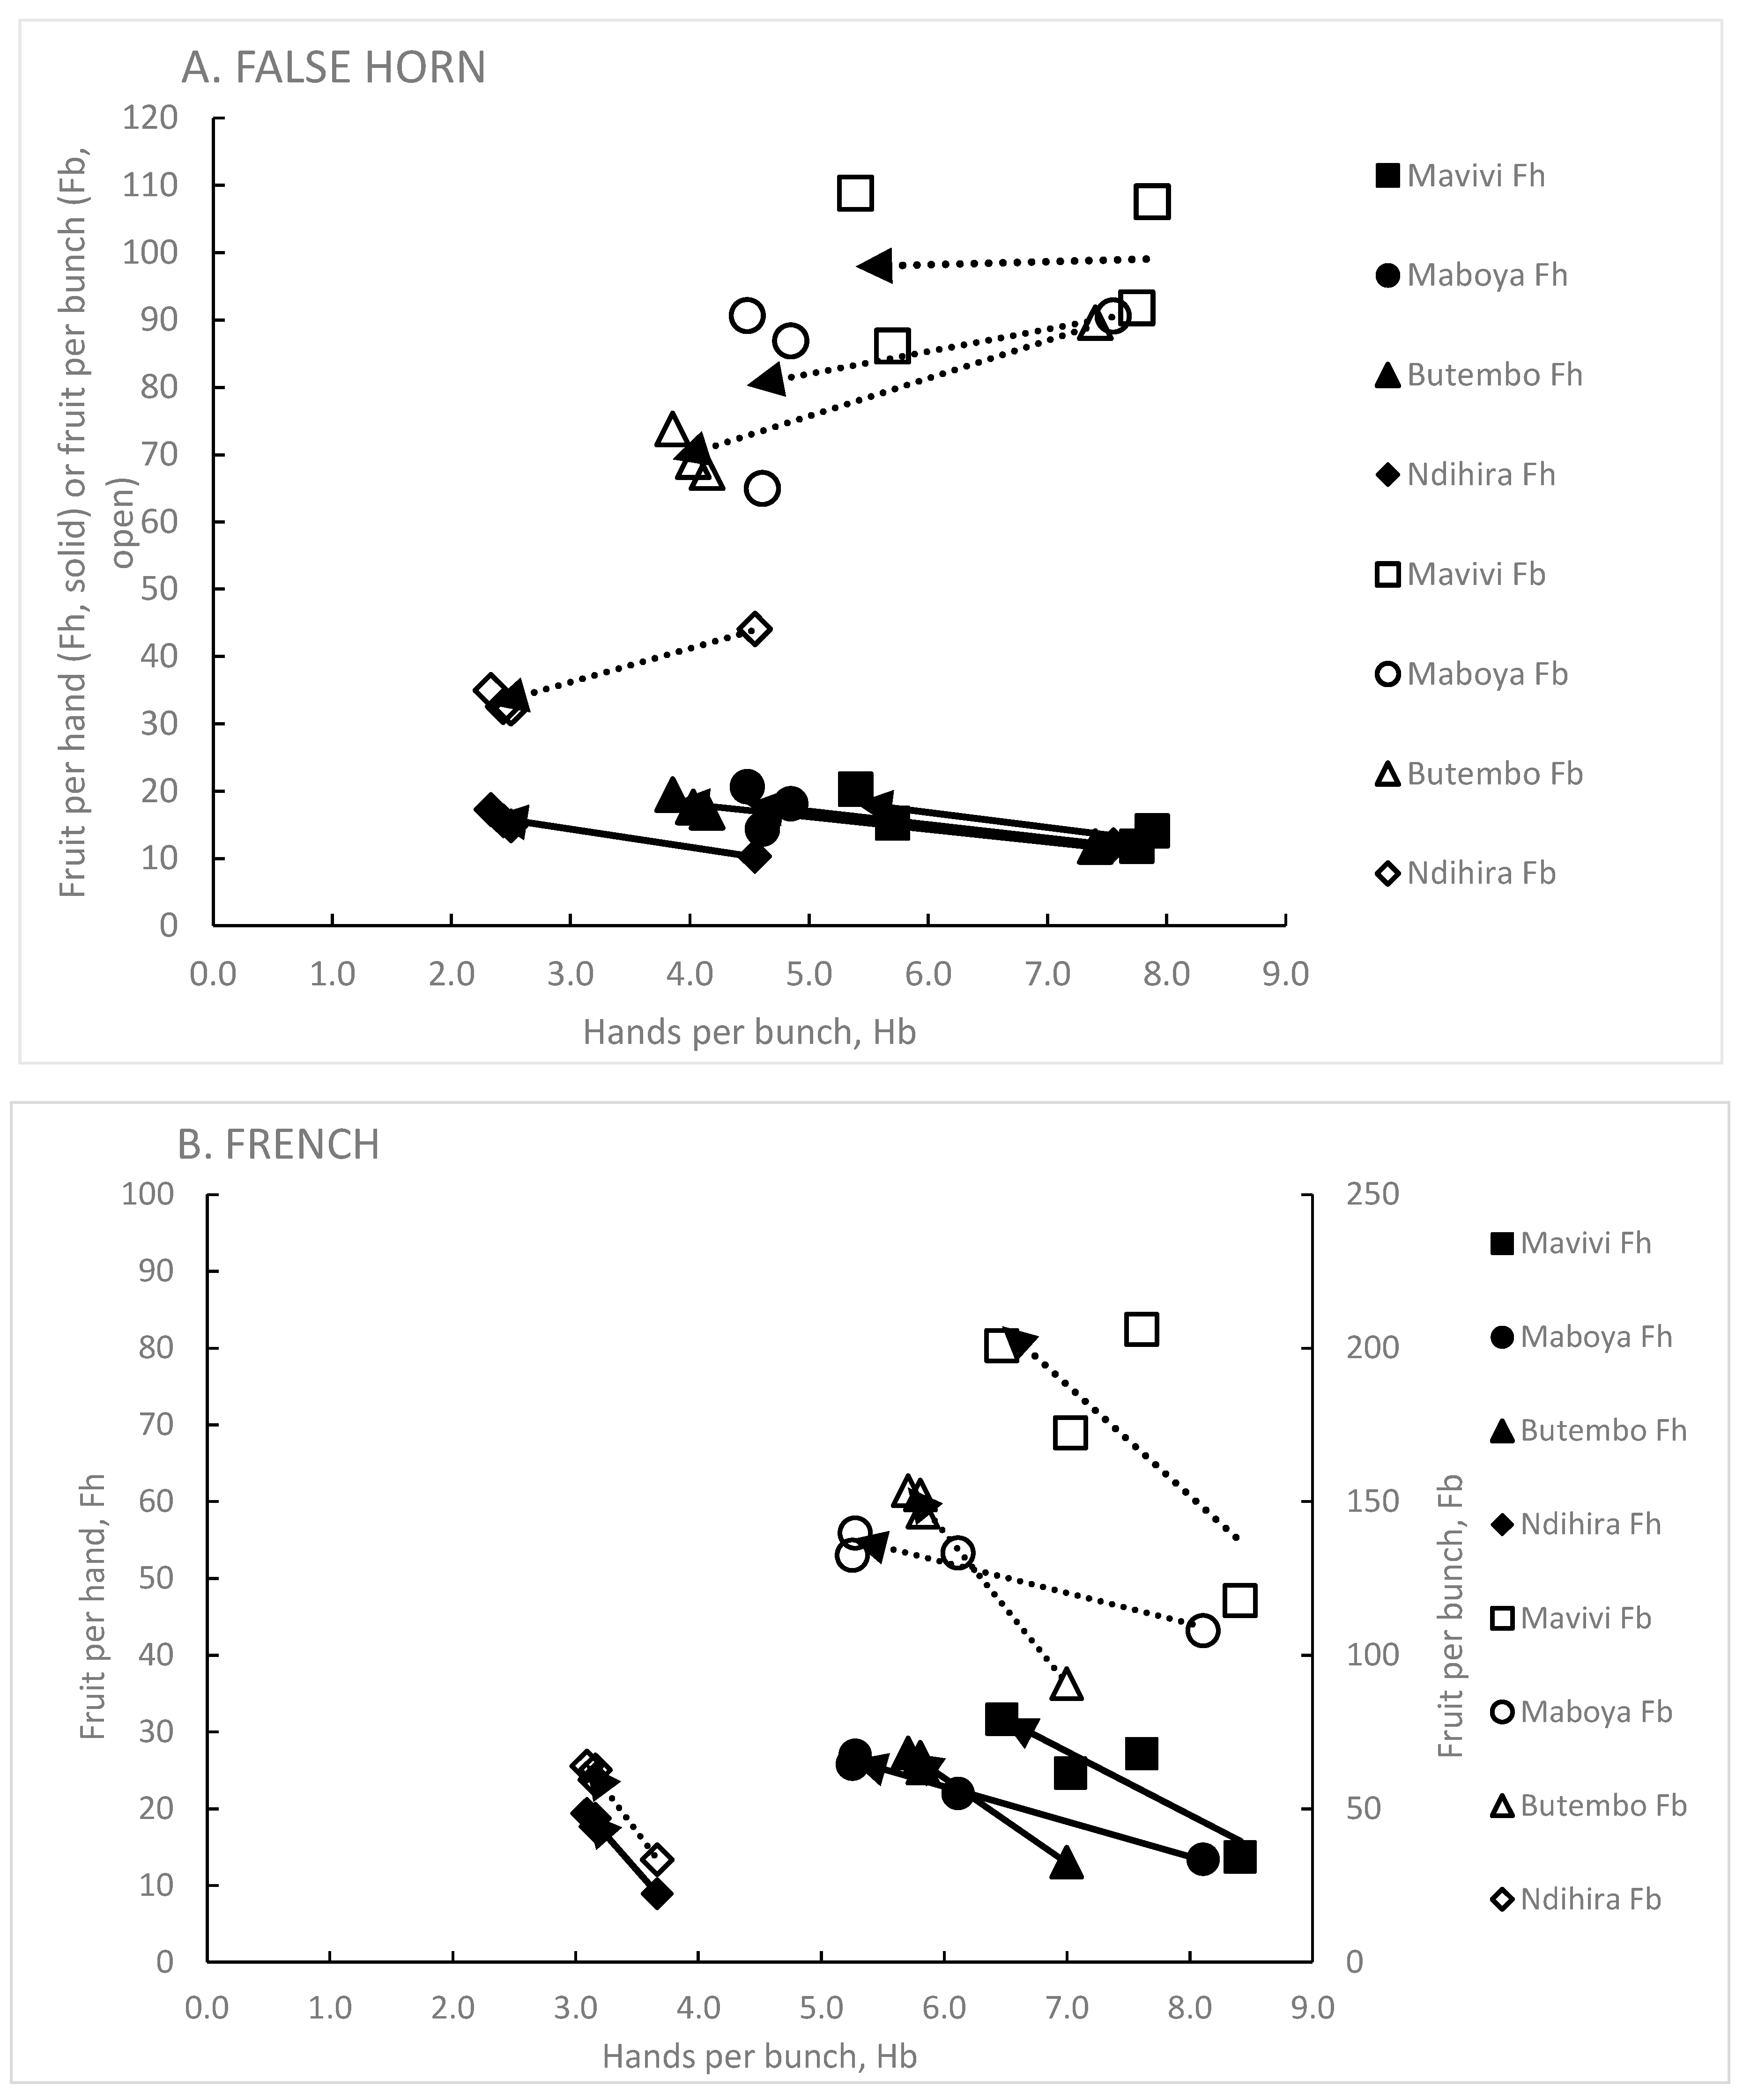
The presence of the genet in the ratoons reduced Hb but increased Fh, compared with the plant crop where the genet was absent (Figure 4A,B). Cultivars of the False Horn clone-set showed a greater reduction in Hb than did those of the French clone-set. The reduction in Hb from C1 to ratoon crops occurred at all sites and in a comparable manner, especially for the False Horn cultivars.
For False Horn cultivars at Mavivi, the changes in Hb and Fh compensated one another giving a similar Fb from plant crop to the ratoon crops as the genets developed. However, as elevation increased, the bunches of ratoon crops had fewer fruit per bunch than the plant crops and this was particularly noticeable at Ndihira, the highest and coolest site (Figure 4A).
For the French cultivars, the changes in Hb and Fh were such that at all sites the Fb of ratoon bunches was greater than those of plant crops (Figure 4B). So, even though there was a reduction in Hb, the increase in Fh more than compensated, thus increasing Fb.

4. Discussion

Site temperature and the presence of the genet affected the three independent components of inflorescence architecture in both clone-sets of edible Musa (AAB) in this experiment, broadly supporting the hypothesis.
In both clone-sets, Fb decreased at cooler temperatures, but lower temperatures affected Hb more than Fh. Thus, the activity of the lateral cushion meristem in producing fruit-forming flowers within a node is less affected by changes in site temperature than the change in gene expression producing the switch from fruit-forming to non-fruit-forming flowers.
For the genet, across all site temperatures, Hb was lower in the ratoons than in the plant crop, while Fh increased. These effects happened at all sites and so are independent of temperature, indicating a change in allocation of reserves with genet development. This was an unexpected result as usually Hb and Fh benefit from the extra resources available in the genet. The clone-sets differed in the magnitude of the changes in Hb and Fh, but not in their general direction. In the French clone-set the genet boosted Fb because the increase in Fh more than compensated for the reduced Hb. In the False Horn clone-set the increase in Fh was not sufficient to compensate for the reduced Hb. We suggest that the source of the reserves allocated to the lateral cushion meristems to determine Fh, differs from that used to hasten the onset of changes in gene expression in nodes of fruit-forming flowers that determine Hb. The reserves present in the genet may be allocated to increase Fh production in ratoon crop cycles, while those usually allocated to Hb were reduced, possibly because of allocation to developing sib-suckers in this experiment (Turner et al., 2020).

4.1. Fruit per Bunch, Fb, per Hand, Fh, and Hands per Bunch, Hb

Increasing fruit per bunch can contribute to increased seed production in individual inflorescences of wild Musa spp. and to increased bunch weight in the edible bananas. In the data reported here, Fb was affected by site temperature, clone-set, and the genet. There was a clear difference between clone-sets (Figure 1C) in absolute terms, but for both clone sets the increase in Fb with warming site temperatures was of a similar proportion, about 100% across the range (Figure 1C). This would suggest a similar response of each clone-set to temperature, at least in relative terms. We found that the responses of Fh and Hb to site temperature differed, and so while at the level of Fb, the response of the two clone sets was similar, they arrived at that ‘similarity’ by different pathways.
Morphologically, each node on the peduncle consists of a bract subtending the lateral ‘cushion’ meristem from which the flowers arise, and fruit are attached. The number of flowers and subsequently fruit per hand are determined during the early development of the hand, with a single cincinnus taking up to seven plastochrons to form (Fahn, 1953). The flower initials that arise within the cushion meristem first appear about three nodes distant from the apical inflorescence meristem (White, 1928; Fahn, 1953; Ram et al., 1962; Moncur, 1988; Kirchoff, 2017). At this point, the peduncle has already begun to expand radially. The cushion meristem, subtended by the bract, is arc-shaped on the expanding peduncle and its final length can physically limit Fh.
In the developing inflorescence, the basal width of the bract provides the outer limit of the cushion meristem as the radial growth of the base of the bract is completed before the growth of the cushion meristem it subtends (Fahn, 1953). The cushion may not develop to the full extent of the bract base (Kirchoff, 2017) and the number of flower initials that form then depends on the length of the cushion and the space occupied by each flower meristem.
Flower meristems appear within the cushion, usually in a sequence best described as a cincinnus (Fahn, 1953; Kirchoff, 2017). If temperature affects the rate at which flower meristems are produced, but not the size of the bract base then, because the latter limits the length of the cushion meristem, it is unlikely that an association between site temperature and Fh will be established. Consistent with this interpretation, the association between site temperature and Fh was weak in the data illustrated in Figure 2B except for lower Fh in the French clone-set at Ndihira, the coolest site.
Fh varies from hand to hand within an inflorescence (Alexandrowicz, 1955; De Langhe, 1961; Swennen and Vuylsteke, 1987) but associated data for the width of the base of the subtending bract are not available. Measurements of peduncle size and bract basal width would be informative in identifying the factor(s) reducing Fh in the cultivars of the French clone-set at Ndihira.
Hb is a function of the rate of lateral node production by the inflorescence meristem and an irreversible change from fruit-forming to non-fruit-forming flower types along the developmental sequence of the peduncle. In Musa there are several flower types: fruit-forming hermaphrodite and female flowers and non-fruit-forming transitional, neuter, and male flowers. Not all species or cultivars have all types, but all species and cultivars have the change from fruit-forming to non-fruit-forming flowers. The change in flower type separates the basal section with its fruit-forming hands from the non-fruit-forming distal section of the inflorescence (White, 1928).
If Hb is determined by a permanent switch in gene expression within the whorls (W3 and W4) of developing flowers, then accumulated reserves may function as an independent factor affecting the timing of this change. This interpretation is consistent with the observation that the number of flowers per hand does not normally change with the change in flower type, from one hand to another, during inflorescence development (Alexandrowicz, 1955; Swennen and Vuylsteke, 1987).
Compared with Fh, Hb was quite sensitive to site temperature (Figure 2A). While Hb was greatest at the warmest site and least at the coolest site for both clone-sets, there was a difference between clone-sets in response to temperature. Cultivars of the False Horn clone set showed an almost linear decline in Hb as temperature fell, whereas with the French clone-set the decline in Hb with decreasing temperature was slight at first, then becoming increasingly greater as temperature fell.
The rate at which hands of female flowers are produced at the inflorescence meristem and the time from inflorescence initiation to when the switch in gene expression occurs in whorls 3 and 4 of developing flowers, are the two processes that determine Hb. Temperature of the meristem strongly affects rate of node production with slower rates at cooler temperatures (Savvides et al., 2016). The change in flower type is sensitive to the quantity of reserves accumulated before the inflorescence was initiated (Turner and Gibbs, 2018). Thus, the reserves affect Hb indirectly through their accumulation before the inflorescence formed and their subsequent effect on gene expression in the flowers when they begin to develop.

4.2. Plant Reserves and Inflorescence Architecture

As the plant moved from the plant (C1) to ratoon crop cycles (C2 to C4), the genet developed with reserves present in the rhizome and stems of earlier generations becoming available for use by the current generation. These reserves complement the carbohydrates available from the functional leaves of the current generation with the expectation that the inflorescences of ratoons would be larger (more Hb and Fh) than those of the plant crop. This feature is usually observed (Robinson and Nel, 1990). However, the magnitude of the change may differ according to genomic group and whether Fh and/or Hb is affected (Table 5).
From the data of Turner and Hunt (1984), Fh increased proportionately much more than Hb as the genet developed. Cultivars of the AAA genomic group (mostly Cavendish genotypes) changed the most, increasing by 60% (Table 5). These data are consistent with the reserves accumulated by previous generations, that now form part of the genet, being used to support development of the inflorescence of the current generation.
The development of the genet in the French and False Horn clone-sets decreased Hb at all four sites (Figure 3) in contrast to what may be expected based on the observations of Turner and Hunt (1984) across a range of genotypes (Table 5). On the other hand, Fh increased from plant to ratoon crops at all sites except for the False Horn clone-set at Ndihira, the coolest site.
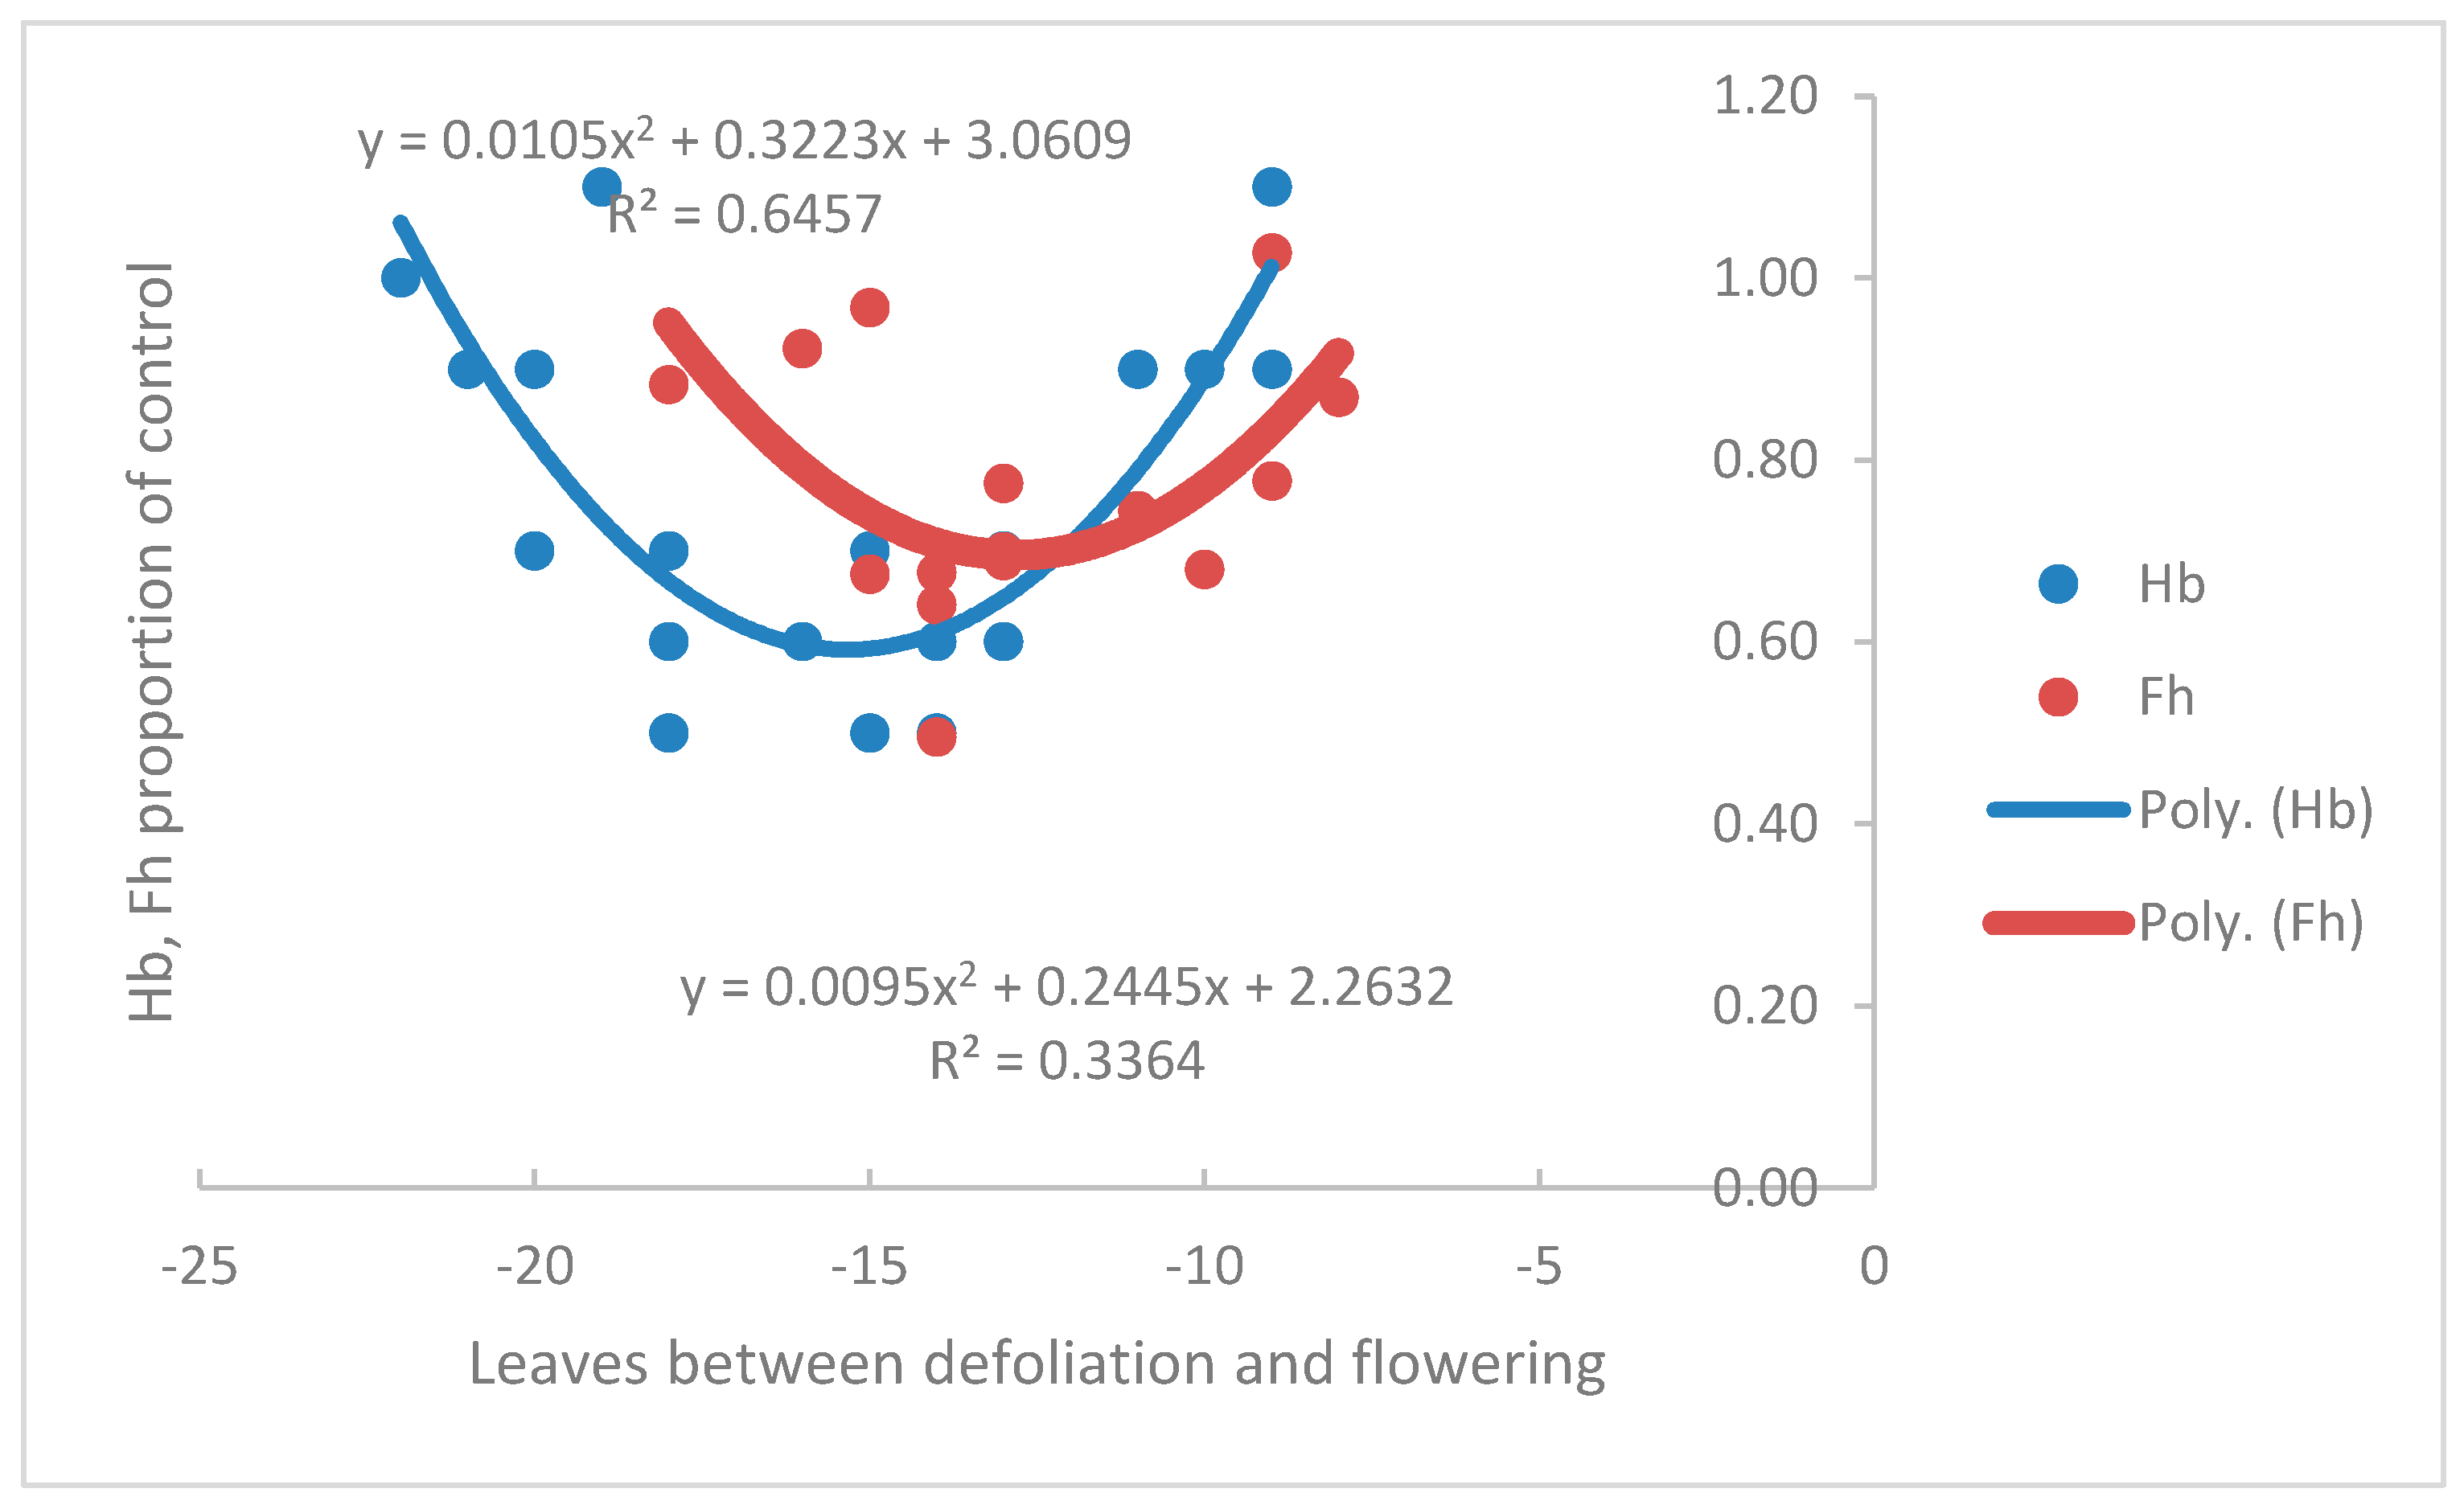
Turner and Gibbs (2018) used the data of Turner and Hunt (1987) from a plant crop to argue the case for Hb being affected by carbohydrate reserves accumulated by the plant before the inflorescence was formed. Removal of all leaves, or half of each leaf, during the mid-vegetative growth phase reduced Hb, formed in the following floral phase, by 40% to 50%. Defoliation in the floral phase, when hands are forming, did not change Hb (Figure 5). A lesser proportional effect (20% to 30%) of defoliation was recorded for Fh, but there was a phase shift as well. In contrast to Hb, Fh was reduced when plants were defoliated in their floral phase beginning -13 to -8 leaves before flowering, but not in the mid-vegetative phase (Figure 5). In the presence of the genet, defoliation had a lower proportional impact on Fh and Hb, with reductions of 7% to 8%. However, Hb was reduced only when plants were defoliated in the mid-vegetative phase, not the floral phase, indicating Hb depends on reserves accumulated before the inflorescence is formed. With the genet present, defoliation in either the vegetative or floral phases reduced Fh, although the effect was small. Reserves influence Fh more than current photosynthates when the genet is present, compared with its absence.
If these relationships hold for the two Musa AAB clone-sets grown in North Kivu, then a reduction of Hb in the ratoon crop cycles would imply that reserves accumulated before the inflorescence was present were not sufficient to delay the change in flower type and maintain or increase Hb. The reserves had either not been accumulated or had already been used for another purpose.
The reduced Hb in the ratoon crop cycles (Figure 4) may have been caused by the allocation of resources to the development of sib-suckers rather than Hb. The reason for the difference in the behaviour of Hb between plant crop and ratoons in this experiment and that of Turner and Hunt (1984) may lie in the different agronomic strategies used for desuckering (pruning). Turner and Hunt (1984) used the single sucker follower system with surplus suckers removed three times per year, equivalent to 4 to 5 times per life cycle, meaning that suckers were removed when they were small. On the other hand, in the experiment conducted by Sikyolo et al. (2013) the suckers remained on the parent plant until flowering, when all were counted and removed except the one retained for the next generation. This delay in desuckering meant that many suckers were more developed before their removal. Suckers remaining attached to the parent plant benefit from this attachment considerably in terms of growth (Eckstein and Robinson, 1999) and are likely to capture more resources, reducing the capacity of the ratoon sucker selected for the next generation to accumulate reserves in the mid-vegetative phase.
Fh behaved very differently with genet development, compared with Hb. It increased considerably. We attribute this to more reserves being allocated to the expanding tissues behind the inflorescence meristem allowing extended cushion meristems to develop across all site temperatures and in all ratoon crop cycles. The reserves accumulated before floral initiation that affect Hb, do not affect Fh, and so the reserves that contribute to increased Fh in ratoon crops must have another source. This may be in the genet, which is absent from the plant crop.
Hb and Fh, both of which contribute to inflorescence architecture in Musa are independent components affected differently by environmental and internal plant factors. These different mechanisms would allow changes in Hb and Fh in wild species that may affect success in pollination by visiting birds and animals. In cultivation, they offer the options for managing the balance between Hb and Fh either genetically or by management practices.

4.3. Peduncle Total Length, Pr, and the Proportion that Was Female, Pf

The timing of termination of the inflorescence meristem differs between the two clone-sets. The mature male peduncles of cultivars of the False Horn clone set contain about fifty nodes (De Langhe, 1961), while those of the French clone-set contain about 100. Since the plastochron of node production in the floral phase is about 5 times faster than the phyllochron (Turner, 1981) and about 10 to 11 leaves emerge from a shoot in the floral phase, which ends at flowering, then in the False Horn clone-set all nodes on the male peduncle present at fruit maturity are already present at flowering. In this clone-set, the inflorescence meristem will have terminated and growth of the male peduncle after flowering, will be entirely due to elongation of the internodes.
For the French clone-set, termination of the inflorescence meristem occurs after fruit maturity, which is from 4 to 8 months after flowering, depending on the site (Sikyolo et al., 2013). These differences between clone-sets in the onset of inflorescence meristem termination are important for interpreting the different responses of Pr to site temperature (Figure 3A).
A reduction in Pr was expected as site temperature decreased because of the effect of temperature on the rate of node production, but the similarity of Pr across sites in the False Horn clone-set suggests negligible effect of site temperature in this clone-set on either node number or the internode length. The slightly longer reproductive peduncle at Ndihira, the coolest site (Figure 3A), is consistent with measurements of Sikyolo et al. (2013) and with a later termination of the inflorescence meristem. This is more likely than an increase in internode length which for female peduncles of the False Horn clone set was 12 cm at Ndihira, compared with 20 cm at the warmer sites.
In the French clone-set the length of the reproductive peduncle and its reduction as site temperature fell cannot be attributed to the termination of the inflorescence meristem as it is still functional at fruit maturity. Rather, it indicated the effect of site temperature on the elongation of internodes of the male peduncle.
The female proportion of the reproductive peduncle, Pf, was governed by Hb and the internode length within the female peduncle. At Ndihira, internode length was 11-12 cm, and the same for each clone set, compared with 16 cm at the three warmer sites for French and 20 cm for False Horn. Lower Hb and reduced internode length both contributed to a reduced length of female peduncle at Ndihira and a substantial reduction in Pf, compared with the three warmer sites.
For a single inflorescence of a wild species of Musa, Pf is a proxy for the balance between reproductive effort allocated to seed and pollen production. The data for the two clone-sets examined here suggest a proportional shift from production of female flowers at warm sites towards a high proportion of the peduncle supporting male flowers at cooler sites.
In terms of the number of female flowers per generation, the high number of suckers produced by plantains at high elevations (Sikyolo et al., 2013; Sivirihauma et al., 2016; Turner et al., 2020) more than compensated for the reduced Pf of individual inflorescences, the 5-fold increase in sucker numbers from Mavivi to Ndihira more than balancing the reduction in Fb. However, this compensation assumes all suckers develop sufficiently to flower and sib suckers within a generation do not reduce Fb, both of which are unlikely (Swennen et al., 1984). Nonetheless, the production of more suckers at high elevations could be a strategy of the plant to increase female flowers for pollination per generation but spread across more individuals within that generation.

Author Contributions

DT: JG, WO and GB conceived the ideas, designed the methodology and analyzed the data. DT and JG wrote the first draft of the paper. All authors contributed to the final draft of the paper and have read and agreed to the published version.

Funding

This work was supported by the Directorate General for Development, Belgium through the Consortium for Improving Agriculture-based Livelihoods in Central Africa (CIALCA). We thank the CGIAR initiative on Transforming Agrifood Systems in West and Central Africa (TAFS-WCA) for covering staff time of the Bioversity authors. We acknowledge the financial contribution of the CGIAR Research Program on Roots, Tubers, and Bananas and the CGIAR funding donors. Funding bodies were not involved in any part of the execution of this research. DT and JG did not receive funding from any agencies.

Data Availability Statement

The data that support this study will be shared on request.

Acknowledgments

We thank colleagues Prof W. and Dr J. Armstrong for comments on an earlier draft. We thank Charles Sivirihauma for data collection in the experimental fields and for providing information about nematode and weevil infestations across sites. We thank referees for helpful comments.

Conflicts of Interest

The authors declare no conflicts of interest.

References

  1. Adheka JG, De Langhe E. (2018) Characterisation and classification of the Musa AAB Plantain subgroup in the Congo Basin. Scripta Botanica Belgica, 54, 1-104.
  2. Adheka JG, Dhed’a DB, Karamura D, Blomme G, Swennen R, De Langhe E. (2018) The morphological diversity of plantain in the Democratic Republic of Congo. Scientia Horticulturae, 234, 126-133. [CrossRef]
  3. Alexandrowicz L. (1955) ‘Etude du developpement de l’inflorescence du bananier Nain’. Annales 9, Institut des Fruits et Agrumes Coloniaux (IFAC), Paris, France.
  4. Argent GCG. (1976) The wild bananas of Papua New Guinea. Royal Botanical Gardens Edinburgh, Notes, 35, 77-114.
  5. Argent GCG. (2000) Two interesting wild Musa species (Musaceae) from Sabah, Malaysia. Gardens’ Bulletin Singapore, 52, 203-210.
  6. Baker JG. (1893) A synopsis of the genera and species of Musaceae. Annals of Botany, 7, 189-222.
  7. Bartlett ME, Specht CD. (2010) Evidence for the involvement of GLOBOSA-like gene duplications and expression divergence in the evolution of floral morphology in the Zingiberales. New Phytologist, 187, 521-541. [CrossRef]
  8. Blomme G, Ocimati W, Sivirihauma C, Vutseme L, Turner DW. (2020) The performance of a wide range of plantain cultivars at three contrasting altitude sites in North Kivu, Eastern Democratic Republic of Congo. Fruits, 75, 21-35.
  9. Bowman JL, Moyroud E (2024) Reflections on the ABC model of flower development. The Plant Cell, 36, 1334-1357.
  10. Daniells, JW, O’Farrell PJ. (1987) Effect of cutting height of the parent pseudostem on yield and time of production of the following sucker in banana. Scientia Horticulturae, 31, 89-94. [CrossRef]
  11. De Langhe E. (1961) La taxonomie du bananier plantain en Afrique Equatoriale. Journal d’agriculture tropicale et de botanique appliquee, 8 (10-11), 417-449.
  12. Dodsworth S. (2017) Petal, sepal, or tepal? B-genes and monocot flowers. Trends in Plant Science, 22 (1), 8-10. [CrossRef]
  13. Eckstein K, Robinson JC. (1999) The influence of the mother plant on sucker growth, development, and photosynthesis in banana (Musa AAA: Dwarf Cavendish). Journal of Horticultural Science and Biotechnology, 74, 347-350.
  14. Fahn A. (1953) The origin of the banana inflorescence. Kew Bulletin 1953, (3), 299-306. [CrossRef]
  15. Ganry J. (1977) Determination ‘in situ’ du stade de transition entre la phase vegetative et la phase florale chez le bananier, utilisant le ‘coefficient de Vitesse de croissance des feuilles’. Essai d’interpretation de quelques processus de developpement durant la periode florale. Fruits, 32, 373-386.
  16. Irish V. (2017) The ABC model of flower development. Current Biology, 27, R853-R909.
  17. Kirchoff BK. (2017) Inflorescence and flower development in Musa velutina H. Wendl. & Drude (Musaceae), with a consideration of developmental variability, restricted phyllotactic direction, and hand initiation. International Journal of Plant Science, 178, 259-272.
  18. Lahav E, Turner DW. (1989) ‘Fertilising for high yield – Banana’ 2nd edn. IPI Bulletin 7, International Potash Institute, Berne, Switzerland.
  19. McIntyre BD, Speijer P, Riha SJ, Kizito F. (2000) Effects of mulching on biomass, nutrients, and soil water in banana inoculated with nematodes. Agronomy Journal, 92, 1081-1085. [CrossRef]
  20. Mead R, Curnow RN, Hasted AM.(1993) ‘Statistical Methods in Agriculture and Experimental Biology’. 2nd Edn. Chapman & Hall, London, UK.
  21. Moncur MW. (1988) ‘Floral development of tropical and subtropical fruit and nut species. An atlas of scanning electron micrographs. Division of Water and Land Resources, Natural Resources Series No 8, CSIRO, Australia.
  22. Nyine M, Uwimana B, Akech V, Brown A, Ortiz R, Dolezel J, Lorenzen J, Swennen R. (2019) Association genetics of bunch weight and its component traits in East African highland banana (Musa spp. AAA group). Theoretical and Applied Genetics, 132, 3295-3308. [CrossRef]
  23. Nyine M, Uwimana B, Swennen R, Batte M, Brown A, Christelova P, Hribova E, Lorenzen J, Dolezel J. (2017) Trait variation and genetic diversity in a banana genomic selection training population. PLoS ONE, 12(6), e0178734. [CrossRef]
  24. R Core Team. (2019) ‘R: A language and environment for statistical computing’. R Foundation for Statistical Computing, Vienna, Austria.
  25. Ram HYM, Ram M, Steward FC. (1962) Growth and development of the banana plant, 3a. The origin of the inflorescence and the development of flowers. 3b. The structure and development of the fruit. Annals of Botany, 26, 657-673.
  26. Robinson JC, Nel DJ. (1985) Comparative morphology, phenology, and production potential of banana cultivars ‘Dwarf Cavendish’ and ‘Williams’ in the Eastern Transvaal Lowveld. Scientia Horticulturae, 25, 149-161.
  27. Robinson JC, Nel DJ. (1990) Competitive inhibition of yield potential in a ‘Williams’ banana plantation due to excessive sucker growth. Scientia Horticulturae, 43, 225-236.
  28. Savvides A, Dieleman JA, van Ieperen W, Marcelis LFM. (2016) A unique approach to demonstrating that apical bud temperature specifically determines leaf initiation rate in the dicot Cucumis sativus. Planta, 243, 1071-1079. [CrossRef]
  29. Sikyolo I, Sivirihauma C, Ndungo V, De Langhe E, Ocimati W, Blomme G. (2013) ‘Growth and yield of plantain cultivars at four sites of differing altitude in North Kivu, Eastern Democratic Republic of Congo’. In ‘Banana Systems in the Humid Highlands of Sub-Saharan Africa – Enhancing Resilience and Productivity’. Eds. G Blomme, P van Asten, B Vanlauwe. CAB International, Wallingford, UK, pp. 48-57.
  30. Simmonds NW. (1954) Varietal identification in the Cavendish group of bananas. Journal of Horticultural Science, 29, 81-88. [CrossRef]
  31. Simmonds NW. (1966) ‘Bananas’. 2nd edn. Longman, London, UK.
  32. Sivirihauma C, Blomme G, Ocimati W, Vutseme L, Sikyolo I, Valimuzigha K, De Langhe E, Turner DW. (2016) Altitude effect on plantain growth and yield during four production cycles in North Kivu, Eastern Democratic Republic of Congo. Acta Horticulturae, 1114, 139-148.
  33. Summerville WAT. (1944) Studies on nutrition as qualified by development in Musa cavendishii Lamb. The Queensland Journal of Agricultural Science, 1, 1-127.
  34. Swennen R, Vuylsteke D. (1987) ‘Morphological taxonomy of plantain (Musa cultivars AAB) in West Africa’. In ‘Banana and Plantain Breeding Strategies’. Eds. GJ Persley, EA De Langhe pp. 165-171. ACIAR Proceedings No 21, ACIAR Canberra, pp 165-171.
  35. Swennen R, Vuylsteke D, Ortiz R. (1995) Phenotypic diversity, and patterns of variation in West and Central African plantains (Musa spp., AAB group, Musaceae). Economic Botany, 49, 329-327. [CrossRef]
  36. Tezenas du Montcel H, De Langhe E, Swennen R. (1983) Essai de classification des bananiers plantains (AAB). Fruits, 38, 461-474.
  37. Turner DW. (1971) Effects of climate on rate of banana leaf production. Tropical Agriculture (Trinidad), 48, 283-287.
  38. Turner DW.(1981) Crop physiology of bananas – quo vadis? Madras Agricultural Journal, 68, 78-84.
  39. Turner DW, Fortescue JA, Ocimati W, Blomme G. (2016) Plantain cultivars (Musa spp. AAB) grown at different altitudes demonstrate cool temperature and photoperiod responses relevant to genetic improvement. Field Crops Research, 194, 103-111. [CrossRef]
  40. Turner DW, Gibbs DJ. (2018) ‘A functional approach to bunch formation in banana’. In ‘Achieving sustainable cultivation of bananas, Vol 1. Cultivation techniques. Eds. GHJ Kema, A Drenth. Burleigh Dodds Scientific Publishing: Cambridge UK, pp. 93-116.
  41. Turner DW, Gibbs DJ, Ocimati W, Blomme G. (2020) The suckering behaviour of plantain (Musa, AAB) can be viewed as part of an evolved reproductive strategy. Scientia Horticulturae, 261, 108975. [CrossRef]
  42. Turner DW, Hunt N. (1984) ‘Growth, yield, and nutrient composition of 30 banana varieties in subtropical New South Wales’. Technical Bulletin 31, Department of Agriculture NSW, Sydney.
  43. Turner DW, Hunt N. (1987) Planting date and defoliation influence the time of harvest of bananas. Scientia Horticulturae, 32, 233-248. [CrossRef]
  44. Twyford IT. (1967) Banana nutrition: a review of principles and practice. Journal of the Science of Food and Agriculture, 18, 177-183. [CrossRef]
  45. Walmsley D, Twyford IT 1968, The translocation of phosphorus within a stool of ‘Robusta’ bananas. Tropical Agriculture (Trinidad) 45, 229-233.
  46. White PR. (1928) Studies on the banana. An investigation of the floral morphology and cytology of certain types of the genus Musa L. Zeitschrift. Fuer. Zellforschung und Mikroskopische Anatomie Bd., 7, 673-733. [CrossRef]
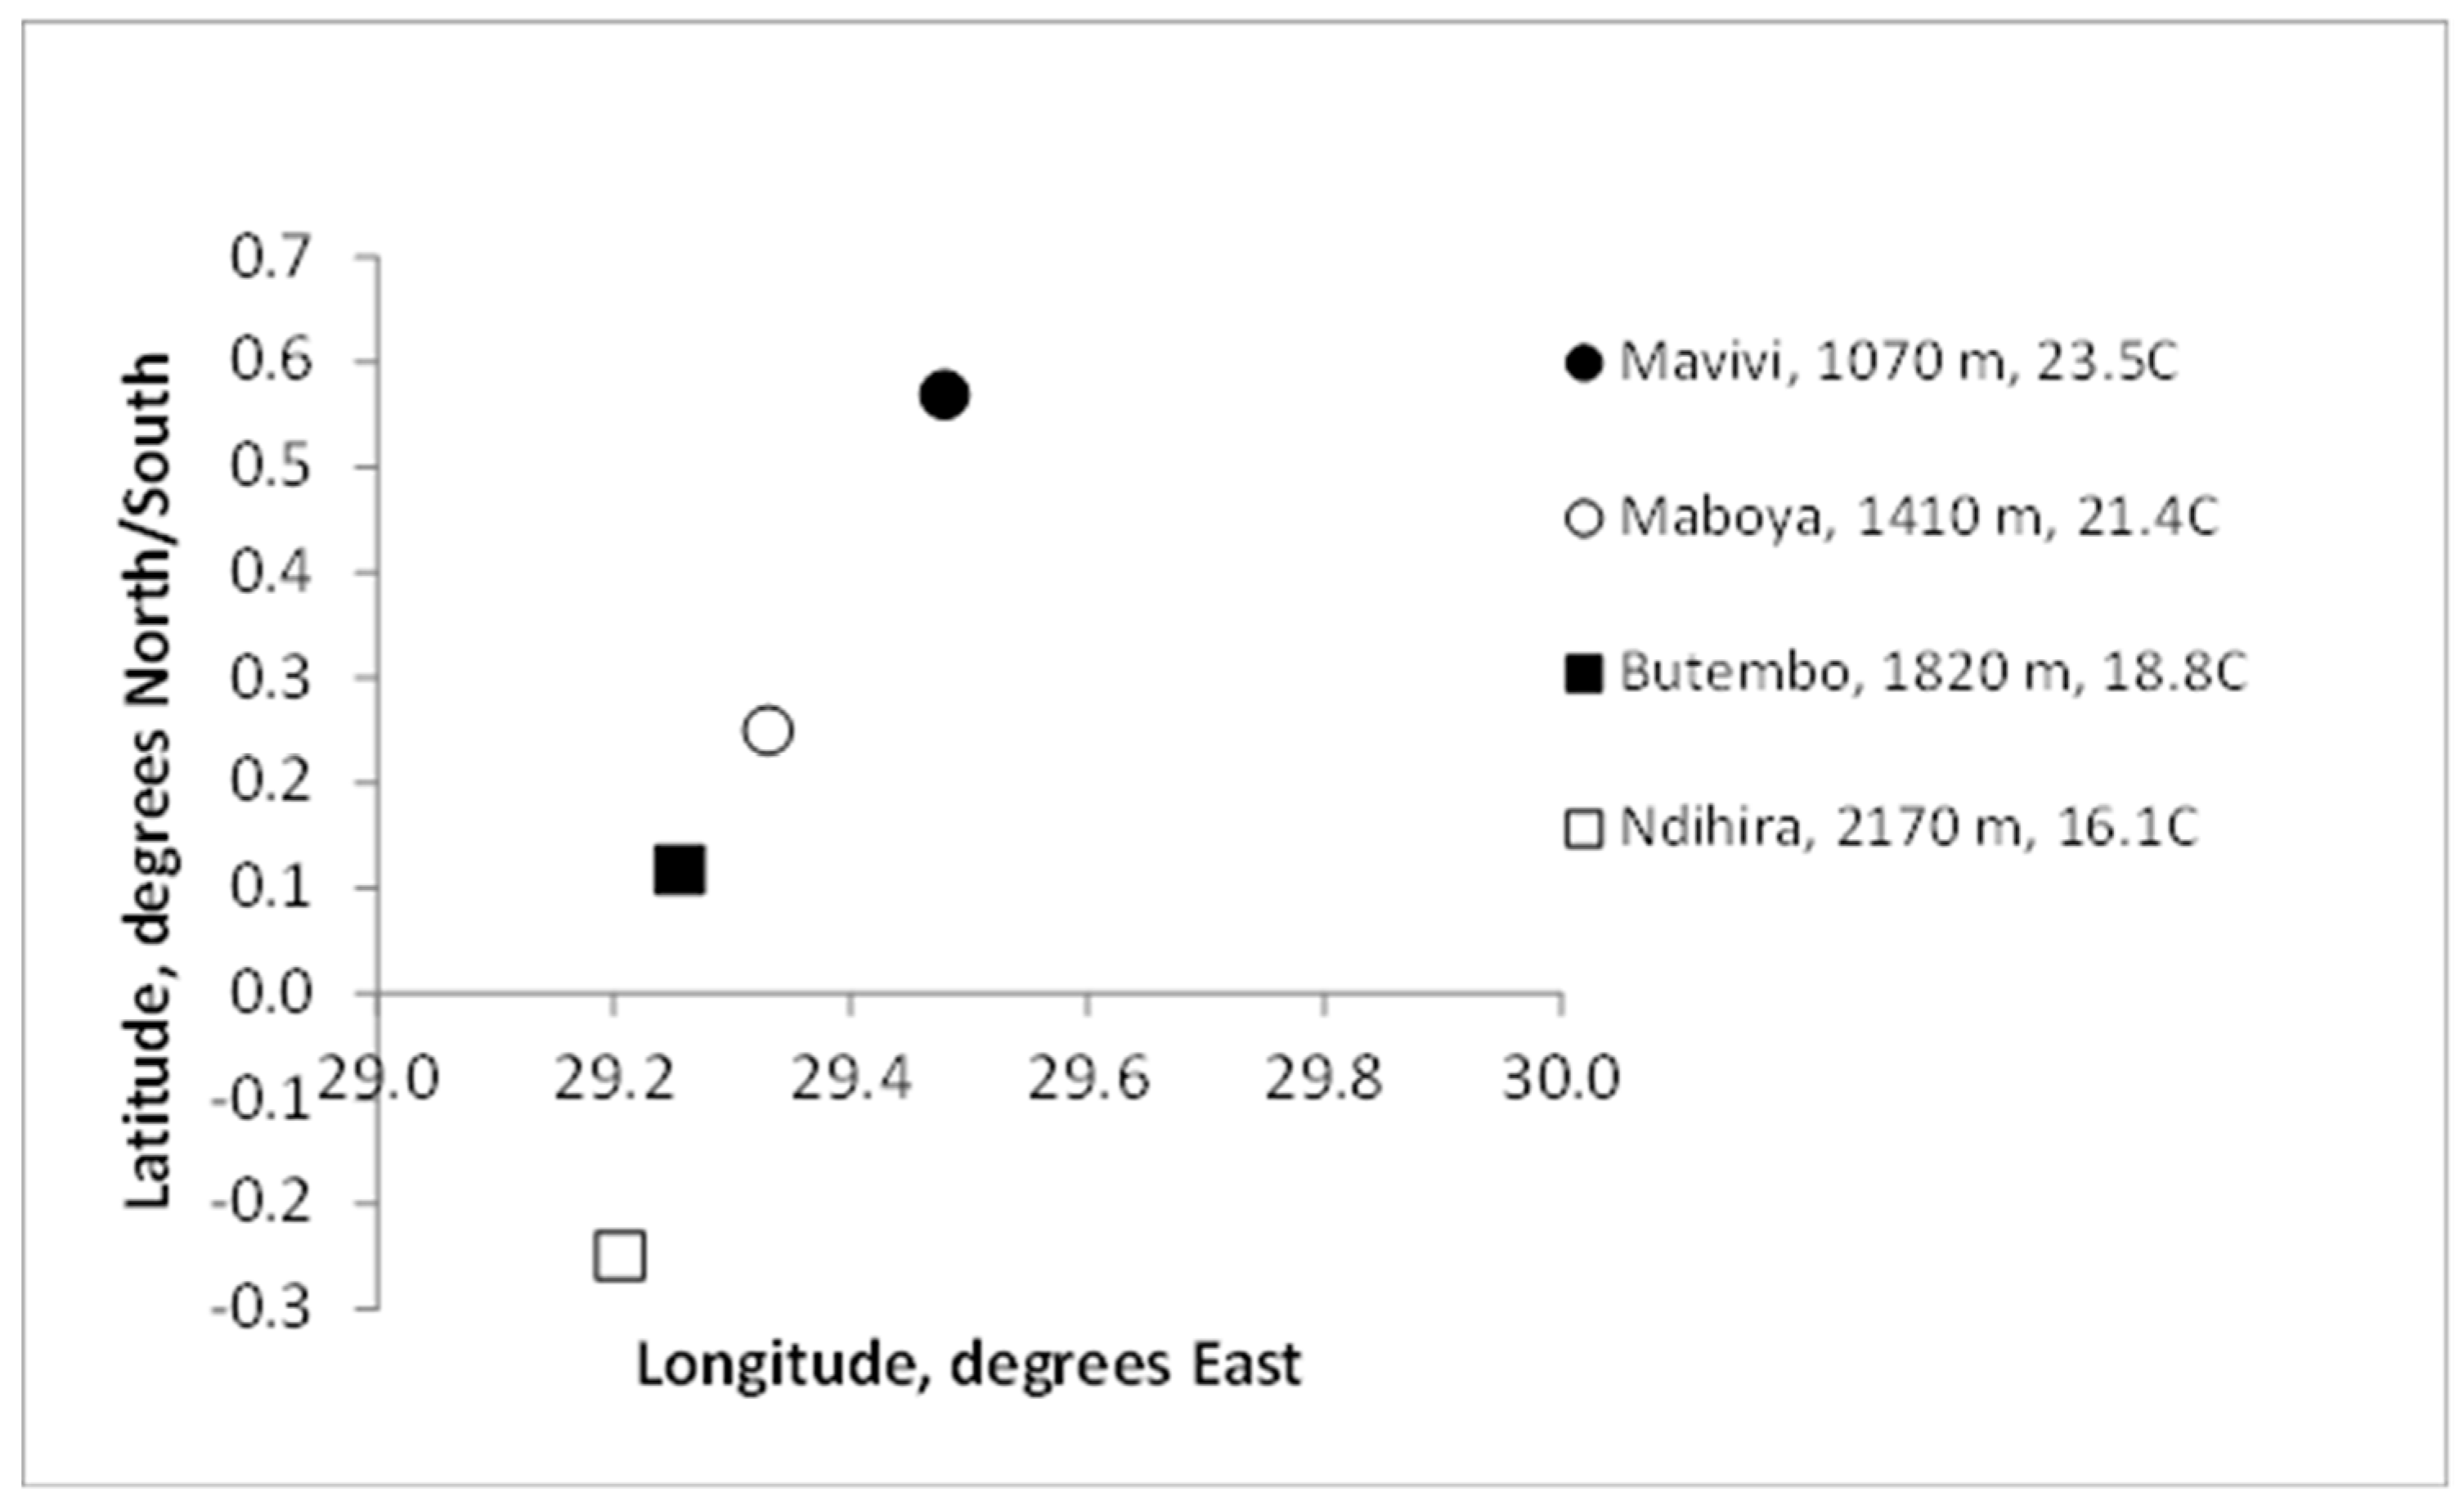
Figure 1. The location of the four sites in North Kivu, DRC, in relation to latitude and longitude. The legend shows respective elevations (m) and annual mean temperature (°C) of the sites. One degree of longitude at the equator (0° latitude, x axis) is equivalent to 111 km.
Preprints 108294 g001
Figure 2. The association between site temperature and A. Hb, B. Fh and C. Fb for False Horn and French clone-sets of plantain. Curves are the exponential reciprocal function fitted to the modified data with the calculated data for Ndihira for cycles C2 to C4 (False Horn n=360, French n=540). Points are site means (False Horn n=90, French n=135). Solid lines indicate the French clone-set and broken lines the False Horn clone-set. The C coefficient appears after the legend for each curve. For each parameter, all values of C are significantly different at P=0.01.
Preprints 108294 g002aPreprints 108294 g002b
Figure 3. The association between site temperature and A. Reproductive peduncle length, Pr, cm, B. Proportion of female peduncle, Pf, %, for False Horn and French clone-sets. Curves are the exponential reciprocal function fitted to bulked data for cycles C2 to C4 (False Horn n=360, French n=540). Points are site means (False Horn n=90, French n=135). Solid lines indicate the French clone-set and broken lines the False Horn clone-set. The C coefficient appears after the legend for each curve. For each parameter, all values of C are significantly different at P=0.01.
Preprints 108294 g003
Figure 4. The changes in Hb, Fh and Fb from plant crop (C1, base of arrows, genet absent) to ratoon crop cycles (C2, C3 and C4, tip of arrows, genet present) for A. False Horn cultivars and B. French cultivars. Data were ‘modified’ and the calculated Ndihira data used for C1. Each symbol type represents a different site (see legend). Open symbols and dotted arrows show changes for Hb and Fb, solid symbols and arrows show changes for Hb and Fh. The arrows show the direction and amount of change from C1 to C2, C3 and C4. Each arrow is the linear trend-line and starts at C1 and ends at C2, C3 and C4. The y axes in A and B have different ranges and in A, for each point, n=30 and for B, n=45.
Preprints 108294 g004
Figure 5. The effect of defoliation at various stages before flowering of the plant crop (no genet) on the Fh and Hb of inflorescences that subsequently emerged, expressed as a proportion of the control (no defoliation). The inflorescence usually begins to form -11 leaves before flowering (range -8 to -14). Each point is for a single inflorescence. Data from Turner and Hunt (1987).
Preprints 108294 g005
Table 1. The Ndhi ratios of Fh, Hb and Fb for the five cultivars of the main experiment used to calculate the Ndihira data set. Data from cultivars present after the main experiment (Cycle >4) and were adjusted for soil P and K concentrations.
Cultivar Ndhi ratio
Fh Hb Fb
‘Kotina’ 0.97 0.60 0.58
‘Vuhembe’ 0.87 0.71 0.62
‘Musilongo’ 0.49 0.35 0.17
‘Nguma’ 0.85 0.70 0.60
‘Vuhindi’ 0.81 0.66 0.53
Table 2. Measured values of A. Hb, Fh, Fb, and B. Pr and Pf of five cultivars of plantains (AAB) from two clone-sets grown over four sites of differing elevations in North Kivu, Democratic Republic of Congo. The data are from three ratoon crop cycles (C2 to C4). For each mean, n=45.
A Parameters of the female peduncle
Parameter Hands/bunch, Hb
Clone set False Horn French
Site/Cultivar ‘Kotina’ ‘Vuhembe’ ‘Musilongo’ ‘Nguma’ ‘Vuhindi’
Mavivi, 1066 m 5.29 4.67 5.57 5.42 5.63
Maboya, 1412 m 3.69 3.73 3.91 4.73 4.67
Butembo, 1815 m 3.60 3.49 4.73 5.86 4.73
Ndihira, 2172 m 2.12 2.04 2.36 2.07 1.94
LSD, P=0.05 0.23
Parameter Fruit per hand, Fh
Mavivi 11.8 14.4 20.2 24.1 21.8
Maboya 14.6 13.9 21.9 20.9 17.2
Butembo 17.4 14.6 21.6 24.2 24.4
Ndihira 2.6 3.3 2.4 2.9 3.5
LSD, P=0.05 0.2
Parameter Fruit per bunch, Fb
Mavivi 58.8 65.7 110.8 127.4 120.2
Maboya 52.9 50.4 83.1 97.1 79.0
Butembo 59.8 49.5 100.3 139.2 113.3
Ndihira 5.0 6.0 5.0 5.5 5.9
LSD, P=0.05 1.3
B Dimensions of the reproductive peduncle
Parameter Length of reproductive peduncle, Pr, cm
Cultivar ‘Kotina’ ‘Vuhembe’ ‘Musilongo’ ‘Nguma’ ‘Vuhindi’
Mavivi 128 95 143 148 142
Maboya 78 80 121 141 111
Butembo 109 95 137 159 132
Ndihira 107 130 105 100 107
LSD, P=0.05 3
Parameter Female proportion of reproductive peduncle, Pf, %
Mavivi 74 74 57 66 60
Maboya 73 69 52 61 56
Butembo 70 66 58 59 57
Ndihira 22 17 26 26 18
LSD, P=0.05 1
Table 3. The effect of (i) modifying Hb, Fh and Fb for P and K concentrations in soil, SQRT(PK), and (ii) calculating the Ndihira data using the Ndhi ratio procedure on site means of parameters of inflorescence architecture. Data are for ratoon crops C2 to C4 averaged over all cultivars. ‘Measured’ are the original data. Means within a row, followed by the same letter do not differ at P=0.05.
Site Mavivi Maboya Butembo Ndihira LSD
Site Temperature, °C 23.5 21.4 18.8 16.1 P=0.05
Data/parameter Hands/bunch, Hb
Measured 5.31 4.15 4.48 2.11 0.10
SQRT(PK) 6.75 5.19 5.07 2.25 0.12
SQRT(PK), Ndhi calc 6.75 5.19 5.07 2.86 0.12

Parameter
Fruit/hand, Fh
Fruit/hand, Fh
Measured 18.3 17.6 18.9 2.8 0.6
SQRT(PK) 23.3 22.0 23.1 3.0 0.7
SQRT(PK), Ndhi calc 23.3 22.0 23.1 17.6 0.8

Parameter
Fruit/bunch, Fb
Fruit/bunch, Fb
Measured 97 73 92 6 2
PK 156 113 118 6 3
PK, Ndhi calc 156 113 118 52 3
Parameter Total peduncle length, Pr, cm
Measured French 144 125 143 104 4
Measured False Horn 112 79 102 118 4
SQRT(PK) French 183 156 162 111 3
SQRT(PK) False Horn 142 99 115 127 3
Table 4. Coefficients of the exponential reciprocal functions in Figure 1A–C (Eqn 5), fitted to data for five parameters each of False Horn and French clone-sets. Within a parameter, A coefficients followed by the same uppercase letter are not significantly different at P=0.001 (t test). Tb is the coefficient that maximizes the F ratio. Within a parameter, C coefficients followed by the same uppercase letter are not significantly different at P=0.001 (t test). *** probability for the regression is <0.001.
Clone set A Tb, °C Curvature coeff, C r P
Hands per bunch, Hb
French 6.98 A 15.1 -0.81 A 0.75 ***
False Horn 20.1 B 5.0 -22.78 B 0.87 ***
Fruit per hand, Fh
French 26.2 A 15.9 -0.074 B 0.51 ***
False Horn 16.8 B 15.9 -0.010 C 0.08 0.097
Fruit per bunch, Fb
French 190 A 15.2 -1.09 B 0.74 ***
False Horn 179 B 10.5 -8.21 C 0.83 ***
Length of reproductive peduncle, Pr, cm
French 183 B 15.0 -0.581 B 0.73 ***
False Horn 115 C 15.9 -0.016 C 0.16 0.001
Proportion of peduncle with female flowers, Pf
French 60.8 A 15.9 -0.201 B 0.92 ***
False Horn 75.5 B 15.9 -0.290 C 0.94 ***
Table 5. The proportional (%) change in Fh and Hb from the plant crop (no genet) to the second ratoon (genet present) for 24 Musa cultivars in the AAA, AAB+ABB, genomic groups grown in the subtropics of North-eastern New South Wales. Data from Turner and Hunt (1984).
Genome (n) Increase in fruit/hand, Fh, % Increase in hands/bunch, Hb, %
AAA (17) 60 15
AAB + ABB (7) 23 16
Disclaimer/Publisher’s Note: The statements, opinions and data contained in all publications are solely those of the individual author(s) and contributor(s) and not of MDPI and/or the editor(s). MDPI and/or the editor(s) disclaim responsibility for any injury to people or property resulting from any ideas, methods, instructions or products referred to in the content.
Copyright: This open access article is published under a Creative Commons CC BY 4.0 license, which permit the free download, distribution, and reuse, provided that the author and preprint are cited in any reuse.
Prerpints.org logo

Preprints.org is a free preprint server supported by MDPI in Basel, Switzerland.

Subscribe

© 2024 MDPI (Basel, Switzerland) unless otherwise stated