Preprint
Article

Circulating miR-16 and miR-21 Levels in Multiple Myeloma: Prognostic Significance of Survival and Response to Lenalidomide Treatment.

Altmetrics

Downloads

112

Views

42

Comments

0

A peer-reviewed article of this preprint also exists.

Submitted:

16 April 2024

Posted:

16 April 2024

You are already at the latest version

Alerts
Abstract
MicroRNAs (miRNAs), particularly miR-16 and miR-21, play a crucial role in mul-tiple myeloma (MM) pathogenesis by regulating gene expression. This study evalu-ated the prognostic significance of circulating miR-16 and miR-21 expression levels in 48 patients with MM at diagnosis treated with lenalidomide/dexamethasone (LD) compared with 15 healthy individuals (HI). All patients were treated with LD, 13 at first line and 35 at relapse, of whom 21 were tested twice at diagnosis and before LD initiation. The results revealed significantly lower levels of miR-16 and miR-21 in patients than in HIs, both at diagnosis and relapse, with decreased miR-16 levels at diagnosis, indicating improved overall survival (OS) (p value 0.024). Furthermore, miR-16 and miR-21 levels were associated with disease markers, while both corre-lated with the depth of response and mir-16 with sustained response to LD treatment. The ratios of both miR-16 and miR-21 expression levels (prior to LD treat-ment/diagnosis) below 2 predicted a shorter time to response (P = 0.027) and a longer time to next treatment (P = 0.042), respectively. These findings suggested a prognostic value for serum miR-16 and miR-21 levels in MM, as their expression levels corre-lated with disease variables and treatment outcomes.
Keywords: 
Subject: Biology and Life Sciences  -   Life Sciences

1. Introduction

Multiple Myeloma (MM) is a plasma cell malignancy characterized by monoclonal plasma cell proliferation in the bone marrow, leading to significant morbidity owing to bone lesions, anemia, renal failure, and hypercalcemia. Recent advances in MM treatment, characterized by the introduction of novel therapeutics, have markedly improved patient survival rates. These developments, along with innovations in cytogenetics and risk-stratification models, have progressively refined the prognostic assessment of MM. Despite these advances, prognosis remains suboptimal for a subset of patients not adequately classified by current risk models, highlighting the need for novel prognostic indicators [1,2].
MicroRNAs (miRNAs) are a class of non-coding RNAs that regulate gene expression, predominantly post-transcriptionally influencing various cellular processes including proliferation, apoptosis, and cancer pathogenesis. Post- transcriptionally, miRNAs bind to untranslated regions of mRNA and regulate specific gene expression and act as proto-oncogenesor suppressor miRNAS [3,4]. Epigenetic processes such as DNA methylation, histone modification, and RNA modification influence the expression levels of miRNAs, while as a feedback function, miRNAs influence epigenetic enzymes such as DNA methyltransferases , histone deacetylases and histone methyltransferases and operate as epigenetic regulators [5]. Although, several studies indicate that miRNA expression patterns are related to the biology and clinical behavior of solid and hematologic malignancies, the origin of miRNAs, the mechanisms of transit (secreted as free miRNAs actively or during cell apoptosis) and the most prominent role (intracellularly or extracellularly), are not well known [6]. Due to their stability as molecules, extracellular expression levels have been investigated for their potential prognostic impact in many tumors. However, limited research is available regarding the prognostic significance of circulating miRNAs in MM; miRNAs can be found in the serum in two forms, free miRNA and exosomal miRNA.
MiR-16 was initially associated with hematological neoplasms, such as chronic lymphocytic leukemia [7] and was among the first miRNAs examined in MM as part of Al Masri et al.'s study on miRNA expression analysis in multiple myeloma [8,9]. Few studies in MM bone marrow have examined miR-16, showing downregulation and suggesting its potential as a prognostic marker [10].
Recent studies have shown that miR-21 is a proto-oncogene that plays a significant role in bone marrow-mediated growth, survival, and resistance of MM cells to therapy. Although, miR-21 has been studied in many cancers [11], data of serum levels in MM are extremely limited.
The role of miRNAs in MM represents an appealing approach for advancing our understanding of the molecular underpinnings of the disease and identifying novel prognostic tools.
Over more than a decade, the therapeutic landscape of MM has been revolutionized by the inclusion of lenalidomide in treatment regimens, initially in relapsed/refractory MM (RRMM), and then rapidly in both the first-line and maintenance therapy strategies, which were significantly improved. However, resistance to lenalidomide emerged as a challenge as these patients often have poor outcomes [12].
This backdrop sets the stage for our investigation of the prognostic relevance of miR-16 and miR-21 in newly diagnosed and relapsed MM, and their potential as biomarkers for lenalidomide treatment response. This study aimed to enlighten the prognostic landscape of MM and explore novel avenues for personalized therapy, potentially guiding more effective treatment strategies and improving patient outcomes.

2. Patients and Methods

2.1. Patients and Samples

In this study, we retrospectively enrolled a total of 48 MM patients at diagnosis and 35 at relapse prior to Lenalidomide-Dexamethasone (LD) treatment. All patients were treated in our department with LD, 13 at first line and 35 at relapse, of whom 21 were tested twice at diagnosis and before LD initiation. Systematic collection of serum samples was performed from both, the patient and control group of healthy individuals, ensuring that the samples were stored in a frozen state for subsequent analysis. Serum samples were collected at the time of diagnosis and before the first administration of lenalidomide and dexamethasone. Our study’s inclusion criteria were based on the International Myeloma Working Group (IMWG) criteria for MM diagnosis, and all patients received a therapeutic protocol consisting of Lenalidomide with dexamethasone at either diagnosis or relapse. None of our patients received Lenalidomide as maintenance therapy. The therapeutic protocol comprised lenalidomide (d1-d21) in combination with dexamethasone 20 or 40 md (d1, d8, d15, and d22) in a 28-day cycle (LD). The Glomerular Filtration Rate (GFR) was determined using the Cockcroft-Gault equation.

2.2. MicroRNA Quantification

2.2.1. RNA Isolation

Total RNA enriched for miRNAs was isolated from 100 μl of blood serum using the MagMAX™ mirVana™ Total RNA Isolation Kit (Thermo Fisher Scientific Inc.) according to the manufacturer’s protocol. Magnetic-bead technology was used to uniformly recover high-quality RNA. The Implen P330 nanophotometer (Implen GmbH) was used to evaluate the concentration and purity of the extracted total RNA

2.2.2. cDNA Synthesis

MiRNA quantification was performed for miR-16-5p and miR21-5p. A TaqMan® Advanced miRNA cDNA Synthesis Kit (Thermo Fisher Scientific Inc.) was used to generate cDNA, which uses universal primers to consistently amplify all targets, including low-expression miRNA targets, thereby increasing assay sensitivity.

2.2.3. Serum microRNA Expression Quantification by Quantitative Realtime PCR (qRT-PCR)

TaqMan® Advanced miRNA Assays (for hsa-miR-16-5p (assay ID #477860_mir) for hsa-miR-21-5p (assay ID #477975_mir) and for cel-miR-39-3p (assay ID #478293_mir)) were used after cDNA synthesis to perform qRT-PCR with TaqMan® Fast Advanced Master Mix providing high specificity and the StepOnePlus™ Real-Time PCR System (Thermo Fisher Scientific Inc.). Each sample was analyzed in duplicate by qPCR. ExpressionSuite™ Software was used for the analysis and calculation of relative gene expression using the comparative Ct (ΔΔCt) method and normalization of sample-to-sample variation to an exogenous control. For accurate and precise quantification of circulating miRNA levels, the Caenorhabditis elegans miRNA Cel-miR-39-3p was used as an exogenous control. Finally, the relative levels of miRNA in patient samples were compared to the lowest value of healthy individuals’ miRNA (due to exceptionally elevated values of miRNA expression in HI compared to MM patients), which was used as a reference sample, and the final results were presented as fold change in expression using the 2ΔΔCt formula.

2.3. Statistical Analysis

Mann–Whitney test was used to analyze differential miRNAs expression between MM patients and HIs. We used the median of miRNA expression levels as a cut off point in the correlation and survival analysis.
To assess the impact of varying serum miRNA 16 and 21 levels at diagnosis (Dx) and LD initiation, the ratio of these two variables was calculated (miR-LD/DX). For the prognostic utility of this analysis, a ratio value greater than two was selected as the cutoff standard.
Clinical characteristics of the different groups and their associations with miRNAs were evaluated using Spearman correlation analysis. The Kaplan-Meier method was used to calculate the overall survival curves according to miRNA-16 and miRNA-21 expression. Survival differences according to gene expression were analyzed using the log-rank test. All statistical analyses were performed using SPSS software (version 28.0, IBM, USA). Statistical significance was set at P < 0.05.

2.4. Ethical Approval

The study was approved by the institutional review board (IRB) of our hospital (protocol number 191 and date of approval 21 February 2019). Informed consent was obtained from each patient prior to participation in the study, followed by a comprehensive review of their medical records. Patient confidentiality was maintained throughout the study.

3. Results

3.1. Demographic, Clinical and Laboratory Characteristics

In our study, we analyzed data at the time of diagnosis from 48 patients diagnosed with Multiple myeloma according to the IMWG criteria. Among these patients, all were newly diagnosed, 13 received LD frontline, while 35 at relapse. Twenty-one patients were tested twice, at diagnosis and at relapse before LD administration. The patient cohort included 28 men and 20 women with a median age of 67 years (range, 40–85 years). All patients received a standard Lenalidomide treatment protocol in combination with dexamethasone (LD). The distribution of International Staging System (ISS) was relatively balanced, with ISS I accounting for 33%, ISS II for 28%, and ISS III for 39% of the total. The Ig type was IgG in 46%, IgA in 33%, and LC (light chain) in 17% of the patients respectively. The majority of patients (80%) had at least one bone lytic lesion and 22 % had hypercalcemia. The median number of treatment lines patients’ received was 3 (range, 1-6), median Overall Survival (OS) was months (range, 2-188), median Time to Len Response (TLR) was 3.5 months (range, 0-16), median Time to Next Treatment after Lenalidomide (TTNT after Len) was 14 months (range, 1-89). The analytic demographic, clinical, and laboratory characteristics of the patients are provided in Table 1 and Table 2.

3.2. MiRNA 16 and MiRNA 21 Results

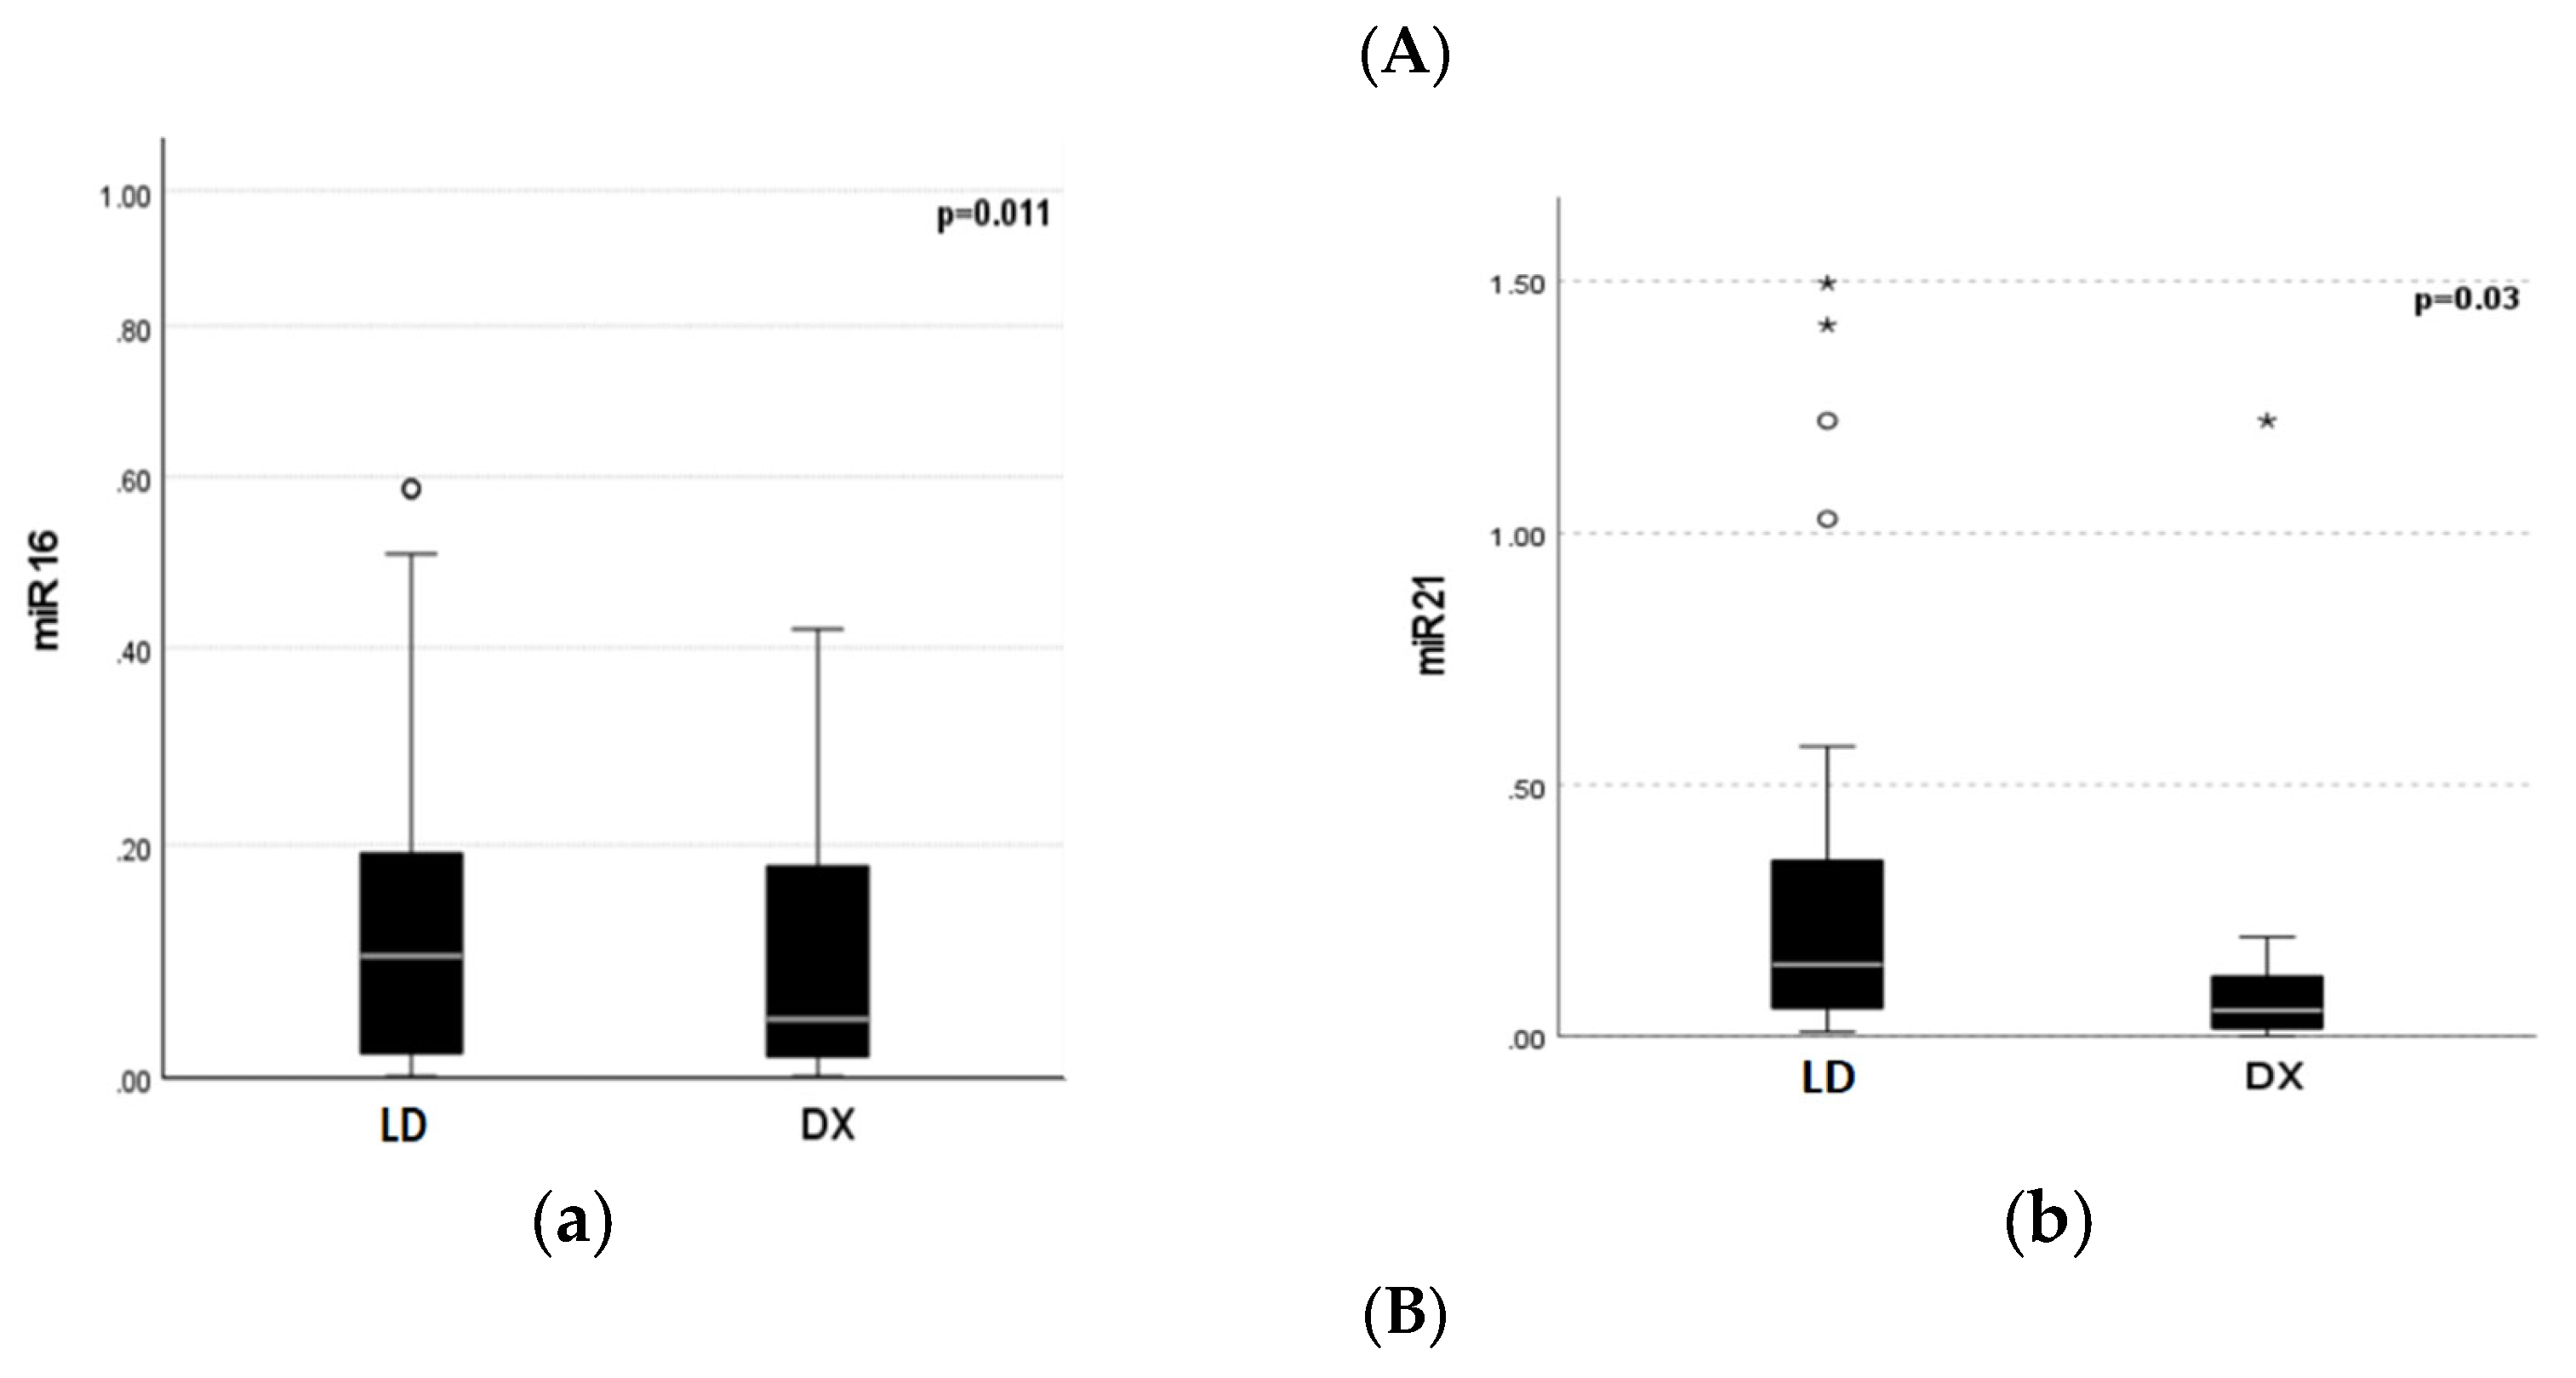
Serum expression of miR-16 and miR-21 was significantly decreased in MM patients at diagnosis compared to that in HI (miR-16 median 0.047 vs. 1.89, and miR-21 median 0.051 vs. 1.59, p < 0.001), respectively. Expression levels of miR-16 and 21 before LD initiation were also significantly downregulated compared to those in healthy individuals (miR-16 median 0.100 vs. 1.89, and miR-21 median 0.143 vs. 1.59, p<0.001). The expression levels of miR-16 and miR-21 at diagnosis were significantly decreased compared to the levels at relapse (p=0.011 and p=0.03, respectively) (Figure 1).
We used the median miR-16 and miR-21 expression levels at diagnosis to assess their association with clinical characteristics of MM. Significant correlations were observed between serum miR-16 expression levels and Cr (r=-0.473, p=0.002), GFR (r=-0.466, p=0.001), Cr≥2 (r=-0.562, p=0.002), hypercalcemia (r=-0.460, p=0.003), B2M (r=-0.370, p=0.021) and CRP (r=-0.356, p=0.022). Moreover, serum miR-21 levels were significantly correlated with B2M≤3.5 (r=0.372, p=0.017), Cr≥2 (r=-0.301, p=0.05), CRP (r=-0.330, p=0.033), and neutrophil/lymphocyte ratio (r=-0.332, p=0.045) (Table 3).
At the initiation of LD, serum miR-21 expression levels were significantly correlated with ISS (r=0.468, p=0.018) and treatment response (≥VgPR) (r=0.453, p=0.034). Additionally, there was a marginal correlation with Hb level (r=0.377, p=0.06). Conversely, serum miR-16 levels at LD initiation did not show any significant correlation with disease characteristics. However, expression levels that were twice the median value of miR-16 (x2) were associated with response to treatment (≥PR) (r=0.427, p=0.05) (Table 4).
To assess the impact of varying serum miRNA 16 and 21 levels at diagnosis (Dx) and LD initiation, the ratio of these two variables was calculated (miR-LD/DX). The miR-16 LD/DX ratio correlated with response to treatment (≥partial response) (r=0.413, p=0.05), and late relapse to LD beyond 24 months (r=0.701, p=0.0001). The miR-21 LD/DX ratio was associated with biochemical relapse (r=0.547, p=0.015) and late relapse to LD beyond 24 months (r=0.461, p=0.035) (Table 4).
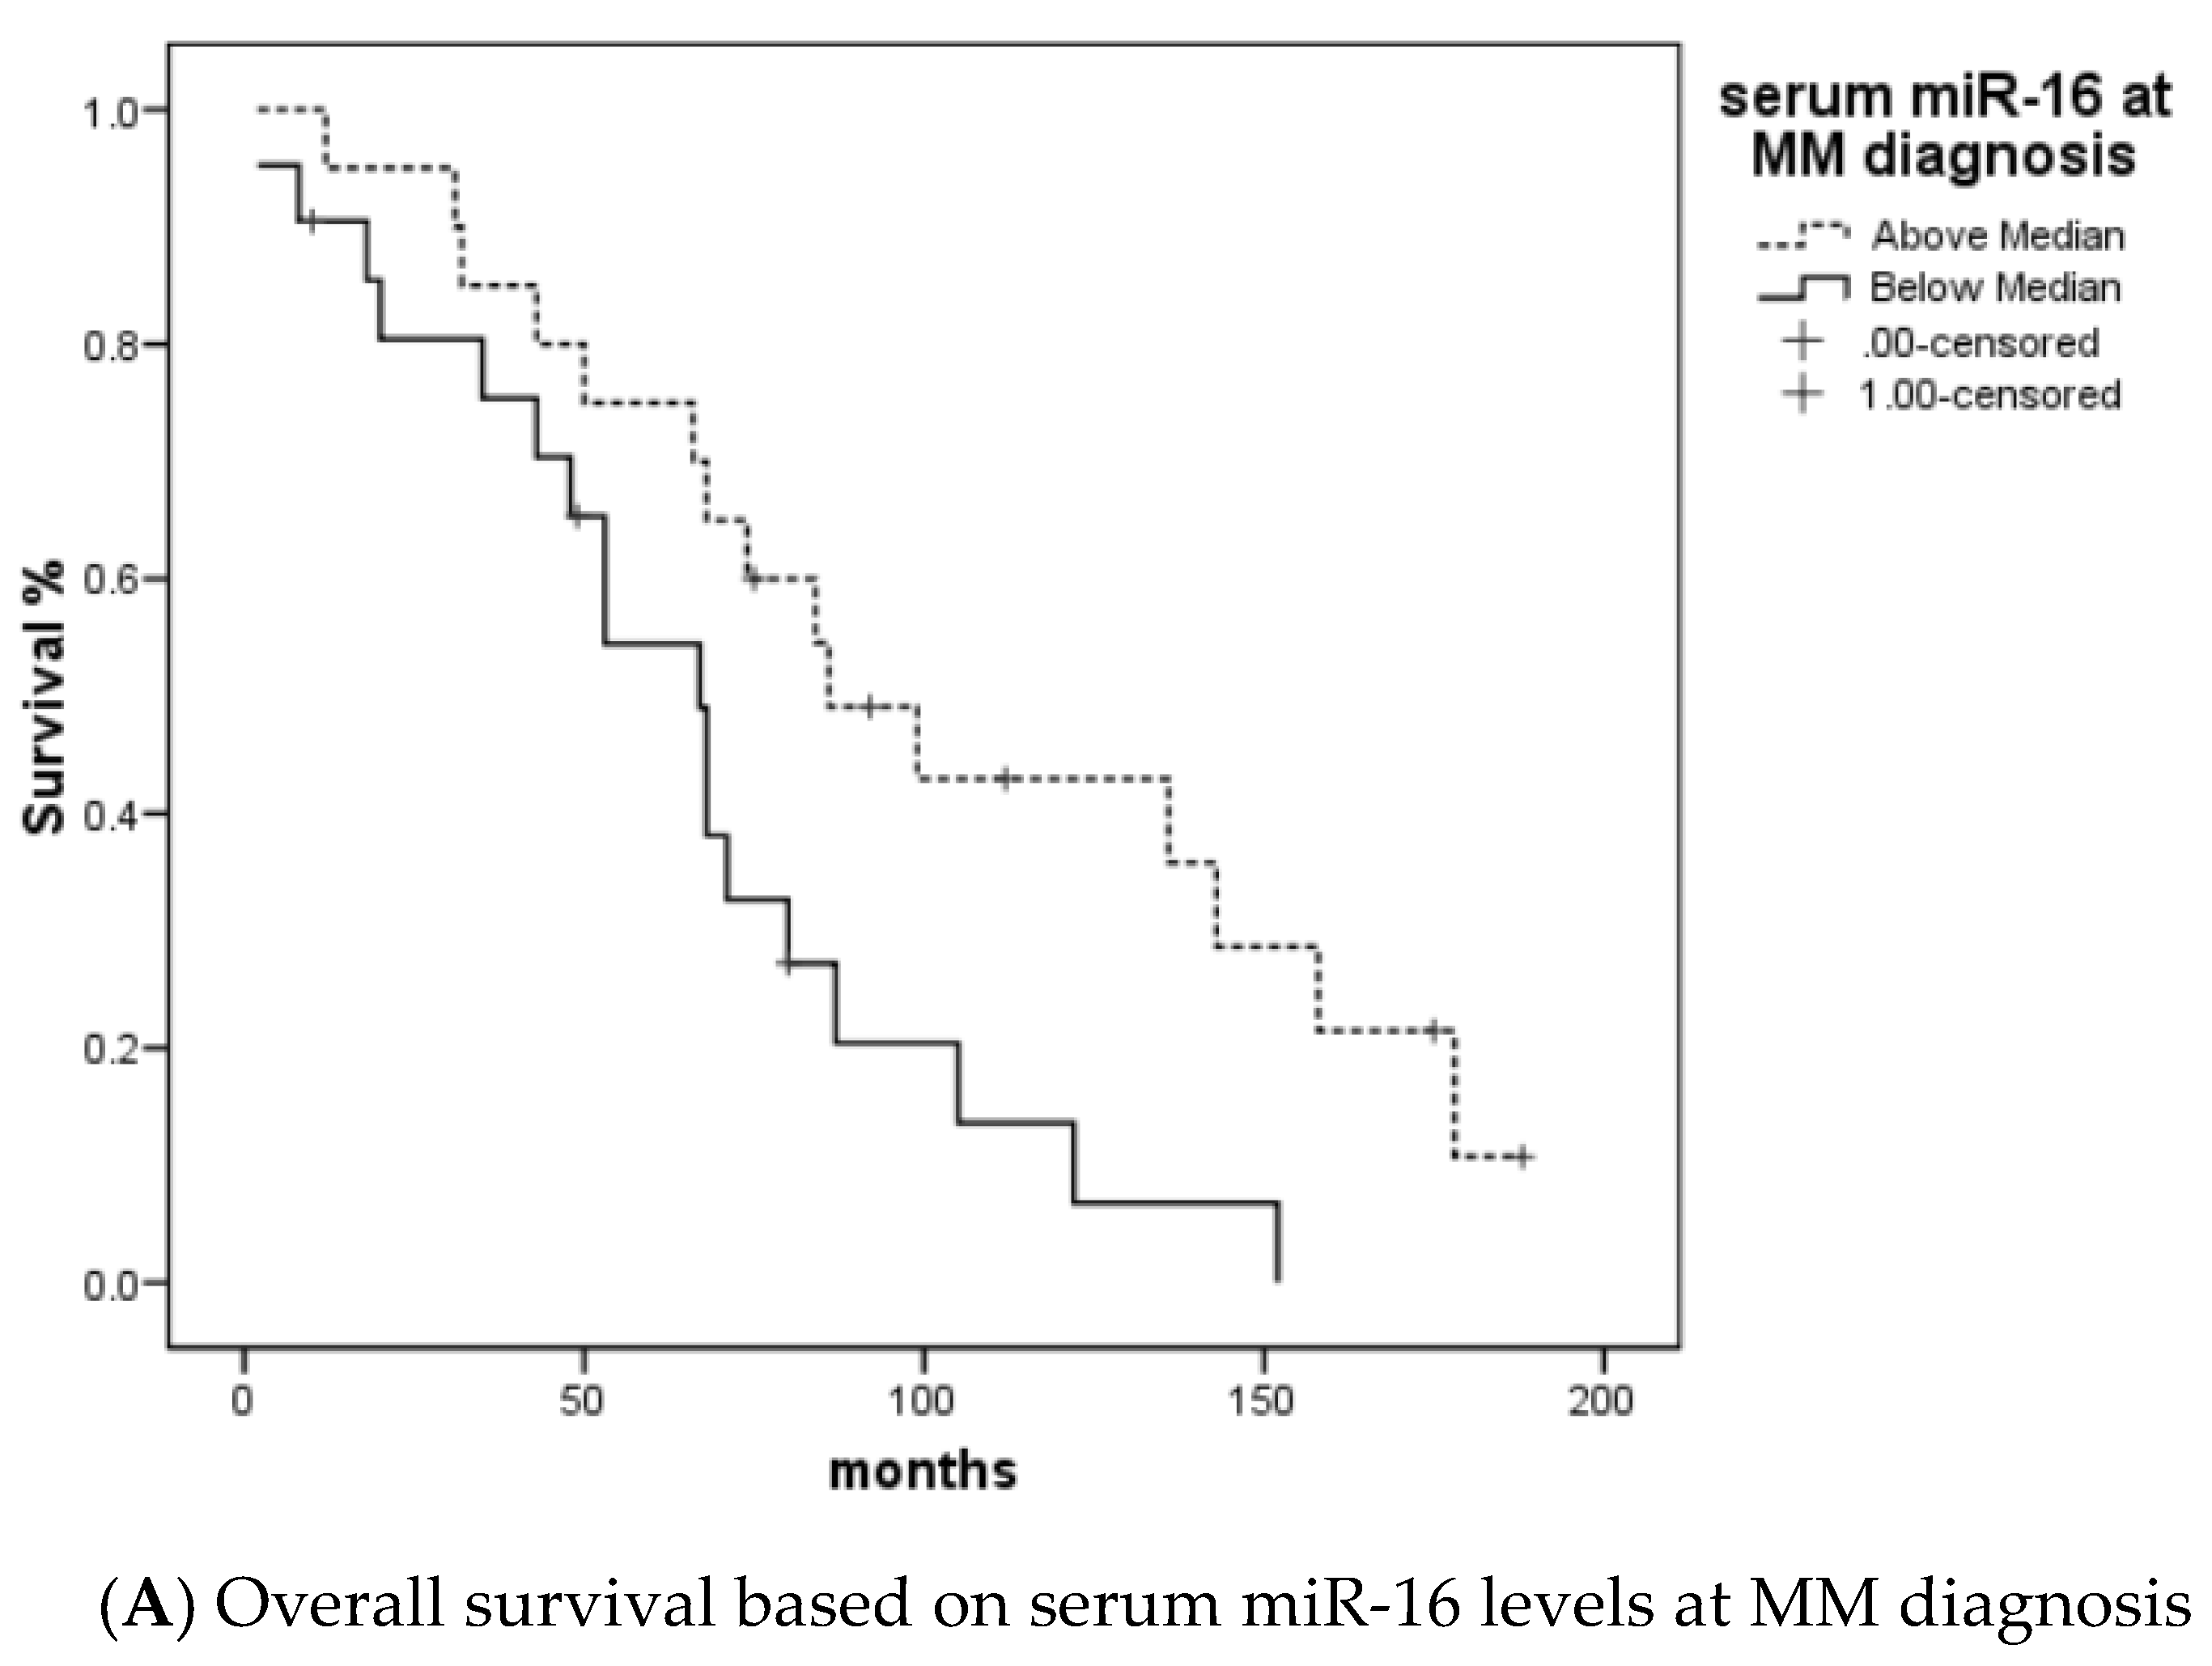
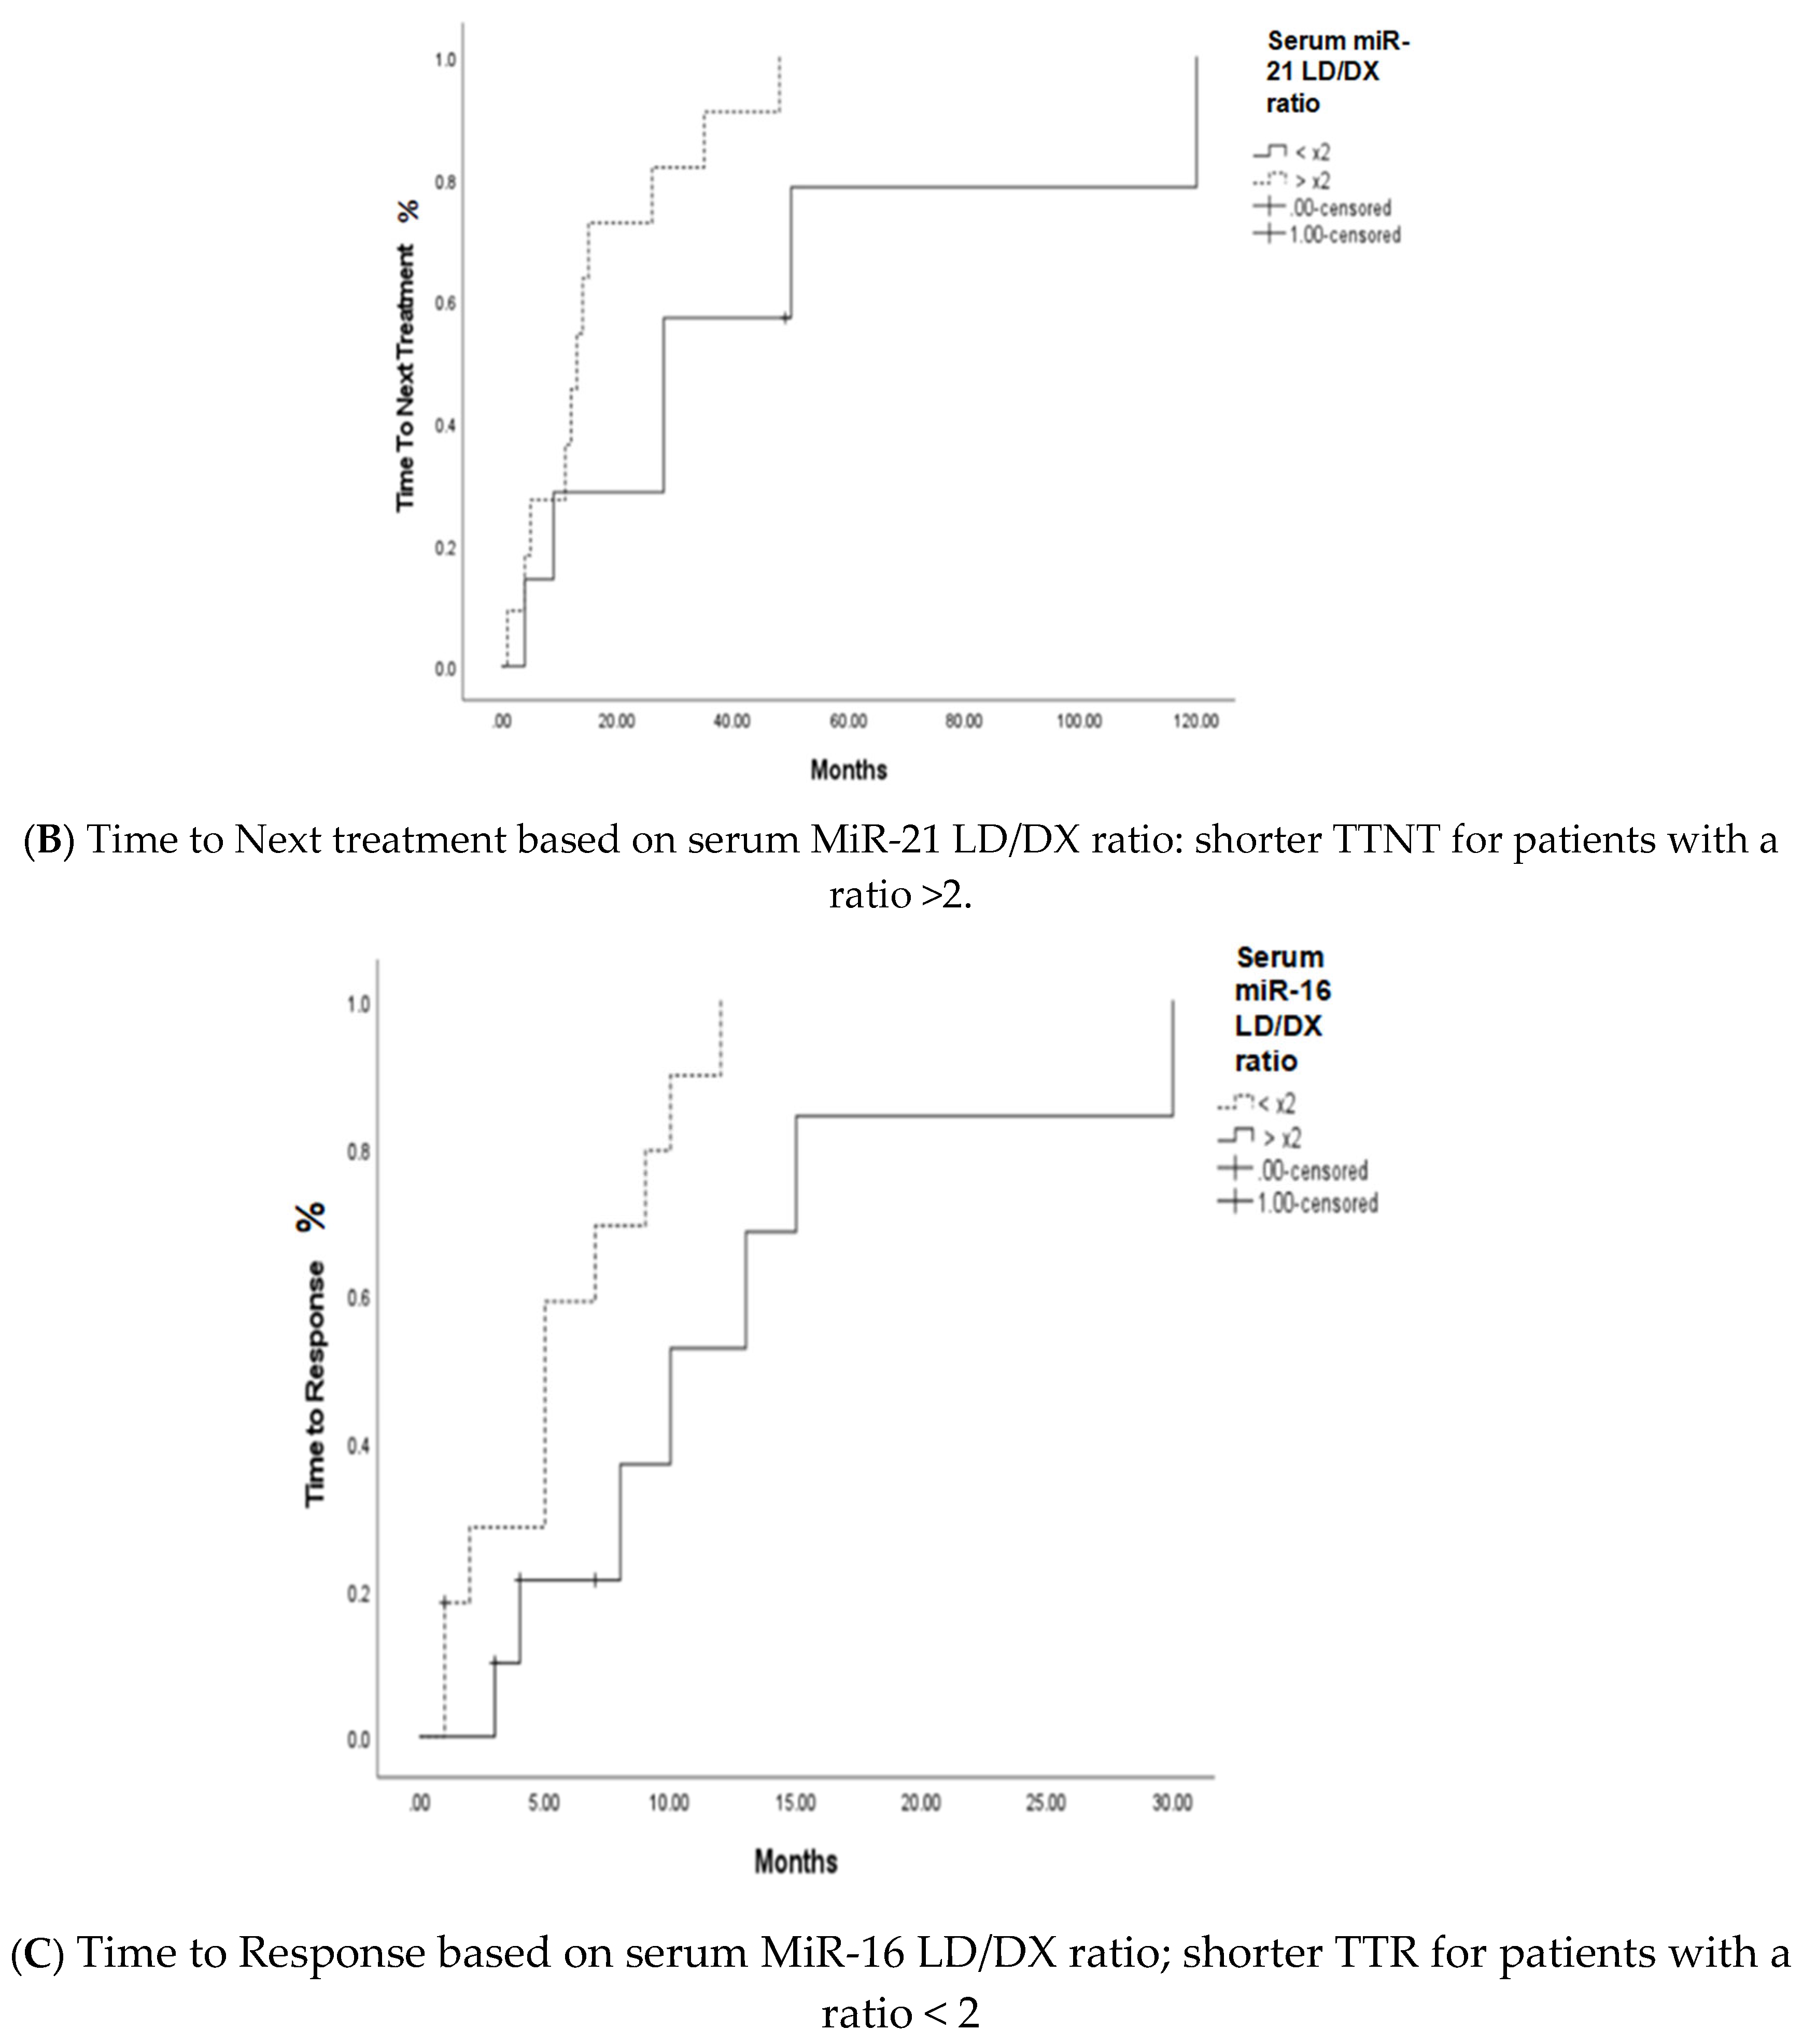
Further analysis was performed to determine the impact of miR-16 and miR-21 expression levels at diagnosis on the prognosis of MM patients. miR-16 expression levels above median were associated with statistically improved overall survival (p=0.024). However, miR-21 expression was not associated with overall survival (p=0.346). At the initiation of LD treatment, a ratio of miR-16 LD/DX below 2 was associated with a shorter time to response (TTR) (p=0.027), and miR-21 LD/DX below 2 with a longer time to next treatment (TTNT) (p=0.042) (Figure 2).

4. Discussion

Recent research has focused on miRNAs function and their involvement in epigenetic regulation of tumors. Studies have shown that miR-16 and miR-21 regulate cell cycle and are linked to the pathogenesis of MM.
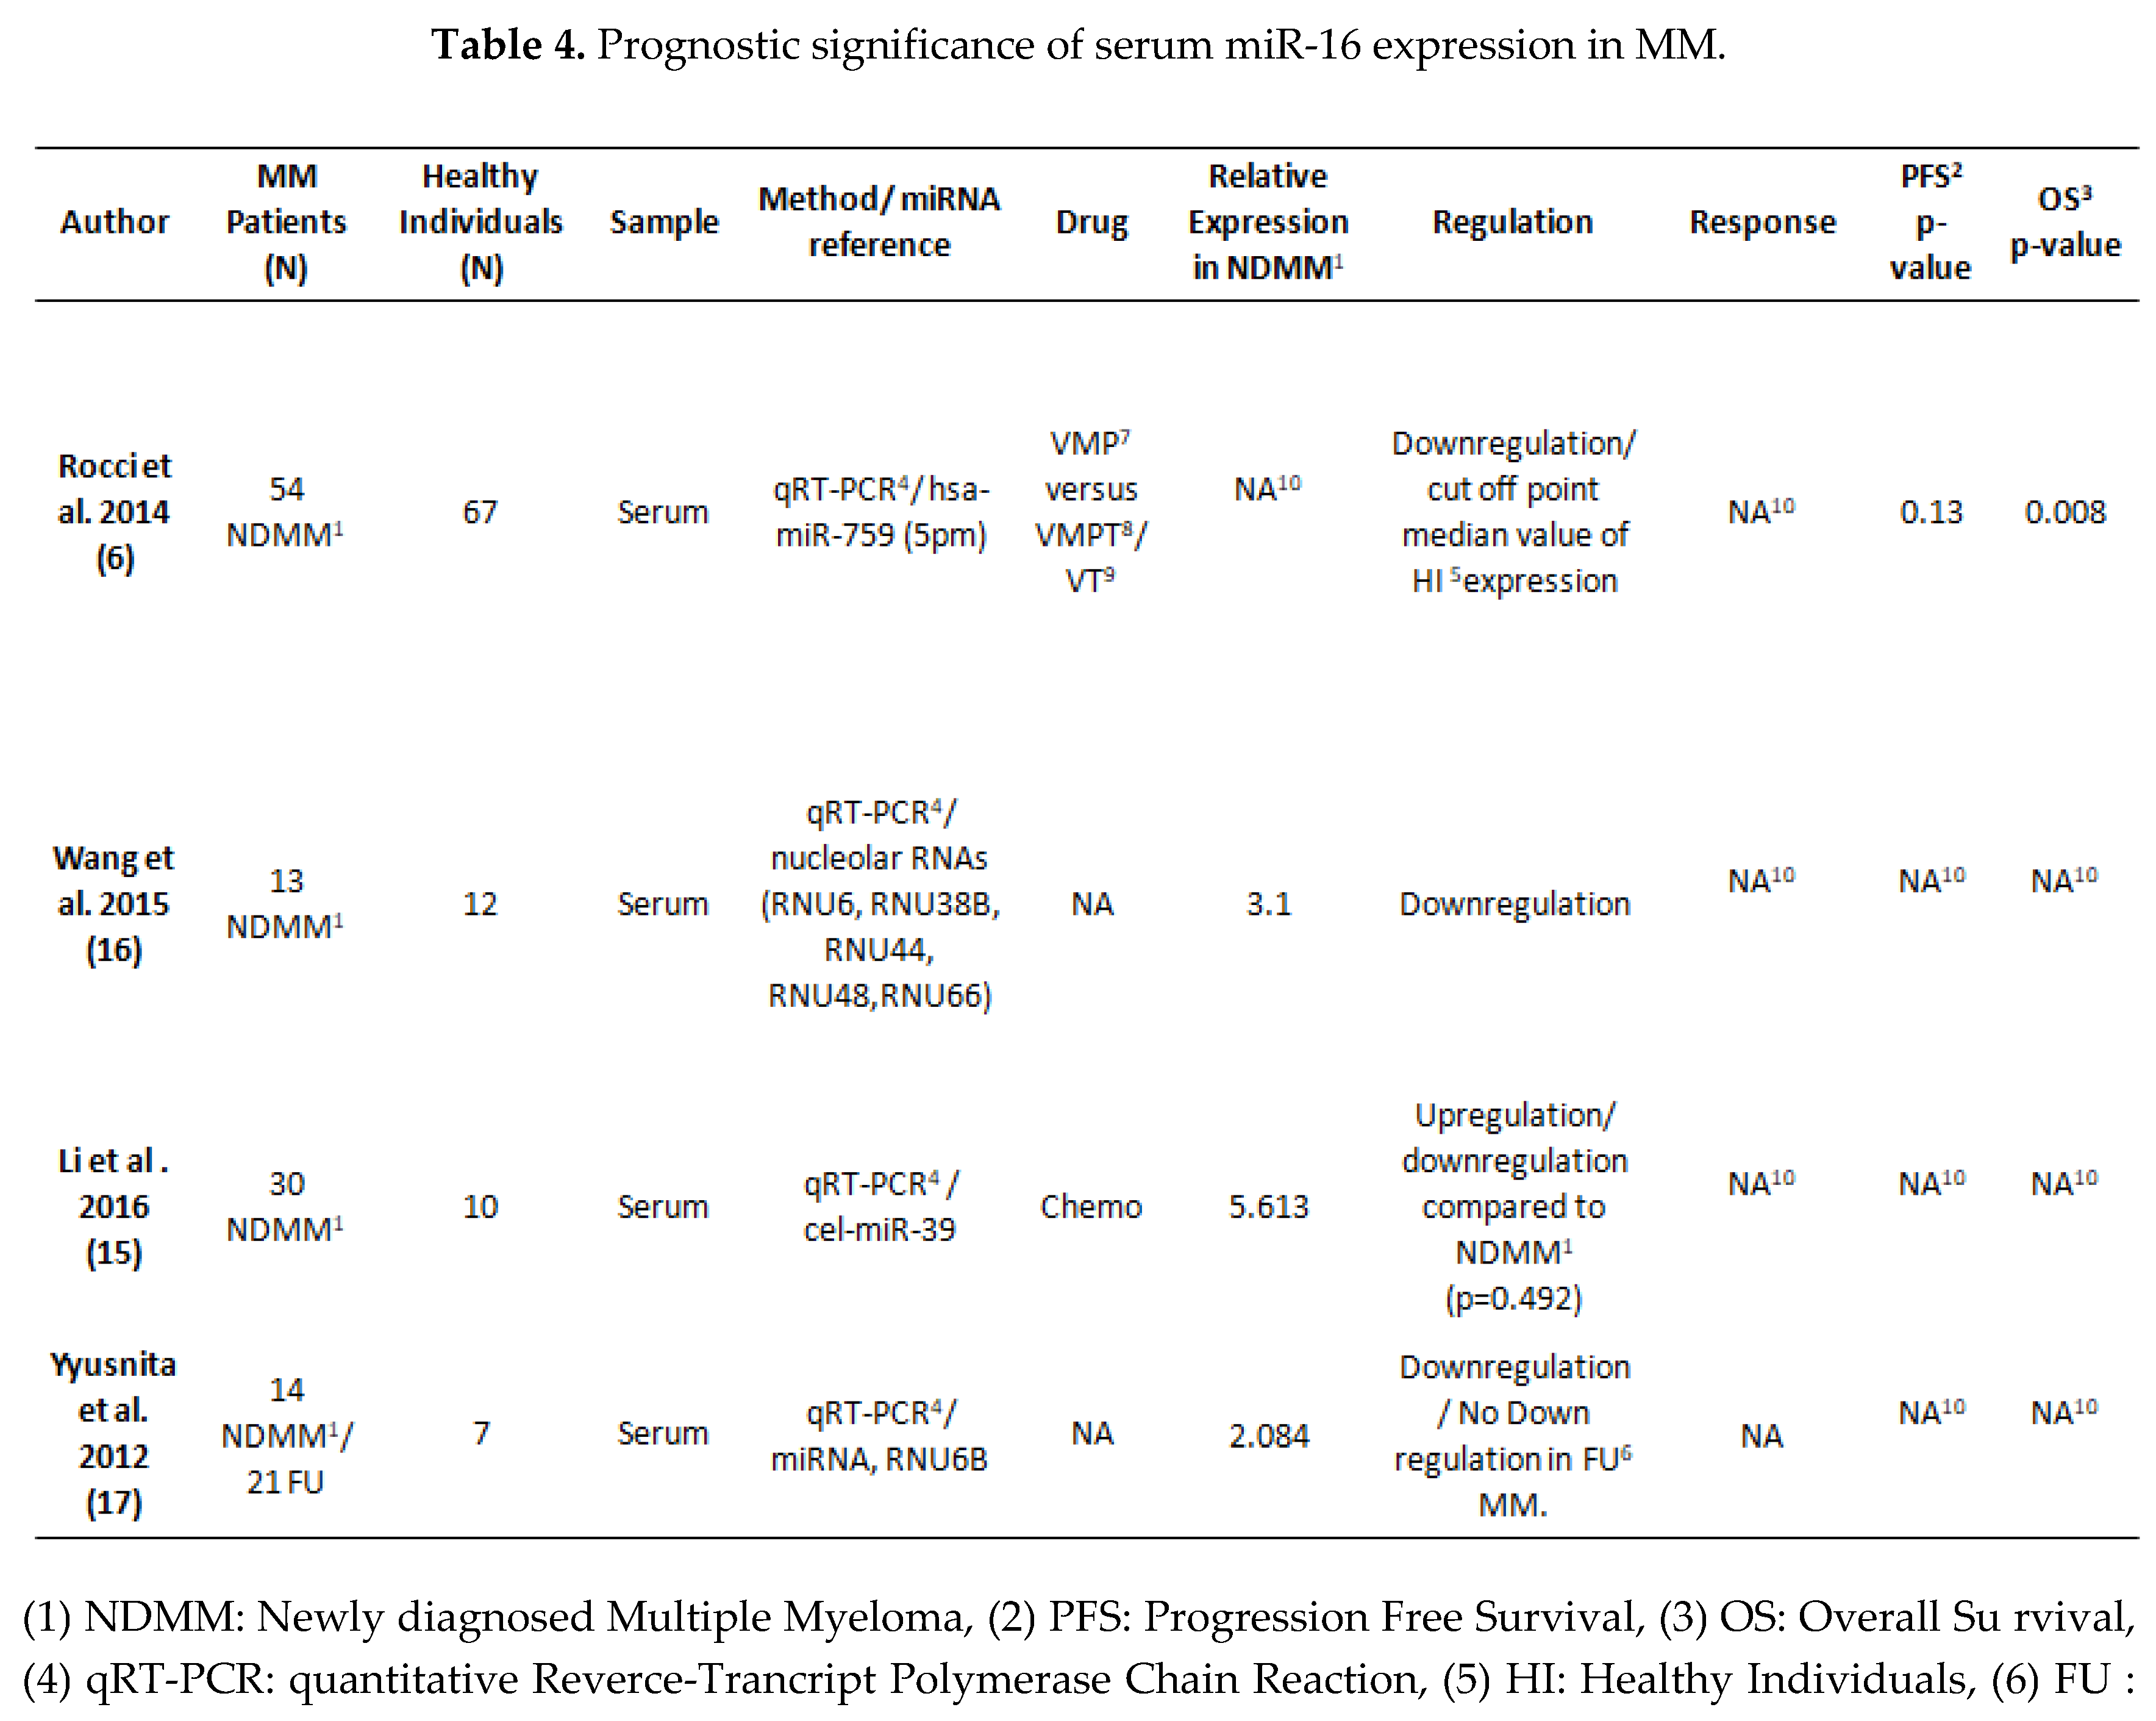
Downregulation of miR-16 enhances cell proliferation through AKT3 kinase, MAP kinases, ribosomal protein S6, and the NF-kB activator MAP3KIP3 inhibition, and influences angiogenesis and apoptosis by increasing the expression of VEGF, BCL2, CCND1, WNT3A, and MCL1 genes [10]. In MM, miRNAs-15a and -16 may disable disease progression by inhibiting various kinase pathways [2]. Moreover, miR-16 regulates the cell cycle and is involved in drug resistance in MM through induction of IL-6 and cell cycle progression [13]. Recent research showed that serum miR-16 expression levels differed amongst malignancies. MiR-16 had lower differential expression levels in esophageal and stomach cancers compared to normal controls, indicating that miR-16 may operate as a tumor suppressor [14]. In MM, few studies in the bone marrow, have demonstrated that miR-16 expression was downregulated compared with normal control cells and their expression levels had prognostic impact [15]. We studied serum levels of miR-16 which were significantly down regulated in newly diagnosed MM patients compared to normal controls. (Table 4) Similar to our findings, circulating miR-16 was found to be downregulated both as free serum miR-16 [16,17], as well as in exosomal serum form [4] when compared to healthy individuals miR-16 expression.
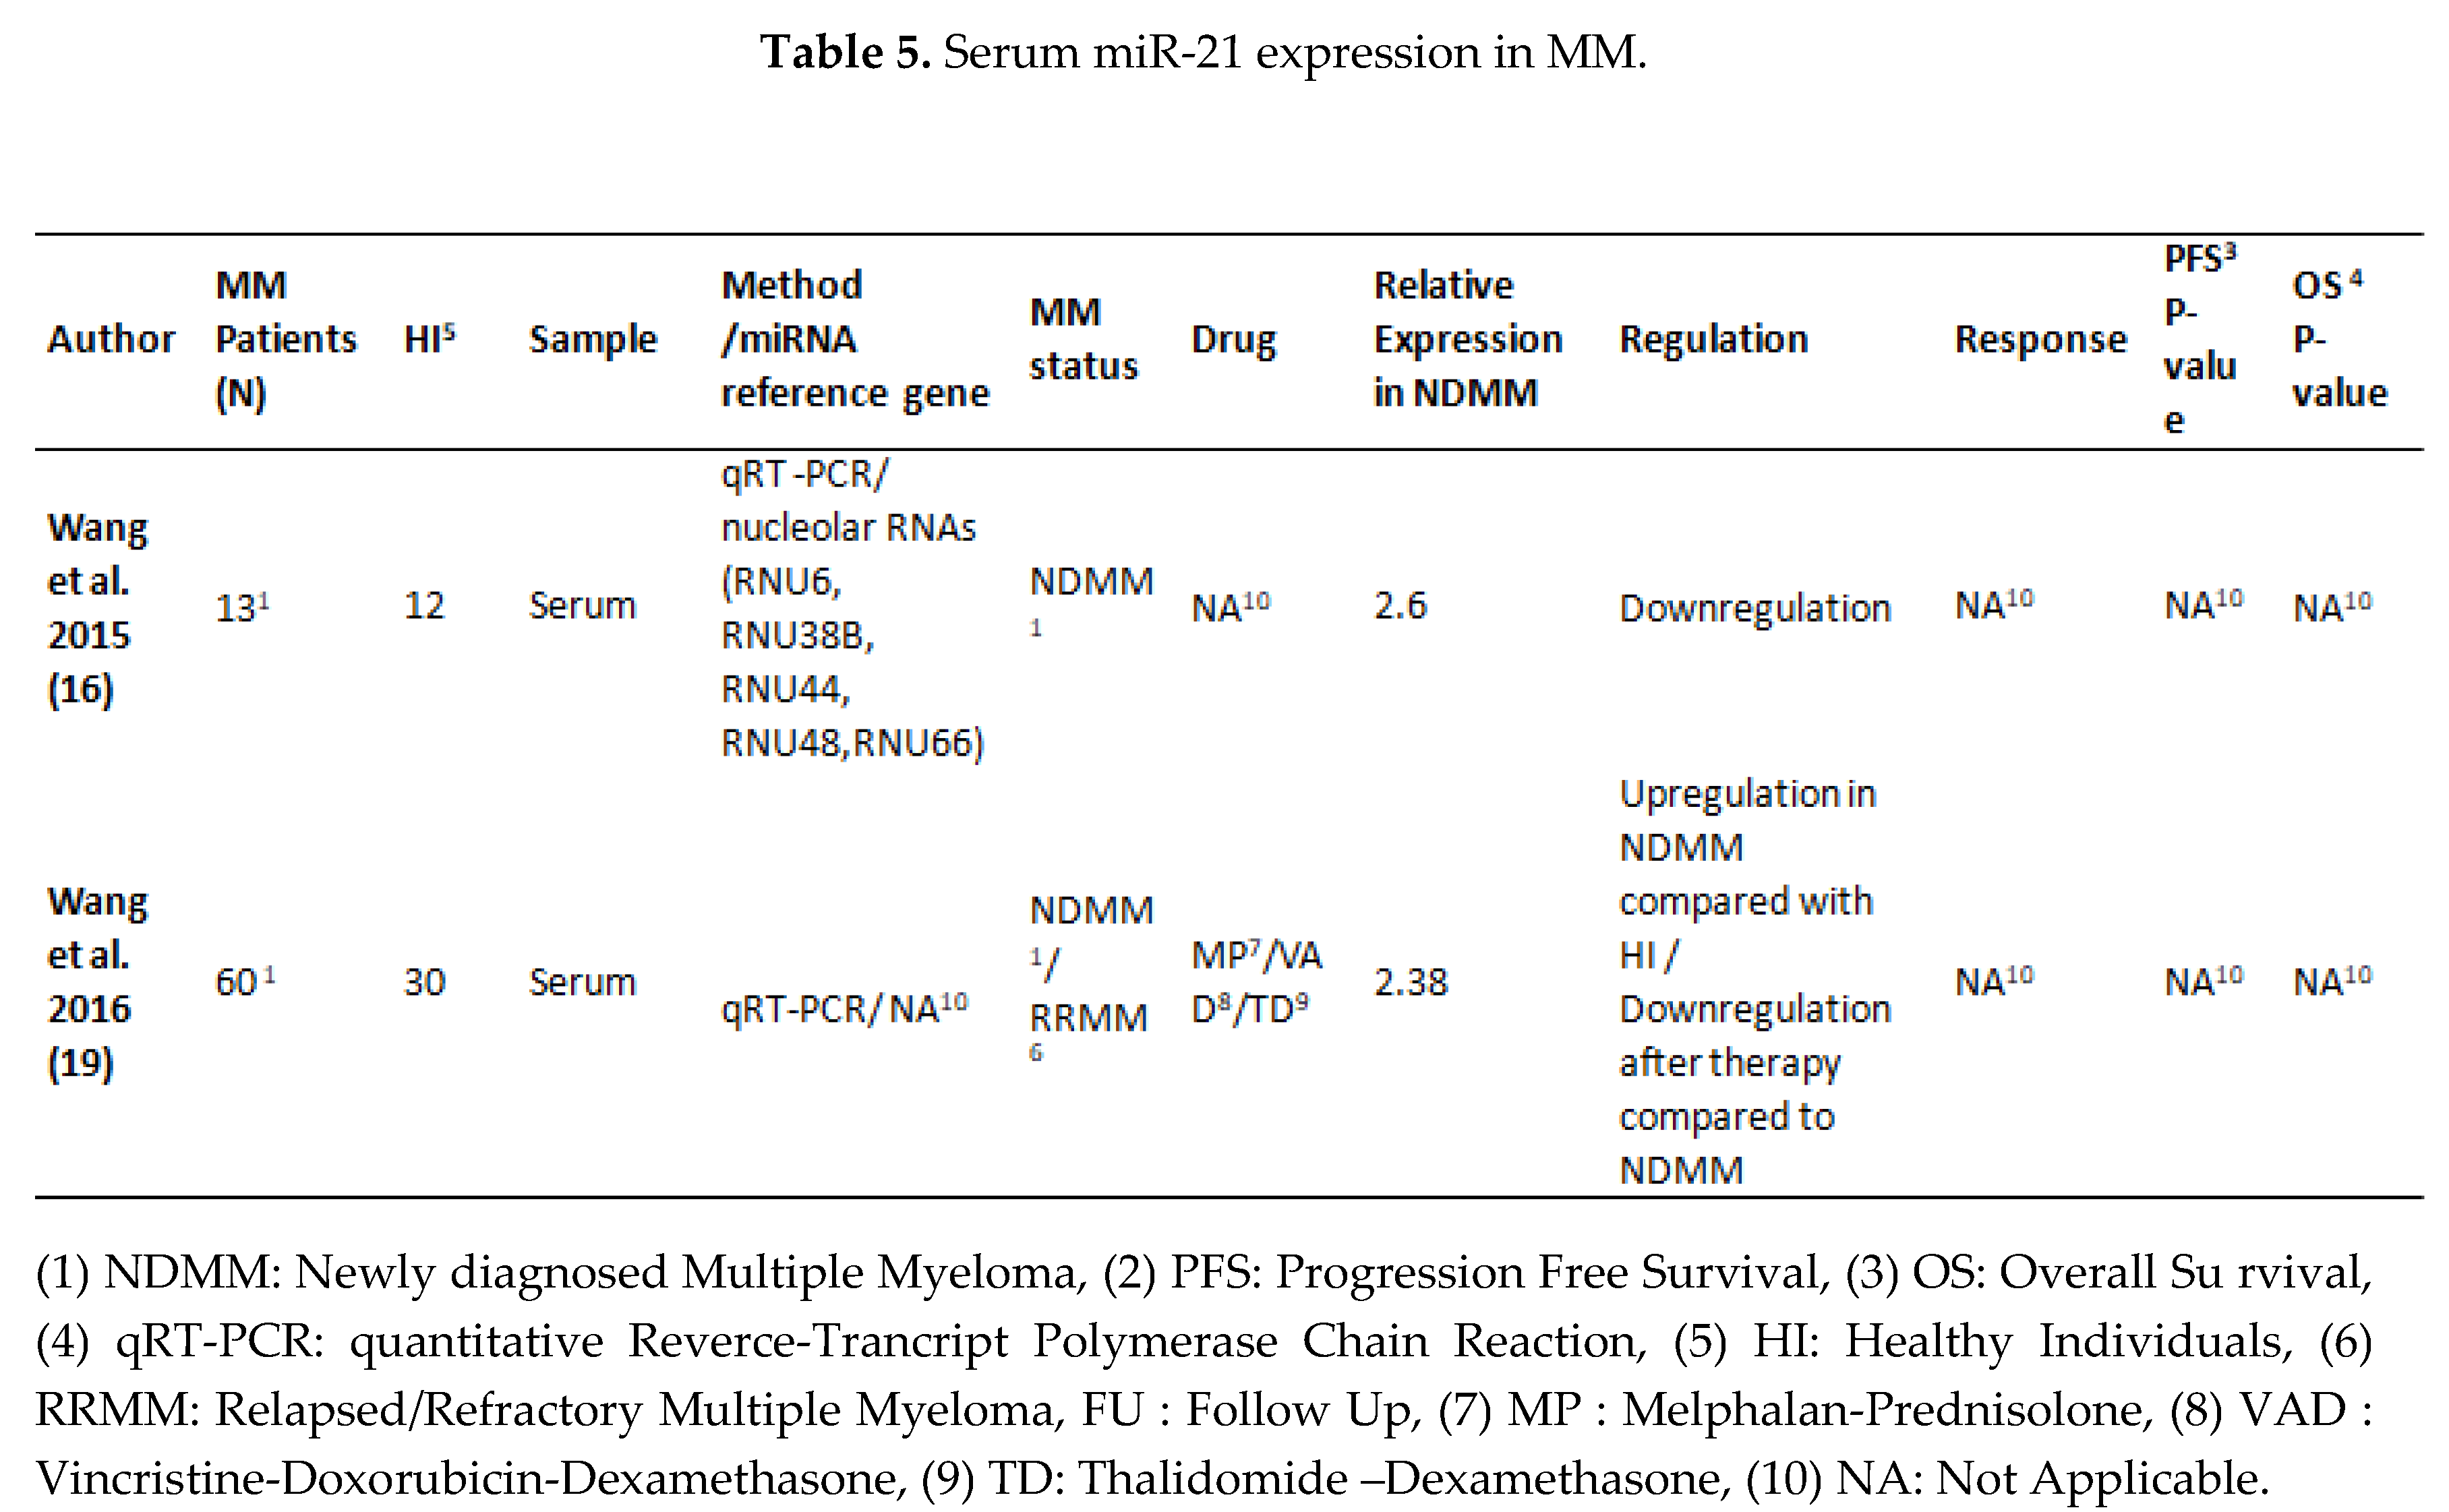
MiR-21 is involved in several signal transduction pathways, important to MM pathophysiology, such as the JAK/STAT-3 and NF-KB. Although, circulating miR-21 has been shown to operate as a proto-oncogene in many cancers [9,18], the studies of serum miR-21 in MM are extremely limited with conflicting results [16,19]. In one study, serum expression of mir-21 studied in 30 MM patients was significantly higher than in the MGUS group (14 patients) and the control group [16]. On the contrary, miR-21 in serum of MM, SMM and MGUS patients was shown to be downregulated only in MM patients, indicating that considerable down-regulation of this miRNA may be associated with subsequent events in disease progression. Furthermore, serum exosomes of miR-21 have been found downregulated in MM patients[20]. In our study, serum expression miR-21 was significantly downregulated in newly diagnosed MM patients compared to normal controls. (Table 5).
The expression levels of serum miRNA-16 and 21 measured right before LD treatment in the same patients, remained significantly suppressed compared to healthy individuals, but a significant up-regulation compared to the levels at diagnosis was observed. (Figure 1). Clinical characteristics, important in MM for the diagnosis and prognosis, were significantly correlated to serum miR-16 in our patients. This was the case for renal impairment, hypercalcemia, B2M and CRP serum levels. Serum Levels of B2M, renal impairment, CRP, and neu/lymph ratio were all associated with miR-21 at the time of diagnosis. MiR-21 serum levels at relapse were associated with ISS stage. From previous studies, plasma levels of miRNA 16 were associated with B2M [21], ISS disease stage and PFS in myeloma [15]. In addition, serum miR-21 was significantly different according to Durie and Salmon stages, correlates with B2M, IgG and albumin levels [16]
Increased interest has been observed regarding the value of miRNAs in drug resistance in MM. In this context, serum levels of distinct miRNAs were shown by Robak et al. [22] to be expressed differently in MM patients based on Bortezomib sensitivity. Additional investigation has shown that miR-16 levels increased after melphalan and bortezomib treatment and decreased following the impact of IL-6 fluctuations, indicating their potential value as a response biomarker to therapies as well [23]. Likewise, increased expression of miR-21 in bone marrow stromal MM cells, promoted resistance to dexamethasone, doxorubicin, or bortezomib through upregulation of nuclear factor-κB (NF-κB) [24]. In contrast, the role of miRNAs in the modulation of the activity of IMiDs has been poorly investigated. Recently, argonaute 2 (AGO2), which plays a pivotal role in miRNAs’ maturation and function, was identified as a cereblon binding partner and it was found that the steady-state levels of AGO2 are regulated by cereblon [25]. This led to the concept that miRNAs had a synergistic impact with anti-MM factors and might be used to enhance anti-MM therapy or used as prognostic implicators. In an attempt to determine the potential association of miRNA expression to Lenalidomide, researchers showed that serum miRNA expression levels, miR-26a-5p, miR-29c-3p, miR-30b-5p, miR-30c-5p, and miR-331-3p were significantly down-regulated in poor responders to treatment [26].
In addition, we observed that higher levels of miR-16 (x2- twice the expression of median miR-16) correlated with response to treatment greater than PR and higher miR-21 levels with a response better than VgPR. Additionally, an increased ratio between serum at diagnosis and before LD treatment (DX/LD) of both miR-16 and miR-21 showed significant association with late relapse to LD treatment (>24 months). Indeed, this is a very interesting finding taking into consideration that poor survival outcome has been linked to early relapse, irrespectively of the depth of response to LD achieved [27].
Finally, our findings showed that miR-16 and miR-21 levels have prognostic value for MM patients survival. Higher serum levels of miR-16 were associated with improved OS. Furthermore, a difference in serum levels between diagnosis and relapse MM was indicated by a lower than two miR-16 Dx/Rel ratio linked with shorter TTP and a miR-21 Dx/Rel ratio related with shorter TTNT, when evaluated prior to LD treatment. Lower expression of other miRNAs (miR-30b5p, miR-30c-5p, miR-193a-5p, miR-331-3p) has been related to poorer overall survival or significantly shorter TTP after lenalidomide treatment [26].
One report by Rocci et al 2014 [6] found that lower miR-16 levels are significantly related to shorter OS. Interestingly, when they compared, intracellular miRNAs (from MM cells) and serum miRNAs from the same patients, no correlation was observed, thus suggesting a different origin for circulating miRNAs, such as normal immune/inflammatory or stromal cells. This may be the case also for miR-21 difference between low serum levels and intracellular increased expression levels of miR-21 in MM but this remains to be elucidated with further research.

5. Conclusions

To summarize, we investigated the prognostic significance of circulating miR-16 and miR-21 levels in 48 patients at diagnosis with MM and in 35 at relapse time treated with LD. Twenty-one patients were tested twice at diagnosis and before LD initiation. Significantly lower levels of miR-16 and miR-21 were observed in patients compared to HI, both at diagnosis and relapse, with decreased miR-16 levels at diagnosis indicating improved overall survival (OS) (p = 0.024). The study also found that miR-16 and miR-21 levels were associated with markers of disease activity and response to LD treatment. The calculated expression ratio (prior LD treatment/diagnosis) below 2 for both miR-16 and miR-21 predicted a shorter time to response (P = 0.027) and a longer time to next treatment (P = 0.042), respectively. We report serum miR-16 and miR-21 levels in MM, which correlated with known disease prognostic factors and treatment outcomes. These findings are indeed preliminary, and further research is needed.
Preprints 104042 g003Preprints 104042 g004

Author Contributions

M- C K and GVZ D; designed the study, supervised and corrected the manuscript, P.P. S; supervised the study, A-I Gkioka; performed the study and the measurements, wrote the paper and followed patients, M T; performed the experiments and wrote the paper, AK; wrote the paper, followed patients, C- AM2, AP, T –MT; performed experiments, AG, AA, MP, VB; followed patients.

Funding

This research was co- funded hematology section, of First Propedeutic Internal Medicine department and the Operational Programme «Human Resources Development, Education and Lifelong Learning» in the context of the Act “Enhancing Human Resources Research Potential by undertaking a Doctoral Research” Sub-action 2: IKY Scholarship Programme for PhD candidates in the Greek Universities.

Institutional Review Board Statement

The study was conducted in accordance with the Declaration of Helsinki, and approved by the Ethics Committee of Laikon General Hospital of Athens (protocol code 191 and date of approval 21 February 2019).

Informed Consent Statement

Informed consent was obtained from all the subjects involved in the study.

Data Availability Statement

Data is contained within the article.

Conflicts of Interest

The authors declare no conflicts of interest.

References

  1. Cowan, A.J., D. J. Green, M. Kwok, S. Lee, D.G. Coffey, L.A. Holmberg, S. Tuazon, A.K. Gopal, and E.N. Libby, Diagnosis and Management of Multiple Myeloma: A Review. Jama, 2022. 327(5): p. 464-477.
  2. Kyrtsonis, M.C., V. Bartzis, X. Papanikolaou, E. Koulieris, G. Georgiou, M. Dimou, T. Tzenou, and P. Panayiotidis, Genetic and molecular mechanisms in multiple myeloma: a route to better understand disease pathogenesis and heterogeneity. Appl Clin Genet, 2010. 3: p. 41-51.
  3. Cortez, M.A., C. Bueso-Ramos, J. Ferdin, G. Lopez-Berestein, A.K. Sood, and G.A. Calin, MicroRNAs in body fluids--the mix of hormones and biomarkers. Nat Rev Clin Oncol, 2011. 8(8): p. 467-77.
  4. Manier, S., C. J. Liu, H. Avet-Loiseau, J. Park, J. Shi, F. Campigotto, K.Z. Salem, D. Huynh, S.V. Glavey, B. Rivotto, et al., Prognostic role of circulating exosomal miRNAs in multiple myeloma. Blood, 2017. 129(17): p. 2429-2436.
  5. Yao, Q., Y. Chen, and X. Zhou, The roles of microRNAs in epigenetic regulation. Curr Opin Chem Biol, 2019. 51: p. 11-17.
  6. Rocci, A., C. C. Hofmeister, S. Geyer, A. Stiff, M. Gambella, L. Cascione, J. Guan, D.M. Benson, Y.A. Efebera, T. Talabere, et al., Circulating miRNA markers show promise as new prognosticators for multiple myeloma. Leukemia, 2014. 28(9): p. 1922-6.
  7. Casabonne, D., Y. Benavente, J. Seifert, L. Costas, M. Armesto, M. Arestin, C. Besson, F.S. Hosnijeh, E.J. Duell, E. Weiderpass, et al., Serum levels of hsa-miR-16-5p, hsa-miR-29a-3p, hsa-miR-150-5p, hsa-miR-155-5p and hsa-miR-223-3p and subsequent risk of chronic lymphocytic leukemia in the EPIC study. Int J Cancer, 2020. 147(5): p. 1315-1324.
  8. Masri, A.A., T. Price-Troska, M. Chesi, T.-H. Chung, S. Kim, J. Carpten, P.L. Bergsagel, and R. Fonseca, MicroRNA Expression Analysis in Multiple Myeloma. Blood, 2005. 106(11): p. 1554-1554.
  9. Ma, J., S. Liu, and Y. Wang, MicroRNA-21 and multiple myeloma: small molecule and big function. Med Oncol, 2014. 31(8): p. 94.
  10. Dubaj, M., K. Bigosiński, A. Dembowska, R. Mlak, A. Szudy-Szczyrek, T. Małecka-Massalska, and I. Homa-Mlak, Role of Non-Coding RNAs in Diagnosis, Prediction and Prognosis of Multiple Myeloma. Cancers (Basel), 2024. 16(5).
  11. Pfeffer, S.R., C. H. Yang, and L.M. Pfeffer, The Role of miR-21 in Cancer. Drug Dev Res, 2015. 76(6): p. 270-7.
  12. Dimopoulos, M.A., P. Moreau, E. Terpos, M.V. Mateos, S. Zweegman, G. Cook, M. Delforge, R. Hájek, F. Schjesvold, M. Cavo, et al., Multiple myeloma: EHA-ESMO Clinical Practice Guidelines for diagnosis, treatment and follow-up(†). Ann Oncol, 2021. 32(3): p. 309-322.
  13. Abdi, J., H. Jian, and H. Chang, Role of micro-RNAs in drug resistance of multiple myeloma. Oncotarget, 2016. 7(37): p. 60723-60735.
  14. Jiang, Y., Y. Luan, H. Chang, and G. Chen, The diagnostic and prognostic value of plasma microRNA-125b-5p in patients with multiple myeloma. Oncol Lett, 2018. 16(3): p. 4001-4007.
  15. Li, F., Y. Xu, S. Deng, Z. Li, D. Zou, S. Yi, W. Sui, M. Hao, and L. Qiu, MicroRNA-15a/16-1 cluster located at chromosome 13q14 is down-regulated but displays different expression pattern and prognostic significance in multiple myeloma. Oncotarget, 2015. 6(35): p. 38270-82.
  16. Wang, W., M. Corrigan-Cummins, E.A. Barber, L.M. Saleh, A. Zingone, A. Ghafoor, R. Costello, Y. Zhang, R.J. Kurlander, N. Korde, et al., Aberrant Levels of miRNAs in Bone Marrow Microenvironment and Peripheral Blood of Myeloma Patients and Disease Progression. J Mol Diagn, 2015. 17(6): p. 669-78.
  17. Xu, Y.N., C. R. Xiao, Y.D. Huang, and Q.Y. Lu, [Circulating Serum MicroRNA as Diagnostic Biomarkers for Multiple Myeloma]. Zhongguo Shi Yan Xue Ye Xue Za Zhi, 2017. 25(2): p. 471-475.
  18. Rhim, J., W. Baek, Y. Seo, and J.H. Kim, From Molecular Mechanisms to Therapeutics: Understanding MicroRNA-21 in Cancer. Cells, 2022. 11(18).
  19. Wang, X., C. Li, S. Ju, Y. Wang, H. Wang, and R. Zhong, Myeloma cell adhesion to bone marrow stromal cells confers drug resistance by microRNA-21 up-regulation. Leuk Lymphoma, 2011. 52(10): p. 1991-8.
  20. Zhou, L., X. L. Liu, Y.W. Li, L. Wu, G.Z. Wang, Z.F. Wang, L. Ma, J. Guan, and C.X. Han, [Clinical Study of miRNAs Derived from Serum Exosomes in Multiple Myeloma]. Zhongguo Shi Yan Xue Ye Xue Za Zhi, 2022. 30(5): p. 1490-1495.
  21. Moura, S.R., H. Abreu, C. Cunha, C. Ribeiro-Machado, C. Oliveira, M.A. Barbosa, H. Marques, and M.I. Almeida, Circulating microRNAs Correlate with Multiple Myeloma and Skeletal Osteolytic Lesions. Cancers, 2021. 13(21): p. 5258.
  22. Robak, P., I. Dróżdż, D. Jarych, D. Mikulski, E. Węgłowska, M. Siemieniuk-Ryś, M. Misiewicz, K. Stawiski, W. Fendler, J. Szemraj, et al., The Value of Serum MicroRNA Expression Signature in Predicting Refractoriness to Bortezomib-Based Therapy in Multiple Myeloma Patients. Cancers (Basel), 2020. 12(9).
  23. Hao, M., L. Zhang, G. An, W. Sui, Z. Yu, D. Zou, Y. Xu, H. Chang, and L. Qiu, Suppressing miRNA-15a/-16 expression by interleukin-6 enhances drug-resistance in myeloma cells. J Hematol Oncol, 2011. 4: p. 37.
  24. Wang, J.H., W. W. Zhou, B.X. Liu, D.L. Man, Z.D. Yang, F.R. Liu, and H. Shang, Expression and significance of miR-21 in multiple myeloma patients. Genet Mol Res, 2016. 15(1).
  25. Xu, Q., Y. X. Hou, P. Langlais, P. Erickson, J. Zhu, C.X. Shi, M. Luo, Y. Zhu, Y. Xu, L.J. Mandarino, et al., Expression of the cereblon binding protein argonaute 2 plays an important role for multiple myeloma cell growth and survival. BMC Cancer, 2016. 16: p. 297.
  26. Jung, S.H., S. E. Lee, M. Lee, S.H. Kim, S.H. Yim, T.W. Kim, C.K. Min, and Y.J. Chung, Circulating microRNA expressions can predict the outcome of lenalidomide plus low-dose dexamethasone treatment in patients with refractory/relapsed multiple myeloma. Haematologica, 2017. 102(11): p. e456-e459.
  27. Majithia, N., S. V. Rajkumar, M.Q. Lacy, F.K. Buadi, A. Dispenzieri, M.A. Gertz, S.R. Hayman, D. Dingli, P. Kapoor, L. Hwa, et al., Early relapse following initial therapy for multiple myeloma predicts poor outcomes in the era of novel agents. Leukemia, 2016. 30(11): p. 2208-2213.
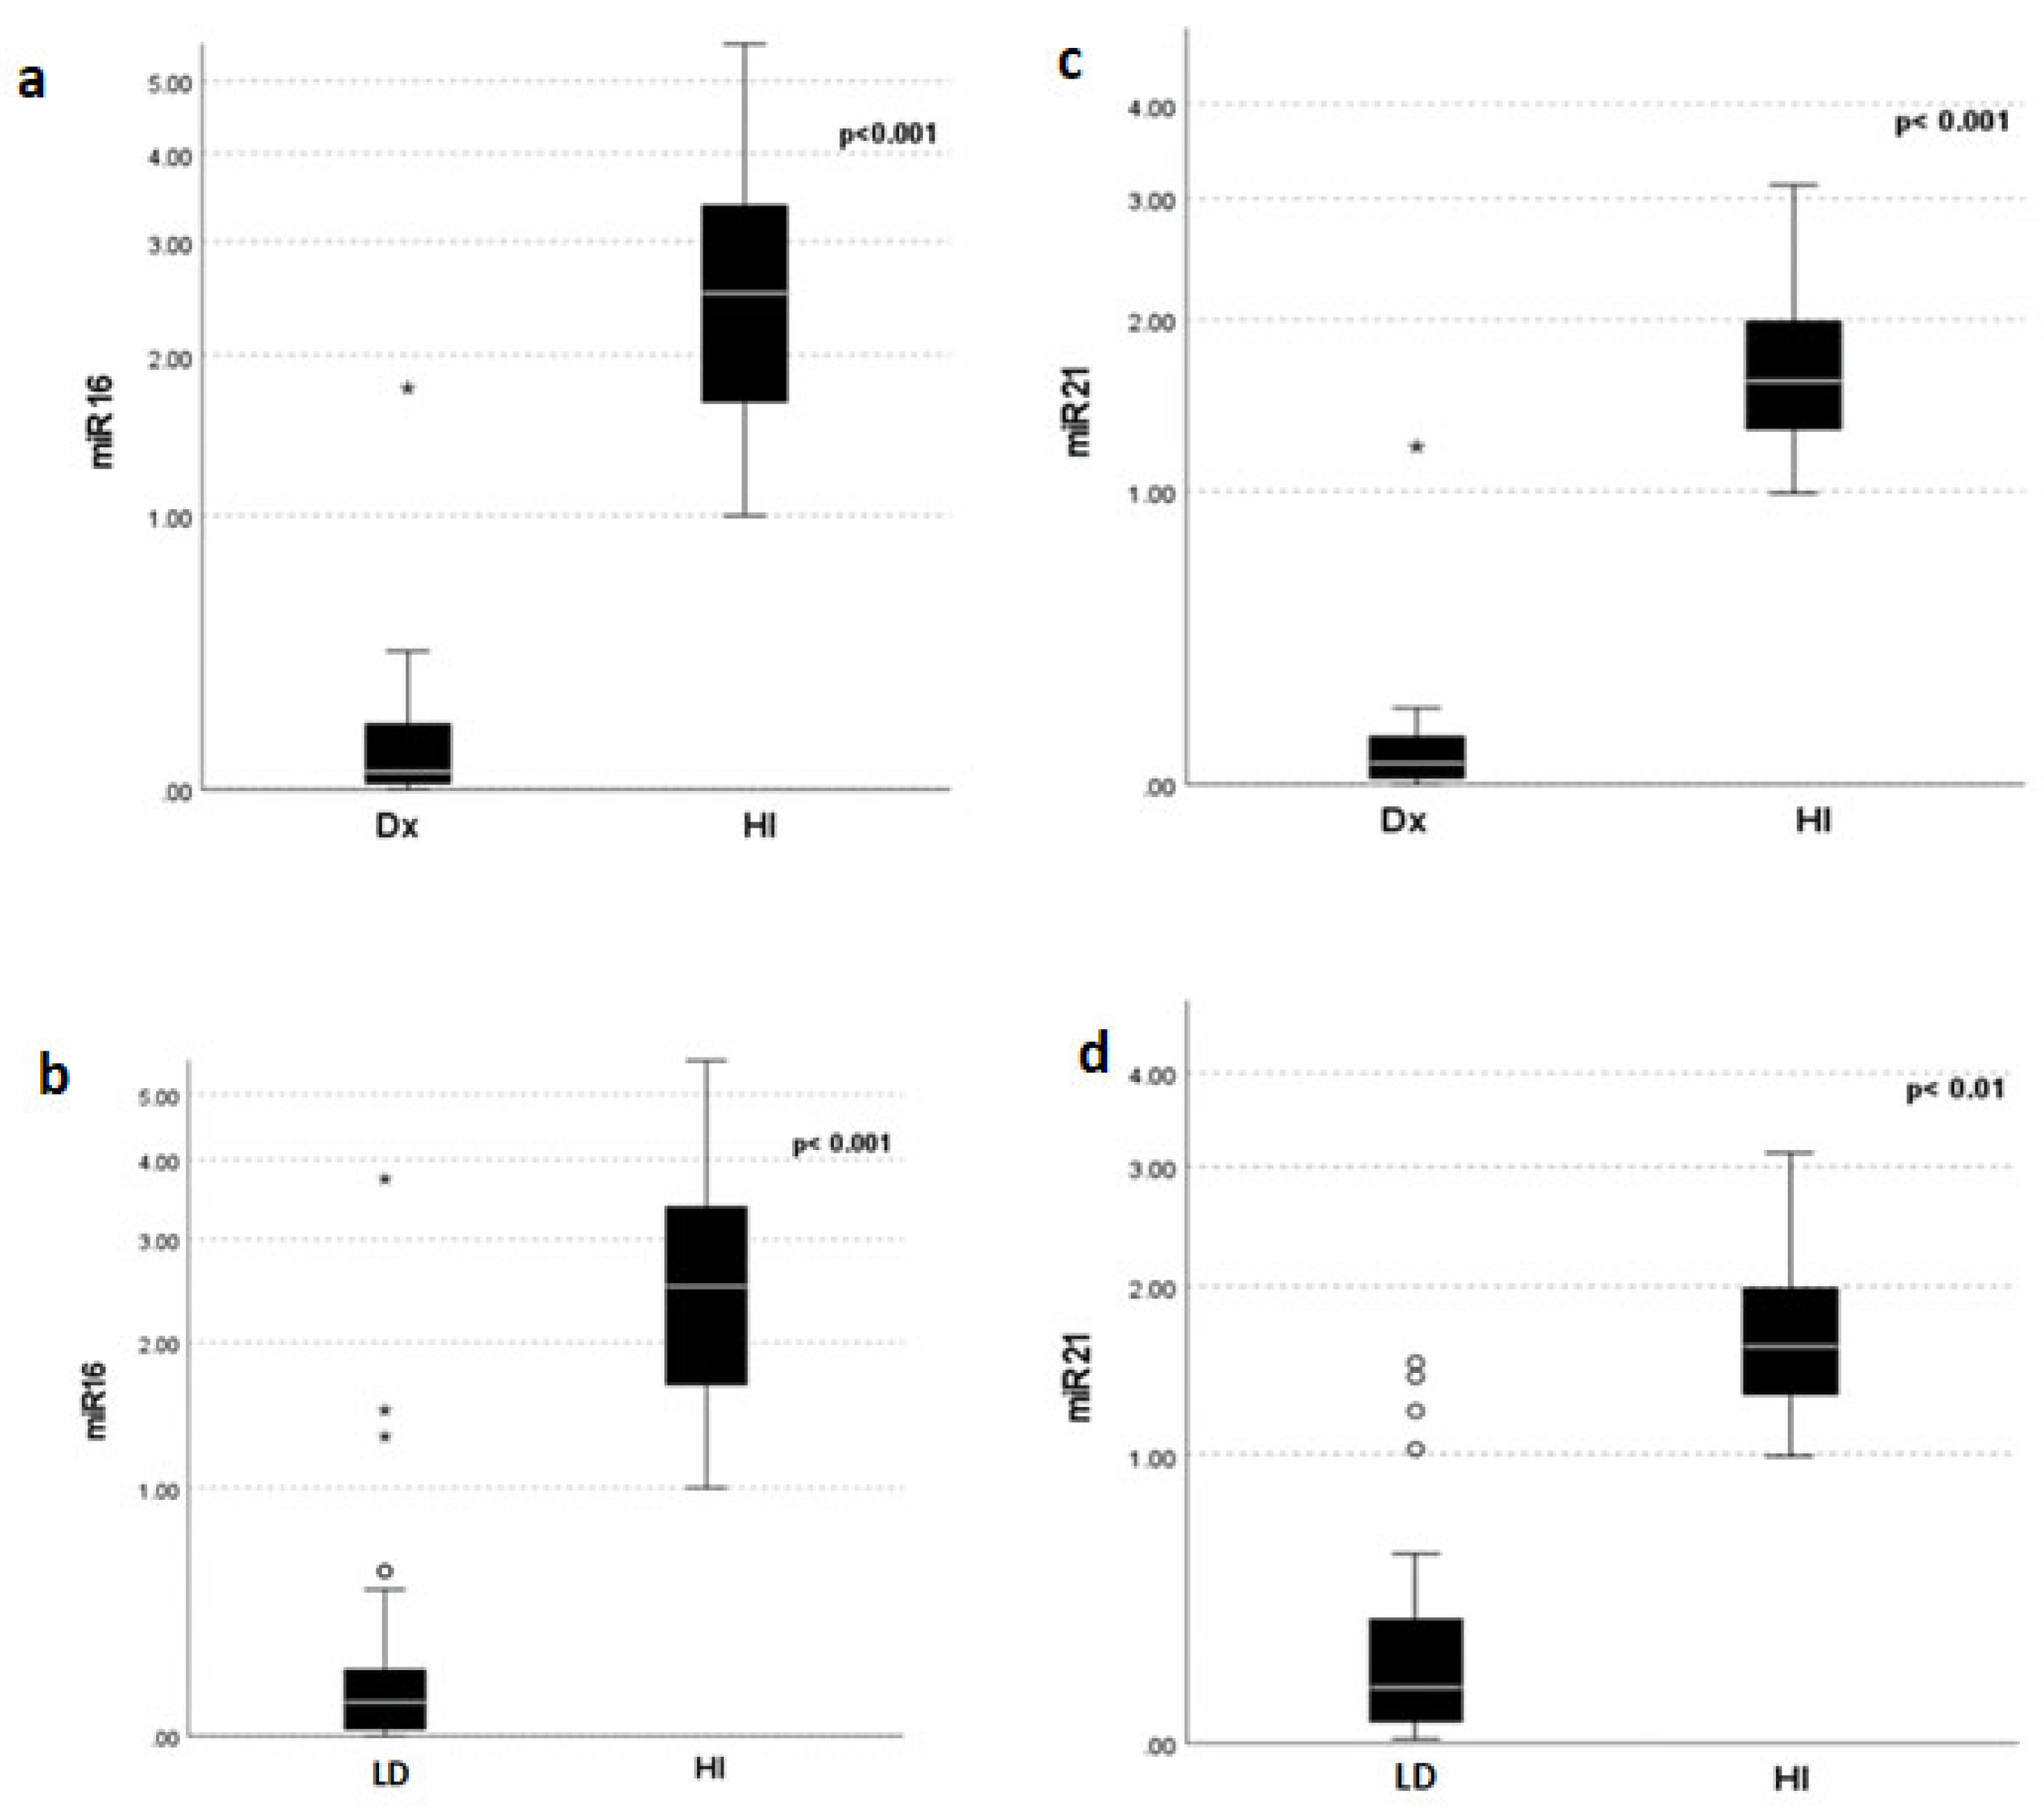
Figure 1. Distribution of miR-16 and miR-21 expression at diagnosis (Dx), prior to LD treatment, and in Healthy Individuals (HI). (A). miR -16 (a, b) and miR-21 (c,d) expression differences between HI and MM patients at Dx and LD. (B). Differences in miR-16 (a) and miR-21 (b) expression between Dx and LD.
Preprints 104042 g001aPreprints 104042 g001b
Figure 2. A. Overall survival based on miR-16 levels, B. Time to Next treatment based on the serum miR-21 LD/DX ratio, C. Time to Response based on serum miR-16 LD/DX ratio.
Preprints 104042 g002aPreprints 104042 g002b
Table 1. Patients’ characteristics at MM diagnosis.
Variable
(N=48)
Number (%) /
Median (Range)
Age 67 (40-85)
Sex
Male 28 (58%)
Female 20 (42%)
Ig Type
IgG 22 (46%)
IgA 16 (33%)
Light Chain 8 (17%)
Biclonal 2 (4%)
Light Chain Restriction
Kappa 31 (64 %)
Lamda 17 (36 %)
ISS1
I 15 (33%)
II 13 (28%)
III 18 (39%)
(1) ISS: International Staging System.
Table 2. Main lab characteristics of MM patients at diagnosis.
Variable (N=48) Median (Range)
Hb1g/dl 11.1 (6.7-15)
PLTs2 109/μL 212 (52-375)
Cr3mg/dl 1 (0.5-4.6)
Hypercalcemia 10 (22 %)
Alb4 4.08 (2.5-5)
Bone Disease (determined by Imaging) 36 (80 %)
IgG mg/L 3360 (1850-8730)
IgA mg/L 3255 (944-6450)
IgM mg/L 17.3 (16.8-99.8)
FLCk5 mg/L 1398 (1.98-1510)
FLCλ6mg/L 3.36 (0.08-2690)
FLCR7 42 (0.9-52750)
B2M8 mg/L 3.8 (2-16)
BMINF9 % 50 (10-95)
LDH UNL10 3 (7 %)
Neu11 109/μL 3455 (500-17880)
Lymph12 109/μL 1610 (780-4340)
Neu/Lymph13 2 (0.52-17.5)
CRP14 mg/L 3.45 (0.470-86.5)
(1) Hb: Hemoglobulin, (2) PLTs: Platelets, (3) Cr: Creatinine, (4) Alb:Albumin, (2) Neu: Neutrophils, (6) Lymph: Lymphocytes, (5) FLC: Free Light chain-Kappa, (6) FLC: Free Light chain-Lamda, (7) FLCR: Free Light Chain Ratio, (8) B2M : B2 microglobulin, (9) BMINF : Bone Marrow Infiltration, (10) LDH UNL: Lactate dehydrogenase-Upper Normal Limit, (11) Neu: Neutrophil count, (12) Lymph: Lymphocyte count, (13) Ratio of Neutrophil to Lymphocyte count (14) CRP: C reactive protein.
Table 3. Correlation of serum miR-16 and miR-21 with disease characteristics of newly diagnosed MM patients.
Variables miR-16 Dx * miR-21 Dx *
R P value r P value
B2M1 -0.370 0.021 NS NS
B2M < 3.5 NS NS -0.372 0.017
CRP2 -0.356 0.022 -0.285 0.068
NEU3/LYMPH4 -0.307 0.069 -0.332 0.045
Renal Failure -0.410 0.008 -0.301 0.05
GFR5 0.419 0.012 NS NS
Hypercalcemia -0.460 0.003 NS NS
(1) B2M: B2-microglobulin, (2) CRP: C-reactive protein, (3) Neu: Neutrophils, (4) Lymph: Lymphocytes, (5) GFR: Glomerular Filtration Rate, (*) Dx: at diagnosis.
Table 4. Correlation between miR-16 and miR-21 before LD initiation and disease characteristics.
Variables miR-16 LD v miR-21 LD v miR-16 LD v /DX* miR-21 LD v /DX*
R P-value r P-value R P-value r P-value
Biochemical Relapse NS NS -0.371 0.068 NS NS 0.547 0.015
ISS1 LD NS NS 0.468 0.018 NS NS NS NS
Relapse > 24 months NS NS NS NS 0.709 0.0001 0.461 0.035
Response ≥ VGPR2 NS NS 0.453 0.034 NS NS NS NS
Response ≥PR3 NS NS NS NS -0.413 0.05 NS NS
(1) ISS, International Staging System, (2) VGPR: Very Good Partial Response, (3) PR: Partial Response, (v) LD: Before LD initiation levels, (*) Dx: at diagnosis.
Disclaimer/Publisher’s Note: The statements, opinions and data contained in all publications are solely those of the individual author(s) and contributor(s) and not of MDPI and/or the editor(s). MDPI and/or the editor(s) disclaim responsibility for any injury to people or property resulting from any ideas, methods, instructions or products referred to in the content.
Copyright: This open access article is published under a Creative Commons CC BY 4.0 license, which permit the free download, distribution, and reuse, provided that the author and preprint are cited in any reuse.
Prerpints.org logo

Preprints.org is a free preprint server supported by MDPI in Basel, Switzerland.

Subscribe

© 2024 MDPI (Basel, Switzerland) unless otherwise stated