1. Introduction
Since the first known cases
identified in Wuhan, China, in December 2019, Coronavirus disease 2019 (COVID-19) has rapidly spread throughout the world [
1]. Indeed, COVID-19 is a contagious disease caused by the virus SARS-CoV-2, which quickly led to a pandemic.
The symptoms of COVID-19 may include fever [
2], cough, headache [
3], fatigue, breathing difficulties, loss of smell [
4], and loss of taste [
5]. In 2020, the Centers for Disease Control and Prevention (CDCP) noted that 14% of COVID-19 patients developed severe symptoms (dyspnea, hypoxia, or lung involvement) while 5 % developed critical symptoms (respiratory failure, shock or multiple organ dysfunction) [
6].
Some people continue to experience a range of effects for months or years after infection with the virus, and damages to organs have been observed; this is now called “long COVID” [
7]. It has also been observed that older people are at a higher risk of developing severe symptoms.
Transmission of SARS-CoV-2 through direct person-to-person contact has been recognized since the early stages of the COVID-19 pandemic [
8]. Although the risk is highest when people are in close proximity, it appears that the virus can be transmitted on longer distances through the inhalation of virus-laden aerosols [
9,
10]. It should be noted that aerosols are small respiratory particles that can linger in the air and disperse or travel up to 2 meters in certain circumstances [
11].
There is much more to say about the SARS-2 Coronavirus, including variants [
12,
13,
14], virology [
15,
16], pathophysiology [
17,
18], diagnosis, prevention [
19,
25], treatment [
26,
29], mortality, etc. While those topics are well documented elsewhere, they are also well beyond the scope of the present investigation.
This study revisited and retrospectively analyzed 18 months of data on cases and deaths in the early stages of the COVID-19 pandemic. We believe that such a phenomenological knowledge will help minimize the impact of potential future pandemics.
2. Material and Method
From March 2020 to August 2021 inclusive, data related to COVID-19, i.e. the toll of cases and deaths, were extracted daily from the
Worldometer platform [
30] to constitute a database in Excel format. At the beginning of this study, the toll of cases and deaths was quite coherent with data from the
World Health Organization [
31].
Worldometer COVID-19 data have been used by many countries and official institutions, including the UK government, the Johns Hopkins CSSE and the New York Times [
32].
Very briefly,
Worldometer is a reference site that provides real-time counters and statistics on various topics. It is run by an international team of developers, researchers, and volunteers with the aim of making world statistics available in a thought-provoking and-time relevant format to a wide audience around the world. They claim to be completely independent and self-funded through automated programmatic advertising sold in real time across multiple ad exchanges [
32].
While
Worldometer data made it possible to carry out a macroscopic analysis of the spread of COVID-19 taking into account the majority of countries in the world, we also extracted some statistics from several government communication sites and from
Statista [
33] in order to perform a more specific analysis based on the spread of COVID-19 in cities and municipal areas. Furthermore, demographic data (population, area, population density) were extracted from numerous websites, including
Wikipedia [
34] and
La Banque Mondiale [
35].
Demographic data were integrated into the COVID-19 database. Without loss of generality, we only analyzed data from the top 30 (out of 200 and above) countries ranked by total number of COVID-19 cases. Statistics (regression, correlation, mean ± std, etc.) were carried out with Excel software. Spectral analysis, using Matlab software, was also used to study the temporal spread of COVID-19.
3. Results
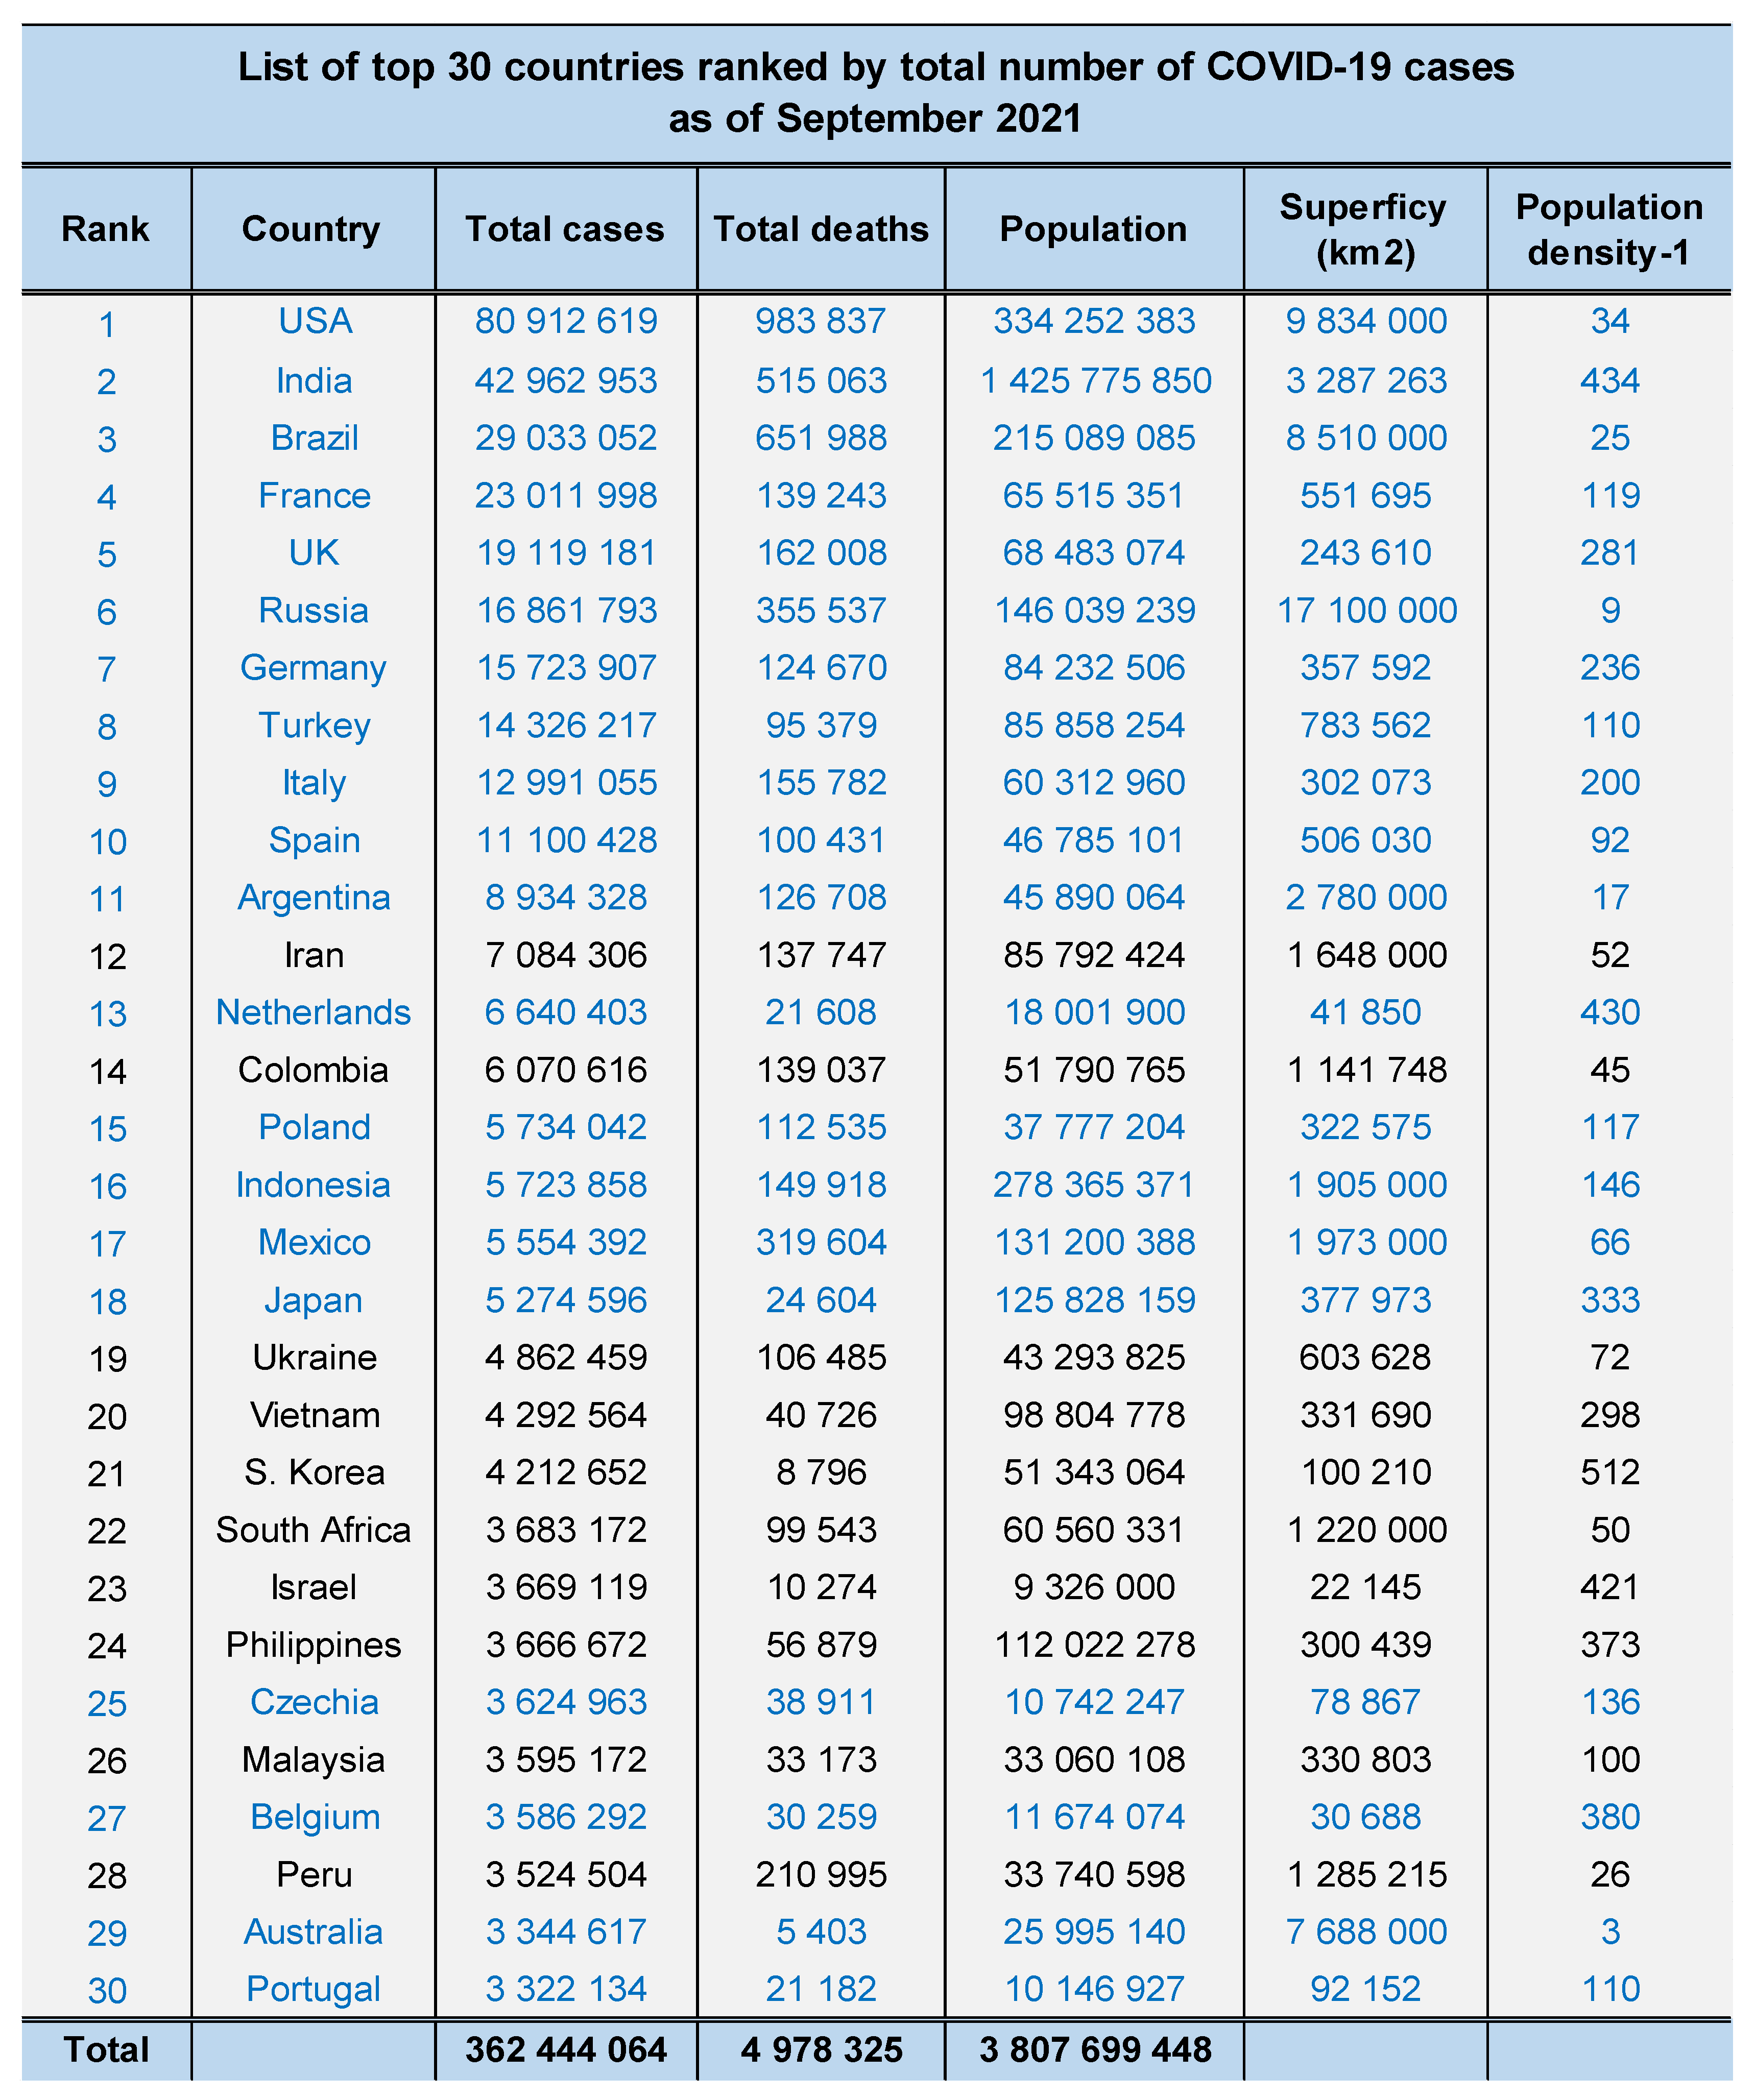
Table 1 shows the top 30 countries ranked by total number of COVID-19 cases as of September 2021. It is observed that the first 11 are exclusively G20 members, while 80% of the first 20 and 73% of the first 30 are G20 members. At that time, those countries accounted for 81% (362 444 064 / 445 277 485) of the total COVID-19 cases, 83% (4 978 325 / 6 016 074) of the total number of deaths from COVID-19, as well as 47% (3 783 837 303 / 8 000 000 000) of the world's population. It should be noted that the G20 includes the European Union, which itself includes 27 countries [
34].
It should be noted that a good linear correlation was observed between the number of cases and the respective number of deaths depending on the country, i.e. y = 0.0121x + 19 559 with R² = 0.8042. From that, the following analysis then focused mainly on the number of cases.
(a) Impact of population density on the spread of COVID-19 in cities and municipal areas
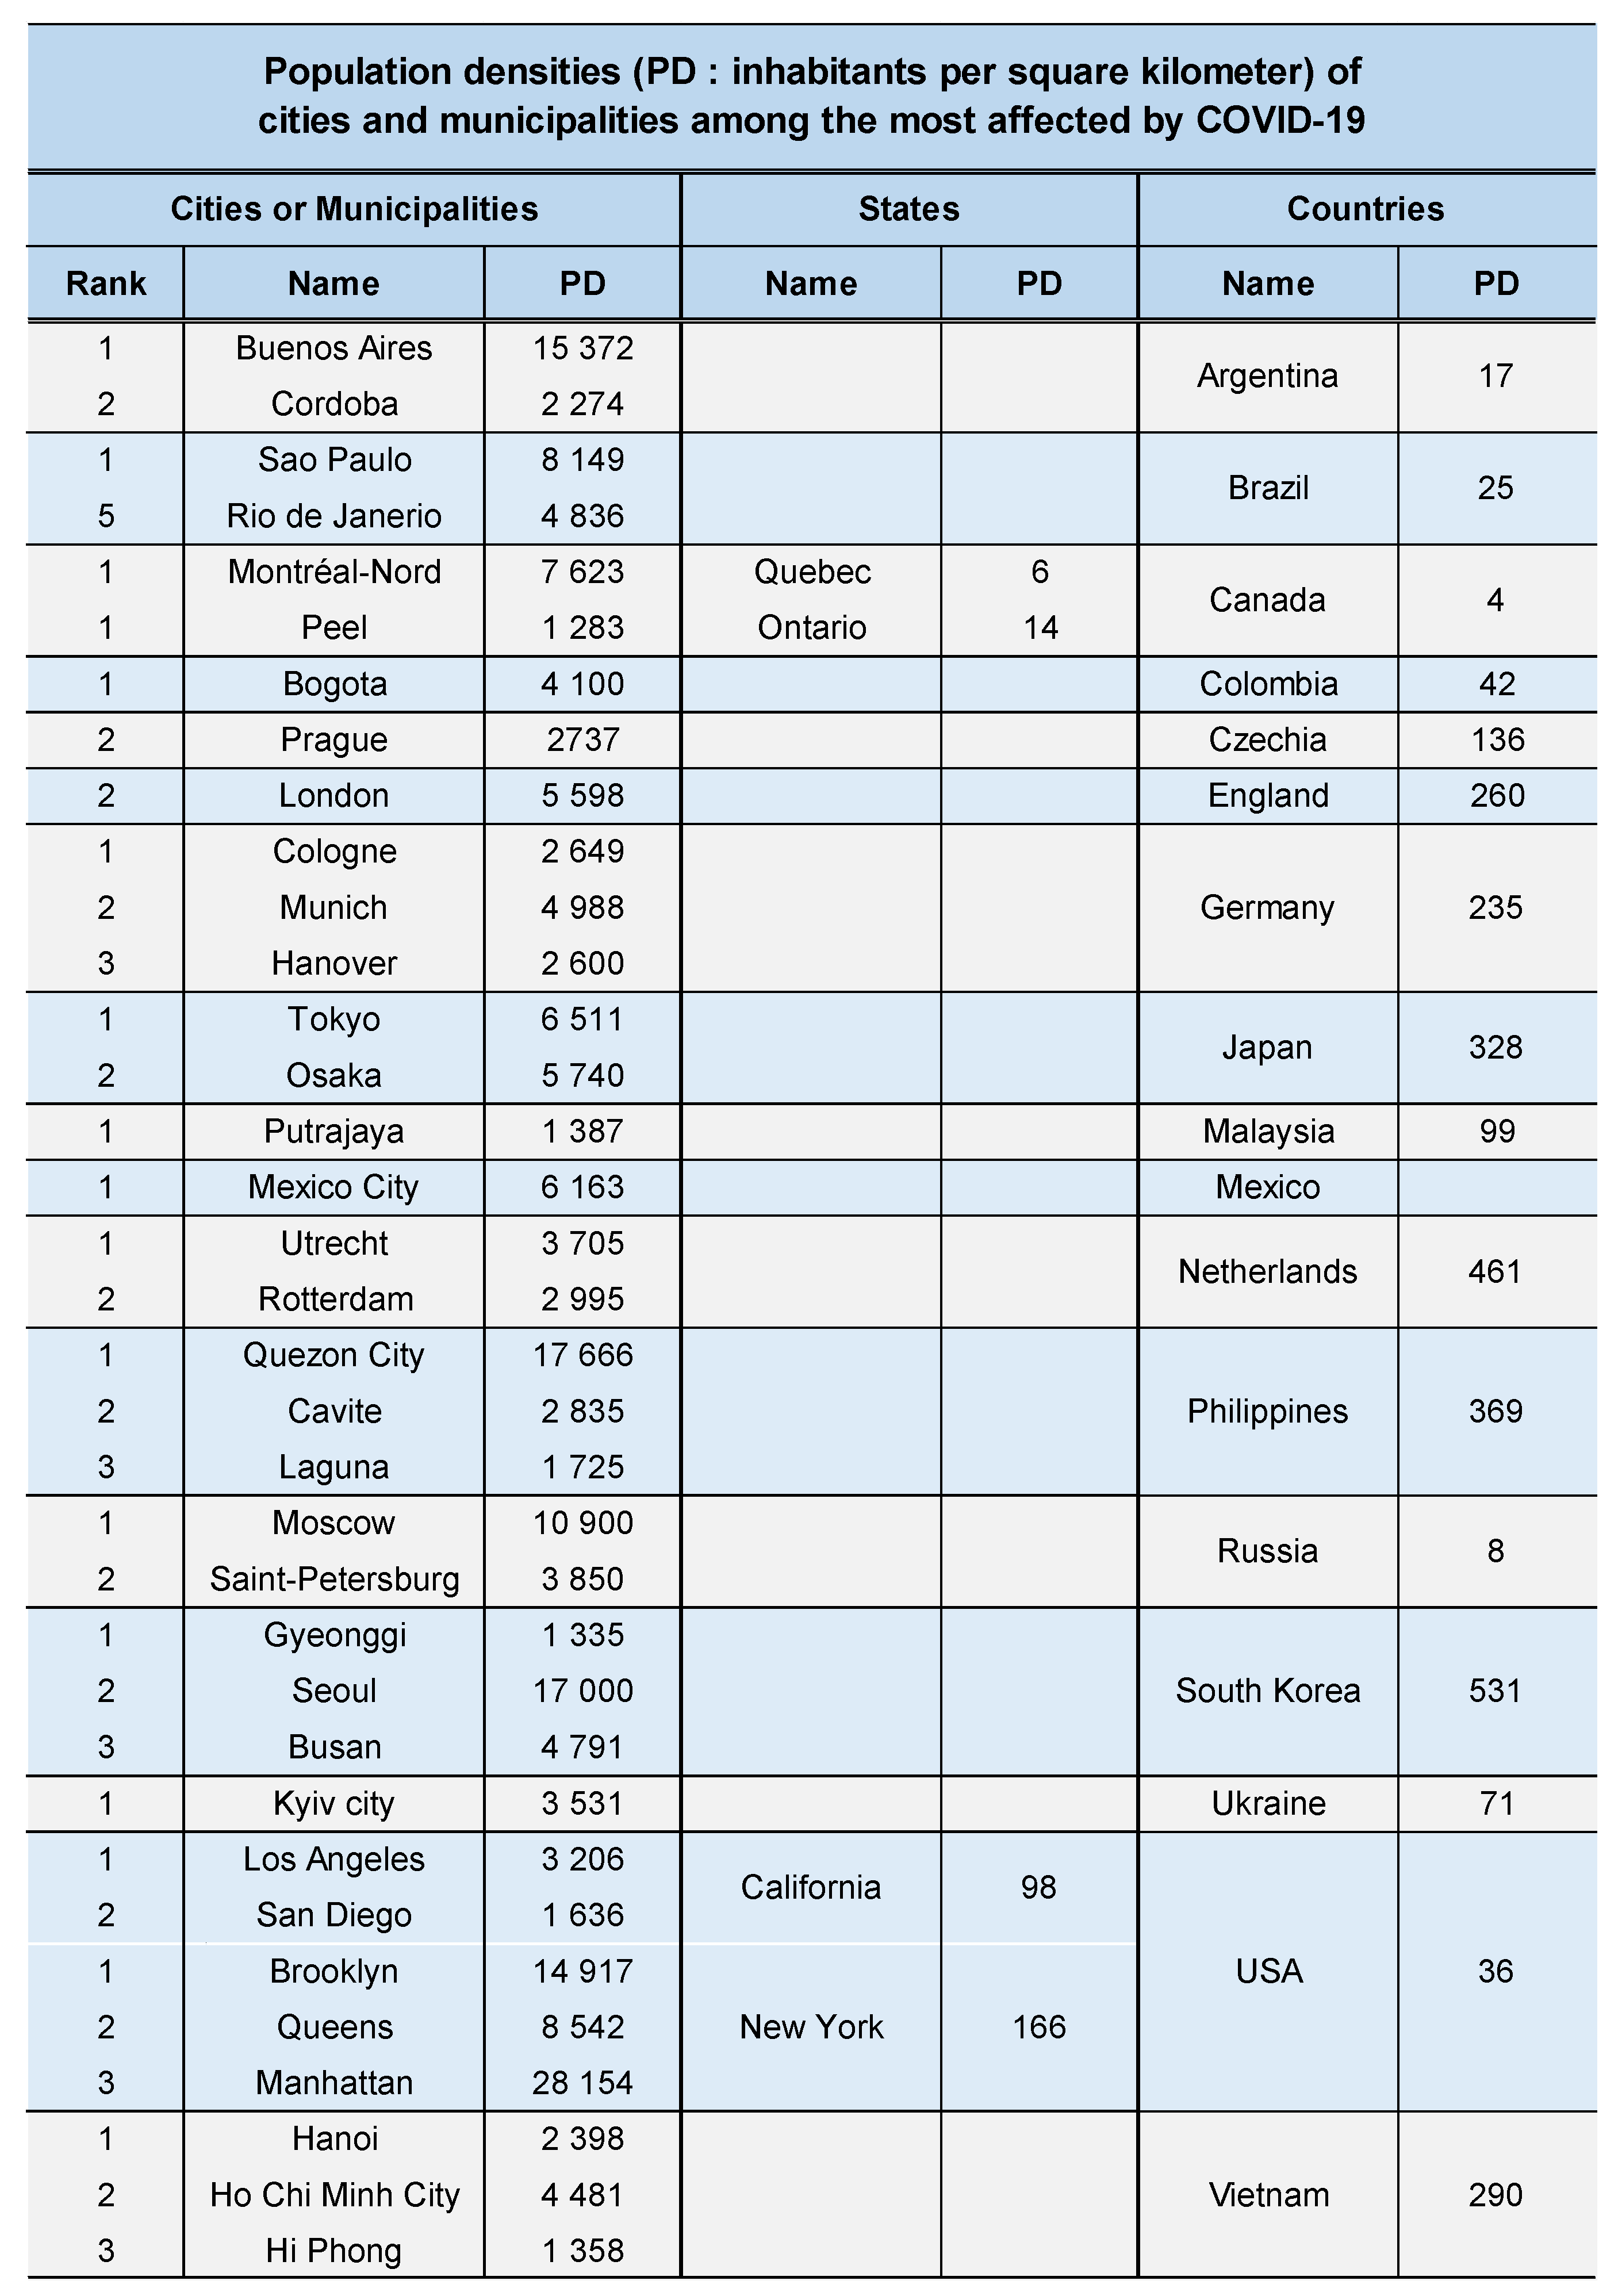
Table 2 presents a summary view of the population density of the cities and municipal areas among the most affected in their respective countries by COVID-19. Although the average population density of a country is only about 61 inhabitants per km
2 [
35], it has been observed that some cities and municipal areas have thousands of inhabitants per km
2. To be more precise, the countries in
Table 2 represented a median value of 118 inhabitants per km2 with [min max] = [4 531] in year 2021 while cities and municipal areas showed a median value of 4 100 with [min max] = [1283 28154].
Apart from population density, the ranking of cities (or municipal areas) based on the total number of COVID-19 cases in their respective countries as of September 2021 is shown in
Table 2. It has been observed that cities (or municipal areas) with high population densities constitute a powerful activator of the spread of COVID-19. This sample of cities and countries is not exclusive. This list is presented primarily for illustration purposes.
(a) Spectral analysis of the temporal evolution of COVID-19
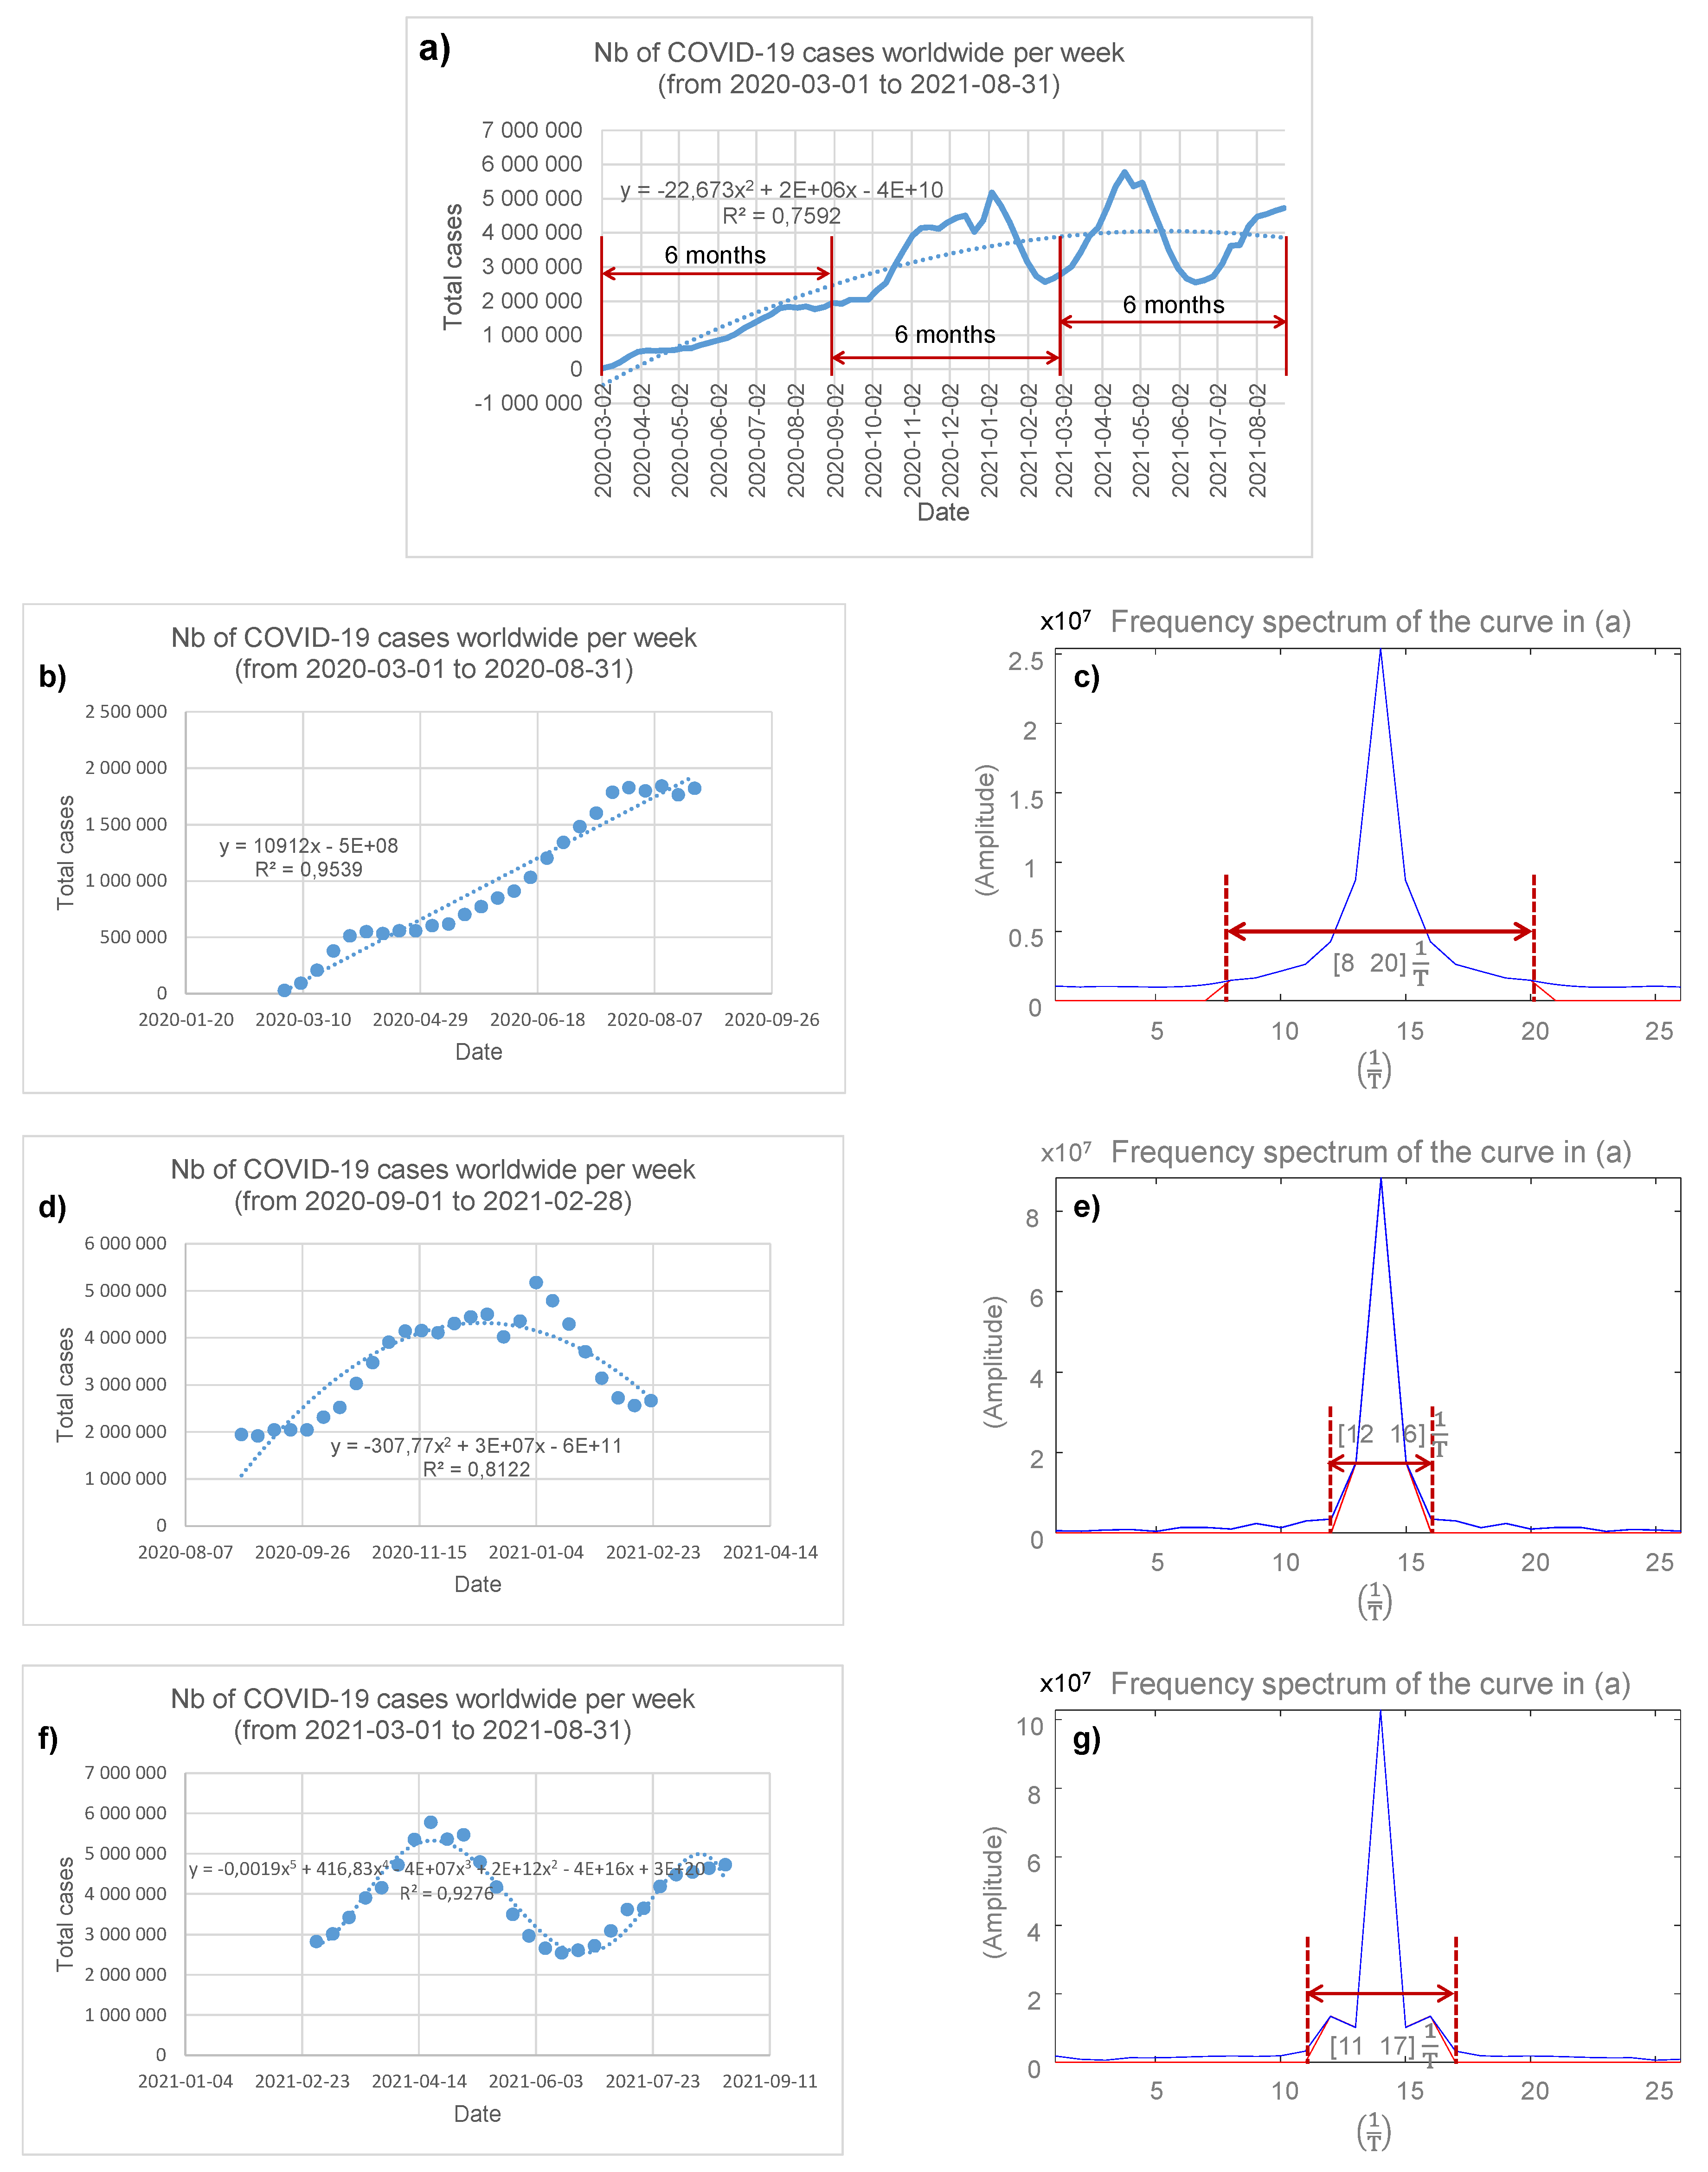
Figure 1a shows the number of COVID-19 cases worldwide by week, from 2020-03-01 to 2021-08-31. For that period, a quadratic regression profile (R² = 0.7592) of the spread of the SARS-CoV-2 virus offered some hope since some
stability in the trend could be observed towards fall 2020. Nevertheless, given the complex profile of the COVID-19 spread curve, it was deemed potentially more informative to analyze the data sampled over three consecutive 6-month periods, i.e. from 2020-03-02 to 2020-08-31, from 2020-09-01 to 2021-02-28 and from 2021-03-01 to 2021-08-31; this is shown in
Figure 1a. The following sections present the results for each of these periods, separately.
(a) COVID-19 spread from2020-03-02 to 2020-08-31
Figure 1b shows the number of COVID-19 cases worldwide by week, from 2020-03-01 to 2020-08-31. For this 6-month observation period, the linear regression profile (R² = 0.9539) of the spread of COVID-19 appears to indicate that a large expansion of the SARS-CoV-2 virus was underway. Additionally, the COVID-19 spectrum, shown in
Figure 1c, has a width of
calculated with a threshold of 5% of the maximum amplitude; T being the period, i.e. T = 1 week.
(b) COVID-19 spread from 2020-09-01 to 2021-02-28
Figure 1d shows the number of COVID-19 cases worldwide by week, from 2020-09-01 to 2021-02-28. For this 6-month observation period, a quadratic regression profile (R² = 0.8122) of the spread of COVID-19 appears to indicate some stability in the expansion of the SARS-CoV-2 virus. The COVID-19 spectrum, shown in
Figure 1e, has a width of
; i.e. a third of that in
Figure 1c and is therefore in agreement with the hypothesis of stability of the spread of the SARS-CoV-2 virus during this period of time.
(c) COVID-19 spread from 2021-03-01 to 2021-08-31
Figure 1f shows the number of COVID-19 cases worldwide by week, from 2021-03-01 to 2021-08-31. For this 6-month observation period, a polynomial regression profile of order 5 (R² = 0.9276) is observed. However, it is important to note that the COVID-19 spectrum, shown in
Figure 1g, has a width of [11 17]
and represents a 50% increase over that in
Figure 1e.
Discussion
(a) COVID-19 data reliability
The COVID-19 data reported in this study, i.e. the number of cases and deaths, were extracted daily from the
Worldometer platform [
30] and were fully consistent with those of the World Health Organization [
31]. For obvious reasons, developing countries have not been able to provide their data with the same frequency as developed countries, but we believe that such a disadvantage does not skew the results of this investigation as much. In fact, COVID-19 appears to have affected much more developed countries.
Additionally, at the end of data compilation in August 2021, China was not officially among the top 50 countries (out of 200+) ranked in terms of total number of COVID-19 cases. Today, almost two and a half years later, in February 2024, China is ranked 92nd with 503 300 total cases. Given the etiology of COVID-19 [
1] and the fact that China is one of the two most populous countries in the world, these statistics may be questioned.
The COVID-19 data reported in this study extend from March 2020 to August 2021 inclusive. Since then, the spread of SARS-CoV-2 has likely evolved, but the results and conclusions remain essentially the same in 2024.
(b) Spread of COVID-19 in G20 countries
As of September 2021, analysis of case and death data showed that COVID-19 mainly affects G20 countries. As shown in
Table 1, the top 11 countries ranked in terms of total number of COVID-19 cases are exclusively G20 members, while 80% of the top 20 and 73% of the top 30 are G20 members; this outlook remains essentially the same today, almost two and a half years later, in February 2024.
It seems relevant to note that 9 of the 10 countries (90%) with the most medals at the 2020 Summer Olympics [
36] are in the list of top 30 countries ranked by total number of COVID-19 cases (
Table 1); the only exception being China, discussed in the section above. Additionally, 28 of the top 30 countries (93%) in terms of total COVID-19 cases were medalists at the 2020 Summer Olympics. Since developed countries usually top the medal table at the Summer Olympics, this provides further argument that COVID-19 has primarily affected G20 countries.
(c) Impact of population density on the spread of COVID-19
Table 2 indicates that cities (or municipal areas) with high population density are a powerful activator of the spread of COVID-19. Indeed, the main cities (and municipalities) most affected by COVID-19 generally have a population density greater than several thousand inhabitants. This is probably the most important result of this investigation, as it highlights a potential solution to counter possible future pandemics to come.
Transmission of SARS-CoV-2 through direct person-to-person contact has been recognized since the early stages of the COVID-19 pandemic [
8]. Additionally, it has also been observed that the virus can be transmitted through inhalation of virus-laden aerosols [9;10]. In both cases, because the risk of transmission is higher when people are in close proximity, it is clear that the virus is fully activated in densely populated cities.
Although it seems easier to say than to implement, it might be wise to start thinking about depopulating densely populated cities (and municipalities) in favor of less populated ones. This is becoming a societal problem that developed countries around the world will face sooner or later and therefore needs to be adequately addressed. In fact, densely populated cities may lack quality services, especially in the context of a pandemic. This was particularly true for health services at the start of the COVID-19 pandemic in many countries, leading to a heavy burden of deaths.
(d) What we learned from the spectral analysis of COVID-19
The observation of the first months of spread of COVID-19, from 03/01/2020 to 08/31/2020, seems to be the most striking with a strong expansion of the SARS-CoV-2 virus, as indicated by a broad spectrum width in
Figure 1c.
The following six months, from 09/01/2020 to 02/28/2021, seem to indicate some stability in the expansion of the SARS-CoV-2 virus, as shown in
Figure 1e with a reduction in the width of the spectrum by 67%. This is mainly
a posteriori to the multiple measures that have been taken around the world to counter the spread of COVID-19, namely confinement, closure of non-essential services, wearing of masks, distancing of 2 meters, etc.
The last six months studied, from 03/01/2021 to 08/31/2021, show a locally periodic signal (
Figure 1f) then inducing a 50% increase in the width of the spectrum (
Figure 1g). This probably results from a mixture of opposing and alternating measures, notably confinement and deconfinement mainly. Variants of SARS-COV-2 could also potentially fit into this picture.
(e) The very next pandemic could be closer than expected
From the year 1
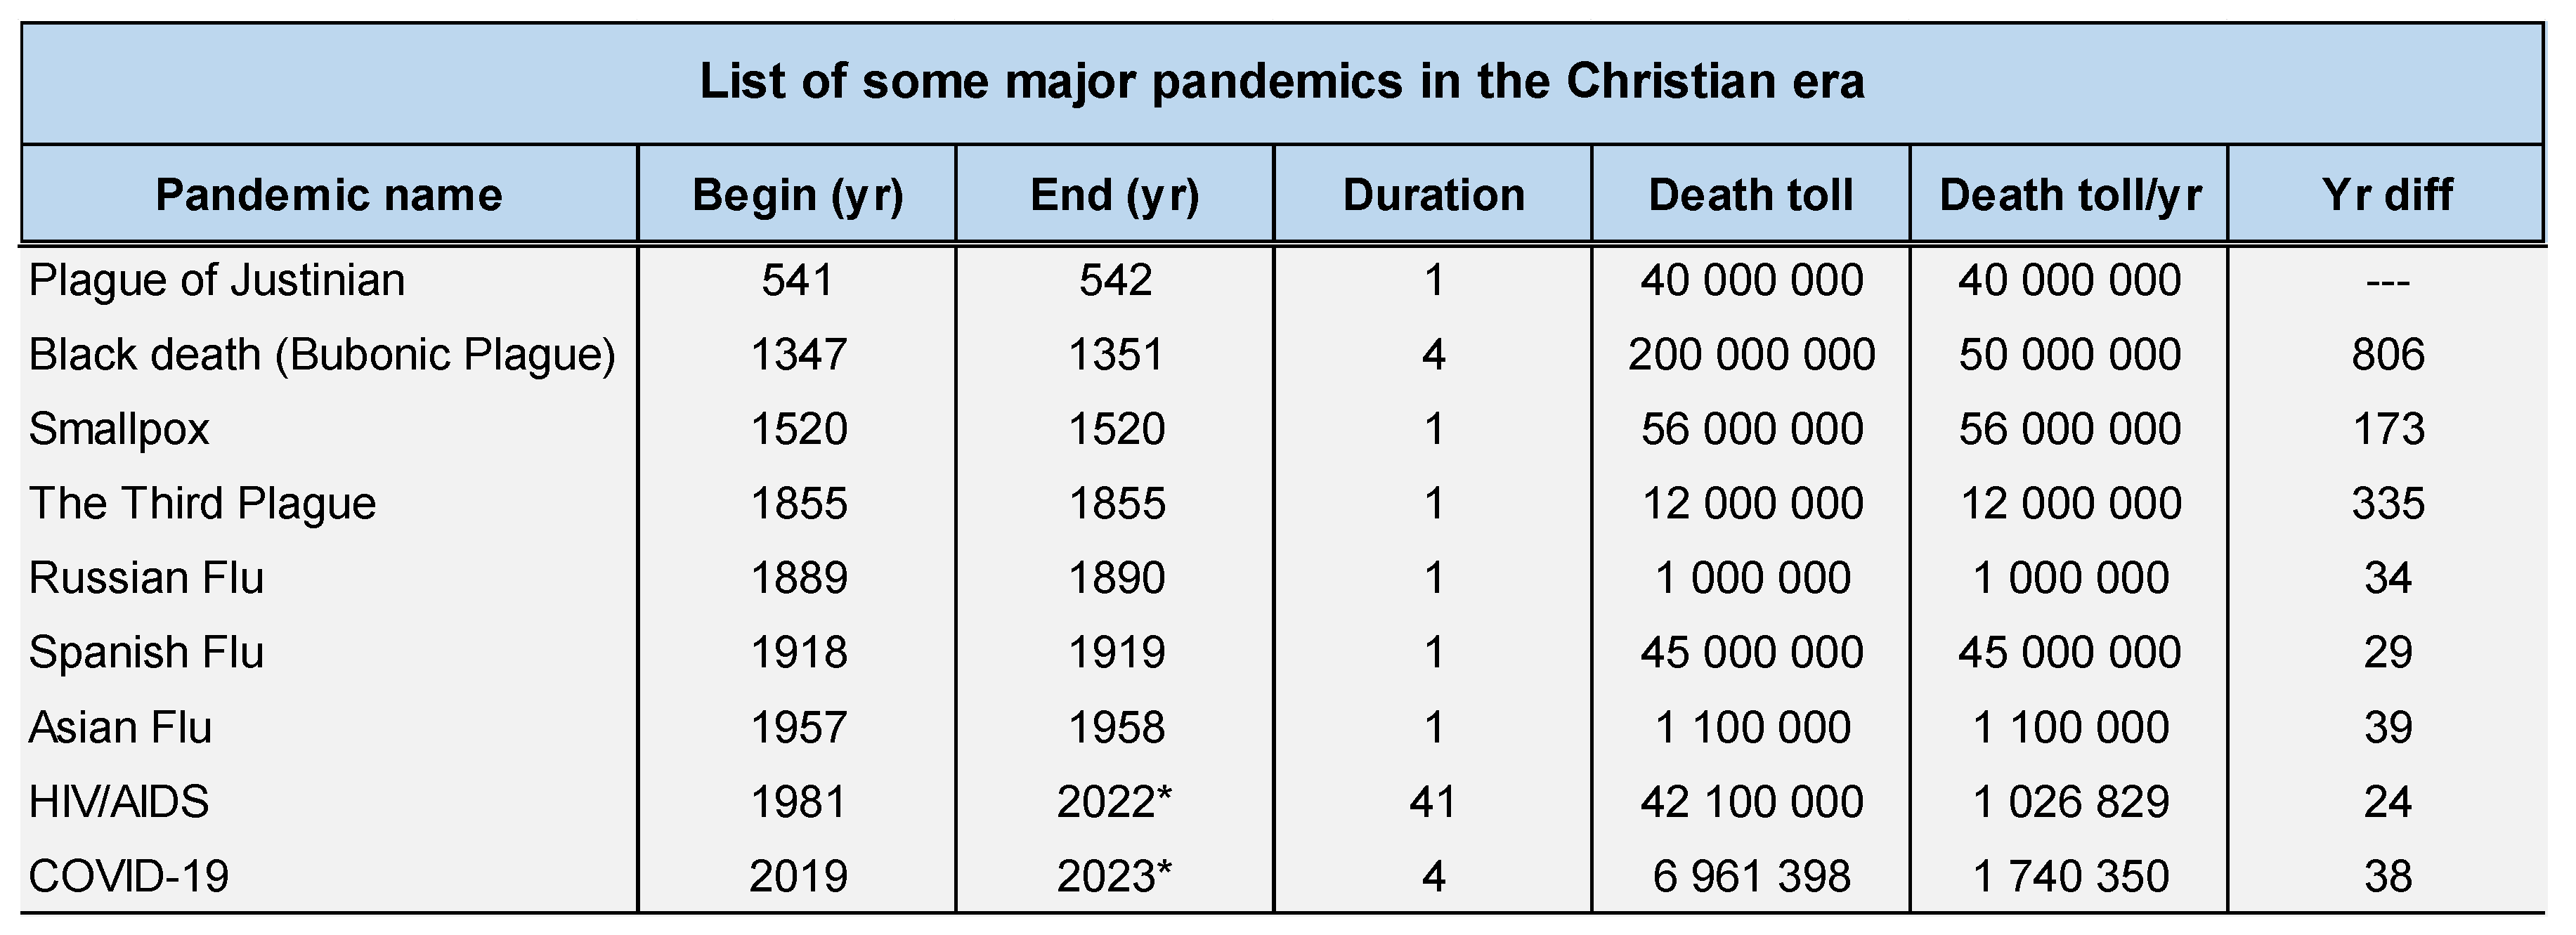
anno Domini until today (2024), our planet has survived close to twenty pandemics, starting with the Antonine Plague in 165 and ending with COVID-19 in 2019. For the purposes of this discussion, we only report pandemics that resulted in one million or more deaths per year, regardless of their duration, as
Table 3 illustrates.
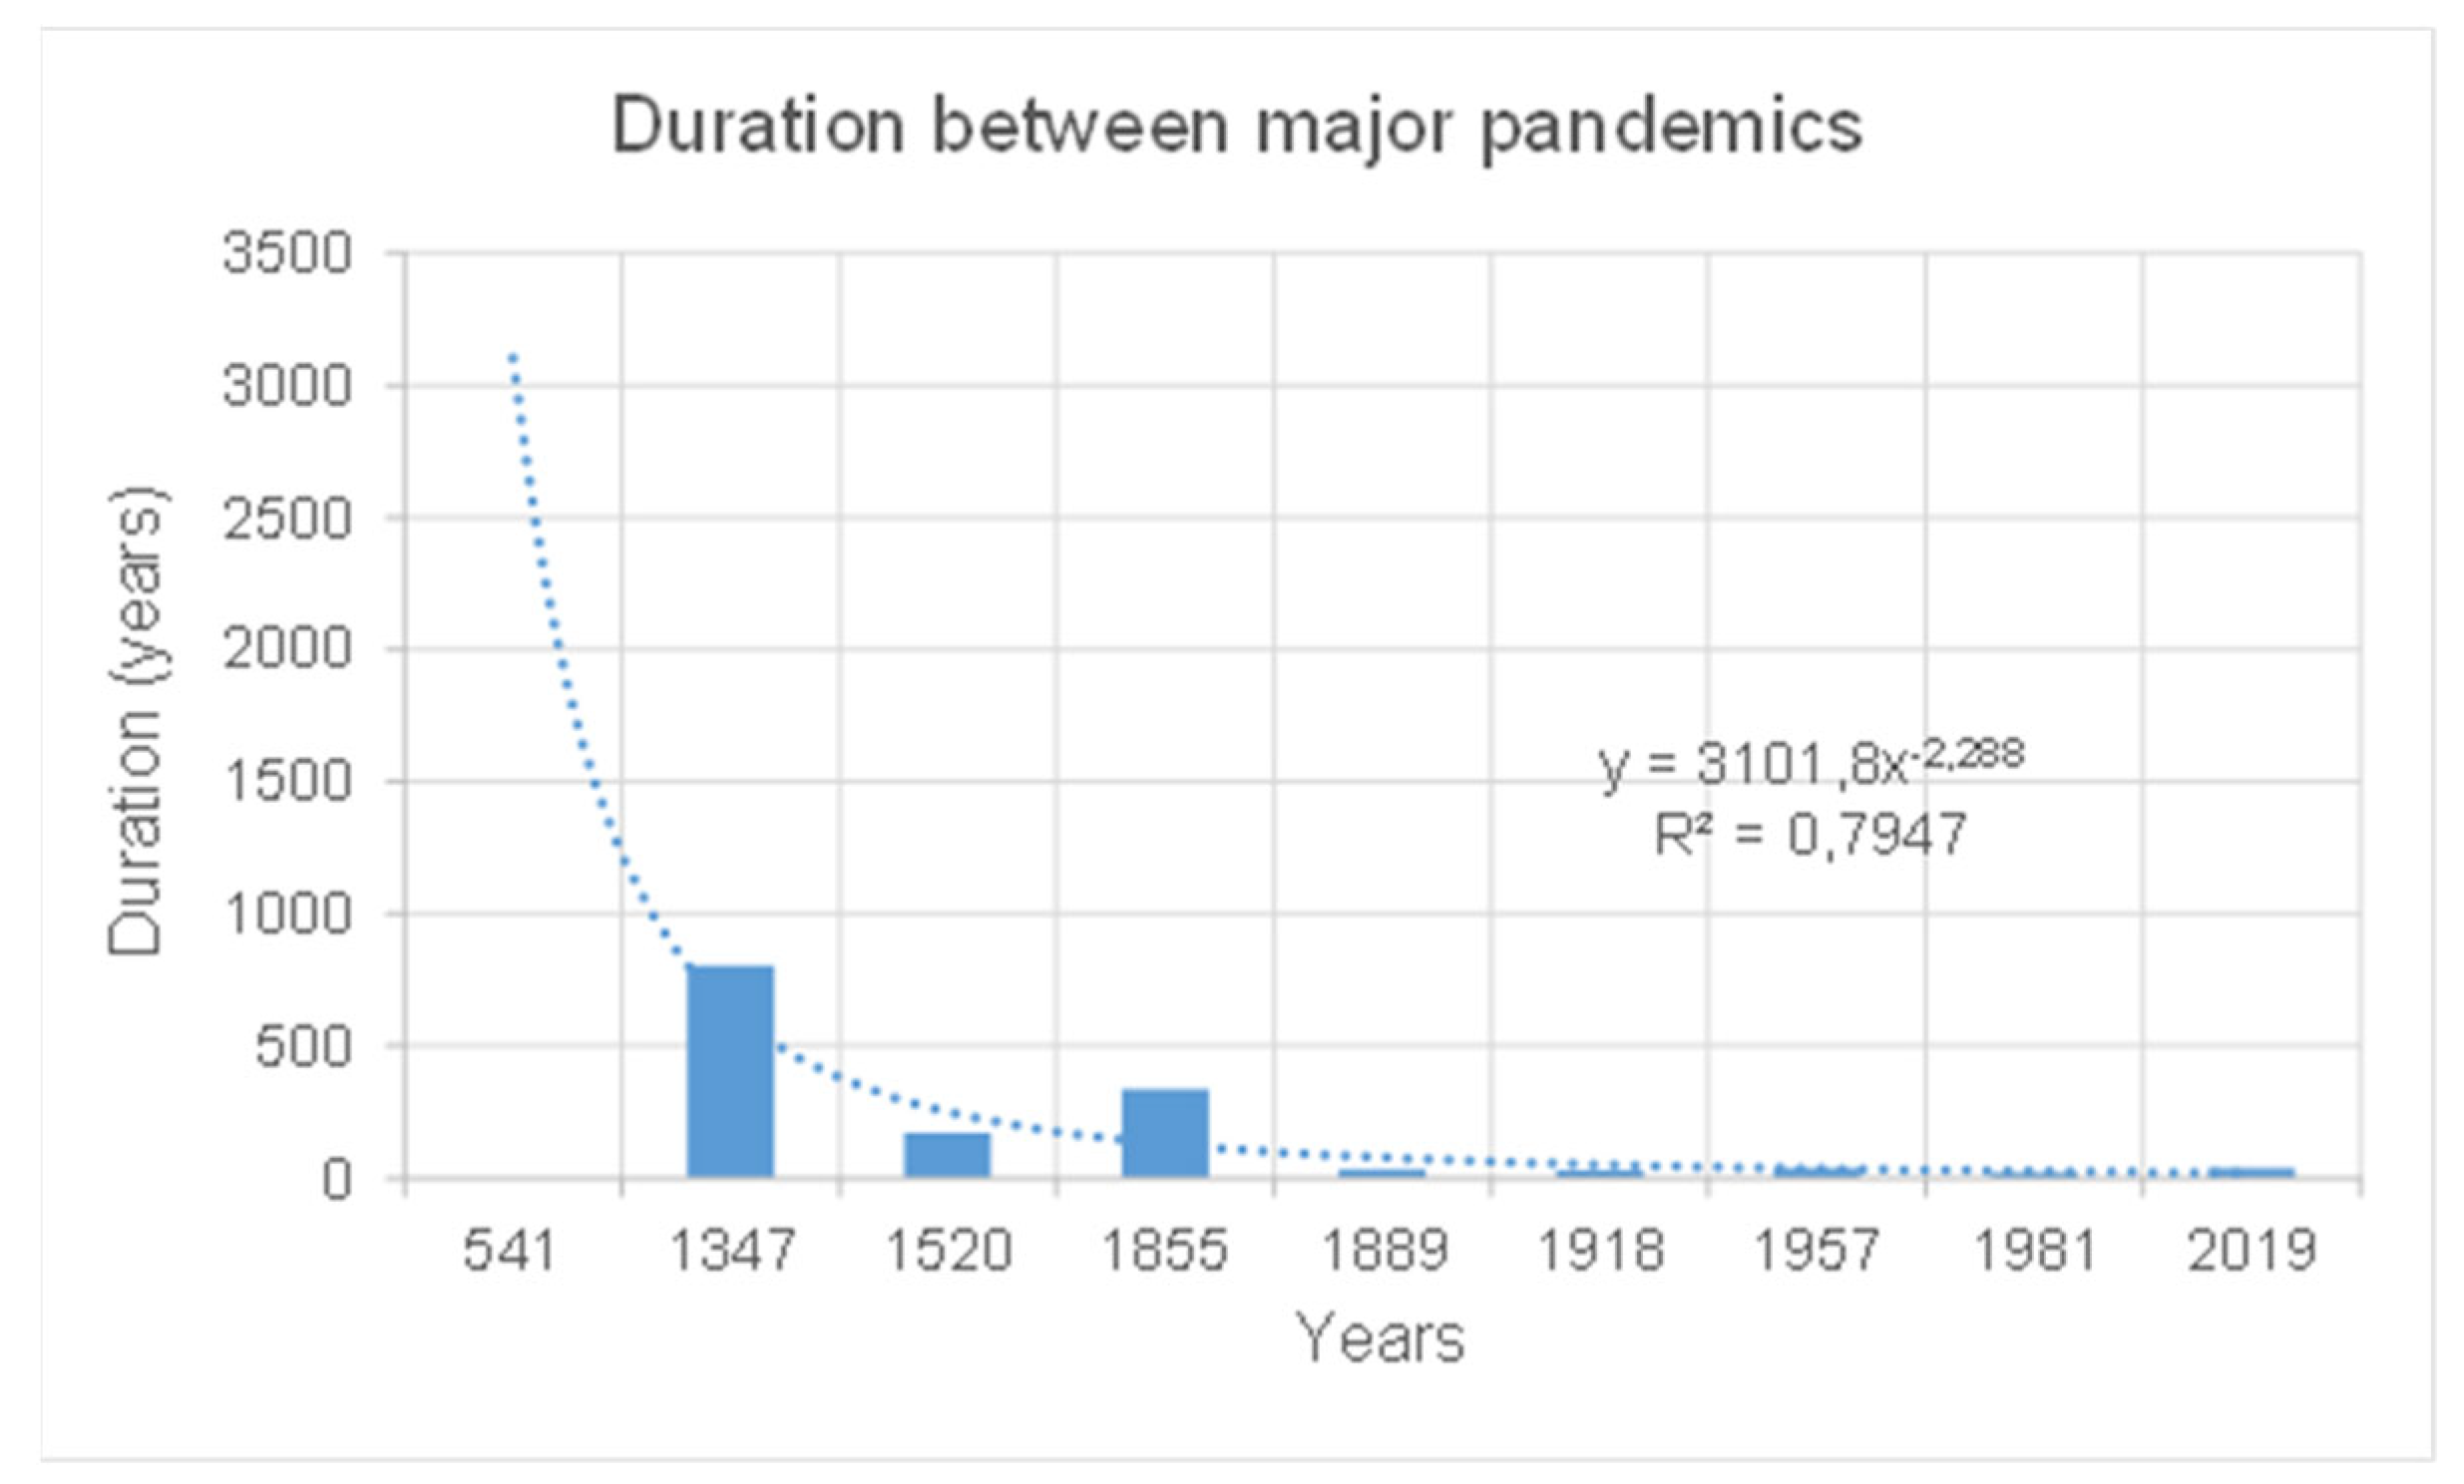
In addition, from the year 1
anno Domini until 1855, the year of the third plague, major pandemics occurred on average every 348 years; since then, they have occurred on average every 33 years [
37], as illustrated in
Figure 2. In other words, the very next major pandemic could be closer than expected.
5. Conclusions
Today, phenomenological knowledge, as reported in
Table 3 and
Figure 2, tends to indicate that the frequency of major pandemics has increased considerably and that the next one could occur in less than 50 years.
The COVID-19 pandemic has taught us that population densities in cities (and municipalities) have a significant impact on the burden of pandemics in terms of cases and then deaths.
Although new knowledge and emerging technologies can provide new vaccines in a relatively short period of time, vaccination remains primarily a curative solution in the context of a pandemic. Indeed, vaccines do not necessary prevent viral infection but mainly aim to minimize its impact on the physiological system.
It is perhaps time to launch new societal projects aimed at relieving congestion in densely populated regions. This seems an adequate solution to minimize the impact of future pandemics.
Even though new knowledge and emerging technologies have considerably improved the human way of life, new challenges arise to optimize and maintain these achievements but also to intelligently prepare for the future. COVID-19 has made us understand that it is time to act both preventatively and curatively.
References
- Gianfranco Spiteri, James Fielding, Michaela Diercke et al., First cases of coronavirus disease 2019 (COVID-19) in the WHO European Region, 24 January to , www.eurosurveillance.org, March 2020.
- Islam MA (21). "Prevalence and characteristics of fever in adult and paediatric patients with coronavirus disease 2019 (COVID-19): A systematic review and meta-analysis of 17515 patients". PLOS ONE. 16 (4): e0249788. [CrossRef]
- Islam MA (20). "Prevalence of Headache in Patients With Coronavirus Disease 2019 (COVID-19): A Systematic Review and Meta-Analysis of 14,275 Patients". Frontiers in Neurology. 11: 562634. [CrossRef]
- Saniasiaya J, Islam MA (21). "Prevalence of Olfactory Dysfunction in Coronavirus Disease 2019 (COVID-19): A Meta-analysis of 27,492 Patients". The Laryngoscope. 131 (4): 865–878. [CrossRef]
- Saniasiaya J, Islam MA (20). "Prevalence and Characteristics of Taste Disorders in Cases of COVID-19: A Meta-analysis of 29,349 Patients". Otolaryngology–Head and Neck Surgery. 165 (1): 33–42. [CrossRef]
- "Interim Clinical Guidance for Management of Patients with Confirmed Coronavirus Disease (COVID-19)". Centers for Disease Control and Prevention, , 2020. https://stacks.cdc.
- Davis HE, McCorkell L, Vogel JM, Topol EJ (23). "Long COVID: major findings, mechanisms and recommendations". Nature Reviews. Microbiology. 21 (3): 133–146. [CrossRef]
- Meyerowitz EA, Richterman A, Gandhi RT, Sax PE. Transmission of SARS-CoV-2: a review of viral, host, and environmental factors. Ann Intern Med. 2021;174:69–79. [CrossRef]
- Wang CC, Prather KA, Sznitman J, Jimenez JL, Lakdawala SS, Tufekci Z and Marr LC, Airborne transmission of respiratory viruses, SCIENCE, 27 Aug 2021, Vol. 373, Issue 6558. [CrossRef]
- Greenhalgh T, Jimenez JL, Prather KA, Tufekci Z, Fisman D and Schooley R, Ten scientific reasons in support of airborne transmission of SARS-CoV-2, www.thelancet.com, Vol 397, 1603:1605, , 2021. [CrossRef]
- Hsin-Yi Wei, Cheng-Ping Chang, Ming-Tsan Liu, Jung-Jung Mu, Yu-Ju Lin, Yu-Tung Dai, Chia-ping Su, Transmission of SARS-CoV-2 through Floors and Walls of Quarantine Hotel, Taiwan, 2021, Emerging Infectious Diseases • www.cdc.gov/eid • Vol. 28, No. 12, 2374:2382, 22. [CrossRef]
- Abdool Karim SS, de Oliveira T (21). "New SARS-CoV-2 Variants – Clinical, Public Health, and Vaccine Implications". The New England Journal of Medicine. Massachusetts Medical Society. 384 (19): 1866–1868. [CrossRef]
- Mallapaty S (20). "COVID mink analysis shows mutations are not dangerous – yet". Nature. 587 (7834): 340–341. [CrossRef]
- Koyama T, Platt D, Parida L (20). "Variant analysis of SARS-CoV-2 genomes". Bulletin of the World Health Organization. 98 (7): 495–504. [CrossRef]
- Andersen KG, Rambaut A, Lipkin WI, Holmes EC, Garry RF (20). "The proximal origin of SARS-CoV-2". Nature Medicine. 26 (4): 450–452. [CrossRef]
- Zhou P, Yang X, Wang X, Hu B, Zhang L, Zhang W, Si H, Zhu Y, Li B, Huang C, Chen H, Chen J, Luo Y, Guo H, Jiang R, Liu M, Chen Y, Shen X, Wang X, Zheng X, Zhao K, Chen Q, Deng F, Liu L, Yan B, Zhan F, Wang Y, Xiao G, Shi Z (2020). [CrossRef]
- Harrison AG, Lin T, Wang P (20). "Mechanisms of SARS-CoV-2 Transmission and Pathogenesis". Trends in Immunology. 41 (12): 1100–1115. [CrossRef]
- 18. [18] Marik PE, Iglesias J, Varon J, Kory P (January 2021). "A scoping review of the pathophysiology of COVID-19", 2: Immunopathology and Pharmacology. 35, 20 January 2058. [CrossRef]
- 19. Viana Martins CP, Xavier CS, Cobrado L (2022). "Disinfection methods against SARS-CoV-2: A systematic review", 8: Hospital Infection. 119. [CrossRef]
- Boulos L, Curran JA, Gallant A, Wong H, Johnson C, Delahunty-Pike A, Saxinger L, Chu D, Comeau J, Flynn T, Clegg J, Dye C (2023). "Effectiveness of face masks for reducing transmission of SARS-CoV-2: A rapid systematic review". Philosophical Transactions of the Royal Society A: Mathematical, Physical and Engineering Sciences. 381 (2257). [CrossRef]
- 21. Ju JT, Boisvert LN, Zuo YY (June 2021). "Face masks against COVID-19: Standards, efficacy, testing and decontamination methods", 1: and Interface Science. 292, 20 June 1024. [CrossRef]
- 22. Ataei M, Shirazi FM, Nakhaee S, Abdollahi M, Mehrpour O (October 2021). "Assessment of cloth masks ability to limit Covid-19 particles spread: a systematic review", 1: Pollution Research International. 29 (2), 20 October 1645. [CrossRef]
-
23. Li YD, Chi WY, Su JH, Ferrall L, Hung CF, Wu TC (December 2020). "Coronavirus vaccine development: from SARS and MERS to COVID-19", 1: 27 (1), 20 December. [CrossRef]
- 24. Subbarao K (July 2021). "The success of SARS-CoV-2 vaccines and challenges ahead", 1: 29 (7), 20 July 1111. [CrossRef]
- Ye Y, Zhang Q, Wei X, Cao Z, Yuan HY, Zeng DD (22). "Equitable access to COVID-19 vaccines makes a life-saving difference to all countries". Nature Human Behaviour. 6 (2): 207–216. 20 February. [CrossRef]
- 26. Kim PS, Read SW, Fauci AS (December 2020). "Therapy for Early COVID-19: A Critical Need", 2: (AMA). 324 (21), 20 December 2149. [CrossRef]
- Wang T, Du Z, Zhu F, Cao Z, An Y, Gao Y, Jiang B (20). "Comorbidities and multi-organ injuries in the treatment of COVID-19". Lancet. Elsevier BV. 395 (10228): e52. 10.1016/s0140-6736(20)30558-4, 20 March. [CrossRef]
-
28. Tao K, Tzou PL, Nouhin J, Bonilla H, Jagannathan P, Shafer RW (July 2021). "SARS-CoV-2 Antiviral Therapy". Clinical Microbiology Reviews. 34 (4): e0010921. https://doi.org/10.1128/CMR.00109-21. PMC 8404831, 20 July. [CrossRef]
- Martel J, Ko YF, Young JD, Ojcius DM (20). "Could nasal breathing help to mitigate the severity of COVID-19". Microbes and Infection. 22 (4–5): 168–171. 20 May. [CrossRef]
- COVID-19 Coronavirus pandemic”, Worldometer. https://www.worldometers.
- WHO COVID-19 dashboard”, World Health Organization. https://data.who.
- Who is Worldometers.info?”, Worldometer. https://www.worldometers.
-
Statista.
-
Wikipedia.
-
La Banque Mondiale.
- https://fr.wikipedia. 2020.
- LePan N, Visualizing the History of Pandemics, Visual Capitalist, 20. https://www.visualcapitalist. 20 March.
|
Disclaimer/Publisher’s Note: The statements, opinions and data contained in all publications are solely those of the individual author(s) and contributor(s) and not of MDPI and/or the editor(s). MDPI and/or the editor(s) disclaim responsibility for any injury to people or property resulting from any ideas, methods, instructions or products referred to in the content. |
© 2024 by the authors. Licensee MDPI, Basel, Switzerland. This article is an open access article distributed under the terms and conditions of the Creative Commons Attribution (CC BY) license (http://creativecommons.org/licenses/by/4.0/).
