1. Introduction
The annual solar radiation in Nigeria is 3.7kW/m
2/day along the coastal region and 7.0kW/m
2/day in the semi-arid zone of the country with average solar radiation of 5.4/m
2/day [
1]. Solar energy generation through Photovoltaic (PV) panel is a technology by which solar radiation directed on PV panel has been converted into Direct Current (DC). The present Si-PV panels has an inherent drawback to absorbed solar radiation from the complete solar spectrum. Incident photons with energy above the bandgap will be absorbed by the PV cell and will generate only one electron-hole pair/photon. While the incident photons with energy smaller than that of bandgap will not be absorbed but reach the back of the solar cell and get reflected by the metal contact and leave the solar cell surface, leaving behind electron hole with released electron being converted into heat by internal recombination and ohmic losses [
2].
1.1. Temperature Effects on Photovoltaic Panel
Solar irradiances elevate temperature of Silicon solar panels. Increase in temperature decrease the PV voltage because it is attributed to the temperature-dependent of semiconductor materials used in PV cells which the bandgap of the semiconductor decreases with increased in the temperature that result in a decrease in open-circuit voltage of the PV cell. While the current is slightly increased because of temperature-dependent behaviour of the semiconductor materials carrier mobility [
3]. High solar irradiance increases PV output power but increase in the temperature decrease the efficiency and without cooling, electric efficiency of PV decreases by 0.03% - 0.05% in any 1
oC in temperature [
4]. Sawadogo et al. (2020) [
5]. investigated the impact of climate change on Photovoltaic Power (PVP) generation in West African region and projected a decrease of PVP in West Africa in the future with four global warming levels of 1.5
oC, 2.0
oC, 2.5
oC and 3.0
oC. The maximum decrease in PVP projected over any country or zone in the region was less than 3.8% at a warming level of 3.0
oC. Rooftop photovoltaic systems increases the operating temperature of PV cells by 3-4% under cold, moderate, and warm climate and 5% in hot climate which achieves very high temperature values above 80
oC, and this can cause degradation of the PV cell [
6]. The results obtained through the simulation of test conducted using PowerSim (PSIM) program found that, increase in temperature decrease voltage, and current in both monocrystalline and polycrystalline PV panel due to increase in solar irradiation. In amorphous silicon thin-film PV panel, the current increase proportionally with solar irradiation and the voltage slightly decreased. Likewise, temperature changes affect monocrystalline PV panel more compared to the polycrystalline PV panel which is less affected and in terms of solar irradiation changes, monocrystalline PV panel is affected more than the amorphous silicon thin-film PV panel [
7].
Al-Ghezi et al. (2022) [
8] carry out PVsyst simulation software and a practical outdoor experiment and maximum values of current and voltage were 7.52A and 22V respectively at maximum solar radiation of 1000W/m
2. The minimum current and voltage were 1.51A and 20.35V respectively at minimum radiation value of 200W/m
2. The experiment shows that increase in temperature by 1
oC, increase the current by 0.07%, the voltage decreases by 0.34%, the output power decrease by 0.49% and the efficiency decrease about 0.59%. Polycrystalline panel was examined in a laboratory stand with two 400W halogen lamps used to illuminate the panel and heating of the panel was done with aid of an electric heater. The temperature was varied from 25
oC to 55
oC and the short-circuit current was increase by 5.8%, open-circuit voltage decrease by 11.76% and power decrease by 15.1% and 15% decrease in the efficiency which sum up the panel efficiency decrease of 0.5% per kelvin rise in temperature [
9]. Another 50W solar PV panel at STC of 1000W/m
2, 25
oC cell temperature was experimented in an outdoor by Senthil Kumar et al. (2019) [
10]. The top panel temperature was increased from 39.5
oC to 46.2
oC, rear panel temperature varied from 38.2
oC to 46.5
oC and the average temperature of the top to bottom was varied from 38.55
oC to 44.15
oC. The open circuit voltage (Voc) decreases from 19.7V to 19V and short circuit current (Isc) decreased from 1.73A to 1.35A and power output was decreased from 27.53W to 20.69W with electrical efficiency decreasing from 12.51% to 11.19%.
The impact of temperature performance is a critical step in the design and operation of solar energy systems. The high temperatures on Si-PV panels performance are a challenge in the field of solar energy and it must be managed carefully to ensure optimal efficiency and energy production from PV systems. Different strategies of cooling methods have been deployed to mitigate the high temperatures for the PV cells, thereby improving their overall efficiency and electrical power output.
1.2. Cooling Techniques
Heat removal from the rear of photovoltaic panel has a positive effect of improving the efficiency of the PV system. Combination of photovoltaic and thermal system to form Photovoltaic-Thermal (PVT) system is an appealing invention. The concept of PVT was reported in the mid of 1970s [
11]. Temperature distribution of PVT was investigated by Al Tarabsheh et al. (2016) [
12], to determine individual cell temperature of PVT module. The temperature differences in the cells as a temperature gradient of the water flowing through the pipes which varies from the inlet towards the outlet at the back of the PVT module. In another study, Tarabsheh et al. (2013) [
13] uses three different cooling pipes geometry to investigate the cooling effect of PV panel. The designs labelled A, B and C pipes geometry. Design A, one pipe was used to circulate water from inlet to the outlet given an efficiency of 15.5%. Design B splits the cooling pipe flow into 9 channels with each channel used for the cooling of 9 cells in series and this maintain a constant flowrate in all cases. The temperature of the cells in the PV was drop more in the B design compared to A and C that give the efficiency of B as 16.4% and C as 16.2%, given B as the highest efficient design geometric to adopt in piping.
Photovoltaic thermal collectors were simulated using 3-dimensional computational fluid dynamic (CFD) method and it was revealed that, increasing the flow rate from 30L/h to 90L/h led to a reduction of 6% and 18% in surface and outlet temperatures of the PV respectively [
14]. Asim et al. (2022) [
15] investigated the electrical efficiency and output power of monocrystalline PV module under real operating condition of Lahore, Pakistan. PV module of 35W capacity at standard test condition with absorber and heat sink with 17 microchannels all made with Aluminium. The PV cell’s temperature was found to be approximately 65
oC with power and efficiency drop of 35 – 28.32W and 19.40% - 15.65% respectively. The results show that, during laminar flow boundary conditions, water attained maximum outlet temperature of 49.86
oC and 48.71
oC as a coolant at 224 and 560 Reynolds numbers respectively. While the PV cell’s temperature reduces proportional to increase in Reynolds numbers with the most optimum temperature of 32.42
oC at 6710 Reynolds numbers. The electrical efficiency and power output of 15.65% - 18.65% and 28.31W – 33.65W respectively were observed under 6710 Reynolds numbers. Ahmadinejad et al. (2022) [
16] investigated a novel sinusoidal-fined-based photovoltaic thermal system (FPVTS) with comparison of two different modules such as PV without heat exchanger and a simple based photovoltaic thermal system (SPVT). It was found that, the sinusoidal-fined-based photovoltaic thermal system performed high in energy and exergy efficiency than the rest of the other configurations. At every 0.001kg/s increase in mass flowrate (0.002 to 0.02kg/s), the electrical and thermal efficiency increases by 0.086% and 0.92% respectively. The results also show that high flow rates are more advantageous from an energy viewpoint, while low flow rate provide better efficiency for the system. Bhat & Qayoum (2023) [
17] examine hybrid-tube design with straight tube with passage of different nano working fluids to cool a photovoltaic panel. The hybrid-tube outperform the straight (conventional) tube by uniformly lowering the PV temperature with average of 324.11K. The nano fluid reduced the PV average temperature to 315.14K and with the hybrid tube and proposed nano fluid, the electrical, thermal, and overall effective efficiencies were recorded as; 11.41%, 63.39% and 84.51% respectively.
An investigation of photovoltaic-thermal system by Adun et al. (2022) [
18] to determine the performance of a PVT system for electricity and hot water production in four-person household in Nigeria. It was noted that, Maiduguri in the northeast of the country has maximum and the highest electricity yield of 159kWh/kWp and Port Harcourt in the southwest of the country with least yield of 75.8kWh/kWp. The best annual final yield of 1735kWh/kWp was derived from Maiduguri and electrical efficiency of 11.99% was measured for Onitsha and 11.66% was measured in Maiduguri. Also a comparative study carried by Maoulida et al. (2023) [
19] to check the performance of PV/T in a tropical climate in the city of Koua in the Comoros in the Mediterranean and continental climates in the city of Marseille and Longwy in France. The results show total efficiency up to 40% throughout the year in the case of Comoros while in France it only attained the percentage in the summer. The domestic hot water needs in Koua was 70% covered unlike in France it was covered 10% to 40% needs. While 80% of electrical demand in Comoros was also covered all year long, while 20% to 30% of the demand was covered in France. This show superiority of PV/T system in sub-Saharan region than in continental climate in France.
The literature works demonstrated the impact of fluid flowrate on surface, outlet temperatures and power production. High flowrate is encouraged when the priority is on energy viewpoint while low flowrate increases the efficiency of the system. The heat exchanger design with different geometric like fins with extruded surfaces were also highlighted and prove to increase the efficiency of the system.
Studies on PVT in the literature can be found in different countries and regions of the world leaving nothing but a huge gap in Africa continent where Nigeria is located. Even though the continent has more potentials in PVT technology because of high solar radiation all year long as compared to the most places of the world, there is little presence of literature work on the topic in the region. The study is important to achieved in reducing the surface temperature, increasing the efficiency of PV panels and increase the PV panels life span in Nigeria.
2. Materials and Methods
2.1. Numerical Model of Photovoltaic-Thermal System
The energy balance equations for unsteady state of the various layers of the PVT are discussed as follows under the following assumptions:
i. One dimensional (1D) thermal model is considered.
ii. The fraction of solar irradiance that is not converted into electrical energy by the PV cell is transferred to the system.
iii. The optical properties of glass cover, the PV cells and EVA layer are constant.
iv. The PV cells and EVA layer temperatures are the same.
v. The properties of the materials are considered homogenous and constant.
vi. Perfect contact between PVT components.
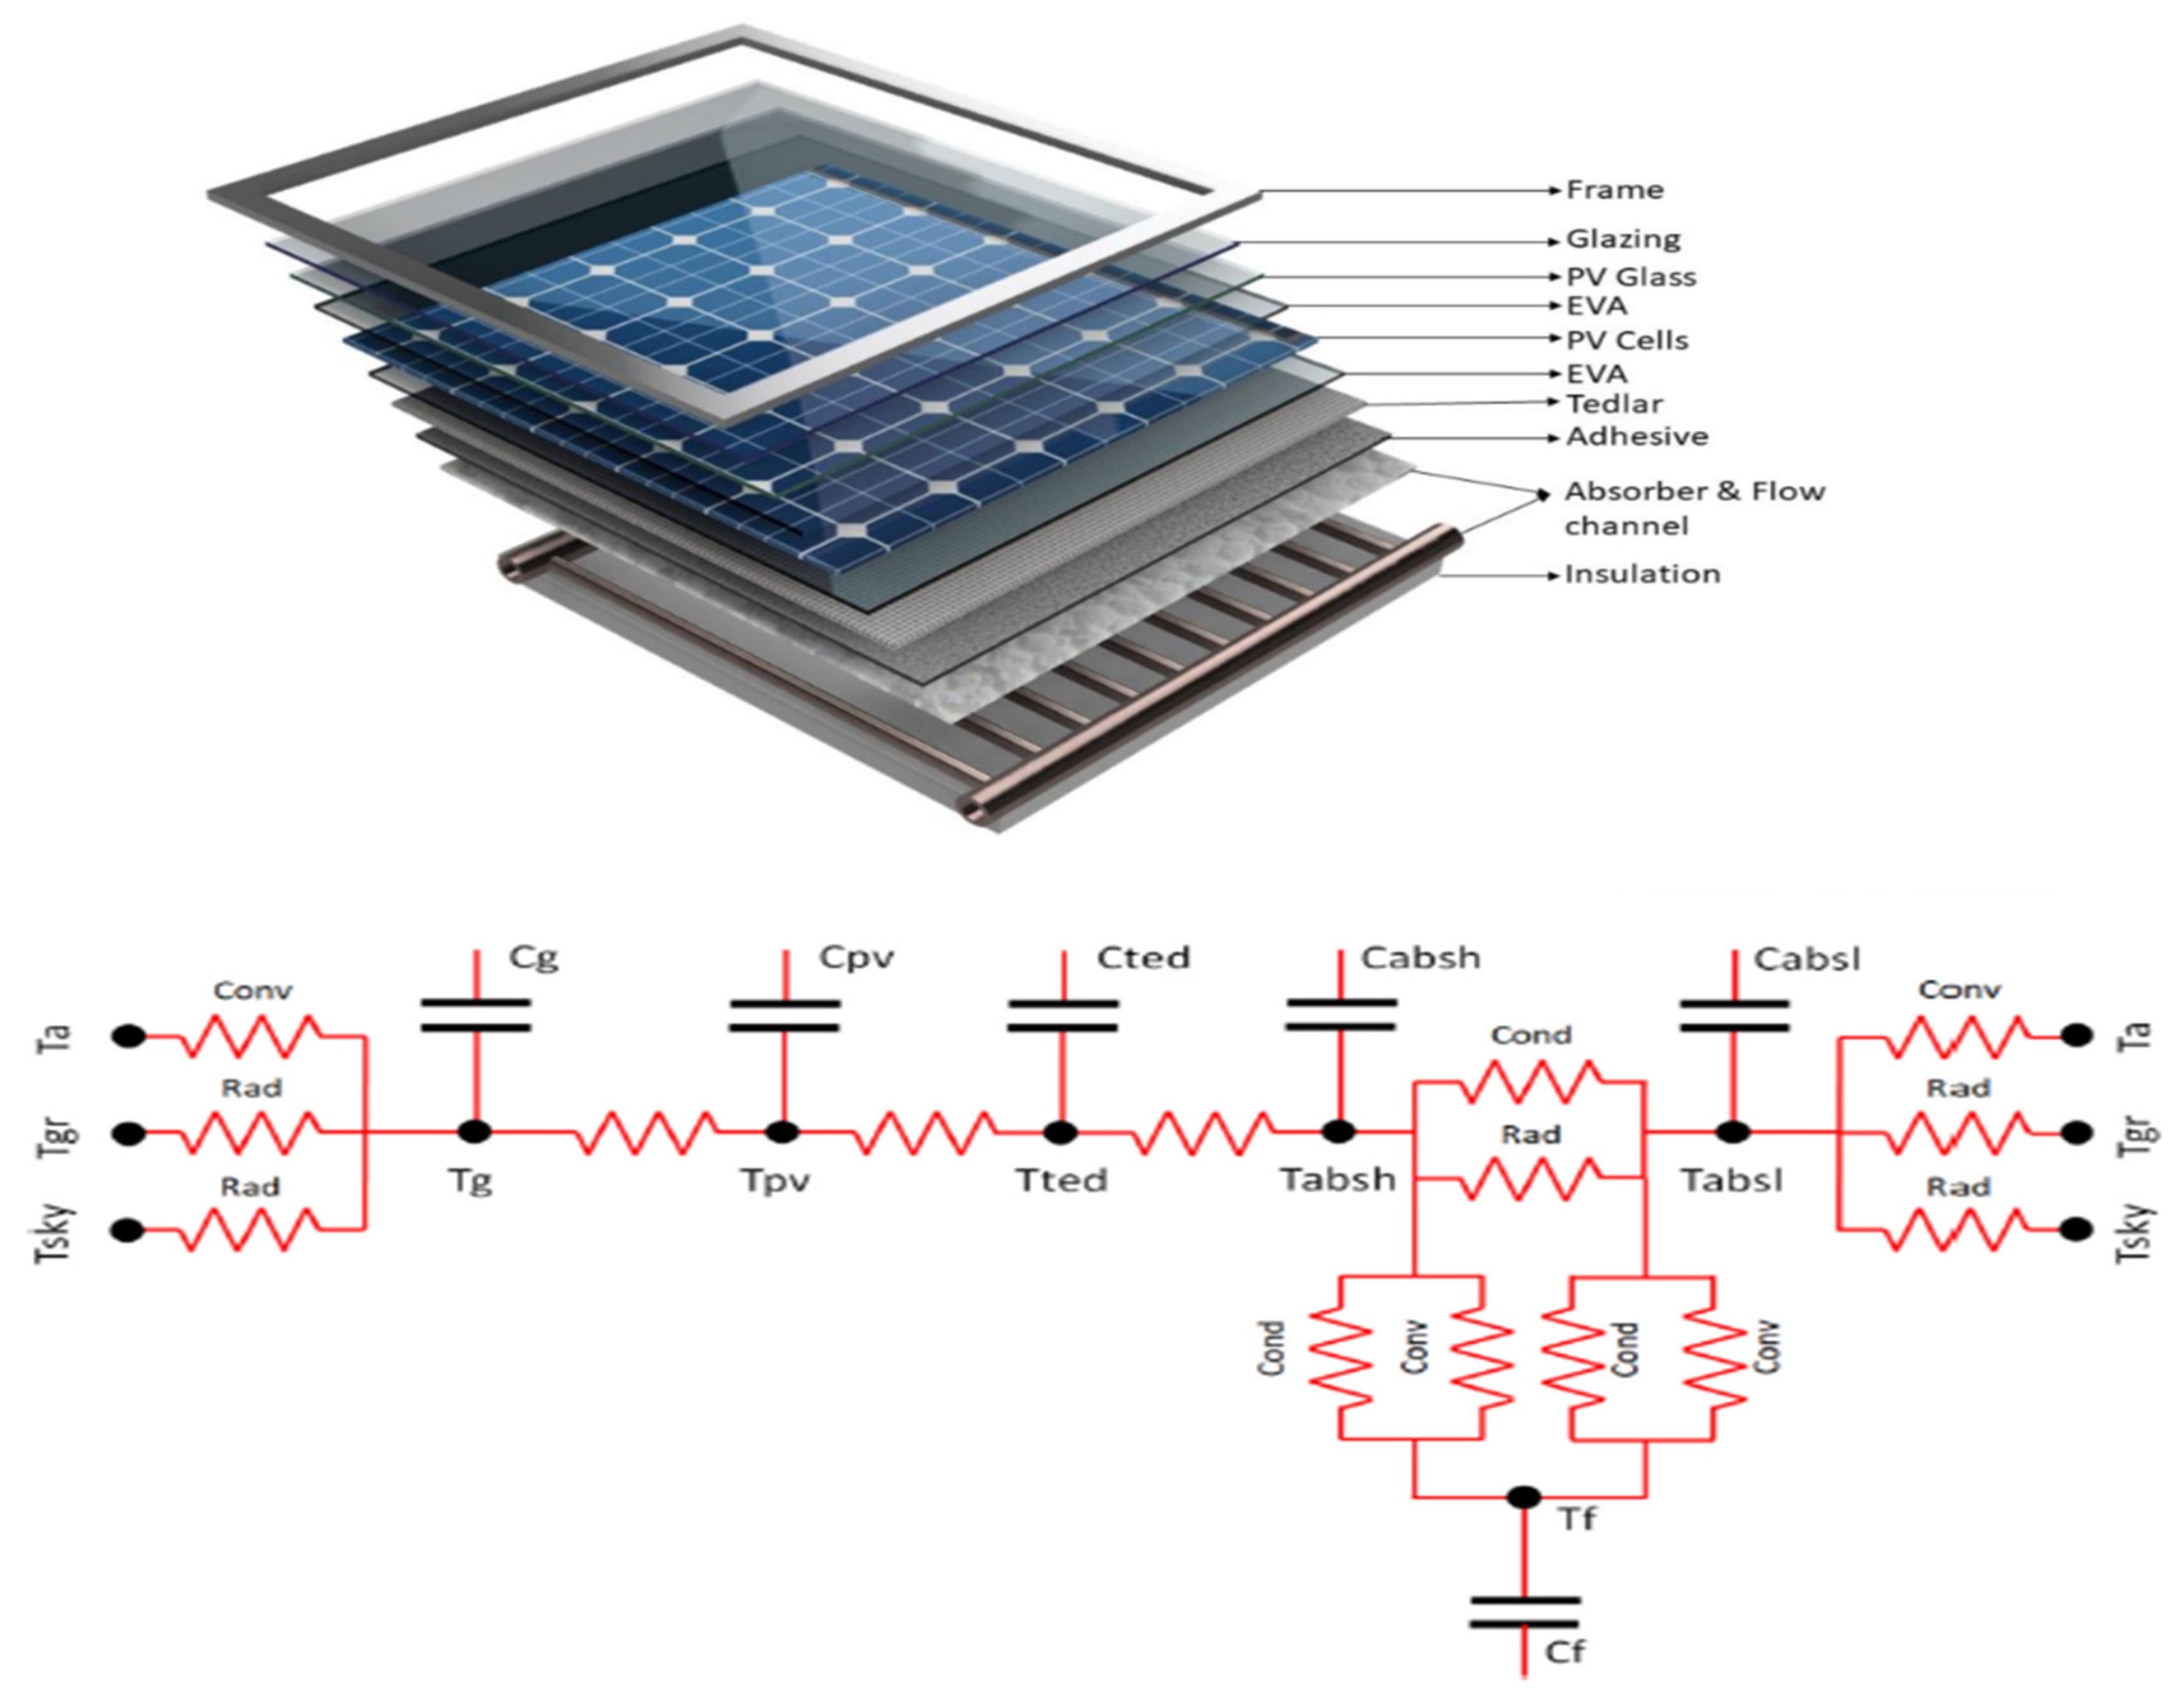
Figure 1.
Detailed parts of water-based and equivalent electrical circuit of PVT system [
20].
Figure 1.
Detailed parts of water-based and equivalent electrical circuit of PVT system [
20].
2.1.1. Glass Energy Balance Equations
At the glass layer, the energy is accumulated by the glass, solar irradiance absorbed, and energy lost by convection, radiation and conduction as demonstrated below.
where
is the absorbed solar irradiance by the glass (W/m
2);
,
and
are heat transfer of radiation, convection, and conduction (W/m
2. K) respectively.
PF is the packing factor which is the ratio between the surface covered by the PV cells and the total surface of the panel been considered.
The radiative exchange of coefficient depends on
and view factors
where
w is the wind speed in (m/s).
2.1.2. PV Cell Energy Balance Equations
The PV cells are affected by solar radiation transmitted through the glass
to convert the solar radiation into electrical energy
and transfer heat by conduction to the down layers.
2.1.3. Tedlar Energy Balance Equations
The Tedlar is in contact with the PV cells at the upper layer and the remaining part (1-PF) is considered in contact with the glass, while below is totally in contact with the absorber which is aluminium in this case. Therefore, Tedlar has been affected by the solar radiation that passes through the glass to the PV cells.
2.1.4. Absorber Energy Balance Equations
The absorber consists of upper and lower plate surface, the energy balance at the upper surface transmit heat by conduction with the Tedlar layer, the energy exchange between this plate and the fluid. The upper layer and lower layer are radiative in corresponding with the channel housing the working fluid and is conductive to the channels as well.
The surface where the fluid flow and the rest area of the absorber is known as percentage of the channel (PC) and is shown below the equation.
The radiative heat transfer coefficient between the two aluminium plates is calculated based on Ben Cheikh correlation [
20]
where
are Stefan-Boltzmann constant, mean plate temperature and plate emissivity.
The energy balance at the lower absorber plate is considered as the amount of energy transferred with the fluid, the upper absorber plate, and the heat exchange with outer surface (ground and air) is shown in Equation (11).
The convective heat transfer coefficient between low absorber plate and outer surrounding area is calculated as a function of thermal air conductivity and Nusselt number in case of free convection [
20].
The radiative exchange coefficients depend by
and the view factors
as:
2.1.5. Fluid Energy Balance Equations
The heat exchange between the coolant fluid and the absorber is governed by Equation (18):
where
is the mass flow rate (kg/s),
is the fluid heat capacity (J/kg. K),
are inlet and outlet temperature of the fluid in (K). the mean temperature between the inlet and outlet temperature of the fluid is given as:
The water from the mains at temperature Tsup = 20oC in this case, flows into the tank where it is mixed with already heated water at temperature Tt. The hot water demand is drawn from the tank at temperature Tt.
The energy balance considering the heat supplied by the panels, the heat supplied to household demand and the heat losses from the tank to environment.
According to El Fouas et al. [
20], the temperature at the outlet of the solar tank T
t is calculated using the effectiveness
of the heat exchanger.
The energy balance equation of the tank becomes:
where
is the mass flowrate of the thermal load,
is the specific heat of water,
is the heat loss coefficient of the tank to the environment (W/K m
2),
is the external surface of the tank.
2.2. Electrical and Thermal Performance
2.2.1. Electrical Outputs
The electrical power (P
e) produced by PVT is calculated from the irradiance (G) impinging on the total surface area of PV cell (A
PV) and the electrical efficiency (
of the collector. Mathematically:
where
is the efficiency at STC condition,
is temperature coefficient of the PV cell and T
PV is the PV surface temperature (
oC) and it can be calculated from Equation (8); T
ref is the reference temperature (
oC).
2.2.2. Thermal Outputs
The thermal power (P
th) output is gotten by applying the thermal balance equations to the fluid passing through the heat exchanger at the rear of PV panel.
The thermal efficiency is given as:
2.2.3. The Overall Outputs of PVT System Are Given in Terms of Power and Efficiency As:
2.3. PVT System Design and Description
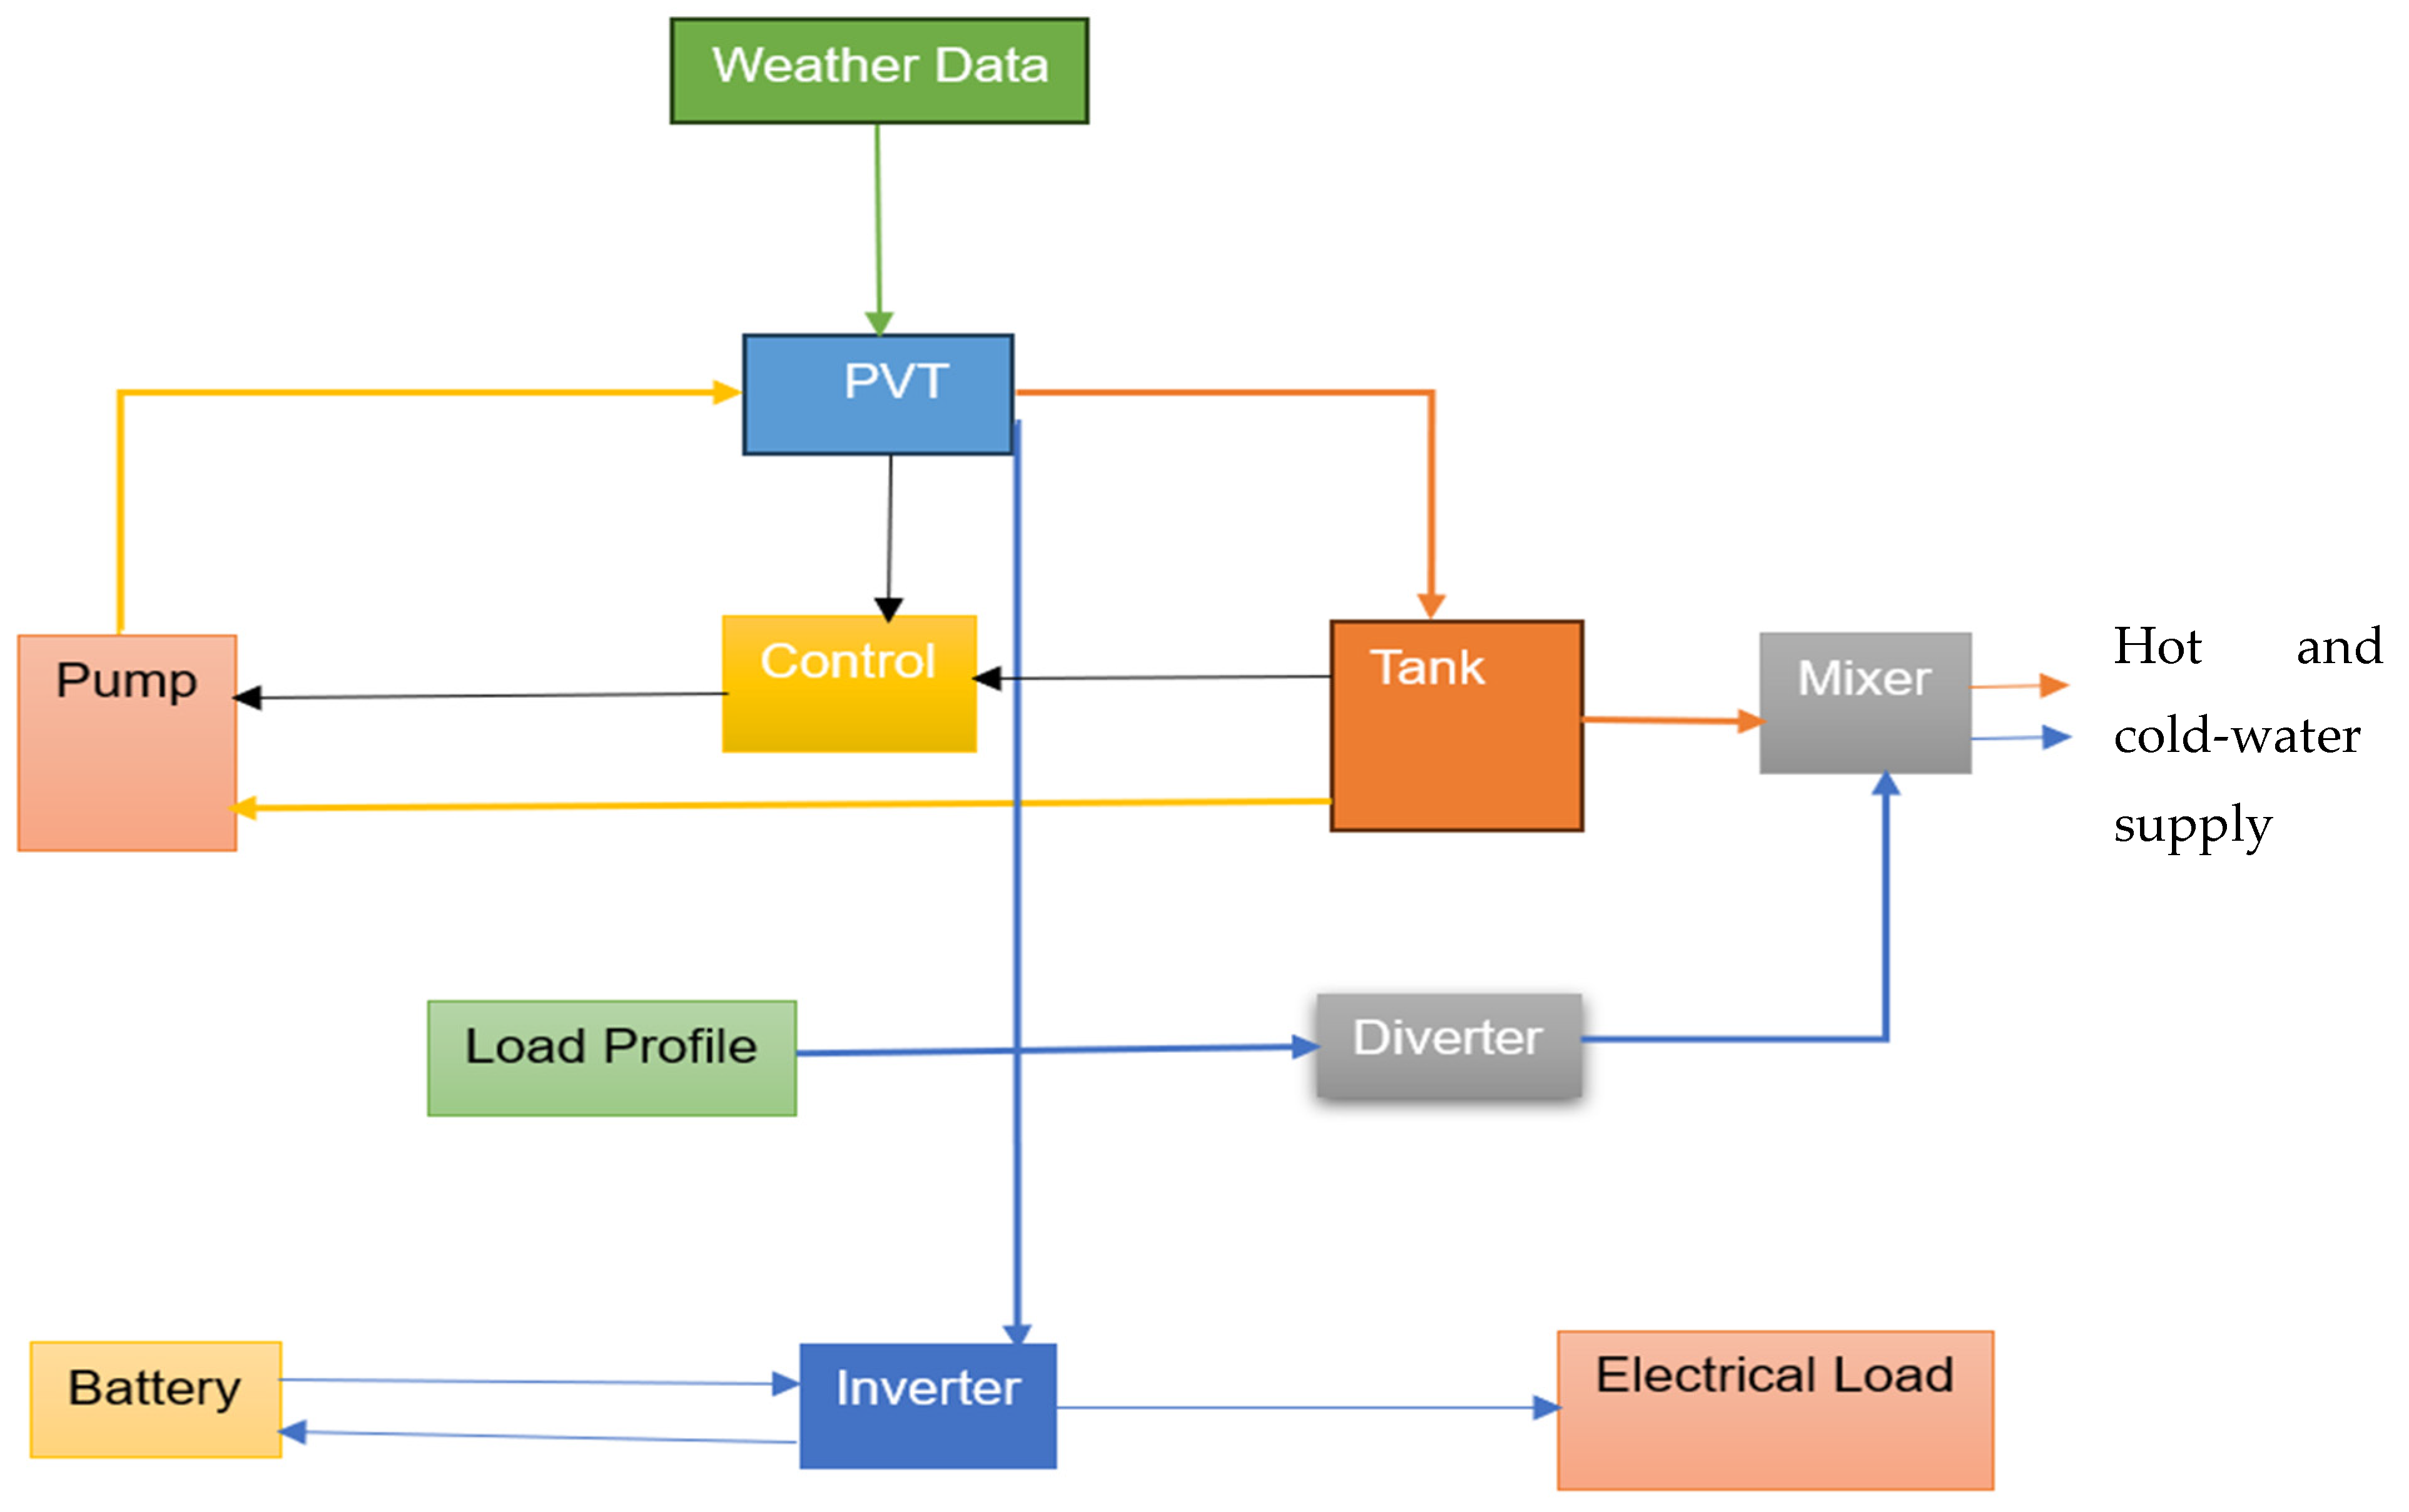
The system components include PVT panel with 1.64m2 area, a water tank of volume capacity of 200L, water pump, a charge controller, and a storage battery. The PV panel is integrated with a heat exchanger that circulate water as coolant. The fluid is circulated in the rear of the PV panel as soon as the surface temperature of the PV is above 35oC to remove the excess heat at the rear of the PV panel. This drop down the temperature of the PV panel and increase the power output and electrical efficiency of the system. The electrical power produced is sent to the controller which distribute the energy to demand and charge the battery. Figure 2 shows the block diagram of PVT system understudy.
Figure 2.
Block diagram of PVT system design.
Figure 2.
Block diagram of PVT system design.
2.3.1. TRNSYS Simulation Model
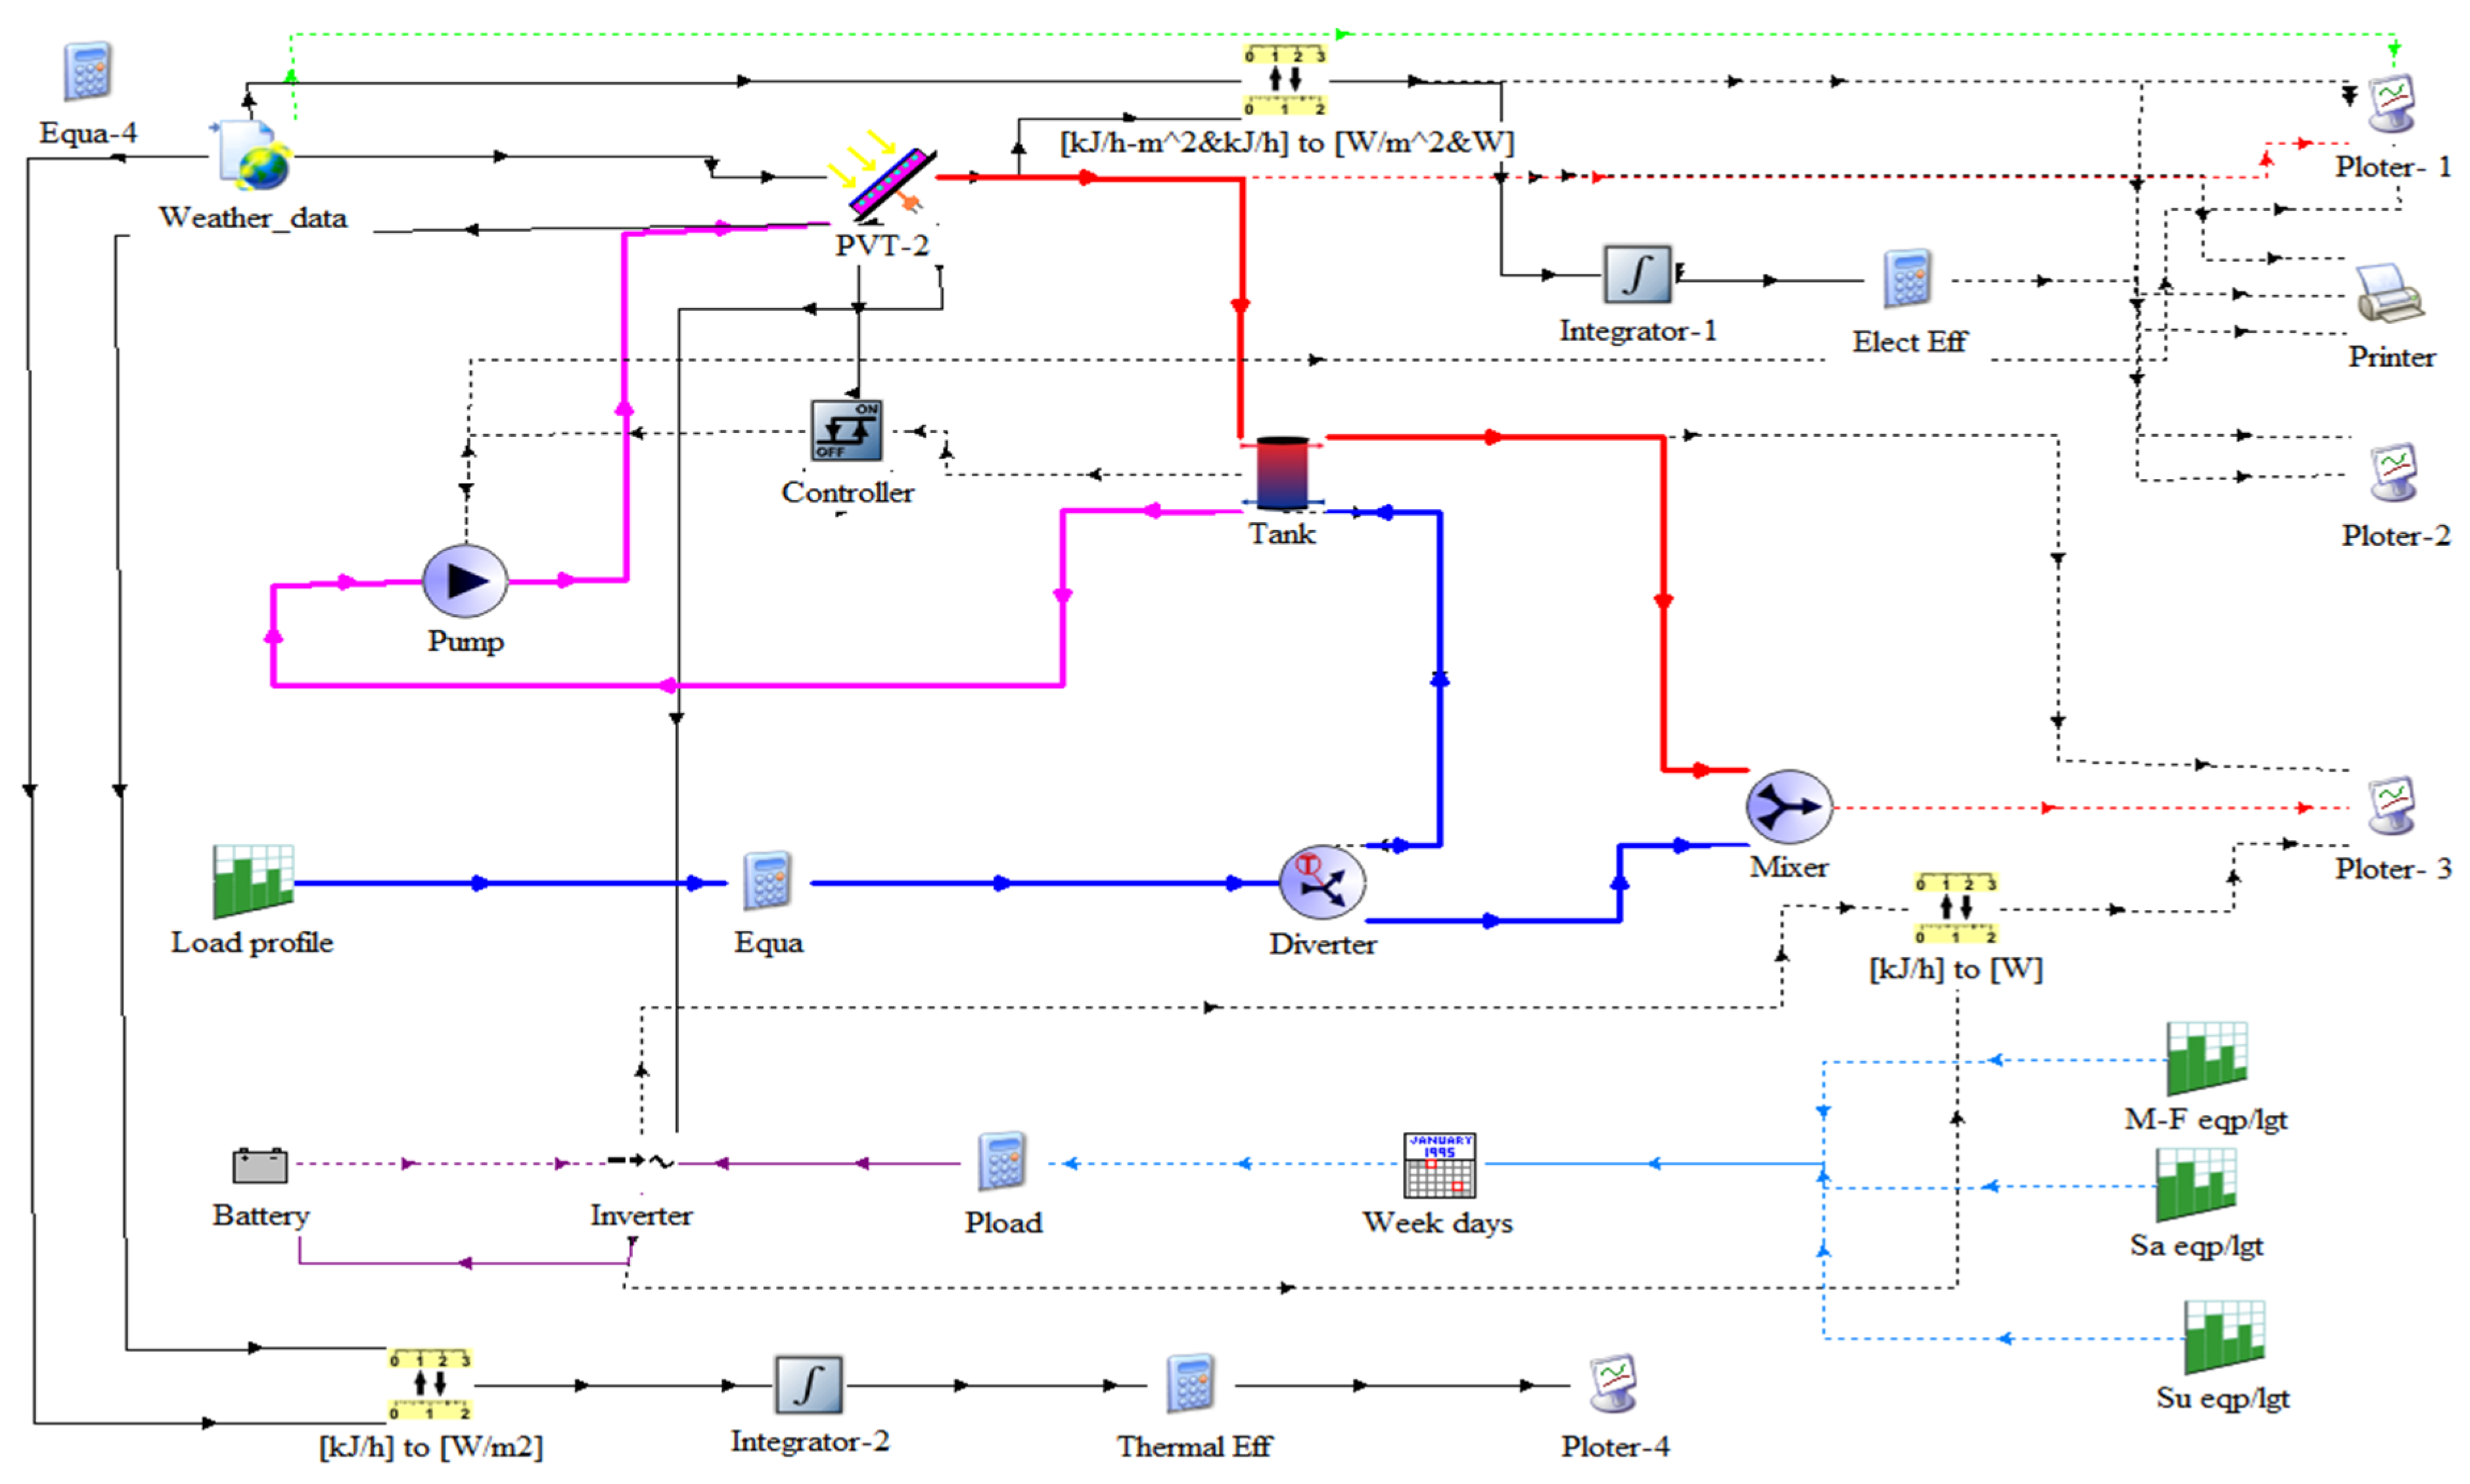
TRNSYS is a transient simulation software program that simulate the electrical and thermal behaviour of the PVT through the introduction of the meteorological weather data with solar irradiance, ambient temperature, and wind speed. TRNSYS 18 version of software was used for the modelling of the PVT system. The mathematical models of the components connected in the PVT are formulated as equations by FORTRAN code to make up its physical behaviour. The simulation time is set from 6:00am to 6:00pm daily for all the twelve (12) months in the year. The TRNSYS model for this study is shown in Figure 3.
Figure 3.
The TRNSYS model of PVT system.
Figure 3.
The TRNSYS model of PVT system.
A Polycrystalline (FT250Cs) PV module at standard test condition (STC) with irradiation of 1000W/m
2, ambient temperature of 25
oC and Air Mass of AM1.5 is used in the design. The parameters of the PV panel used in the simulation are shown in
Table 1.
This paper investigates the potentials and benefits of using PVT technology in sub-Saharan climate such as Nigeria in the West African region, which have not extensively studied. The three sites chosen for comparative study are: Maiduguri in the North-East, Makurdi in the North-central and Port Harcourt in the South-South of the country. The system simulates the performance of PVT in terms of electricity and hot water production in the selected regions in the country.
A typical off-gride households in developing countries could have an average domestic hot water demand of 5.6L per person per day which is about 28L per day for a four-person household. While in developed countries would be 30L per person per day or 120L per day for a four-person household [
21]. A 200L tank to produced hot water for a family of four estimated at 50liters per person with flowrate at 100L/h was selected by experimenting different flowrate from 10L/h to 200L/h.
3. Simulation Results and Analysis
3.1. Solar Radiation and Ambient Temperature of the Three Cities Understudy
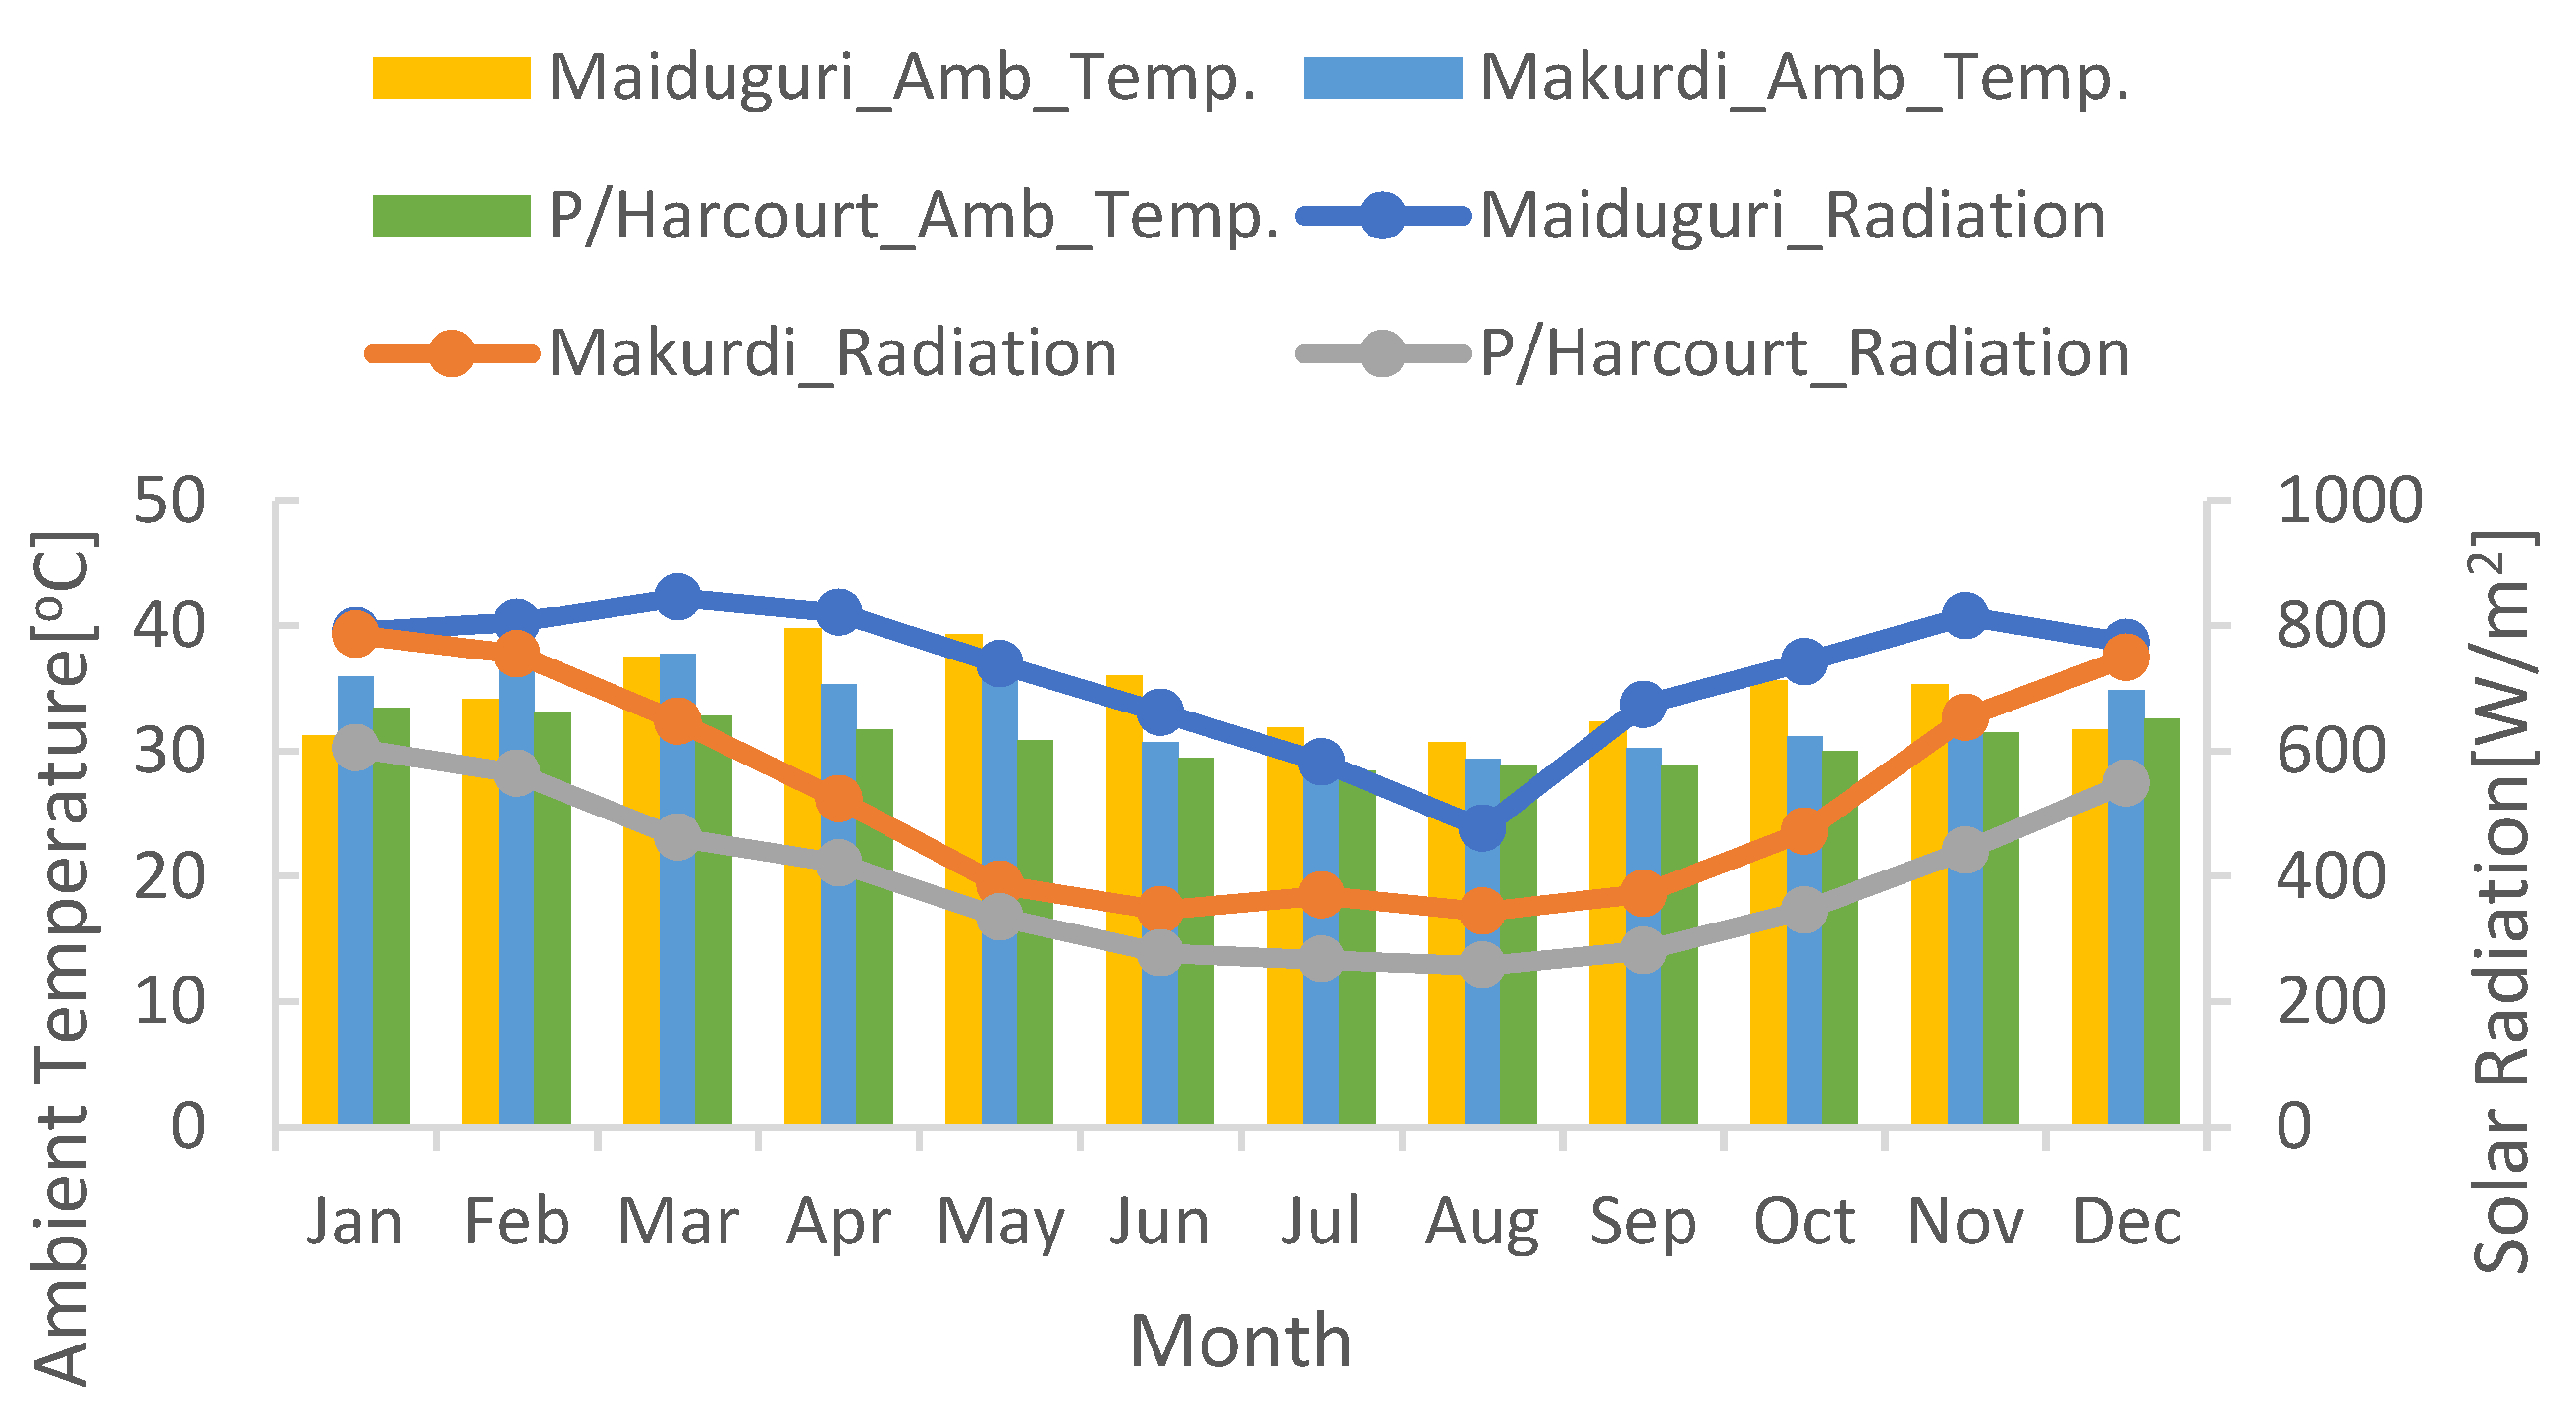
The output performance of PV panel is directly proportional with the rate of irradiation presence at a particular area. The surface temperature of PV and the ambient temperature of a place are radiation parameters. The higher the solar radiation of a place, the higher the output power of the PV system and the higher the PV surface temperature. Higher ambient temperature lowers the efficiency of the PV panel. Figure 4 shows the ambient temperature and solar radiations in the three cities in Nigeria.
Figure 4.
Solar radiation and ambient temperature of the three cities in Nigeria.
Figure 4.
Solar radiation and ambient temperature of the three cities in Nigeria.
3.2. Electrical Power Outputs of the System
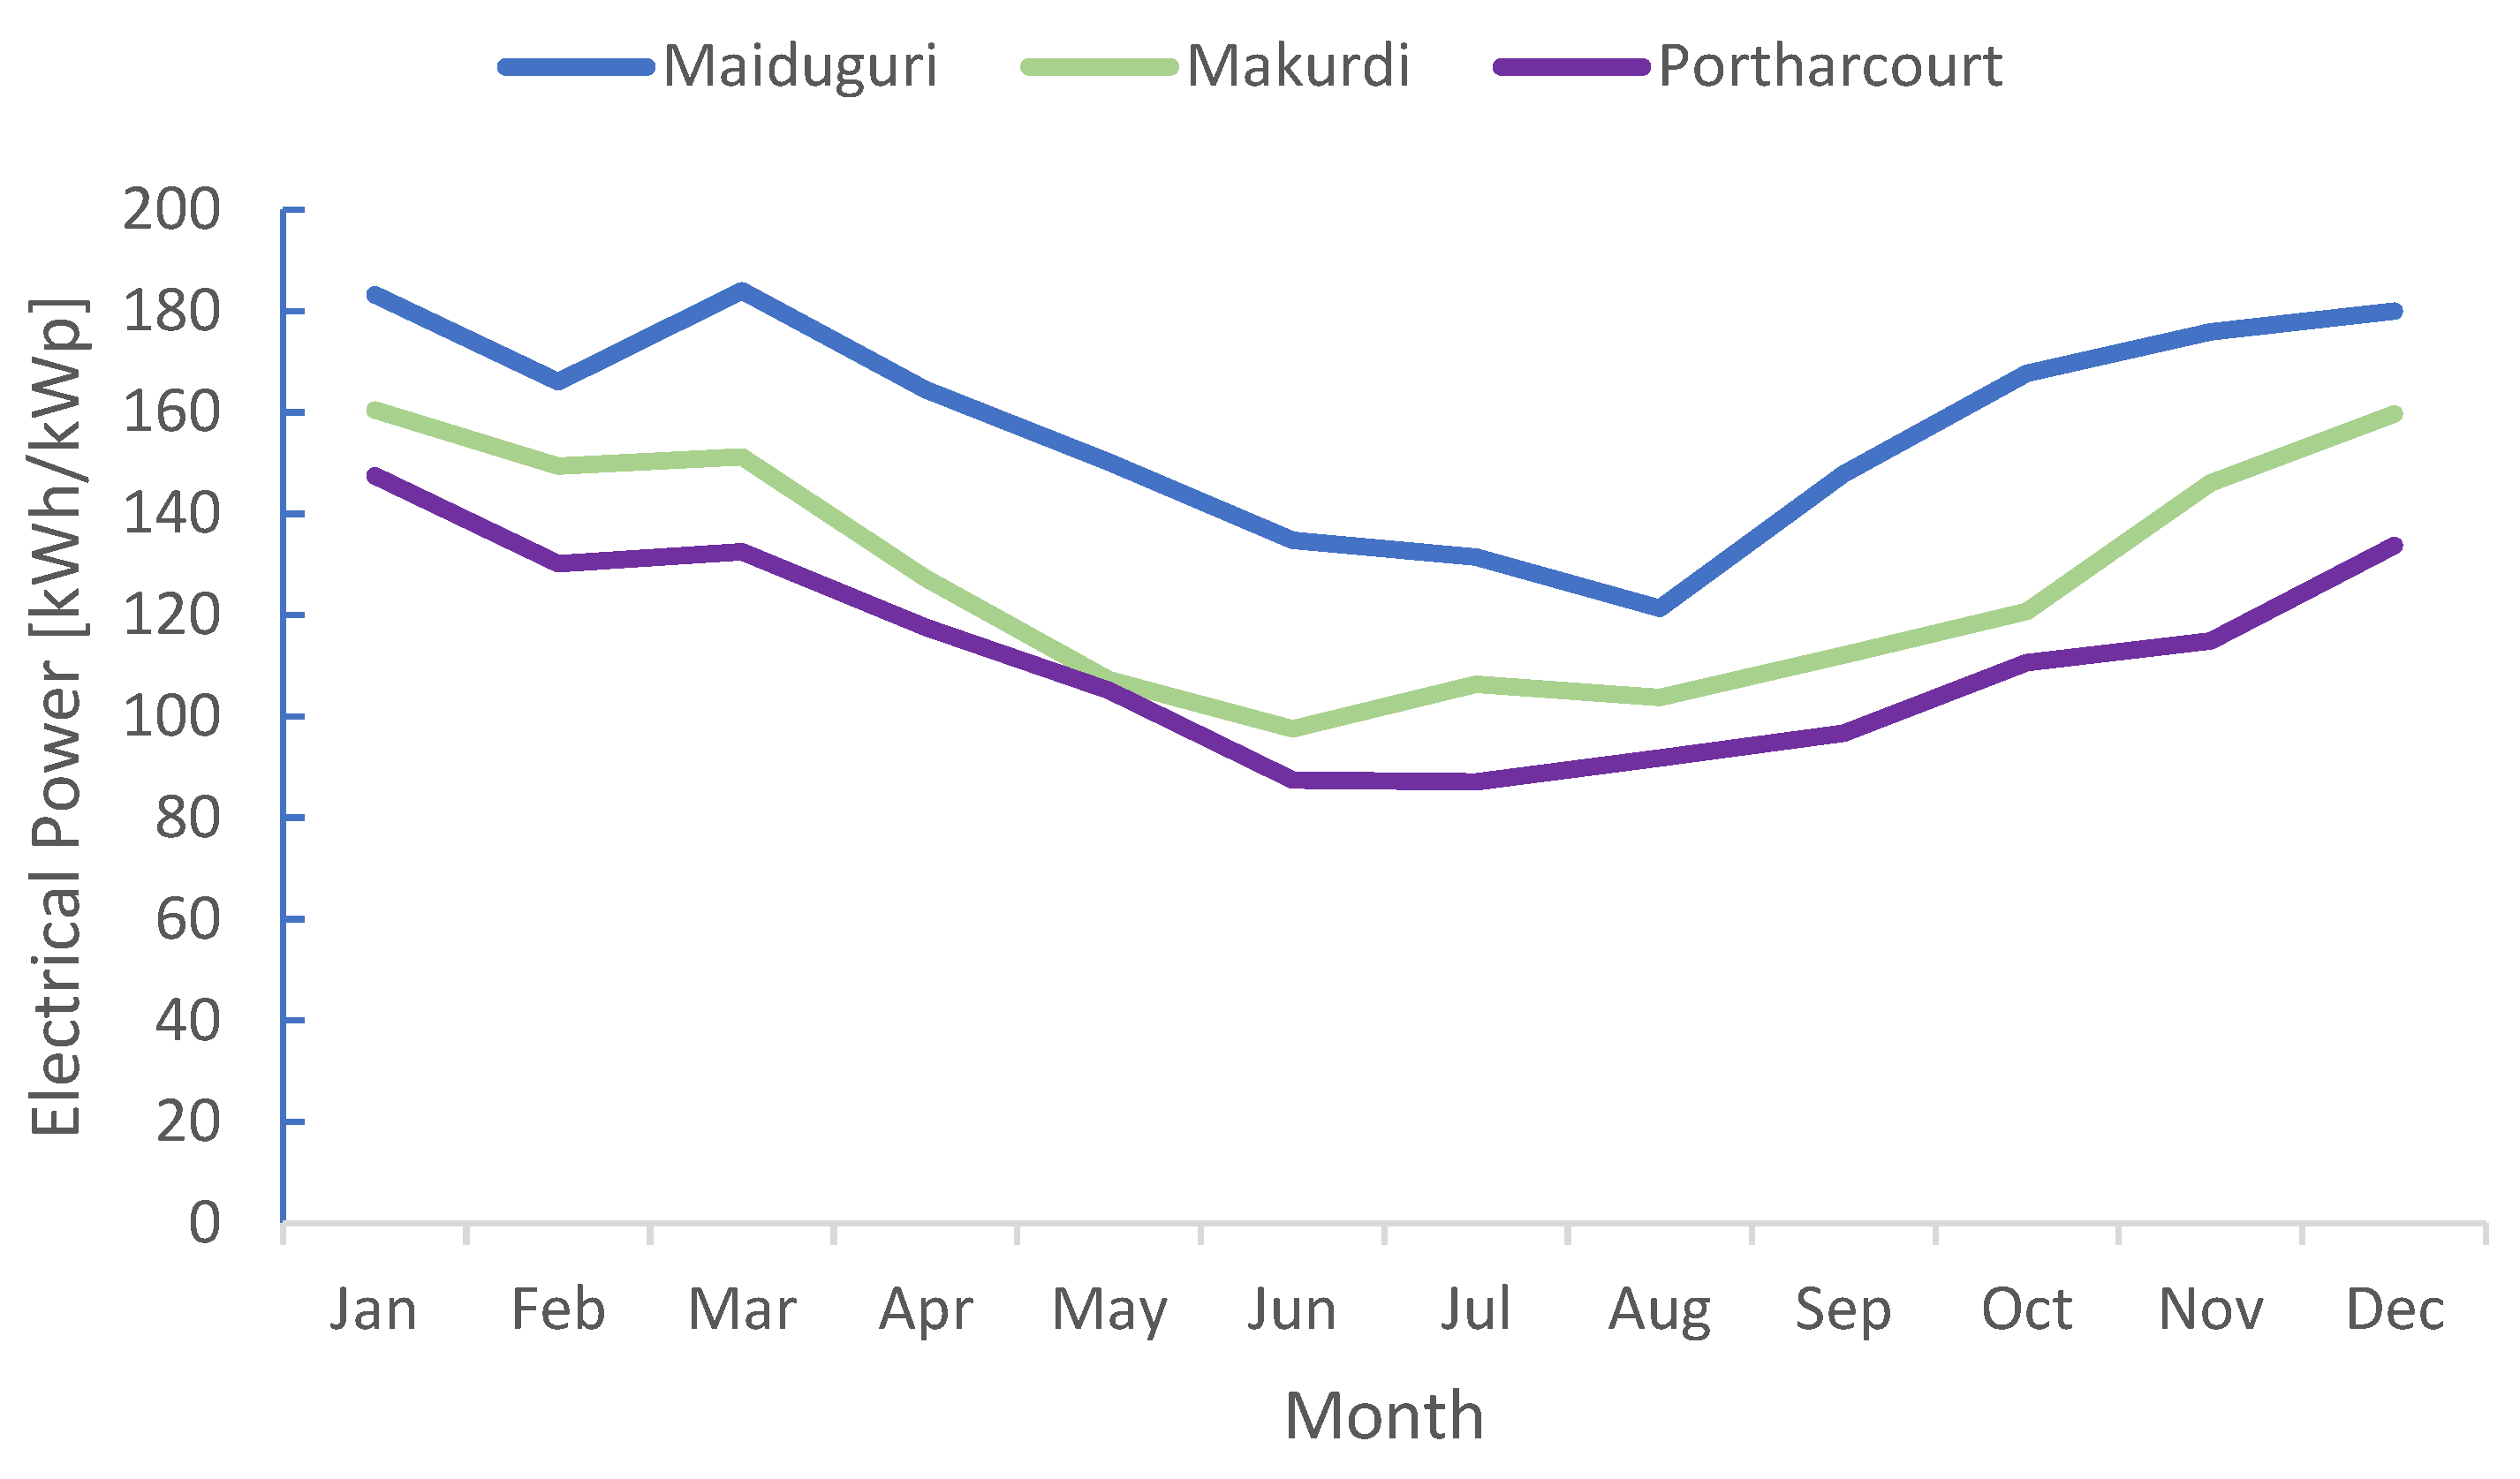
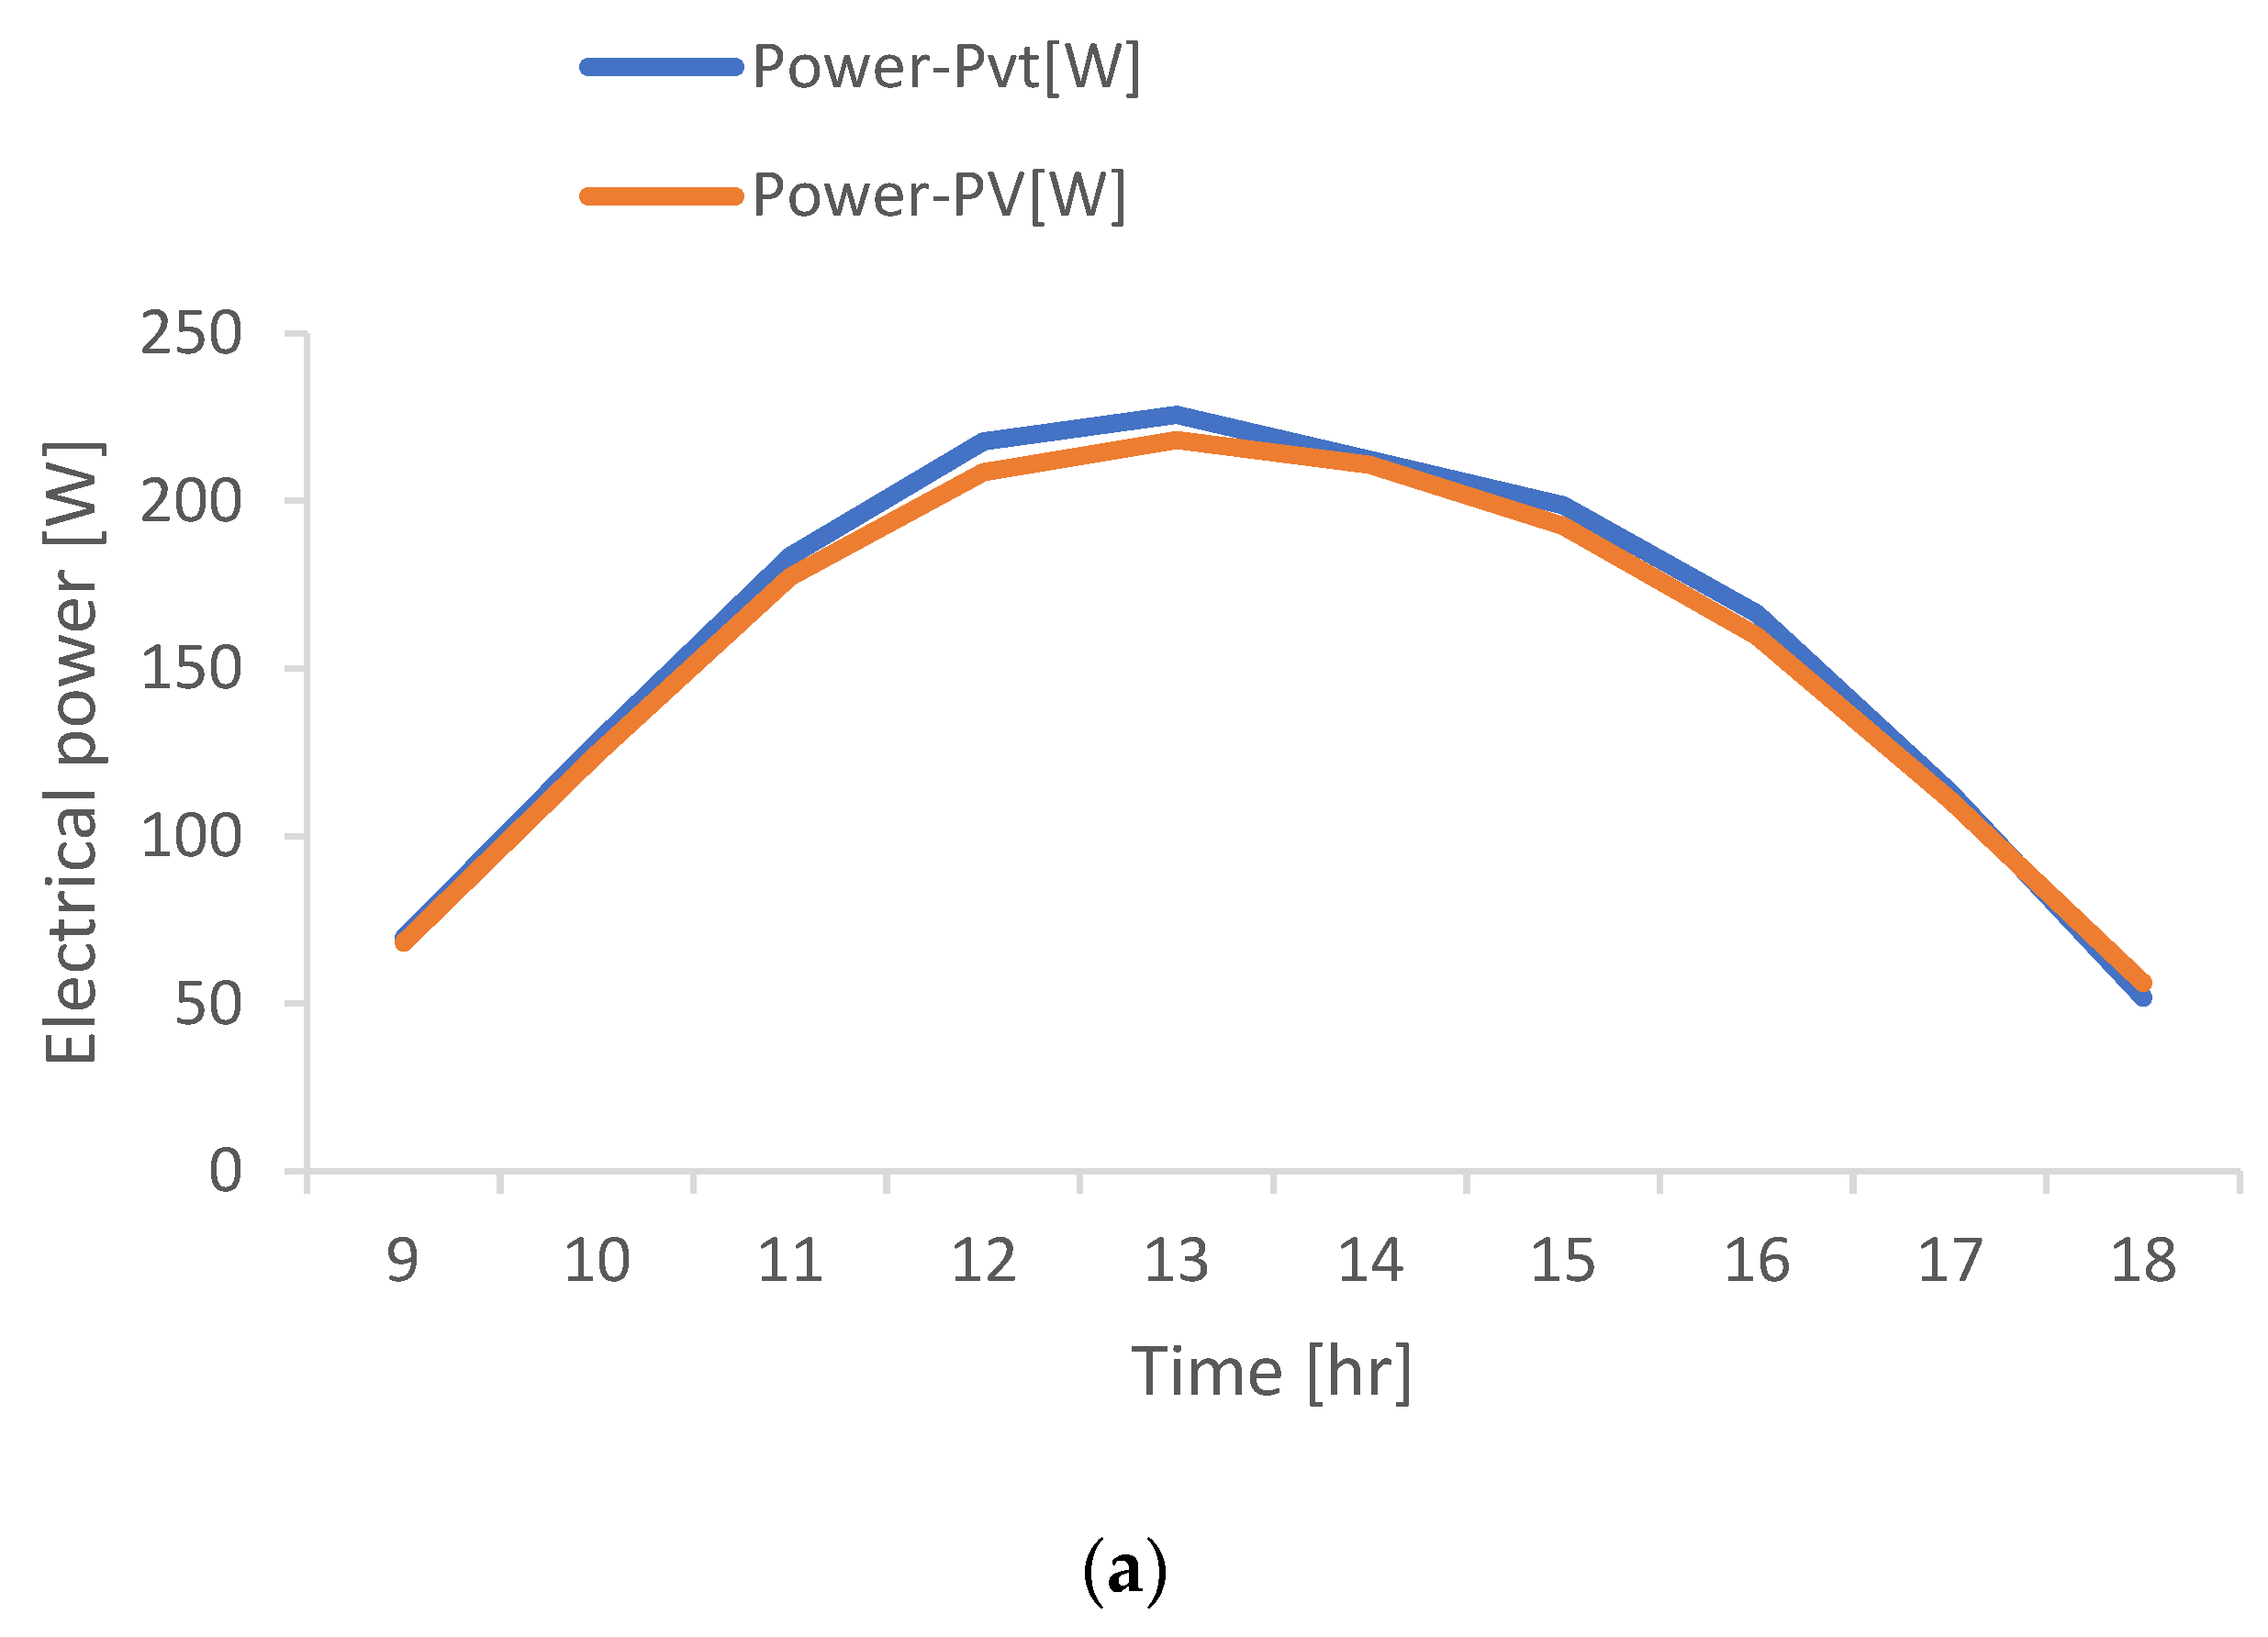
The combine results of the three cities under study in Nigeria show results of electrical power production, Maiduguri having the highest peak power and total annual electrical power output of 184.02kWh/kWp and 1906.87kWh/kWp respectively, which signifying higher solar irradiation in the region. Makurdi producing the second highest peak power and total annual electrical power of 160.5kWh/kWp and 1541.82kWh/kWp respectively. And for Port Harcourt, the lowest peak power and total annual electrical power yield of 147.53kWh/kWp and 1355.16kWh/kWp respectively is produced which signified low solar irradiation in the region. This total annual electrical power output differences by the PVT in the country was confirmed by the study of Adun et al. [
18]. Figure 5 present the monthly peak electrical power outputs of the three cities understudy.
Figure 5.
Monthly peak electrical power yield in three cities in Nigeria.
Figure 5.
Monthly peak electrical power yield in three cities in Nigeria.
3.3. Thermal Output of the System
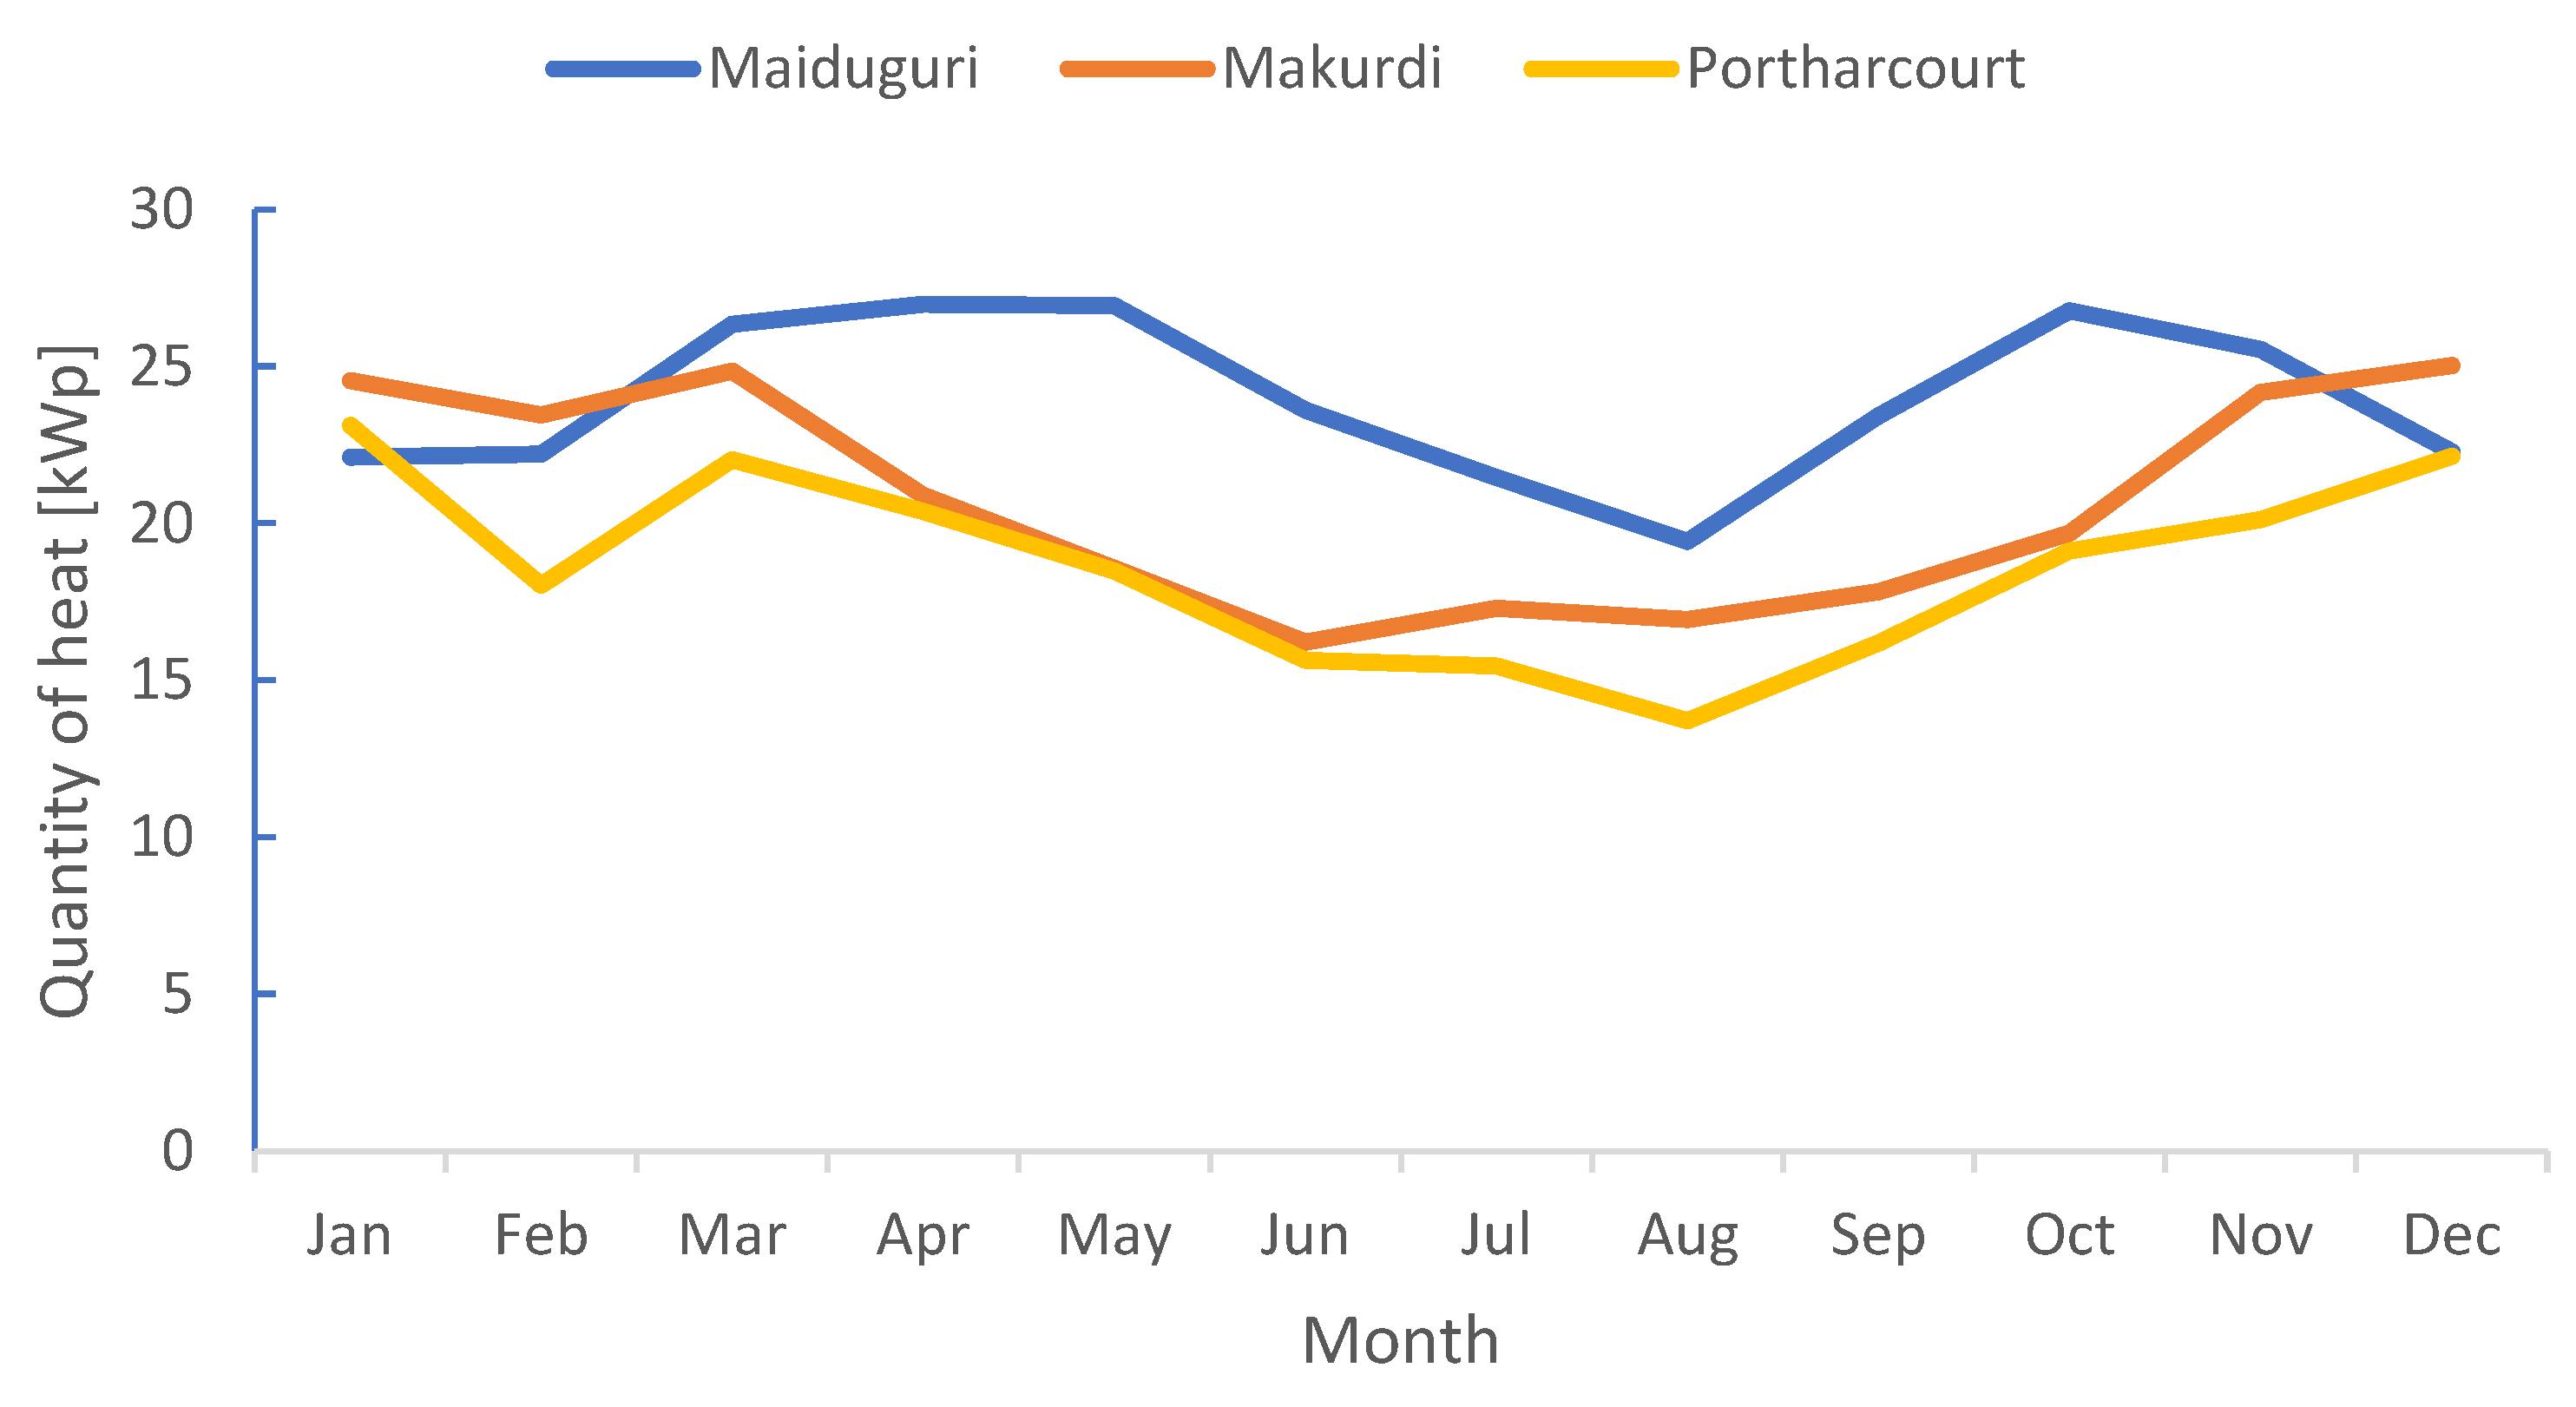
The thermal outputs in Figure 6 shows Maiduguri producing the highest peak thermal and total annual thermal of 26.99kWp and 287.09kWp respectively. Makurdi having peak thermal and annual thermal output of 25.03kWp and 249.47kWp respectively. While Port Harcourt again having lowest peak thermal and total annual thermal output of 23.13kWp and 224.44kWp respectively because of low solar radiation and the ambient temperature which is depicted in Figure 4.
Figure 6.
Monthly peak thermal outputs generated in the three cities in Nigeria.
Figure 6.
Monthly peak thermal outputs generated in the three cities in Nigeria.
3.4. Electrical Efficiency of the System
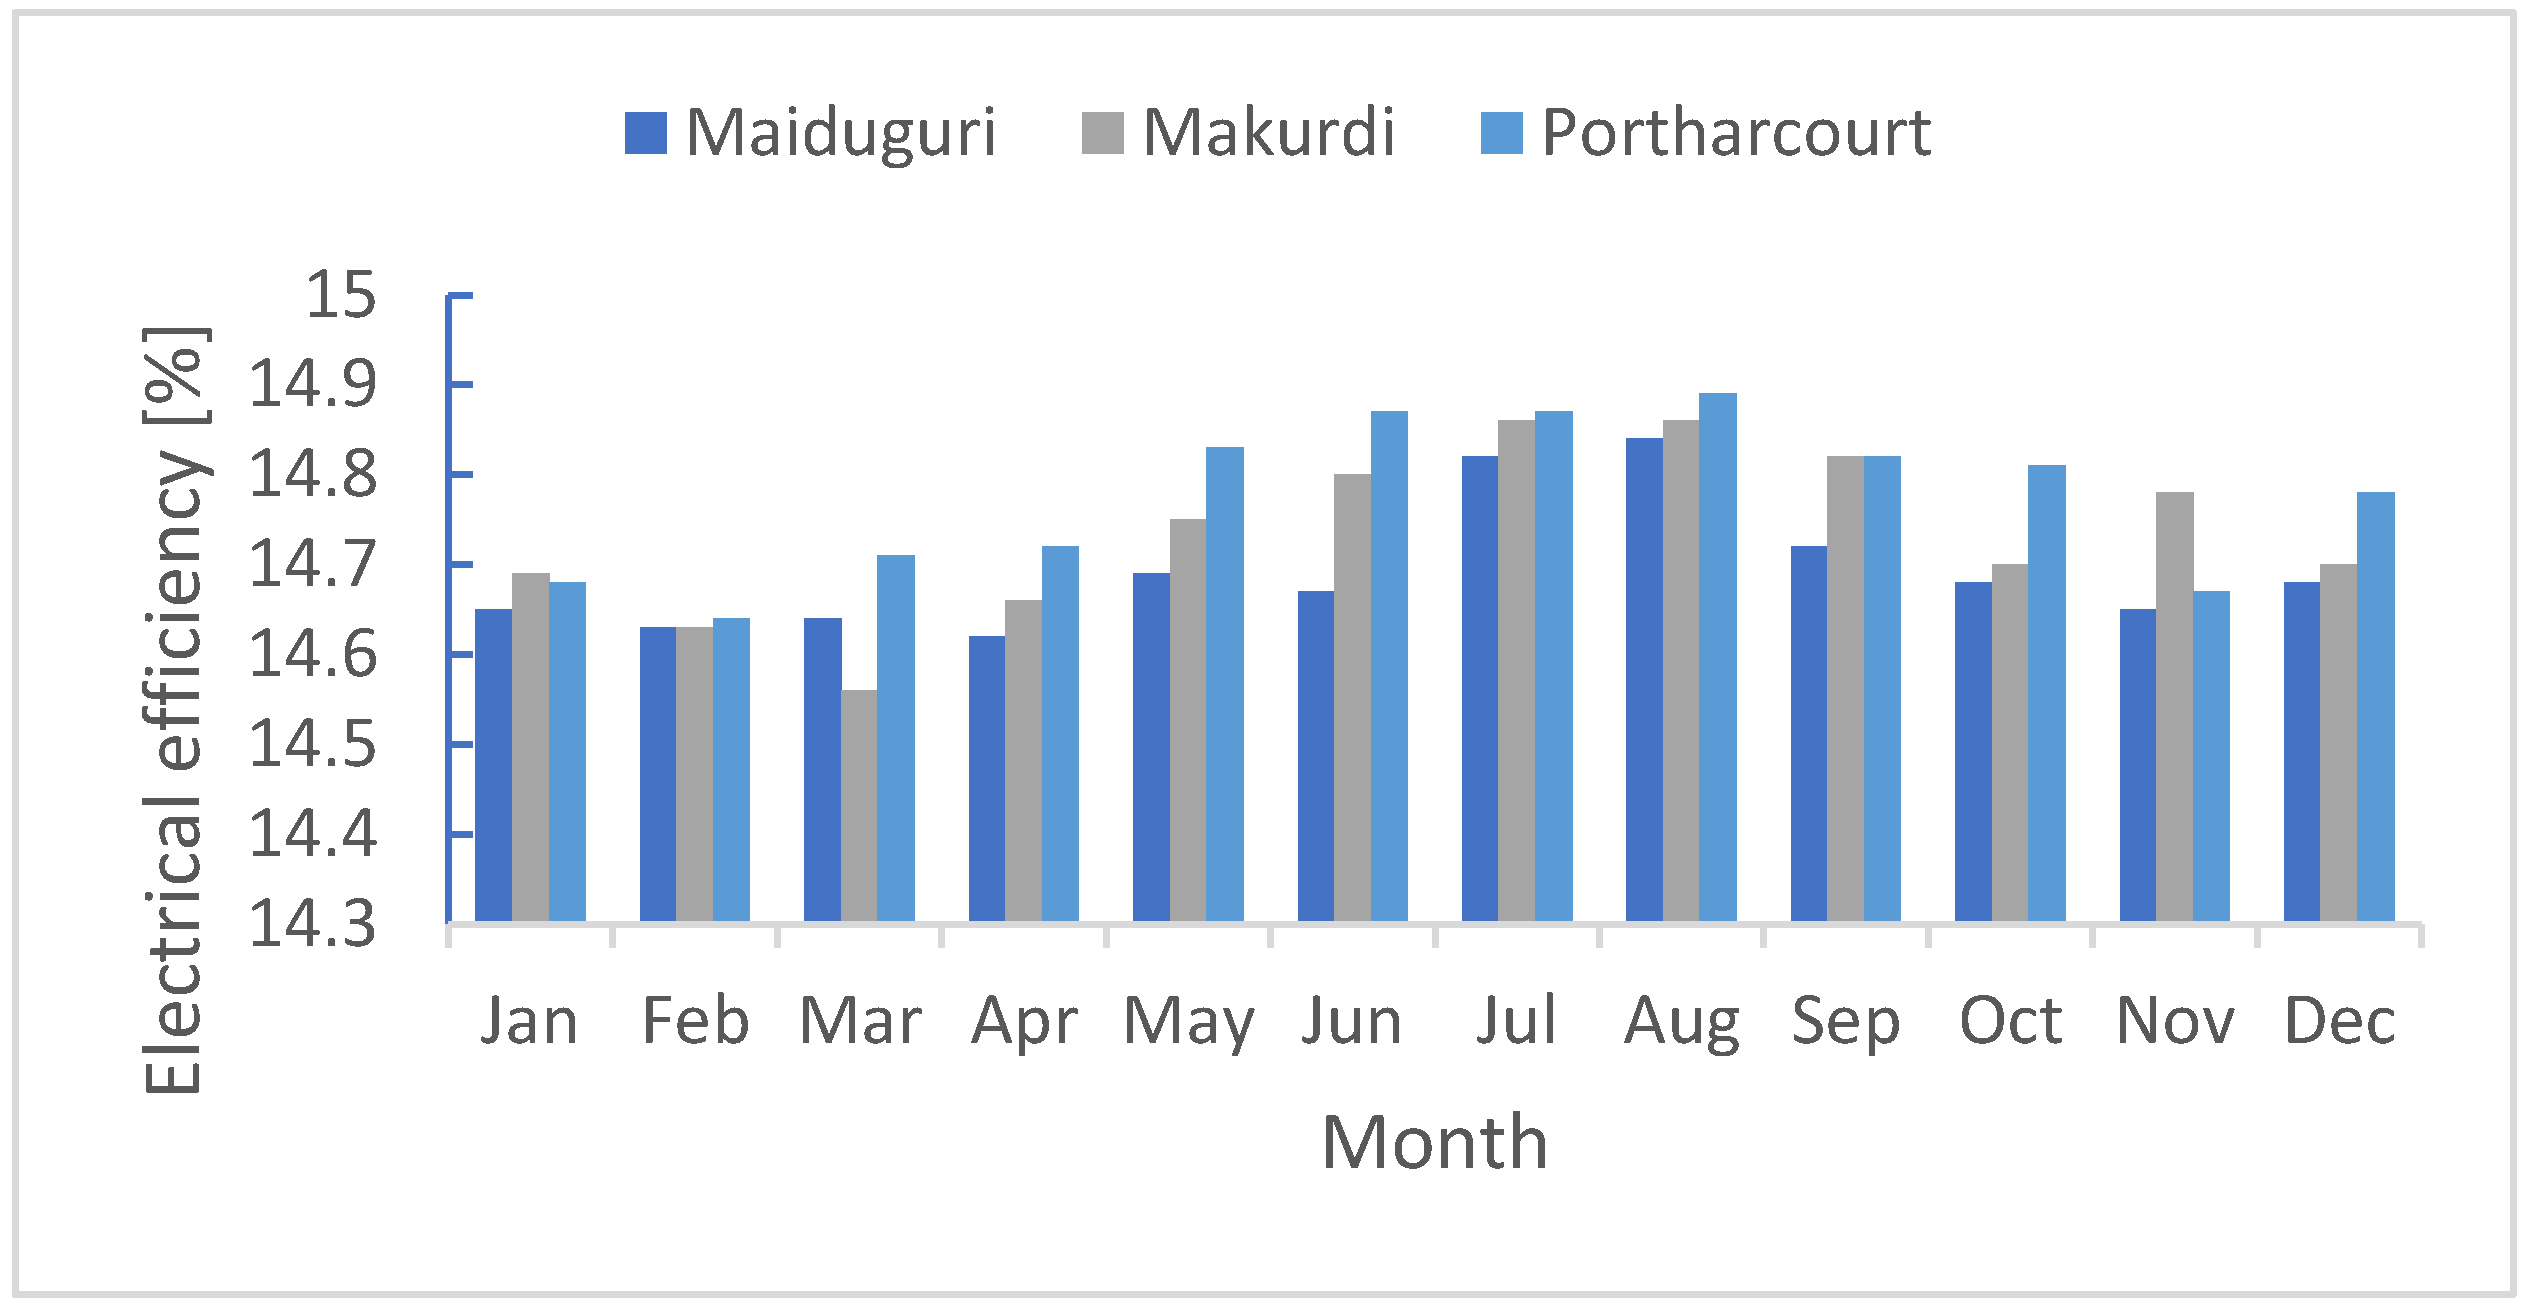
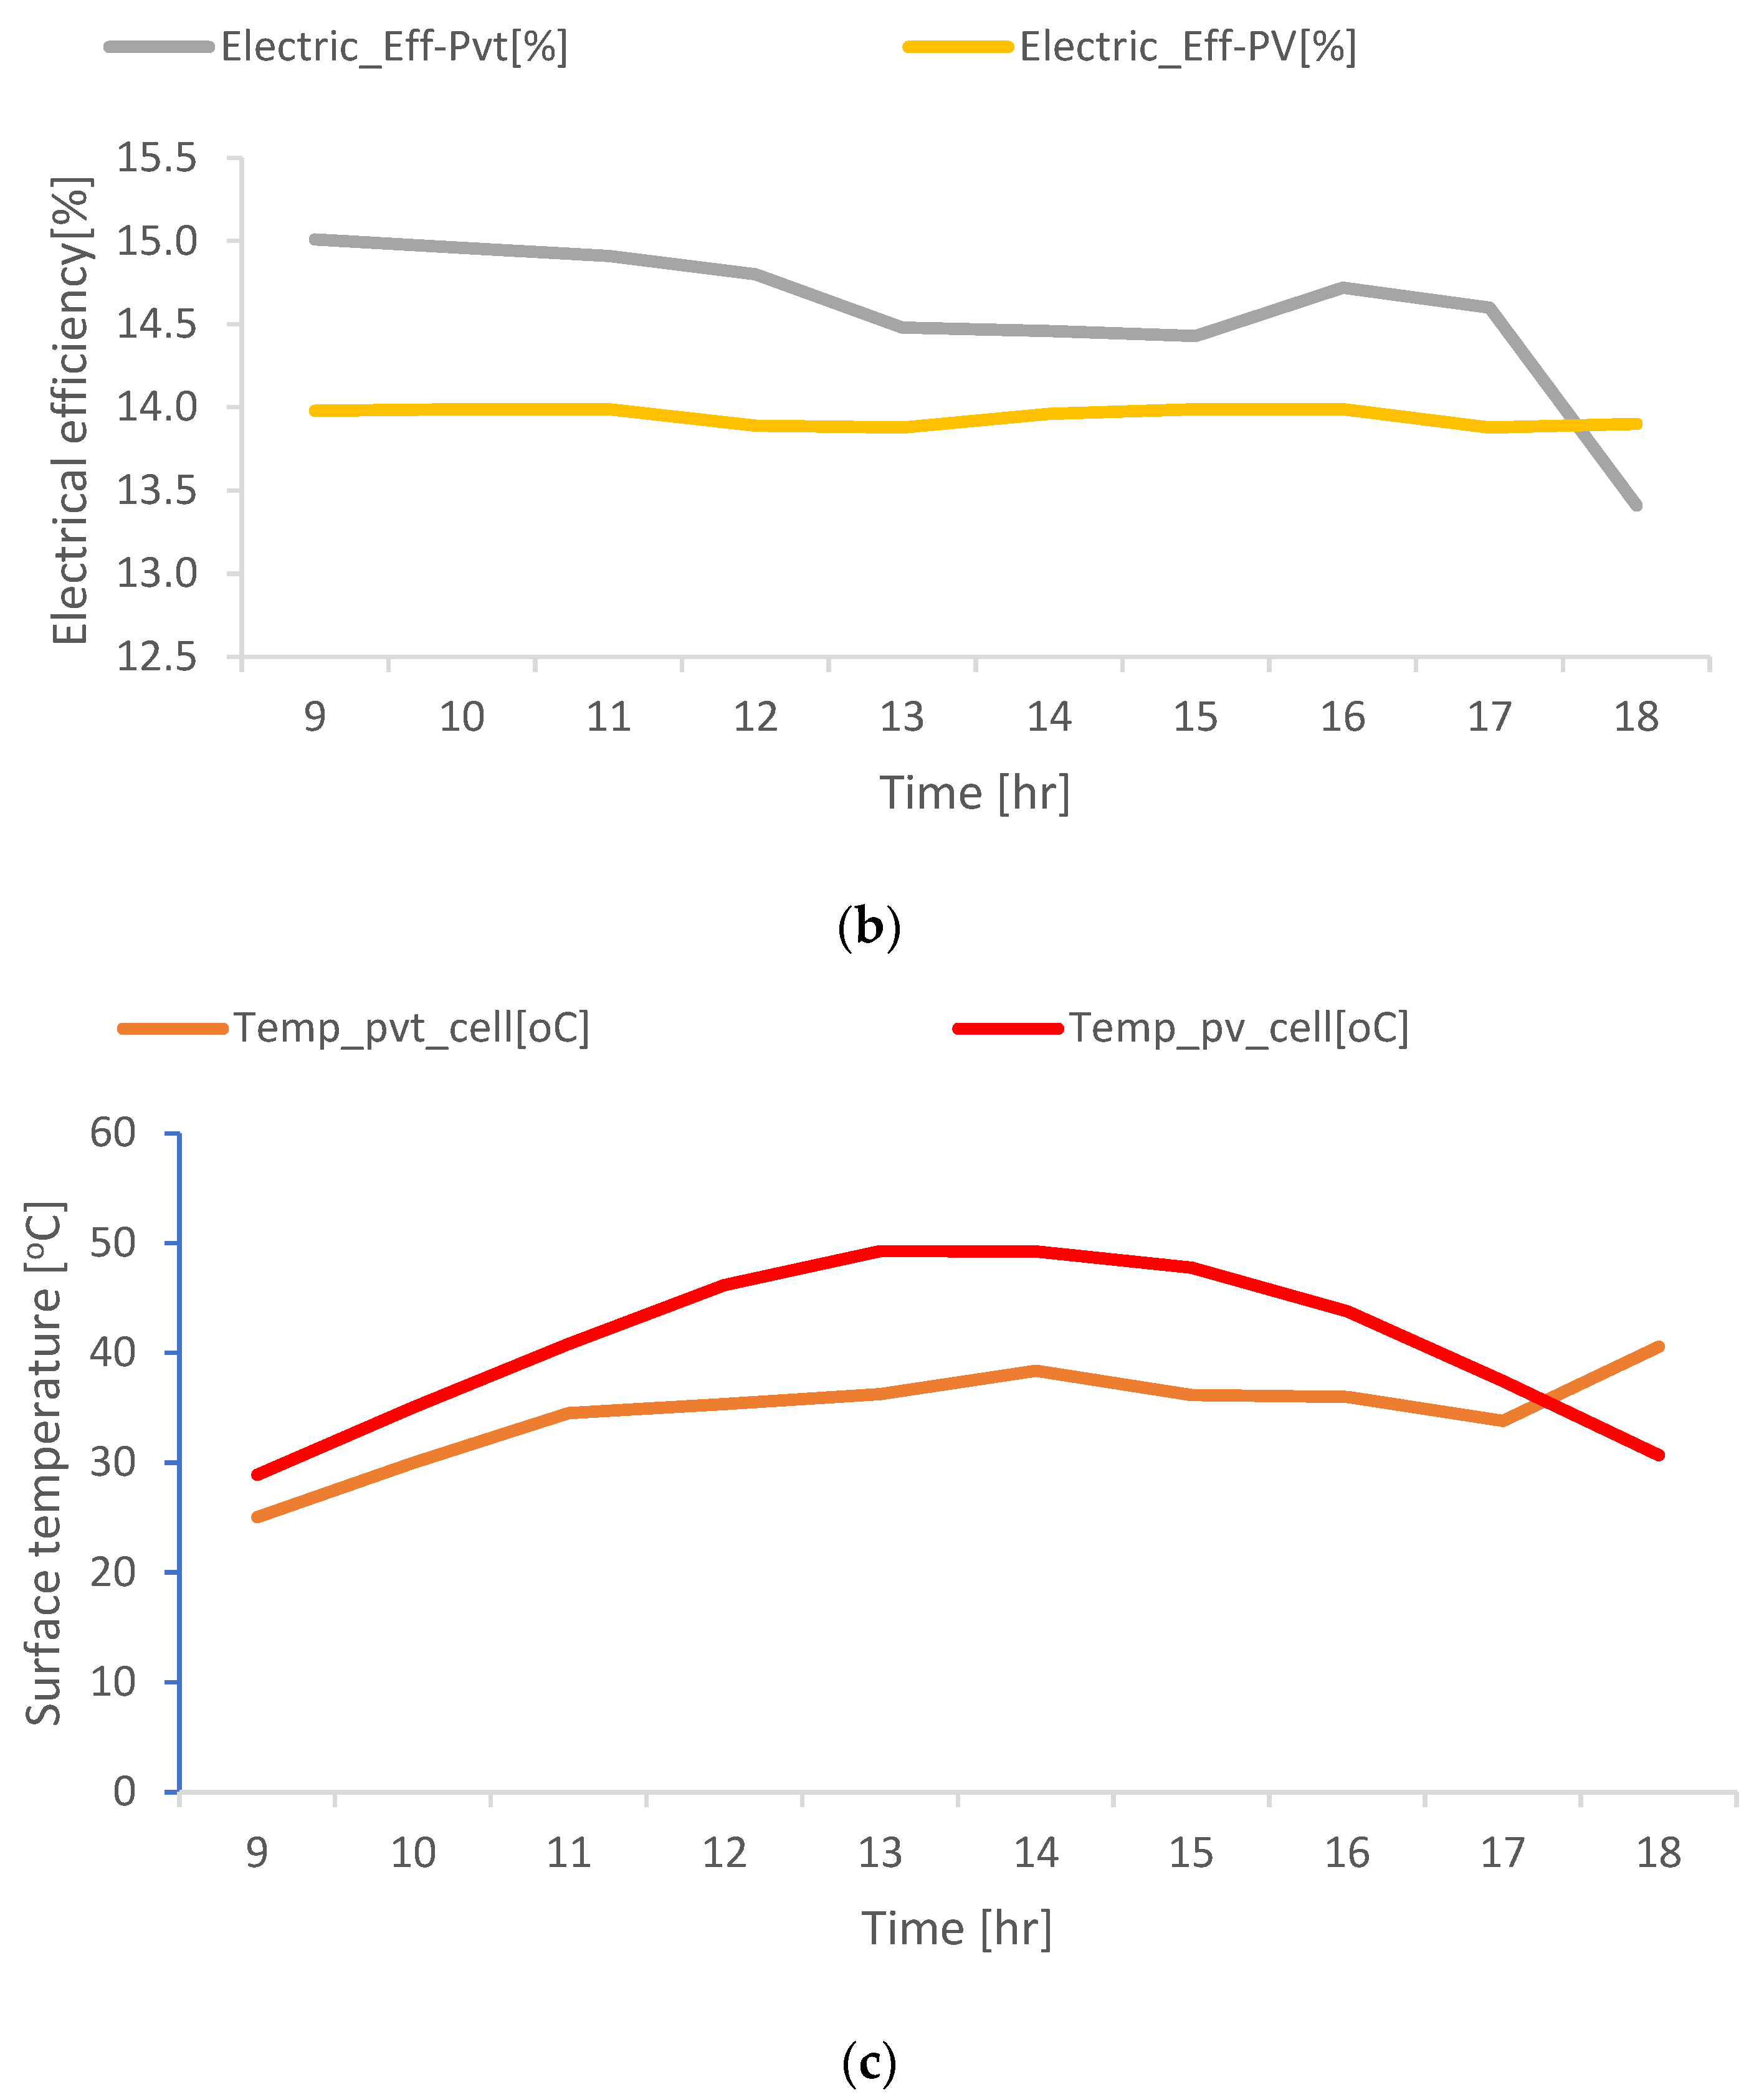
The electrical efficiency of the three cities shows Port Harcourt having the highest monthly average electrical efficiency peak of 14.89% because of low radiation and low ambient temperature which contribute to less PV surface temperature. Makurdi with second highest monthly average electrical efficiency peak of 14.87% and the least is Maiduguri with monthly average electrical efficiency peak of 14.84% because of high solar radiation and high ambient temperature which produced high PV surface temperature in the region. Figure 7 shows the monthly average electrical efficiency of the three cities understudy.
Figure 7.
Monthly average electrical efficiencies of the three cities in Nigeria.
Figure 7.
Monthly average electrical efficiencies of the three cities in Nigeria.
3.4. Thermal Efficiency of the System
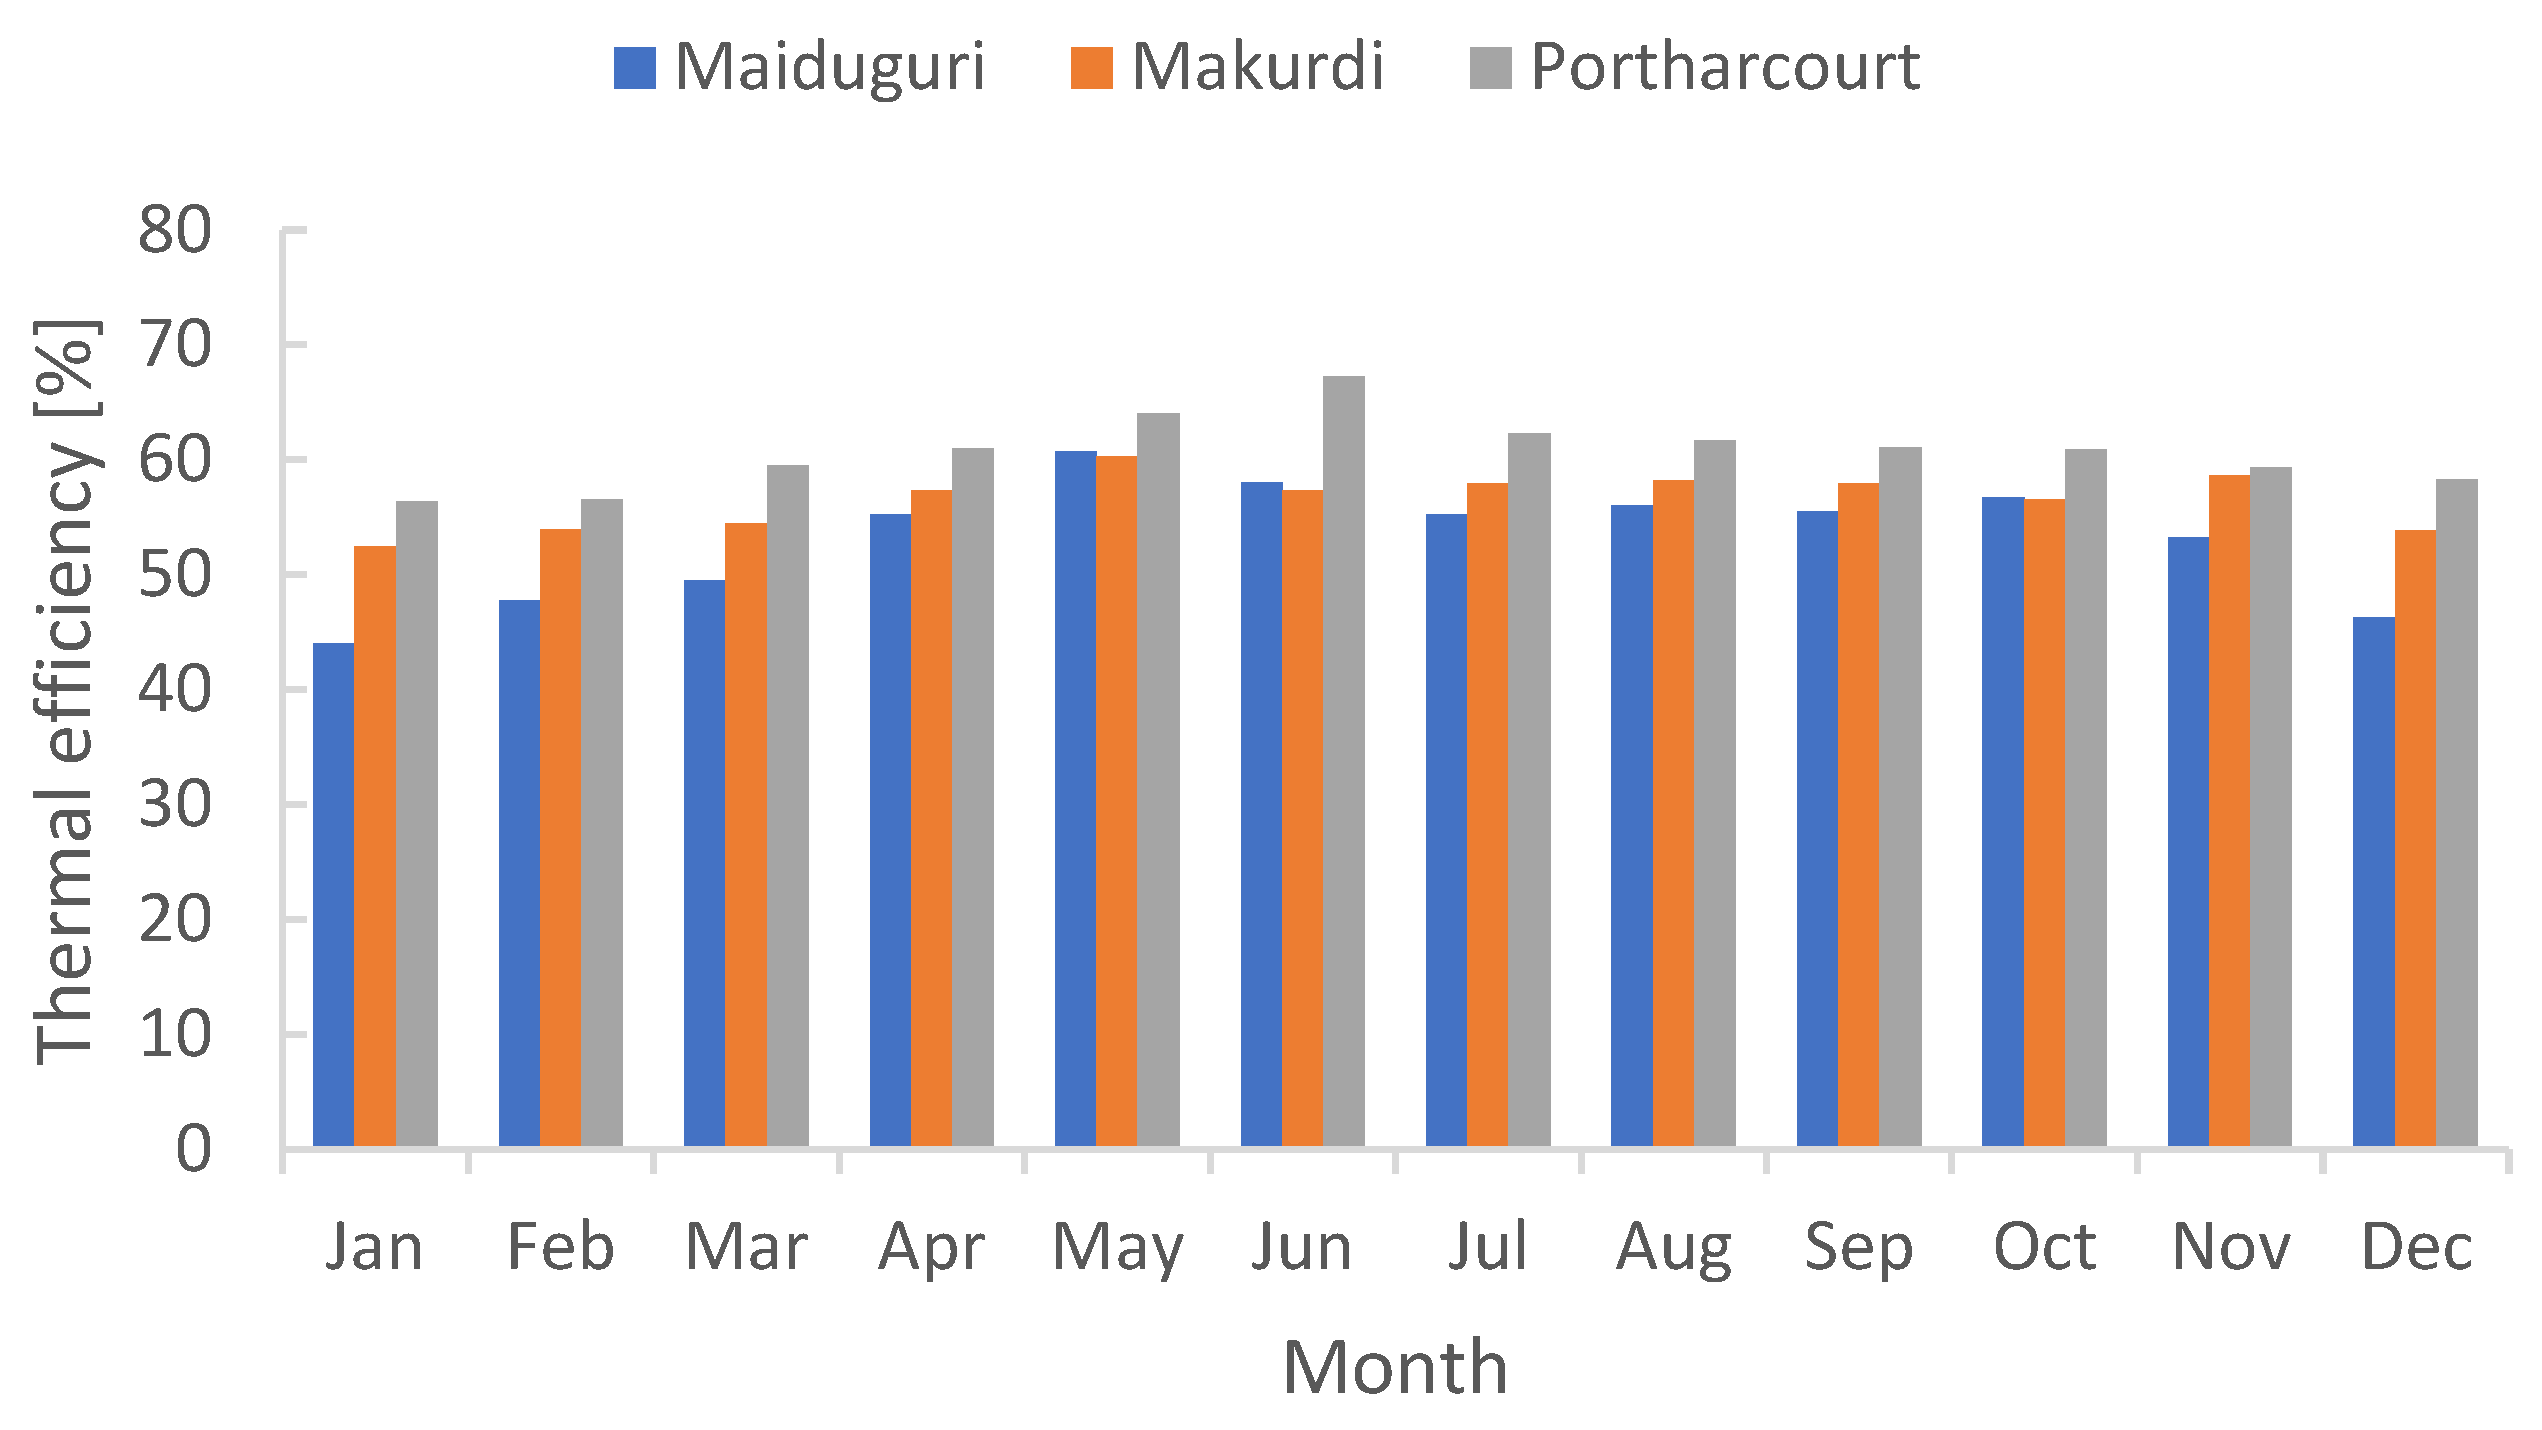
Figure 8, shows the monthly average thermal efficiency of the three cities, presenting Port Harcourt with the highest thermal efficiency of 67.23%. Makurdi with the second highest thermal efficiency peak of 60.26 and for Maiduguri, the lowest thermal efficiency peak of 58.65% is recorded Maiduguri respectively.
Figure 8.
Monthly average thermal efficiencies of the three cities in Nigeria.
Figure 8.
Monthly average thermal efficiencies of the three cities in Nigeria.
3.4. Outlet Fluid Temperature from PVT
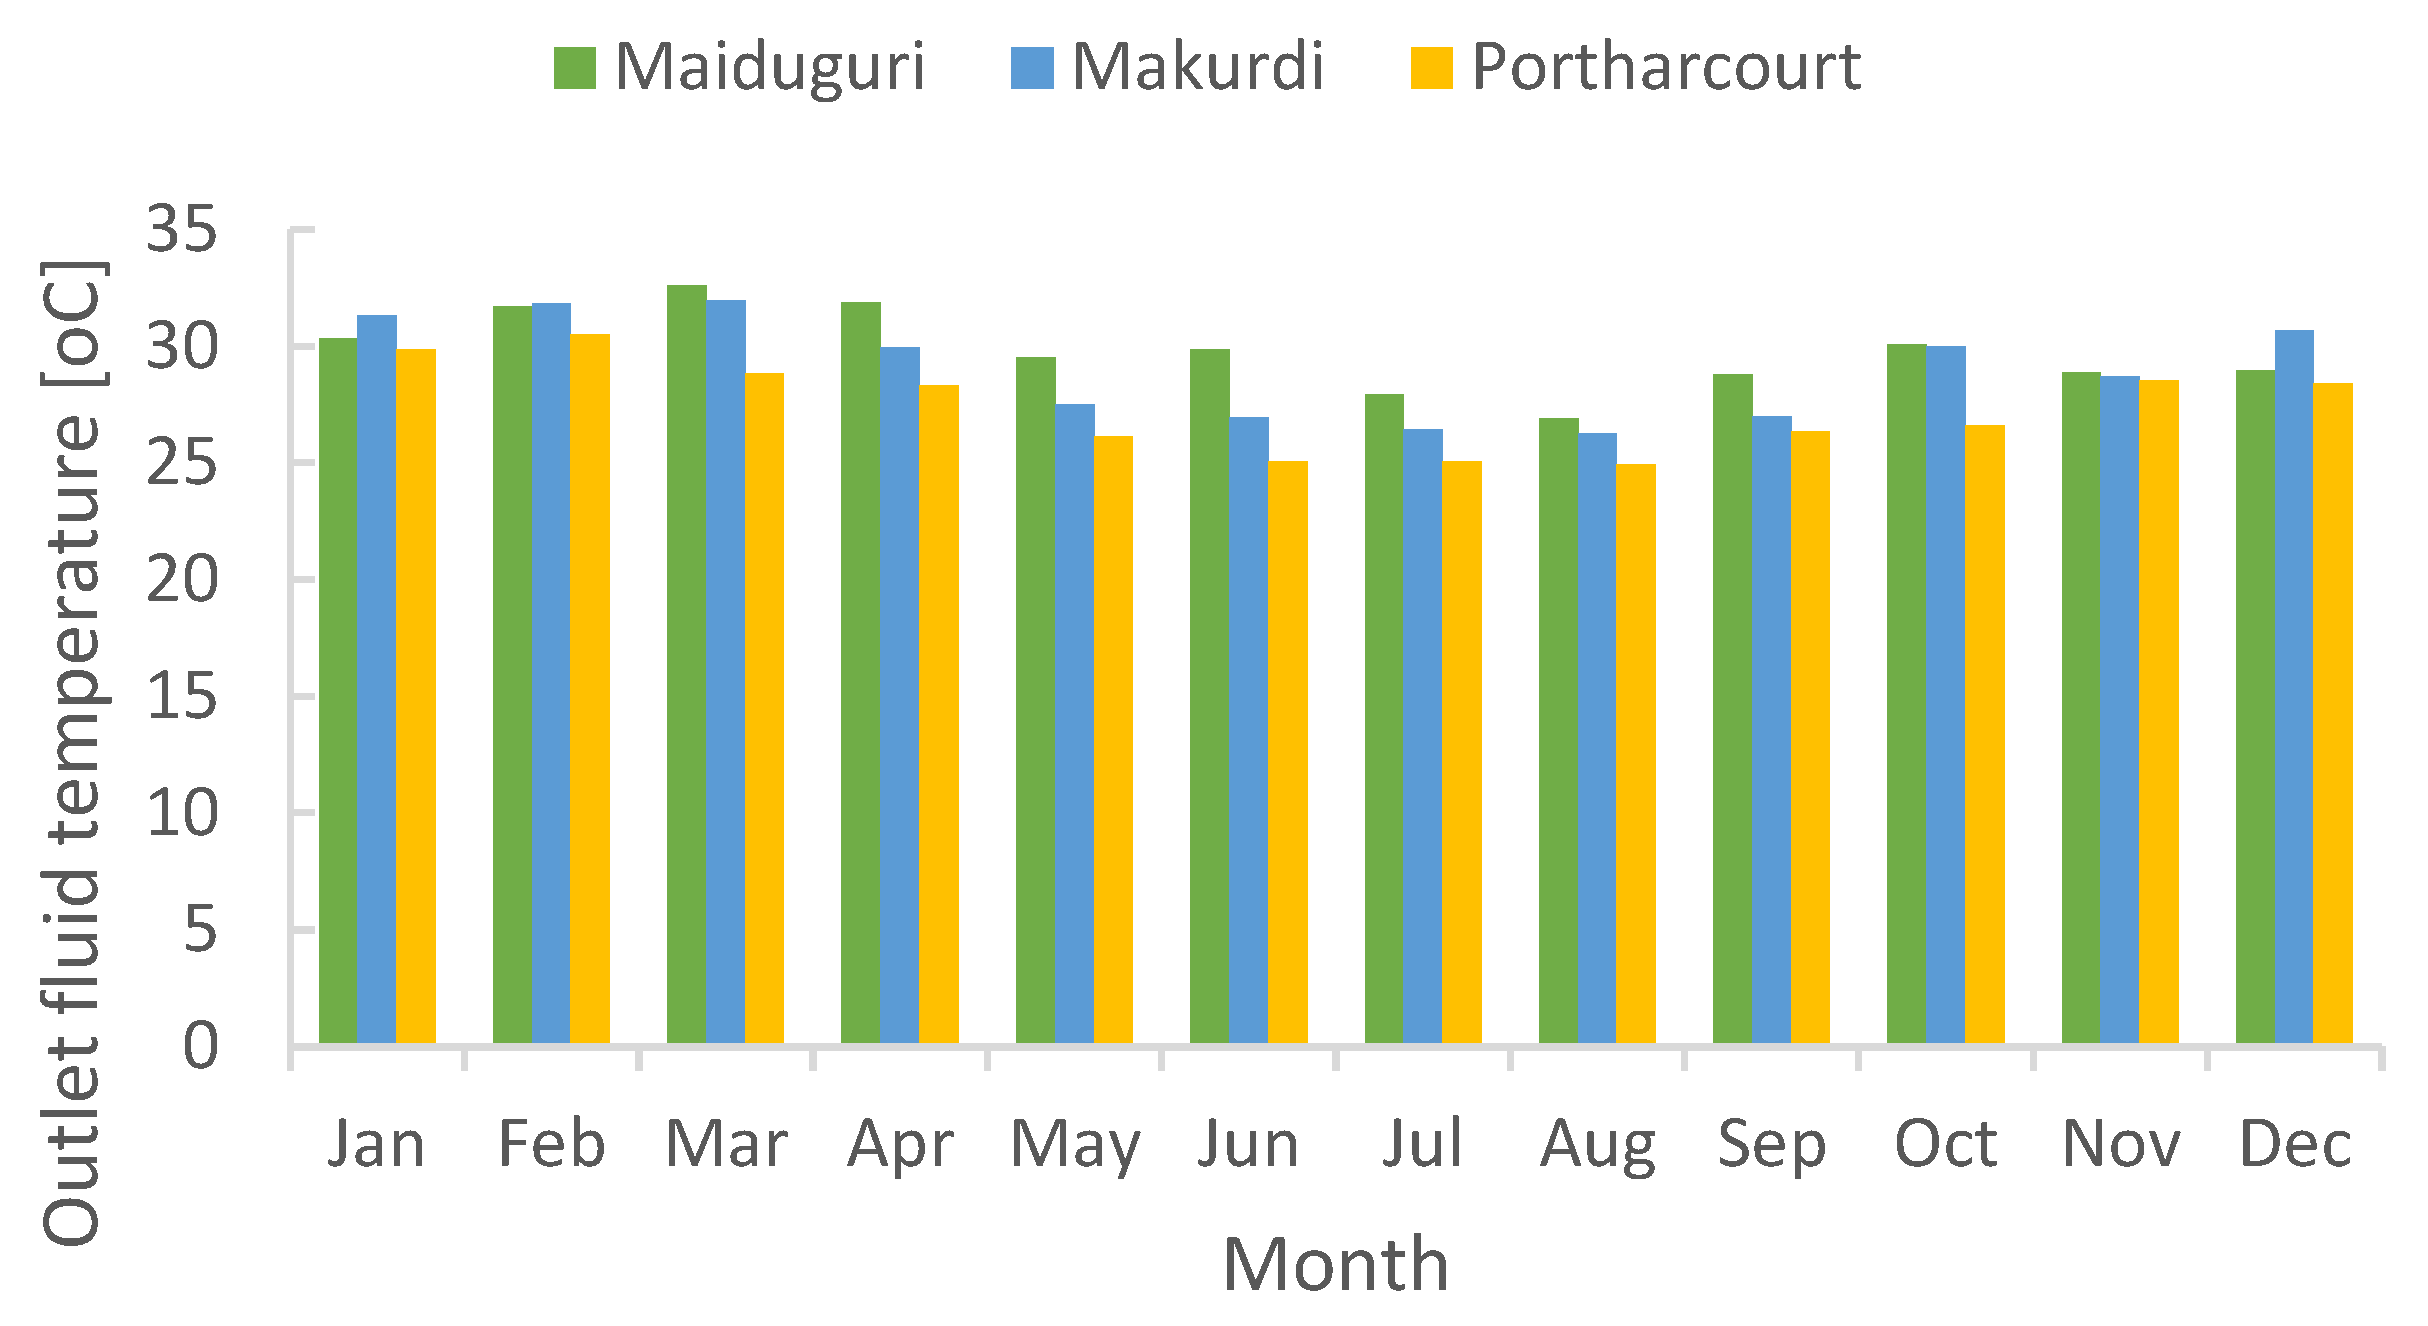
Maiduguri recorded a monthly average fluid outlet temperature of 29.79oC, while Makurdi record 29.04oC and for Port Harcourt, 27.38oC is the monthly average outlet temperature. Figure 9 shows Maiduguri with the highest outlet fluid temperature against the rest of the cities and is because of variation in radiation and ambient temperature that exist between the three cities as shown in Figure 4.
Figure 9.
Monthly average outlet fluid temperatures of the three cities in Nigeria.
Figure 9.
Monthly average outlet fluid temperatures of the three cities in Nigeria.
3.4. PV Cell Surface Temperature
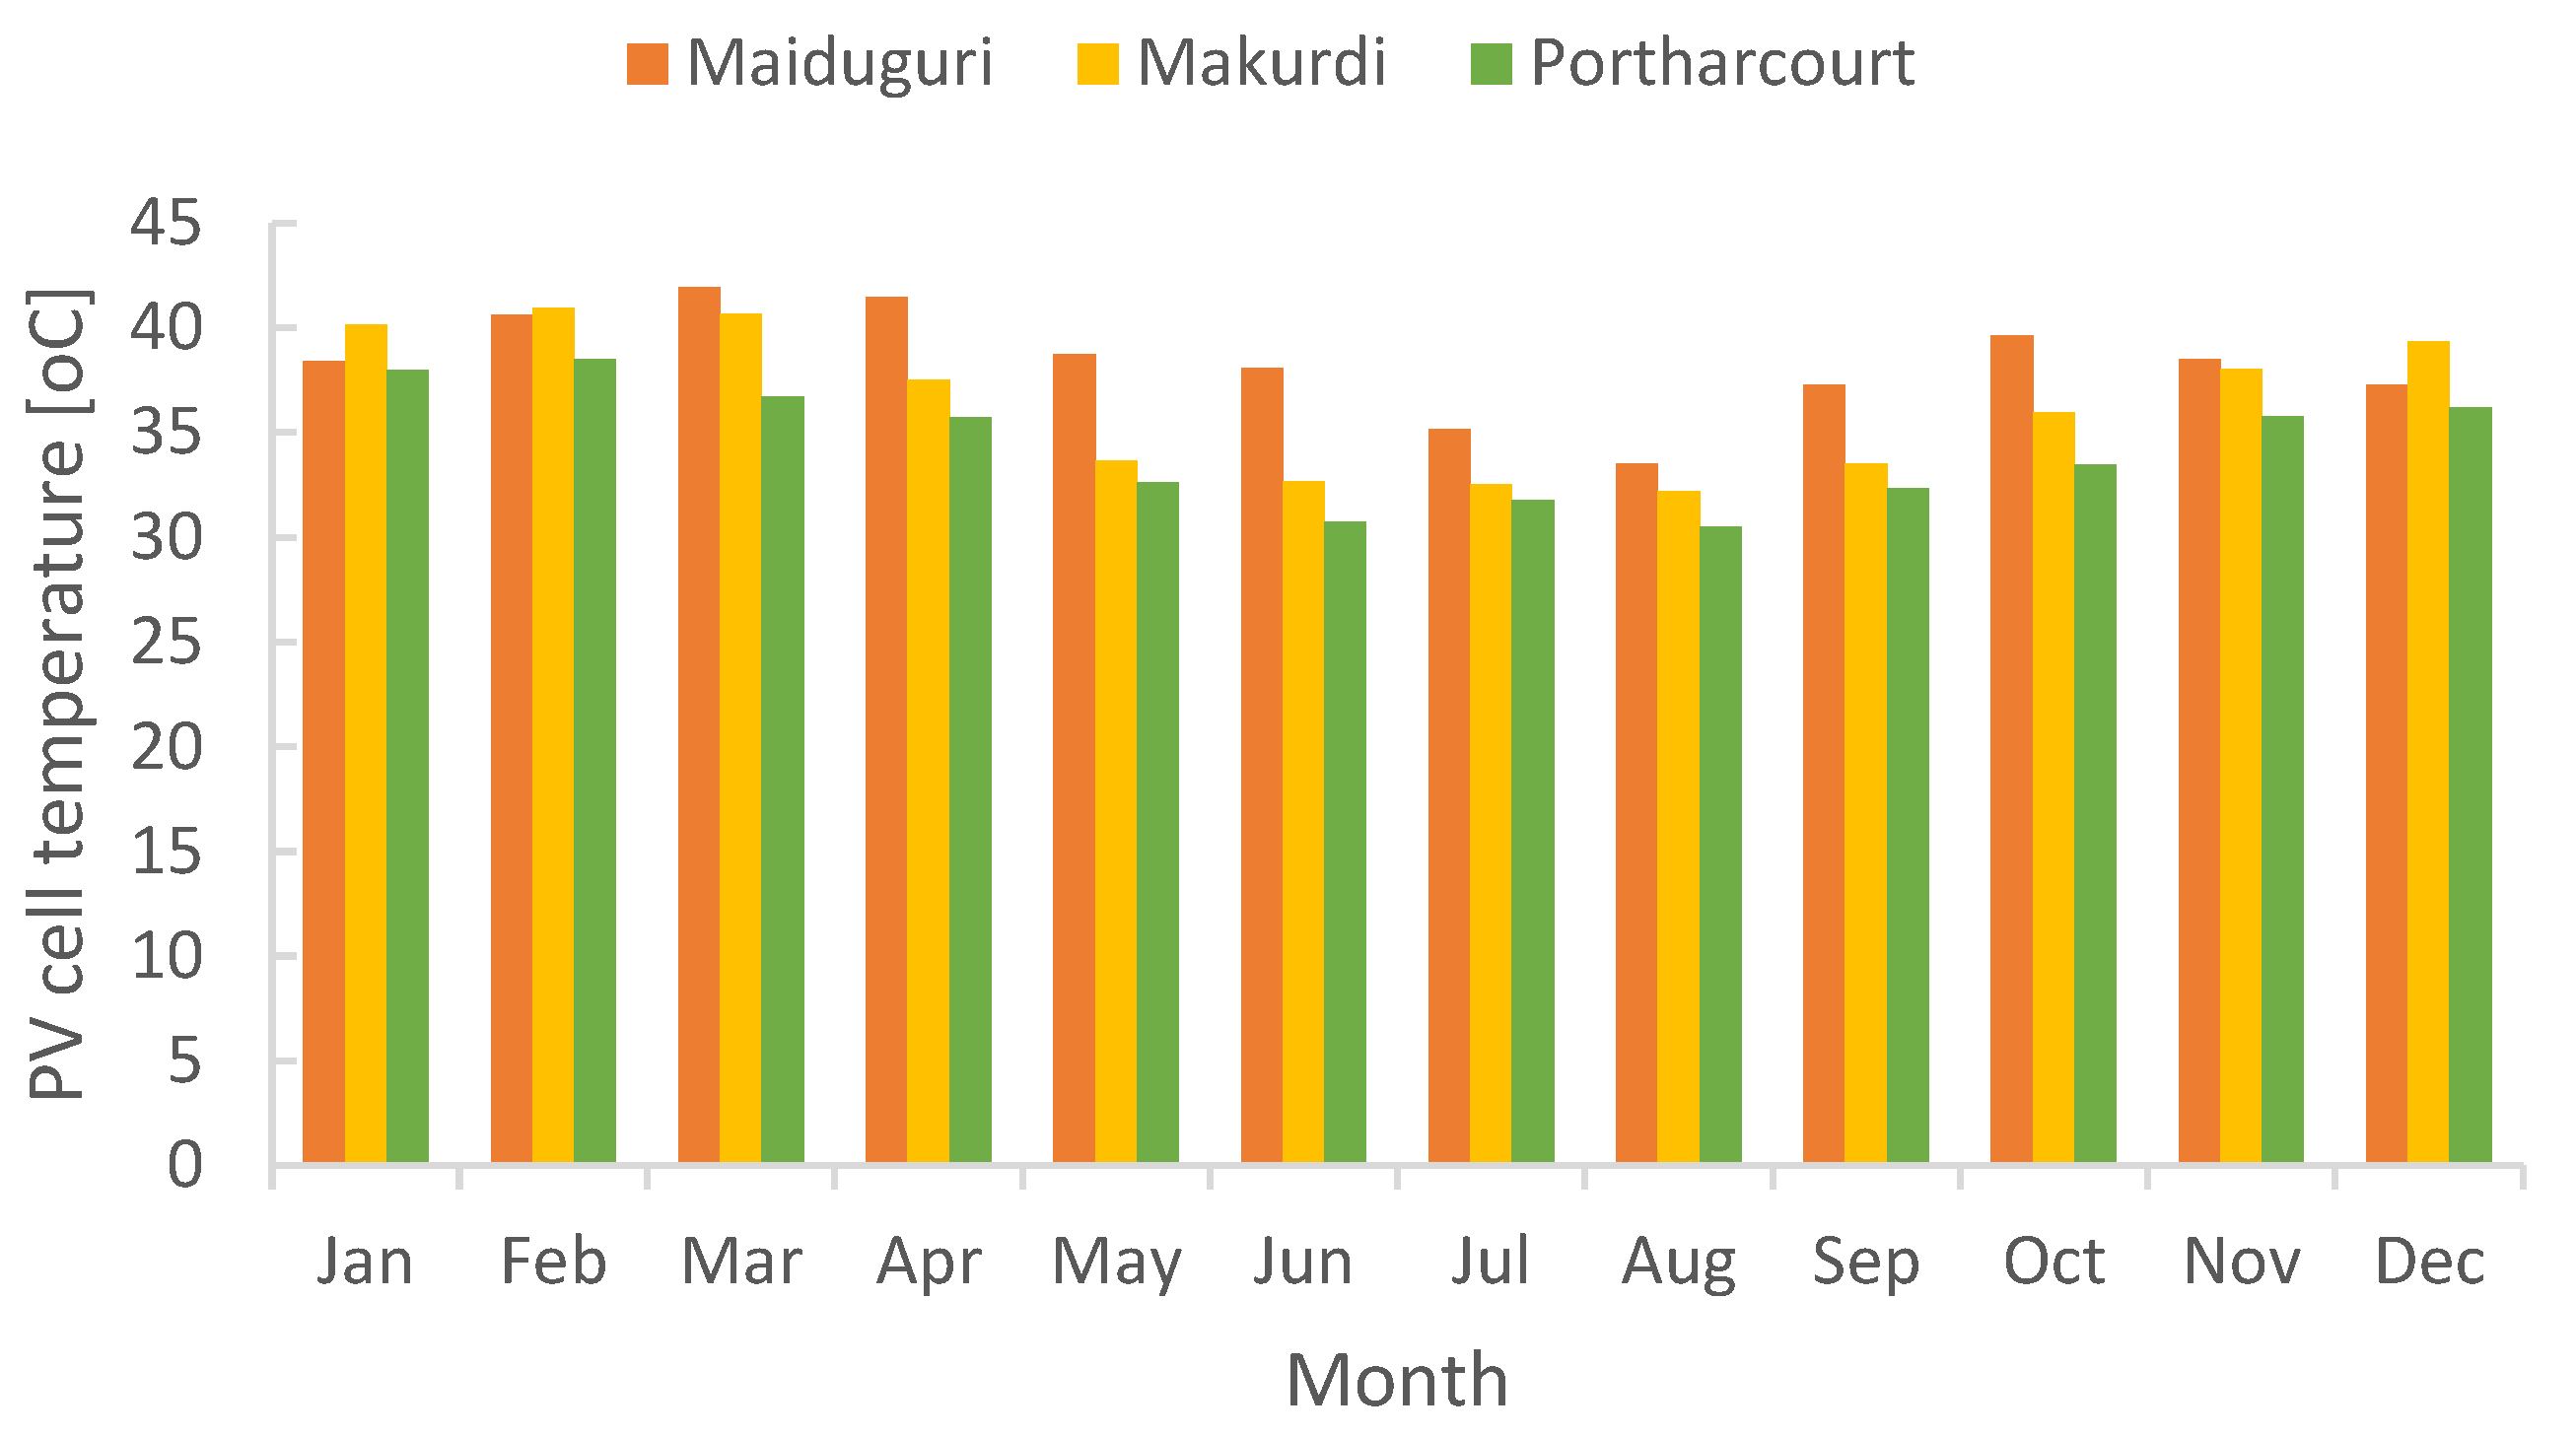
The PV cell surface temperature of the three cities at monthly average is 38.39oC for Maiduguri, 36.43oC for Makurdi and 34.36oC for Port Harcourt. Figure 10 shows the results of PV surface temperature of both cities. Maiduguri record the highest PV cell temperatures because of high solar radiation and ambient temperature in the region.
Figure 10.
Monthly average PV surface temperature of the three cities in Nigeria.
Figure 10.
Monthly average PV surface temperature of the three cities in Nigeria.
4. Conclusions
This paper investigates the potentials of PVT in terms of electrical and thermal production in Nigeria. The annual performance of the combined system was established by means of TRNSYS simulation model. The simulation results show for Maiduguri region the total annual electrical power output of 1906.87kWh/kWp been the highest because of high solar radiation presence in the region compared with Makurdi with total annual electrical power output of 1541.82kWh/kWp and for Port Harcourt region with the total annual of 1355.16kWh/kWp. The variation in power output follows closely the variation in solar radiation and ambient temperature. The ambient temperature also influences the electrical efficiency as observed in the results, as the operating temperature increases, the efficiency is decreased. It also worth to note that, the high power and thermal outputs is observed during months in the dry season because of clear sky and high solar radiation as compared with the months in the raining season with cloudy and low solar radiation. The trend also shows as you move away from the northern part of the country to the southern part, the solar radiation decreases in that pattern and the PVT output also decreased in the same pattern. Other findings of the present study are outline below:
The power output increase by 2.62% with the hybrid PVT system.
The cooling system helps in decreasing the PV surface temperature by 22.07%.
The percentage increase of electrical efficiency of the system is by 7.29% with the PVT system.
The overall efficiency of the hybrid system is 75.46% as compared with conventional PV panel that only perform at maximum efficiency of 20%.
This system can improve the life span of PV panel by reducing the degradation that might occur by overheating due to high temperature in Nigeria. This work paves a new investigation on capability of PVT integration on enhancing the efficiency of PV panels and generating hot water as an important by-product. The works opens plethora of application and further investigation for bifunctional use of solar panels particularly for high temperature regions or locations.
Author Contributions
Conceptualization, K.R.A.; methodology, K.R.A.; software, P.K. and K.P.; validation, K.R.A., P.K. and K.P.; formal analysis, K.R.A., P.K. and K.P.; investigation, K.R.A.; data curation, K.R.A.; writing—original draft preparation, K.R.A; writing—review and editing, K.R.A.; P.K.; K.P. and S.M.J.; visualization, K.R.A.; supervision, K.R.A.; P.K.; K.P. and S.M.J. All authors have read and agreed to the published version of the manuscript.
Funding
This research was funded by Tertiary Education Trust Fund (TETFund), Federal Republic of Nigeria.
Conflicts of Interest
The authors declare no conflict of interest.
Nomenclature
| |
Nomenclature |
|
Scripts |
| T |
temperature [oC] |
g |
Glass |
| C |
specific heat capacity [KJ/kg.oC] |
sky |
Sky |
| hc,j,k
|
conductive heat transfer coefficient between layer j and k [W/m2K] |
gr |
Ground |
| hr,j,k
|
radiative heat transfer coefficient between layer j and k [W/m2K] |
a |
Ambient |
| Hv,j,k
|
convective heat transfer coefficient between layer j and k [W/m2K] |
|
Photovoltaic |
| PF |
Packing factor |
|
Tedlar |
| Fj,k
|
View factor between layer j and k |
|
Higher absorber plate |
| A |
Area [m2] |
|
Lower absorber plate |
| w |
Wind speed [m/s] |
|
Fluid |
| G |
Solar radiation [W/m2] |
|
Absorber plate |
| PC |
Percentage of collector occupy by channel |
|
Natural convection |
| Nu |
Nusselt number |
|
Radiation |
|
Mass flow rate [kg/s] |
|
convection |
|
Quantity of heat supply [KJ/s.K] |
|
conduction |
|
Mass flow rate of thermal load [kg/s] |
|
Inlet |
|
Overall heat loss of tank [W/m2 K] |
|
Outlet |
|
External surface of the tank [m2] |
|
Reference |
|
Average tank temperature [oC] |
|
electrical |
|
Ambient temperature [oC] |
|
thermal |
|
Temperature of supply water from mains [oC] |
|
tank |
|
Effectiveness of heat exchanger |
|
Force convection |
| STC |
Standard test conditions |
|
Greek symbols |
|
Electrical power [W] |
|
Density [kg/m3] |
|
Thermal power [W] |
|
Thickness [m] |
|
Overall power output of PVT [W] |
|
Absorptivity |
|
Temperature entering the collector [oC] |
|
Stefan-Boltzmann constant |
|
Temperature leaving the collector [oC] |
|
emissivity |
|
Prandtl number |
|
transmissivity |
|
Rayleigh number |
|
Electrical efficiency |
|
Average fluid temperature inside PVT panel [oC] |
|
Reference efficiency |
|
Wind speed at back of collector [m/s] |
|
Temperature coefficient |
| |
|
|
Thermal efficiency |
| |
|
|
Overall efficiency |
| |
|
|
Tilt angle |
References
- O. U. Oparaku, S. N. Agbo, and O. U. Oparaku, “Positive and Future Prospects of Solar Water Heating in Nigeria,” 2006. [Online]. Available online: https://www.researchgate.net/publication/228730985.
- J. J. Michael, I. S, and R. Goic, “Flat Plate Solar Photovoltaic-thermal (PV/T) systems: A reference guide,” Renewable and Sustainable Energy Reviews, vol. 51. Elsevier Ltd, pp. 62–88, Jun. 22, 2015. [CrossRef]
- R. Amelia, Y. M. Irwan, W. Z. Leow, I. #1, I. Safwati, and M. Zhafarina, “Investigation of the Effect Temperature on Photovoltaic (PV) Panel Output Performance,” vol. 6, no. 5, 2016.
- K. Hasan, S. B. Yousuf, M. S. H. K. Tushar, B. K. Das, P. Das, and M. S. Islam, “Effects of Different Environmental and Operational Factors on the PV Performance: A comprehensive review,” Energy Science and Engineering, vol. 10, no. 2. John Wiley and Sons Ltd, pp. 656–675, Feb. 01, 2022. [CrossRef]
- W. Sawadogo, B. J. Abiodun, and E. C. Okogbue, “Impacts of Global Warming on Photovoltaic Power Generation over West Africa,” Renew Energy, vol. 151, pp. 263–277, May 2020. [CrossRef]
- V. Poulek, T. Matuška, M. Libra, E. Kachalouski, and J. Sedláček, “Influence of Increased Temperature on Energy Production of Roof Integrated PV Panels,” Energy Build, vol. 166, pp. 418–425, May 2018. [CrossRef]
- N. Karakilic, A. Karafil, and N. Genc, “IJTPE Journal “Effects of Temperature and Solar Irradiation on Performance of Monocrystalline, Polycrystalline and Thin-film PV Panels,” International Journal on “Technical and Physical Problems of Engineering” (IJTPE) Issue, vol. 51, pp. 254–260, 2022, [Online]. Available online: www.iotpe.com.
- M. K. S. Al-Ghezi, R. T. Ahmed, and M. T. Chaichan, “The Influence of Temperature and Irradiance on Performance of the Photovoltaic Panel in the Middle of Iraq,” International Journal of Renewable Energy Development, vol. 11, no. 2, pp. 501–513, May 2022. [CrossRef]
- Idzkowski, W. Walendziuk, and W. Borawski, “Analysis of the Temperature Impact on the Performance of Photovoltaic Panel,” in Photonics Applications in Astronomy, Communications, Industry, and High-Energy Physics Experiments 2015, SPIE, Sep. 2015, p. 96620J. [CrossRef]
- M. Senthil Kumar, K. R. Balasubramanian, and L. Maheswari, “Effect of Temperature on Solar Photovoltaic Panel Efficiency,” Int J Eng Adv Technol, vol. 8, no. 6, pp. 2593–2595, Aug. 2019. [CrossRef]
- S. S. Joshi and A. S. Dhoble, “Photovoltaic -Thermal Systems (PVT): Technology Review and Future Trends,” Renewable and Sustainable Energy Reviews, vol. 92. Elsevier Ltd, pp. 848–882, Sep. 01, 2018. [CrossRef]
- Al Tarabsheh et al., “Performance of Photovoltaic Cells in Photovoltaic Thermal (PVT) Modules,” IET Renewable Power Generation, vol. 10, no. 7, pp. 1017–1023, Jul. 2016. [CrossRef]
- Al Tarabsheh, S. Voutetakis, A. I. Papadopoulos, P. Seferlis, I. Etier, and O. Saraereh, “Investigation of Temperature Effects in Efficiency Improvement of Non-Uniformly Cooled Photovoltaic Cells,” in Chemical Engineering Transactions, Italian Association of Chemical Engineering - AIDIC, 2013, pp. 1387–1392. [CrossRef]
- M. M. Sardouei, H. Mortezapour, and K. J. Naeimi, “Temperature Distribution and Efficiency Assessment of Different PVT Water Collector Designs,” Sādhanā, vol. 43, 2018. [CrossRef]
- M. Asim et al., “Investigation of Mono-Crystalline Photovoltaic Active Cooling Thermal System for Hot Climate of Pakistan,” Sustainability (Switzerland), vol. 14, no. 16, Aug. 2022. [CrossRef]
- M. Ahmadinejad, A. Soleimani, and A. Gerami, “Performance enhancement of a photovoltaic Thermal (PVT) System with Sinusoidal Fins: A Quasi-Transient Energy-Exergy Analysis,” Int J Green Energy, vol. 20, no. 9, pp. 978–996, 2023. [CrossRef]
- Y. Bhat and A. Qayoum, “Synergistic Impact of Tube Configuration and Working Fluid on Photovoltaic-Thermal System Performance,” Renew Energy, vol. 207, pp. 205–217, May 2023. [CrossRef]
- H. Adun, H. P. Ishaku, O. Ayomide Titus, and A. Shefik, “3-E Feasibility Analysis on Photovoltaic/Thermal Application for Residential Buildings: A Case Study of Sub-Saharan Africa,” Energy Sources, Part A: Recovery, Utilization, and Environmental Effects, vol. 44, no. 4, pp. 9901–9919, Dec. 2022. [CrossRef]
- F. Maoulida, R. Djedjig, M. A. Kassim, and M. El Ganaoui, “Numerical Study for the Evaluation of the Effectiveness and Benefits of Using Photovoltaic-Thermal (PV/T) System for Hot Water and Electricity Production under a Tropical African Climate: Case of Comoros,” Energies (Basel), vol. 16, no. 1, Jan. 2023. [CrossRef]
- El Fouas, B. Hajji, A. Gagliano, G. M. Tina, and S. Aneli, “Numerical Model and Experimental Validation of the Electrical and Thermal Performances of Photovoltaic/Thermal Plant,” Energy Convers Manag, vol. 220, Sep. 2020. [CrossRef]
- R. Muhumuza, A. Zacharopoulos, J. Deb Mondol, M. Smyth, and A. Pugsley, “Meeting Energy Needs of Low-Income Sub-Saharan Households with a Partially Hybridised Solar Technology (PHST): Experimental Performance Evaluation Based on Simulated Solar Radiation and Demand Profiles,” in Sustainable Energy Technologies and Assessments, Elsevier Ltd, Aug. 2021. [CrossRef]
Table 1.
Photovoltaic module and thermal collector parameters.
Table 1.
Photovoltaic module and thermal collector parameters.
| Parameters |
Quantity |
| PV Panels |
|
| Peak power (Pm) |
250Wp
|
| Maximum voltage (Vm) |
30.1V |
| Maximum current (Im) |
8.3A |
| Open circuit voltage (Voc) |
37.2V |
| Short circuit current (Isc) |
8.87A |
| Module efficiency |
15% |
| Module dimensions |
1638mm x 982mm |
| Panel type |
Polycrystalline; FT250Cs |
| Weight |
27.6Kg |
|
Disclaimer/Publisher’s Note: The statements, opinions and data contained in all publications are solely those of the individual author(s) and contributor(s) and not of MDPI and/or the editor(s). MDPI and/or the editor(s) disclaim responsibility for any injury to people or property resulting from any ideas, methods, instructions or products referred to in the content. |
© 2024 by the authors. Licensee MDPI, Basel, Switzerland. This article is an open access article distributed under the terms and conditions of the Creative Commons Attribution (CC BY) license (https://creativecommons.org/licenses/by/4.0/).
