Void Nucleation at Arbitrary T, S, and
As a summary of the results obtained using Eqs. (3-4),
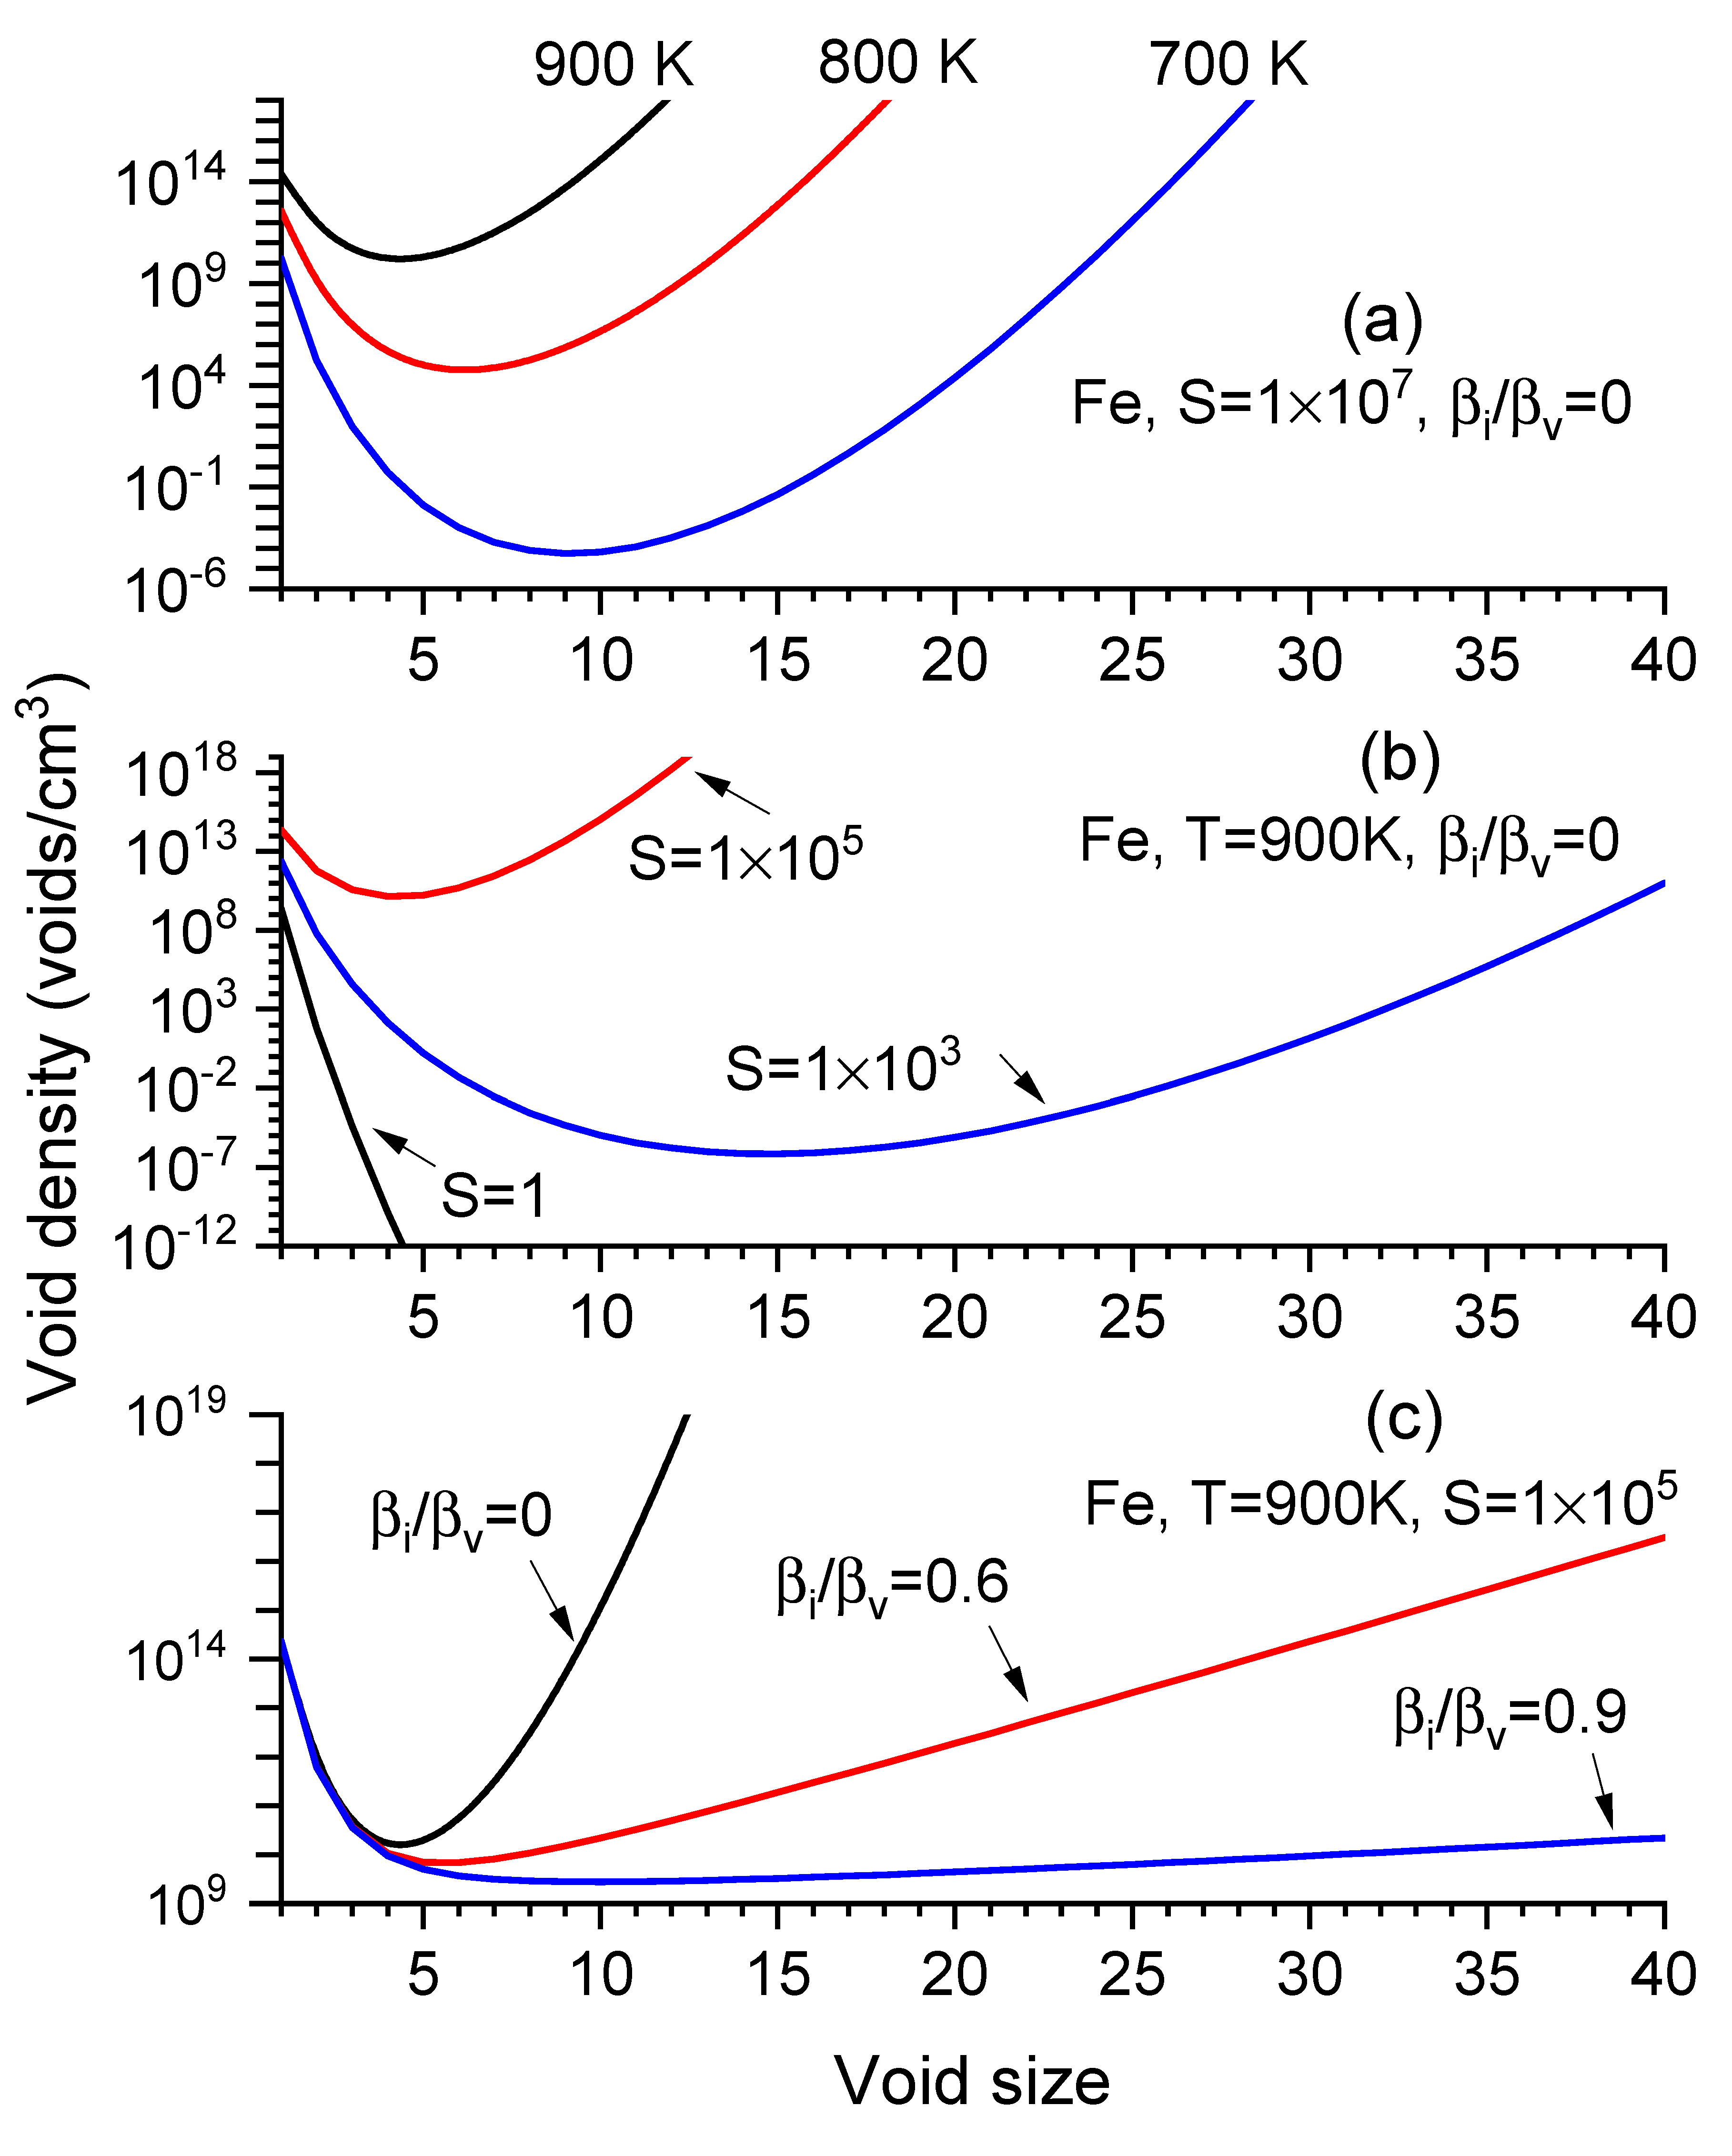
Figure 1a–c show
distribution changes by varying temperatures
), vacancy supersaturation ratios
, and the ratios of interstitial-to-vacancy arrival rates to a void (
). All
curves feature a dip at the critical size,
. With increasing
, the size curves move upwards, exhibiting smaller
and higher
(
Figure 1a). Similarly, with increasing
S values, the curves shift upward, reducing
and increasing
(
Figure 1b). Increasing
increases
while reducing void density at large sizes (
Figure 1c).
Once
is obtained, Eq. (2) is used to calculate void nucleation rate
J.
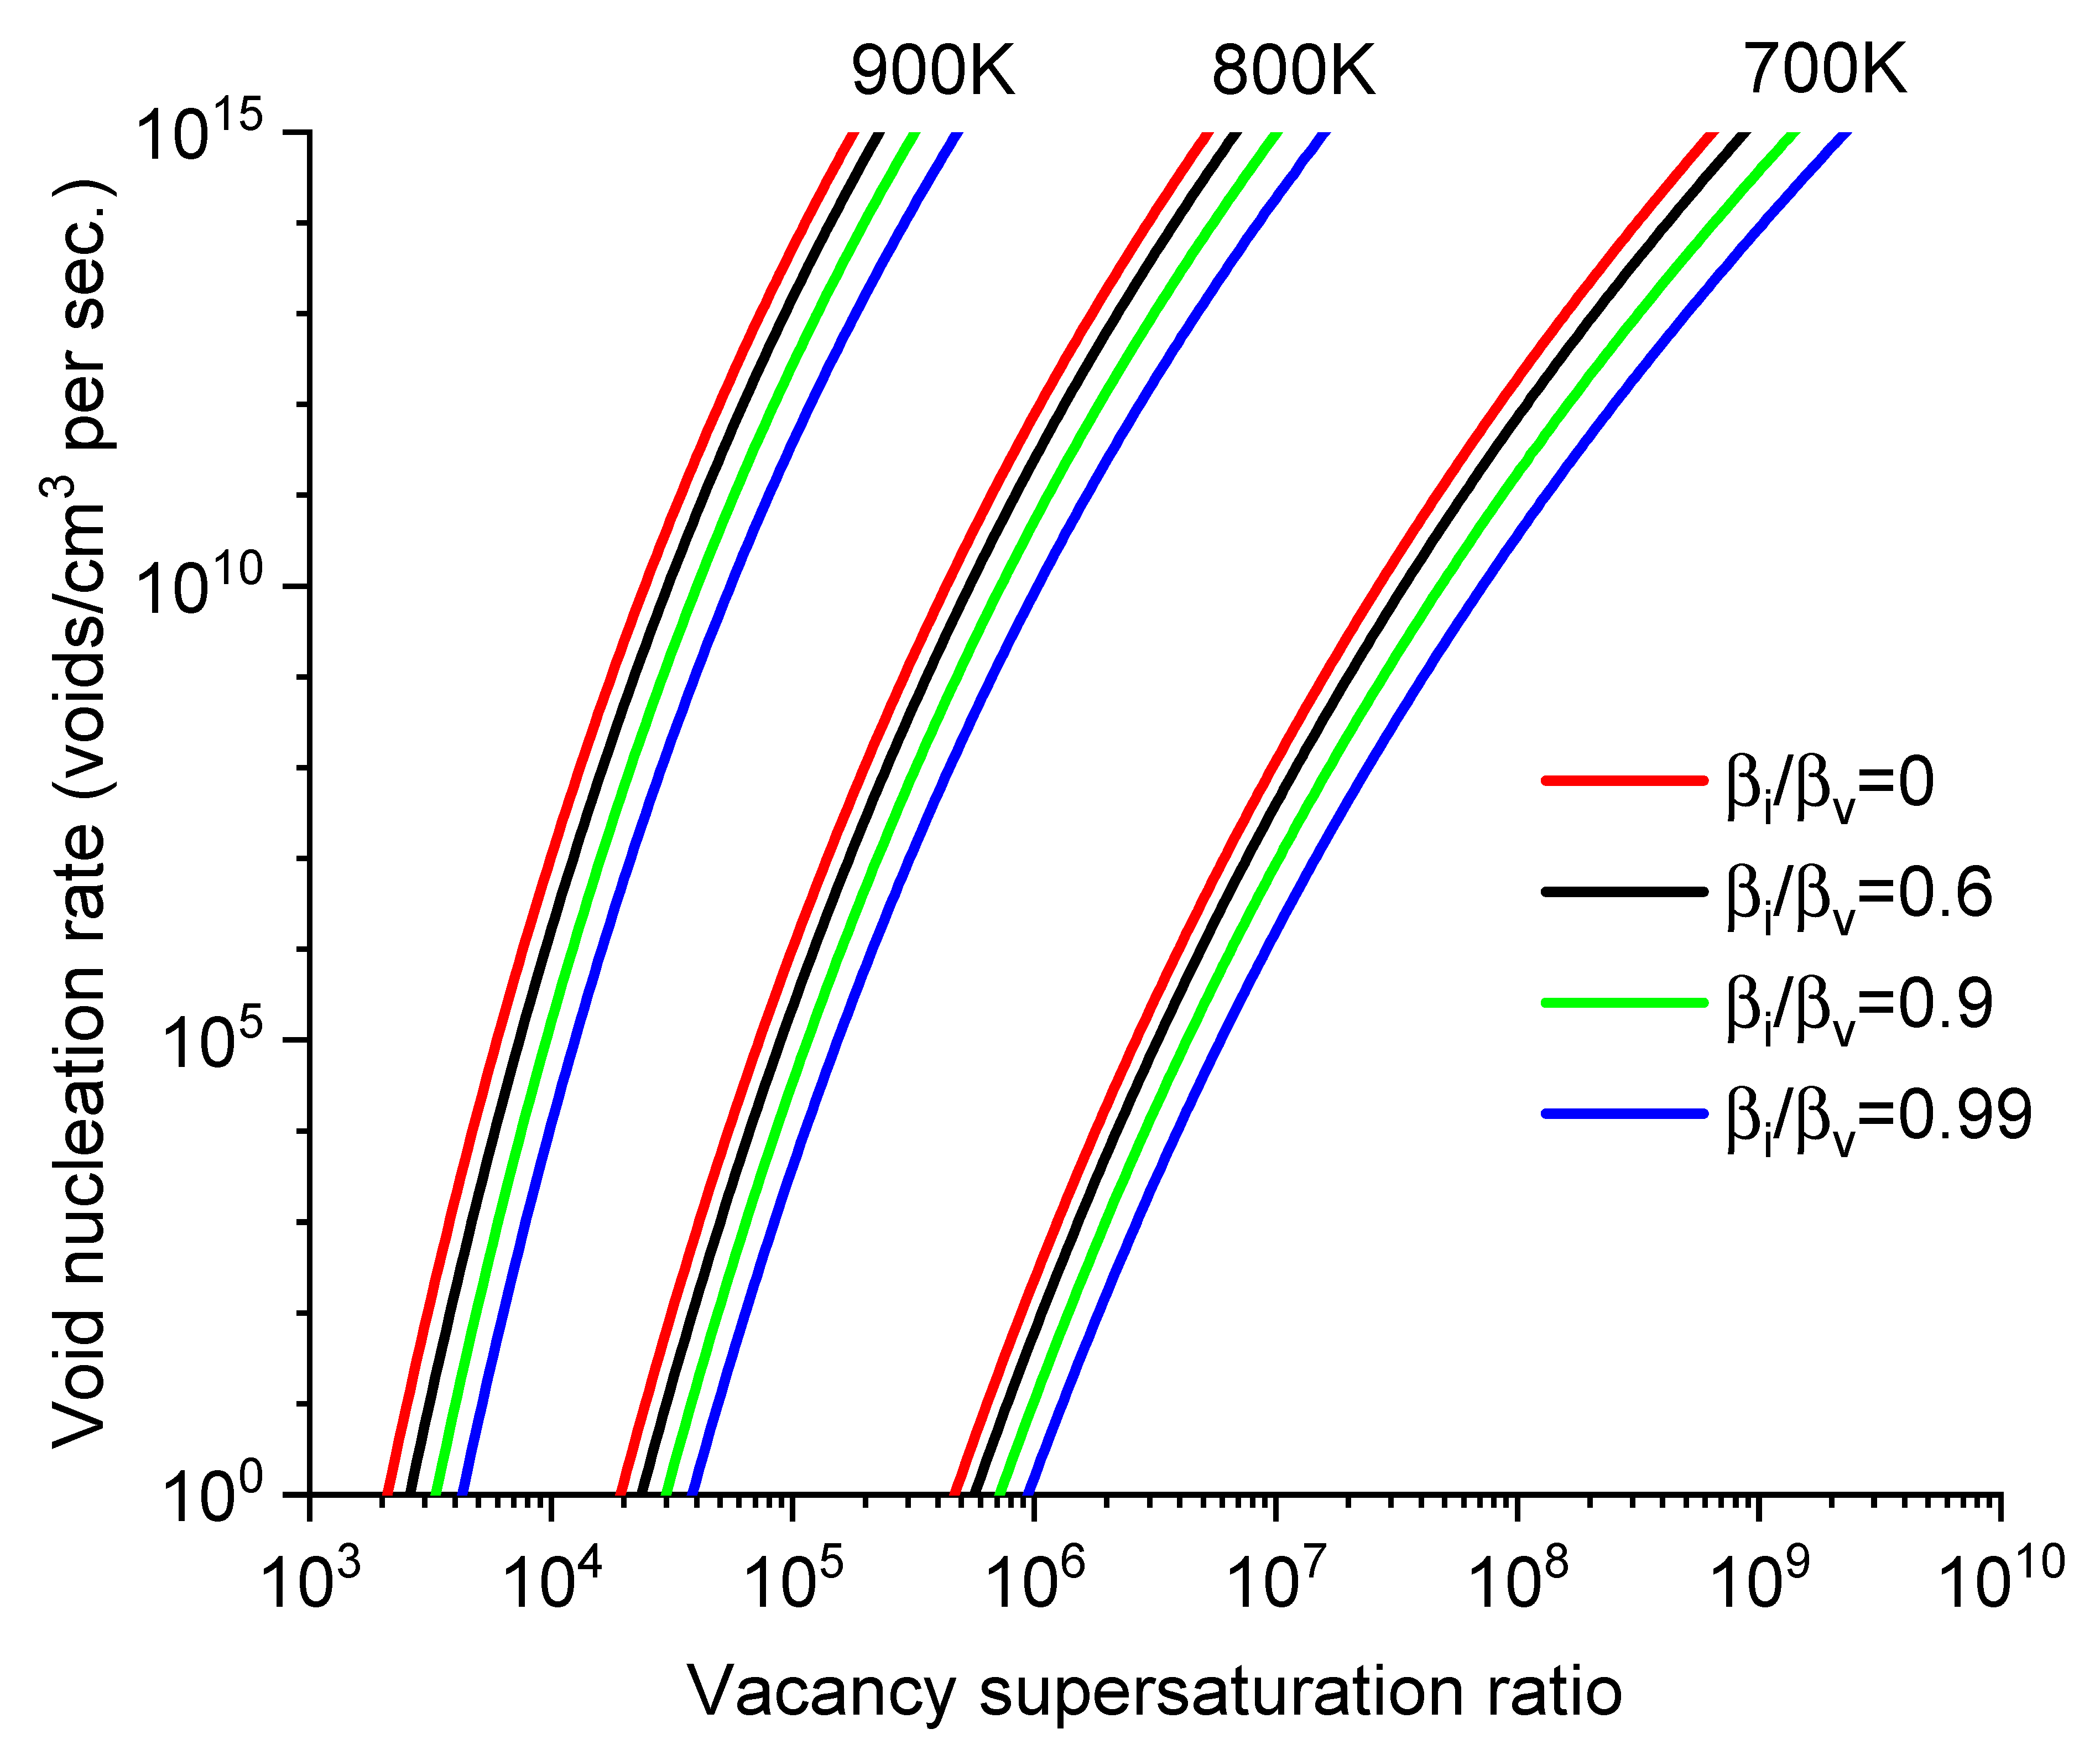
Figure 2 plots the
J values as a function of S for different
T and
. The
J values are very sensitive to all three parameters. For example, at 900K and
=0.99, a change of
S from 1×10
4 to 1×10
5 leads to an increase in
J by more than six orders of magnitude.
Figure 2 also shows a compensating effect among parameters. For instance, to maintain the same
J value, the impact of lowering
T can be counterbalanced by increasing
S.
Void Nucleation Considering Irradiation for Defect Production and Dislocations as Defect Sinks
After establishing the relationship of
with T, S, and
, we now proceed to rate theory calculations to establish how these parameters relate to the displacements per atom
and defect sinks. Two master equations describe the time rate of change of vacancy concentration (
) and interstitial concentration (
), expressed as:
where
is time.
is the survival fraction of defects after the initial damage creation.
is the atomic density of Fe.
is the displacements-per-atom (dpa).
and
are thermal generation rates of vacancies and interstitials, respectively.
and
are sink strength for vacancies and interstitials, respectively.
and
are sink densities for vacancies and interstitials, respectively.
is the interstitial-vacancy recombination rate.
and
are diffusivities of vacancies and interstitials, respectively.
In a steady state, where
and
, the net point defect fluxes of interstitials and vacancies to defect sinks are equal. This equilibrium condition gives
Combining Eqs. (12-14) for a steady state under irradiation, a quadratic equation is derived for vacancy concentration deviation from its equilibrium
, expressed as:
Substituting obtained from Eq. (16) into Eq. (14) obtains . Then the ratio can be obtained using (.
The dislocation sink strength
is described by
where
is dislocation density,
is the defect trapping radius for trapping interstitials and vacancies. The point defect combination rate is calculated by [
1]:
where
is atomic volume of one lattice atom and
is the lattice constant of Fe.
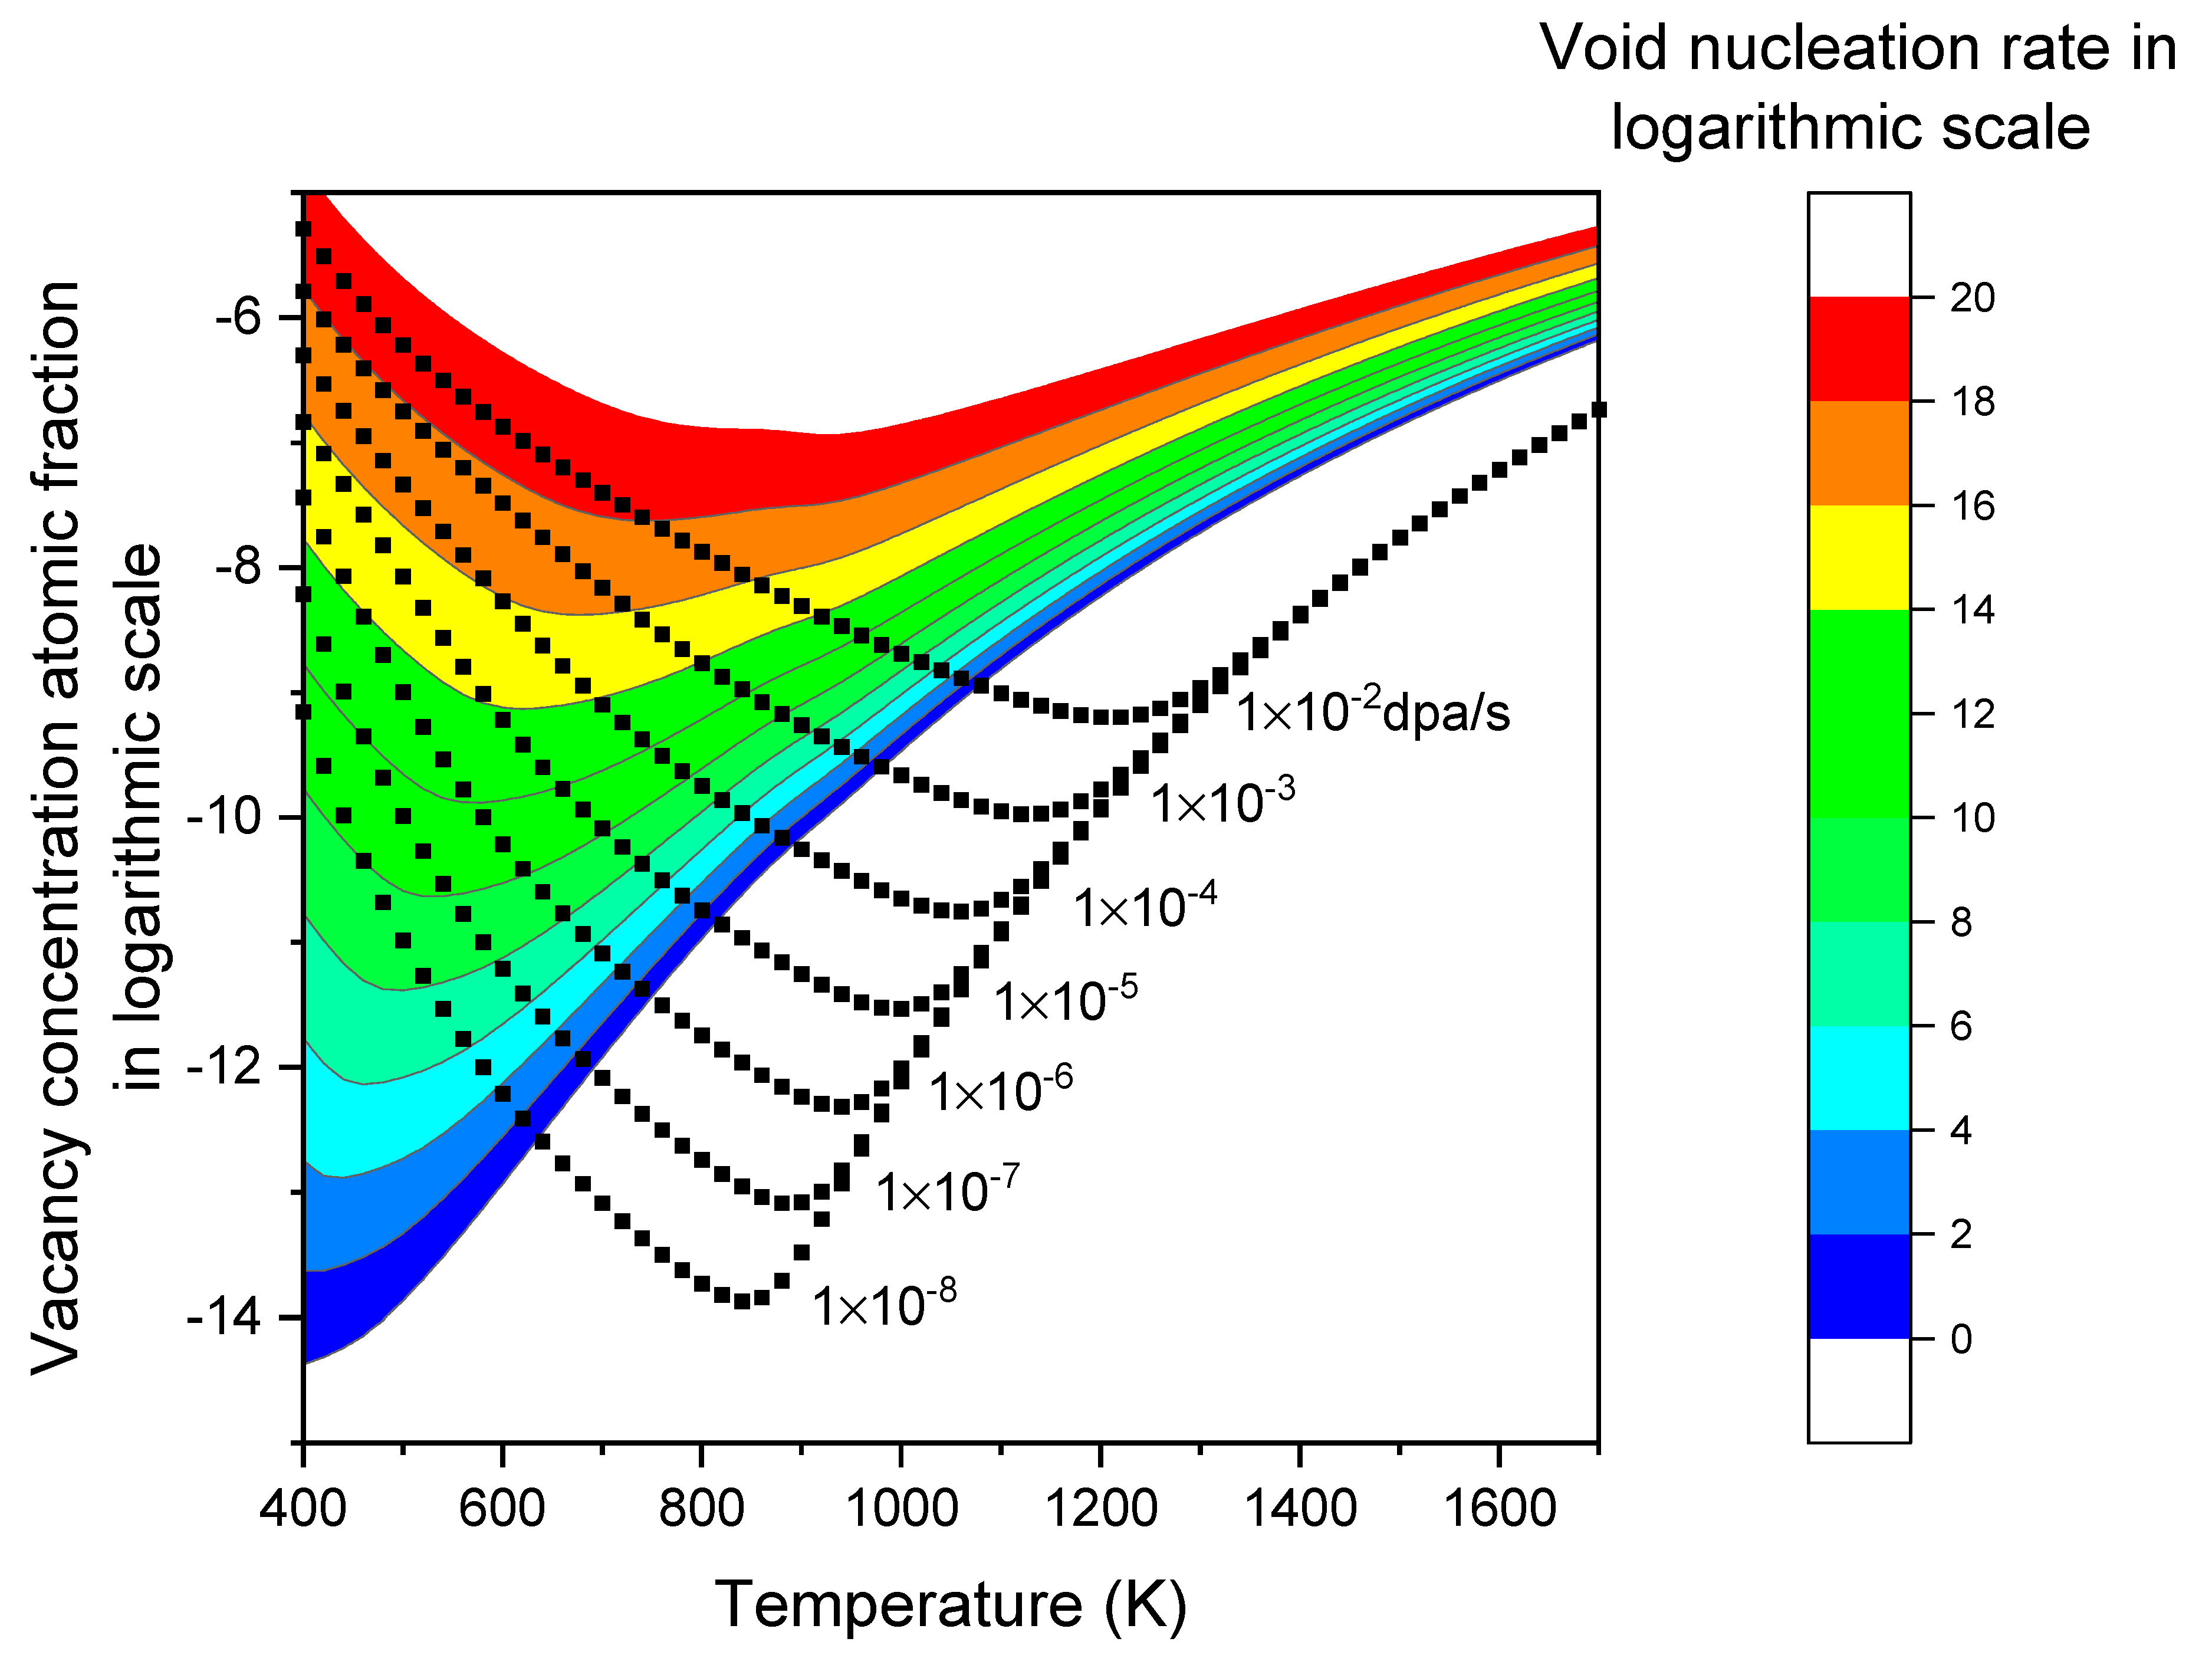
Table II summarized the parameters used in the present study. The black square lines in
Figure 3 show the calculated vacancy atomic fraction concentration as a function of temperature at various dpa rates. Under a given dpa rate, the vacancy concentration exhibits a V-shaped pattern. At very high temperatures, the concentration follows
. As the temperature decreases,
begins to rise at a certain temperature point and deviates from
. At sufficiently low temperatures, where
and
are negligible,
becomes proportional to
. Changing
by an order of magnitude results in a parallel shift of the logarithmic plot of
. This shift is obvious by the square lines for
ranging from 1×10
-2 dpa/s to 1×10
-8 dpa/s. Lowering
causes the temperature point at which
deviates from
to shift to lower temperatures accordingly. In
Figure 2, the calculations assume a dislocation density of 1×10
9/cm
2. Changing the dislocation density does not cause a significant shift in the curve, unlike
. Instead, the dislocation density mainly influences the concentration near the turning point. A higher dislocation density results in a lower defect concentration and shifts the turning point to a lower temperature. The effect of dislocation density becomes more evident under lower dpa rate irradiation.
The color bands in
Figure 3 represent the contour map of the void nucleation rate as a function of vacancy concentration and temperature. Each color or contour line corresponds to a constant void nucleation rate. It exhibits a V-shaped pattern. For lower void nucleation rates, the minimum point of the V-shaped pattern shifts to lower defect concentrations and temperatures. The V-shaped behavior primarily arises from the change in the critical void size (
), which corresponds to the size at which the void density is the lowest. When
is larger, the void density at that size,
, is lower, resulting in lower void nucleation rates. In the high-temperature region (i.e., > 900K),
decreases with increasing temperature, leading to higher nucleation rates at higher temperatures. The effect of irradiation is less significant in this temperature range because
is already high, and the irradiation-induced S changes become insignificant. At extremely high temperatures, S approaches 1. In the low-temperature region (i.e., T < 600K), the effect of S becomes more significant as
is very low. Although lowering the temperature would tend to increase
, the high value of S counteracts this and reduces
. The significant changes in S alter the trend, resulting in the V-shaped temperature dependence as shown in
Figure 3.
For two points on the contour line with the same nucleation rate, the following observations were made: Taking the example of a nucleation rate of 1×10¹⁸ voids/cm3 per second, when the temperature decreases from 700K to 600K, the significantly increased vacancy concentration (and subsequently, S values) shift the entire profile upwards, resulting in higher void densities at each size. Conversely, is reduced when the temperature changes from 700K to 600K, due to large changes in vacancy diffusivity. This reduction in compensates for the increase in void density, thereby maintaining the same nucleation rate.
Void Nucleation Considering Irradiation, Dislocation, and Carbon Incorporation
We now proceed to discuss the effect of carbon. Carbon is well-known for causing the suppression of void swelling, but no quantitative evaluation has been established to assess its impact, which motivates the present study. The effect was not significant during the short-term ion irradiation of materials in earlier days but has become significant for prolonged irradiation of advanced alloys, which are highly swelling-resistant. More recent relevant studies show that carbon is the reason why the width of the void denuded zone is governed by an activation energy that significantly deviates from the expected vacancy migration energies [
3].
C atoms temporarily immobilize vacancies through the formation of V-C
n complexes. The complexes are expected to be dissociated later, and the dissociation probability is determined by the V-C binding energies. The binding energies of various C-V complexes were previously calculated using ab initio calculations [
8]. The binding energies
are 0.41 eV for VC, 1.18 eV for VC
2, and 1.30 eV for VC
3. The complex concentration, expressed as the atomic fraction concentration,
, of various vacancy-carbon complexes
is approximated by the mass-action law [
8]:
where
is the number of vacancies and
is the number of carbon atoms in a vacancy-carbon complex.
is the binding energy of the complex.
Under the approximation that (1) the amount of carbon bonded with vacancies in complexes is significantly less than the total carbon dissolved in the system, and (2) the major complexes consist of those containing one vacancy (m=1) and multiple carbons with n=1, 2, and 3, the effective vacancy diffusivity
can be calculated by:
where
is the intrinsic diffusivity of vacancies,
represents the atomic fraction concentration of free/isolated vacancies,
is the atomic fraction concentration of carbon, and
is the binding energy of vacancy-carbon complex
with n=1, 2, and 3.
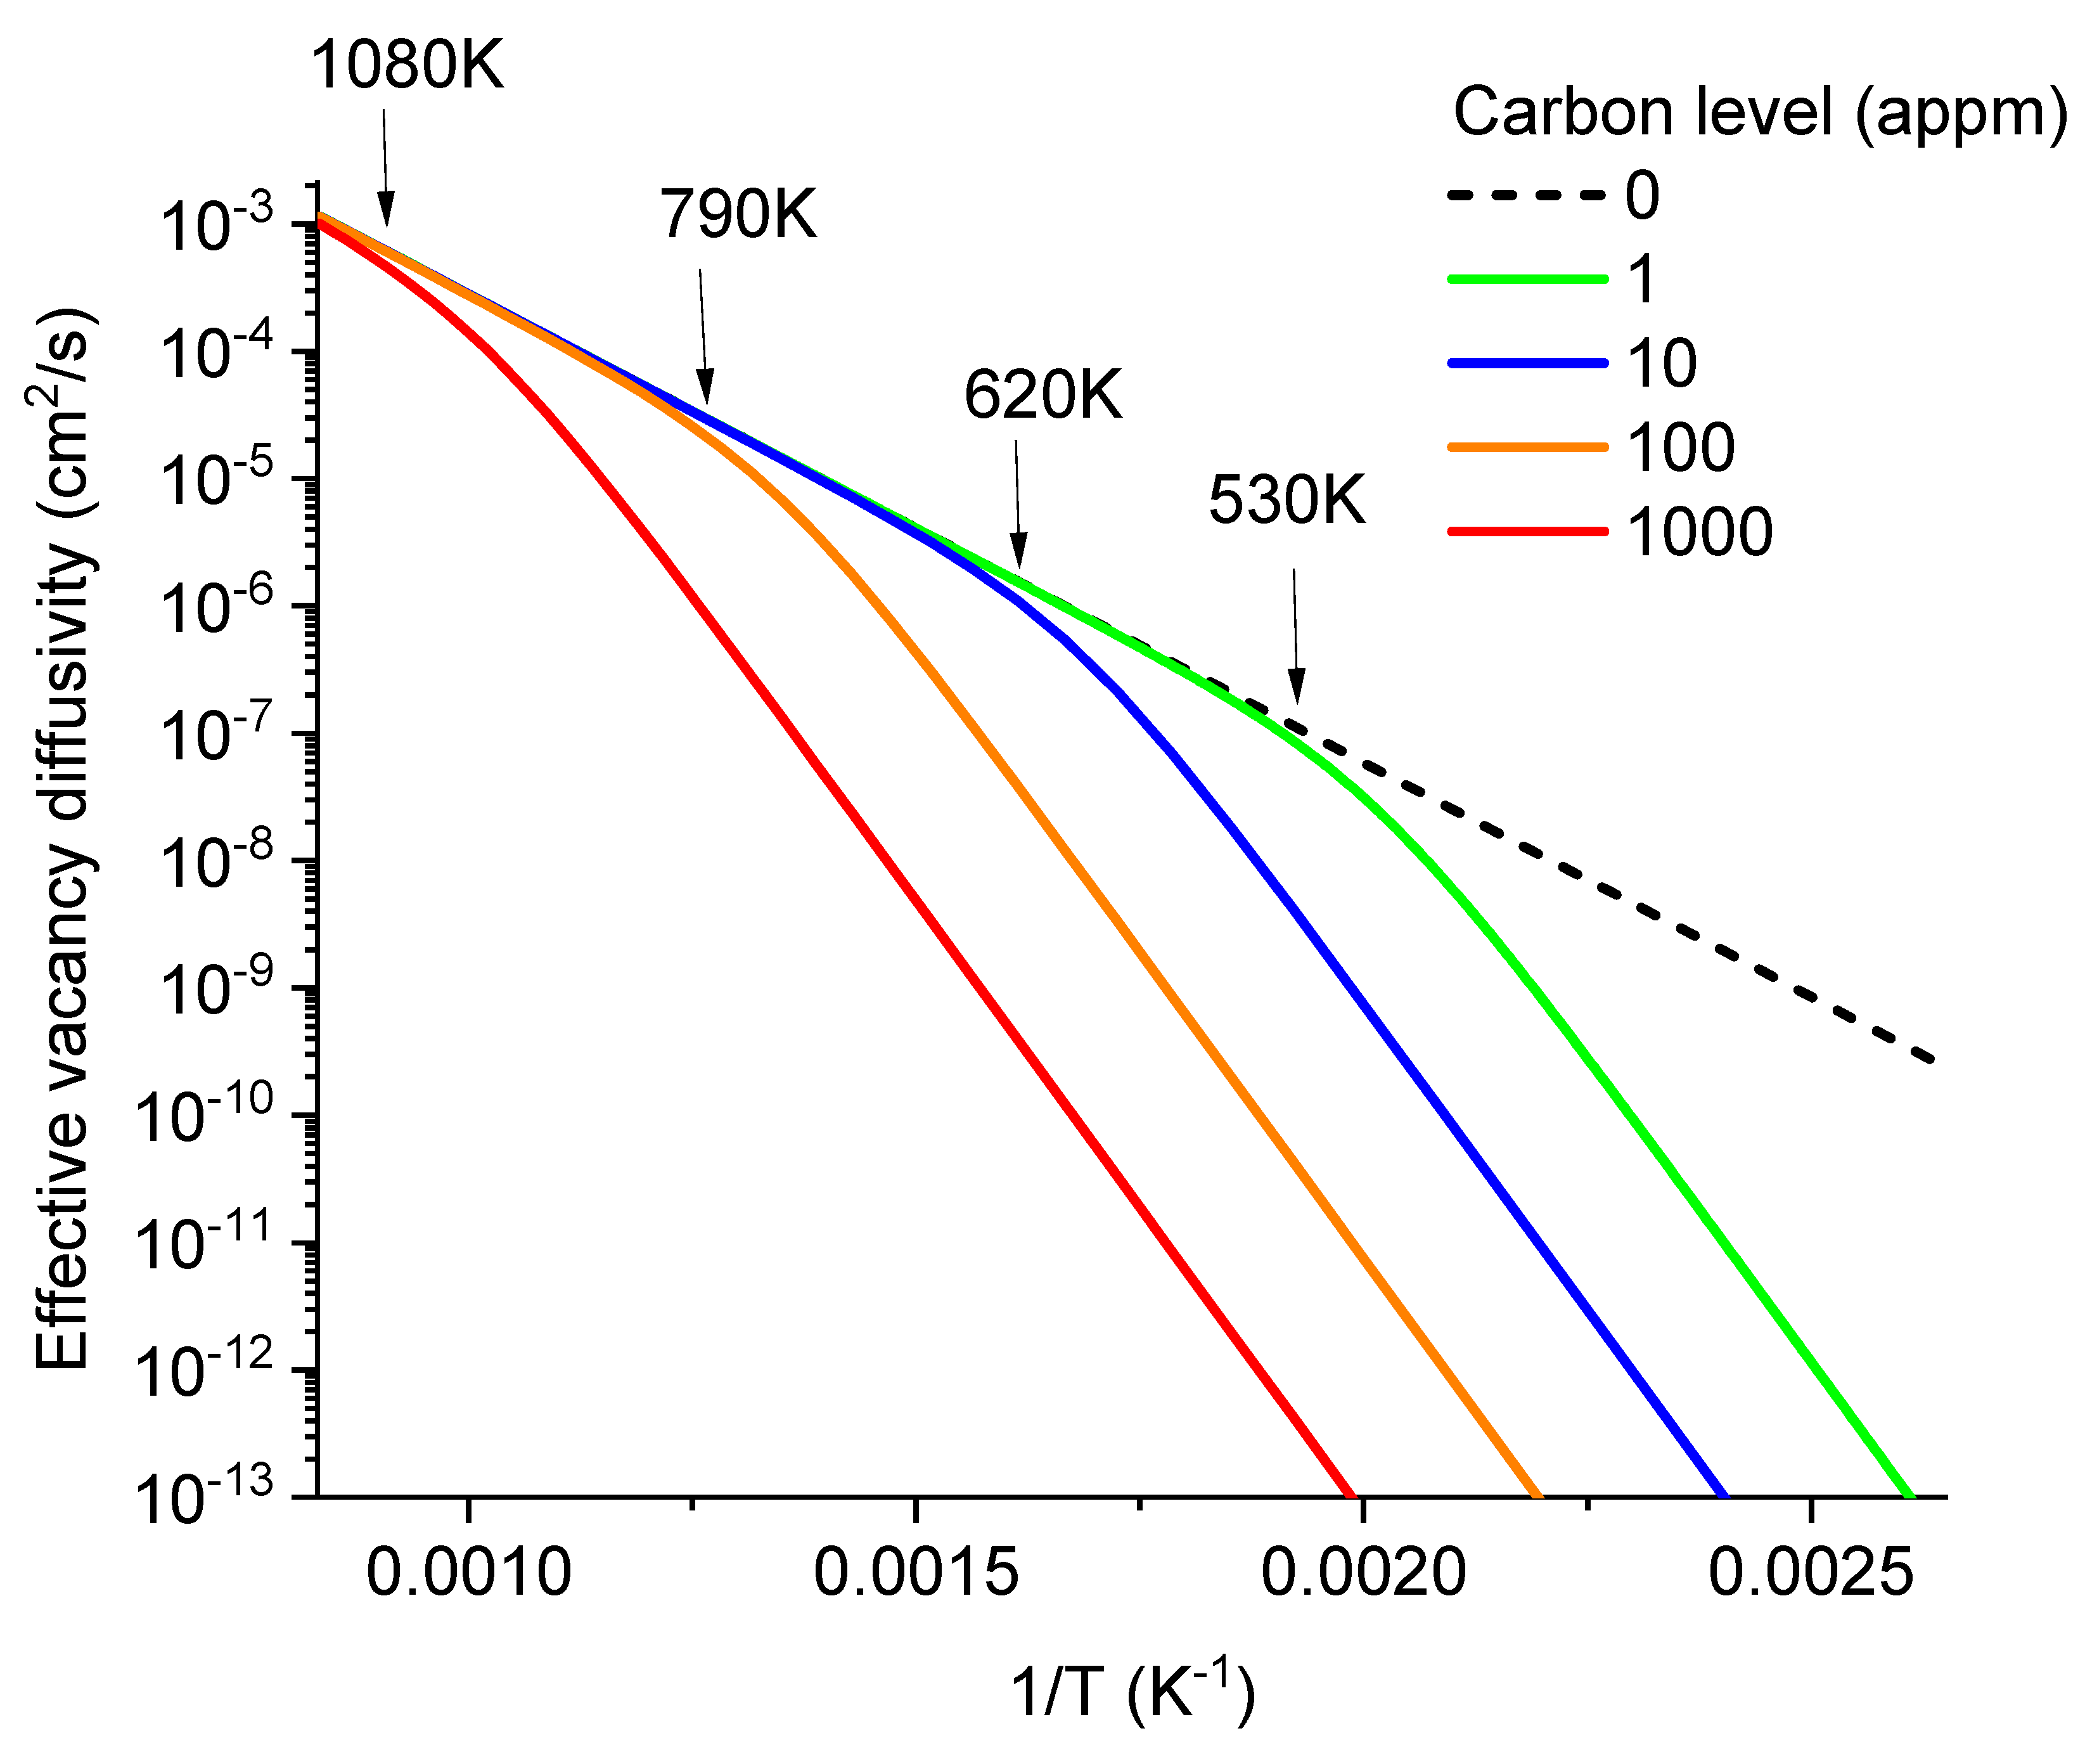
Figure 4 plots the effective vacancy diffusivity as a function of temperature for carbon concentrations at 1, 100, and 10000 appm levels. The solid line represents C-free Fe, exhibiting a single activation energy (0.73 eV). With the addition of carbon, the effective diffusivity deviates from the solid line at temperatures below a critical temperature. At higher C levels, this deviation occurs at higher temperatures. Notably, in the affected-temperature region, the effective vacancy diffusivity exhibits the same activation energy of 1.91 eV, regardless of the carbon level. The diffusivity curve is parallelly shifted downwards with increasing carbon level. The constant activation energy of 1.91 eV for all C levels can be approximated as the sum of the migration energy (0.73 eV) of free vacancies and the binding energy (1.18 eV) of VC
2 complexes. The effect from VC
2 is dominant. The VC complex plays a less significant role due to its much lower E
b value, and VC
3 is also less significant due to its relatively lower concentrations.
Figure 4 also marks the temperatures at which the effective vacancy diffusivities begin to deviate form the carbon-free case. As to be discussed soon, these critical temperature points also play an important role in determining the temperature dependence of void nucleation.
The method of calculating effective vacancy diffusivity in the present study follows the early approach by Fu et al [
8]. The diffusivity calculation in Reference 8 used a vacancy migration energy of 0.67 eV. In the plot of
Figure 4, we used an activation energy of 0.73 eV [
15], to be consistent with the calculations in the preceding sections.
Substituting
into rate theory calculations to determine
and
, and then substituting these parameter values into the void nucleation rate calculation, we obtain J as a function of both carbon concentration and temperatures. As shown in
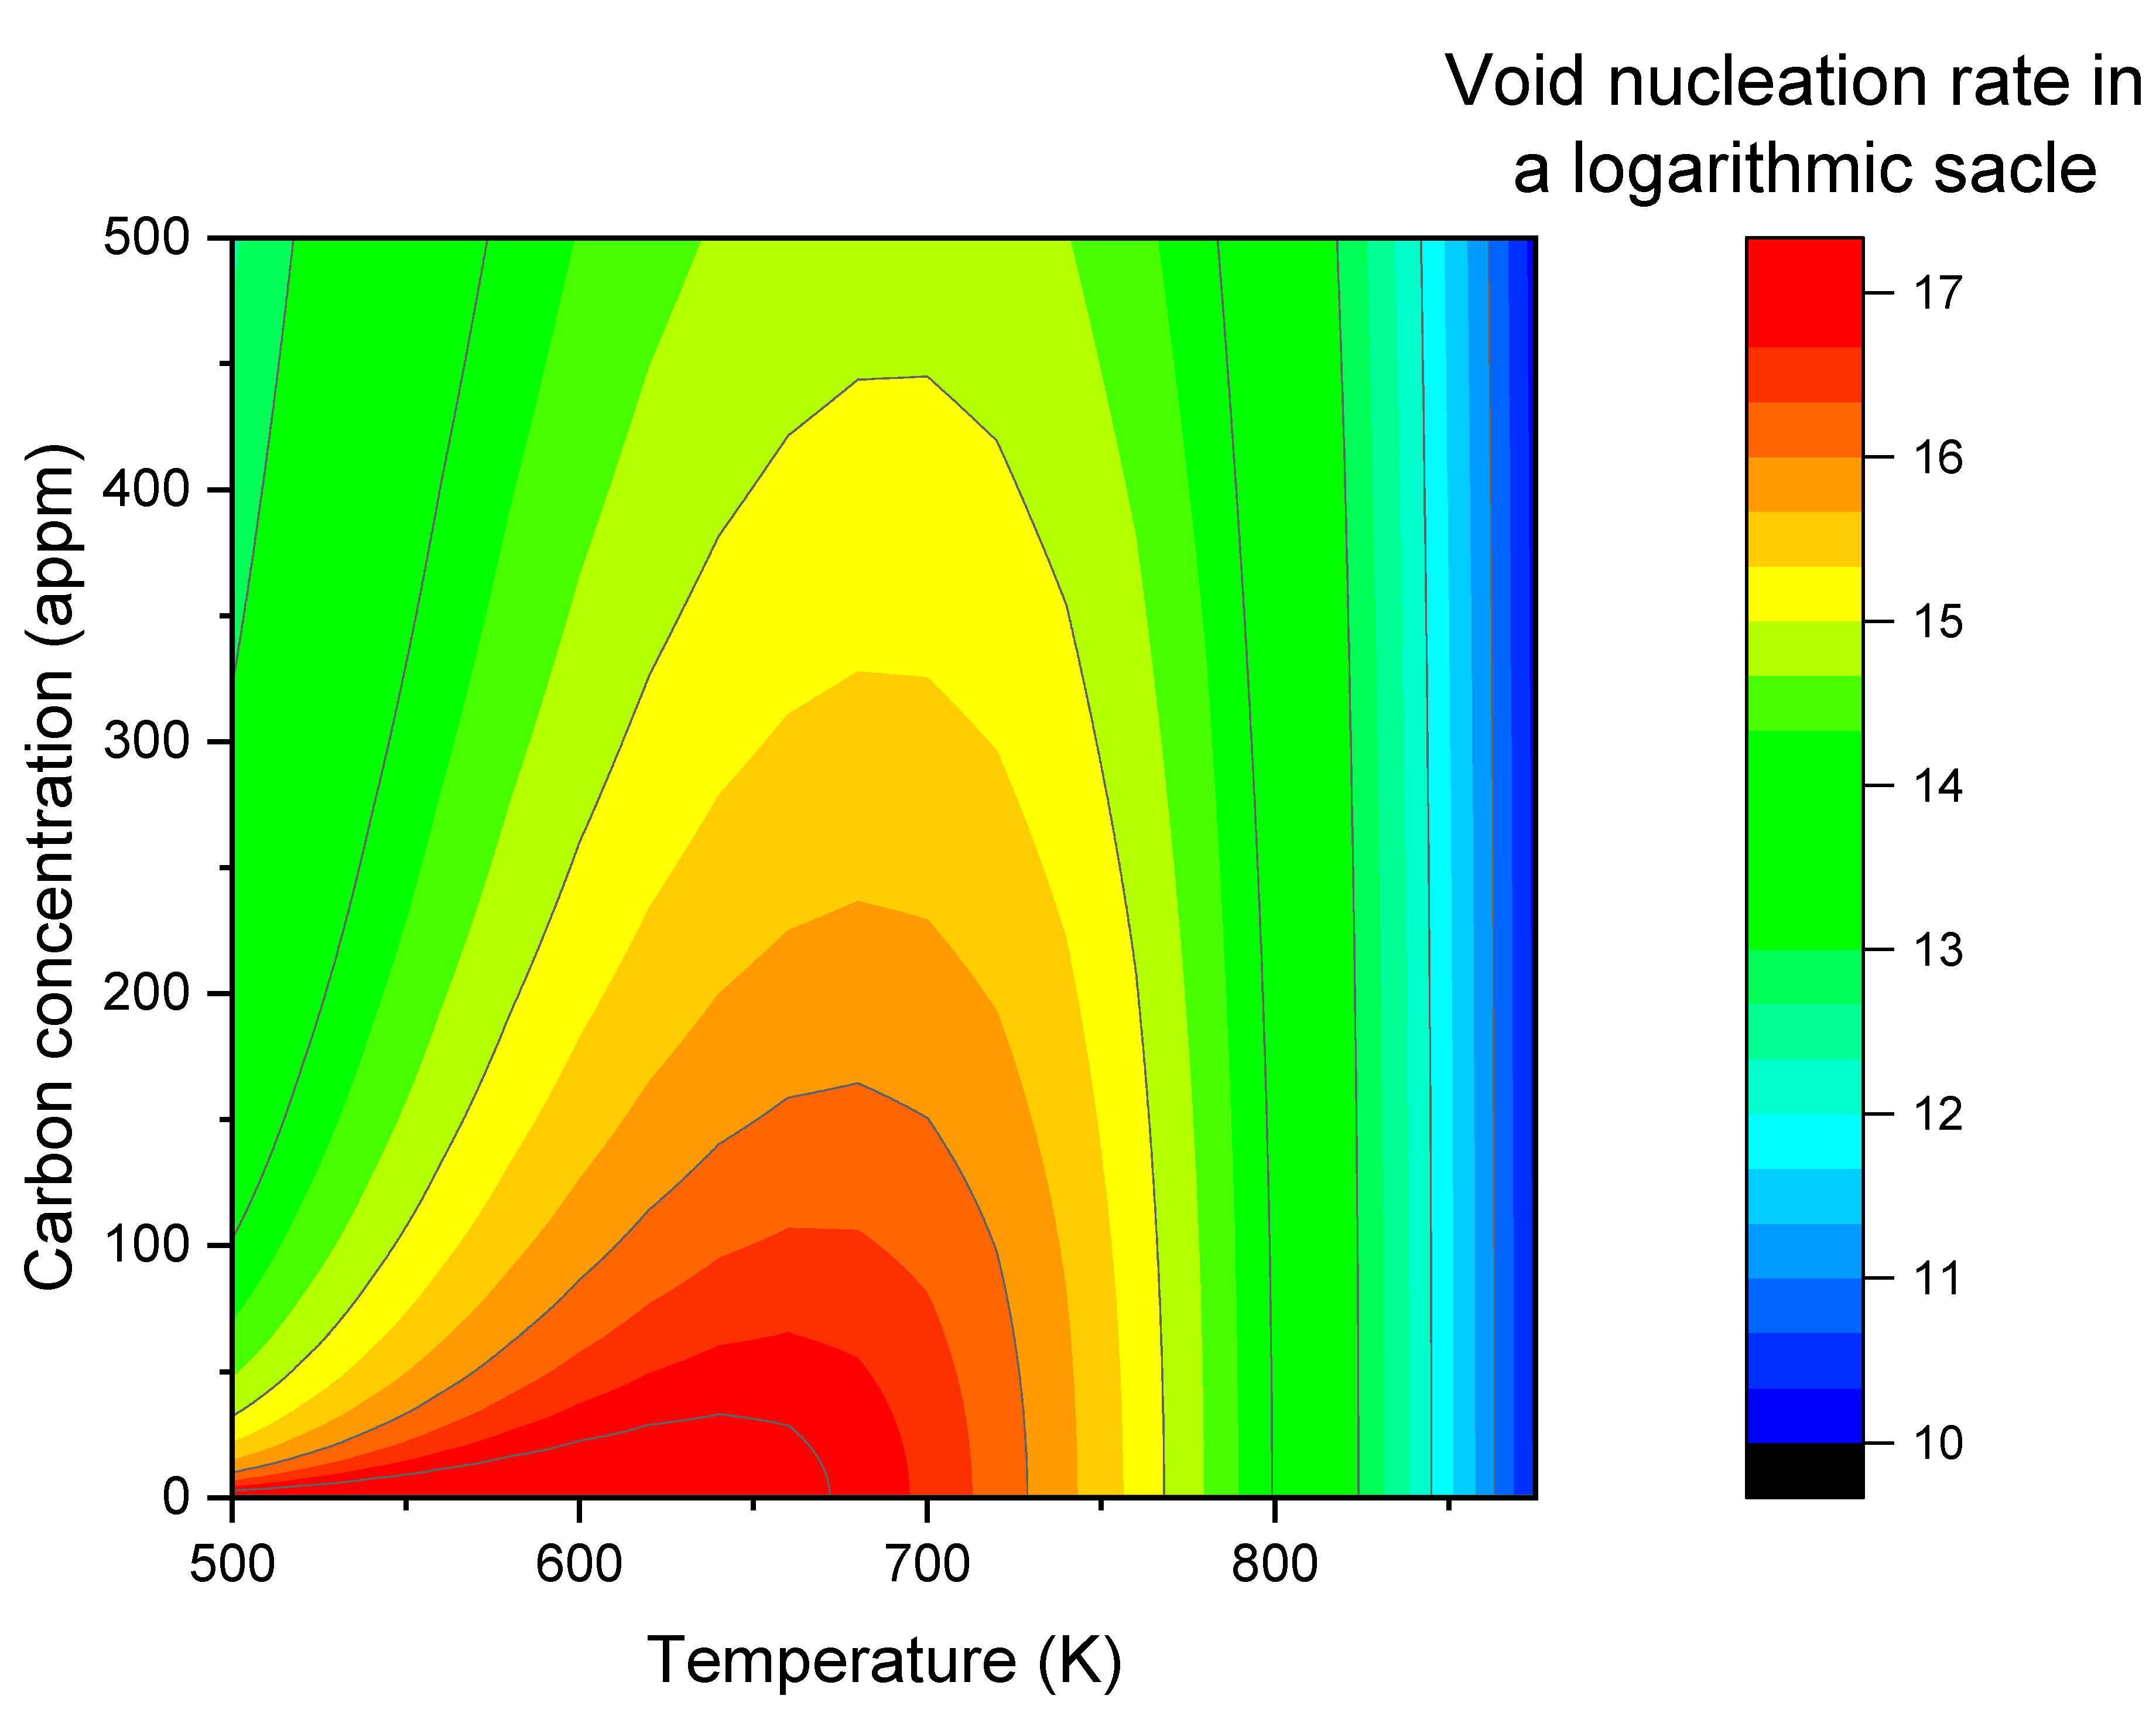
Figure 5, introducing carbon dramatically changes the contour map. At zero carbon concentration, the nucleation rate remains high at temperature below ~700K. However, with a small amount of carbon addition, nucleation rates quickly evolve into a temperature-dependent peak. As the carbon concentration increases, the peak height becomes lower, the peak width is narrower, and the peak center slightly shifts to a higher temperature.
In
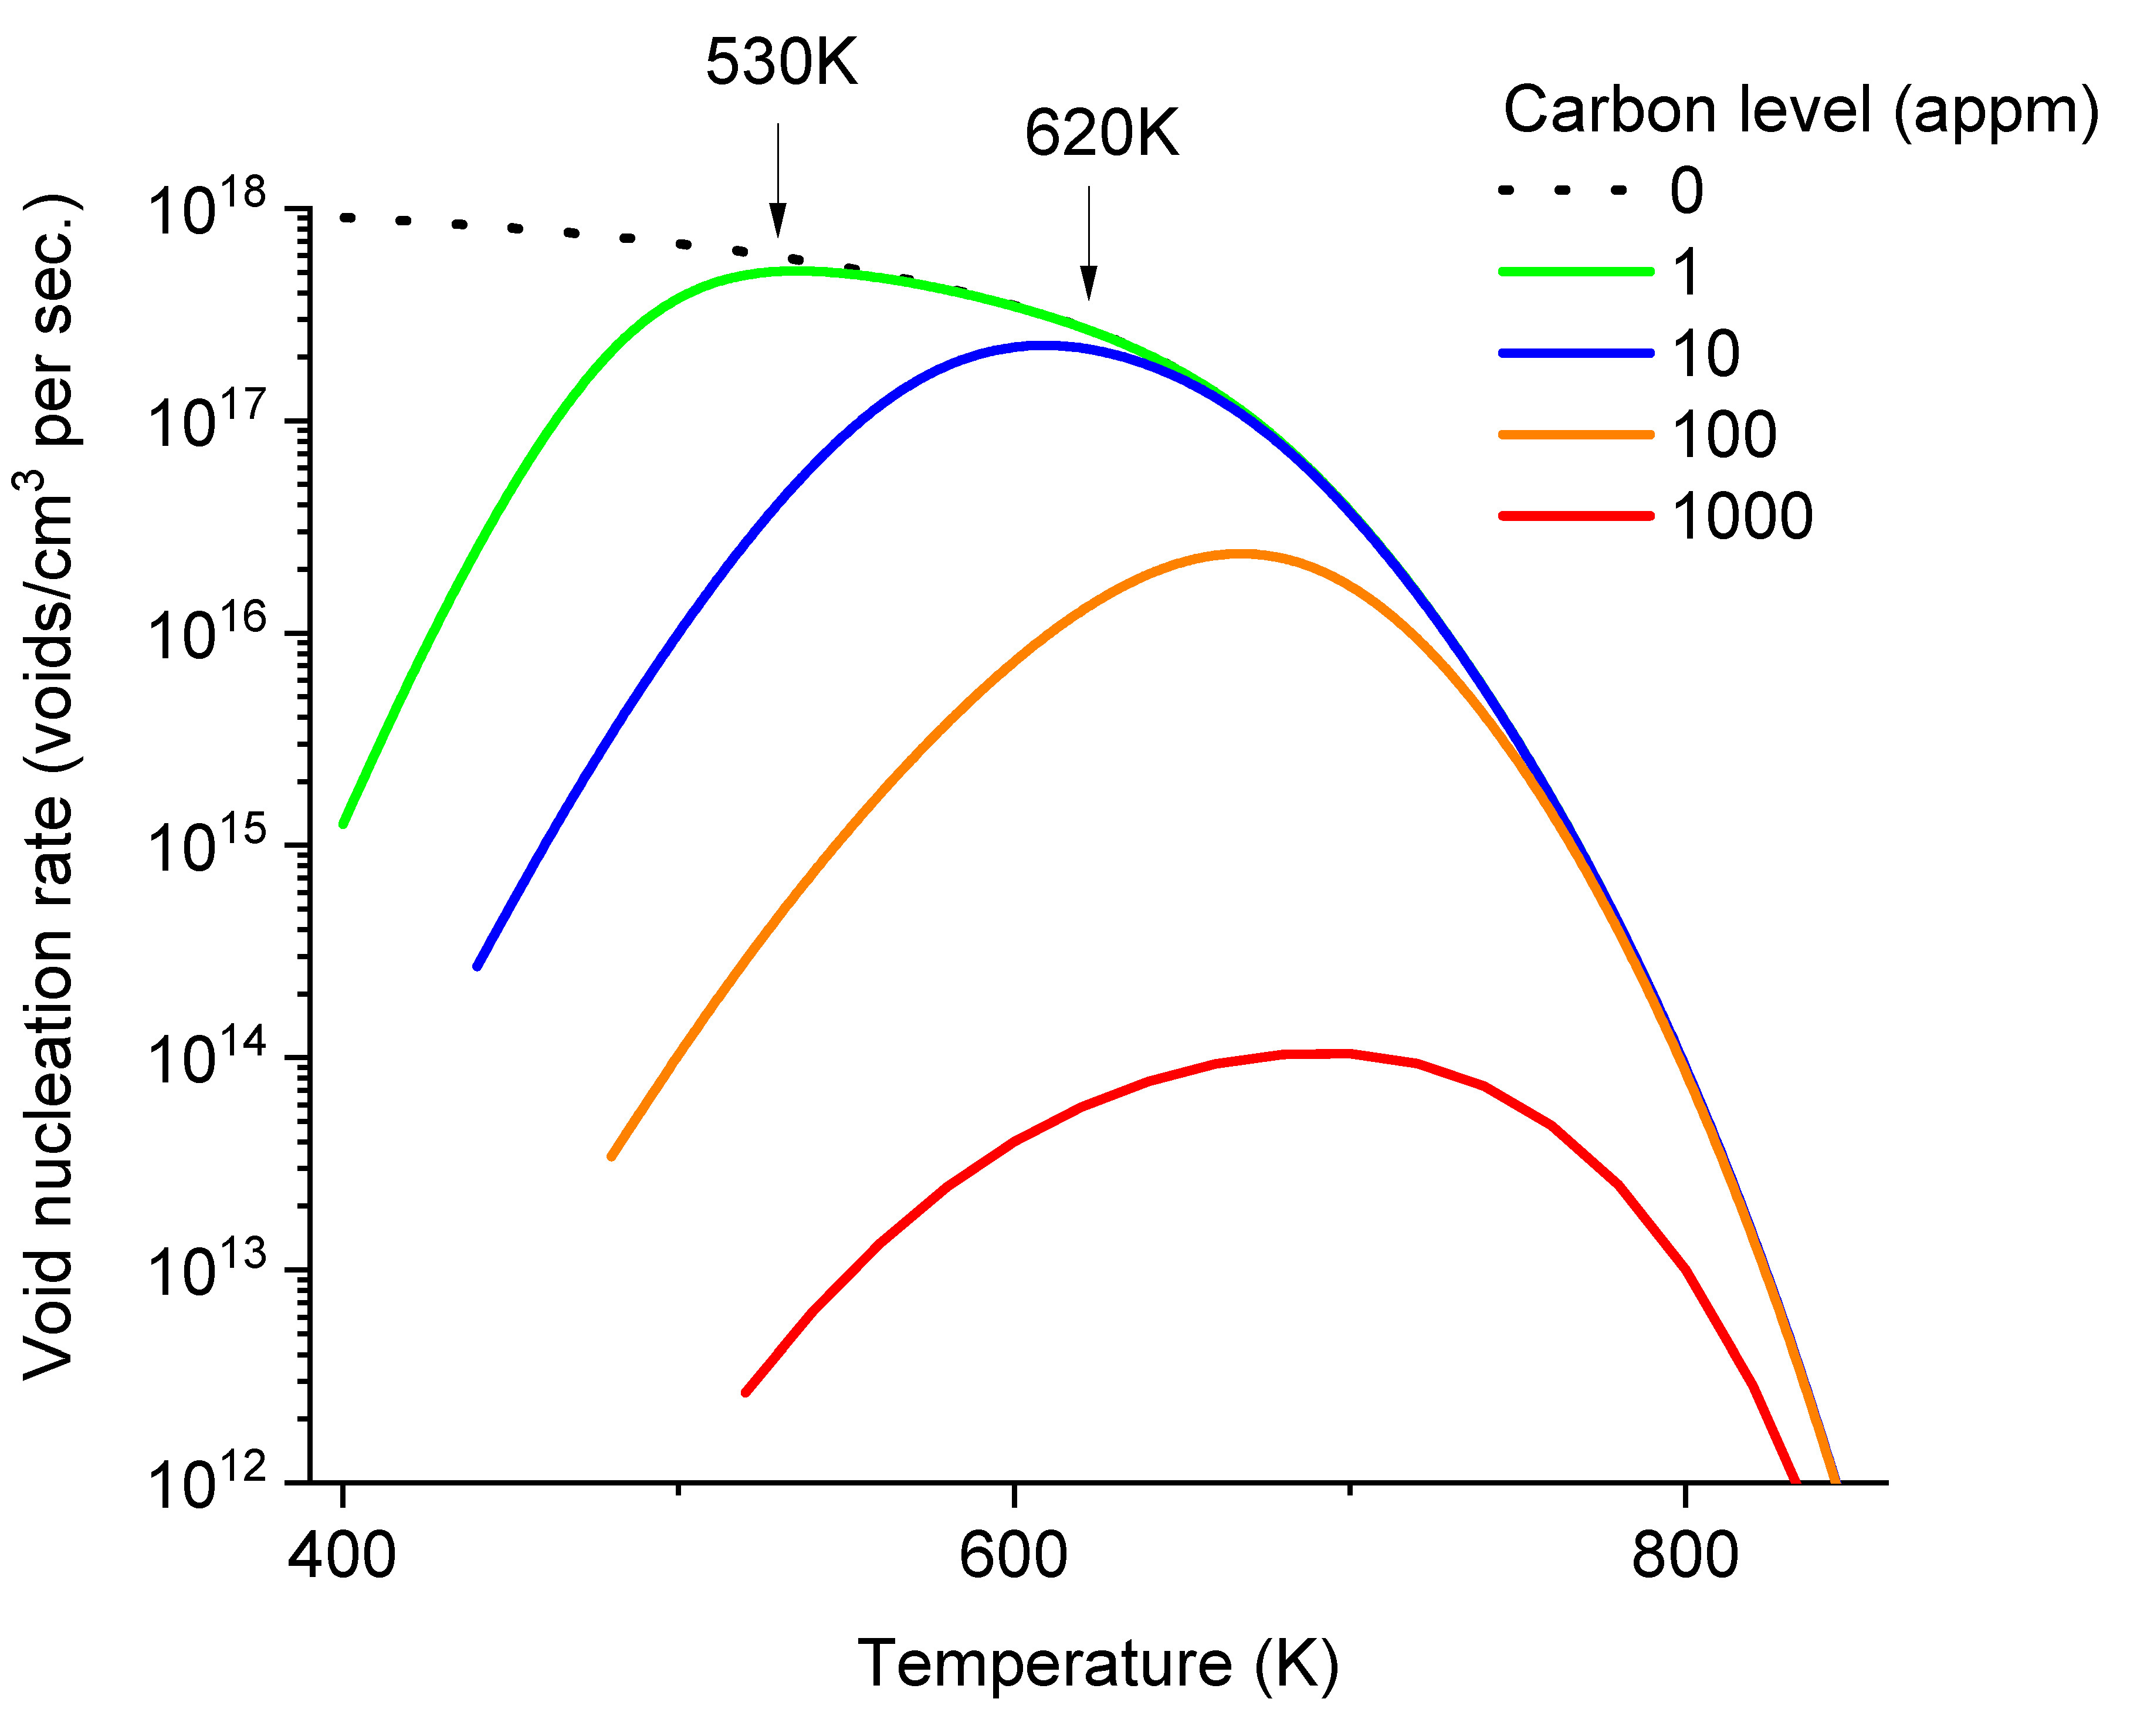
Figure 6, the void nucleation rates are plotted as a function of temperature while fixing carbon concentrations at distinct levels of 0, 1, 10, 100, and 1000 appm. At zero carbon concentration (dot line),
J remains above 3×10
17/cm
3 per second when temperature at 600K and below. Even with carbon levels as low as 1 appm, void nucleation begins to show a peak. The nucleation rates start to drop at temperatures ~530K and below. At a higher carbon level of 10 appm, the nucleation allowable temperature window is narrower, and the temperature of maximum void nucleation rate increases to about 600K. Additionally, at this carbon level, the peak nucleation rate is noticeably lower than in the carbon-free case. As shown by two arrows (one at 530K for 1 appm carbon and the other at 620K for 10 appm carbon), the temperatures at which void nucleation begins to deviate from the carbon-free case corresponds to the temperatures at which effective diffusivities of vacancies begin to deviate from the carbon-free case (as marked in
Figure 4). At a higher carbon level of 100 appm, the peak shifts to about 670K, and the peak height is about 25% of that in the carbon-free case at the same temperature. At the highest carbon level of 1000 appm, the nucleation peak is reduced by more than two orders of magnitude compared to the carbon-free curve at the same temperature.
One way to validate the carbon effect on effective vacancy diffusivity is to measure the width of the void denuded zone, denoted by
. According to the analytical solution of rate theory equations,
[
24]. Recent studies on Fe irradiated by self-ions at various temperatures, beam energies, and dpa rates have measured an effective vacancy activity energy of 1.65 eV for single crystal Fe containing a carbon background concentration of 103 appm [
3]. The Fe substrate was found to have a carbon background concentration of 103 appm. The experimentally extracted value of 1.65 eV aligns with the 1.91 eV predicted from
Figure 4, and is significantly larger than the 0.73 eV predicted for carbon-free cases.
Validation of void nucleation in carbon-free Fe is indeed very challenging due to various factors, including the difficult in manufacturing and irradiation testing. Carbon contamination has been an issue in prolonged accelerator-based ion irradiation testing and void disappearance has been frequently reported [
25,
26,
27]. Carbon contamination is not expected in reactor irradiation testing. However, parameters such as dpa rate, temperature, and neutron flux are all interlinked and coupled. Fixing other parameters and allowing temperature to be the single variable proves to be challenging in reactor experiments. The prediction of a non-zero void nucleation rate in carbon-free Fe at low temperatures is a subject that will be of interest for future studies, especially if low-temperature neutron irradiation can be achieved.
Testing low-temperature void nucleation is challenging in accelerator-based irradiation, with complexities extending beyond beam contamination. In the case of accelerator-based ion irradiation, heavy ions suffer from the injected interstitial effect [
28,
29,
30], which exhibits strong temperature dependence [
30]. The swelling suppression by the injected interstitials becomes more significant at lower temperatures [
30], leading to a suppression behavior similar to that of carbon. Proton irradiation can minimize the injected interstitial effects to a large extent. However, proton irradiation can introduce local beam heating, making it difficult for testing temperatures lower than 600K.
The findings presented in this study can provide insights into the significant data scattering observed in additively manufactured (AM) steels. Previous reports have indicated that AM steels exhibit reduced void swelling compared to wrought materials [
31,
32]. However, it is noteworthy that void swelling behavior can vary significantly among AM steels manufactured from different groups. One likely cause of such variation is the difficulty in controlling impurities during the additive manufacturing process. These impurities include elements such as carbon, oxygen, and nitrogen, as well as ambient gases used during the printing process. The presence and concentration of these impurities can have a considerable impact on the void swelling behavior of AM steels.
The high sensitivity of void swelling to carbon levels suggests that it is possible to alloy steels with a small amount of carbon. This can be done at a level that does not significantly alter the optimized mechanical properties but is sufficient to improve the resistance to void swelling. Indeed, nitrogen is another element that can have a similar effect on void swelling in steels. For instance, nitrogen-doped full ferritic HT-9 exhibits much less swelling compared to conventional HT-9 [
33].
The author gratefully acknowledge the support by Los Alamos National Laboratory, through Triad National Security, LLC, under award M2101345-01-47042-0000, and the support by National Nuclear Security Administration (NNSA) under award DE-NA0003921.
