1. Introduction
Skeletal muscle, which constitutes more than 40% of a body’s weight and storing approximately 50%–75% of all human protein in various forms, is the largest and one of the most critical organs in the body [
1]. Achieving and maintaining the normal growth and development of skeletal muscle requires a harmonious interplay of internal and external factors. Myogenesis is a highly orchestrated process that encompasses muscle stem cell activation, proliferation, differentiation, and fusion into multinucleated myotubes with contractile capacity [
2]. The regulation of myogenic processes predominantly depends on myogenic regulatory factors (MRFs), including myoblast determination protein (Myod1), myogenin (Myog), and muscle-specific regulatory factor 4 (Mrf4/Myf6), which govern myoblast proliferation, differentiation, and fusion. Additionally, the myocyte enhancer factor (Mef2a), which regulates the expression of MRFs and participates in the skeletal muscle-specific transcriptional processes regulated by MRFs [
3].
The intestinal micro-ecosystem, consisting of tens of billions of bacteria that colonize the host’s intestinal cavity, plays an indispensable role in the host’s overall health [
4]. An imbalance of the gut microbiota can cause substantial damage to the physiology of skeletal muscle [
5,
6,
7]. Short-chain fatty acid (SCFA) are produced through the fermentation of dietary fiber by intestinal flora [
8] and affect various physiological aspects of different organs, including protection against lung injury [
9], promotion of liver regeneration [
10], enhancement of cardiac metabolism [
11], improvement of brain function [
12] and strengthening of immune system functions [
13]. Acetate is the dominant SCFA in the peripheral circulation [
14] and is considered harmless [
15]. Nevertheless, the current understanding of how gut microbiota-derived acetate regulates skeletal muscle remains incomplete, especially, in the stage of rapid skeletal muscle growth.
Long non-coding RNA (lncRNA), which lacks protein-coding capacity and typically exceeds 200 nucleotides in length, possesses a wide array of biological functions [
16]. As a regulatory factor, it plays a pivotal role in the processes of skeletal muscle cell proliferation, differentiation, and muscle-related diseases [
17]. Recent researches has highlighted the role of lncRNA, serving as competing endogenous RNA (ceRNA) in affecting skeletal muscle growth and development. Examples include linc-MD1 [
18], lnc-MAR1 [
19], and lnc-IRS1 [
20]. Although the functions of these lncRNA have been elucidated in vivo and in vitro during myogenesis, the roles of other lncRNA await to discovery. Supplementing germ-free mice with SCFA brings their transcriptomes and chromatin states closer to those of mice colonized with gut microbiota [
21]. Furthermore, acetate supplementation significantly regulates the DNA methylation levels of the miR-378a promoter [
22], underscoring its irreplaceable role in host epigenetic regulation. LncRNA is crucial for epigenetic regulation; however, to the best of our knowledge, few studies have investigated the role of lncRNA involvement in acetate-mediated regulation of skeletal muscle growth and development in young mice.
Here, three experimental groups—SPF, GF, and GS—were prepared to evaluate the effect of acetate on the growth and development of skeletal muscle in young mice lacking gut microbiota. Our findings indicate that acetate mitigates the impairment to skeletal muscle growth and development in young mice induced by gut microbiota depletion and demonstrate that this is partially mediated by the Gm16062/miR-129-2-3p/Mef2a regulatory axis.
3. Discussion
Acetate is not only the most predominant SCFA, accounting for more than 60%, but also the primary SCFA entering the peripheral circulation [
27,
28,
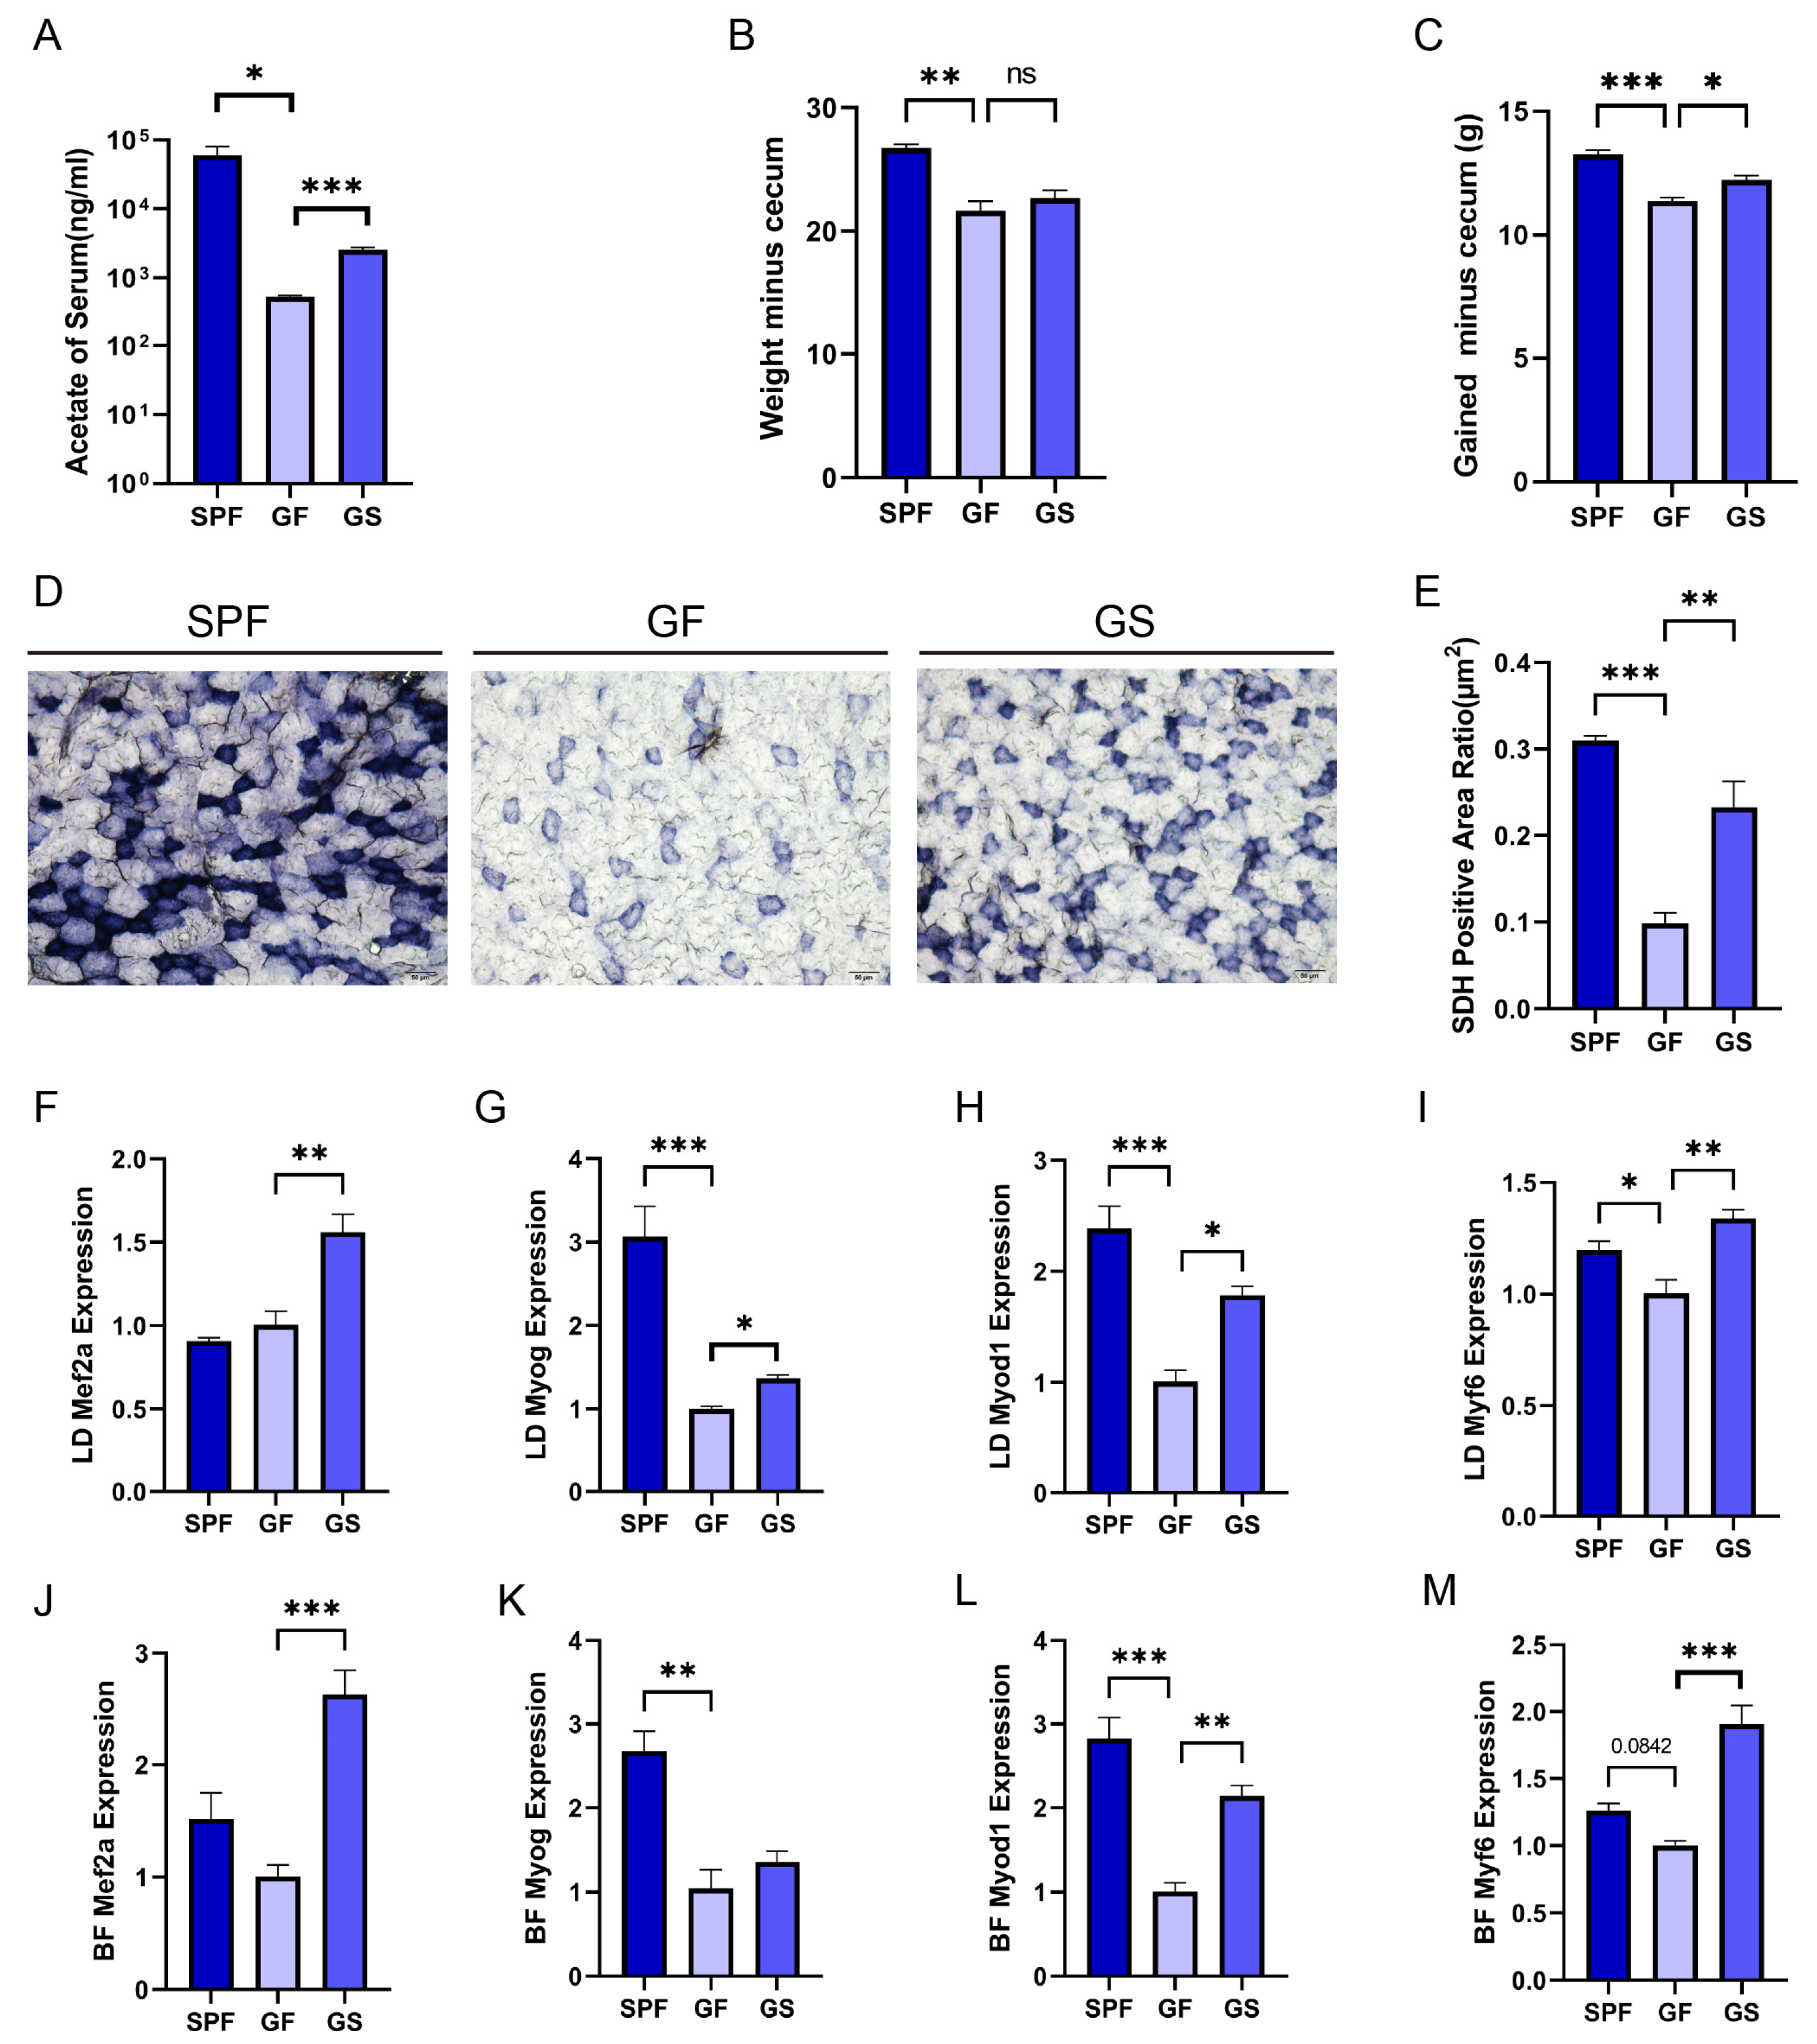
29]. Herein, we demonstrated that the concentration of acetate in the serum of SPF mice was substantially higher than that of GF mice, and it was associated with higher body weight gain (except for cecum weight) and SDH activity, compared to the GF group. It is worth noting that the minimal amount of acetate detected in the serum of GF mice may have originated from their dietary intake [
30]. We therefore speculated that a high concentration of acetate in the peripheral circulation may play a pivotal role in regulating the growth and development of peripheral tissues and organs.
The loss of gut microbiota has been shown to lead to skeletal muscle atrophy and decreased expression of MRFs in mice and Bama pigs [
5,
6]. Liu and Qiu also proposed that skeletal muscle atrophy caused by aging is closely related to gut microbiota disorder [
31,
32]. The absence or perturbation of gut microbiota can therefore substantially impair the physiological function of skeletal muscle. In contrast, in this study acetate promoted the expression of MRFs across multiple skeletal muscle tissues of the GF group. A few previous studies have demonstrated that acetate has a positive effect on skeletal muscle, such as the study by Maruta et al., which showed that long-term acetate supplementation can mitigate aging-induced loss of muscle mass [
33] and by Lahiri et al., which showed that treatment of GF mice (6 to 8 weeks of age) with a cocktail of SCFAs increased skeletal muscle mass [
5]. However, against the background of gut microbiota deficiency, the impact of acetate on the skeletal muscle growth and development of young mice is still worthing exploring. In this study, the concentration of acetate in the serum of the GS group significantly increased following SA supplementation and exhibited a higher body weight gain (except for cecum weight) and SDH activity, compared to the GF group. Additionally, the absence of gut microbiota inhibited the expression of MRFs in multiple skeletal muscle tissues.
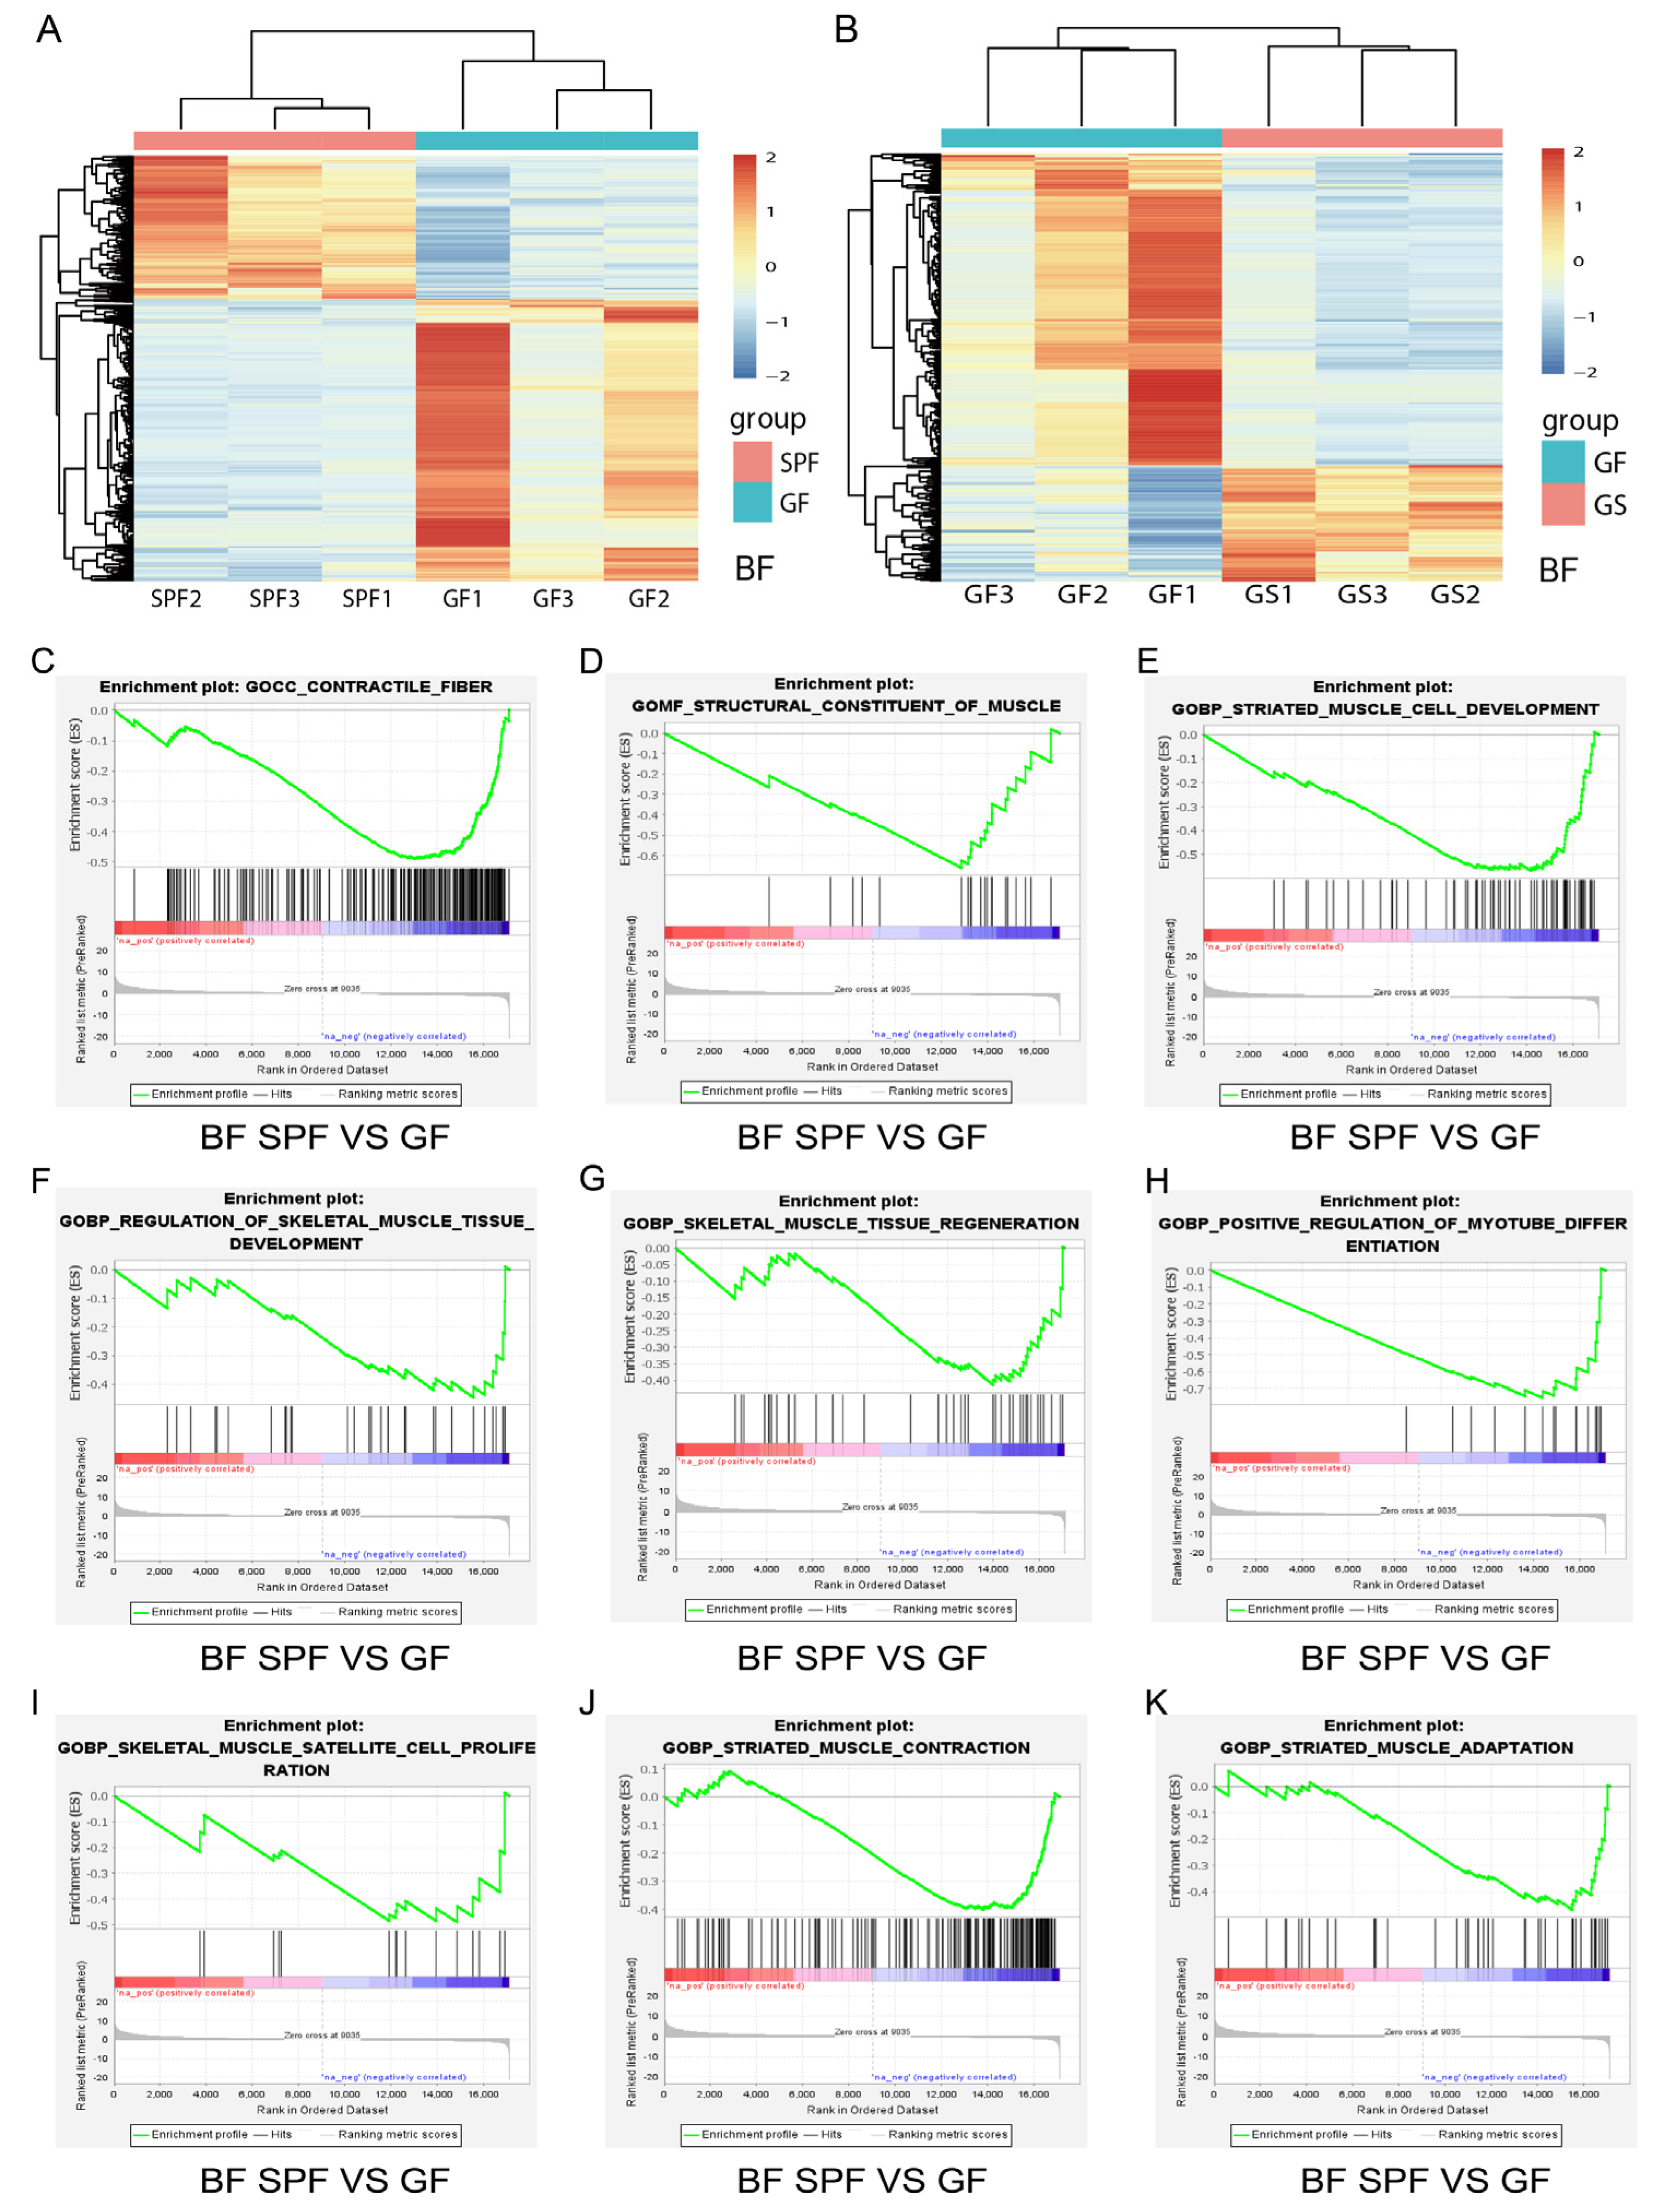
Furthermore, the transcriptome sequencing was employed to determine the effect of gut microbiota deficiency and the impact of acetate on the skeletal muscle growth and development of GF mice. GSEA revealed that gut microbiota deficiency had a detrimental effect on skeletal muscle growth and development, including regulation of skeletal muscle tissue development, skeletal muscle tissue regeneration, regulation of myoblast differentiation, and skeletal muscle cell proliferation. These findings align with the emerging concept of the gut–muscle axis, in which the absence or dysfunction of gut microbiota has a negative influence on the mass and function of skeletal muscles and is associated with sarcopenia and cachexia [
5,
34]. Moreover, specific intestinal probiotics, such as Lacticaseibacillus casei LC122 and Bifidobacterium longum BL986, are crucial to the physiological function of skeletal muscle [
31,
34]. In addition, it has been reported that specific foods can significantly alter the abundance of Lactobacillaceae in the gut [
35]. Therefore, investigation of specific probiotics that are beneficial to skeletal muscle growth and development is warranted. Furthermore, elucidating the regulatory relationships among specific foods, gut microbiota, and skeletal muscle may help to optimize dietary structure.
Moreover, The GSEA revealed that acetate promoted skeletal muscle growth and development in GF mice, including regulation skeletal muscle cell differentiation, positive regulation of skeletal muscle tissue development, and skeletal muscle tissue regeneration. We observed that acetate mitigated the inhibitory effects of gut microbiota depletion on skeletal muscle cell differentiation, both in LD and BF. Therefore, we suggest that acetate may be more favorable for skeletal muscle cell differentiation. It is important to note that besides acetate, the gut microbiota also produces various other metabolites, including branched-chain amino acids, biogenic amines, bile acids, trimethylamine N-oxide, tryptophan, and indole derivatives [
36]. In recent years, bile acids have been demonstrated to affect glucose metabolism, insulin sensitivity, metabolic dysfunction, mass, and atrophy of skeletal muscle [
32,
37,
38,
39]. Meanwhile, regarding branched chain amino acids, it has been reported that skeletal muscle growth and development are closely related to branched chain amino acid metabolism [
40,
41]. Therefore, an intriguing avenue for future exploration is whether metabolites other than acetate produced by gut microbiota also play a role in regulating skeletal muscle growth and development. Collectively, the above evidence indicates that acetate can alleviate the impairment of skeletal muscle growth and development induced by gut microbiota depletion.
In our study, co-expression analysis demonstrated the involvement of lncRNA in the regulatory network underlying the acetate mediated alleviation of skeletal muscle growth and development retardation induced by gut microbiota depletion. LncRNA was initially considered to be genomic transcription “noise” [
42]. However, mounting evidence has underscored that lncRNA plays a crucial role in regulating myogenesis. Examples include linc-MD1 [
18], lnc-MAR1 [
19], and lncIRS1 [
20]. Herein, we identified a new lncRNA, Gm16062, to be upregulated by acetate in skeletal muscle cells in vivo and in vitro. The functional mechanisms of lncRNA often hinge on their subcellular localization [
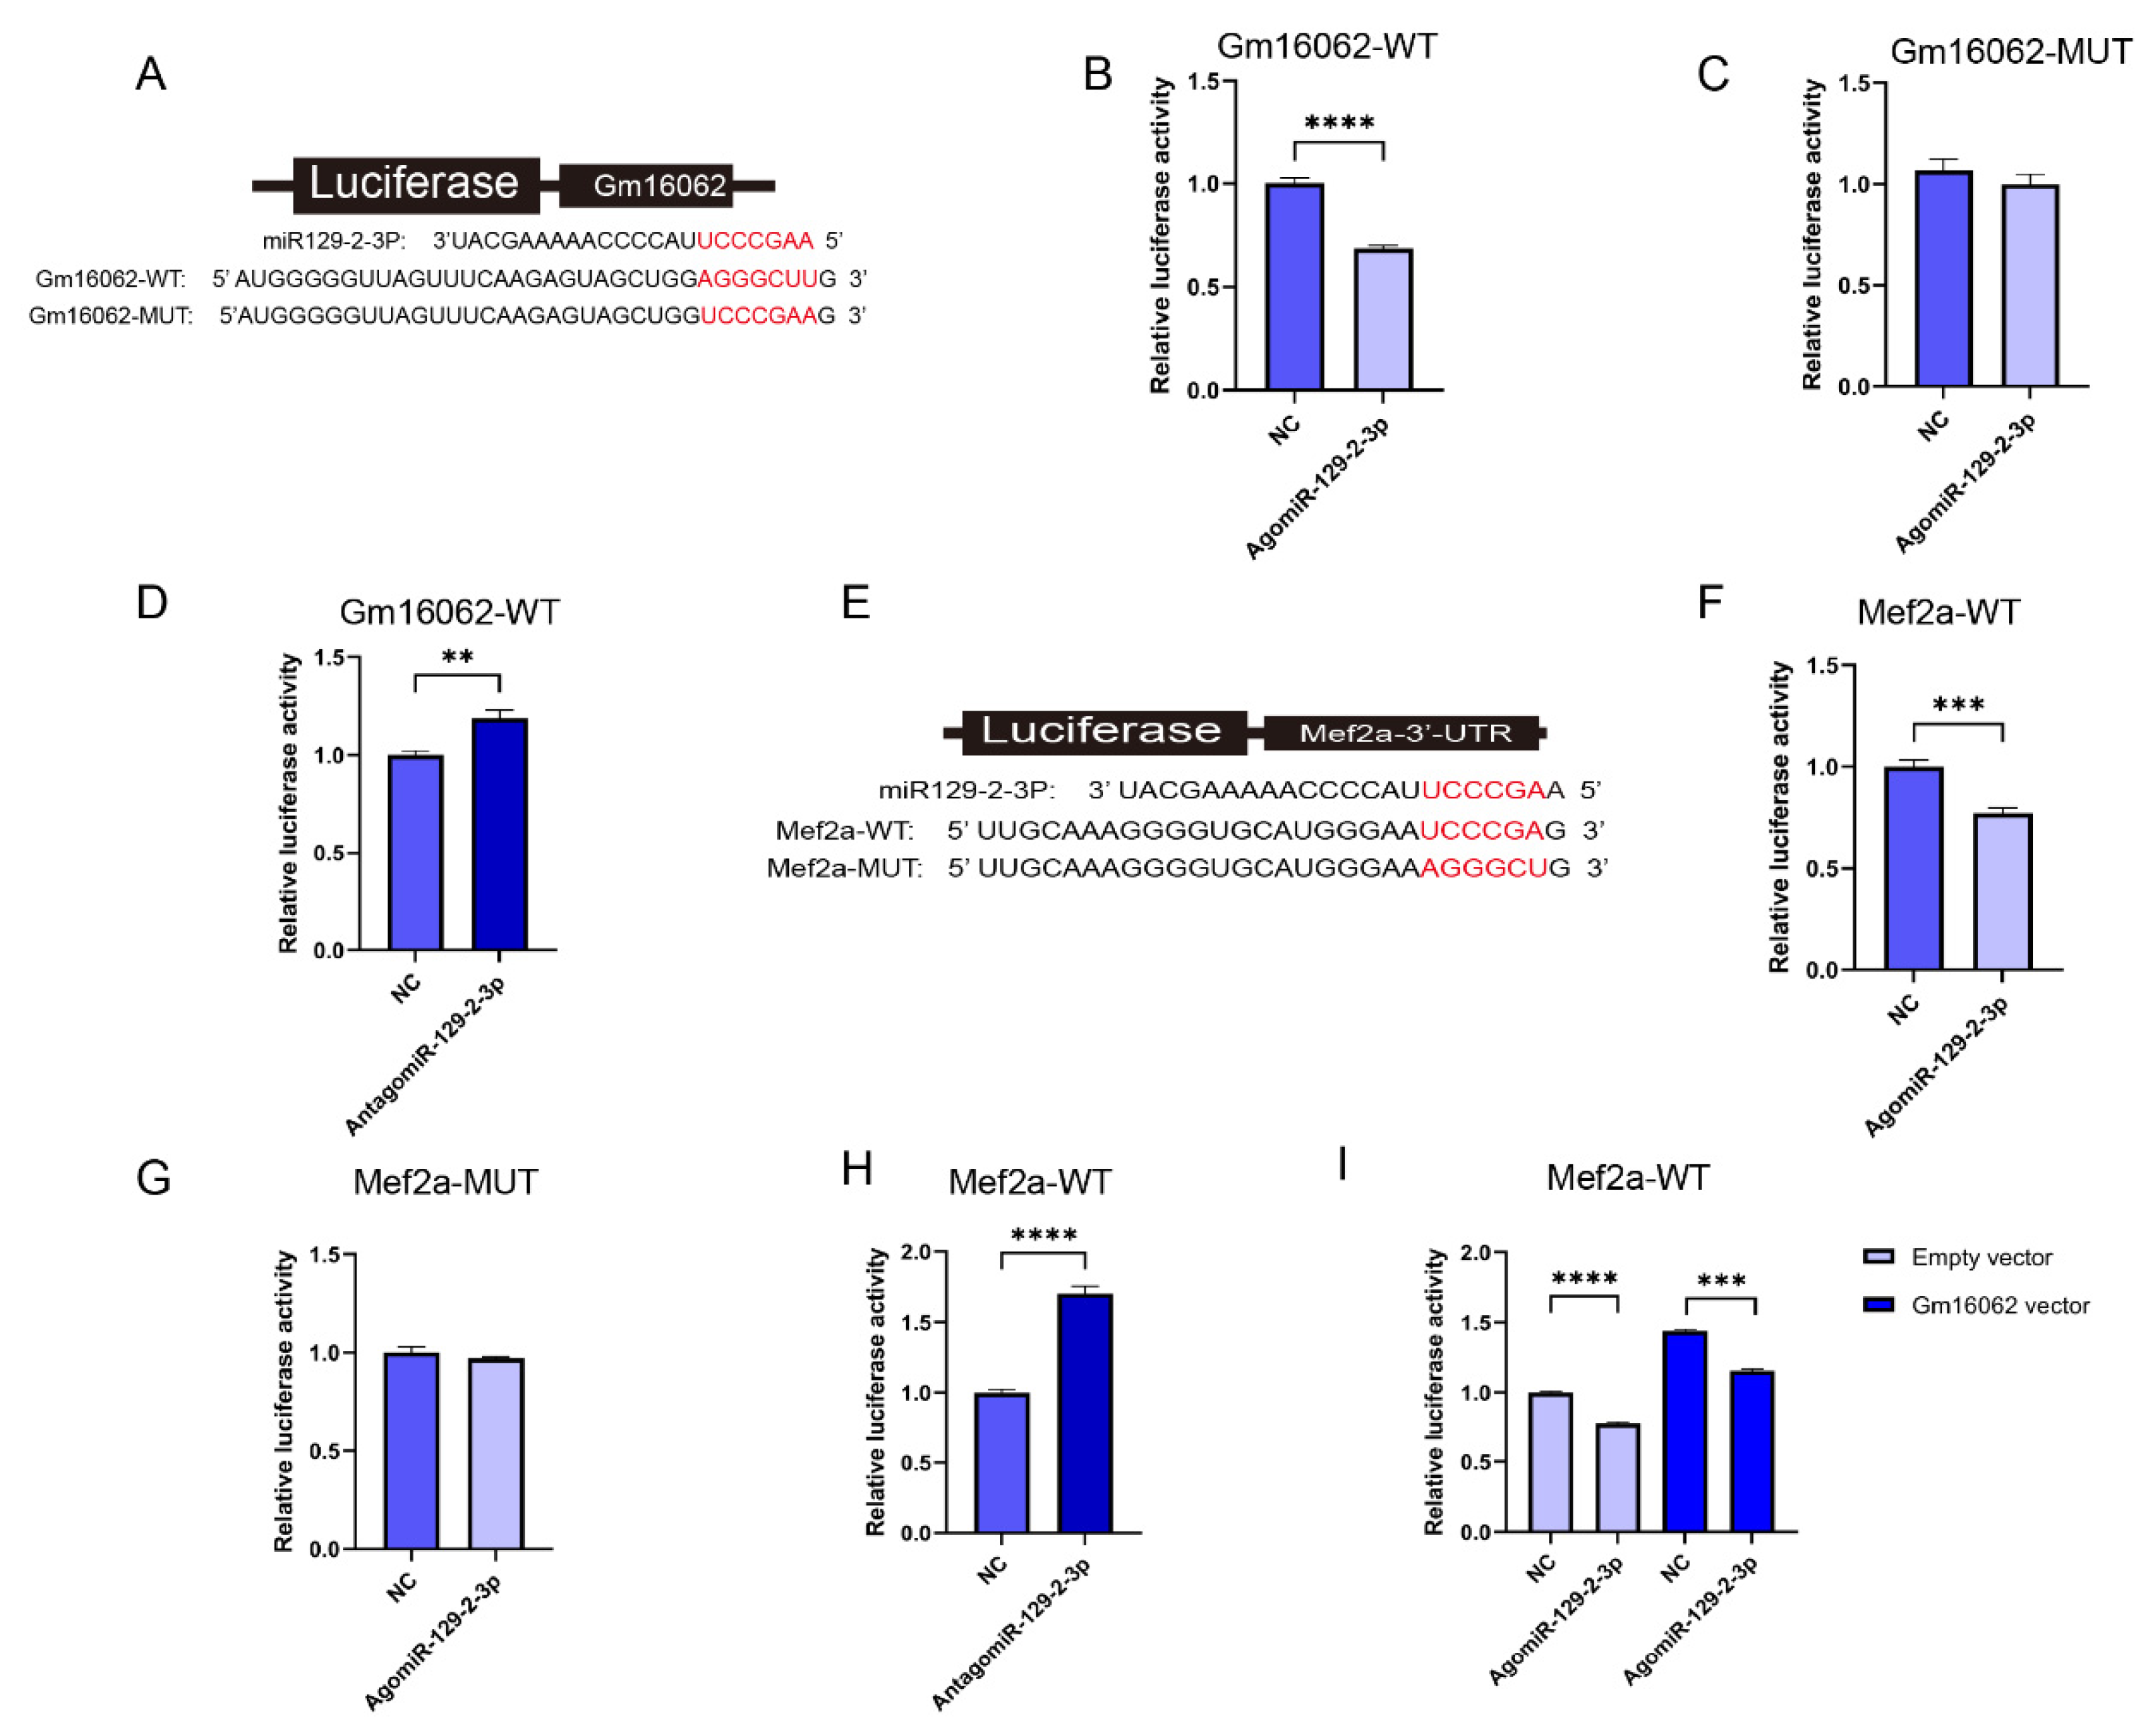
43], Finally, our findings indicated that Gm16062 regulates C2C12 myogenesis as a ceRNA, mechanistically, Gm16062 sponges miR-129-2-3p, thereby liberating the inhibitory effect of miR-129-2-3p on Mef2a to up-regulate the expression of Myod1 and Myog. It is noteworthy that miR-129-5p, in the same family as miR-129-2-3p, inhibits C2C12 myogenesis by targeting Mef2a [
44]. Bioinformatics analysis revealed that Mef2a is also the target gene of miR-129-2-3p. In this study, we found that miR-129-2-3p inhibited C2C12 myogenesis by targeting Mef2a.
In recent decades, significant progress has been made in understanding the intricate interplay between gut microbiota and skeletal muscle. Herein, we demonstrated that a lack of gut microbiota severely inhibits skeletal muscle growth and development in young mice. Conversely, acetate can alleviate the retardation of skeletal muscle growth and development induced by gut microbiota depletion in young mice. Furthermore, we have showed that the Gm16062/miR-129-2-3p/Mef2a regulatory axis partially mediates how acetate improves the retardation of skeletal muscle growth and development induced by gut microbiota depletion. These outcomes provide a novel insight into the underlying mechanisms by which acetate (gut microbiota metabolites) modulates skeletal muscle and inform future research on therapeutic strategies aiming to optimize skeletal muscle function.
4. Materials and Methods
4.1. Mice and Sampling
All animal protocols were approved by the Animal Care and Ethics Committee of the College of Animal Science and Technology, Sichuan Agricultural University, Chengdu, China (approval number: DKY-S2020202037; 18 May 2022). In details, nine 3-week-old healthy male C57BL/6JGpt mice were selected, including three specific-pathogen free (SPF) mice and six germ-free (GF) mice. The SPF mice were allocated to the SPF group; the GF mice were randomly and evenly divided into the GF group and GS groups; The GS group was treated with 150 mmol/L [
22] of sodium acetate (SA) (purity ≥99%, Sigma, USA) in their drinking water throughout the entire experimental period. The GF mice were housed in special plastic isolators (GemPharmatech, Nanjing, China), and the SPF mice were housed in IVC cages in an environment with a temperature 23 ± 2°C, humidity of 40-70%, noise of ≤ 60 dB, and illumination of 15-20 lx (under a strict 12 hours light cycle). All mice in each group were weighed after 3 days of acclimatization, and a 6-week experiment was initiated. During the experiment, the drinking water was changed twice a week and sufficient feed was provided. At the end of the experiment, the mice in each group were weighed, and the feces of the mice in each group were collected into sterile centrifuge tubes and frozen for subsequent analysis. The serum was also collected, and then, the mice were euthanized via cervical dislocation. The longissimus dorsi (LD), psoas major (PM), biceps femoris (BF), gastrocnemius (Gas), and tibialis anterior (TA) were collected.
4.2. Sequencing and Analysis
The total RNAs of the tissues and cells was extracted according to the instructiong of the HiPure Universal RNA Mini Kit instructions (Magen, China). The library (ribosomal RNA removal) was constructed and paired-end reads of 150-bp in length were generated on the Illumina Nova6000 platform. The protein coding gene (PCG) and lncRNA reference transcript file and genome annotation files, were obtained from the GENCODE website. The transcript-level quantification was completed using kallisto [
45] software, and gene-level quantification (Transcripts Per Kilobase of exon model per Million mapped reads, TPM) was determined using the R package Tximport. Gene differential expression analysis was performed using DESeq2. The criteria used to identify differentially expressed genes were |log2FC| ≥ 1.0 and a P-value ≤ 0.05.
4.3. Co-expression Analysis between PCG and lncRNA
Gene Ontology (GO) enrichment analysis based on the co-expression analysis was performed to examine the potential biological functions of the identified lncRNA. We calculated the Pearson correlation coefficients between PCG and lncRNA using the R package Hmisc, where only PCG was selected with |r| ≥ 0.8 and a P-value ≤ 0.05 against lncRNA. The selected PCG was further analyzed for Gene Ontology (GO) enrichment using the Metascape. Specifically, GO terms related to muscle growth and development were visualized using the R package ggplot2.
4.4. Gene Set Enrichment Analysis (GSEA)
To determine whether the GO item related to muscle growth and development have significantly changed between groups, we used the GSEA analysis tool to interrogate specific gene sets that relate to muscle growth and development against our pre-ranked PCG expression data. Only GO terms with an FDR ≤ 0.25 and a P-value ≤ 0.05 were considered significantly changed.
4.5. 16S rRNA Sequencing
Bacterial genomic DNA from fresh stool samples was extracted using a DNA stool kit. The 16S rRNA V3~V4 hypervariable region sequence was amplified using the forward primer 5’-CCTAYGGGRBGCASCAG-3’ and the reverse primer 5’- GGACTACNNGGGTATCTAAT -3’, and sequenced on the Illumina NovaSeq platform to obtain 250bp paired-end data. Sequence data analyses were performed using QIIME2.
4.6. Gas Chromatograph–Mass Spectrometry (GC-MS)
For serum isolation, blood samples were collected from fasted mice, separated by centrifugation at 3000 g for 5 min at room temperature. The composition of acetate was determined by Beijing Masspeaks Technology Co., Ltd. (Beijing, China) using GC-MS (Agilent, USA).
4.7. Fluorescence In Situ Hybridization (FISH)
An oligonucleotides probe (RiboBio, China) targeting Gm16062 was modified with Cy3. Briefly, for Gm16062 FISH, cells were fixed using 4% polyformaldehyde (BOSTER, China), permeabilized using Triton X-100 (Beyotime, China), and hybridized with the Gm16062 probe in buffer overnight at 37 ̊C. Then, the nuclei were stained with DAPI (RIB Bio, China). Images were visualized using a laser scanning confocal microscope (Nikon, Japan).
4.8. CCK-8 Assay
SA cytotoxicity was assessed using the Cell Counting Kit-8 (CCK-8) assay (Beyotime, China). In details, the C2C12 cells were seeded in 96-well plates and cultured in growth medium. When the cell confluence reached 50%~60%, the cells were treated with different concentrations of SA and cultured for 24 hours. Then, the CCK-8 reagent was added to each well for 1 h at 37°C. Finally, the absorbance was measured at 450 nm using a chemiluminescent microplate detector (Bio-tek, USA).
4.9. RT-qPCR
Reverse transcription quantitative PCR (RT-qPCR) was performed according to the manufacturer’s instructions. In brief, the reverse transcription of PCG and lncRNA from total RNA was accomplished using the PrimeScriptTM RT Reagent Kit with gDNA Eraser (Takara, Japan); the reverse transcription of miRNA from total RNA was accomplished using the Mir-X miRNA First-Strand Synthesis Kit (Takara, Japan). The relative abundance of the gene was determined using TB Green
® Premix Ex Taq™ II (Takara, Japan) under QuantStudioTM Flex System (Thermo Fisher Scientific, USA) protocols. Finally, relative gene expression values were calculated using the 2
ΔΔT [
46] method. The gene specific-primer sequences are listed in
Supplementary Table S1.
4.10. Immunofluorescence Staining and Fusion Index
C2C12 cells were fixed in 4% paraformaldehyde for 30 min and permeabilized in Triton X-100 for 20 min at room temperature. C2C12 cells were then blocked with goat serum (Beyotime, China), and incubated with primary anti-MYH4 (Myosin heavy chain 4, MYH4) (Abcam, 1:100, USA) at 4°C overnight. The cells were then incubated with Cy3 Goat Anti-Mice IgG secondary antibody (ABclonal, 1:200, China) at room temperature for 1h and nuclei were labeled with DAPI (Beyotime, China). Images were captured using a fluorescence microscope (Leica, Germany). Myotube fusion index was calculated by ImageJ.
4.11. Succinate Dehydrogenase (SDH) Staining
For histological staining, serial cross-sections (14 μm thick) were cut from the BF muscle, fixed in an optimal cutting temperature compound (Sakura, USA), and frozen in liquid nitrogen. An SDH staining kit (Solarbio, China) was used to identify SDH-positive area, and then SDH positive area ratios were calculated using ImageJ.
4.12. Cell Culture, Treatment, and Transfection
The C2C12 cell line was obtained from Sichuan Agricultural University, and cultured with Dulbecco’s modified Eagle’s medium (DMEM) (Hyclone, China) supplemented with 10% fetal bovine serum (Gibco, USA) and 1% penicillin/streptomycin (Procell, China) at 37°C in a 5%(v/v) CO2 incubator. To induce differentiation the medium was changed to DMEM containing 2% horse serum (Thermo, USA) and 1% penicillin/streptomycin after cells reached 70% confluency. For the cell treatments, myotubes were treated with a vehicle or SA solutions of different concentrations. The pcDNA3.1-Gm16062 (Gm16062 vector) and pcDNA3.1-NC (empty vector) were manufactured by RIB Bio; agomiR-129-2-3p, antagomir-129-2-3p and the negative control (NC) were manufactured by TsingKe Biotech. Transient transfection of cells was performed in a 12-well plate or 24-well plate using Lipofectamine 3000 reagent (Invitrogen, USA) or HiPerFect (Qiagen, Germany) according to the manufacturer’s direction.
4.13. Luciferase Reporter Assay
According to the information on the binding site of Gm16062 and Mef2a-3’UTR with the miR-129-5p seed sequence, respectively, pmirGLO-Gm16062-WT(Gm16062-WT), pmirGLO-Gm16062-Mutate (Gm16062-MUT), pmirGLO-Mef2a-3’UTR-WT(Mef2a-WT), and pmirGLO-Mef2a-3’UTR-Mutate (Mef2a-MUT), were manufactured by TsingKe Biotech respectively. For luciferase reporter analysis, plasmid or nucleic acid molecules were transfected into the cells according to the experimental design, using Lipofectamine3000 or HiPerFect. After 48 h, the luciferase activity analysis was performed using the Dual Luciferase Reporter Gene Detection Kit (Beyotime, China). Firefly luciferase activity was normalized against Renilla luciferase activity.
4.14. Data Statistics Analysis
The data visualization involved in this experiment was completed using GraphPad Prism 9.0, R 4.2.1 language, and Cytoscape 3.9.1, and determining the normal distribution of values was a priority before unpaired Student’s t-test and one-way ANOVA with Tukey’s post-hoc test were used to evaluate the differences between two and three groups, respectively. The results are expressed as the mean ± SEM. *P<0.05, **P<0.01, ***P<0.001, and ****P<0.0001.
Author Contributions
Conceptualization, Guitao YANG, Jinwei ZHANG and Jideng MA; methodology, Jinwei ZHANG and Yan LIU; data curation, Dengfeng Xu, Lu LU, and Keren LONG; writing—original draft preparation, Guitao YANG and Yan LIU; writing—review and editing, Jideng MA; visualization, Jinwei ZHANG; supervision, Xuewei LI, Jing SUN and Liangpeng GE; project administration, Xuewei LI, Jing SUN and Liangpeng GE; funding acquisition, Jideng MA. All authors have read and agreed to the published version of the manuscript.
Figure 1.
Acetate relieved the gut microbiota depletion induced inhibition of the physiological functions and MRFs expression in skeletal muscle. A. Concentration of acetate in the serum detected using GC-MS. B. Body weight minus cecum weight. C. Body weight gain (except cecum weight). D. Representative images of BF muscle sections from stained for the enzyme SDH (20×, scale bar, 50 μm). E. Quantitative analysis of the ratio of SDH-positive area using ImageJ. F-M. Detection of LD(F-I) and BF (J-M) expression of Mef2a, Myod1, Myog and Myf6 using RT-qPCR, respectively. All data are expressed as the mean ± SEM (n = 3 per group) and the “n” defines the number of biological replicates. Data were analyzed using one-way ANOVA test and were considered statistically significant, at *P < 0.05, **P < 0.01, and ***P < 0.01 between the indicated groups.
Figure 2.
The transcriptome differences in BF and GSEA reveal that the absence of gut microbiota inhibited the growth and development of BF in the GF group. A, B. Heatmap of the differentially expressed genes of in BF in the SPF vs. GF (A) and GF vs. GS (B) groups. C-K. Compared to the SPF group, loss of gut microbiota inhibited the contractile fiber (C), structural constituent of muscle (D), striated muscle cell development (E), regulation of skeletal muscle tissue development (F), skeletal muscle tissue regeneration (G), positive regulation of myotube differentiation (H), skeletal muscle satellite cell proliferation (I), striated contraction (J) and striated muscle adaptation (K) biological processes in the BF muscle of the GF group. A permutation test was applied to the analysis. n = 3 per group, and the “n” defines the number of biological replicates.
Figure 3.
The lncRNA participated in the regulatory network underlying how acetate alleviates the impaired growth and development of skeletal muscle in mice caused by gut microbiota depletion. A, B. GO enrichment analysis accomplished based on the co-expression analysis between differentially expressed PCG and lncRNA of BF (A) and LD (B), respectively. C. Interaction network of 22 lncRNA with Myf6, Myod1 and Myog based on BF and LD sequencing. D. TPM values of Myf6, Myod1, Myog, and Gm16062 based on BF and LD sequencing. E. Pearson correlation coefficients of Gm16062 with Myf6, Myod1, and Myog were calculated according to the data in Figure (D,F). The Gm16062 expression level was determined using RT-qPCR in skeletal muscle tissue. All data are expressed as the mean ± SEM (n = 3 per group) and the “n” defines the number of biological replicates. Data were analyzed using one-way ANOVA test and were considered statistically significant, at *P < 0.05 and **P < 0.01 between the indicated groups.
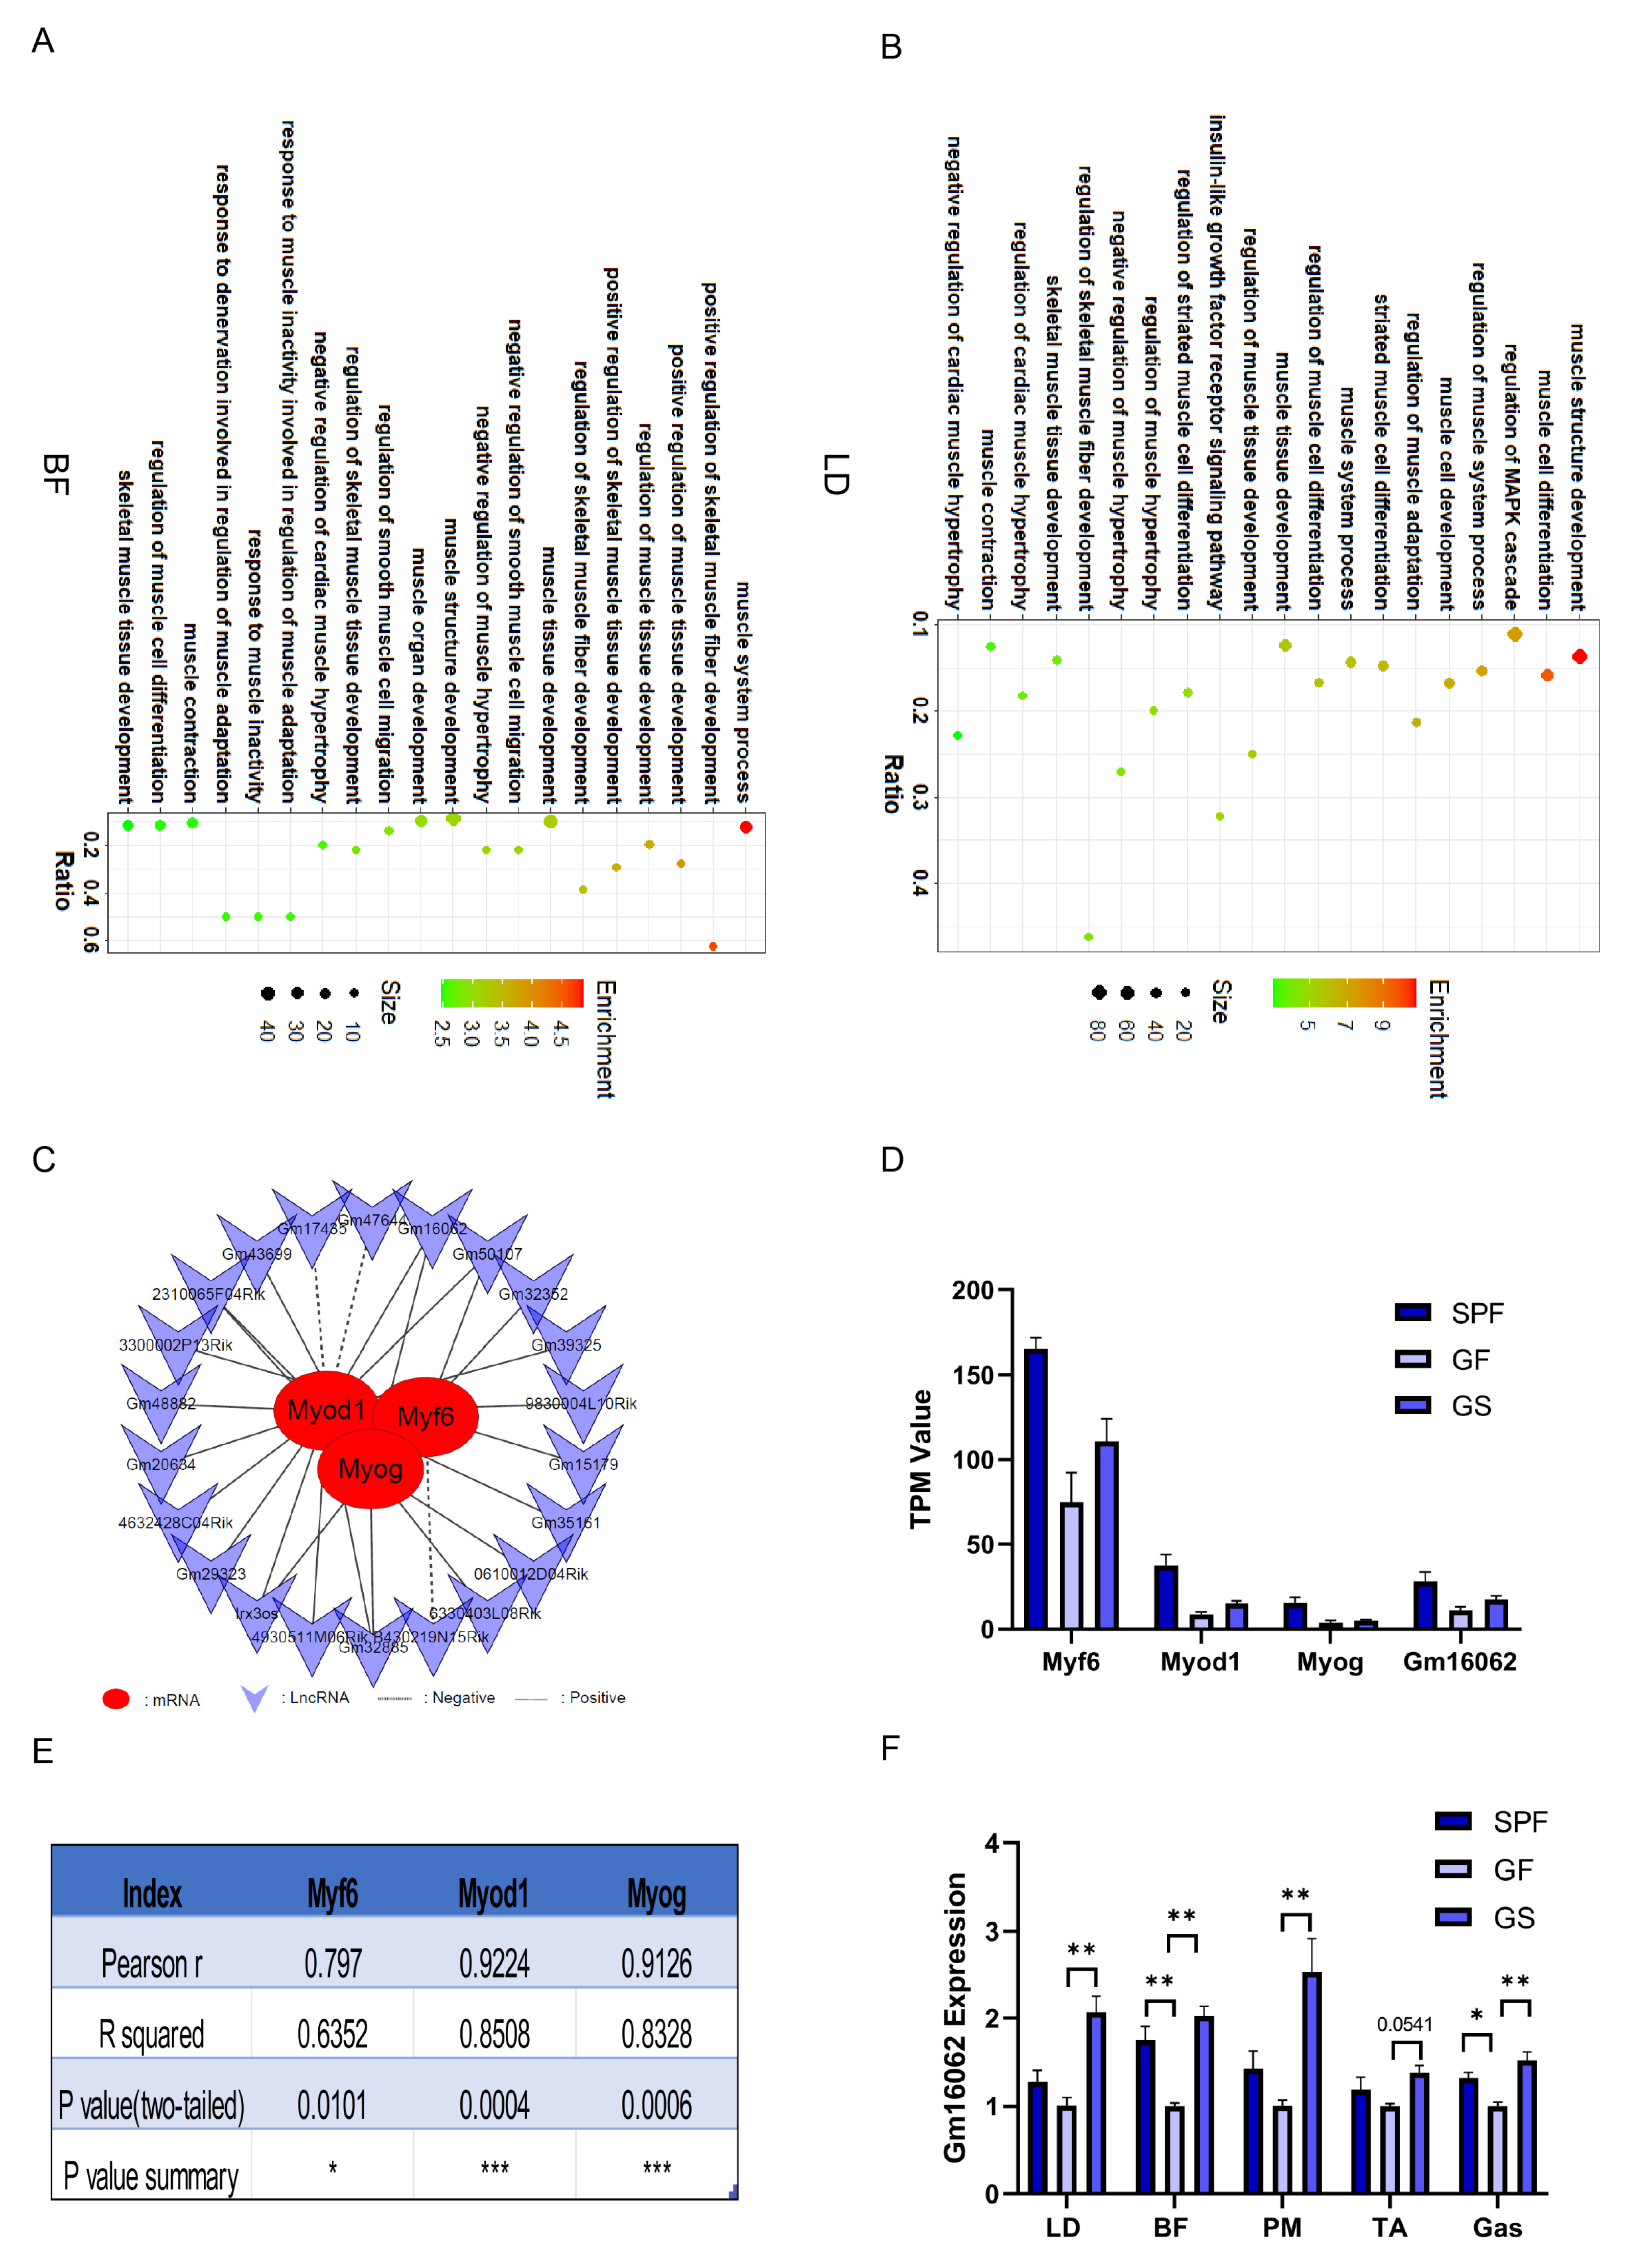
Figure 4.
Acetate promoted the myogenic differentiation of C2C12 cells. A. Mycoplasma detection results, lane#1: positive control, lanes#2-4: C2C12 culture supernatant, lane#5: DL2000 DNA marker. B. CCK-8 assays to detect the cytotoxicity of C2C12 with different concentrations of sodium acetate supplementation (n = 5 per group). C-E. The expressions of Mef2a (C), Myog (D), and Myod1 (E) was detected on the 5th day of C2C12 differentiation with supplementation of different SA concentrations using RT-qPCR (n = 3 per group). F. Gm16062 expression level was detected using RT-qPCR on the 5th day of C2C12 differentiation with 2 mmol/L of SA supplementation (n = 3 per group). G. MYH4 was detected using immunofluorescence staining on the 5th day of C2C12 differentiation, 20×, scale bar, 100 μm (n = 5 per section per group). H. The myotube fusion index was calculated by ImageJ (n = 5 per group). All data are expressed as the mean ± SEM and the “n” defines the number of biological replicates. Data were analyzed using an unpaired two tailed Student’s t test and one-way ANOVA test between two groups or more groups, respectively, and were considered statistically significant, at *P < 0.05, **P < 0.01, ***P < 0.001, and ****P < 0.0001 between the indicated groups.
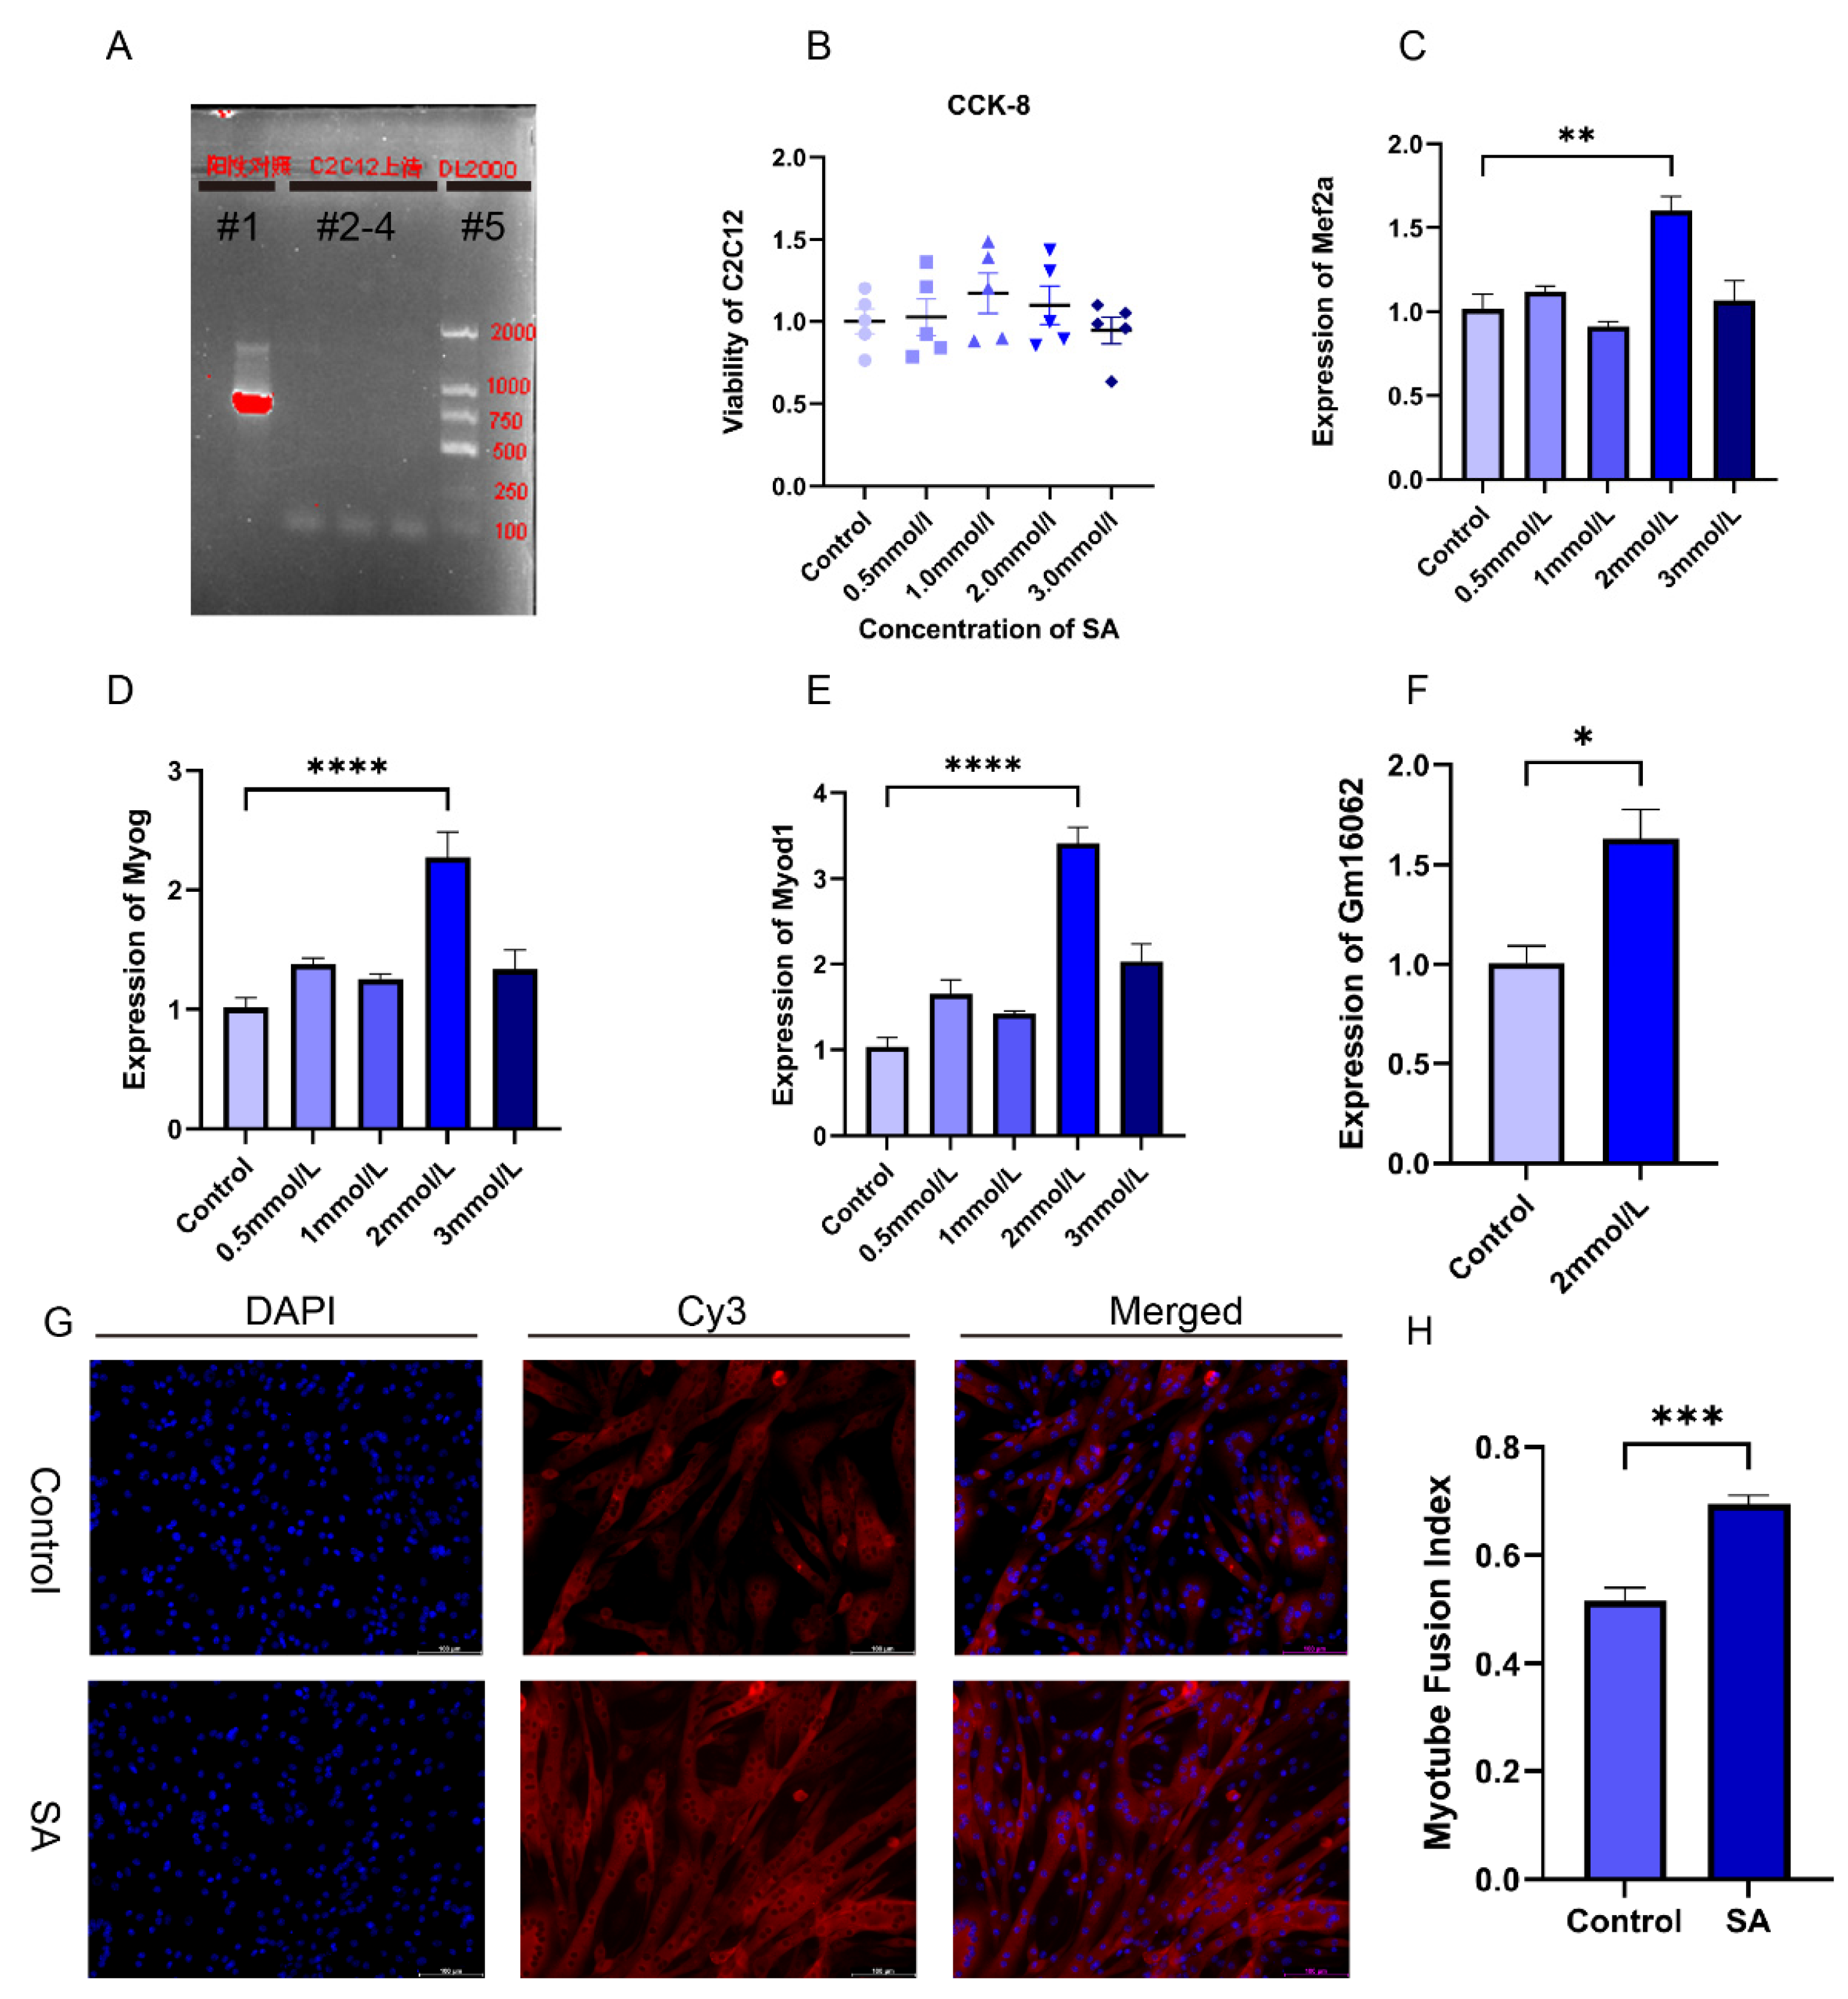
Figure 5.
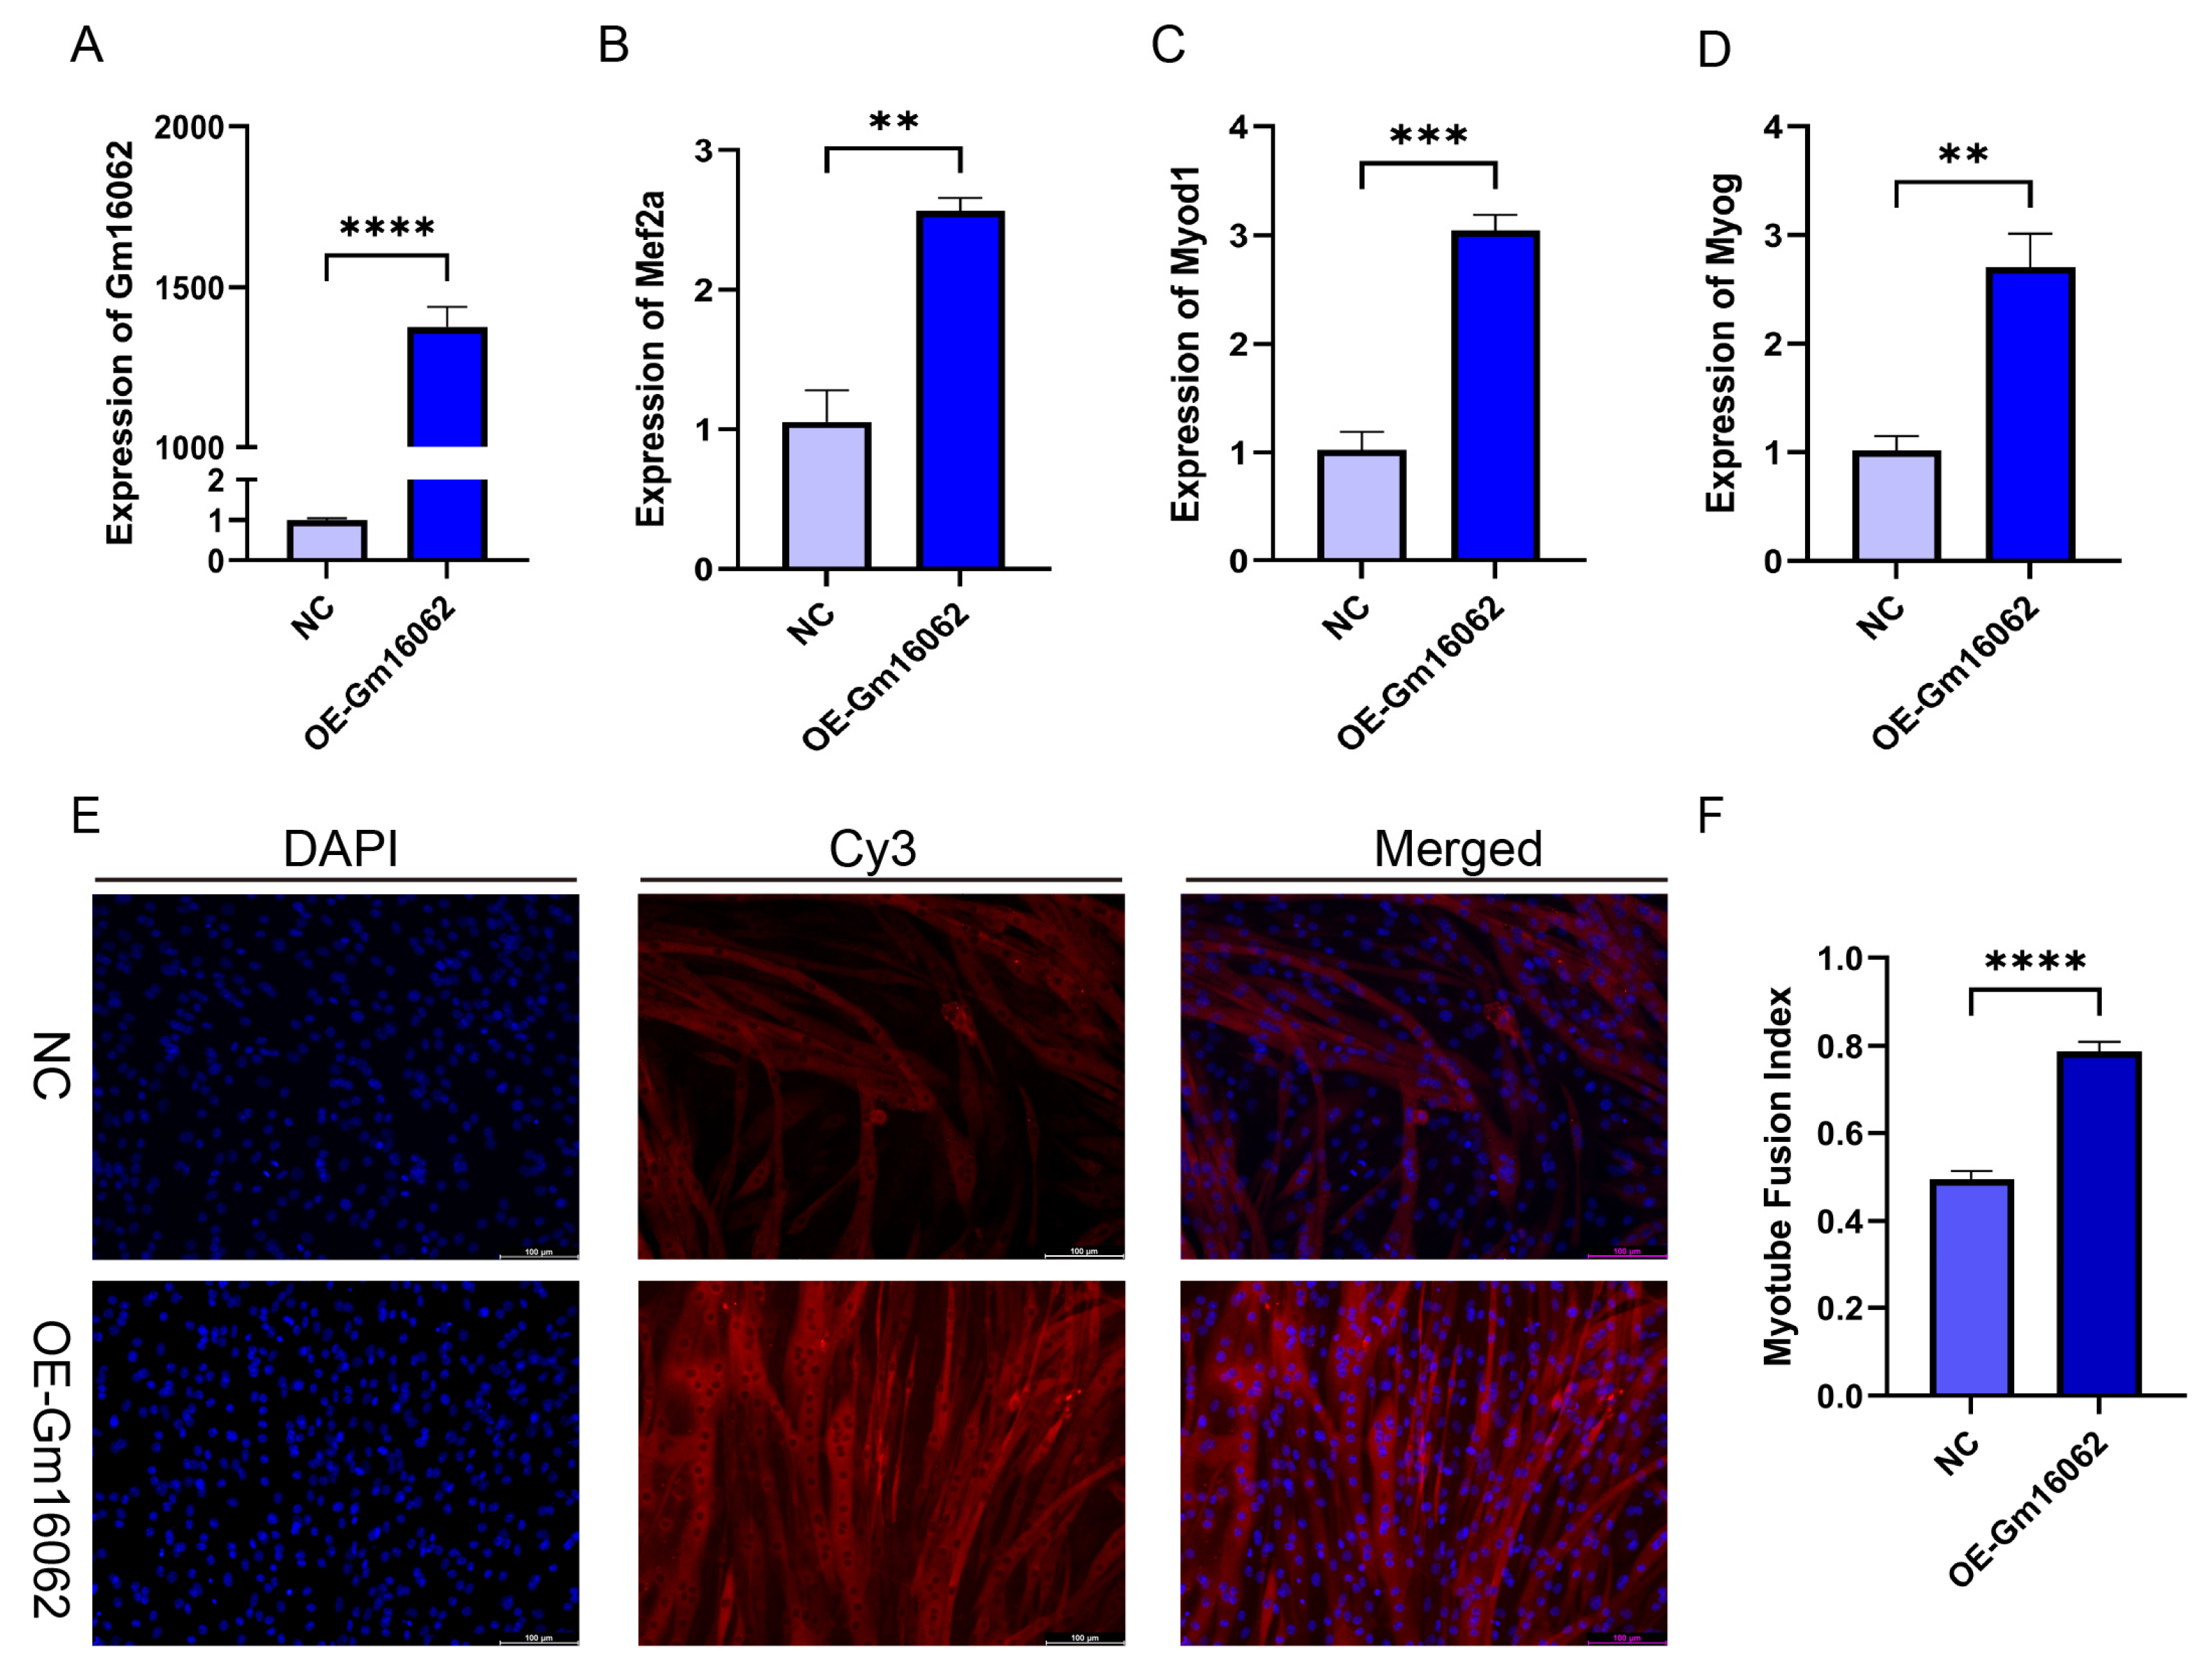
Overexpression of Gm16062 promoted the myogenic differentiation of C2C12. A. The transfection efficiency of the Gm16062 overexpression vector was detected using RT-qPCR 48 h after the overexpression of Gm16062 (n = 3 per group). B-D. The expression of Mef2a (B), Myod1 (C), and Myog (D) was detected using RT-qPCR on the 5th day of C2C12 differentiation after the overexpression of Gm16062 (n = 3 per group). E. MYH4 was detected using immunofluorescence staining on the 5th day of C2C12 differentiation transfected with the Gm16062 vector, 20×, scale bar, 100 μm (n = 5 per section per group). H. The myotube fusion index was calculated by ImageJ (n = 5 per group). All data are expressed as the mean ± SEM and the “n” defines the number of biological replicates. Data were analyzed using an unpaired two tailed Student’s t test and were considered statistically significant, at *P < 0.05, **P < 0.01, ***P < 0.001, and ****P < 0.0001 between the indicated groups.
Figure 6.
Overexpression of miR-129-2-3p inhibited C2C12 myogenic differentiation. A-D. Detection of the expression level of miR-129-2-3p in LD (A) and BF muscles (B), with SA supplementation (C) and Gm16062 overexpression (D) using RT-qPCR, respectively (n = 3 per group). E. The expression pattern of miR-129-2-3p during myogenic differentiation detected using RT-qPCR (n = 3 per group). F. The transfection efficiency of agomiR-129-2-3p 48 h after transfection was detected using RT-qPCR (n = 3 per group). G-I. The expression levels of Mef2a (G), Myod1 (H), Myog (I) and Gm16062 (J) were detected using RT-qPCR on the 5th day of C2C12 differentiation transfected with agomiR-129-2-3p (n = 3 per group). K. MYH4 was detected using immunofluorescence staining on the 5th day of C2C12 differentiation transfected with agomiR-129-2-3p (20×, scale bar, 100 μm; n = 5 per section per group). L. The myotube fusion index was calculated using ImageJ (n = 5 per group). All data are expressed as the mean ± SEM, and the “n” defines the number biological replicates. Data were analyzed using an unpaired two tailed Student’s t test and one-way ANOVA test between two groups or three groups, respectively, and were considered statistically significant, at *P < 0.05, **P < 0.01, ***P < 0.001, and ****P < 0.001 between the indicated groups.
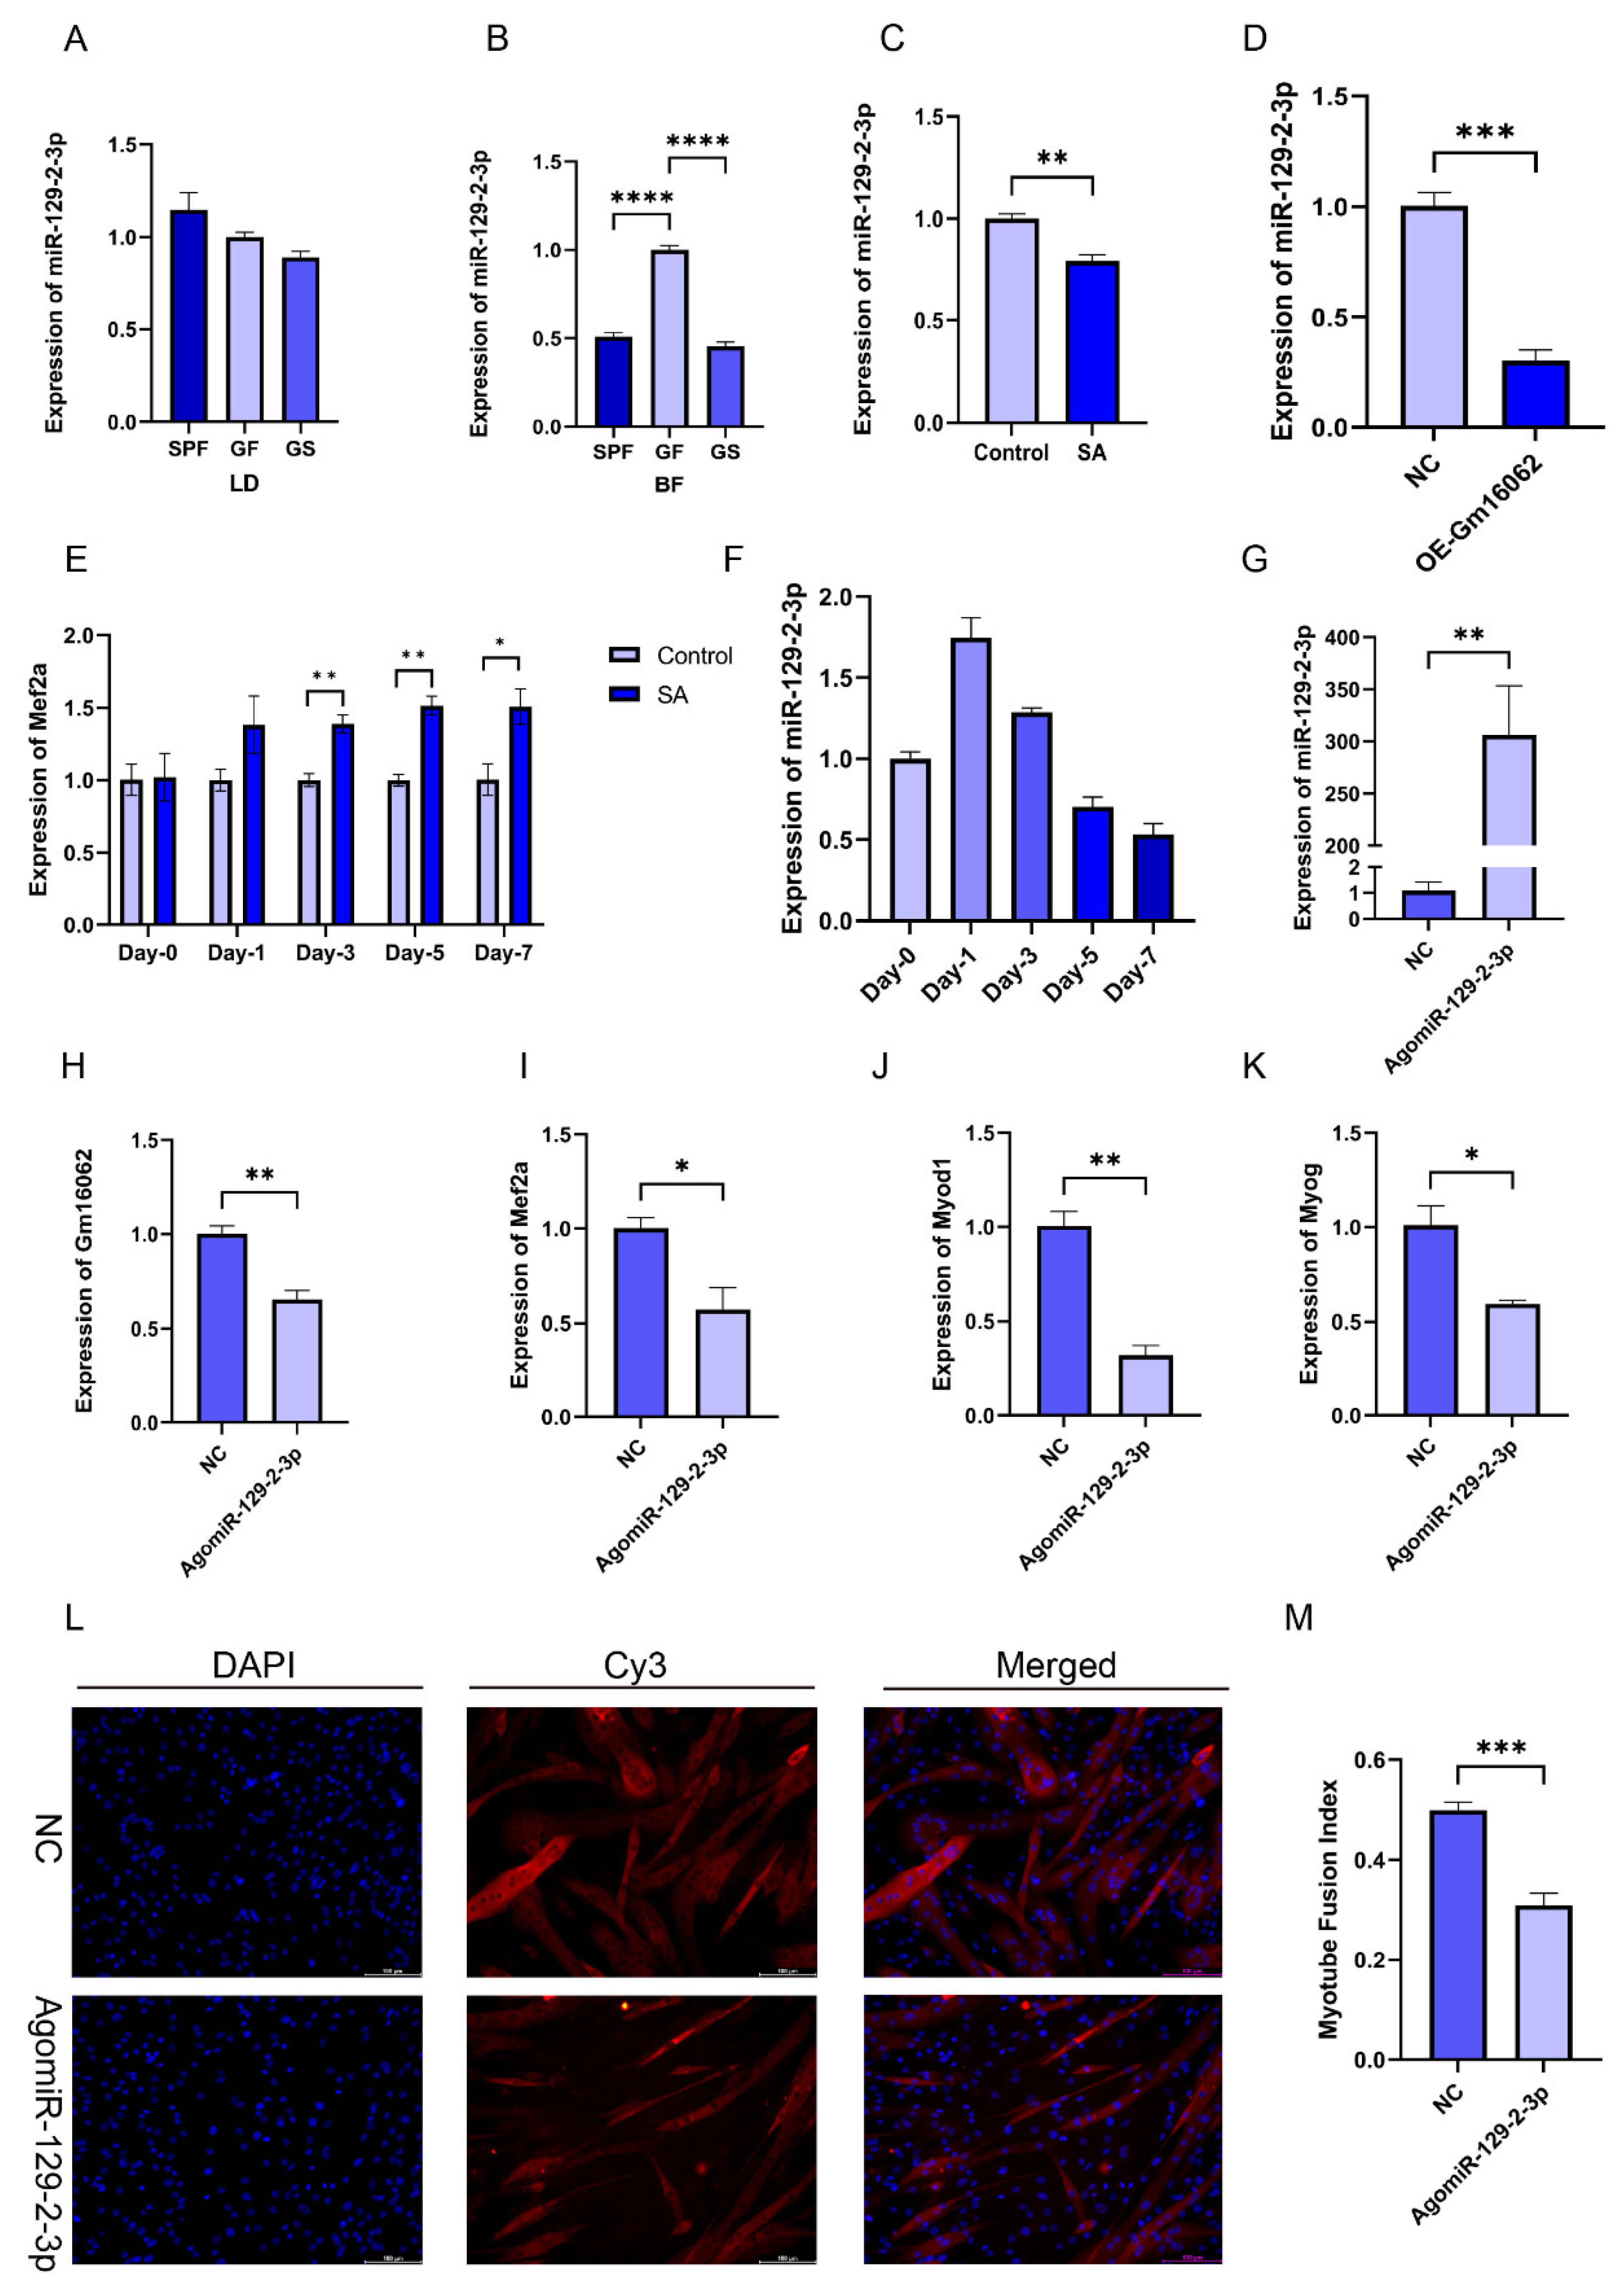
Figure 7.
Identification of the Gm16062/miR-129-2-3p/Mef2a regulatory axis. A. The binding site between miR-129-2-3p and Gm16062. B. Detection of Gm16062-WT luciferase activity after overexpression of miR-129-2-3p for 48 hours. C. Detection of Gm16062-MUT luciferase activity after overexpression of miR-129-2-3p for 48 hours. D. The activity of Gm16062-WT luciferase was detected after inhibition of endogenous miR-129-2-3p for 48 hours. E. The binding site between miR-129-2-3p and Mef2a-3’UTR. F. The expression of Mef2a during C2C12 differentiation between the control group and SA supplementation group detected using RT-qPCR. G. Mef2a-WT luciferase activity was detected after overexpression of miR-129-2-3p for 48 h. H. The Mef2a-MUT luciferase activity was detected after overexpression of miR-129-2-3p for 48 hours. I. The activity of Mef2a-MUT luciferase was detected after inhibition of endogenous miR-129-2-3p for 48 hours. J. The luciferase activity of Mef2a-WT was detected after co-transfection of agomiR-129-2-5p or NC with the Gm16062 vector or an empty vector for 48 hours. All data are expressed as the mean ± SEM and the luciferase activity was normalized by Renilla luciferase activity (n = 5 per group) and the “n” defines the number of biological replicates. Data were analyzed using an unpaired two tailed Student’s t test and were considered statistically significant, at *P < 0.05, **P < 0.01, ***P < 0.001, and ****P < 0.001 between the indicated groups.
