
Submitted:
17 April 2024
Posted:
18 April 2024
You are already at the latest version
Abstract
The enhancement of early diagnosis of lung cancer is mandatory to improve prognosis. We observed the increase cancer stem cells (CSC) and circulating tumor cells (CTC) in blood of mice on d3 after Lewis lung carcinoma (LLC) cell implantation before disease symptom. Besides we have developed an approach to reprogramming immune cells by inhibiting the MAPK/ERK pathway through MEKi and the PD-1/PD-L1 immune checkpoint signaling pathway. We hypothesized that reprogramming of spleen CD8+ T-cells could also create a population of immune cells with high antitumor activity. We reprogrammed CD8+ T-cells derived from the spleen of C57BL/6 mice (rsCD8+T-cells). The rsCD8+T-cells were able to migrate to lung and were more resistant after the exhaustion in vitro in comparison with naïve sCD8+T-cells. In the orthotopic LLC model, the rsCD8+T-cells therapy increased the amount of proliferating CD8+ and CD4+ T-cells in blood and lung from mice. The amount of CSC decreased in the blood and lung of mice treated with rsCD8+ T-cells. A morphological study revealed a decrease in the number of metastases in lung tissue. The antitumor effects of rsCD8+T-cells are based on the activation of the host immune response by increasing the populations of CD8+ and CD4+ T-cells and apoptosis of CSCs.
Keywords:
reprogrammed spleen CD8+ T-cells
; Lewis lung carcinoma
; cancer stem cell
; CD8+ and CD4+ T-cells
; antimetastatic activity
1. Introduction
Despite advances in therapeutic strategies, our understanding of risks, and its immunologic control, lung cancer is the second most common malignancy [1]. Metastasis is one of the most important aspects of tumor progression and the high cancer-related mortality. In most cases, tumor progression is associated with highly resistant cancer stem cells (CSCs), which constitute part of the circulating tumor cells (CTCs) [2], and impaired T-cell activity at the tumor site and in the peripheral circulation, contributing to a decrease in T-cell-mediated antitumor immunity [3,4]. Therefore, the search of new early diagnosis and prognosis markers and explore the relationship among the markers and immunity, can to improve the prognosis of patients with lung cancer. Understanding the mechanisms of immunosuppression development has formed the basis for modern cancer immunotherapy. Immunotherapy has successfully been used in cancer treatment in the last time, although the full potential of the immune system in eradicating tumors is yet to be realized. Moreover, some immunotherapies, including immune checkpoint inhibitors, have demonstrated limited efficacy in solid tumors [3,4]. This is explained by many factors, in particular, it has been shown that the effectiveness of T-cell therapy depends on the ability of transferred cells to multiply in vivo, overcome a high tumor load, migrate to tumor sites, persist and perform effector functions, destroying tumor cells [5]. It is noted that additional activation of the immune system after immunotherapy increases the risk of developing autoimmune diseases [3]. Reprogramming T-cell metabolism is critical for enhancing the antitumor immune response. The immunotherapy has been mainly on CD8+ T-cells because they can directly kill cancer cells [4].
With the advent of different reprogramming strategies mediated, it was interesting to investigate whether reprogramming can be used to induce the activity of CD8+ T-cells from dissimilar tissues. Unlike chemotherapy drugs, where the dose/response relationship is easily measured, the effectiveness of reprogrammed T-cells isolated from different sources may vary. In addition, differences in functional properties may occur between T-cells isolated from normal donors and from patients with malignant neoplasms. Therefore, expanding the arsenal of sources for reprogramming T-cells is very important for creation of T-cell populations that are cytotoxic, more resilient, and more effective against tumors. We proposed an method to reprogramming CD8+ T-cells based on the combined use of the MEK inhibitor (MEKi) and the PD-1/PD-L1 signaling pathway blocker nivolumab. We have previously shown that reprogrammed CD8+ T-cells isolated from mouse bone marrow [6] and from the peripheral blood of healthy volunteers [7] have high cytotoxicity and anti-tumor effects. It has been proposed that spleen T-cell reprogramming could be used to rejuvenate exhausted CD8+ T-cells too. At the same time, our reprogramming method increases the expression level of CCR7 on CD8 cells [6]. It was known the CCR7 chemokine axis is comprised of chemokine ligand 21 (CCL21) and chemokine ligand 19 (CCL19) acting on chemokine receptor 7 (CCR7). This axis plays two important but opposing roles in cancer. On the one hand, this axis is involved in the modulation of the immune response to a growing tumor [8]. On the other hand, the CCR7 axis plays a significant role in controlling the migration of tumor cells towards the lymphatic system and metastasis and can thus contribute to the expansion of cancer [8,9]. In this study, we assessed the dynamics of changes in CTCs, CCR7+ cells, and T-cells in the blood and the effects of cell therapy with reprogrammed CD8+ T-cells isolated from the spleen (rsCD8+ T-cells) in an orthotopic model of Lewis lung cancer (LLC).
2. Results
2.1. The Content of Different Populations of CD8+ T-Cells and CD4+ T-Cells in the Blood of Tumor-Bearing Mice after LLC Cell Implantation
It was shown the frequency of circulating T-cells was significantly decreased in patients with cancer versus normal controls [10]. The orthotopic model of LLC we studied different populations of CD8+T-cells in the blood of mice on the d3 and d7 after LLC cell implantation. We observed a reduce of the different CD8+ T-cells populations in the blood of tumor-bearing mice compared with mice of intact control on the d3 and d7: CD3+CD4−CD8+, CD3+CD8+PD-1+, CD3+CD8+PD-L1+, CD3+CD8+PD-1hi, CD8+CCR7+, CD8+CD62L−CD44+, CD8+CD62LhiCD44low, and CD8+CD62+CD44+ (Figure 1). At the same time, the amount of proliferating CD8+T-cell populations with phenotype CD3+CD4-CD8+ and CD3+CD8+PD-1+ increased in the blood of tumor-bearing mice on the d7.
It is known that C-C Chemokine receptor 7 (CCR7) is involved in the movement of mononuclear cells, in particular T-cells, into secondary lymphoid tissues [10,11]. At the same time, immune response against pathogens and tumors depend on the ability of T-cells to migrate to appropriate places in the body. Populations of CD8+ T-cells of varying degrees of maturity: CD8+CCR7(CD197)+, CD8+CD62L+CD95+CCR7+, CD8+CD62L+CCR7+CD95hi, СD8+CD62L+CD95+CCR7hi, CD8+CD62L+CD95+CCR7-, CD8+CD62L+CD44- and CD8+CD62L-CCR7-CD95hi highly decreased in the blood of mice already on d3 after LLC cell administration (Figure 2). On the d7, part of the studied populations, less mature CD8+T-cells (CD8+CD62L+CD95+CCR7+ CD8+CD62L+CCR7+CD95hi, CD8+CD62L+CD95+CCR7-, CD8+CD62L+CD44- and CD8+CD62L-CCR7-CD95hi) began to gradually increase in the blood of mice with LLC, without reaching the initial values (Figure 2). The CD45RA-CD62L-CD95-CD8-CCR7+ cell population decreased in the blood of mice on d3 and d7 after LLC cell implantation.
The LLC model caused a significant decrease in the number of CD4+ T-cells with different phenotypes in the mouse blood on the d3 and d7: CD3+CD4+CD8-, CD3-CD4+, CD3+CD4+CD8+, CD3+CD4+PD-1+, CD3+CD4+PD-L1+, and proliferating CD3+CD4+PD-1+ (Figure 3). Thus, we observed changes in various populations of T-cells in the blood of tumor-bearing mice immediately after LLC cell implantation. This circumstance together with others can be an important factor for assessing the onset of development of the tumor process. It is known tumor and tumor microenvironment suppress proliferation of T-cells and decrease their numbers [12]. Moreover, during interaction with the tumor, CD8+ T-cells have a decreased activity of metabolic pathways and hyporeactive phenotypes that cannot be restored by stimulation [13].
2.2. The Amount of Circulating Tumor Cells in the Blood of Tumor-Bearing Mice after LLC Cell Implantation
We observed a significant increase in the number of CTCs with different phenotypes on the d3 after LLC injection (CD44+Sox2+, CD90+Sox2+, CD44hiCD90+, CD44hiCD90+Sox2+, CD279+Ki67+, and CD274+Ki67+) in the blood of tumor-bearing mice compared to mice of intact control (Figure 4). At the same time, the cell population (EGF+Sox2+) were increased only on d7 after LLC cell implantation. Of note, that by d7 all populations of CTCs remained at a high level. Thus, these cell populations of CTCs might be proposed for use in the early detection of lung cancer after additional clinical studies.
2.3. The Feature Assessment of rsCD8+T-Cells in Vitro and in Vivo
2.3.1. Study of Detection of the CCR7 Expression, Cytotoxicity, and Apoptosis of rsCD8+T-Cells in Vitro
Verma et al. demonstrated that inhibition of the MAPK/ERK signaling pathway causes metabolic reprogramming of effector CD8+ T-cells and enhances their antitumor activity [14]. These cells had the high methylation of effector genes, self-renewal, multipotency, ability to proliferate, and an overexpression of CCR7 and CD62L. We studied the expression of chemokine receptor CCR7 by CD8+ T-cells in vitro to evaluate the effectiveness of the reprogramming (Figure 5). The rsCD8+ T-cells had higher expression levels of chemokine receptor CCR7 than naive sCD8+ T-cells in CD8+ T-cell culture (Figure 5 a, b). Using by Cytation 5 and FACSCanto II flow cytometer stability of rsCD8+ T-cells was confirmed in vitro (Figure 5). The CCR7 expression by rsCD8+ T-cells did not change after the exhaustion, which indicates that the changes induced by the MEKi and nivolumab are stable (Figure 5). The content CD8+CD197+, CD8+CD62L+CD197+CD95+, and CD8+CD62L+CD95+CD197- cells in population of CD8+T-cells didn’t change after the exhaustion too (Figure 5 c, d). The rsCD8+ T-cells were more resistant to the cytotoxic effect of LLC cells than the naive sCD8+ T-cells. The rsCD8+ T-cells are more stable under cultivation: the apoptosis level of rsCD8+ T-cells was more in 2 times higher than naive sCD8+ T-cells. The cytotoxicity of rsCD8+ T-cells was higher than the cytotoxicity of naive sCD8+ T-cells in the same ratios (Figure 6). Collectively, these findings indicated the successful reprogramming of sCD8+ T-cells.
2.3.2. The rsCD8+ T-Cells Isolated from Mouse Spleen Migrated into the Lungs of Tumor-Bearing Mice
We assessed the effectiveness of the CFSE staining procedure in each study before administration of labeled CD8+T-cells. CD8+T-cells isolated from donor mice were stained with a vital dye. Control of CFSE labeling of CD8+T-cells before administration to mice is presented on the Figure S1. To analyze the migration of CD8+T-cells, cell populations containing at least 90% labeled cells were used. After magnetic separation and staining, CFSE-labeled CD8+T-cells of the donor mice were administered to intact control recipient mice and the dynamics of their content in the lungs was studied. RsCD8+ T-cells migrated actively to the lungs of mice; the maximum level of CFSE-labeled cells was observed after 60 min after intravenous injection of CFSE-labeled rsCD8+ T-cells (Figure S2).
To confirm the migration of CFSE-labeled CD8+T-cells into the lungs, in mice with LLC, the content of CD45+CD8+ cells with the vital dye CFSE was examined in the lung mononuclear cell population 60 min after administration. In the population of CD45+CD8+ cells, CFSE+ cells were detected, while in the population of CD45‒CD8‒ cells the dye was not detected (Figure 7).
2.4. Effect of rsCD8+ T-Cells on the Content of CD8+ T-Cells in the Blood and Lungs of Tumor-Bearing Mice
We evaluated different populations of CD8+T-cells in the blood of mice after LLC cell implantation. We observed the decrease of the different CD8+ T-cells populations in the blood of tumor-bearing mice compared with mice of intact control (Figure 1). The rsCD8+T-cells administration caused an increase in a significant number of CD8+T-cell populations (CD8+CCR7+, CD3+CD4-CD8+Ki67+, CD3+CD8+PD-1+, and CD3+CD8+PD-L1+) in the blood of tumor-bearing mice compared to tumor-bearing mice without treatment (Figure 8). The content of CD8+CD44lowCD62Lhi T-cells decreased even more during treatment in the blood. At the same time, the content CD3+CD8+CD4-, CD3+CD8+PD-1hi, CD8+CD62L−CD44+ T-cells and effector CD8+T-cells CD8+CD44hiCD62Llow and CD8+CD44+CD62L+ did not change during treatment (Figure 8). We detected an growth of CD8+ T-cells migration from the blood to the lungs in response to tumor and exhaustion of CD8+ T-cells pool under tumor formation on d7 (CD3+CD4-CD8+, CD3+CD8+PD-1+, CD3+CD8+PD-L1+, CD3+CD8+PD-1hi, CD8+CCR7+, CD8+CD62LhiCD44low, and CD8+CD62L+CD44+) (Figure 8 and Figure 9). The exception was proliferating CD3+CD4-CD8+ T-cells, effector T-cells (CD8+CD62LlowCD44hi), whose number significantly decreased in the lungs of mice with LLC. After rsCD8+T-cell therapy, the CD8+T-cell population in the lungs of tumor-bearing mice was lower in comparison with the mice with LLC without treatment (Figure 9). At the same time, populations of proliferating CD3+CD4−CD8+ cells and effector CD8+T-cells (CD8+CD62LhiCD44low and CD8+CD62L+CD44+) in the lung were increased after rsCD8+ T-cell injection.
After therapy with rsCD8+T-cells, an increase in various populations of CD8+T-cells with the CCR7 marker (CD8+CD62L+CCR7+CD95hi) and without CCR7 (CD8+CD62L-CCR7-CD95hi) was observed in the blood of mice compared to those in LLC mice without treatment (Figure 10).
2.5. Effect of rsCD8+ T-Cells on the Content of CD4+ T-Cells in the Blood and Lungs of Tumor-Bearing Mice
Administration of rsCD8+T-cells caused an increase in a significant number of CD4+T-cell populations (CD3-CD4+, CD3+CD4+CD8+, CD3+CD4+PD-L1+, CD3+CD4+PD-1+, proliferating cells: CD3+CD4+PD-1+ and CD3+CD4+CD8-) in the blood of mice with LLC compared to untreated mice with LLC (d7) (Figure 11). At the same time, the content of CD3+CD4+CD8- cells and proliferating CD3+CD4+PD-1+ cells in the blood decreased even more during treatment by rsCD8+T-cells. We observed a significant decrease in the number of CD4+ T-cells with different phenotypes in the lungs of mice on the d7: CD3+CD4+CD8-, CD3-CD4+, CD3+CD4+CD8+, CD3+CD4+PD-1+, and proliferating CD3+CD4+CD8- and CD3+CD4+PD-1+ cells (Figure 11). However, we observed an increase double-positive CD3+CD4+CD8+ T-cells, the population of Treg (CD3+CD4+PD-1+) and CD3+CD4+PD-L1+ cells in the lungs of tumor-bearing mice compared to mice without tumor on the d7 (Figure 12). The rsCD8+ T-cells injection significantly reduced the number of T-cells with phenotype CD3+CD4+CD8+, CD3+CD4+PD-L1+, CD3+CD4+PD-1+ and proliferating CD3+CD4+PD-1+ cells in the lungs. At the same time, the number of CD4+ T-cell populations with phenotype CD3+CD4+CD8-, CD3-CD4+ and proliferating CD3+CD4+CD8- increased in the lungs of mice with LLC. We clarify this by increased migration of these populations of CD4+ T-cells from the blood to the lungs in response to rsCD8+T-cells administration.
2.6. The rsCD8+ T-Cells Changes the Amount of Cancer Cells and Cancer Stem Cells in the Lungs and Blood of Tumor-Bearing Mice
We observed a significant increase in the number of CSCs and CTCs with different phenotypes in the blood and in the lungs of tumor-bearing mice compared to mice of intact control on the d7 after LLC injection (Figure 4, Figure 13 and Figure 14). The rsCD8+ T-cells injection significantly reduced the number of cancer cells and CSCs population (EGF+Sox2+, CD44hiCD90+Sox2+, CD90+Sox2+, CD279+Ki67+) in the lungs and blood of tumor-bearing mice on the d7 (Figure 13 and Figure 14). However, the population of proliferating CD274+ cells in the lung was increased after rsCD8+ T-cell injection. At the same time, the number of CD44+Sox2+ cells in the blood and the amount of CD44hiCD90+ cells in the lung were changed weakly. The cell population (CD45RA-CD62L-CD95-CD8-CCR7+) didn’t change in the blood and decreased in lung after rsCD8+T-cells therapy (Figure 13 and Figure 14).
2.7. Lung Histology and Tumor Growth after rsCD8+ T-Cells Therapy
2.7.1. Lung Histology
We evaluated the lung histology on d7 in response to treatment with LLC injection. The vehicle-treated lung of mice displayed lung tumors characterized by scattered tumor cells with cellular and nuclear polymorphism. Multinucleated giant cells are organized in clusters or aligned along the alveolar walls (Figure 15). The histological picture of the lungs from tumor-bearing mice treated with rsCD8+T-cells only displayed growth deceleration but not regression of tumor (Figure 15c) and showed a decrease in the number of tumor emboli in the vessels and perivascular and peribronchial metastases.
2.7.2. Tumor Growth
The rsCD8+T-cell therapy caused an increase in TGII. The value of TGII after cell therapy with rsCD8+T-cells was 54.7 %. Moreover, we observed an increase in tumor volume and the average number of metastases (Table 1).
3. Discussion
Non-small cell lung cancer is the most common type of lung cancer characterized by high morbidity and mortality [11]. Current treatment includes surgical resection, chemotherapy, targeted therapy, and radiation therapy. However, despite these options, the prognosis remains poor with a low 5-year survival rate [11]. Therefore, new treatments are constantly being searched for. In recent years, the emergence of complex biotechnologies and interdisciplinary integration has provided innovative approaches to the treatment of lung cancer in particular advanced developments in immunotherapy for lung cancer are actively carried out. However, new treatments are insufficiently effective in some patients with solid tumors [15,16]. Therefore, understanding the basis of tumor progression is necessary to develop treatment strategies for lung cancer and improve therapeutic outcomes for these patients. CSCs play an important role in the development, proliferation and metastasis of tumors [17]. Their unique properties ensure resistance to therapy, which often leads to the treatment failure. Moreover the dissemination of CTCs is a relevant event in the process of metastasis and tumor recurrence [18]. We observed an increase CTCs in blood on early period after LLC cell implantation yet. In addition, the development and progression of malignant lung tumors is largely due to suppression of the immune system [19]. The result of the inhibitory effect of the tumor and its environment is a decrease in the number and activity of the metabolic pathways of immune cells. The hyporeactive T-cell phenotypes formed under these conditions are not restored by currently known treatment approaches [20]. In this regard, reprogramming by inhibiting the MAPK/ERK pathway through MEKi and the PD-1/PD-L1 immune checkpoint signaling pathway in the CD8+T-cell population may be promising to enhance antitumor T-cell immunity and suppress tumor growth. However, clinical practice is often faced with a lack of immune cells for cell therapy. We hypothesized that reprogramming CD8+T-cells, regardless of the source of their production (bone marrow, spleen, peripheral blood, etc.), will create a population of cells that can affect the host immune system and tumor cells.
In this study, we observed that reprogramming induced the activity of CD8+ T-cells isolated from the spleen. Similarly, CD8+ T-cells isolated from mouse bone marrow [6] and peripheral blood of healthy volunteers [7], reprogramming with preliminary training increased the expression of CCR7 by CD8+ T-cells and the persistence of this population upon depletion in vitro. Cells of the rsCD8+T-cells subset expressed L-selectin and CCR7 when cultured, and their abundance did not change after depletion. Thus, our studies demonstrated that reprogramming of CD8+T-cells preserves the expression of CD62L, CD95 and CCR-7 cells. It has been shown that this population of cells is quite resistant to adverse effects and more effective against tumors than central memory T-cells [21]. This is an important aspect to be considered because the number and functional activity of a patient's T-cells is different from the number and activity of a healthy person's T-cells [22]. In our studies, a sharp decrease in the number of different populations of CD4 and CD8 T-cells was observed in the blood of mice already on d3 after LLC cells injection. When studying the content of these populations of CD4 and CD8 cells in the lungs of mice on d7 after the LLC cells injection, the opposite picture was observed: the majority of these populations migrated to the lungs accumulating there. The rsCD8+T-cell therapy showed antitumor activity by increasing CD8+T -cells and CD4+T-cells in vivo in a LLC model in the blood of tumor-bearing mice compared to tumor-bearing mice without treatment on d7. At the same time, rsCD8+T-cell therapy prevented the migration of T-cells into the lungs of mice with LLC. It should be noted that the effectiveness of T-cell therapy should be based on the ability of the transferred cells to multiply in vivo, overcome a numerically large tumor load, migrate to tumor sites, persist and mediate effector functions that destroy tumor cells. Our study showed that in mice with LLC without treatment, various populations of naive CD8+ T-cells with markers CD62L, CD95 and CCR7 were reduced in the blood. Our results are confirmed by studies reporting that cancer patients have an increased frequency of circulating apoptosis-sensitive CD8+CCR7- T -cells and a low number of CD8+CCR7+ T-cells compared with healthy volunteers [10]. The higher percentage of CD8+CCR7- T-cells in patients with cancer than normal is a result of the accumulation of terminally differentiated T-cells (TTD). Low frequency of circulating CD8+CCR7+ T-cells is a significant risk factor for disease relapse [10]. Administration of rsCD8+T-cells to mice with LLC increased the number of circulating CD8+CCR7+ T-cells and other CD8+ T-cell populations of varying degrees of maturity: CD8+CD62L+CD95+CCR7+, CD8+CD62L-CCR7-CD95hi, CD8+CD62L+CD95+CCR7hi, and CD8+CD62L+CD95+CCR7-. It has been postulated that cancer cells can upregulate CCR7 expression and hijack its normal functions, enabling them to migrate along the gradient of CCL19 and CCL21 towards the lymph node and colonies them as a first step towards metastasis [8]. In our study the rsCD8+T-cell therapy prevented increase CCR7+ cells of non-lymphoid origin in the lung. Thus our study demonstrates that T-cell stimulation can be achieved by reprogramming. In order for cells to accumulate at tumor sites, they must have chemokine receptors on the surface of T-cells to transport and penetrate cells into tumor sites [23]. In our case, the population of CD8+T-cells which have similar receptors increased after rsCD8+T-cell therapy. Based on the results of in vivo therapeutic efficacy study, we first found that rsCD8+T-cells suppressed tumor volume in an LLC mouse model. Based on the positive effect of rsCD8+T-cell therapy on the tumor process, in addition to stimulating CD8 and CD4 T-cells of varying degrees of maturity, the influence of rsCD8+T-cell therapy on CSCs was also discovered. It was shown that on d3 after implantation of LLC cells, the number of circulating CSCs sharply increased, which continued to increase by d7. The rsCD8+T-cell administration contributed to the reduction of CSCs in the blood and lung tissue of LLC mice.
Thus, to enhance antitumor T-cell immunity and suppress tumor growth, reprogramming by inhibiting the MAPK/ERK pathway through MEKi and the PD-1/PD-L1 immune checkpoint signaling pathway in the CD8+ T-cell population is promising.
Our work is limited by the capacity of animal models to mimic the human lung cancer. Thus, further evaluation in more mouse experimental systems and randomized trials is needed.
4. Materials and Methods
4.1. Animals
Male C57BL/6 mice (8–10 weeks old, 20–22 g) were obtained from Experimental BioModels Department of the Tomsk National Research Medical Center (Tomsk, Russia). Mice were kept in polycarbonate cages in the laboratory’s animal room at standard temperature (22±2 °C) with relative humidity of 50±20%, and 12 h light-dark cycle. Animals were given food and water freely.
4.2. Lewis Lung Carcinoma Cell Line and Tumor Model
Lewis lung cancer (LLC) cells were purchased from the CLS Cell Lines (Service, GmbH, Eppelheim, Germany). The orthotopic model of LLC was described previously [6]. Briefly animals were injected with a 50 µL suspension of LLC cells (1.5 × 10⁶ cells) using an insulin syringe with a 30 G needle to a depth of 5 mm into the left lung, between the 6th and 7th ribs [24,25]. All manipulations were accomplished with isoflurane inhalation using an inhalation anesthesia machine (UGO BASIELE, model 21050, Italy). The d3 and d7 after LLC cell implantation peripheral blood was taken to study the level of T-cells and CSC in the blood. The d7 after LLC cell implantation animals were euthanized. The d7 after LLC cell implantation peripheral blood and lung were taken to study the level of T-cells and CSC in the blood and lung.
4.3. Isolation of Mononuclear Cells
4.4. Flow Cytometry
The surface markers and intracellular receptors on mononuclear cells derived from blood and lungs were analyzed by flow cytometry [6,7]. Briefly, the cell suspension was pre-incubated for 5 min with anti-mouse CD16/CD32 (FcBlock™, BD Biosciences, San Jose, CA, USA). The cell suspension was stained with fluorophore-conjugated monoclonal antibodies: CD3 PerCP (Cat#553067), CD4 FITC (Cat#553046), CD8 BV510 (Cat#563068), CD44 APC-Cy™7 (Cat#560568), CD45RA PerCP-Cy™5.5, CD62L APC(Cat#553152), CD90 APC(Cat#561409), EGF (F4/80) Alexa Fluor® 647 (Cat#564226), CD274 (PD-L1) PE (Cat#558091), CCR7 (CD197) PE (Cat#560682), CD279 (PD-1) BV421(Cat#748268), and for the intracellular staining Sox2 PE (Cat#562195), and Ki-67 APC (Cat#558615) (dilution 1/50, all—BD Biosciences, San Jose, CA, USA). The relevant isotype controls were used. FACSCanto II flow cytometer with FACSDiva software was used for analysis.
4.5. Magnetic Separation of CD8+ T-Cells
The magnetic sorting of mononuclear cells from the spleen was performed using EasySepTM Mouse Naive CD8+ T-Cell Isolation Kit (StemCell Technologies, Vancouver, Canada). The cell suspension was further enriched with naive CD8+ T-cells (CD3+CD8+CD44-CD62L+) as recommended by the manufacturer (StemCell Technologies, Vancouver, BC, Canada).
4.6. Reprogramming of Spleen CD8+ T-Cells
The CD8+ T-cells isolated from spleen were reprogrammed as described earlier [6,7]. The reprogramming of CD8+T-cells was performed using monoclonal antibodies nivolumab (Bristol-Myers Squibb Company, New York, NY, USA) and MEK1/2i ((cat.PZ0162, Sigma-Aldrich, St. Louis, MO, USA). To evaluate the population stability was carried out in vitro exhaustion of rsCD8+ T-cells [6].
Immunophenotype and cytotoxicity of rsCD8+ T-cells were analyzed by Cytation 5 and FACSCanto II flow cytometer.
4.7. CD8+ T-Cells Injection
To assess the migration of rsCD8+ T-cells into the lungs of mice with LLC, CFSE-labeled rsCD8+T-cells were injected intravenously at 106 cells in 0.1 mL of PBS per dose. The rsCD8+ T-cells were stained by CFSE as described earlier according to the manufacturer’s instruction (BD Biosciences, San Jose, CA, USA) [6]. CFSE labeling of rsCD8+ T-cells isolated from spleen of donor mice was used to determine the content of rsCD8+ T-cells in the lungs of recipient mice.
To assess the antitumor and antimetastatic activity, rsCD8+T-cells were injected intravenously to mice with LLC (1 × 10⁶ cells in 0.1 mL of PBS per dose) on the d4 and d6 after LLC cell implantation.
4.8. Detection of the CCR7 Expression, Cytotoxicity, and Apoptosis of rsCD8+T-Cells In Vitro
Cytation 5 instrument with Gen5™ data-analysis software (BioTek, Instruments, Friedrichshall, Germany) was used for the analysis of cells images, as described earlier [6]. The CCR7 expression on CD8+ T-cells, cytotoxicity, and apoptosis of rsCD8+ T-cells were studied, as described previously [6]. Images of cells were obtained using the cell imaging Cytation 5 equipped with the following cubes: DAPI (blue), GFP (green), RFP (yellow). To assess of CCR7 expression, CD8+T-cells from spleen were stained with anti-CCR7 anti-bodies and polyclonal secondary antibody donkey anti-Rabbit IgG H&L Alexa Fluor® 555 (all Abcam, Cambridge, MA, UK). Nuclei were additionally stained with Hoechst 34580 (blue), and CD8 FITC (green) was used to CD8+ T-cells detection. The percent of CD8+CCR7+ cells were determined as the ratio of cells counted in green and red channel to total cells counted using blue (DAPI) channel.
4.9. Histology of the Lungs
Histological examination of lung was carried out on d7, as described previously [6,7]. Briefly, lung preparations were fixed in 10% neutral buffered formalin, passed through increasing concentrations of alcohol to xylene and embedded in paraffin was according to the standard method, then sectioned into 5 μm thick slices, and stained with hematoxylin and eosin [26].
4.10. Assessment of Tumor Growth
The effect of cell therapy with rsCD8+ T-cells on the growth of LLC was evaluated via statistical comparison of the tumor nodes volume in the control and experimental groups at the d7, according to the tumor growth retardation and tumor growth inhibition index (TGII) [27,28].
where Vc and Ve are the average volumes of the nodes in the control and experimental groups.
ТGII = (Vc — VO)/Ve × 100%
4.11. Assessment of Tumor Volume
Tumor dimensions were measured by digital calipers at d7, and the tumor volume was calculated as follows [28]:
V = π/6 × length × width × height
4.12. Statistical Analysis
Data are presented as mean ± SEM. Differences between groups were identified using the Mann–Whitney test by the SPSS 12.0 software. Under all circumstances, p < 0.05 was considered significant.
5. Conclusions
Thus, cell populations expressing markers CD44, Sox2, CD90, CD279, CD274 and EGF might be proposed for use in the early detection of lung cancer after additional clinical studies. We presented evidence that reprogramming may have favorable CD8+ T-cells impacts and enhances the antitumor activity of CD8+ T-cells in the LLC orthotopic model. This strategy generated CD8+ T-cells with higher efficacy for cell therapy. The effect of rsCD8+ T-cell therapy has been associated with the activation of the host immune response by increasing the populations of CD8+ and CD4+ T-cells in mice, and the effect of rsCD8+ T-cells and effector CD8+ T-cells on tumor cells and CSCs.
Supplementary Materials
The following supporting information can be downloaded at the website of this paper posted on Preprints.org. Figure S1: The control of vital dye CFSE labeling of CD8 T-cells prior to cell therapy; Figure S2: The content of CFSE-labeled CD8+ T-cells (% of the CD8+ T-cell population) isolated from the spleen of C57BL/6 donor mice in the lungs of C57BL/6 recipient mice 15, 30, 60, and 90 min after cell therapy.
Author Contributions
Conceptualization, O.P., and E.P.; methodology, E.G.S., O.P., and N.E.; software, E.P.; validation, O.P., A.P., N.E., and E.P.; formal analysis, E.G.S., O.P., and N.E.; investigation, O.P., A.P., N.E., M.Z., E.P., L.S., and L.K.; resources, E.G.S. and V.Z.; data curation, A.P.; writing—original draft preparation, O.P.; writing—review and editing, O.P. and D.W.; visualization, O.P., N.E., A.P., E.P., and L.S.; supervision, V.Z.; project administration, A.D., N.K., S.M., and A.K.; funding acquisition, A.D., N.K., S.M., and A.K. All authors have read and agreed to the published version of the manuscript.
Funding
“This research received no external funding”.
Institutional Review Board Statement
This study was approved by the IACUC of Goldberg ED Research Institute of Pharmacology and Regenerative Medicine, Tomsk NRMC (protocol code 189a092021).
Informed Consent Statement
“Not applicable.”.
Data Availability Statement
Data is contained within the article or supplementary material.
Conflicts of Interest
“The authors declare no conflicts of interest.”.
References
- Stapelfeld, C.; Dammann, C.; Maser, E. Sex-specificity in lung cancer risk. Int. J. Cancer 2020, 146, 2376–2382. [Google Scholar] [CrossRef] [PubMed]
- Rossi, F.; Noren, H.; Jove, R.; Beljanski, V.; Grinnemo, K.H. Differences and similarities between cancer and somatic stem cells: therapeutic implications. Stem cell research & therapy 2020, 11, 489. [Google Scholar] [CrossRef] [PubMed]
- Poncette, L.; Bluhm, J.; Blankenstein, T. The role of CD4 T cells in rejection of solid tumors. Curr Opin Immunol. 2022, 74, 18–24. [Google Scholar] [CrossRef] [PubMed]
- Raskov, H.; Orhan, A.; Christensen, J.P.; Gögenur, I. Cytotoxic CD8+ T-cells in cancer and cancer immunotherapy. Br. J. Cancer. 2021, 124, 359–367. [Google Scholar] [CrossRef] [PubMed]
- Golubovskaya, V.; Wu, L. Different Subsets of T Cells, Memory, Effector Functions, and CAR-T Immunotherapy. Cancers 2016, 8, 36. [Google Scholar] [CrossRef] [PubMed]
- Skurikhin, E.G.; Pershina, O.; Ermakova, N.; Pakhomova, A.; Widera, D.; Zhukova, M.; Pan, E.; Sandrikina, L.; Kogai, L.; Kushlinskii, N.; et al. Reprogrammed CD8+ T-Lymphocytes Isolated from Bone Marrow Have Anticancer Potential in Lung Cancer. Biomedicines 2022, 10, 1450. [Google Scholar] [CrossRef] [PubMed]
- Skurikhin, E.G.; Pershina, O.; Ermakova, N.; Pakhomova, A.; Zhukova, M.; Pan, E.; Sandrikina, L.; Widera, D.; Kogai, L.; Kushlinskii, N.; Kubatiev, A.; Morozov, S.G.; Dygai, A. Cell Therapy with Human Reprogrammed CD8+ T-Cells Has Antimetastatic Effects on Lewis Lung Carcinoma in C57BL/6 Mice. Int. J. Mol. Sci. 2022, 23, 15780. [Google Scholar] [CrossRef] [PubMed]
- Salem, A.; Alotaibi, M.; Mroueh, R.; Basheer, H. A.; Afarinkia, K. CCR7 as a therapeutic target in Cancer. Biochimica et biophysica acta. Reviews on cancer 2021, 1875, 188499. [Google Scholar] [CrossRef]
- Xiong, Y.; Huang, F.; Li, X.; Chen, Z.; Feng, D.; Jiang, H.; Chen, W.; Zhang, X. CCL21/CCR7 interaction promotes cellular migration and invasion via modulation of the MEK/ERK1/2 signaling pathway and correlates with lymphatic metastatic spread and poor prognosis in urinary bladder cancer. International journal of oncology. 2017, 51, 75–90. [Google Scholar] [CrossRef]
- Czystowska, M.; Gooding, W.; Szczepanski, M.J.; Lopez-Abaitero, A.; Ferris, R.L.; Johnson, J.T.; Whiteside, T.L. The immune signature of CD8(+)CCR7(+) T cells in the peripheral circulation associates with disease recurrence in patients with HNSCC. Clin Cancer Res. 2013, 15, 889–899. [Google Scholar] [CrossRef]
- Siegel, R.L.; Miller, K.D.; Jemal, A. Cancer statistics,2020. CA Cancer J Clin. 2020, 70, 7–30. [Google Scholar] [CrossRef] [PubMed]
- Sathaliyawala, T.; Kubota, M.; Yudanin, N.; Turner, D.; Camp, P.; Thome, J.J.; Bickham, K.L.; Lerner, H.; Goldstein, M.; Sykes, M.; et al. Distribution and compartmentalization of human circulating and tissue-resident memory T cell subsets. Immunity 2013, 38, 187–197. [Google Scholar] [CrossRef] [PubMed]
- Gattinoni, L.; Speiser, D.E.; Lichterfeld, M.; Bonini, C. T memory stem cells in health and disease. Nat. Med. 2017, 23, 18–27. [Google Scholar] [CrossRef] [PubMed]
- Verma, V.; Jafarzadeh, N.; Boi, S.; Kundu, S.; Jiang, Z.; Fan, Y.; Lopez, J.; Nandre, R.; Zeng, P.; Alolaqi, F.; et al. MEK inhibition reprograms CD8+ T lymphocytes into memory stem cells with potent antitumor effects. Nat. Immunol. 2021, 22, 53–66. [Google Scholar] [CrossRef]
- Abken, H. Adoptive therapy with car redirected T cells: The challenges in targeting solid tumors. Immunotherapy 2015, 7, 535–544. [Google Scholar] [CrossRef] [PubMed]
- Ahmed, H.; Mahmud, A.R.; Siddiquee, M.F.; Shahriar, A.; Biswas, P.; Shimul, M.E.K.; Ahmed, S. Z.; Ema, T.I.; Rahman, N.; Khan, M.A.; Mizan, M.F.R.; Emran, T. B. Role of T cells in cancer immunotherapy: Opportunities and challenges. Cancer pathogenesis and therapy 2022, 1, 116–126. [Google Scholar] [CrossRef] [PubMed]
- Marcu, L.G.; Moghaddasi, L.; Bezak, E. Cannot Target What Cannot Be Seen: Molecular Imaging of Cancer Stem Cells. International journal of molecular sciences 2023, 24, 1524. [Google Scholar] [CrossRef] [PubMed]
- Poggiana, C.; Rossi, E.; Zamarchi, R. Possible role of circulating tumor cells in early detection of lung cancer. Journal of thoracic disease 2020, 12, 3821–3835. [Google Scholar] [CrossRef] [PubMed]
- Sathaliyawala, T.; Kubota, M.; Yudanin, N.; Turner, D.; Camp, P.; Thome, J.J.; Bickham, K.L.; Lerner, H.; Goldstein, M.; Sykes, M.; Kato, T.; Farber, D.L. Distribution and compartmentalization of human circulating and tissue-resident memory T cell subsets. Immunity 2013, 38, 187–197. [Google Scholar] [CrossRef]
- Speiser, D.E.; Ho, P.C.; Verdeil, G. Regulatory circuits of T cell function in cancer. Nat Rev Immunol. 2016, 16, 599–611. [Google Scholar] [CrossRef]
- Golubovskaya, V.; Wu, L. Different Subsets of T Cells, Memory, Effector Functions, and CAR-T Immunotherapy. Cancers 2016, 8, 36. [Google Scholar] [CrossRef] [PubMed]
- van der Leun, A.M.; Thommen, D.S.; Schumacher, T.N. CD8+ T cell states in human cancer: insights from single-cell analysis. Nature reviews. Cancer 2020, 20, 218–232. [Google Scholar] [CrossRef] [PubMed]
- Misslitz, A.; Pabst, O.; Hintzen, G.; Ohl, L.; Kremmer, E.; Petrie, H.T.; Förster, R. Thymic T cell development and progenitor localization depend on CCR7. The Journal of experimental medicine 2004, 200, 481–491. [Google Scholar] [CrossRef] [PubMed]
- Liu, X.; Wu, Z.; Zuo, S.; Zhou, Y.; Chen, Y.; Wang, X. Establishment of orthotopic Lewis lung cancer model in mouse. Zhongguo Fei Ai Za Zhi 2010, 13, 42–47. [Google Scholar] [CrossRef] [PubMed]
- Justilien, V.; Fields, A.P. Utility and applications of orthotopic models of human non-small cell lung cancer (NSCLC) for the evaluation of novel and emerging cancer therapeutics. Curr. Protoc. Pharmacol. 2013, 62, 14.27.1–14.27.17. [Google Scholar] [CrossRef] [PubMed]
- Cardiff, R.D.; Miller, C.H.; Munn, R.J. Manual hematoxylin and eosin staining of mouse tissue sections. Cold Spring Harb. Protoc. 2014, 2014, 655–658. [Google Scholar] [CrossRef] [PubMed]
- Hather, G.; Liu, R.; Bandi, S.; Mettetal, J.; Manfredi, M.; Shyu, W.C.; Donelan, J.; Chakravarty, A. Growth rate analysis and efficient experimental design for tumor xenograft studies. Cancer Inform. 2014, 13, 65–72. [Google Scholar] [CrossRef]
- Tomayko, M.M.; Reynolds, C.P. Determination of subcutaneous tumor size in athymic (nude) mice. Cancer Chemother. Pharmacol. 1989, 24, 148–154. [Google Scholar] [CrossRef]
Figure 1.
The CD8+ T-cell count in blood on d3 and d7 after LLC cell implantation (% of total mononuclear cells number). Phenotype of CD8 cells: CD3+CD4-CD8+, CD3+CD8+PD-1(CD279)+, CD3+CD8+PD-L1(CD274)+, CD3+CD8+PD-1(CD279)hi, CD8+CD197(CCR7)+, CD8+CD62L−CD44+, CD8+CD62LhiCD44low, CD8+CD62L+CD44+, CD3+CD4-CD8+Ki67+ and CD3+CD8+PD-1+Ki67+. *—for comparison with the intact group by Mann–Whitney test (p<0.05).
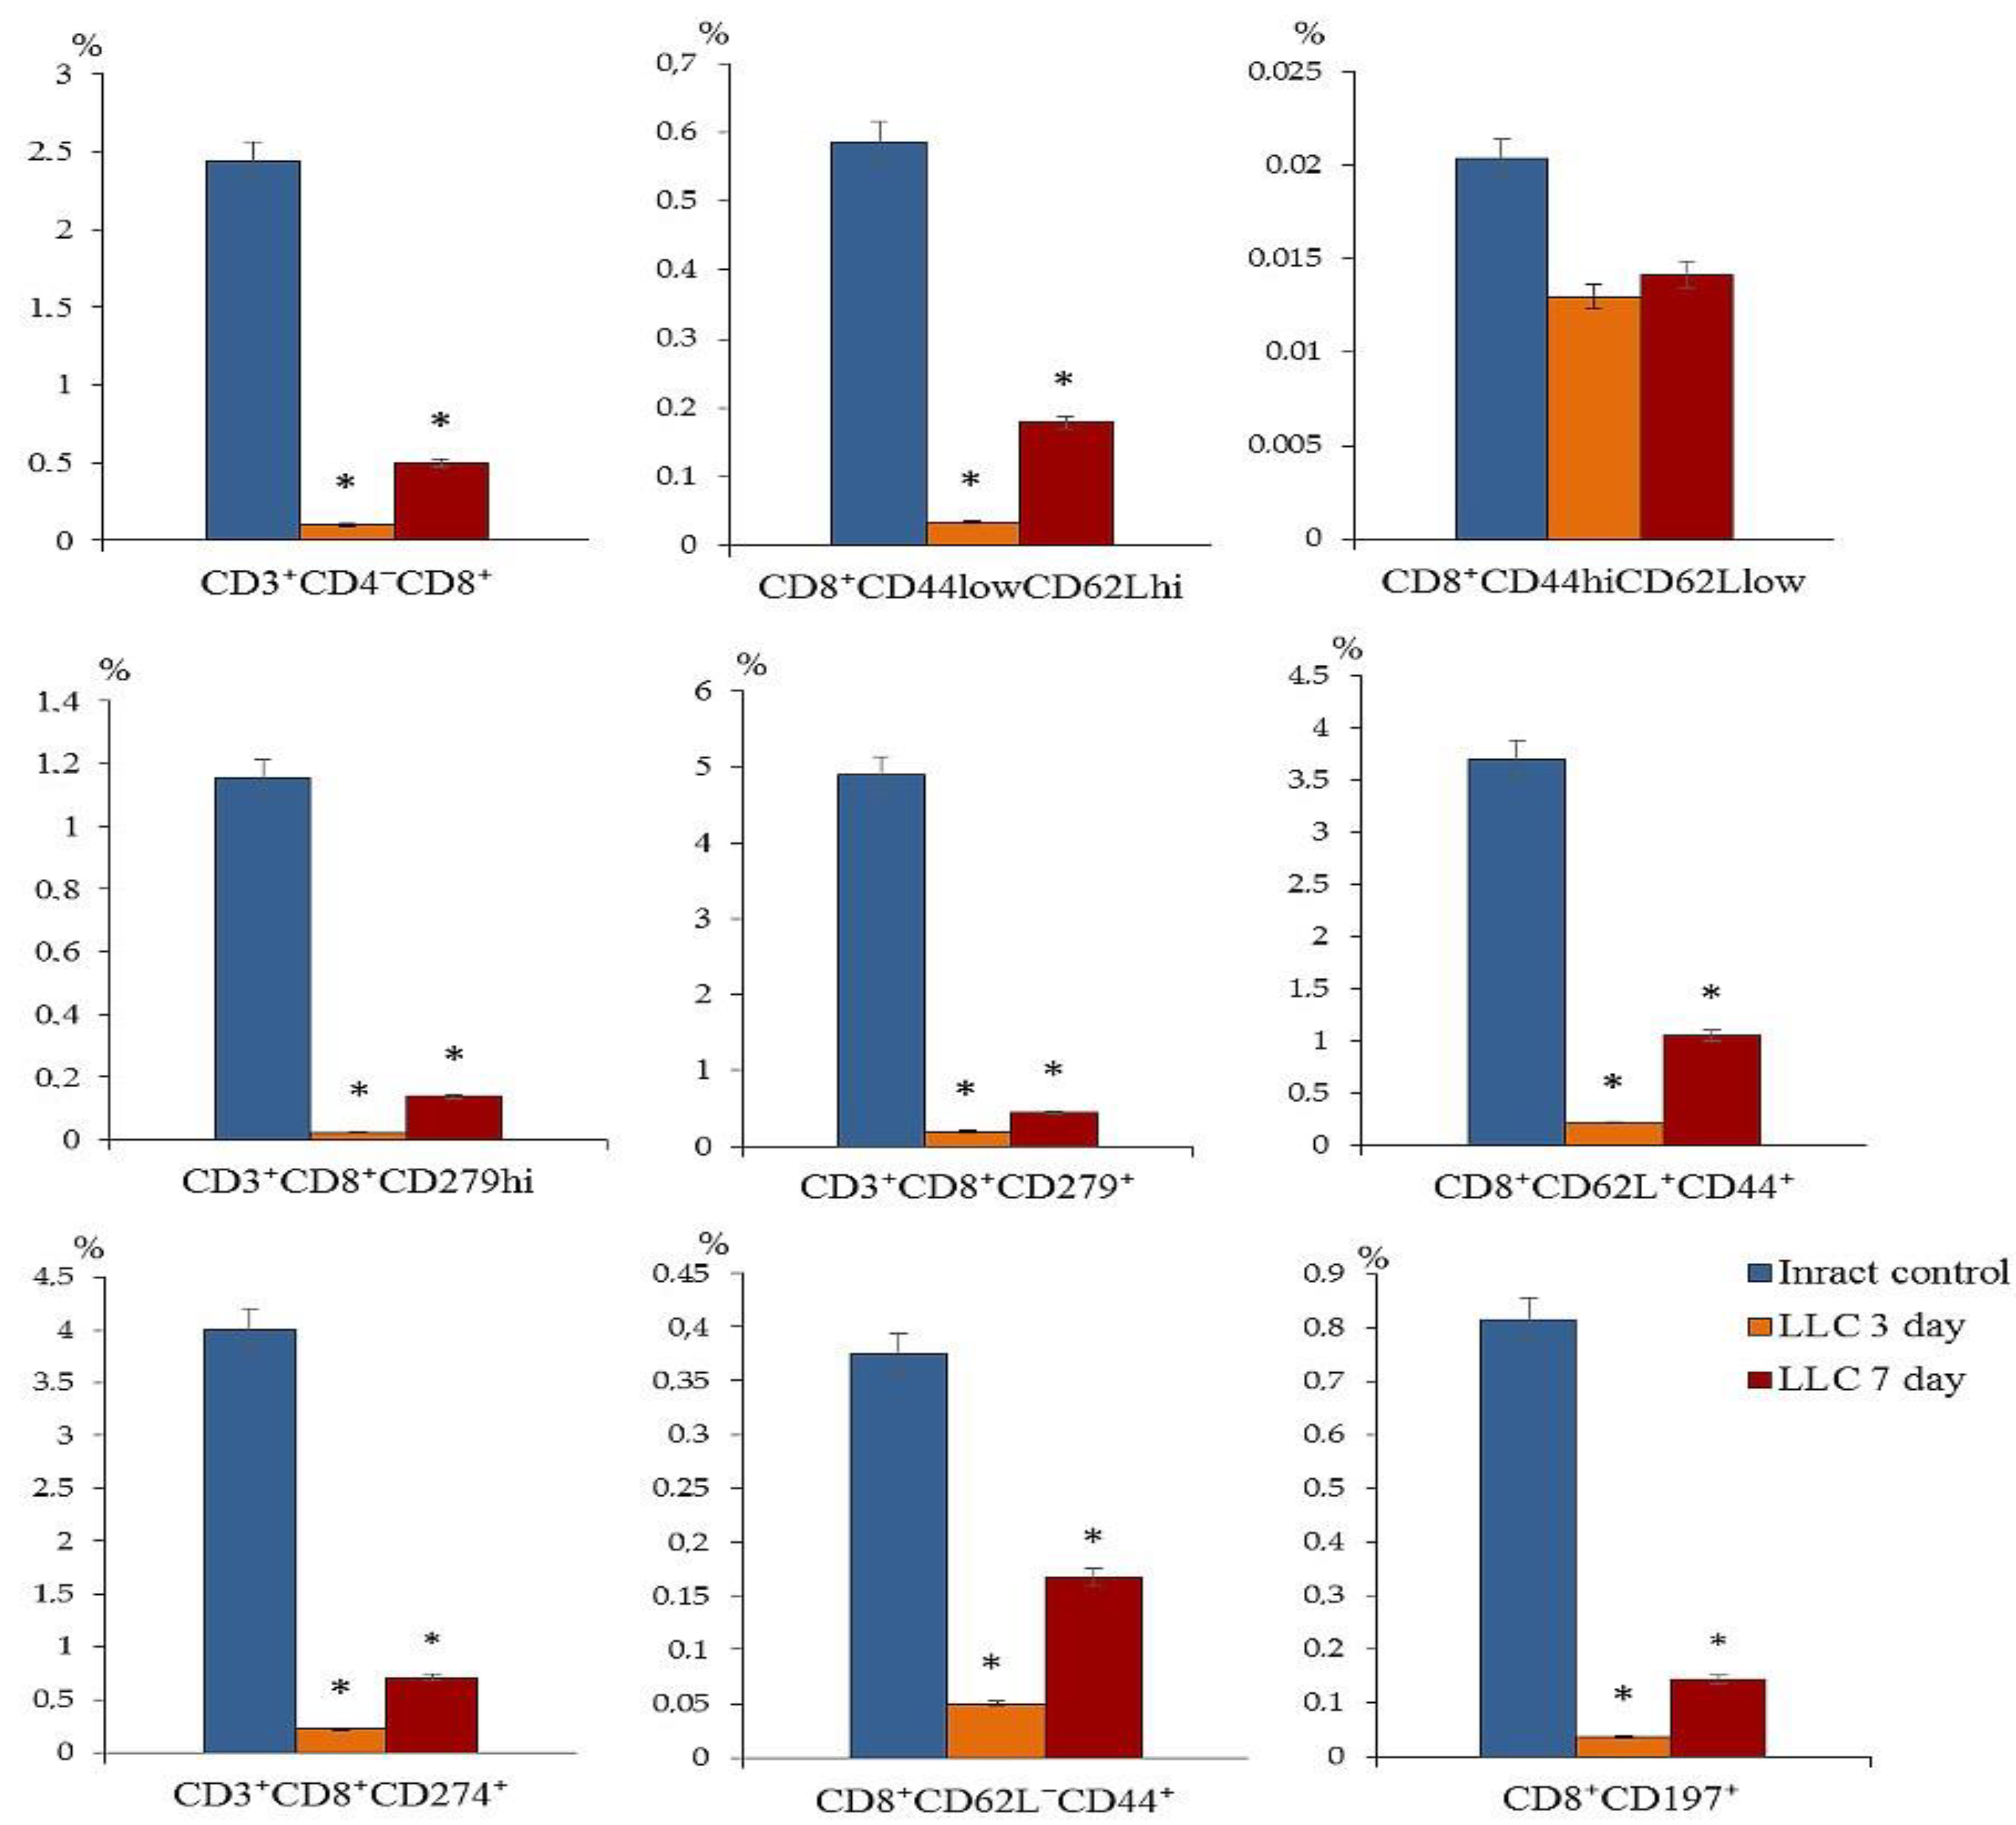
Figure 2.
The CCR7+ T-cell count in blood of mice with LLC on d3 and d7 (% of total mononuclear cell number or from CD8, or CD3). Phenotype of CD8+ T-cells: CD8+CCR7+, CD8+CD62L+CD95+CCR7+, CD8+CD62L+CCR7+CD95hi, СD8+CD62L+CD95+CCR7hi, CD8+CD62L+CD95+CCR7-, CD8+CD62L+CD44-, CD8+CD62L-CCR7-CD95hi, and CD45RA-CD62L-CD95-CD8-CCR7+. *—for comparison with the intact group by Mann–Whitney test (p<0.05).
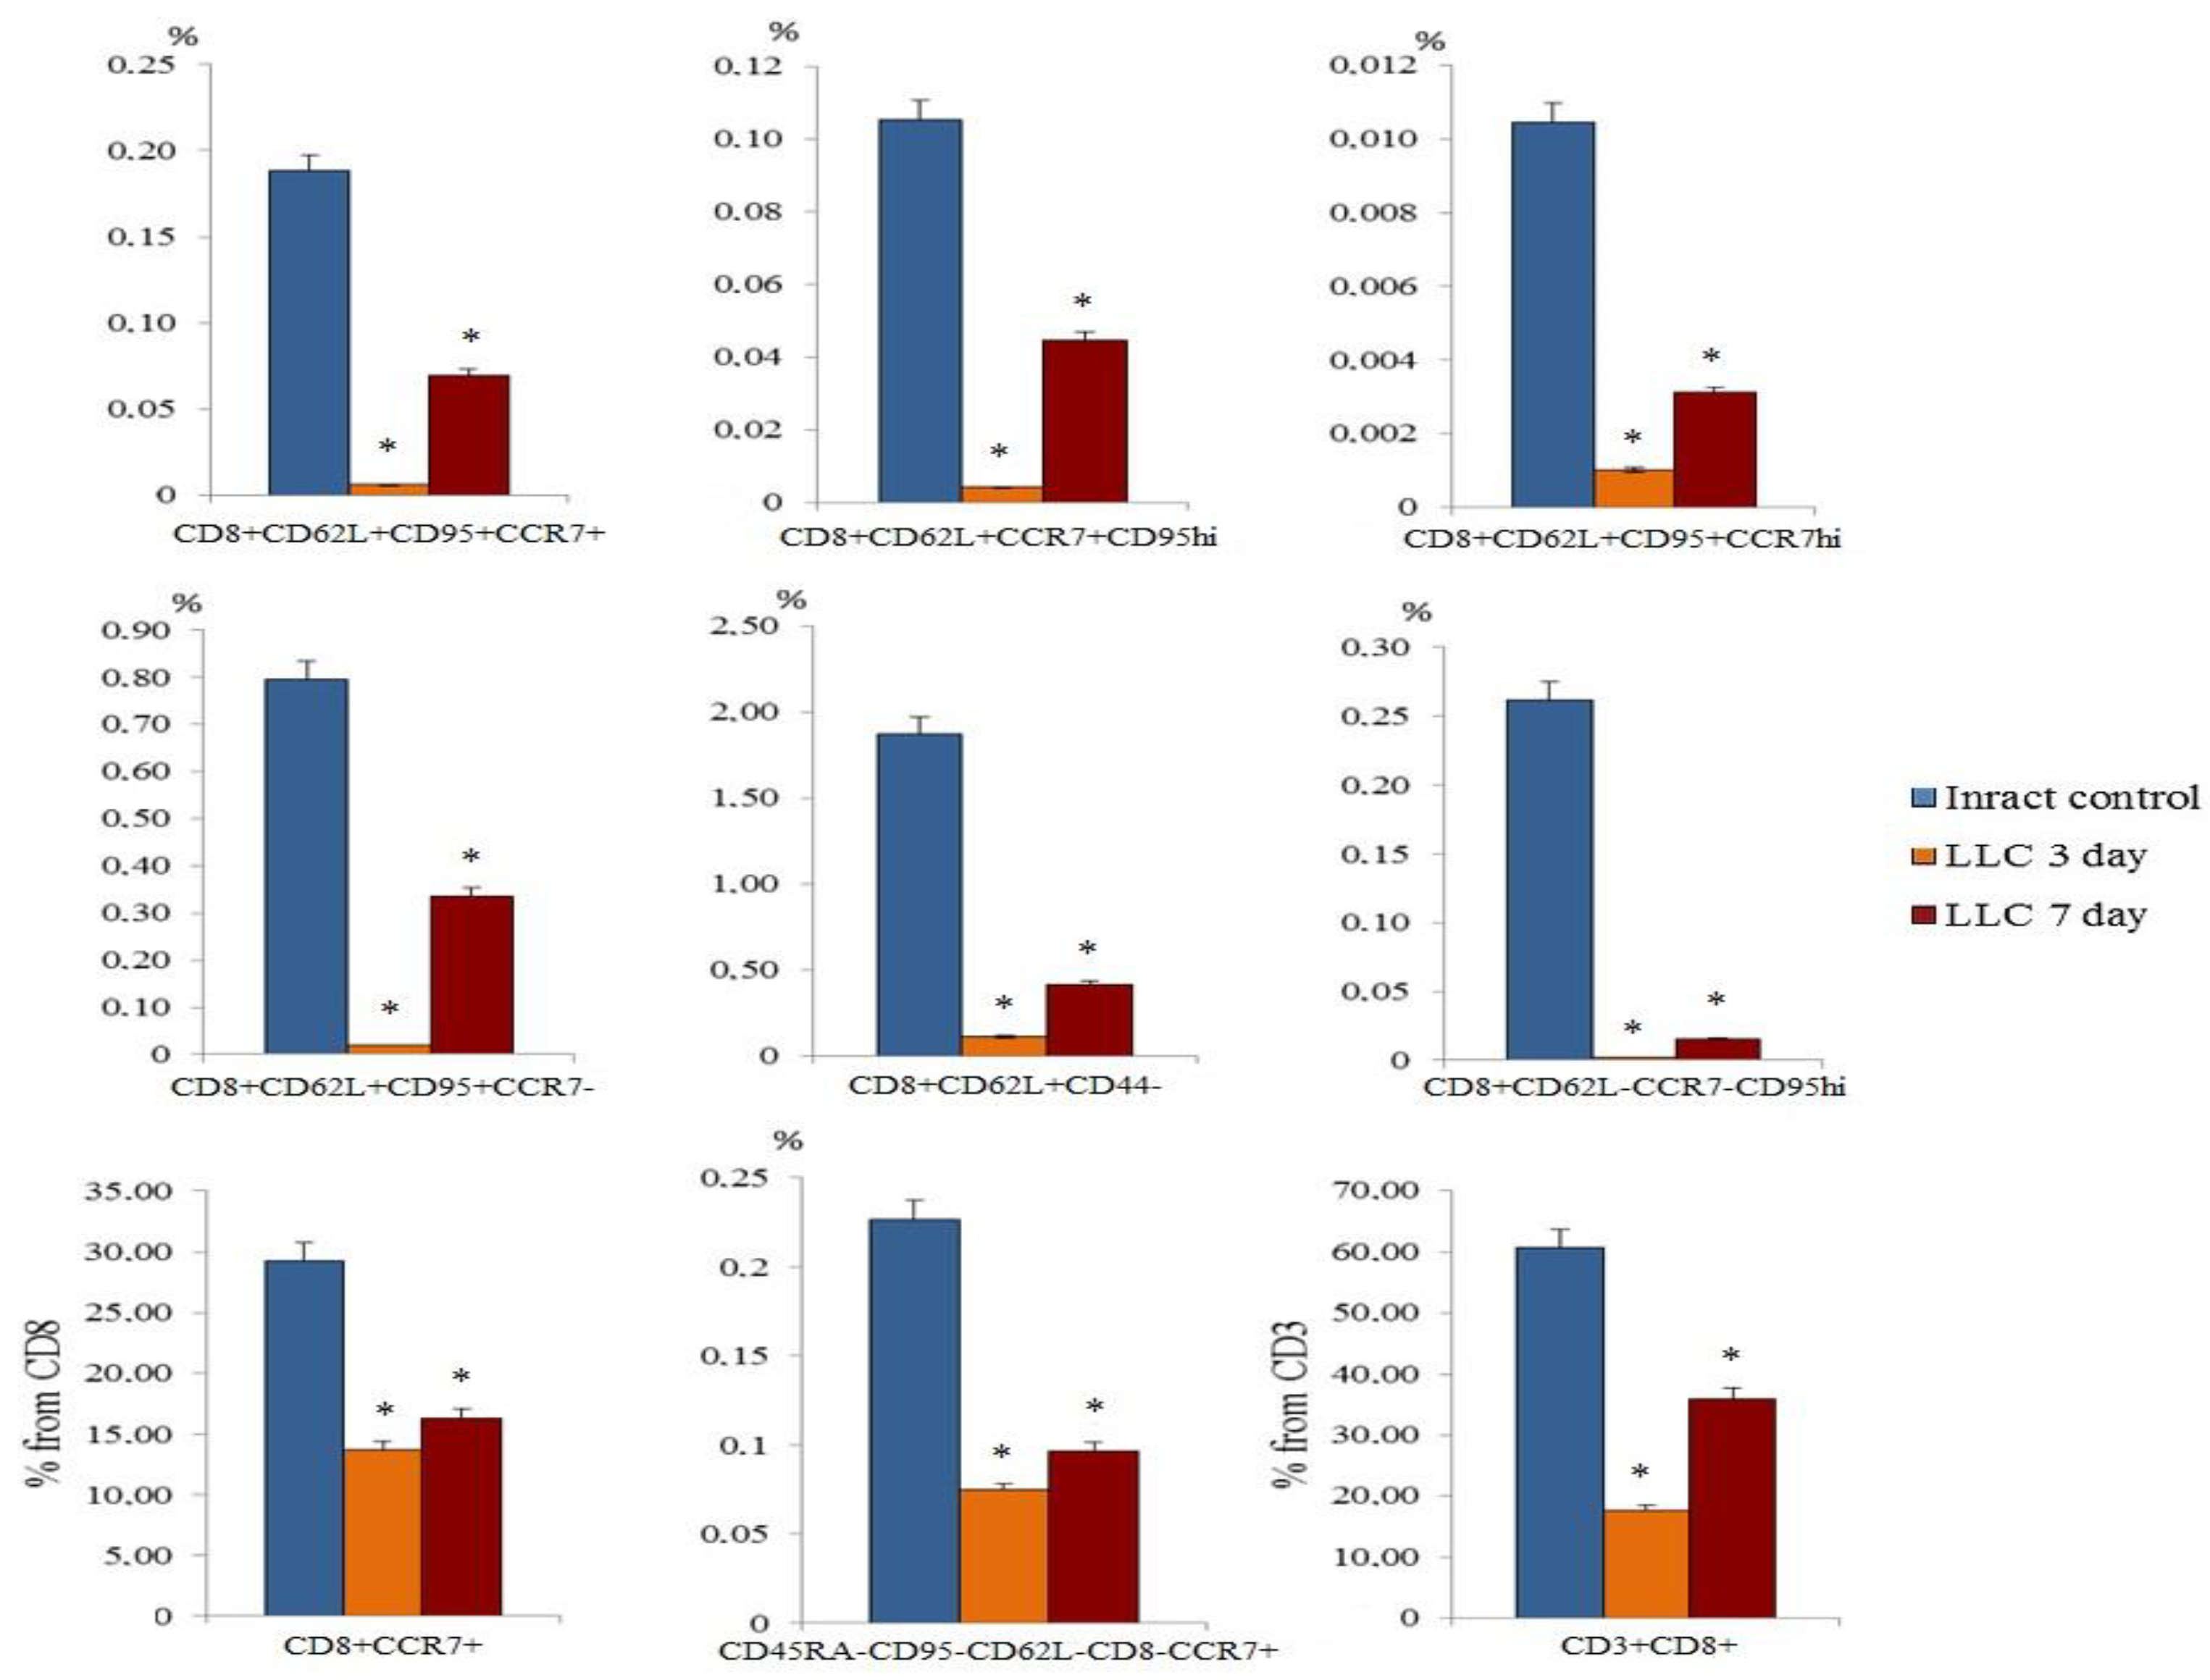
Figure 3.
The count of CD4+ T-cell in blood of mice on d3 and d7 after LLC cell implantation (% of total mononuclear cell number). Phenotype of CD4+ T-cells: CD3-CD4+, CD3+CD4+CD8+, CD3+CD4+PD-L1(CD274)+, CD3+CD4+PD-1(CD279)+, CD3+CD4+CD8-, CD3+CD4+PD-1+Ki67+ and CD3+CD4+CD8-Ki67+. *—for comparison with the intact group by Mann–Whitney test (p < 0.05).
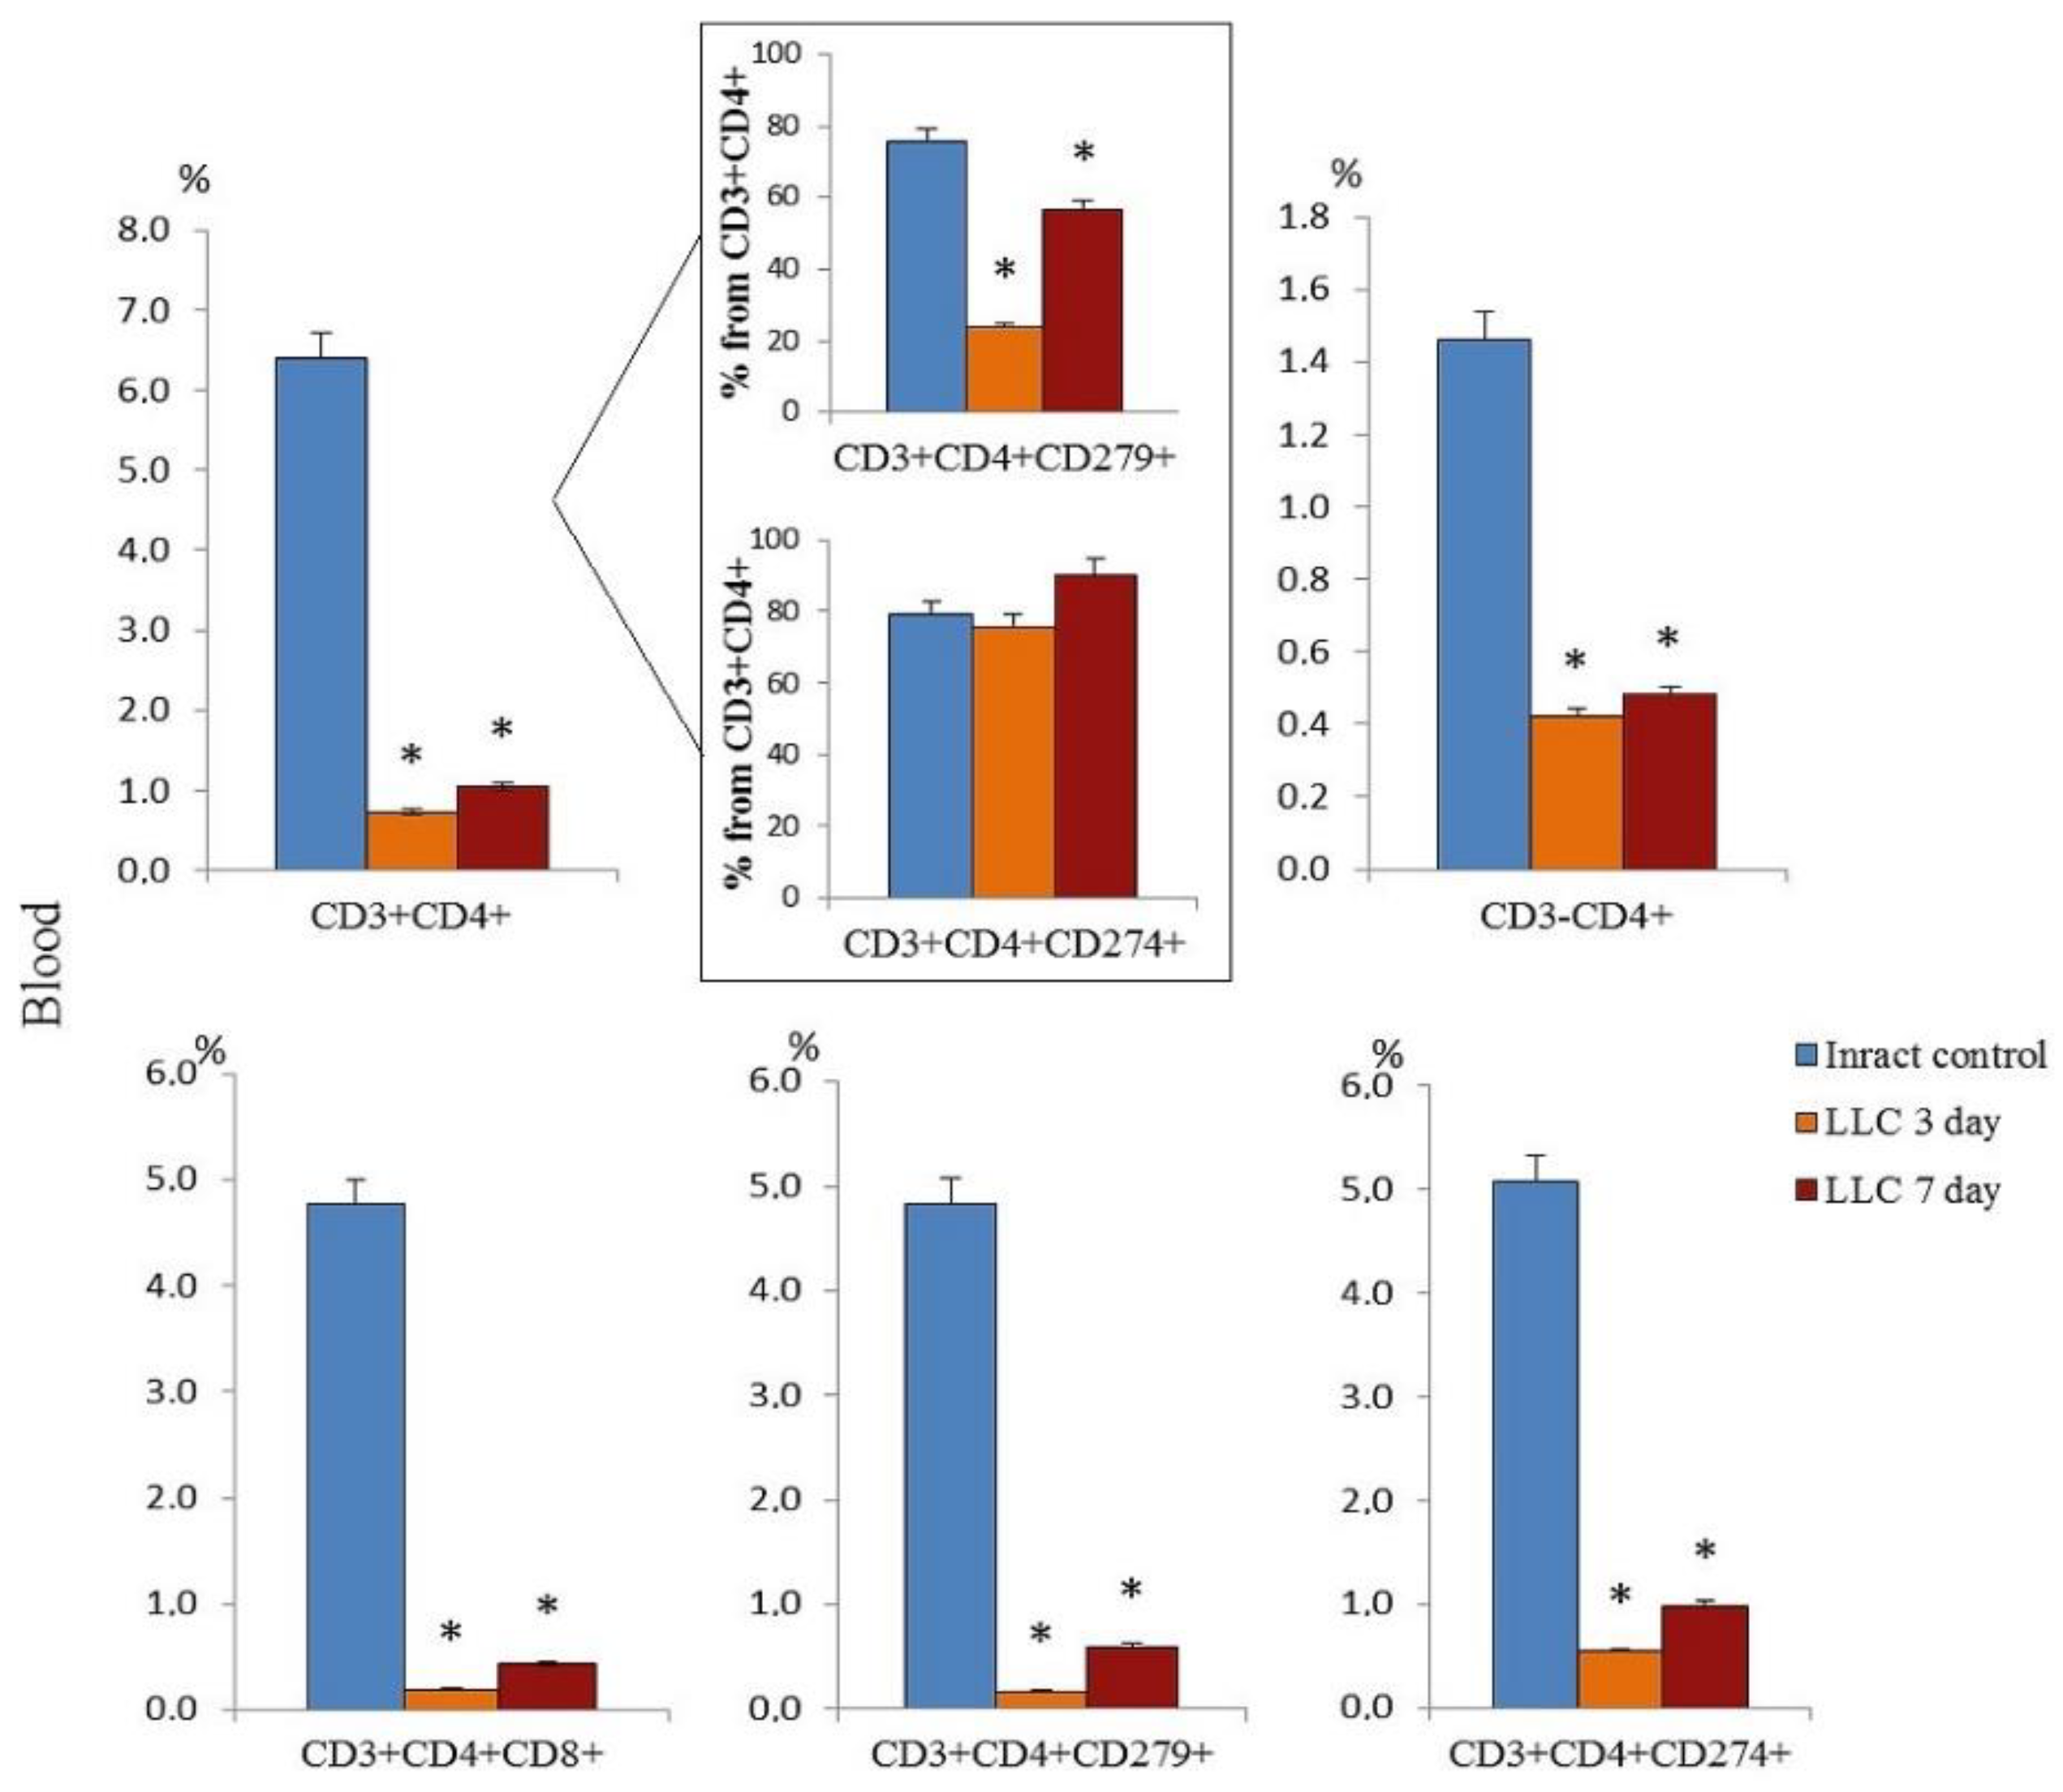
Figure 4.
The count of cancer cells and cancer stem cells in the blood of mice with LLC on d3 and on d7 (% of total mononuclear cells number). The phenotype of cancer cells and cancer stem cells: EGF+Sox2+, CD44+Sox2+, CD44hiCD90+, CD44hiCD90+Sox2+, CD90+Sox2+, (PD-1)CD279+Ki67+, (PD-L1)CD274+Ki67+. *—for comparison with the intact group by Mann–Whitney test (p < 0.05).
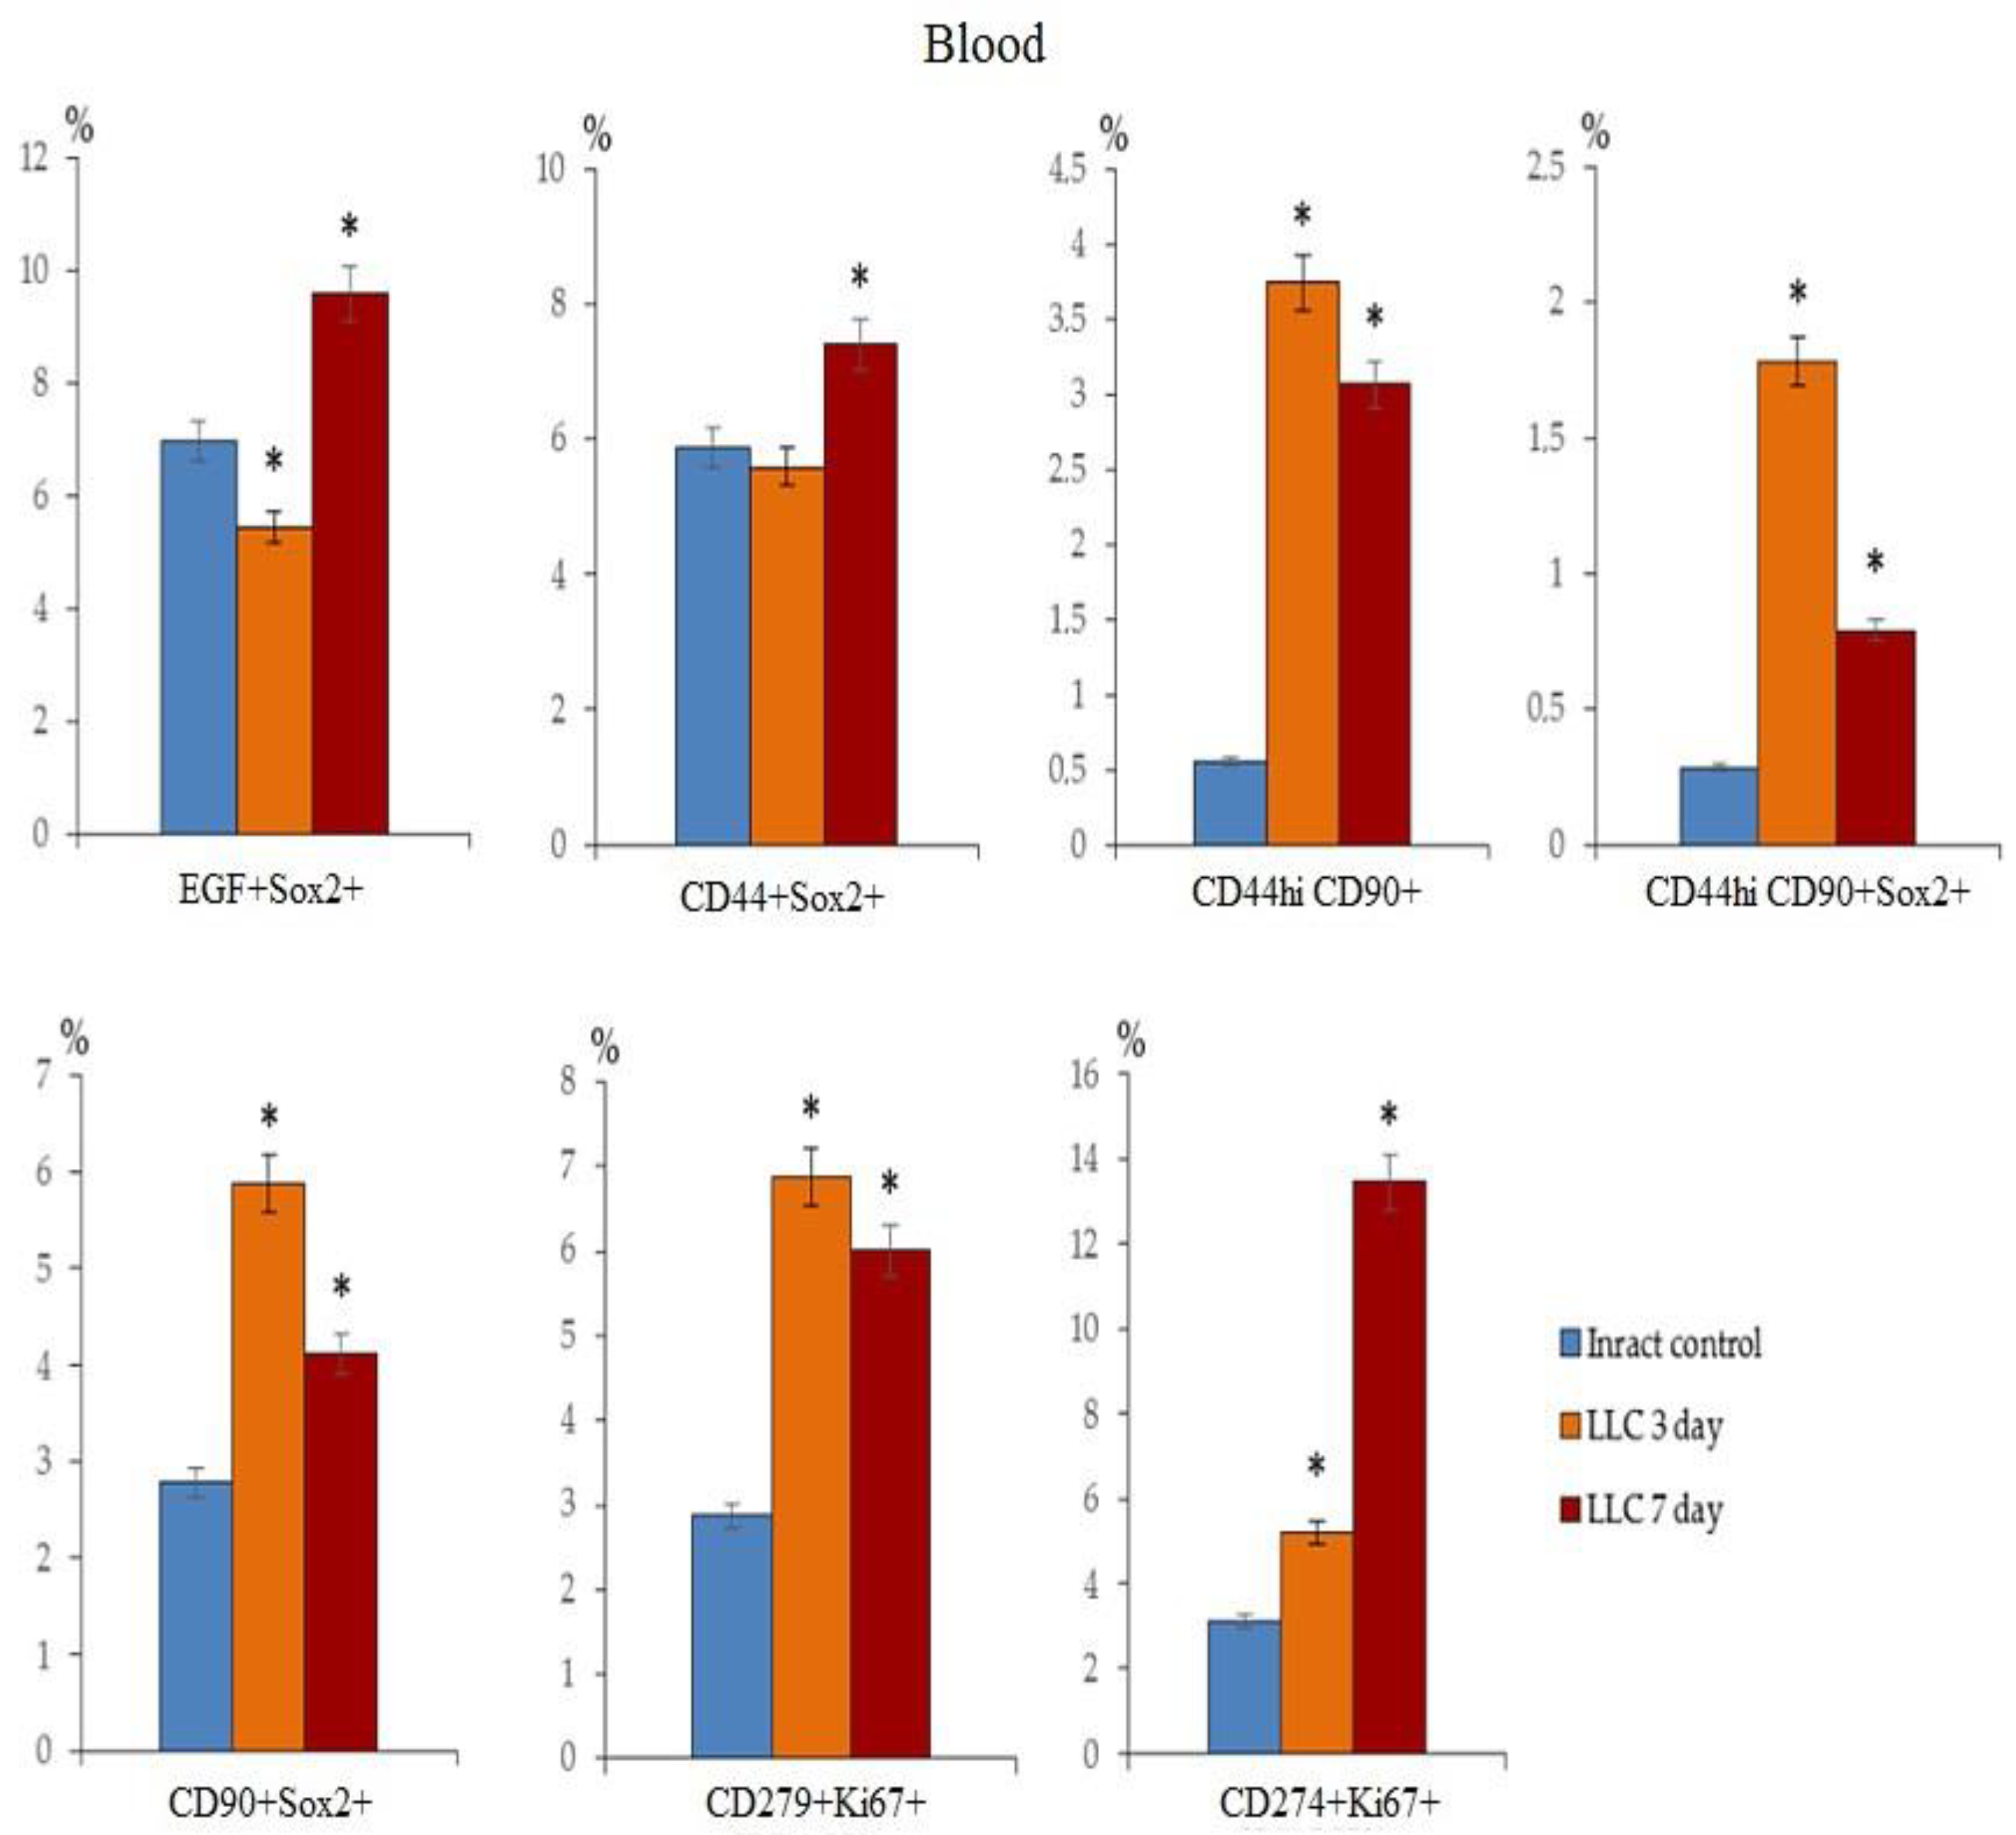
Figure 5.
The count of CCR7+CD3+CD8+T-cells in a culture of naive, reprogrammed, exhausted reprogrammed CD8+ T-cells isolated from the spleen. (a) The count of naive, reprogrammed, and exhausted reprogrammed CD8+ T-cells of the spleen of mice expressing the CCR7 marker in T-cell culture; 20× images of T-cells stained with: Hoechst (blue) to identify cell nuclei; CD8 FITC (green); CCR7 AF555 (red); (Hoechst+CD8+ CCR7) composite image using all three colors. Determination of the percentage of cells CD3+CD8+CCR7+ was made by assessing the ratio of cells counted in green and red channel to total cells counted in the blue (DAPI) channel. All scale bars are 1000 µm. (b) Isotypes, Histograms and Dot-plot of phenotype establishment and qualitative analysis of CD8 (BV510), CD62L (APC), (CCR7) CD197 (PE), CD95 (BV421); The count of naïve (naiveCD8+ T-cells), reprogrammed(rsCD8+ T-cells), and exhausted reprogrammed CD8+ T-cells (exrsCD8+ T-cells) isolated from spleen of C57BL/6 mice with phenotype CD8+CD197+, CD8+CD62L+CD197+CD95+, and CD8+CD62L+CD95+CD197- cells in population of CD8+T-cells (% of CD8+T-cells) from T-cell culture. *—for comparison with the naive spleen T-cells by Mann–Whitney test (p < 0.05).
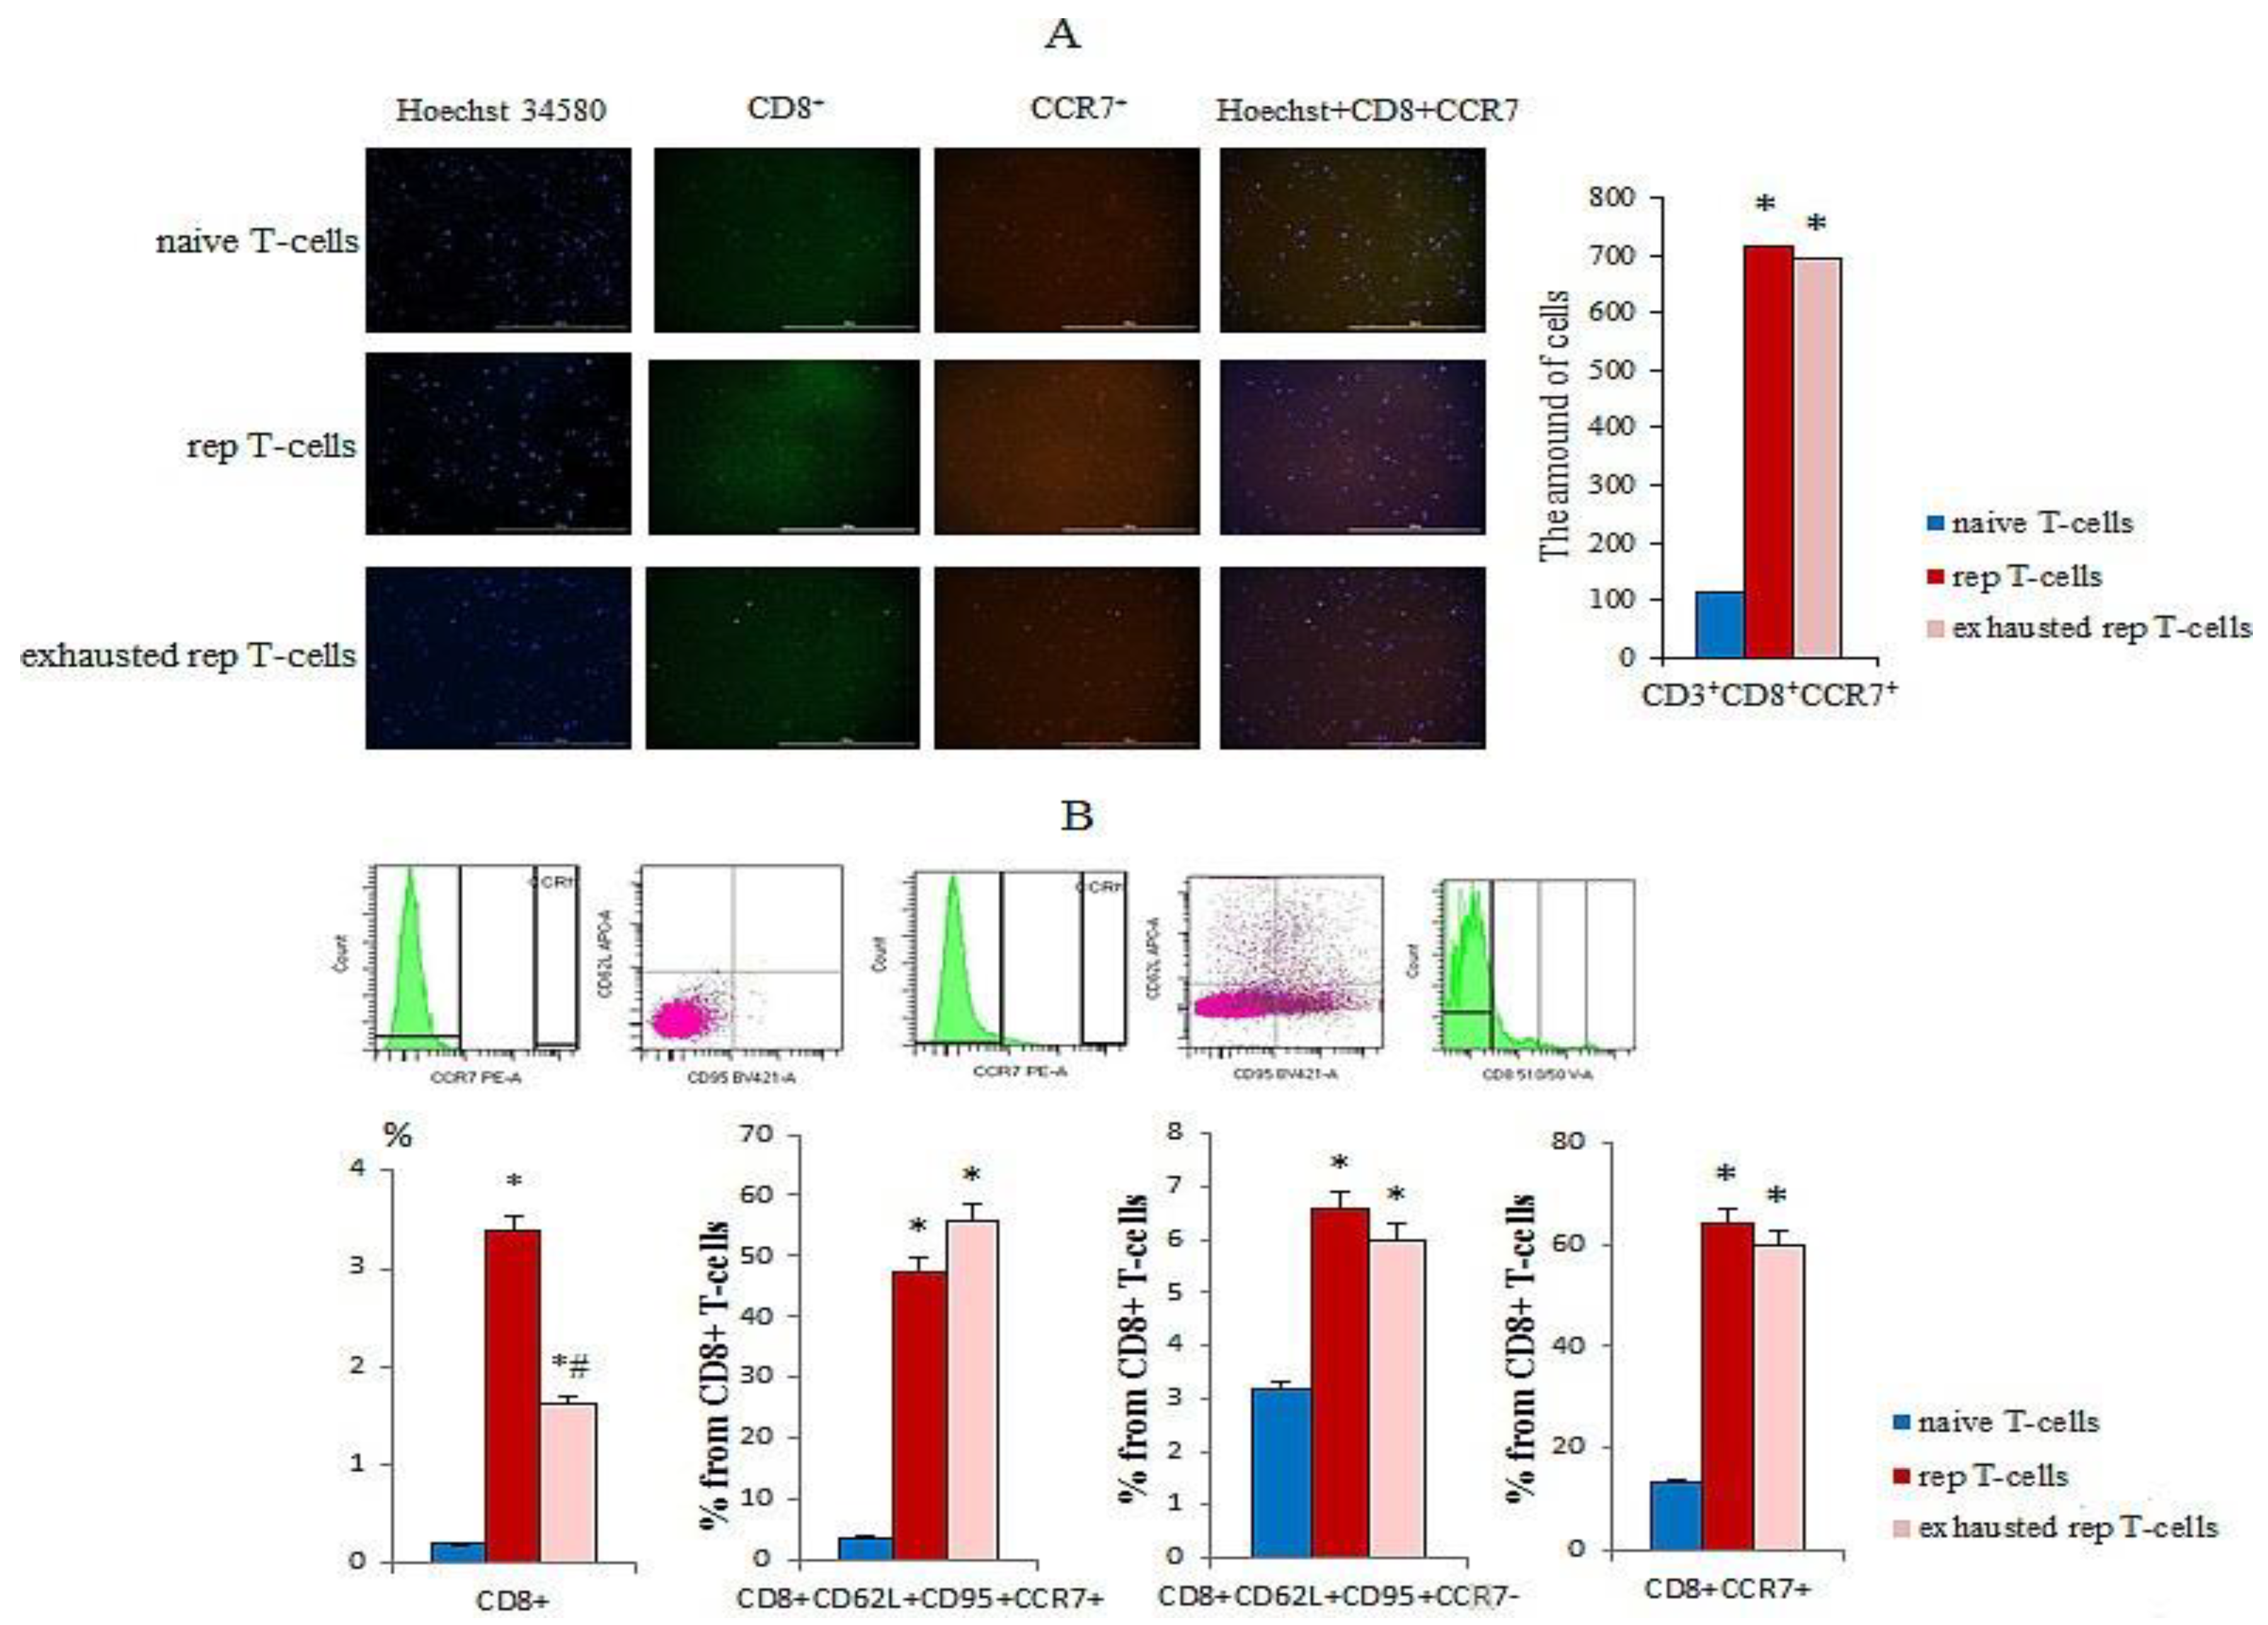
Figure 6.
Cytotoxicity and apoptosis of naive and reprogrammed spleen CD8+ T-cells in LLC culture. (a) The count of apoptotic tumor LLC cells after co-cultivation with reprogrammed spleen CD8+ T-cells (% from dead cells of LLC culture); (b) The count of apoptotic tumor LLC cells after cocultivation with spleen CD8+ T-cells (% from added cells); (c) Hoechst (blue) to identify cell nuclei; 7AAD (red); (Hoechst+7AAD+) composite image using all two colors. Determination of the percent of died cells of LLC Hoechst+7AAD+ was made by assessing the ratio of cells counted in blue and red channel to total cells of LLC without green channel. All scale bars are 1000 μm. * - for comparison with naive CD8+ T-cell by Mann–Whitney test (p < 0.05).
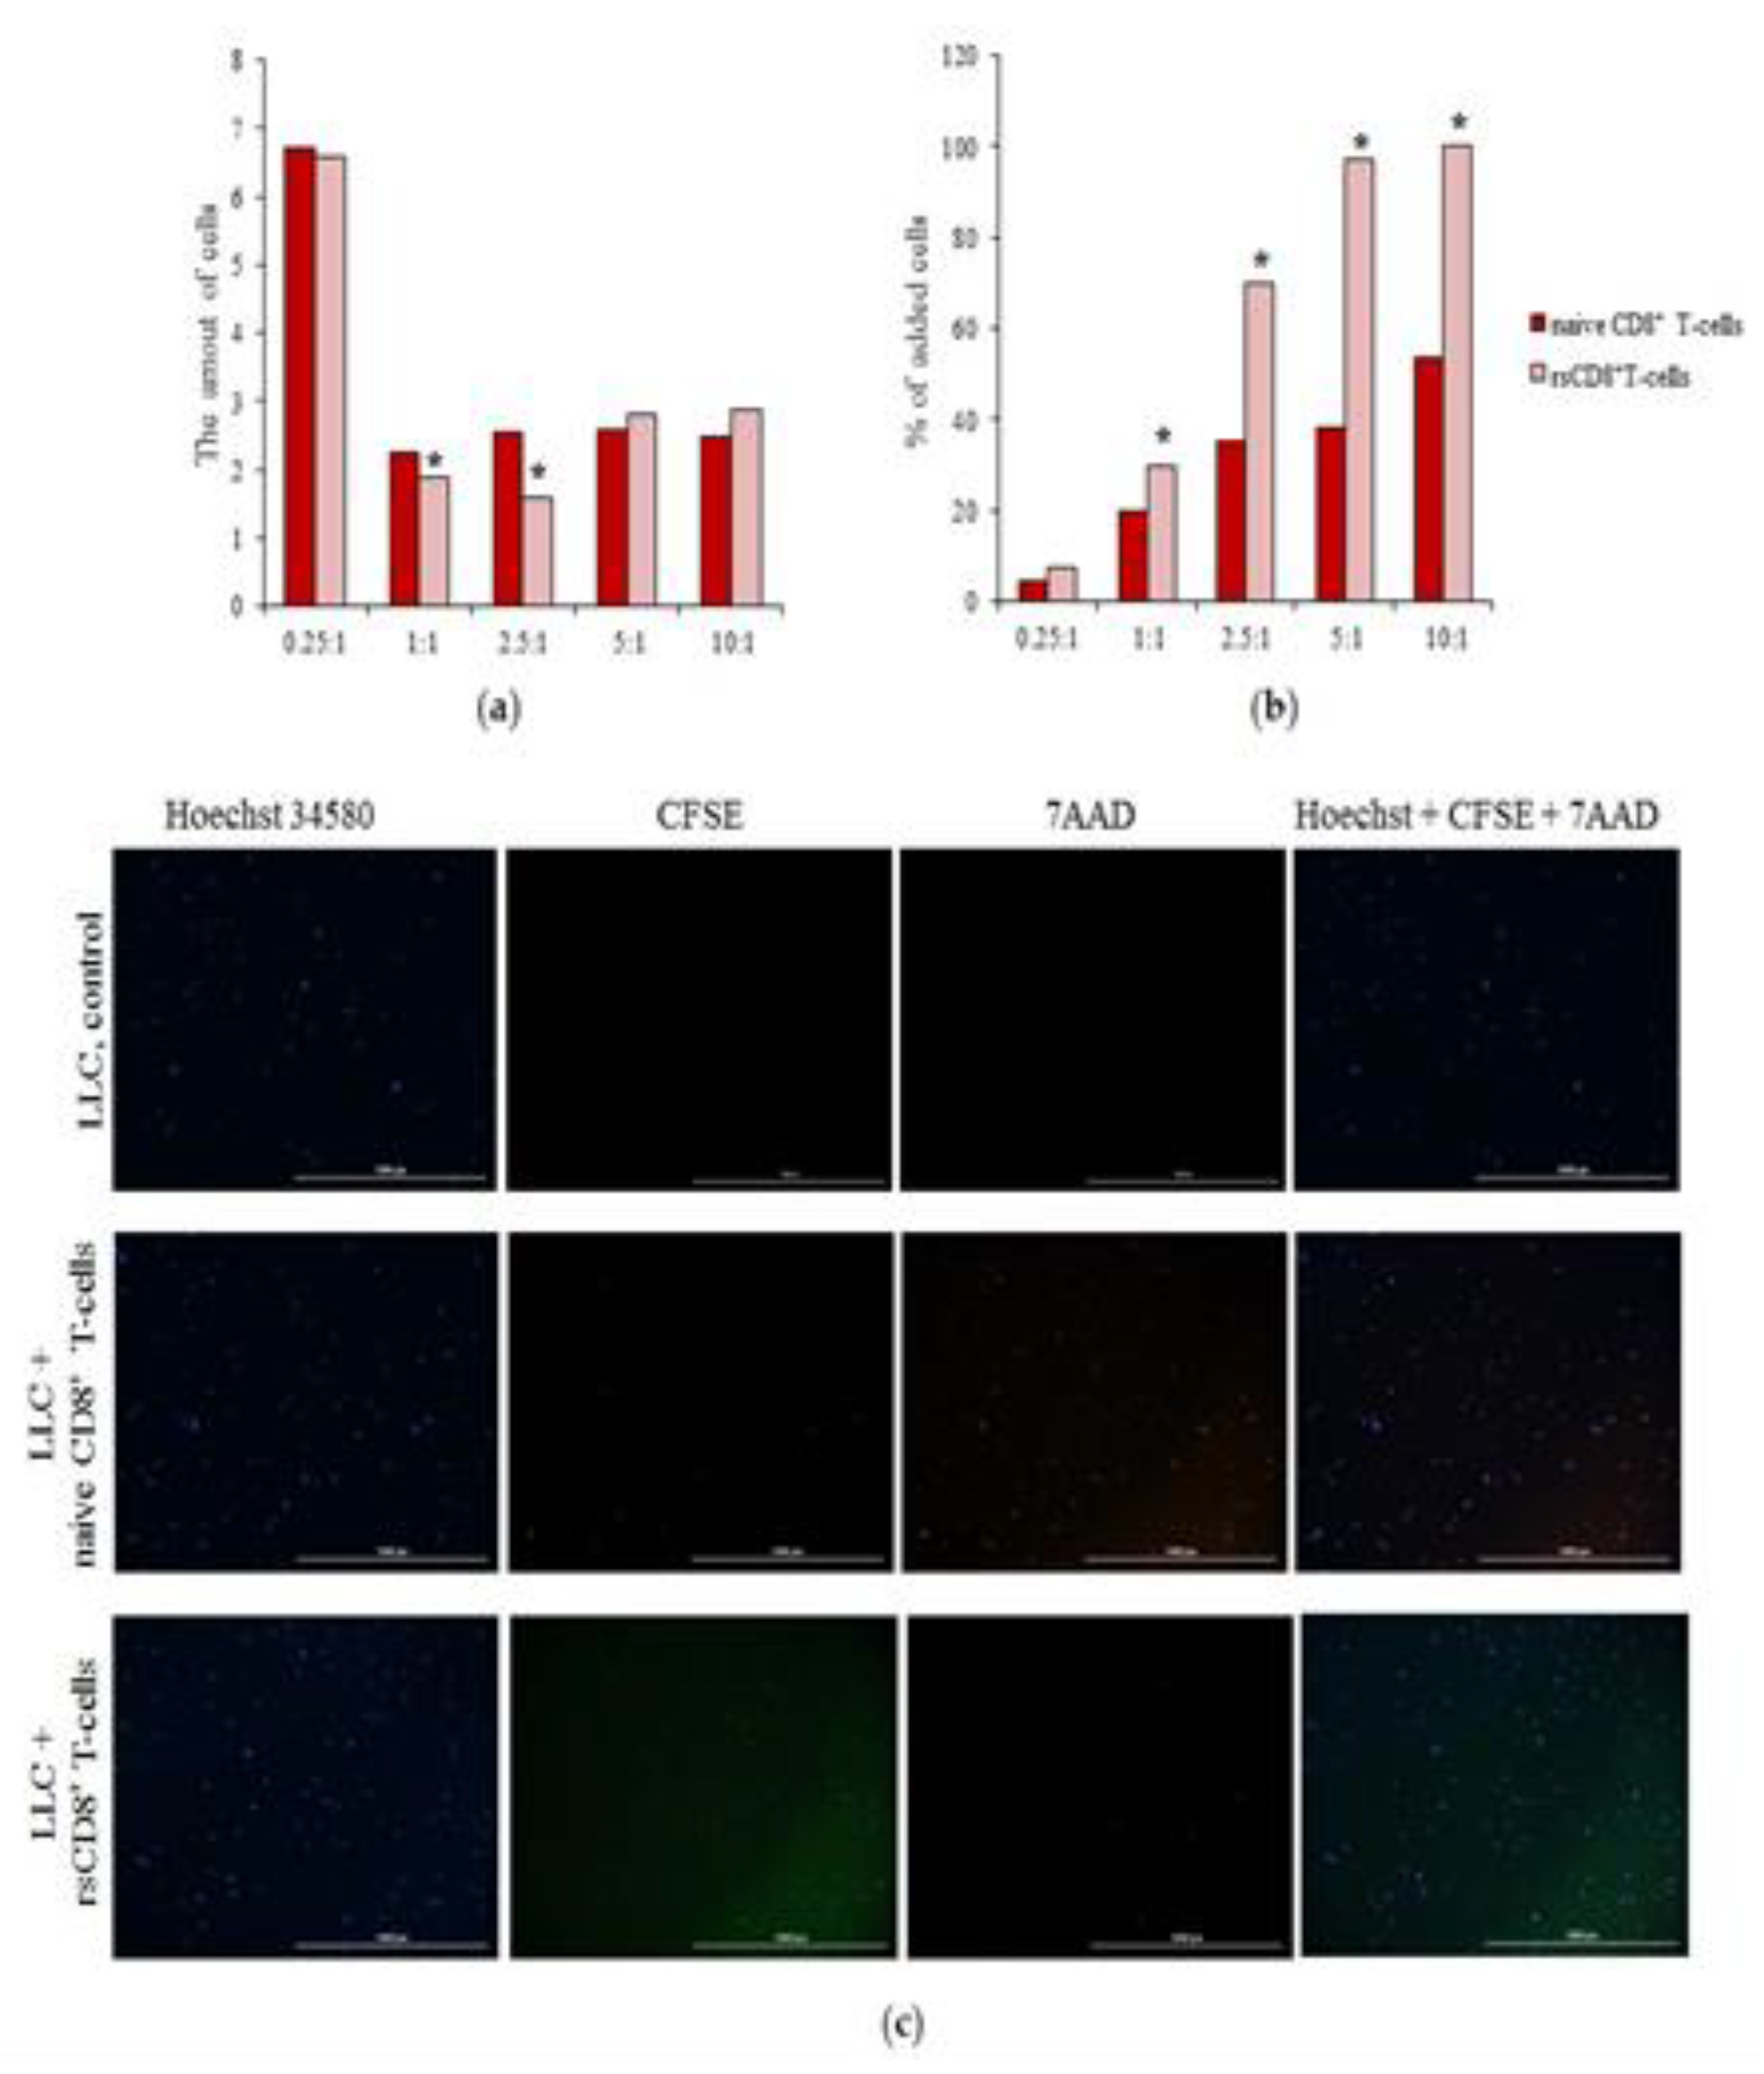
Figure 7.
The count of CD45+CD8+CFSE+ T-cells isolated from the spleen in the lung of mice with LLC 60 min after LLC introduction. (a) Unlabeled by CFSE control of CD8 T-cells from spleen of mice; (b) Labeled by CFSE control of CD8 T-cells from spleen of mice; (c) Content of CFSE-labeled CD45+CD8+ T-cells isolated from the spleen in the lung of mice with LLC 60 min after cell therapy.
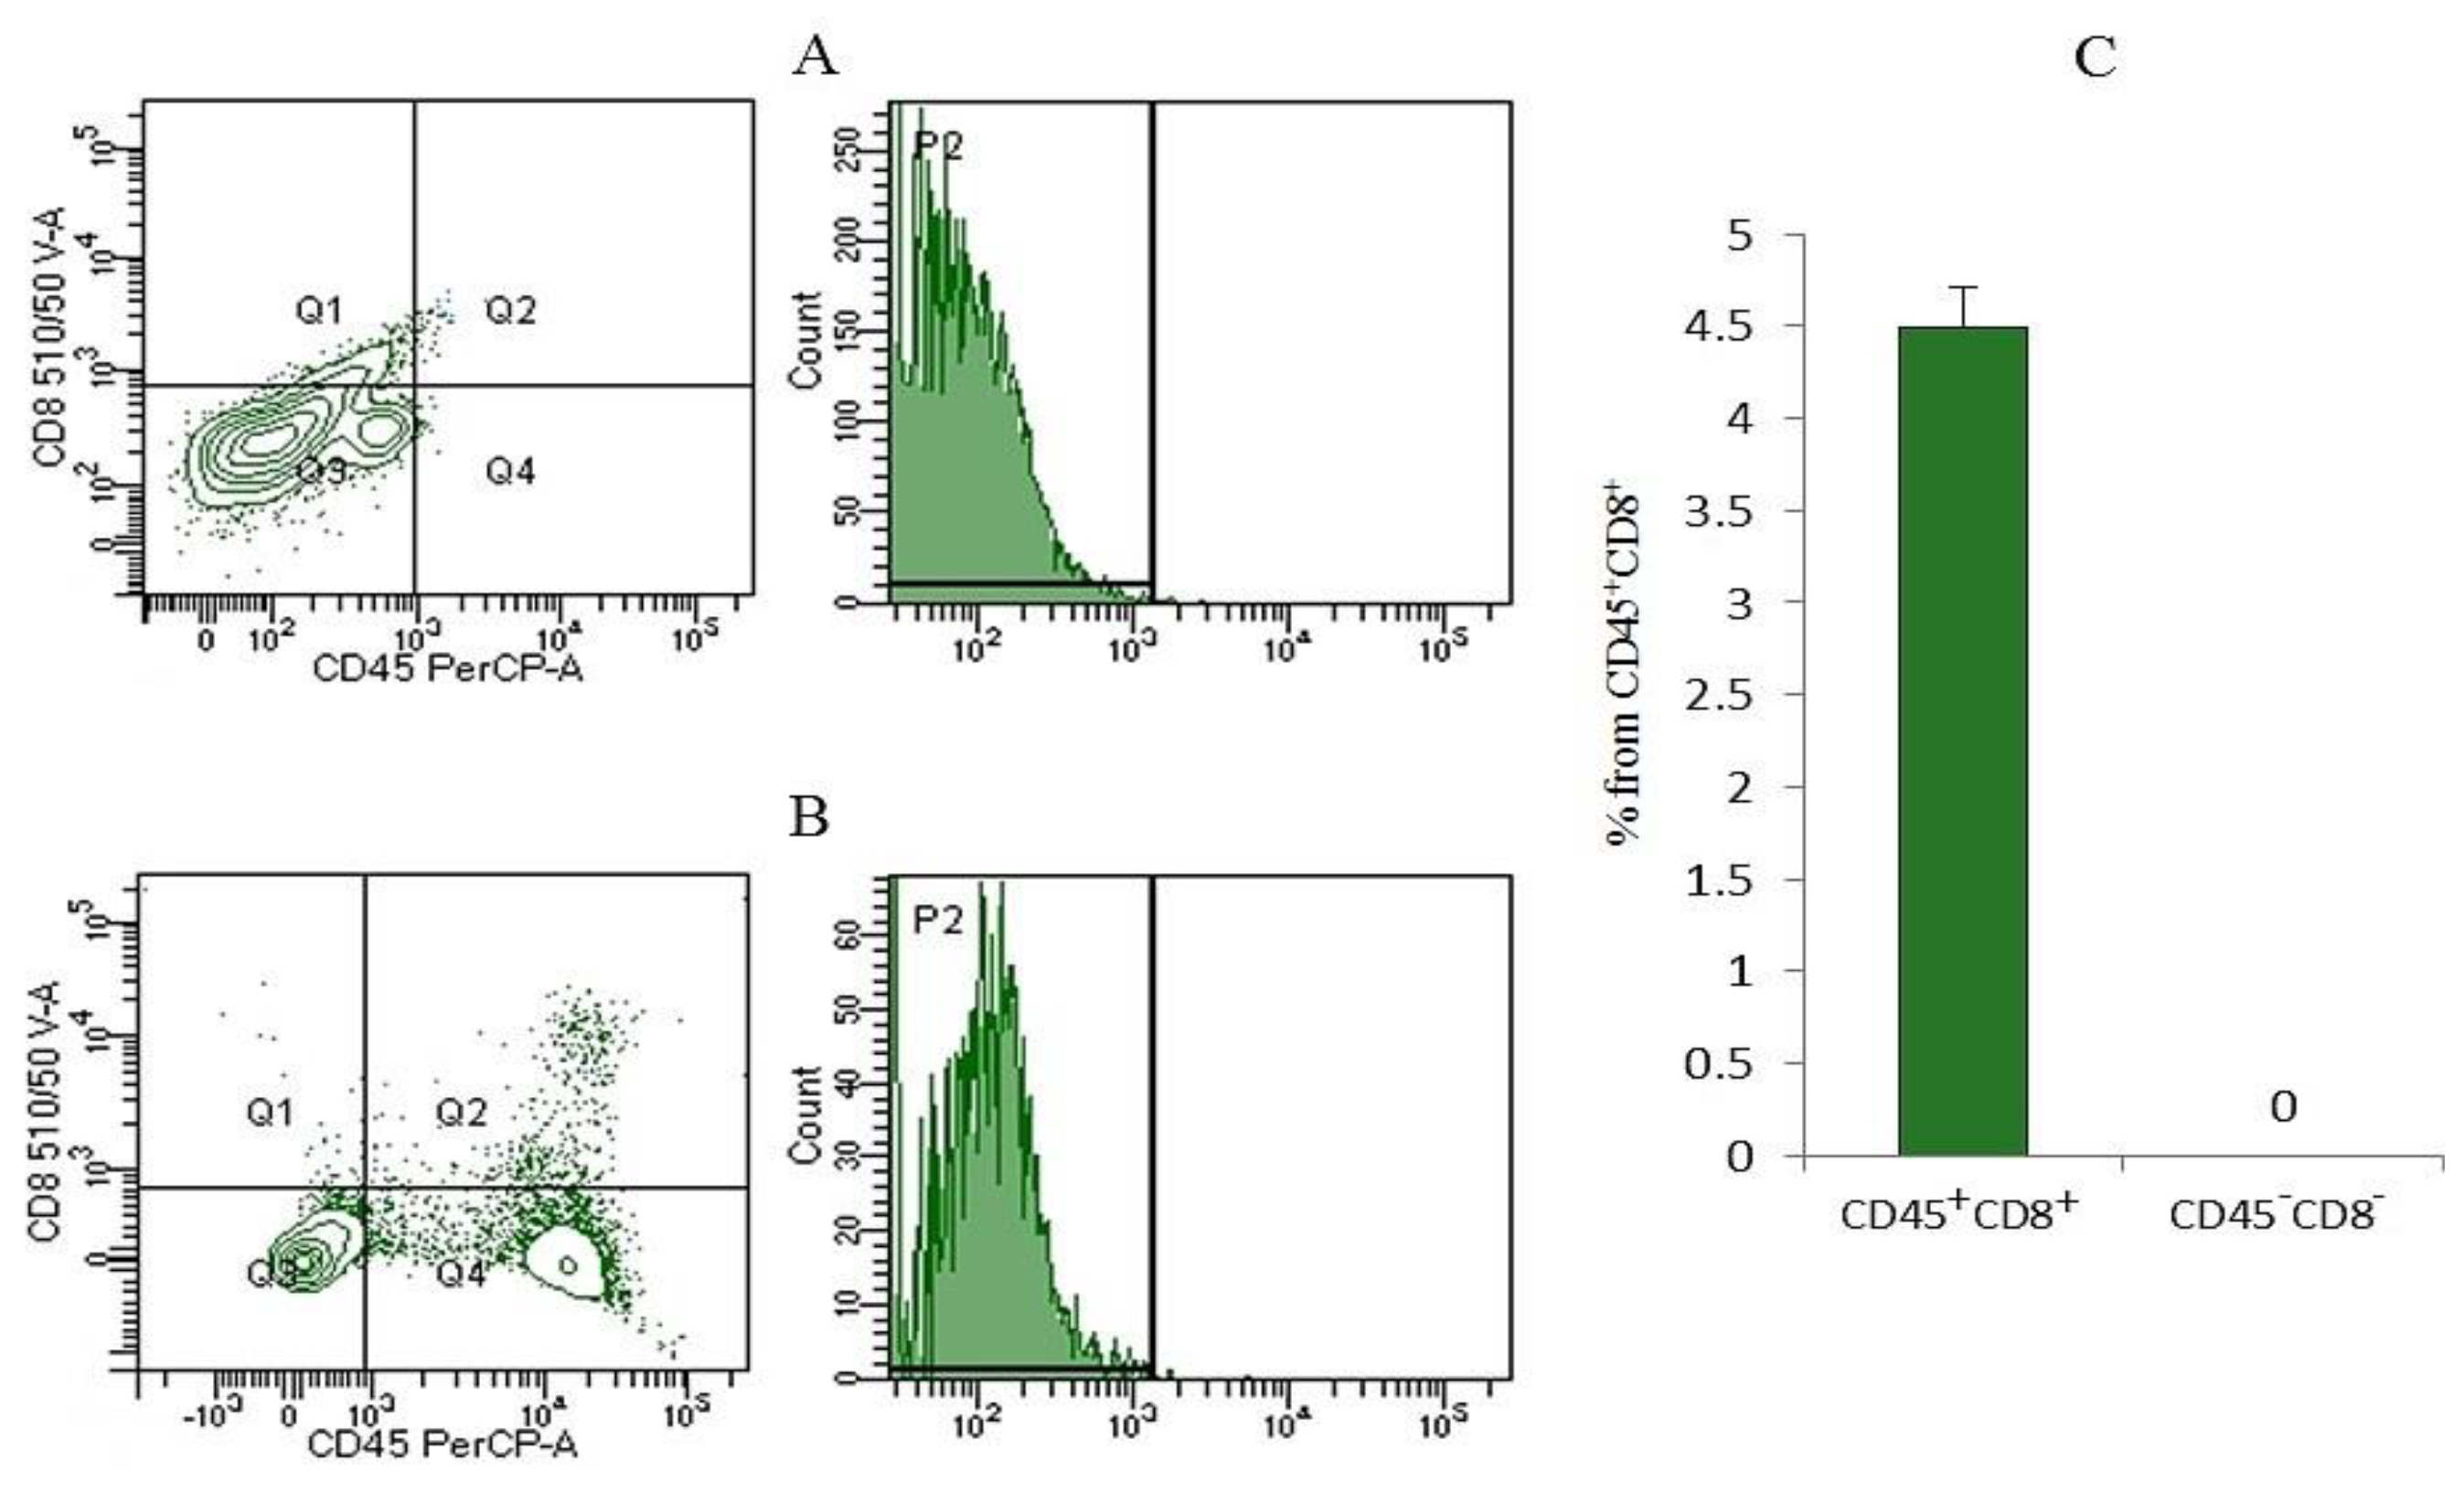
Figure 8.
The effect of rsCD8+ T-cell-therapy on CD8+ T-cell count in blood of mice on d7 after LLC cell implantation (% from intact control). 100 % - level of cells from mice of intact control. *—for comparison with the intact group by Mann–Whitney test (p<0.05); #—for comparison with the mice with LLC by Mann–Whitney test (p<0.05).
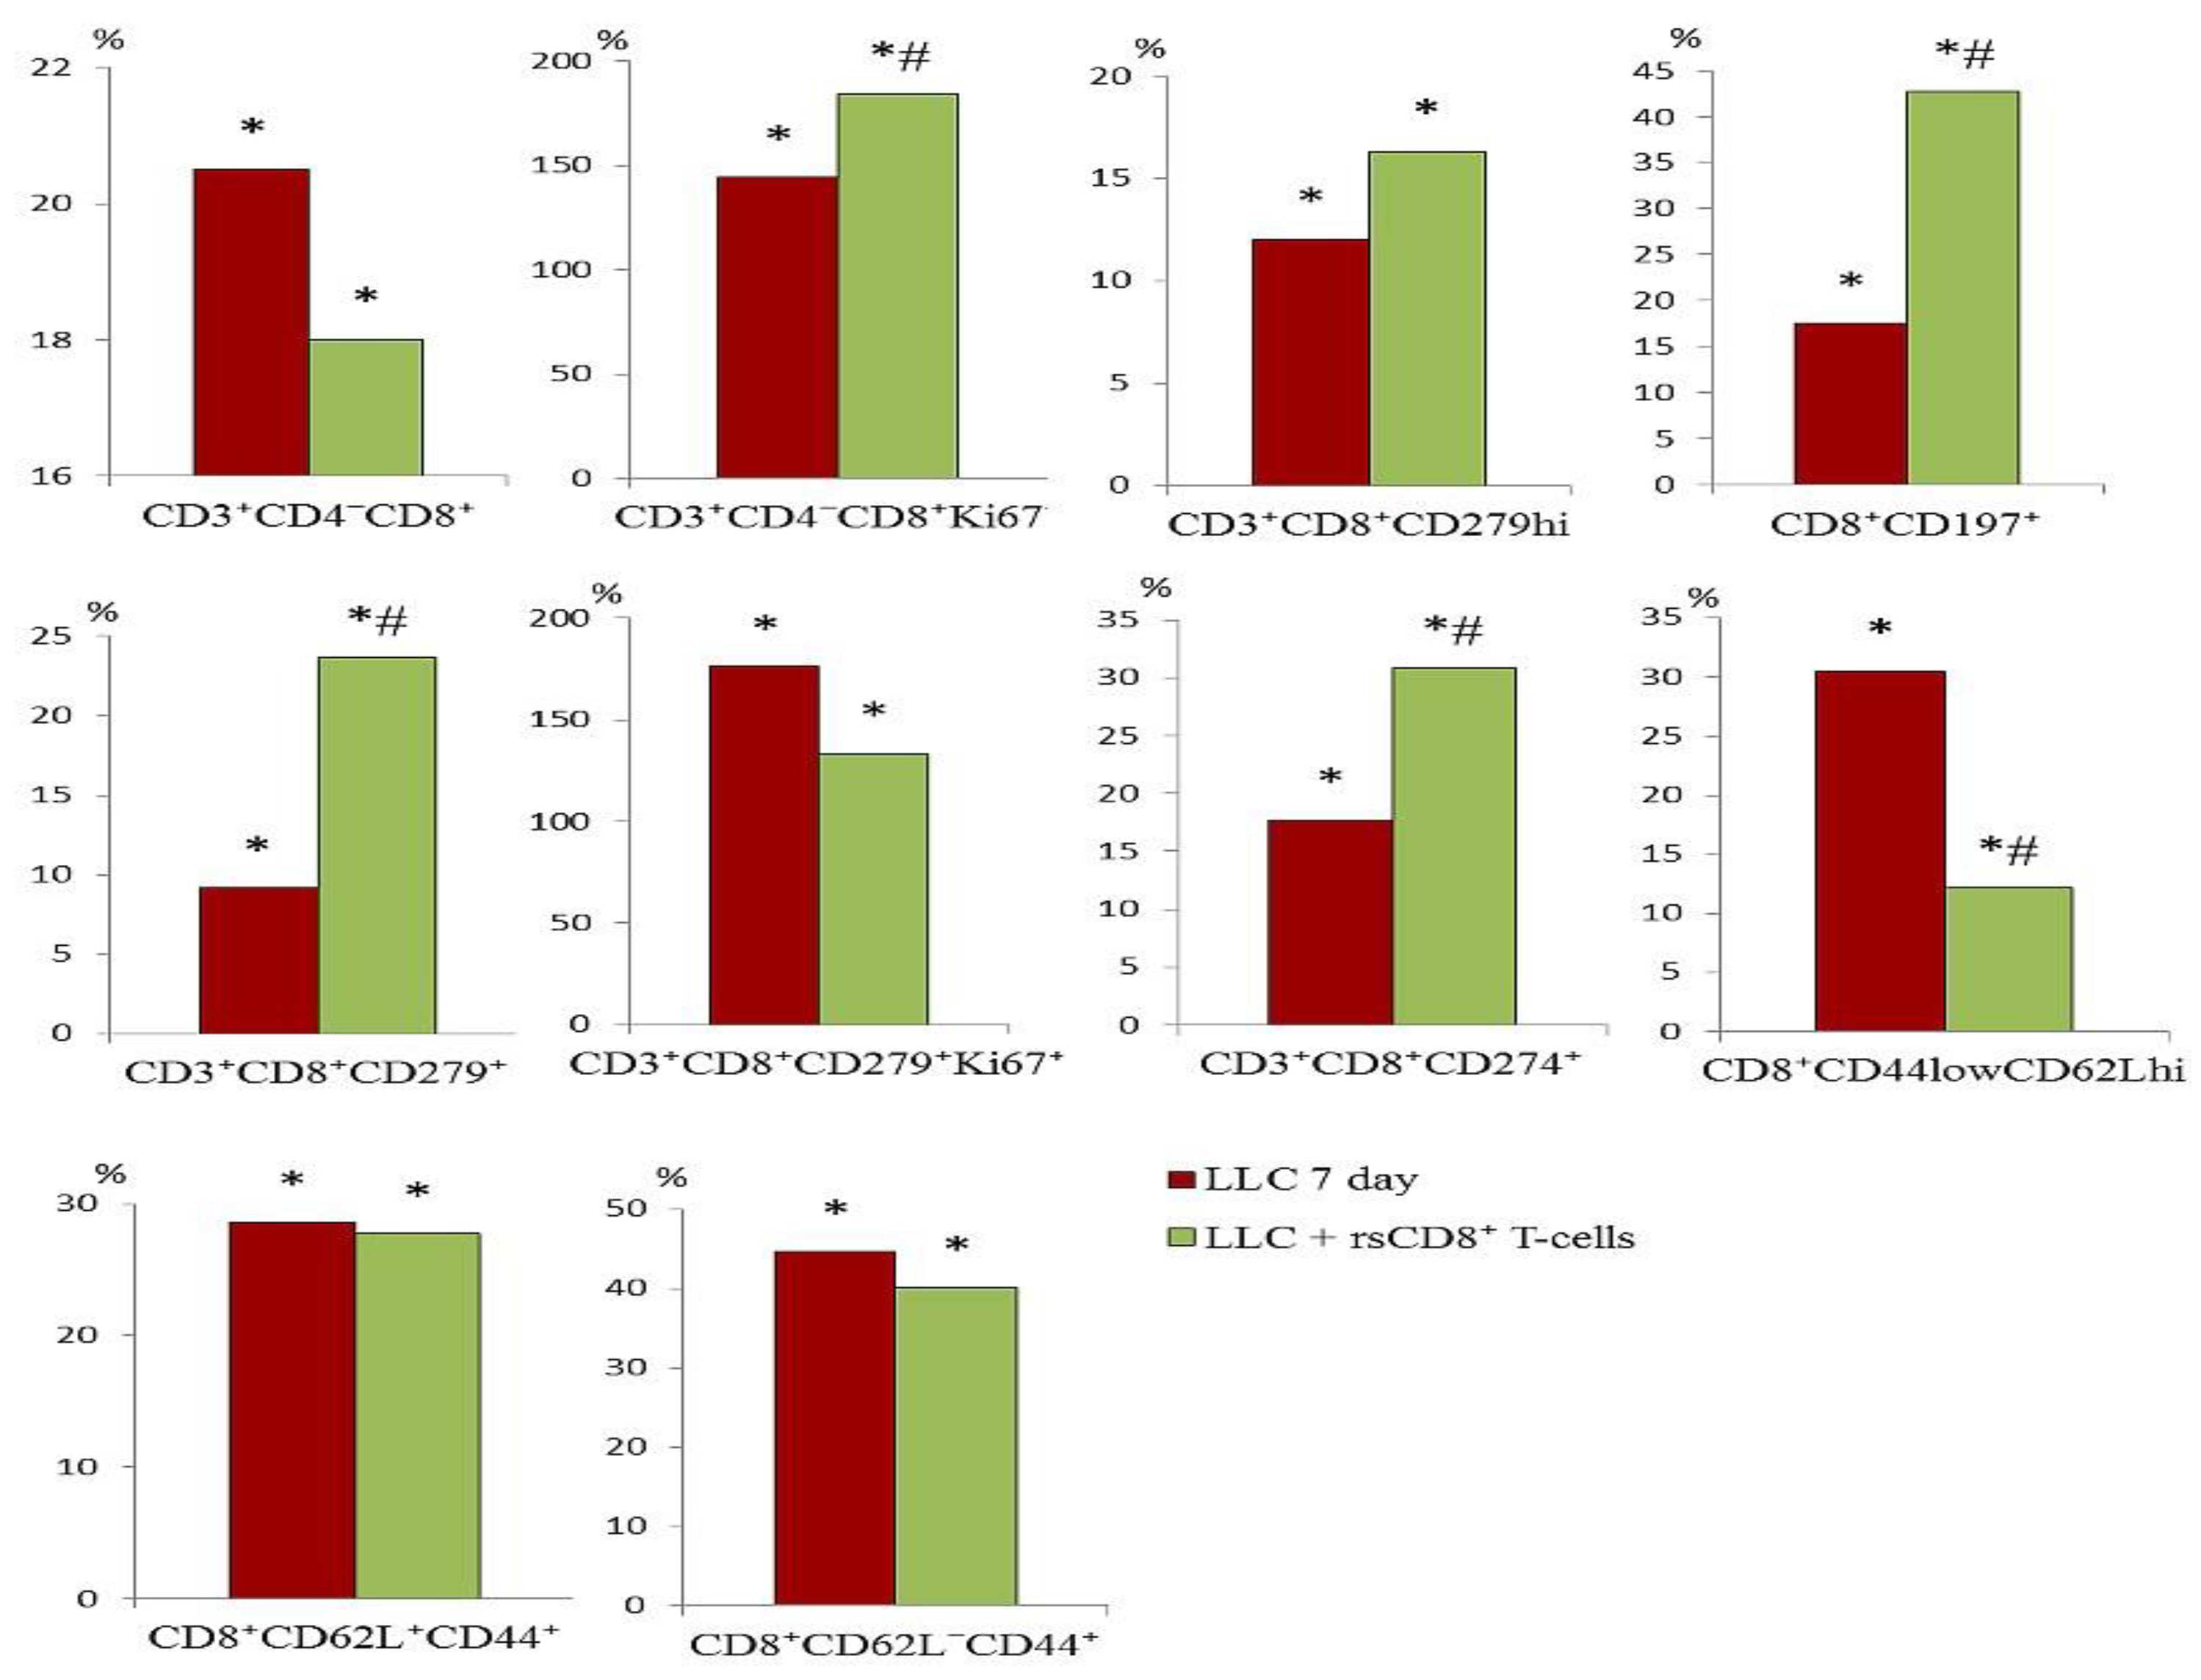
Figure 9.
The effect of rsCD8+ T-cell-therapy on CD8+ T-cell count in lung of mice with LLC on d7 after LLC cell implantation (% of total mononuclear cells number). *—for comparison with the intact group by Mann–Whitney test (p<0.05); #—for comparison with the mice with LLC by Mann–Whitney test (p<0.05).
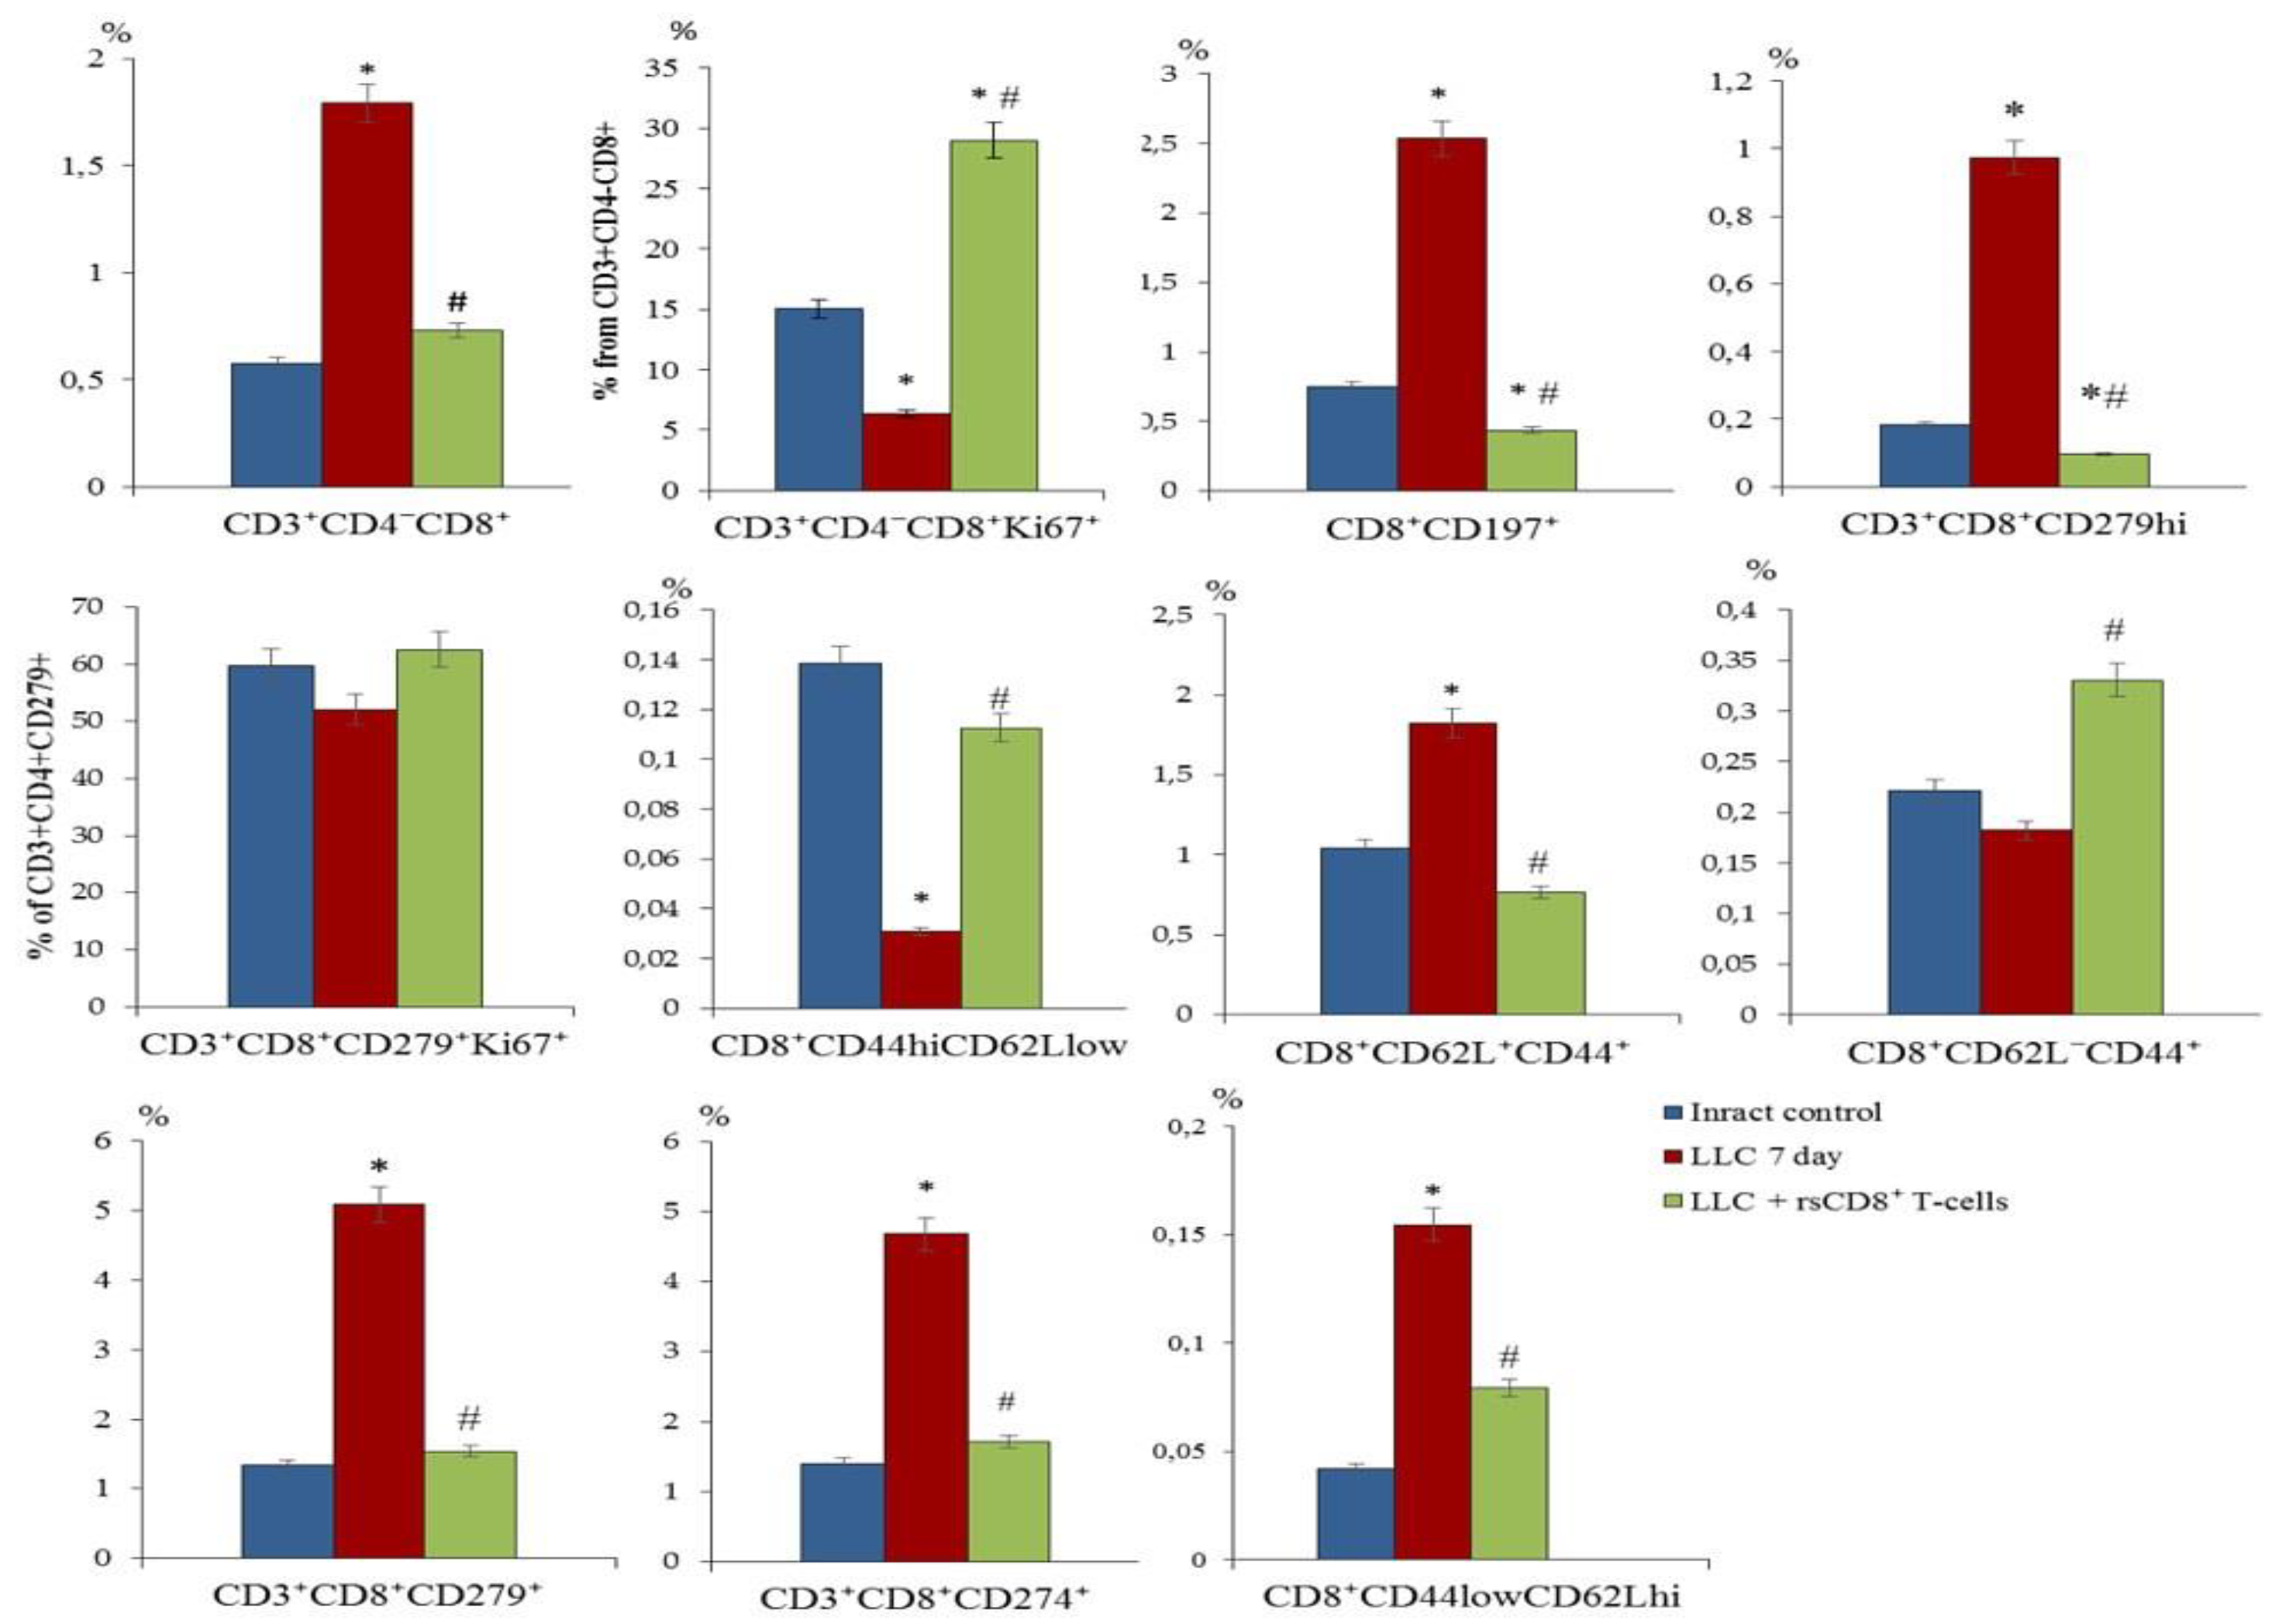
Figure 10.
The effect of rsCD8+T-cell therapy on CCR7+ T-cell count in blood mice on d7 after LLC cell implantation (% from intact control). 100 % - level of cells from mice of intact control. Phenotype of CD8+ T-cells: CD8+CCR7+, CD8+CD62L+CD95+CCR7+, CD8+CD62L+CCR7+CD95hi, СD8+CD62L+CD95+CCR7hi, CD8+CD62L+CD95+CCR7-, CD8+CD62L+CD44-, and CD8+CD62L-CCR7-CD95hi. *—for comparison with the intact group by Mann–Whitney test (p<0.05); #—for comparison with the mice with LLC by Mann–Whitney test (p<0.05).
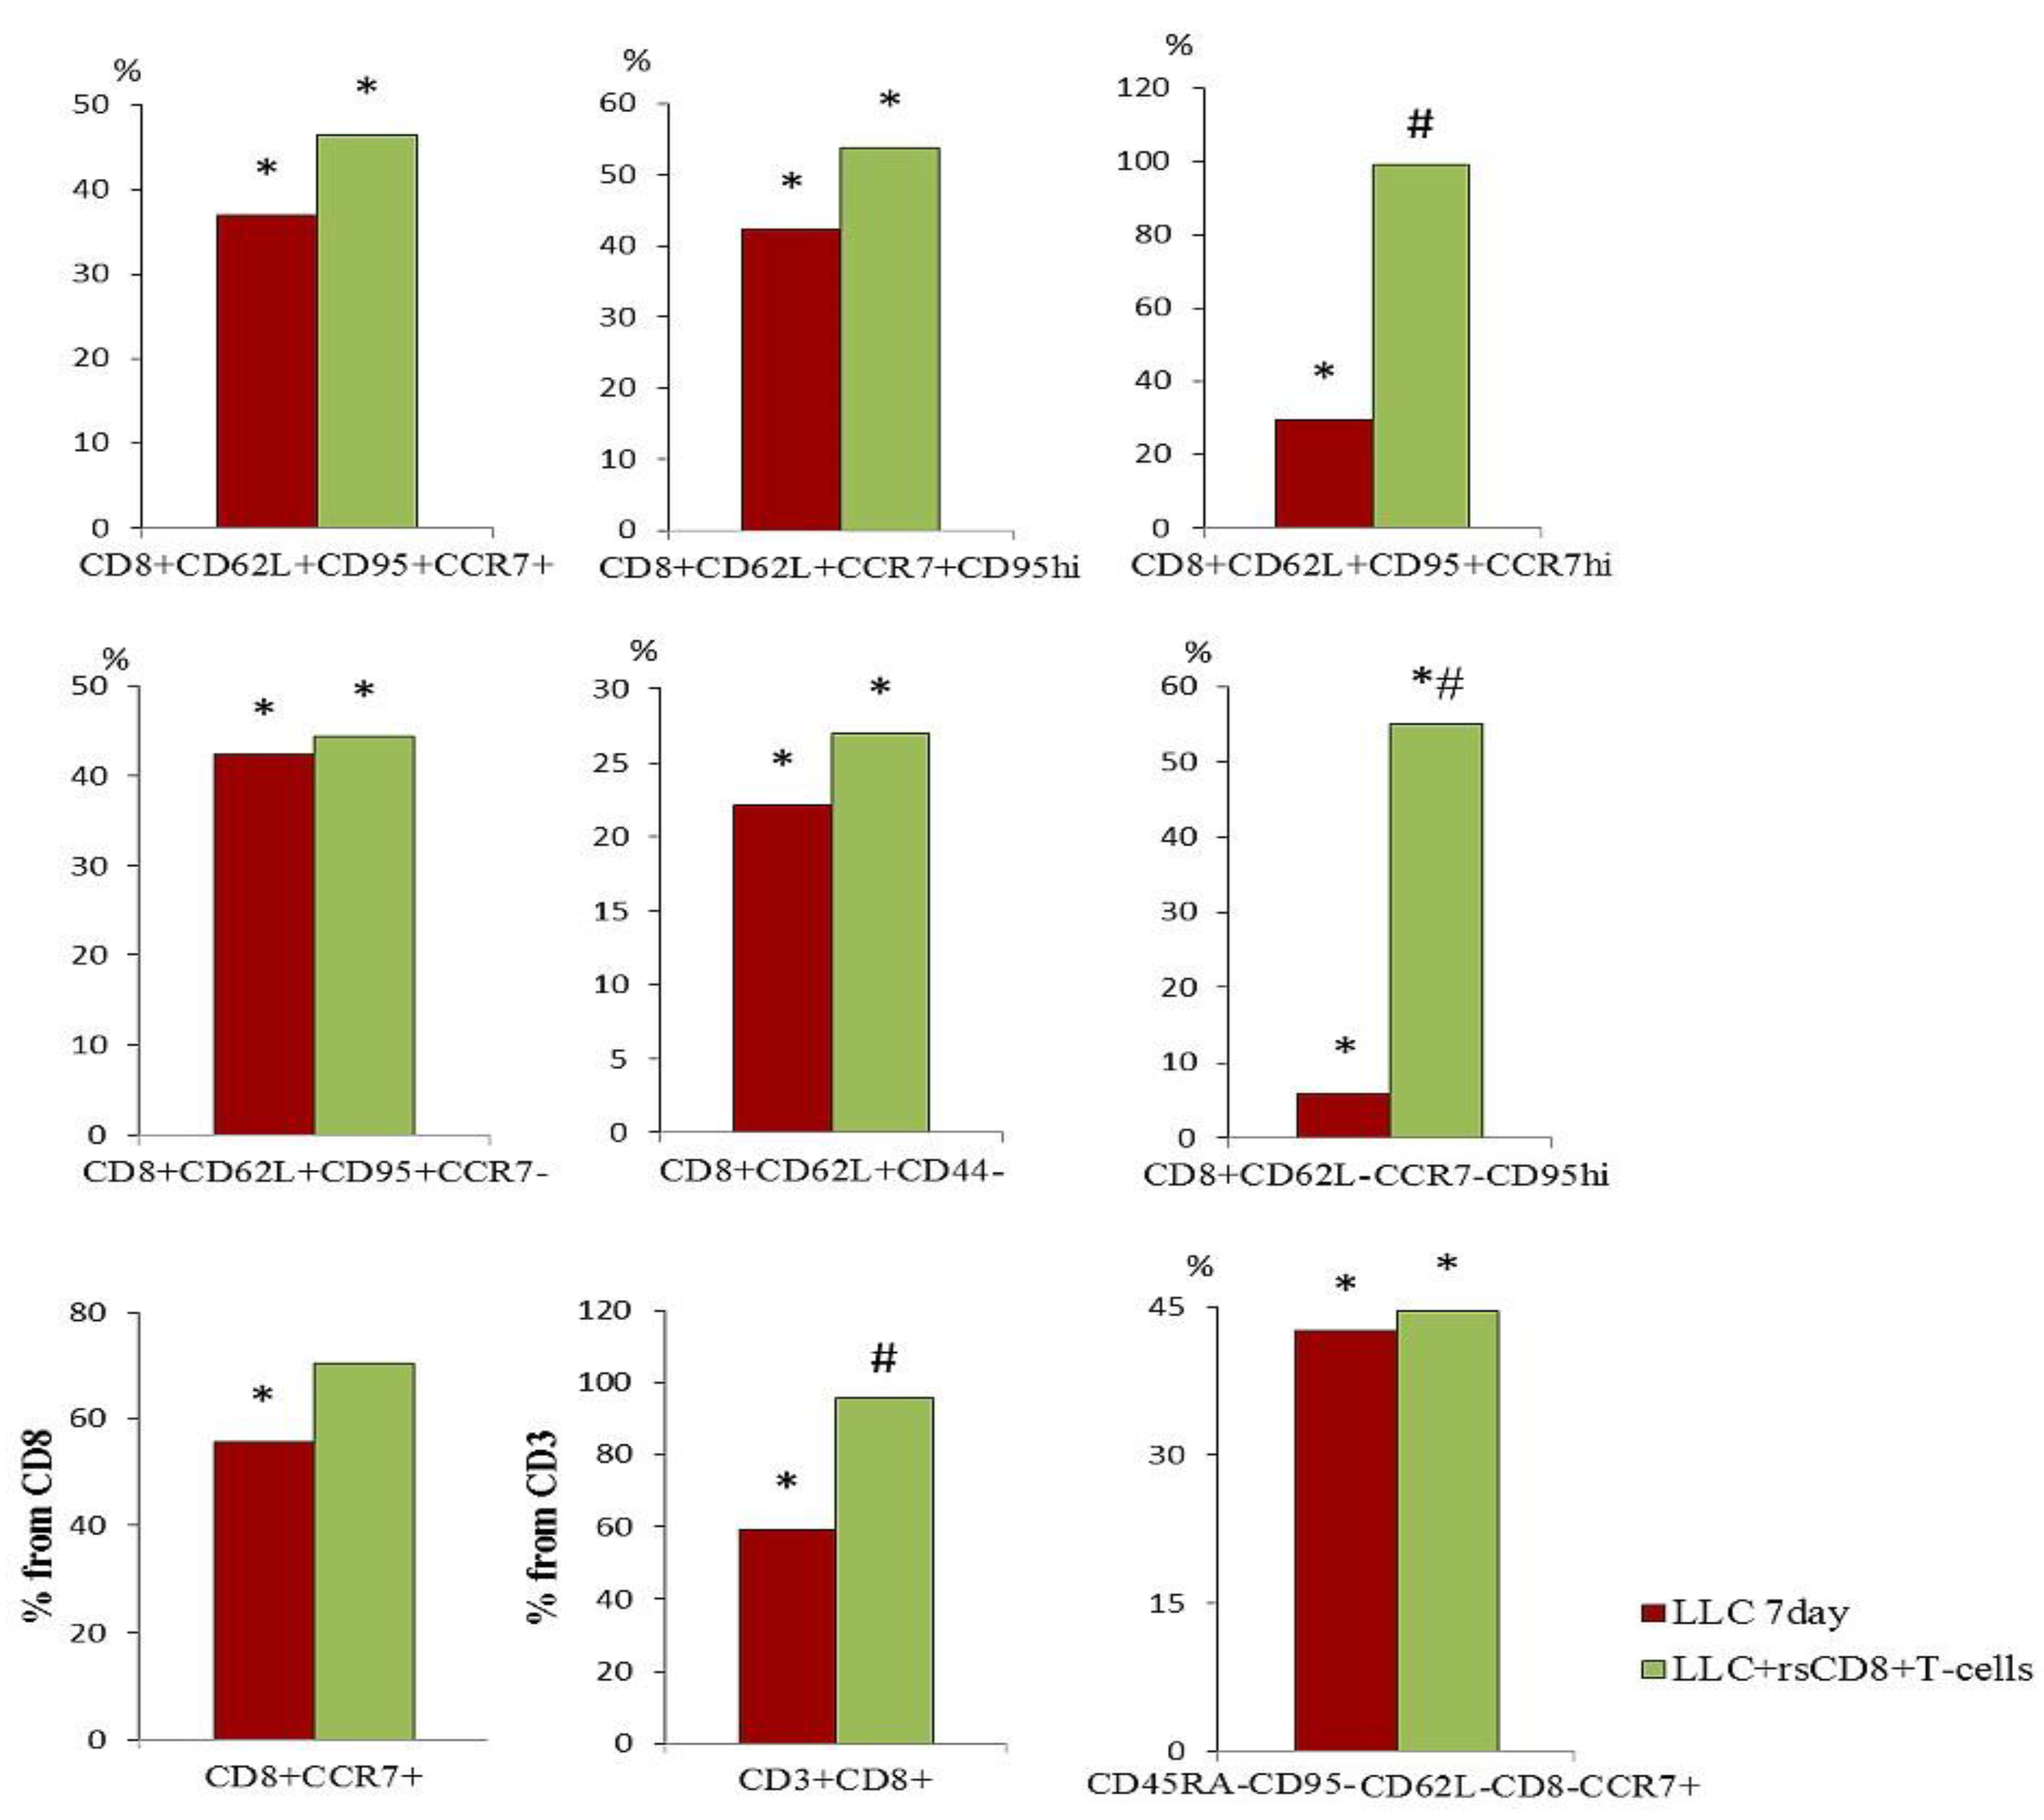
Figure 11.
The effect of rsCD8+ T-cell-therapy on CD4+ T-cell count in blood of mice on d7 after LLC cell implantation (% from intact control). 100 % - level of cells from mice of intact control. Phenotype of CD4+ T-cells: CD3-CD4+, CD3+CD4+CD8+, CD3+CD4+PD-L1(CD274)+, CD3+CD4+PD-1(CD279)+, CD3+CD4+CD8-, CD3+CD4+PD-1+Ki67+ and CD3+CD4+CD8-Ki67+. *—for comparison with the intact group by Mann–Whitney test (p < 0.05); #—for comparison with the mice with LLC by Mann–Whitney test (p < 0.05).
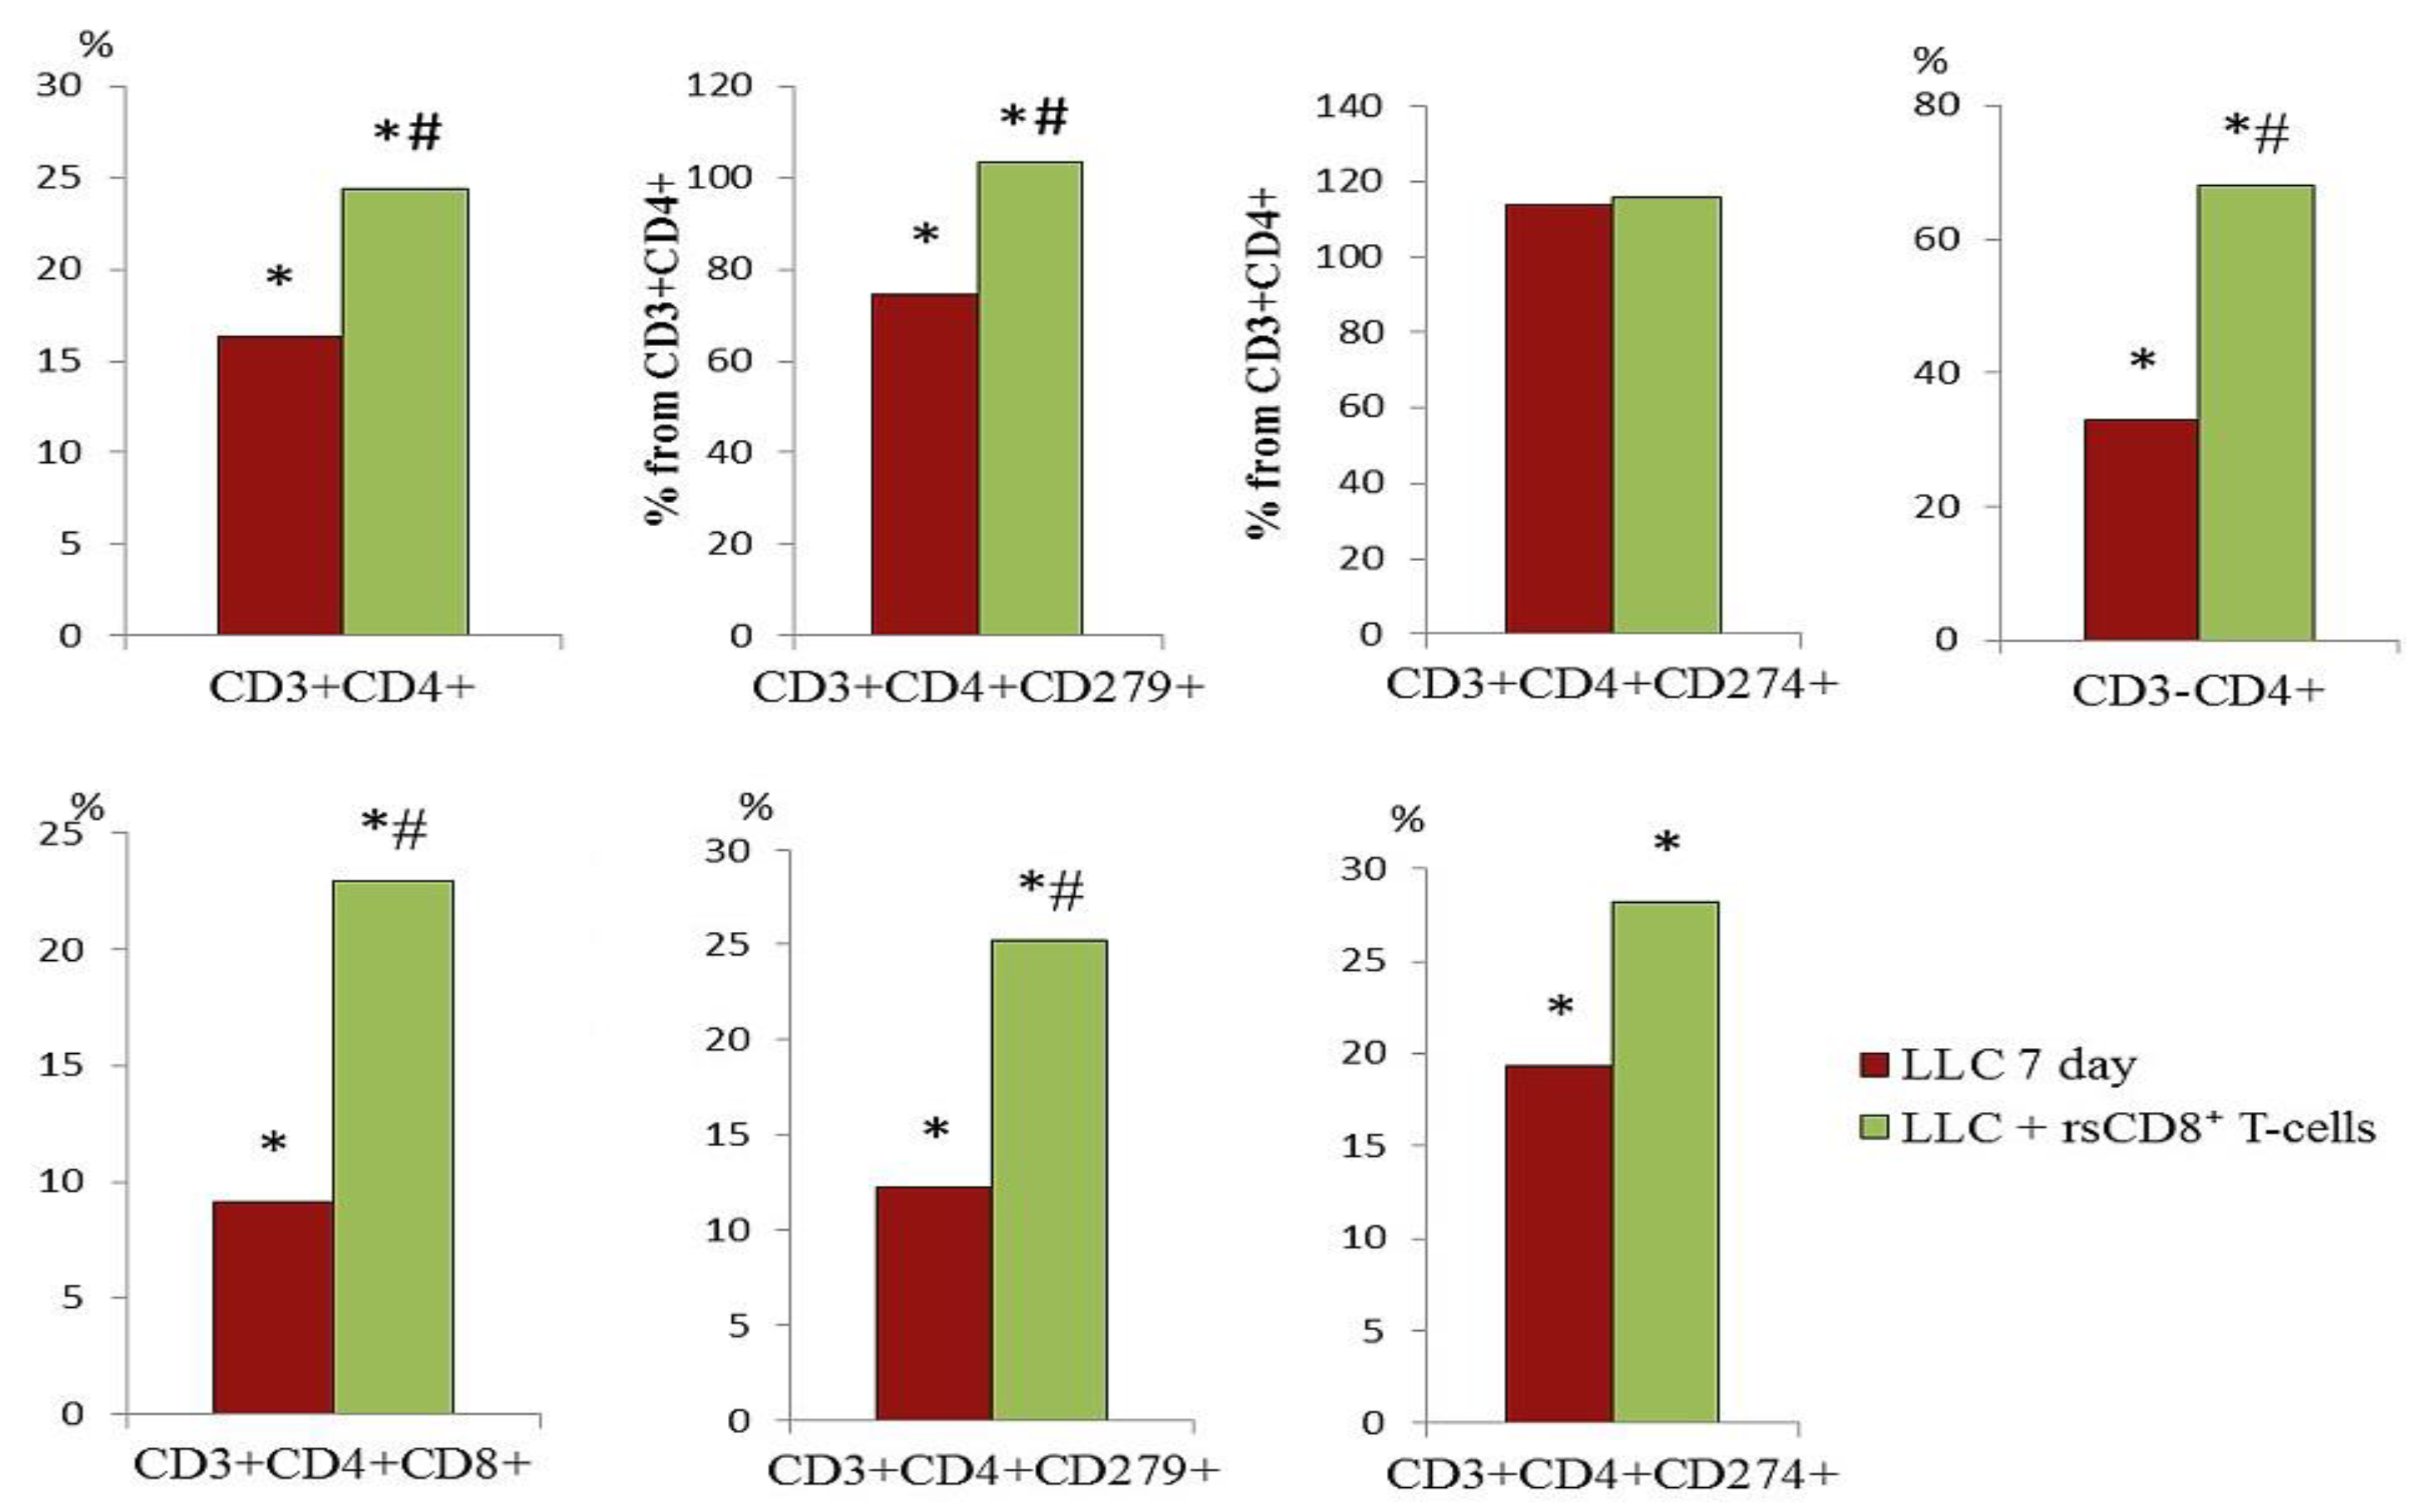
Figure 12.
The effect of rsCD8+ T-cell-therapy on CD4+ T-cell count in lung of mice on d7 after LLC cell implantation (% of total mononuclear cell number). Phenotype of CD4+ T-cells: CD3-CD4+, CD3+CD4+CD8+, CD3+CD4+PD-L1(CD274)+, CD3+CD4+PD-1(CD279)+, CD3+CD4+CD8-, CD3+CD4+PD-1+Ki67+ and CD3+CD4+CD8-Ki67+. *—for comparison with the intact group by Mann–Whitney test (p < 0.05); #—for comparison with the mice with LLC by Mann–Whitney test (p < 0.05).
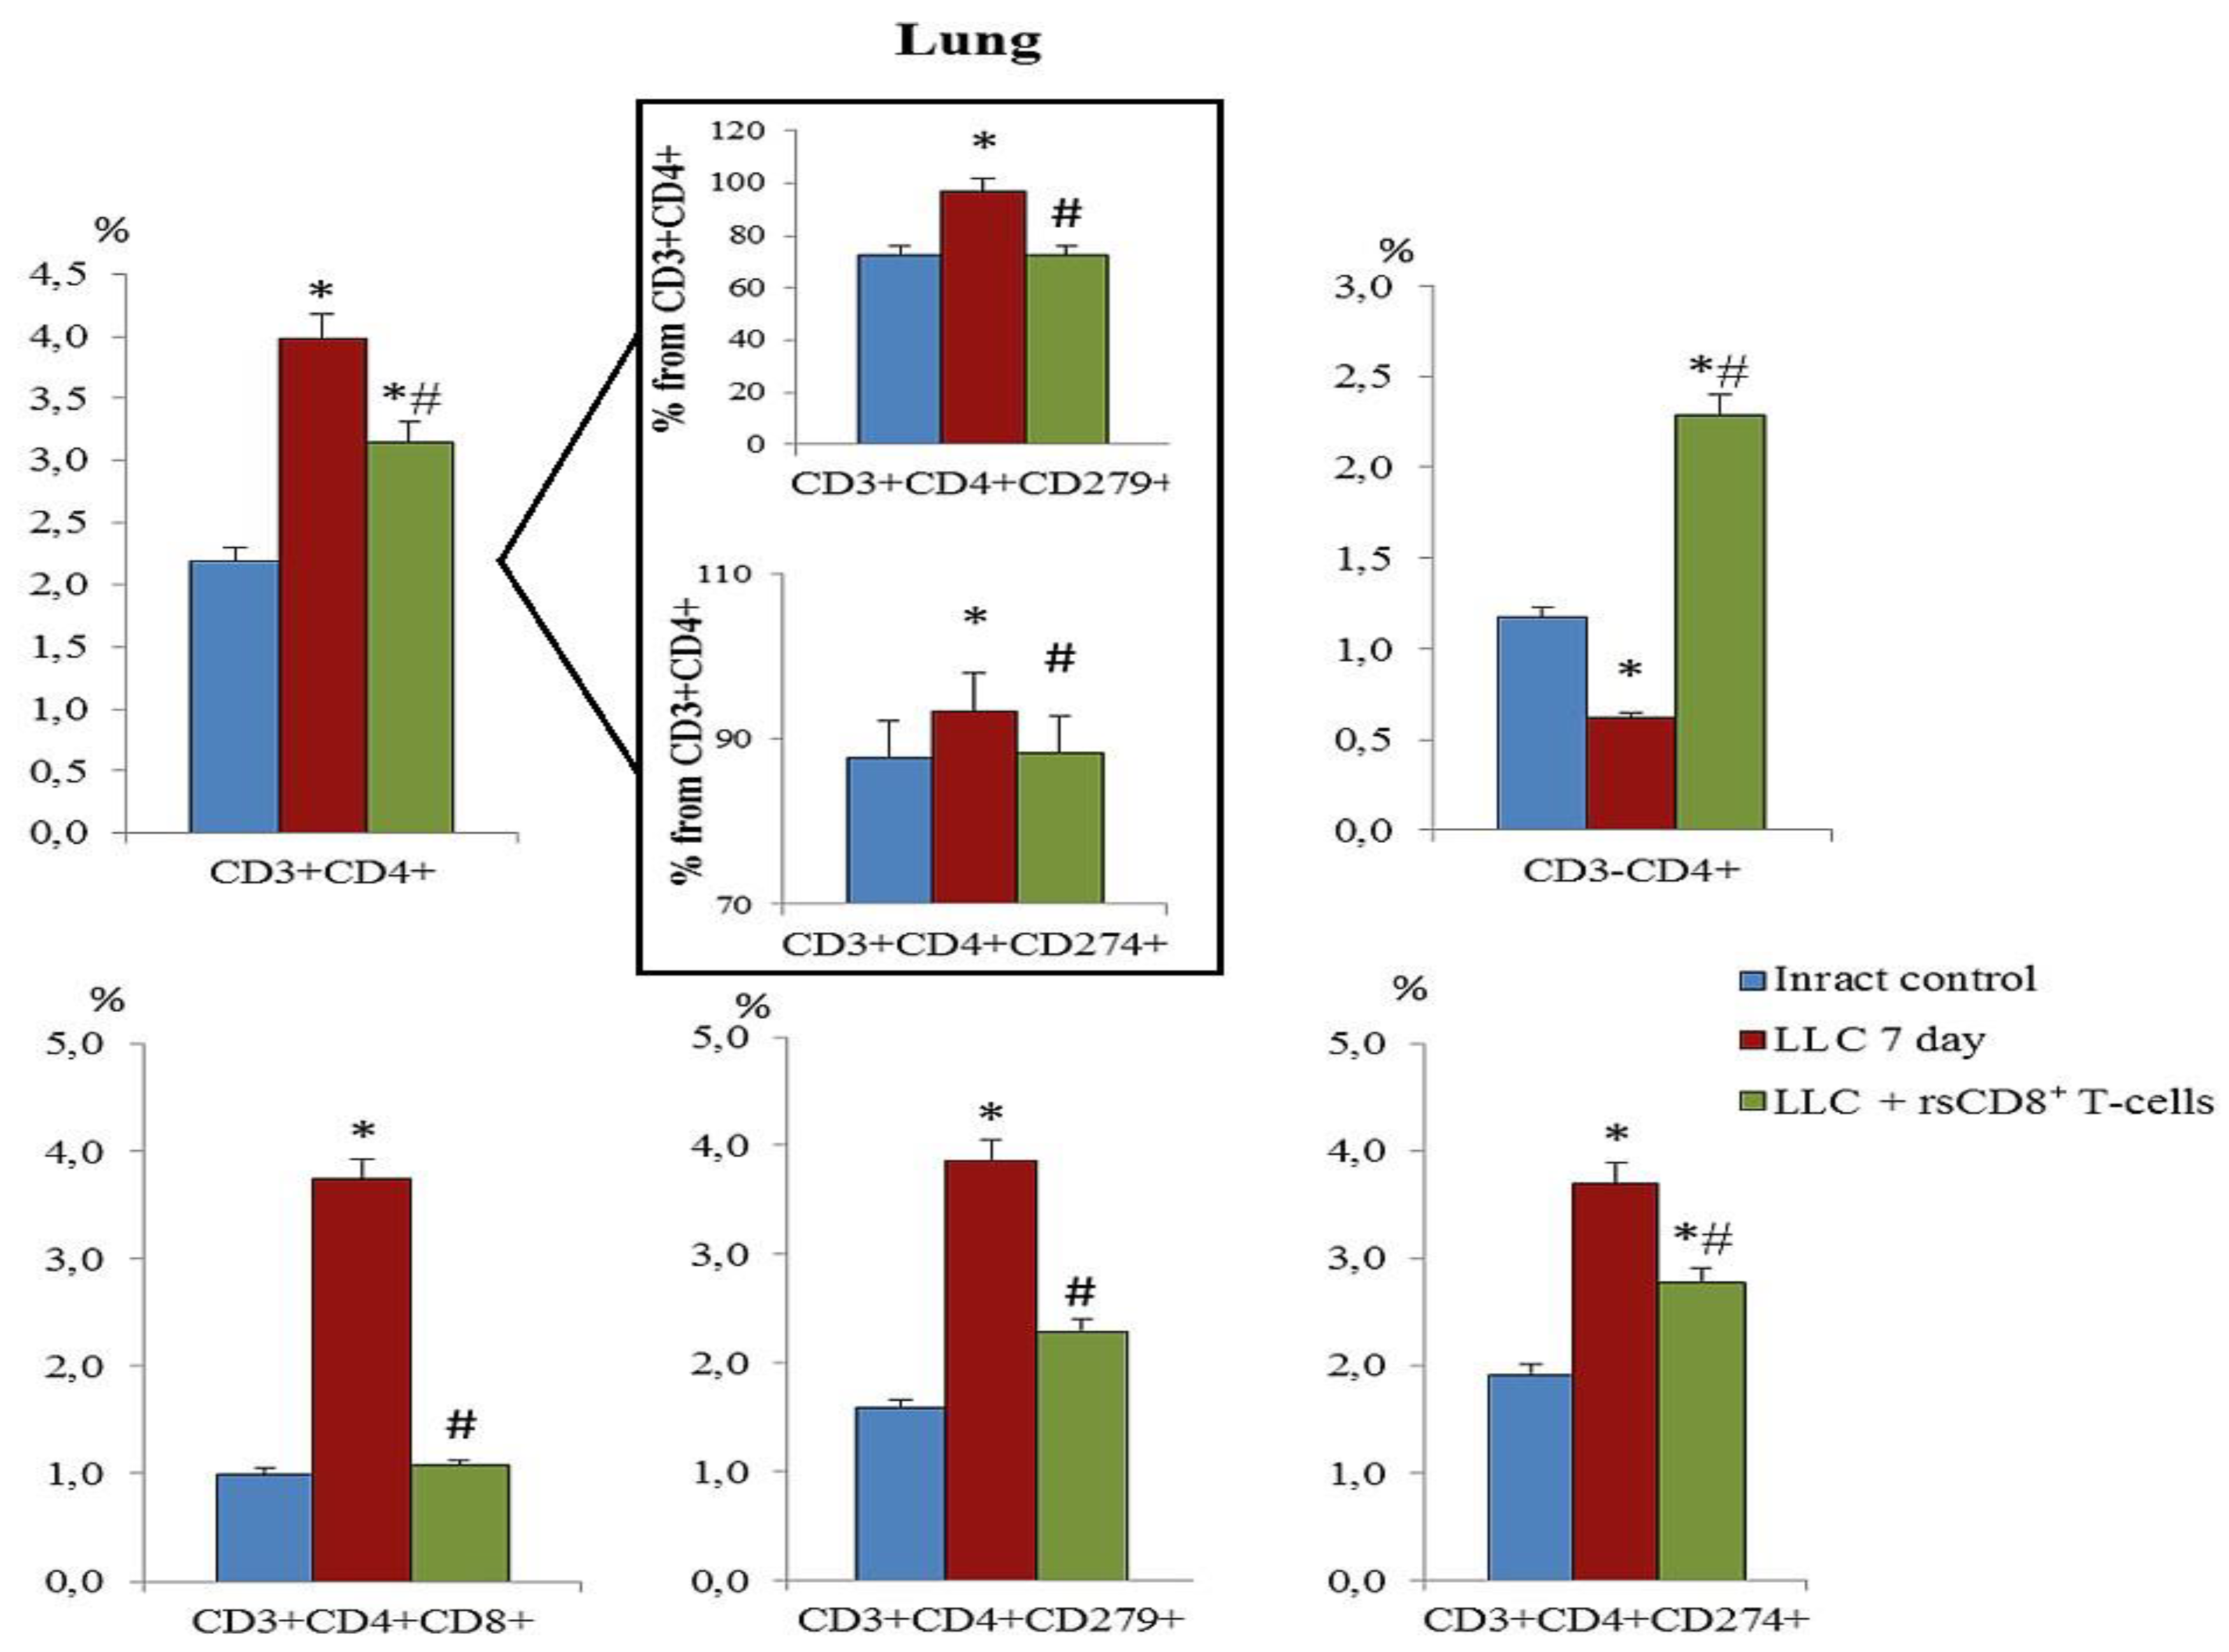
Figure 13.
The count of cancer cells and cancer stem cells in the blood of mice on d7 after LLC cell implantation (% from intact control). 100 % - level of cells from mice of intact control. The phenotype of cancer cells and cancer stem cells: EGF+Sox2+, CD44+Sox2+, CD44hiCD90+, CD44hiCD90+Sox2+, CD90+Sox2+, CD279+Ki67+, CD274+Ki67+, and CD45RA-CD62L-CD95-CD8-CCR7+. *—for comparison with the intact group by Mann–Whitney test (p < 0.05); #—for comparison with the mice with LLC by Mann–Whitney test (p < 0.05).

Figure 14.
The count of cancer cells and cancer stem cells in the lung of mice on d7 after LLC cell implantation (% of total mononuclear cells number). The phenotype of cancer cells and cancer stem cells: EGF+Sox2+, CD44+Sox2+, CD44hiCD90+, CD44hiCD90+Sox2+, CD90+Sox2+, CD279+Ki67+, CD274+Ki67+, and CD45RA-CD62L-CD95-CD8-CCR7+. *—for comparison with the intact group by Mann–Whitney test (p < 0.05); #—for comparison with the mice with LLC by Mann–Whitney test (p < 0.05).
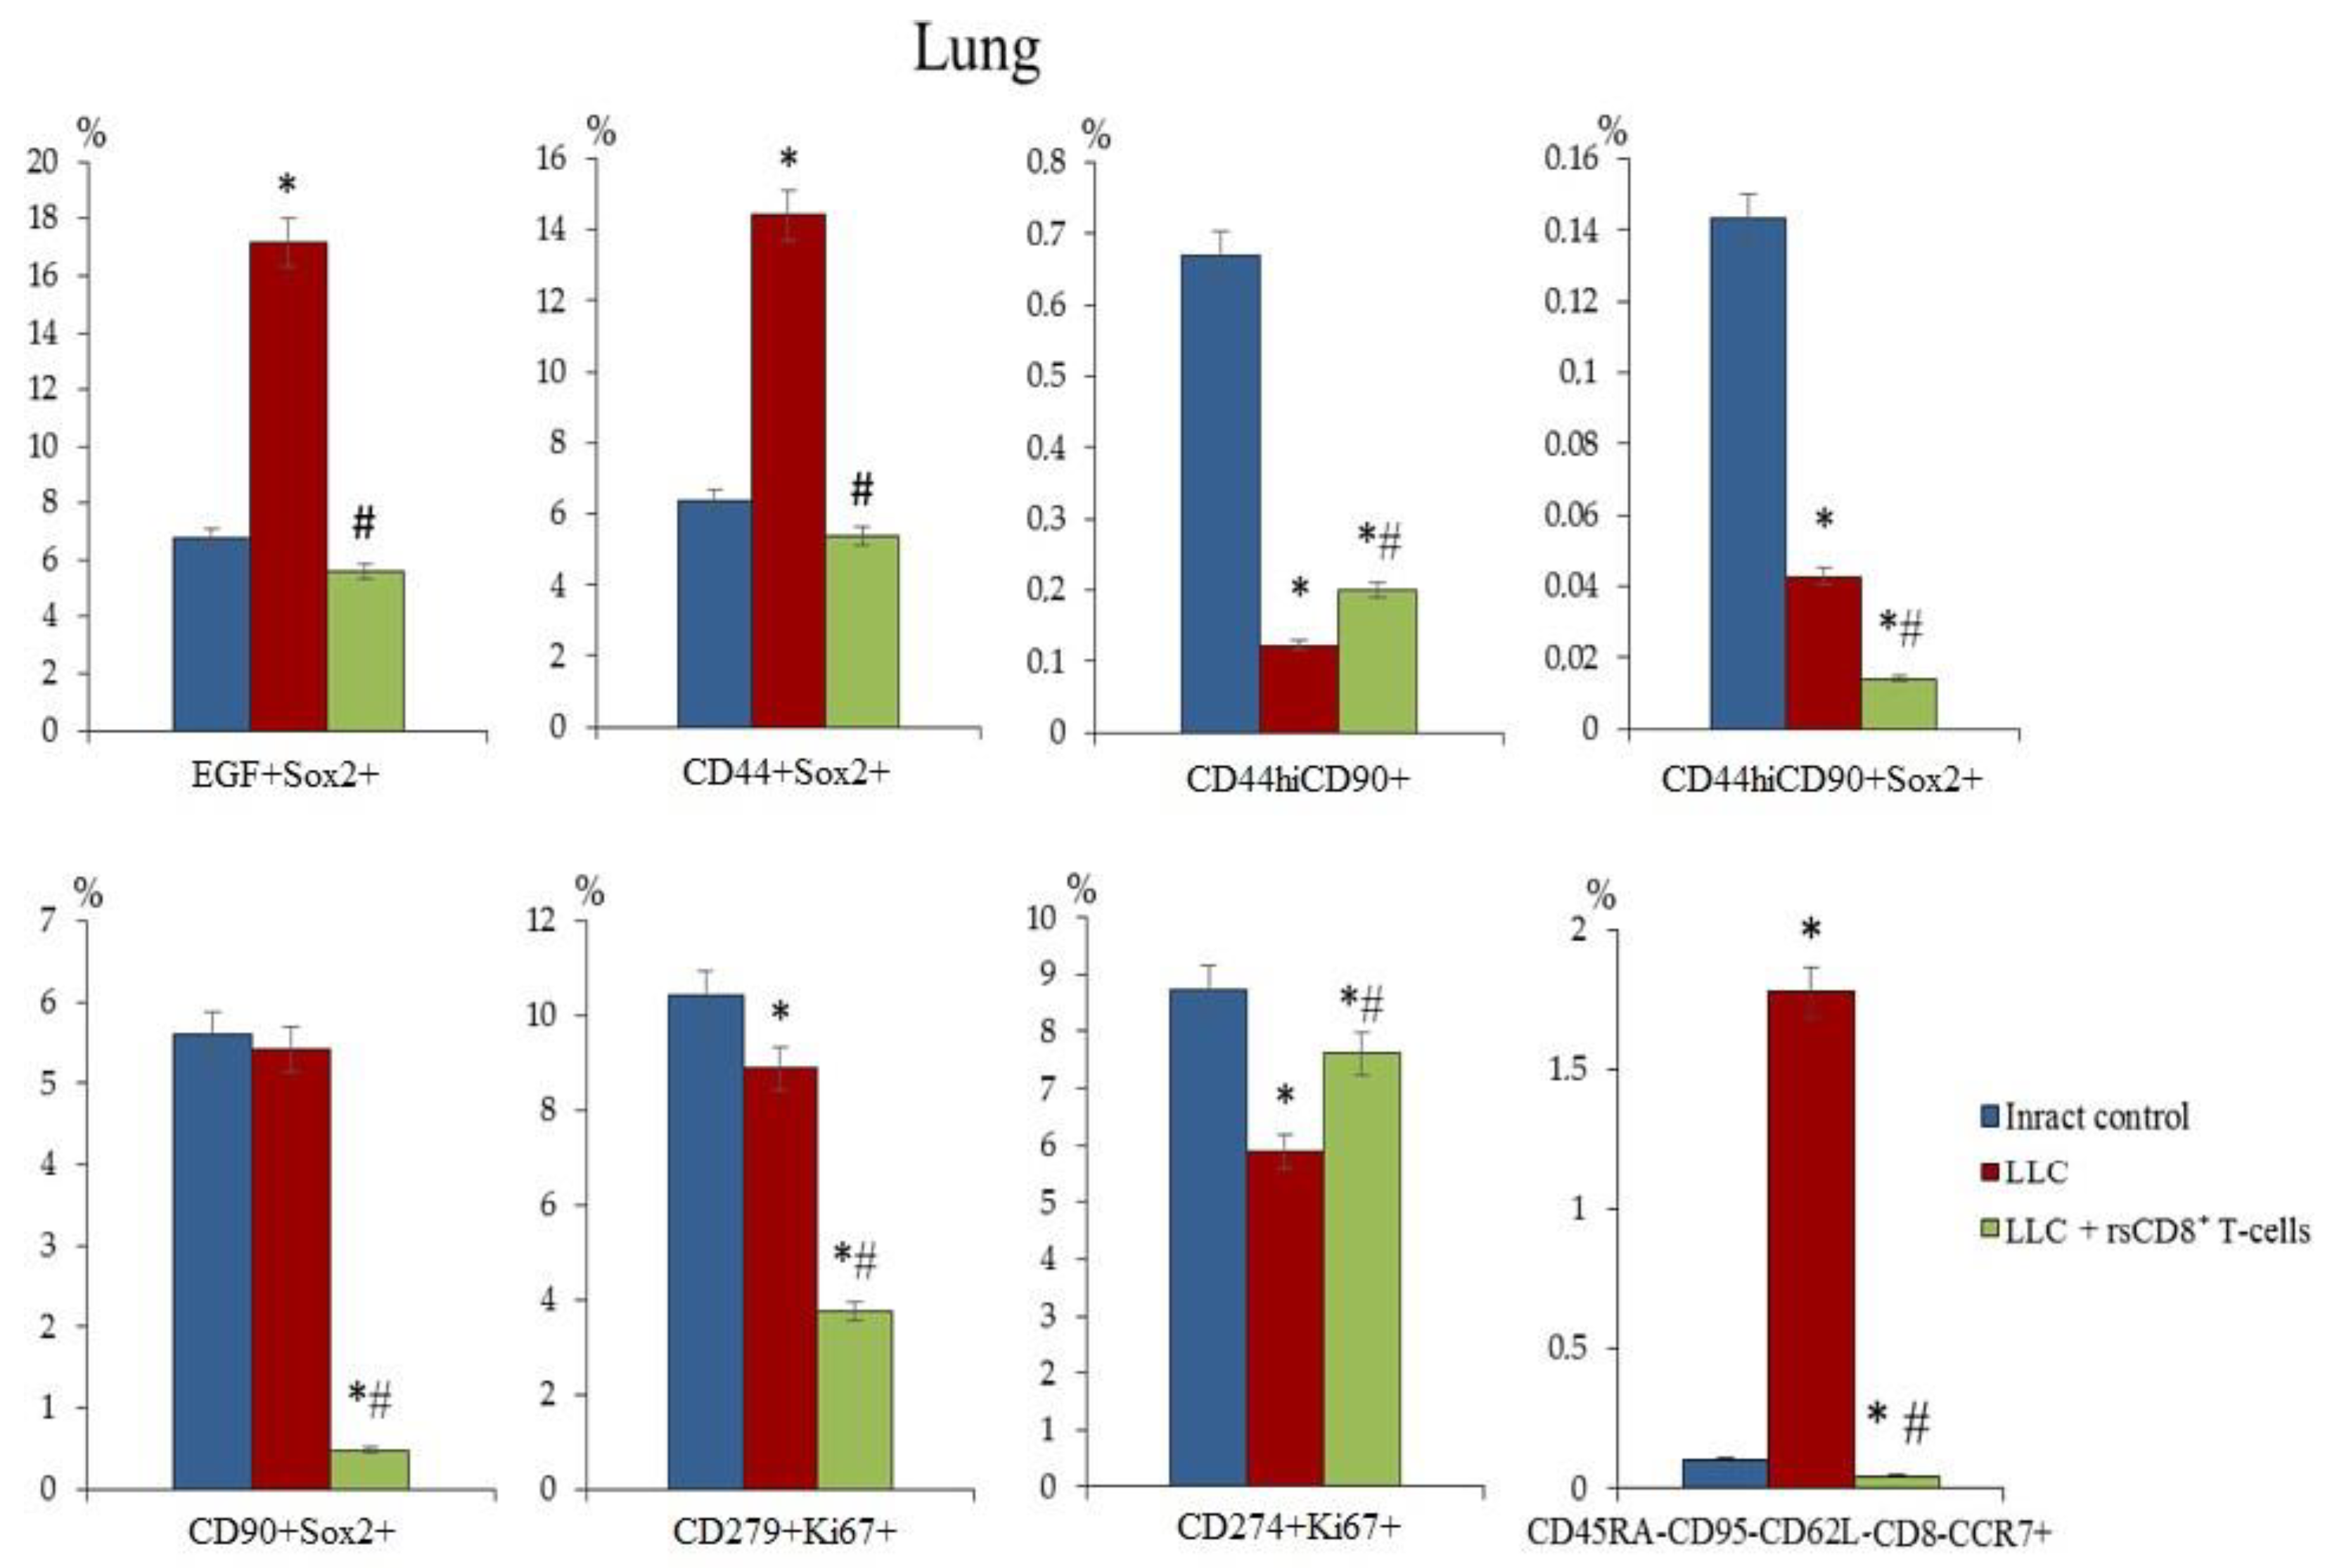
Figure 15.
Representative hematoxylin-eosin staining of tissue sections from (a) mice of intact control; (b) mice with LLC; (c) mice with LLC treated with rsCD8+T-cells on d7. ×400. Scale bar 10 μm.
Figure 15.
Representative hematoxylin-eosin staining of tissue sections from (a) mice of intact control; (b) mice with LLC; (c) mice with LLC treated with rsCD8+T-cells on d7. ×400. Scale bar 10 μm.
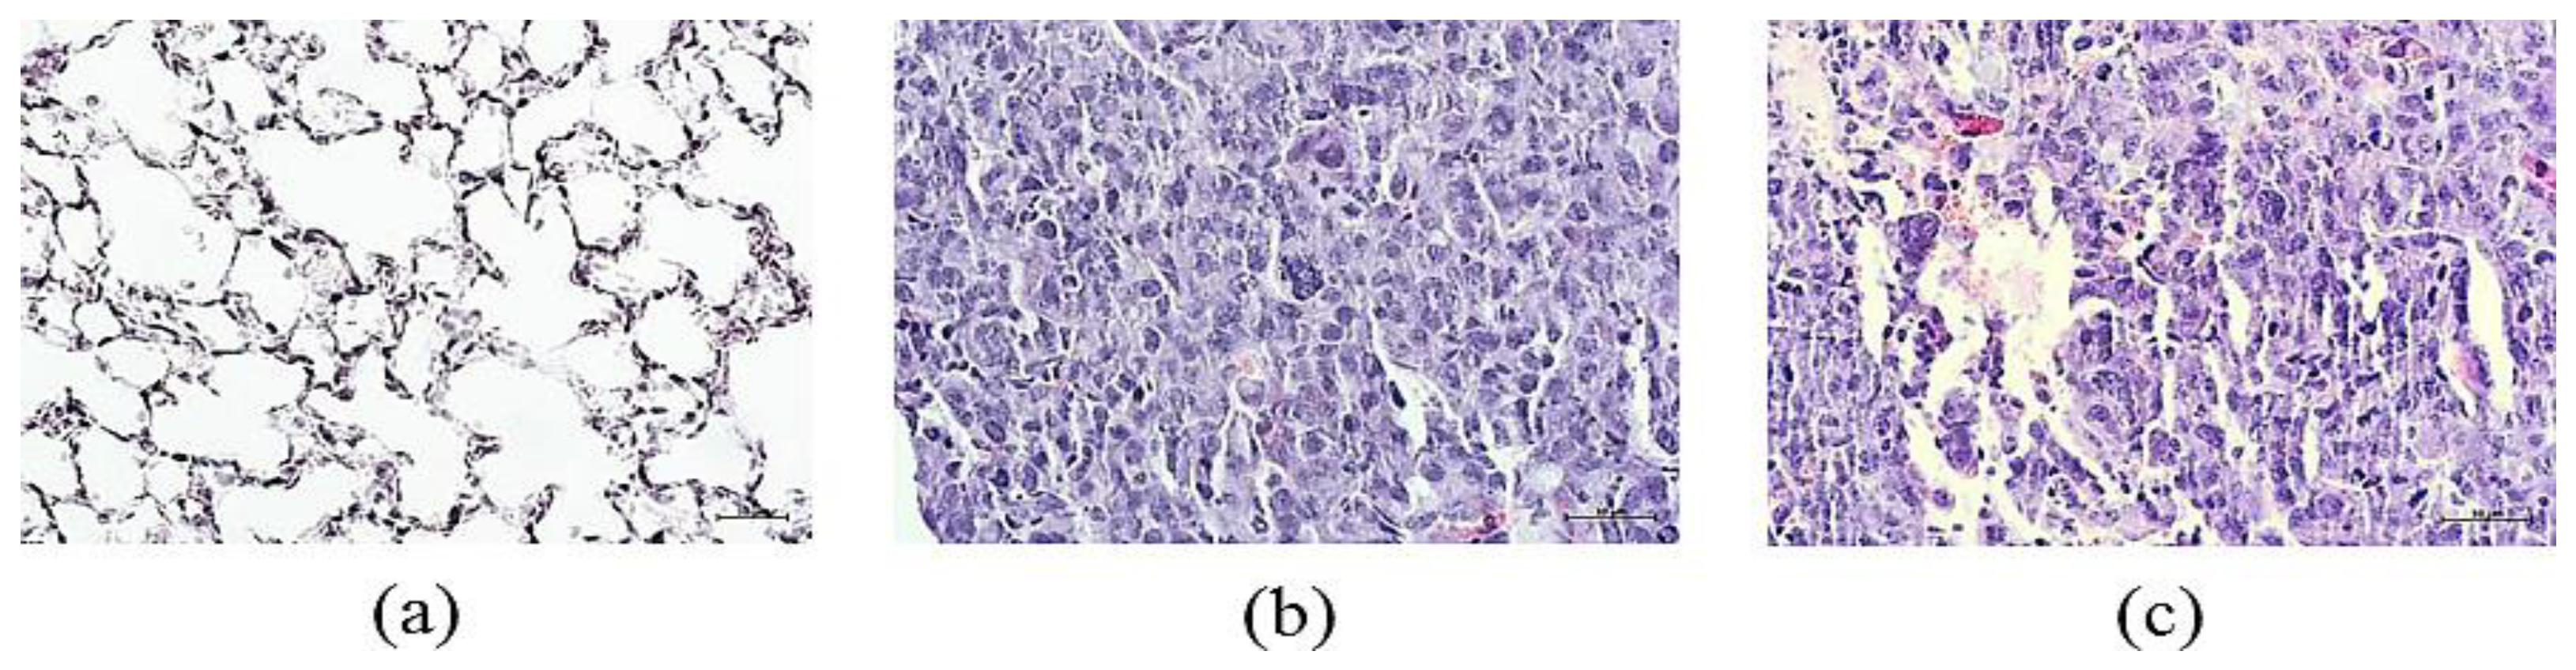

Table 1.
The effect of cell therapy with rsCD8+ T-cells on tumor growth in mice with LLC on d7 (M ± m).
Table 1.
The effect of cell therapy with rsCD8+ T-cells on tumor growth in mice with LLC on d7 (M ± m).
| Values/Parameters | Intact Control | LLC | rsCD8+ T-cells |
|---|---|---|---|
| Tumor volume, mm3 | 0 | 4.72 ± 2.85 # | 2.09±0.09 #,* |
| The average number of metastases | 0 | 2.60 ± 0.35 #,1 | 0.17±0.17#,* |
1—Differences are significant in comparison; #—with intact control by Mann–Whitney test (p < 0.05); *—with pathological control by Mann–Whitney test (p < 0.05).
Disclaimer/Publisher’s Note: The statements, opinions and data contained in all publications are solely those of the individual author(s) and contributor(s) and not of MDPI and/or the editor(s). MDPI and/or the editor(s) disclaim responsibility for any injury to people or property resulting from any ideas, methods, instructions or products referred to in the content. |
© 2024 by the authors. Licensee MDPI, Basel, Switzerland. This article is an open access article distributed under the terms and conditions of the Creative Commons Attribution (CC BY) license (http://creativecommons.org/licenses/by/4.0/).
Copyright: This open access article is published under a Creative Commons CC BY 4.0 license, which permit the free download, distribution, and reuse, provided that the author and preprint are cited in any reuse.


