Preprint
Article

Oil-Coated Ammonium Sulfate Improve Maize Nutrient Uptake and Prevent Nitrogen Leaching Rates in Sandy Soil

Altmetrics

Downloads

108

Views

38

Comments

0

A peer-reviewed article of this preprint also exists.

Submitted:

18 April 2024

Posted:

18 April 2024

You are already at the latest version

Alerts
Abstract
Ammonium sulfate has been utilized in agriculture; however, there is a dearth of research on its application in maize cultivation subsequent to the implementation of nitrification inhibitors or coating. This study aims to analyze the impacts of various combinations of ammonium sulfate fertilizers on soil nutrients, plant nutrient uptake, yield, and fertilizer utilization efficiency in maize cultivation to ascertain the optimal and stabilized disposal method for ammonium sulfate. A completely randomized design was employed with five treatments (AU, the control using urea; AS, treatment using ammonium sulfate; ASN, treatment using ammonium sulfate with a nitrification inhibitor; ASG, treatment using oil-coated ammonium sulfate; ASD, treatment using oil-humic acid-coated ammonium sulfate). Results showed that: (1) Compared with AU and AS, ASN, ASG and ASD decreased the leaching rates of TN, NH4+-N and NO3-N to the 10-20 cm soil layer, and more residual N was obtained in 0-10 cm soil layer. The first-order kinetic equation Nt=N0(1-e-kt) can better fit the process of nitrogen accumulation and release, and the N release rate constant is AU>CK>AS>ASH>ASN>ASD; (2) Compared with AU and AS treatments, the plant dry weight, grain dry weight, spike width, spike length, and yields of maize increased by 8.85-11.08%, 12.98-14.15%, 2.95-3.52%, 5.50-5.65%, and 43.21-51.10% under ASG treatment respectively. The impact of effective spike number on maize yield was found to be significant, as demonstrated by the path analysis conducted in this study. Furthermore, the accumulation levels of nitrogen, phosphorus, and potassium within above-ground plants significantly increased under the ASG treatment compared to the AU and AS treatments. The partial productivity of nitrogen, phosphorus, and potassium increased by 1.43-1.51-fold under ASG treatment, while grain nitrogen balance, grain phosphorus balance, and grain potassium balance increased by 1.41-1.58-fold, 1.51-1.95-fold, and 1.15-l.96-fold respectively. The oil-coated ammonium sulfate, therefore, exhibited the optimal slow-release effect of nutrients, thereby achieving superior performance in enhancing maize production and efficiency.
Keywords: 
Subject: Environmental and Earth Sciences  -   Soil Science

1. Introduction

The utilization of slow-/controlled-release nitrogen (N) can effectively regulate the dissolution and release rate of N, facilitating its migration through various regulatory mechanisms to meet the nutrient demands of crops throughout their entire growth cycle [1,2,3]. Slow-release N exhibits a significantly reduced nutrient release rate compared to quick-release fertilizers upon application in soil, resulting in stable yields, prolonged nutrient availability, high fertilizer utilization efficiency, and minimal environmental pollution [4,5]. The application of slow-/controlled-release N fertilizers is recommended for inhibiting N transformation, minimizing seedling stage losses and delaying peak occurrence time to fulfill low nitrogen requirements during this stage while meeting the rapidly increasing demand during flowering stages in maize cultivation, thereby promoting maize growth and ensuring optimal nutrient absorption [6,7,8]. Consequently, incorporating slow-/controlled-release N fertilizers into agricultural practices can effectively enhance fertilizer efficiency and crop yield.
Ammonium sulfate contains not only essential N nutrients for crops but also sulfur nutrients to promote crop development and metabolism [9,10]. After application in soil, ammonium sulfate will immediately dissociate into available NH4+ and SO42- that can be absorbed and used by crops, therefore, it has been widely applied in agriculture [11,12,13]. However, ammonium sulfate accounts for less than 1% of the total N fertilizer variety structure in China, which is far lower than the proportion of ammonium sulfate used in developed countries [14], but the industrial by-product ammonium sulfate has a huge production capacity in China. Therefore, the industrial by-product ammonium sulfate has a great application prospect in China, which can promote the transformation and upgrading of traditional fertilizers in the green agricultural development in China. Nevertheless, due to the quick-acting properties of ammonium sulfate, one-time basal application will lead to a large N supply in the crop seedling stage, whereas insufficient soil N supply during the later stages, probably causing N deficiency in the later stage of plants. Therefore, it is necessary to carry out slow- and controlled-release measures for ammonium sulfate to prolong the release of fertilizer nutrients, meet the needs of crop growth, and achieve high-efficiency utilization of ammonium sulfate.
In 2020, the maize planting area in China reached 41,264 thousand hectares, taking up 42.12% of total grain planting area; moreover, the maize yield was 260,665 million tons, occupying 38.93% of total grain yield [15]. The development of maize production has a critical role in China's agricultural economy. Maize is a kind of crop with a longer growth period. The screening of slow-/controlled-release nitrogen fertilizer suitable for maize growth can provide technical support and theoretical foundation for the development of high-quality and high-yield maize and new slow-/controlled-release fertilizers. Currently, the majority of studies investigating the effects of slow-/controlled-release nitrogen fertilizers primarily focus on urea [16,17,18]. However, there is a lack of reports regarding the utilization of ammonium sulfate as the primary nitrogen source, and little is known about changes in soil nutrients, crop nutrients, fertilizer utilization rate, and yield following the application of ammonium sulfate combined with nitrification inhibitors and coated treatments. Therefore, this study aims to investigate the impact of ammonium sulfate on soil and maize under three different slow-/controlled-release measures. Additionally, correlation and path analyses will be conducted to elucidate the roles played by each factor in maize production. These findings will contribute to establishing a scientific foundation for developing novel slow-/controlled-release ammonium sulfate fertilizers.

2. Materials and Methods

2.1. Simulation Experiment Design

The experiment was carried out with a PVC pipe (25 cm×5.70 cm) with gauze covered in the bottom, the air-dried soil over 2mm screen packed into 10cm according to the bulk weight of 1.30 g/cm3 to compact the lower soil (Figure 1). The tested fertilizer (Table 1) is mixed with soil and packed into 10 cm soil layer with an equal N of 0.30 g/kg. The topside covered with 1.00 cm quartz sand, and a total of 663.46g of soil is loaded. Minimized the edge effect of leaching by compacting the soil at the edge of the soil column. The PVC pipe was closed with a thin film with punctured holes after each soil column saturated with water, and cultured at 25℃. Then added deionized water 150 mL to leach after 24 h, and the leach solution was collected. The next leach was dissolved after 4 days, repeated 10 times. The volume of each leaching solution was measured, and determined the concentration of total nitrogen (TN), ammonium nitrogen (NH4+-N) and nitrate nitrogen (NO3-N) in each leaching solution.
The content of total nitrogen in the leaching solution was determined by potassium persulfate oxidation and ultraviolet spectrophotometry, and the content of ammonium nitrogen and nitrate nitrogen was determined by flow analyzer. The content of total nitrogen in soil was determined by Kjeldahl method, and ammonium nitrogen and nitrate nitrogen were determined by continuous flow analyzer after leaching by potassium chloride.
Nitrogen leaching (g) = nitrogen concentration in each leaching solution × volume of leaching solution
Nitrogen leaching rate per time (%) = nitrogen leaching amount per time/nitrogen application amount ×100%
Cumulative nitrogen leaching rate (%) = sum of each nitrogen leaching rate
After the test finished, the soil was mixed and collected from different soil layers to determine the total nitrogen, ammonium nitrogen, and nitrate nitrogen concentration.

2.2. Field Experiment

2.2.1. Experiment Design

Field experiment was conducted at the Experimental Demonstration Base of Wheat Research Institute, Hongbao Village, Wucun Town, Linfen City (111°33 '07 "E, 36°13' 02"N) in Shanxi Province from May 25, 2021 to September 13, 2021. The previous crop was maize with one ripe a year. The site is rain-fed and belongs to the temperate monsoon climate with the annual average temperature 12.2℃ and annual precipitation 486.5 mm. The soil type was calcareous cinnamon, and basic soil properties were organic matter 8.44 g/kg, pH 8.57, total nitrogen 1.39 g/kg, alkali- hydrolyzed nitrogen 69.02 mg/kg, available potassium 64.57 mg/kg and available phosphorus 4.66 mg/kg.
A completely random design with five fertilizer treatments (the same as the simulated experimental) was conducted in this experiment. The area of each plot was 56.25 m2 (length 22.5 m × width 2.5 m), and 0.5 m protection row were set up between plots. Besides, the fertilization amount of each plot was the same, including 160 N kg/hm2, 90 P2O5 kg/hm2 and 60 K2O kg/hm2, separately, all of which were applied to the soil once as the basal fertilizer.

2.2.2. Soil Sampling and Measurements

The basic soil samples in the experimental area were collected before maize sowing, and the basic physical and chemical indicators were determined. Moreover, soil sample at the 0-20 cm depth were also collected in the seedling stage, shooting stage and maturity stage. Following air drying, we utilized the Kjeldahl digestion approach was employed for determining soil total N content, the alkali-hydrolyzed diffusion approach was applied in analyzing soil alkali-hydrolyzed N content, while 0.5 mol/L NaHCO3 extraction and molybdenum-antimony resistance colorimetry was conducted to analyze soil available phosphorus content, and 1 mol/L NH4Ac extraction flame photometry was performed for examining soil available potassium content [19].

2.2.3. Maize Plant Sampling and Determination

Plant samples in seedling, shooting and maturity stages were obtained, separately. After drying, the plant N content was determined by the concentrated H2SO4 digestion-H2O2-semi-trace Kjeldahl N method, the plant phosphorus content was measured through concentrated H2SO4 digestion-H2O2-vanadium molybdenum yellow colorimetry, and the plant potassium content was analyzed by concentrated H2SO4 digestion-H2O2-flame photometry. An area of 2.5 m2 was randomly assigned in each experimental plot to harvest all maize spikes. After natural air drying, the yield of 14% standard water content was determined, and the effective spike numbers, 1000-grain weight and grain number per spike were determined. Meanwhile, five maize plants were selected to measure the plant biomass index. The same measurement was conducted twice in each experimental plot.

2.3. Data Analysis

Microsoft Excel 2016 and Origin 2021 were applied in data statistics and chart, separately. The SPSS 26 data analysis system was employed for testing significant differences (P<0.05), correlations between indicators, multiple regression analysis, principal component analysis and path analysis. Path analysis is an analytical method proposed by Wesall Wright in 1921 [20]. By calculating the path coefficient (β), the direct and indirect effects of every variable on the dependent variable could be analyzed through excluding the influence of the unit of measurement and the variation degree of independent variables [21,22]. The relevant indexes were calculated by the formulas below:
Decision coefficient: D = 2rp - p2 (r stands for the correlation coefficient, and p indicates the direct path coefficient)
Plant   N   ( P / K )   uptake   ( kg / h m 2 ) = Total   N   P / K %   in   plants 100 × Total   dry   matter   ( kg / h m 2 )
N ( P / K )   partial   factor   productivity   ( kg / kg ) = Yield N ( P / K )   supplied
Grain   N   ( P / K )   balance   ( kg / kg ) = Grain   N   ( P / K )   content N   ( P / K )   supplied

3. Results

3.1. Simulation Experiment

3.1.1. N Leaching Rate

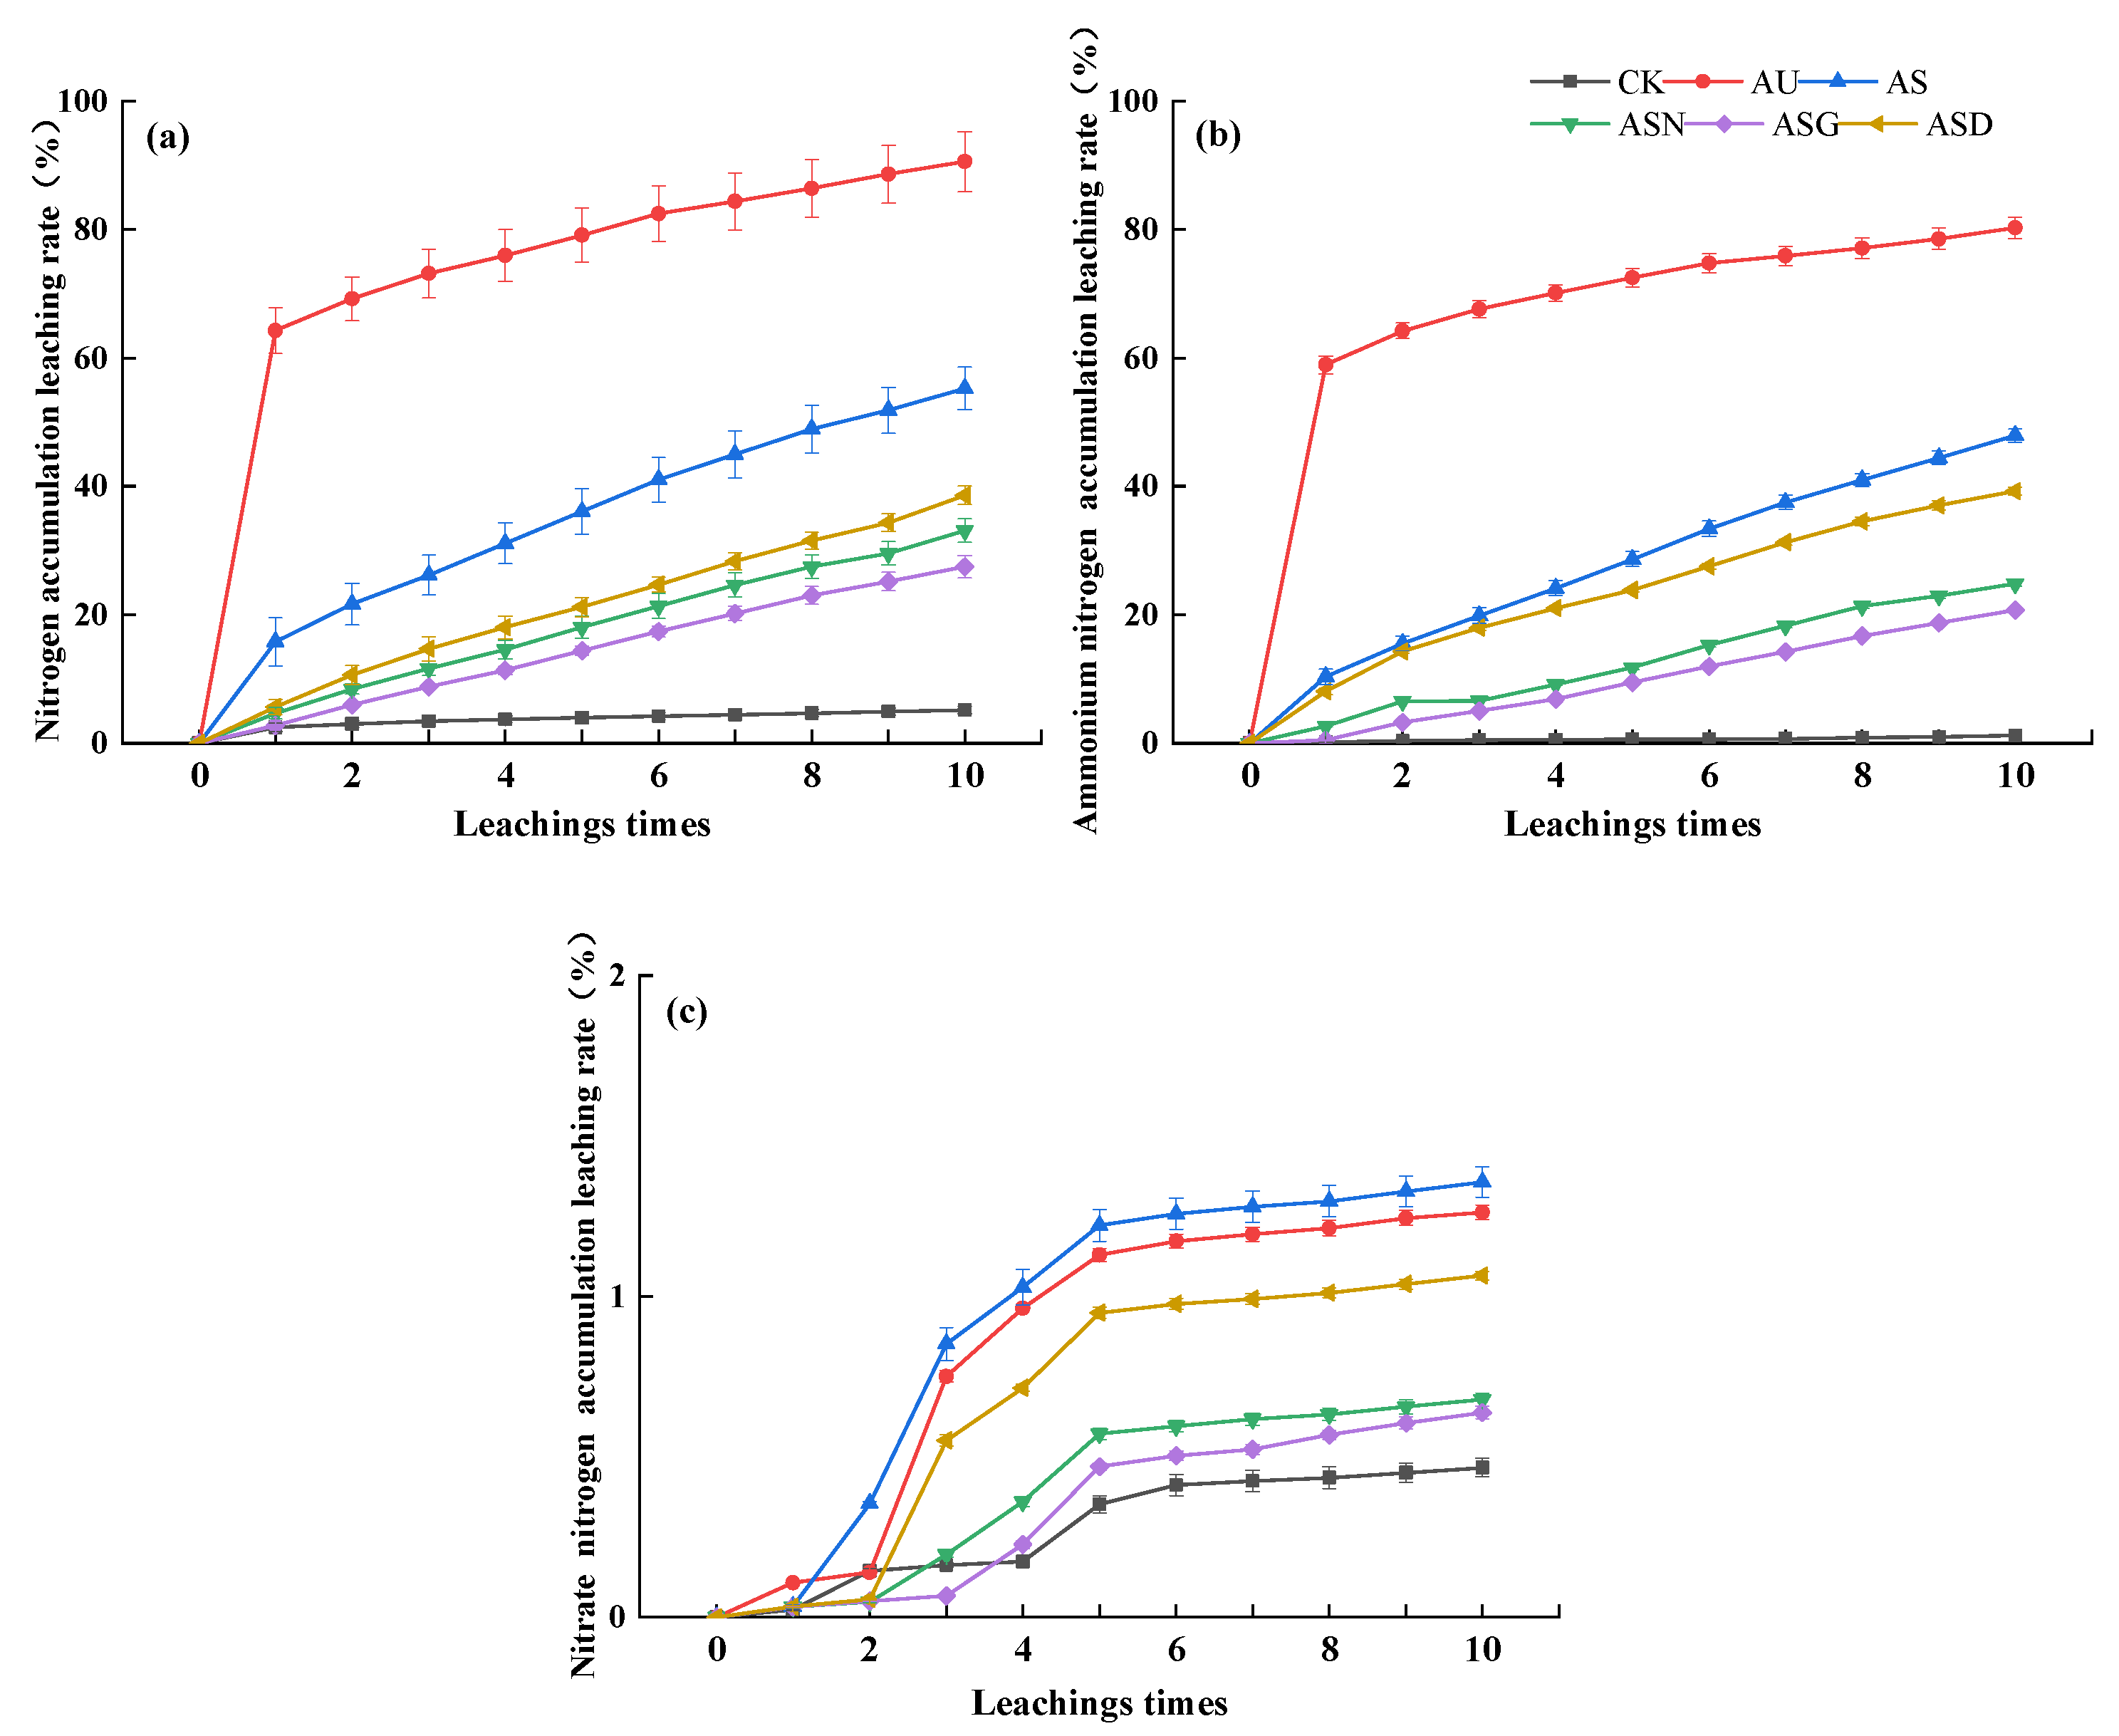
The accumulation leaching rate of TN and NH4+-N showed the order of AU>AS>ASD>ASN>ASG>CK across all collected times (Figure 2a and 2b). AS showed the highest NO3-N leaching rate than that of AU, while higher than those of ASD, ASN and ASG (Figure 2c). Overall, lowest leaching rates were obtained under ASG treatment.
As shown in Table 2, the cumulative release dynamics of soil TN were fitted with the first-order dynamic equation Nt=N0(1-e-kt) model among all fertilizer treatments, and showed significant (P<0.01) linear relationship with time. The k value of N release rate of each treatment was presented as AU > CK > AS > ASD > ASN > ASG.

3.1.2. Soil N Residual

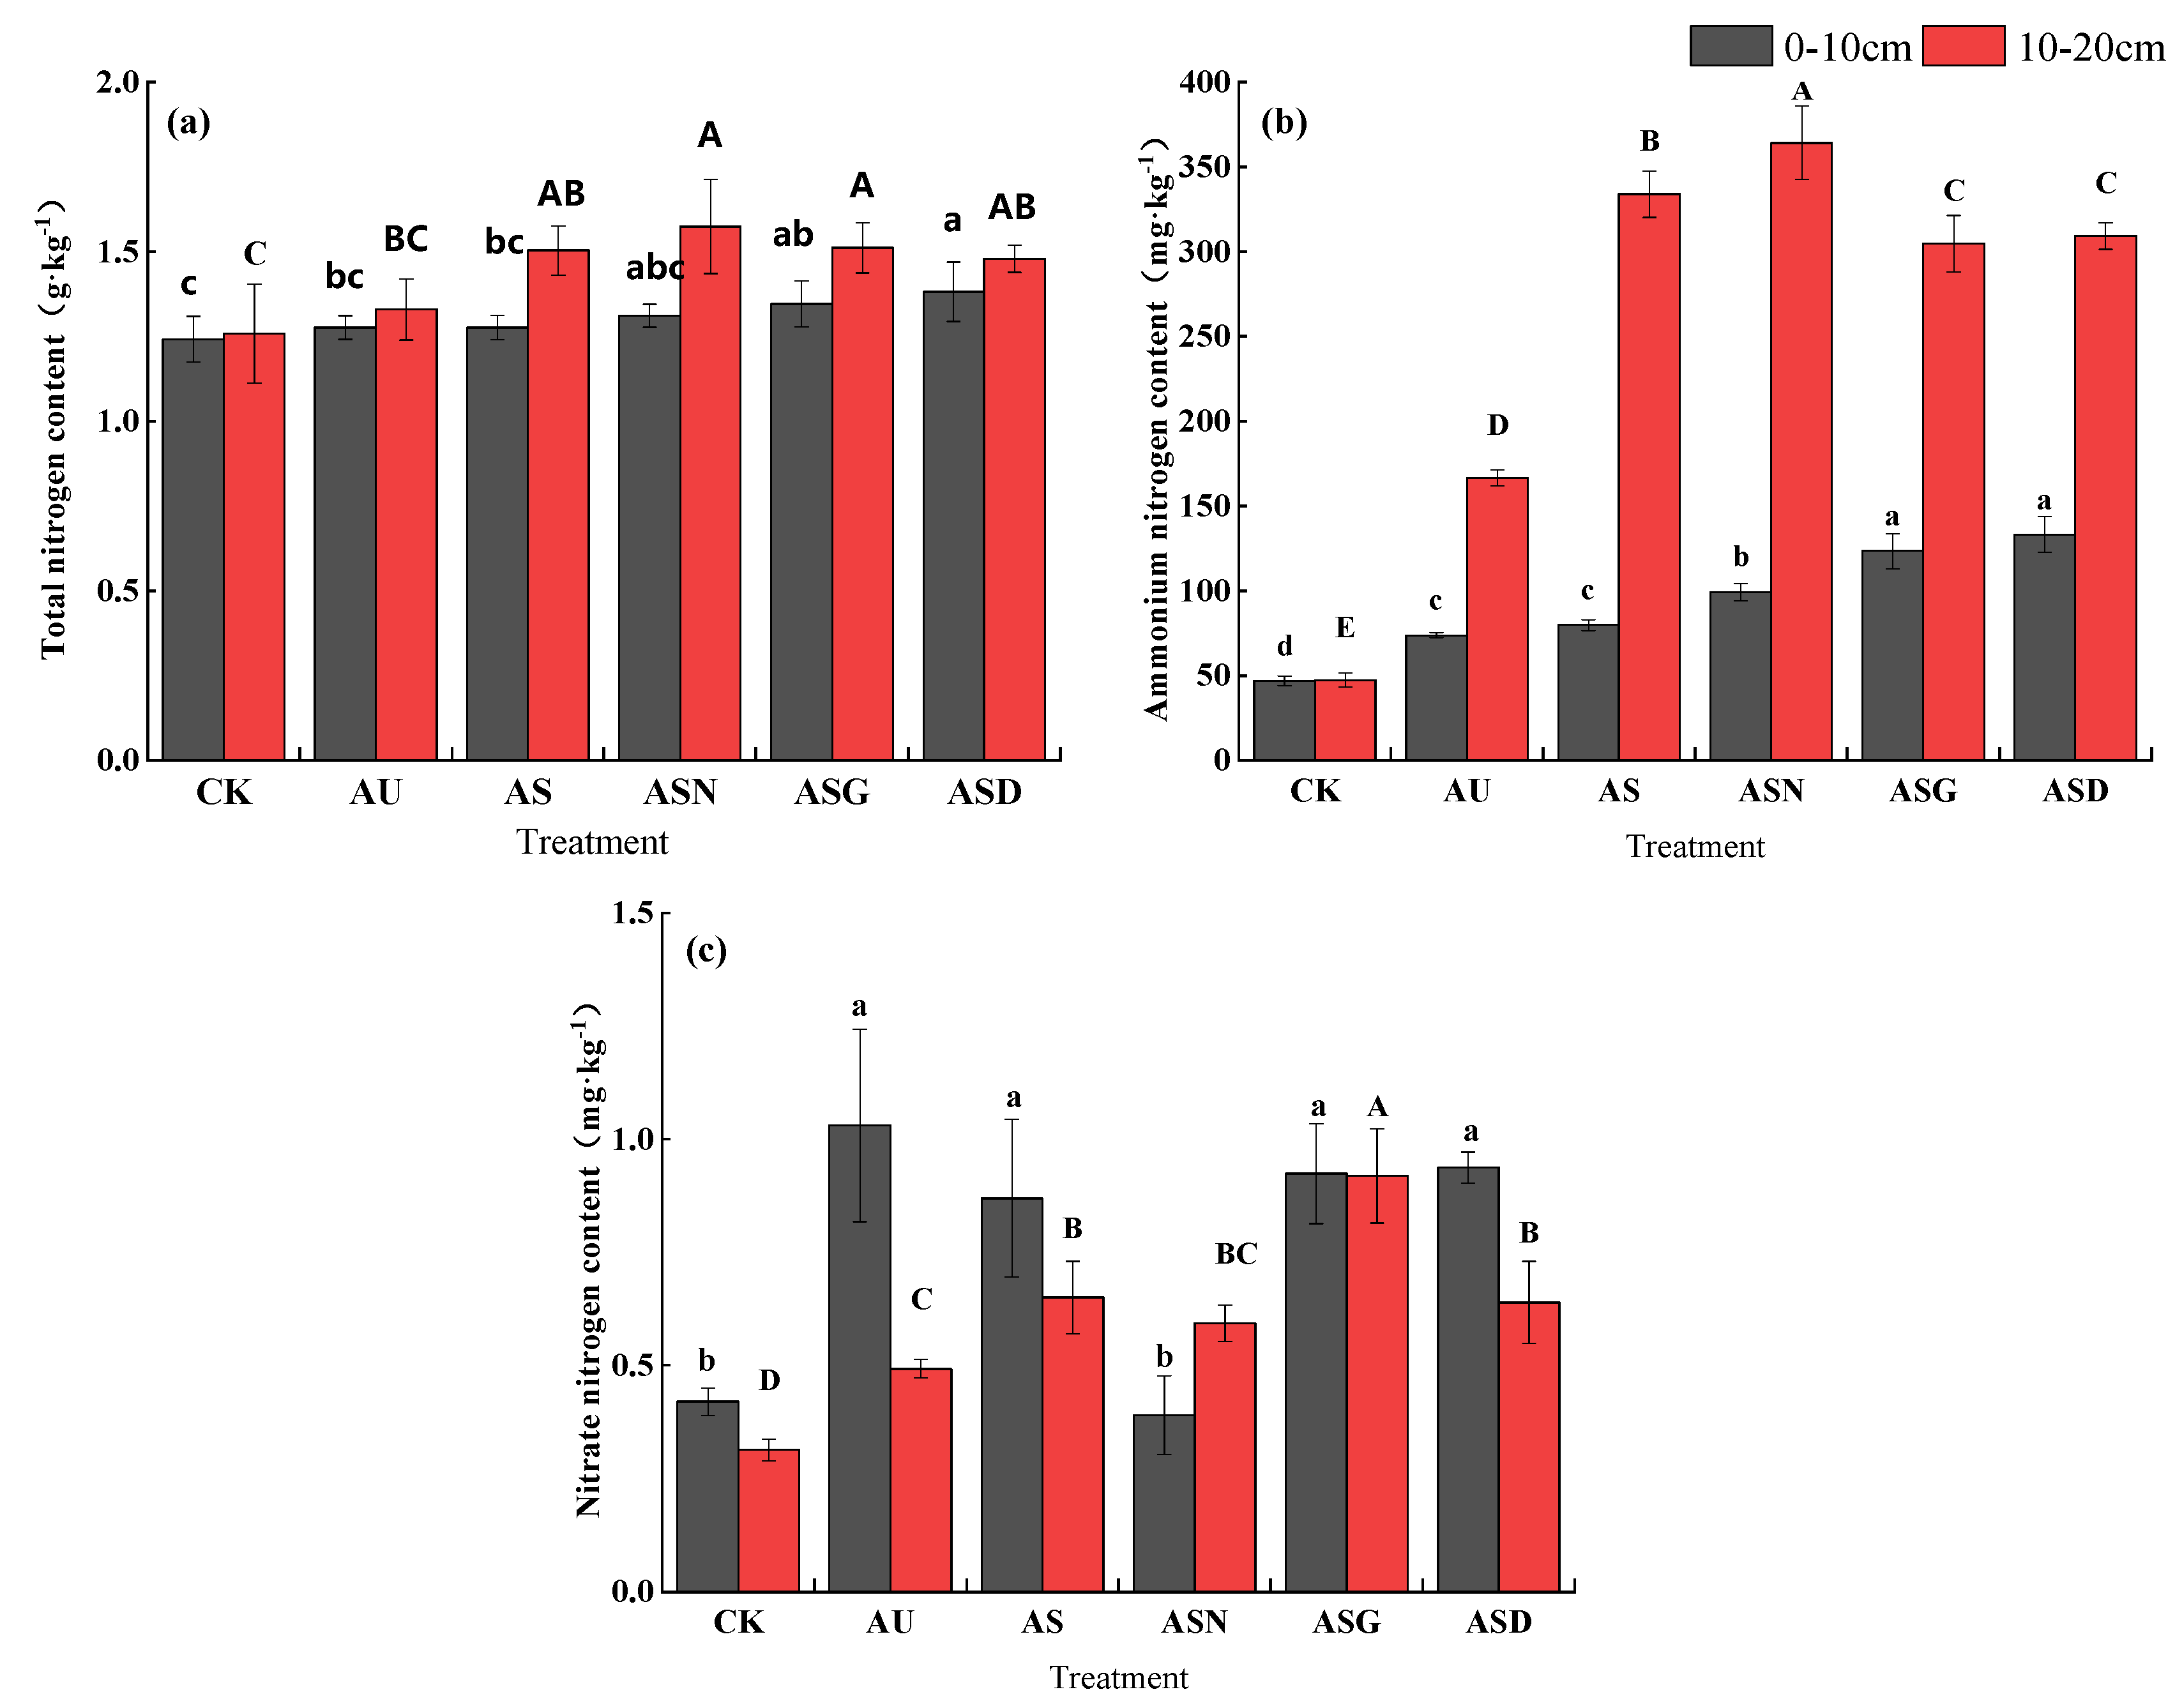
The ASN, ASG and ASH treatments improved TN residual in both 0-10 and 10-20 cm soil layers compared with AU and AS treatments. Higher TN was performed in 10-20 cm soil layer compared with that of 0-10 cm soil layer (Figure 3a). For NH4+-N, about 2-fold higher in 10-20 cm soil layer than those of 0-10 cm layers across all treatments. AS treatments performed higher soil NH4+-N content than that of AU, especially in ASN treatment (Figure 3b).

3.2. Maize Growth and Yield Components

Plant height under AS treatment remarkably decreased compared with ASD treatment, while difference in plant height under AU, AS and ASG treatments was not significant, but they were lower than that under ASD treatment (Table 3). Compared with ASN treatment, ASG and AU treatments significantly increased plant dry weight, while AS and ASD treatments elevated dry weight but the difference was not significant. Grain dry weight per spike under ASG treatment was significantly higher than ASN treatment, which was 1.28 times of that under ASN treatment. Grain dry weights were not significantly different among AU, AS, and ASD treatments, and they were all significantly higher than that under ASN treatment. The spike coarse and spike length of maize under the coating treatment apparently increased relative to ASN treatment, while those under AU and AS treatments also dramatically elevated relative to ASN treatment (Table 3).
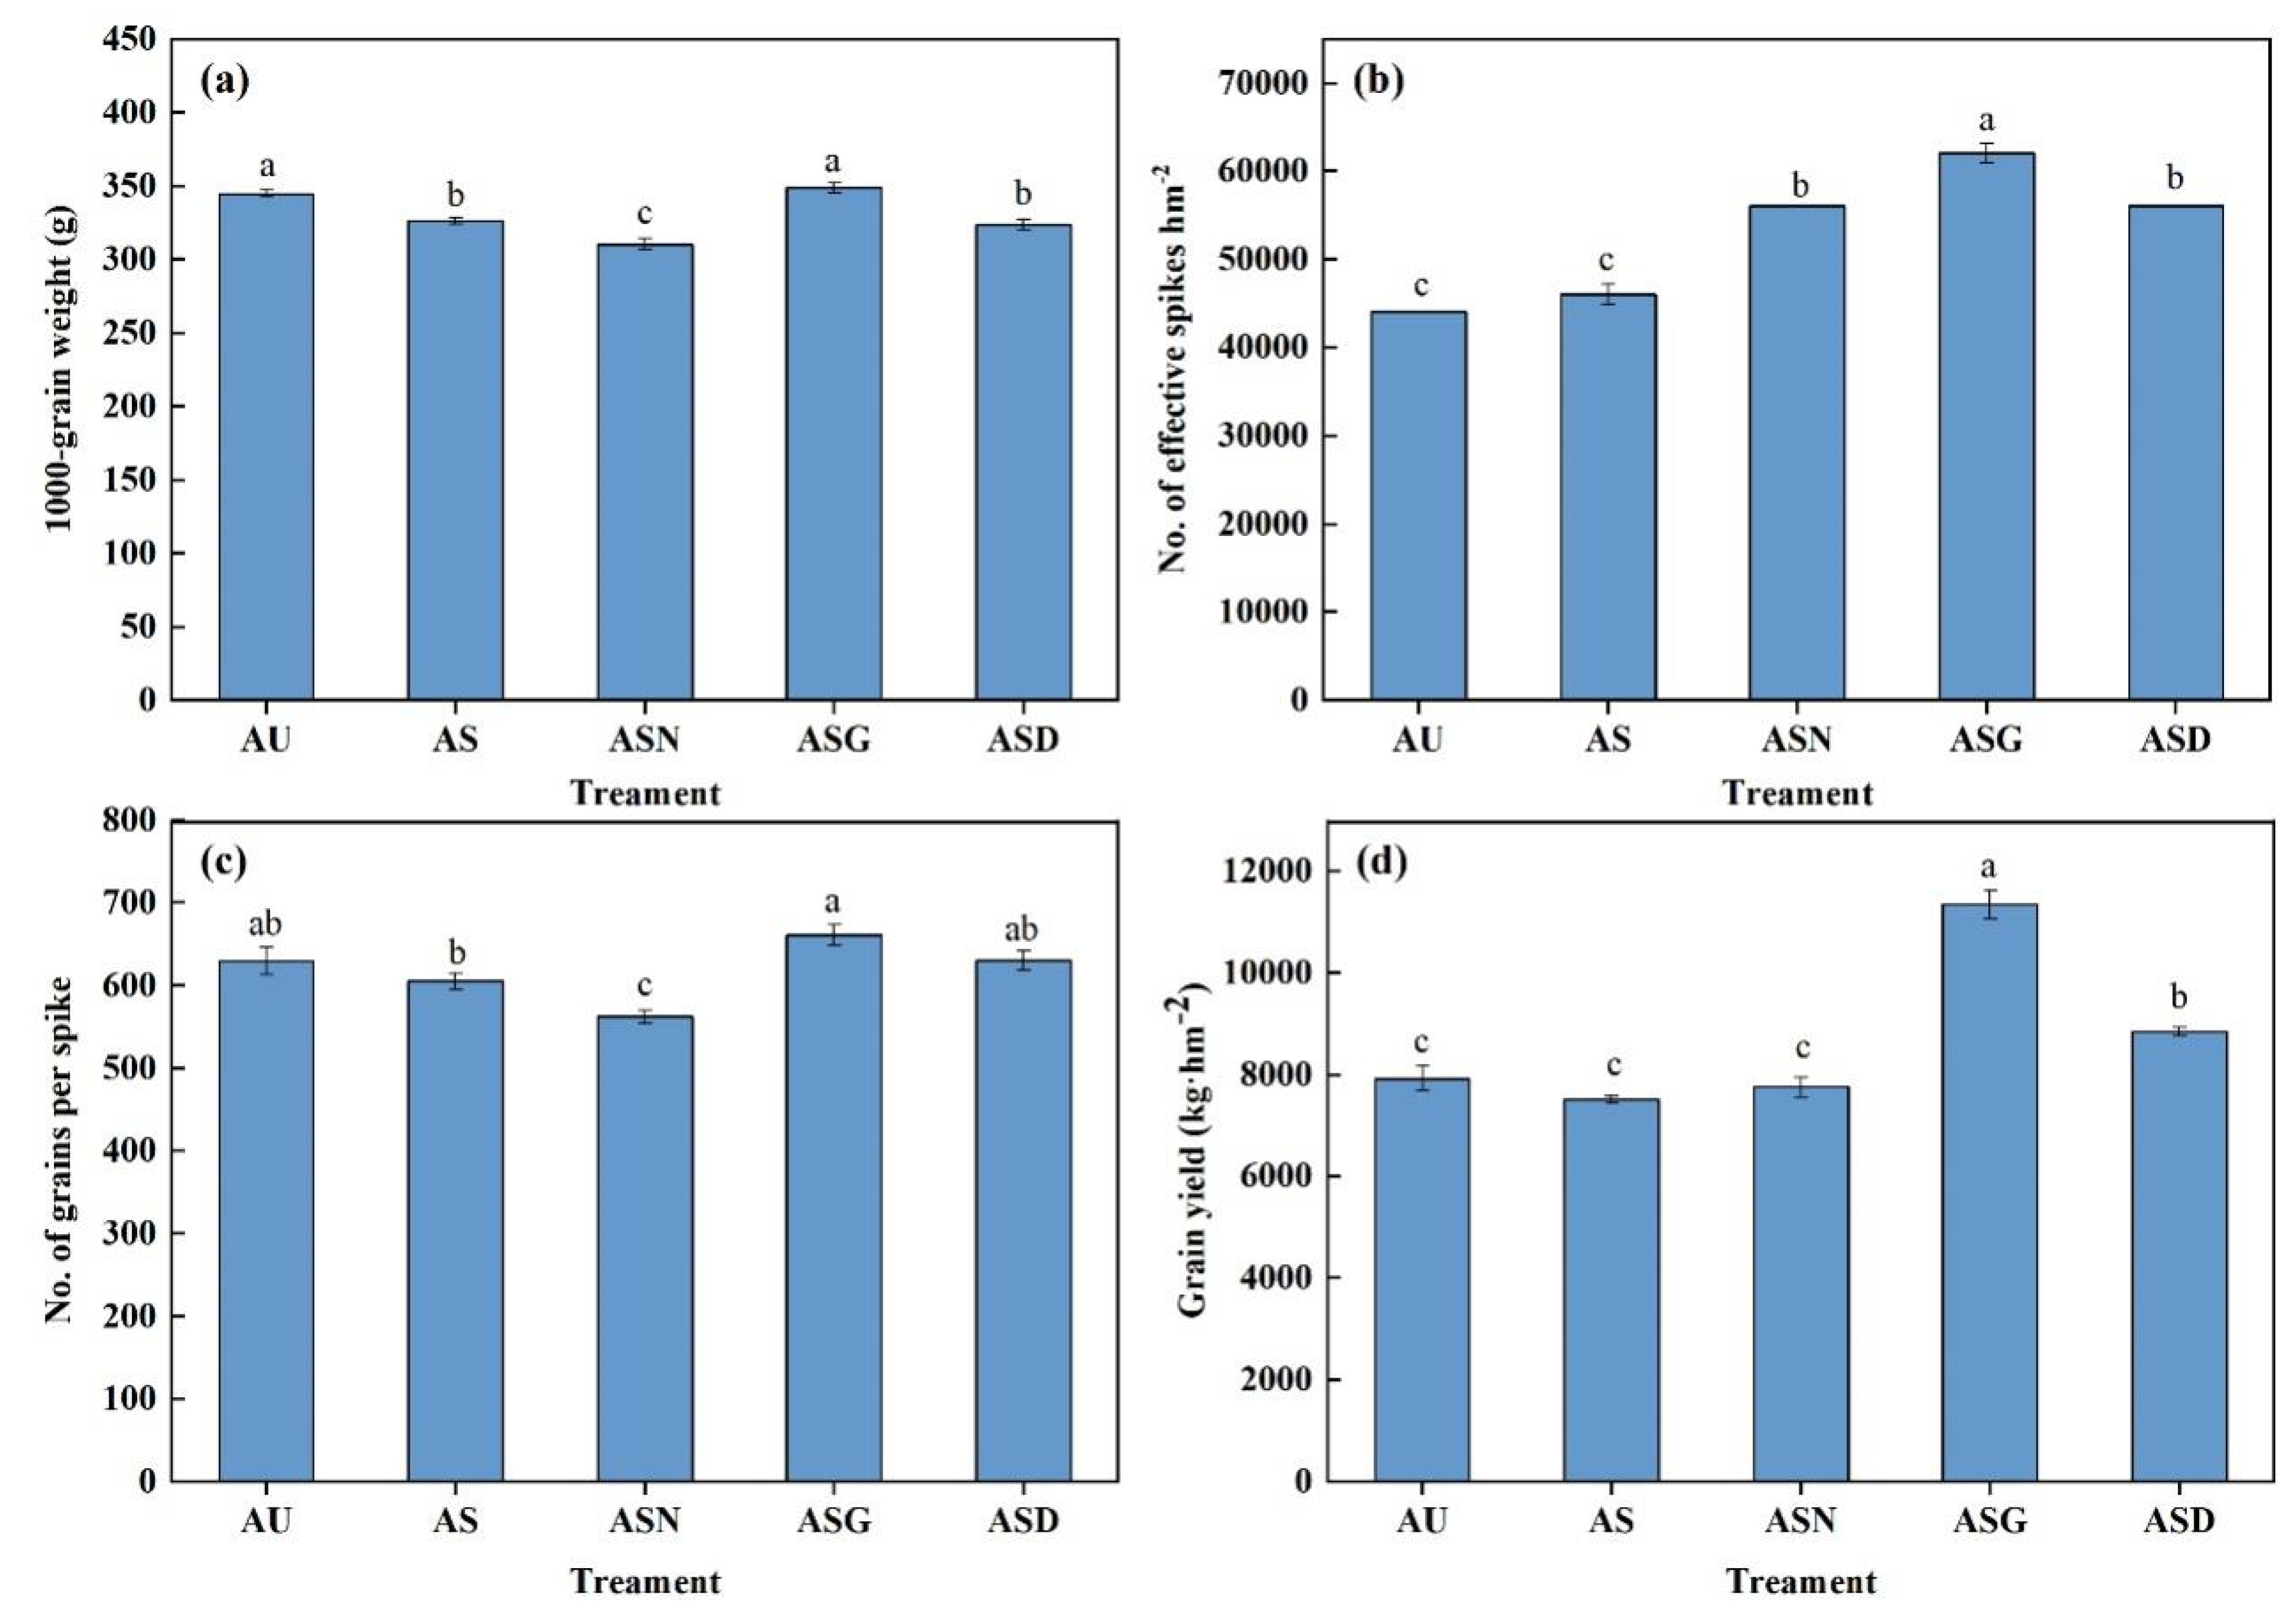
Moreover, effective spike numbers of the three types of slow-/controlled-release fertilizers evidently elevated relative to AU and AS treatments, while that under ASG treatment was much higher than AU and AS treatments. There was no significant difference in 1000-grain weight or grain number per spike between ASG and AU treatment, but they were still higher than those under other treatments, and ASN treatment had the lowest 1000-grain weight, indicating that ammonium sulfate combined with nitrification inhibitor was not conducive to dry matter accumulation of grains (Figure 4a, 4b and 4c). Compared with AU, AS and ASN treatments, the yield of maize under coating treatment significantly increased by 11.63%-50.10%. The grain yield under ASD treatment dramatically decreased compared with ASG treatment, and it was 77.94% of that under ASG treatment. Besides, the grain yield under ASN treatment increased relative to AS treatment, but decreased compared with AU treatment (Figure 4d).
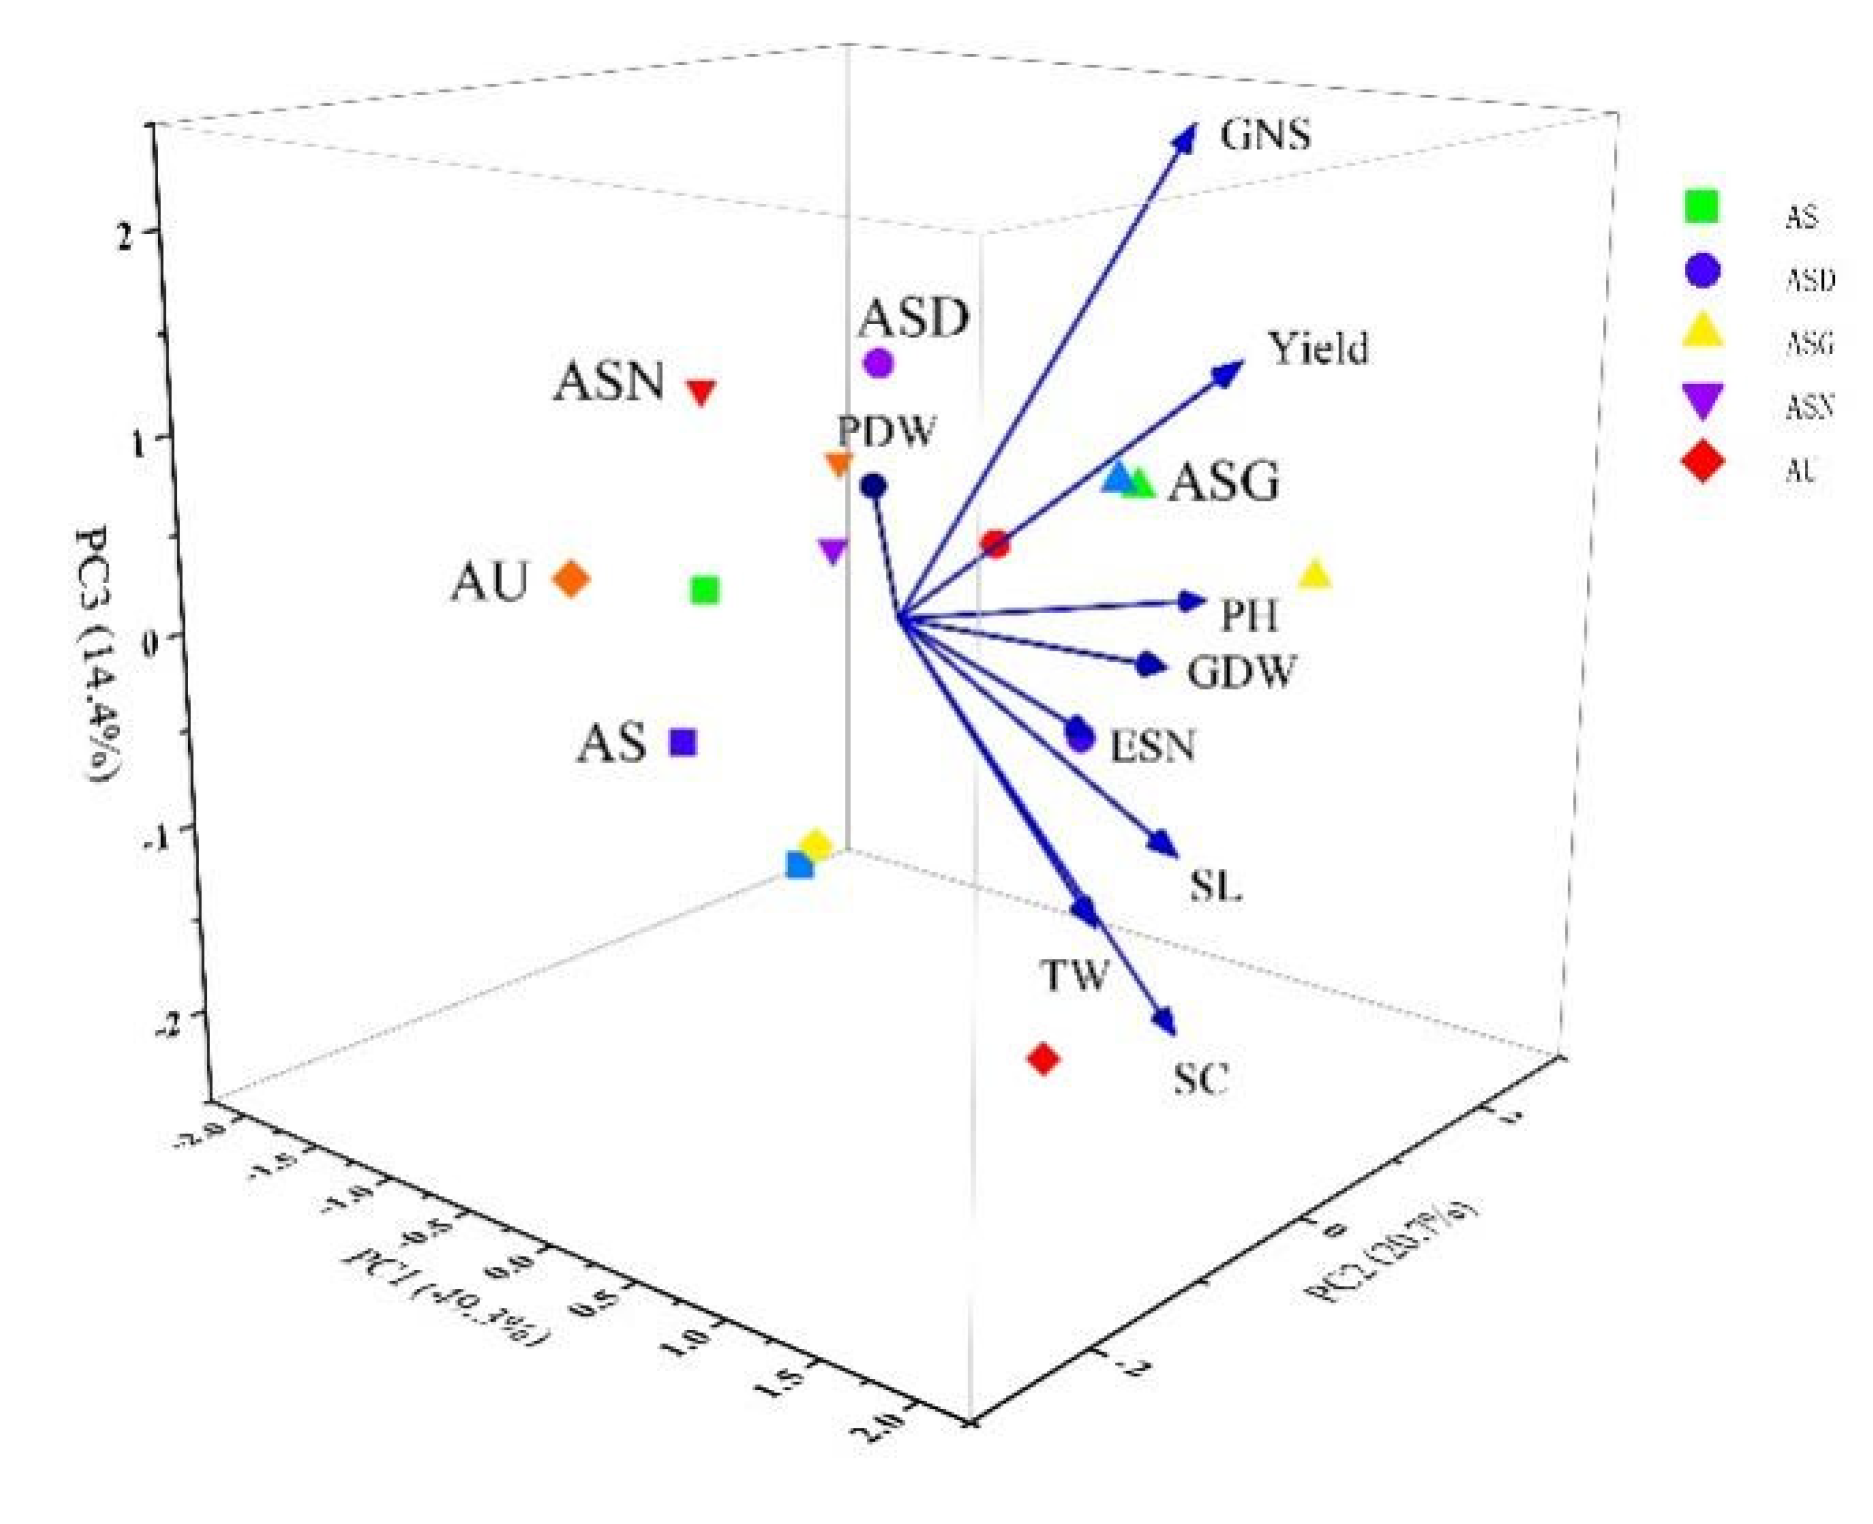
Three principal components PC1, PC2 and PC3 represented 84.34% of the 9 indicators to quantify the growth status of maize. Among them, the growth condition of maize under coating treatment was superior to those under other treatments, and that under ASG treatment was the best, while that under AS treatment was the worst (Figure 5). Obviously, the yield showed significant correlation with effective spike number and grain dry weight.
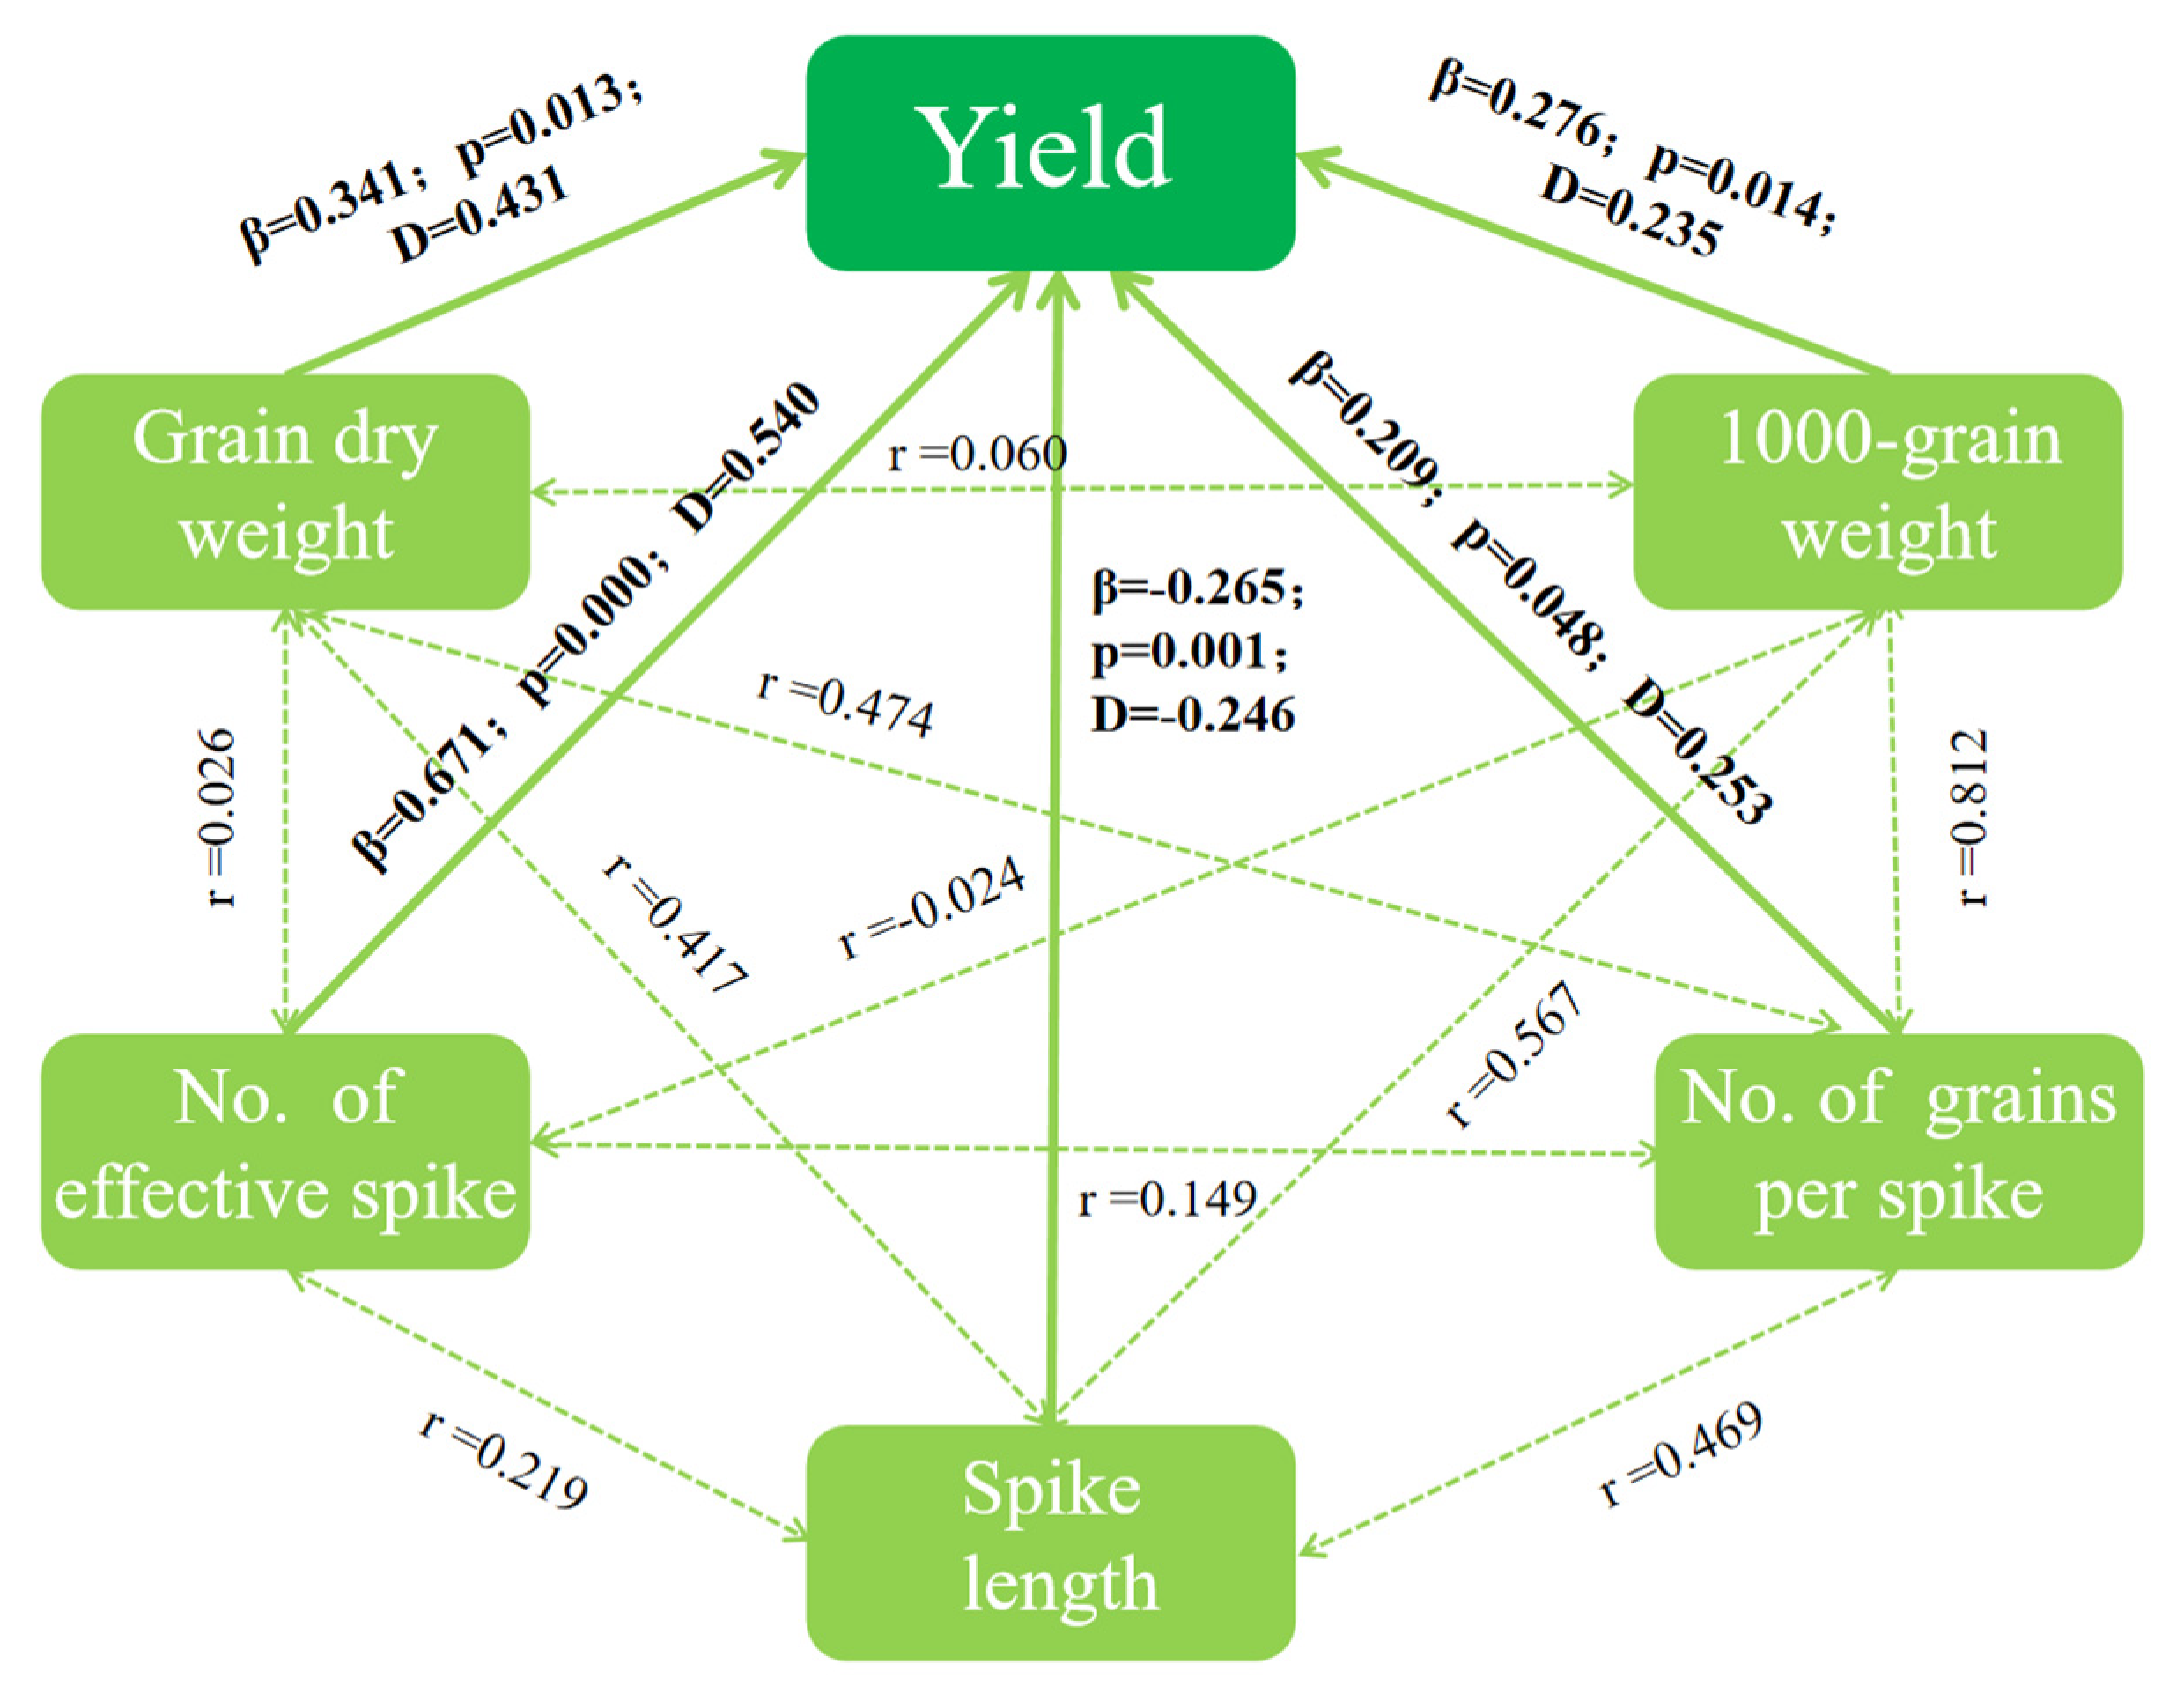
The direct effects (β) on maize yield followed the order below: grain dry weight (0.341) > spike length (-0.265) > 1000-grain weight (0.276) > effective spike number (0.671) > grains per spike (0.209). Meanwhile, the decision coefficient (D) of effective spike number (0.540) was higher than those of other traits, indicating that it was the leading factor affecting maize yield (Figure 6).

3.3. Soil Nitrogen, Plant Nitrogen Accumulation and Nitrogen Use Efficiency

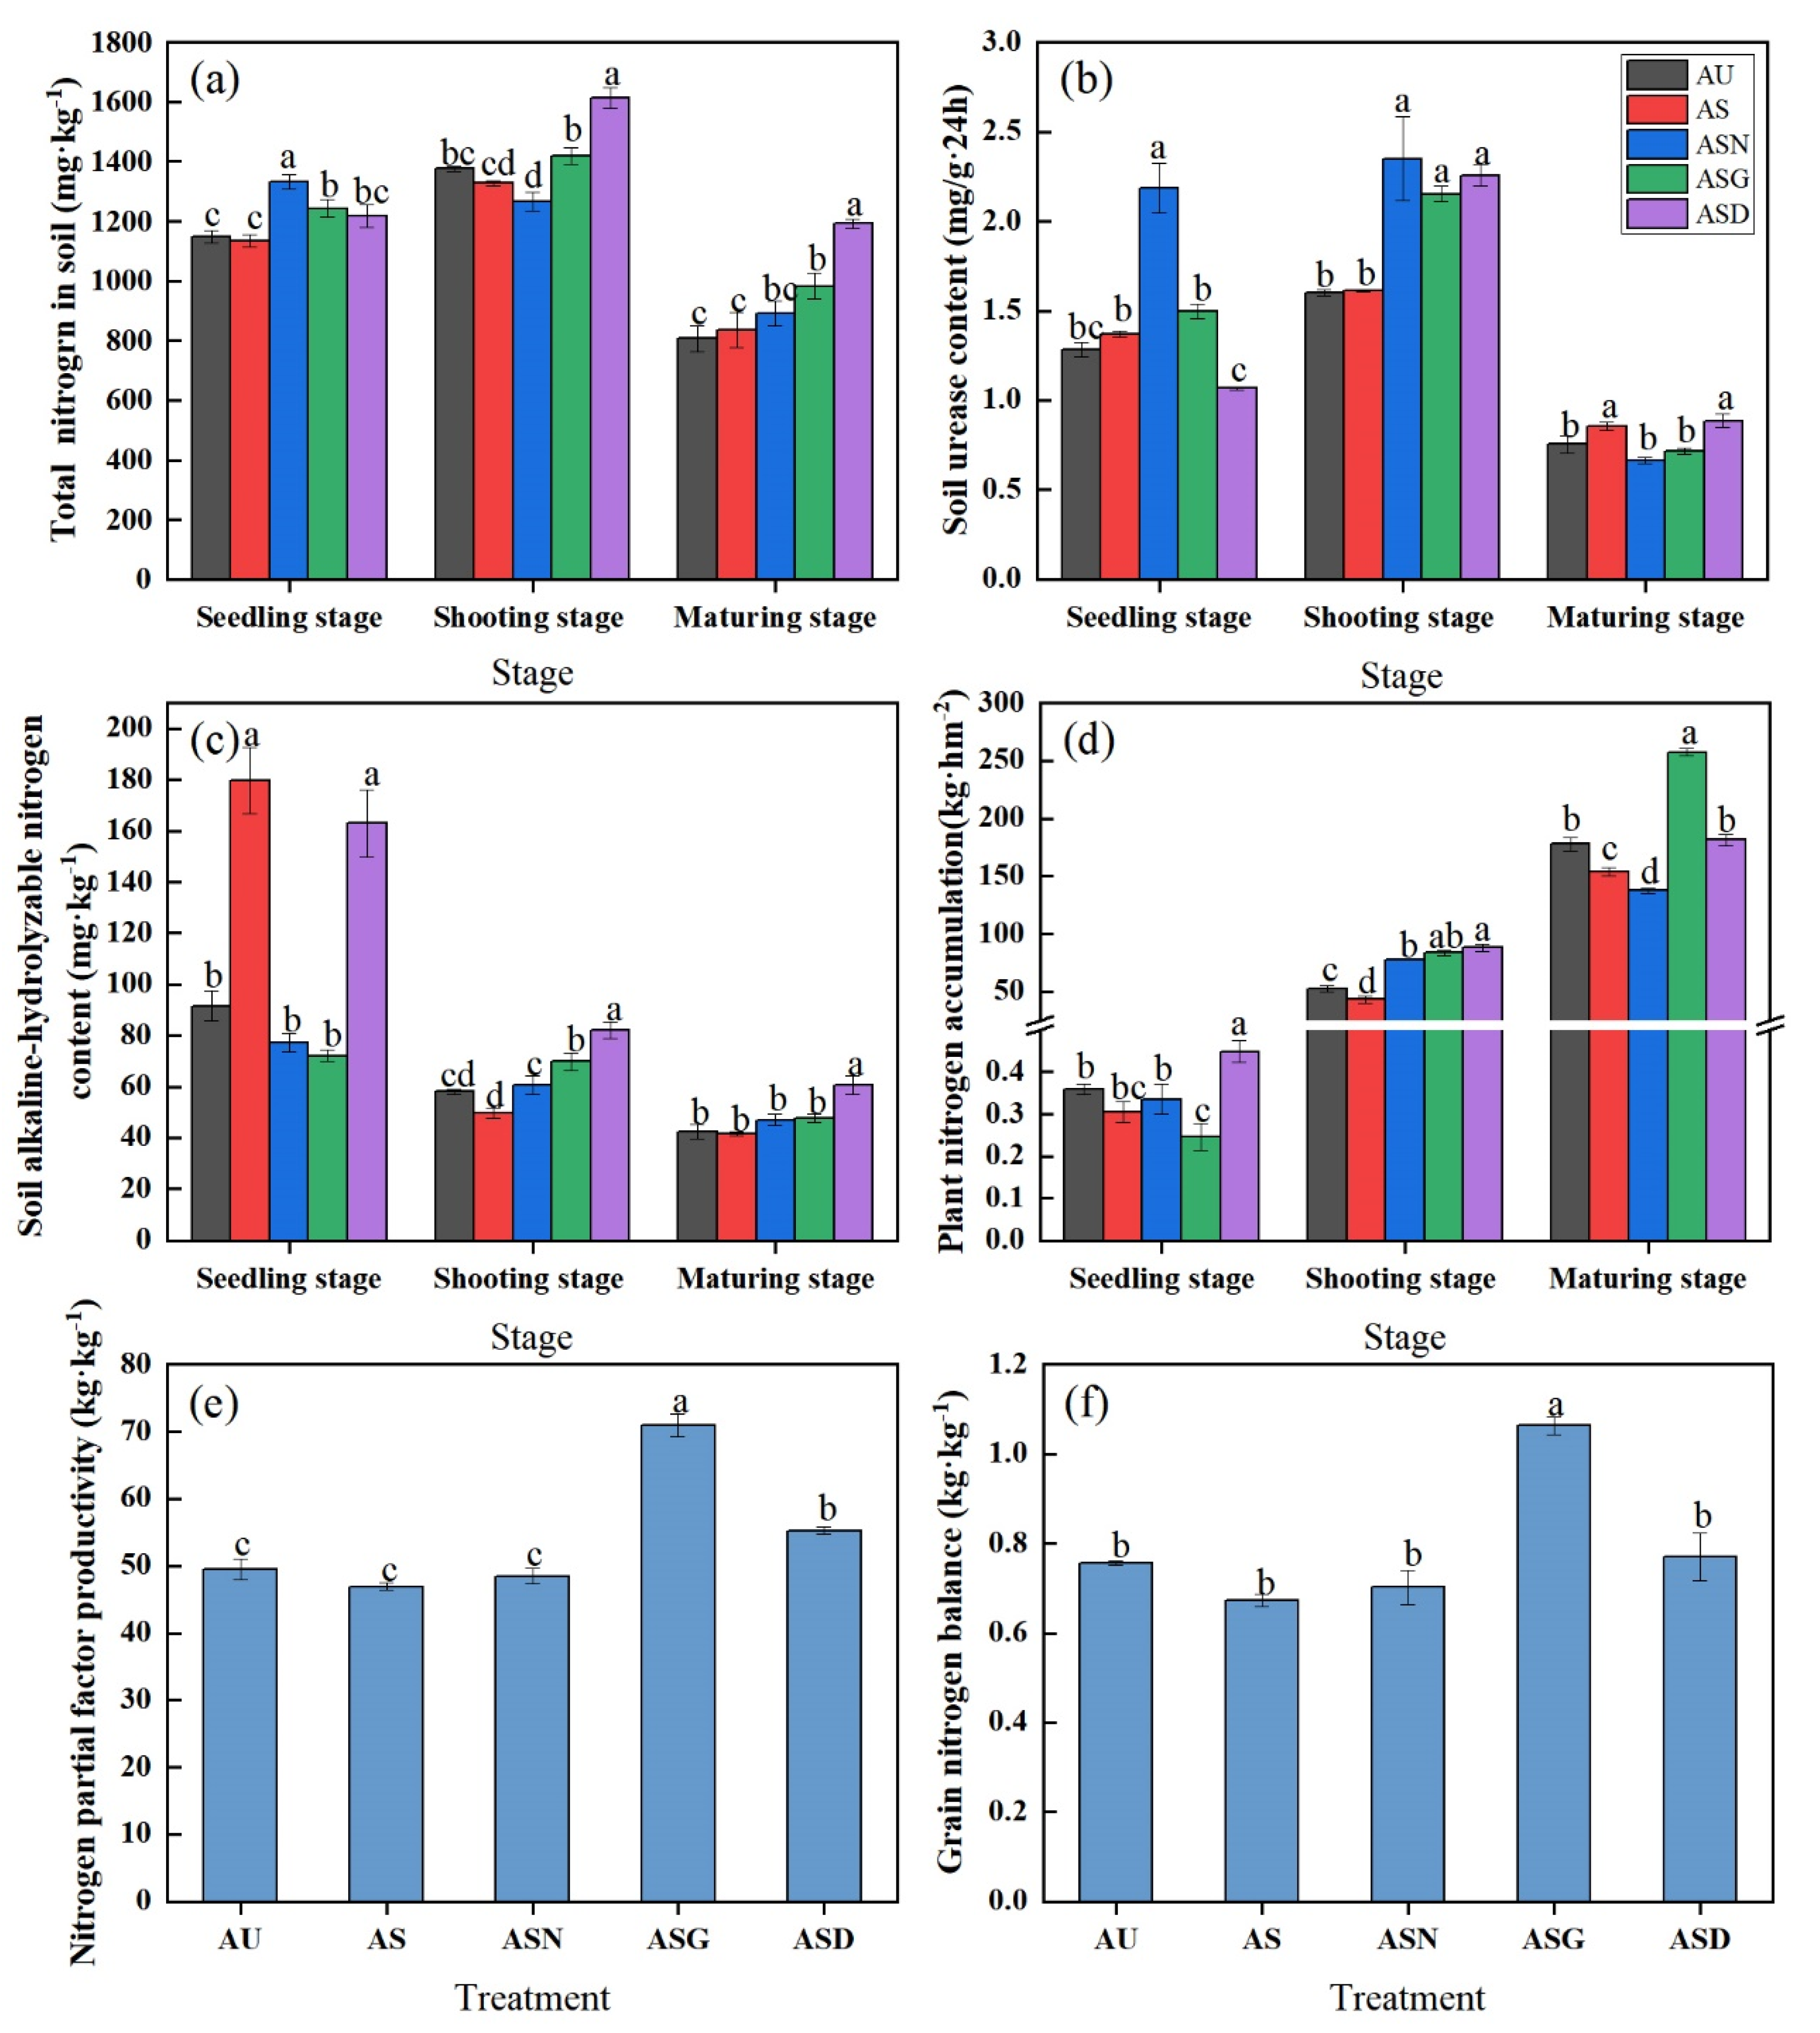
The total soil nitrogen content showed a first increasing and later decreasing trend, with the exception of ASN treatment (Figure 7a). The soil total nitrogen content under ASD treatment in seedling stage remarkably increased relative to other treatments, and the soil total nitrogen content under ASD treatment peaked in later growth stage. Soil total nitrogen content under ASG treatment in maturity stage apparently elevated relative to AU and AS treatments, but the difference was of no significance compared with ASN treatment (P<0.05).
In seedling stage, urease activity under AS and ASD treatments apparently increased relative to other treatments, that under ASD treatment peaked in late growth stage, and that under ASG treatment elevated relative to AU and AS treatments but the difference was not significant (Figure 7b).
The soil alkali-hydrolyzed nitrogen content decreased rapidly from seedling stage to shooting stage, with a much smaller decrease range from shooting stage to maturing stage than that from seedling stage to shooting stage (Figure 7c). In the seedling stage, the soil alkali-hydrolyzed nitrogen contents under AS and ASD treatments significantly increased relative to other treatments. In shooting stage, soil alkali-hydrolyzed nitrogen content under AS treatment decreased rapidly, significantly lower than that under ASN, ASG and ASD treatments, indicating the faster nitrogen release rate of ammonium sulfate and the greater nitrogen loss without sustained-release treatment. In the maturing stage, soil alkali-hydrolyzed nitrogen content under ASD treatment markedly increased relative to other treatments.
In seedling stage, ASD treatment exhibited one significant advantage in nitrogen accumulation. In the shooting stage, the nitrogen accumulation under the three slow-/controlled-release fertilizer treatments dramatically elevated compared with AU and AS treatments. In maturity stage, plant nitrogen accumulation under ASG treatment was the highest, while that under ASN treatment was the lowest. Difference was not significant between ASD and AU treatments, yet their plant nitrogen accumulation evidently increased relative to that under AS treatment (Figure 7d).
Compared with other treatments, ASG treatment markedly increased nitrogen partial factor productivity and grain nitrogen balance, which were 1.43 times of that under AU treatment and 1.51 times of that under AS treatment (Figure 7e and 7f). In addition, the nitrogen partial factor productivity under ASD treatment also remarkably elevated relative to AU, AS and ASN treatments, while the grain nitrogen balance was not significantly different.

3.4. Available P(K) in Soil, P(K) in Plants and Effective Use of P(K)

Soil available P contents under coating and AU treatment markedly increased relative to AS and ASN treatments (Table 4). Besides, soil available K contents under ASG and ASD treatments apparently elevated compared with AU, AS and ASN treatments, but differences under AU, AS and ASN treatments were not significant. The highest P and K contents were detected under ASG treatment, while the lowest contents were measured under AS treatment. Further, the P partial productivity under ASG treatment was 1.43 times of that under AU treatment and 1.51 times of that under AS treatment. ASG treatment resulted in the significantly increased K partial productivity and grain P balance relative to other treatments. Additionally, grain K balance under AU and ASG treatments evidently increased compared with AS, ASD and ASN treatments, and that under ASN treatment was the lowest.

3.5. Principal Components Analysis (PCA)

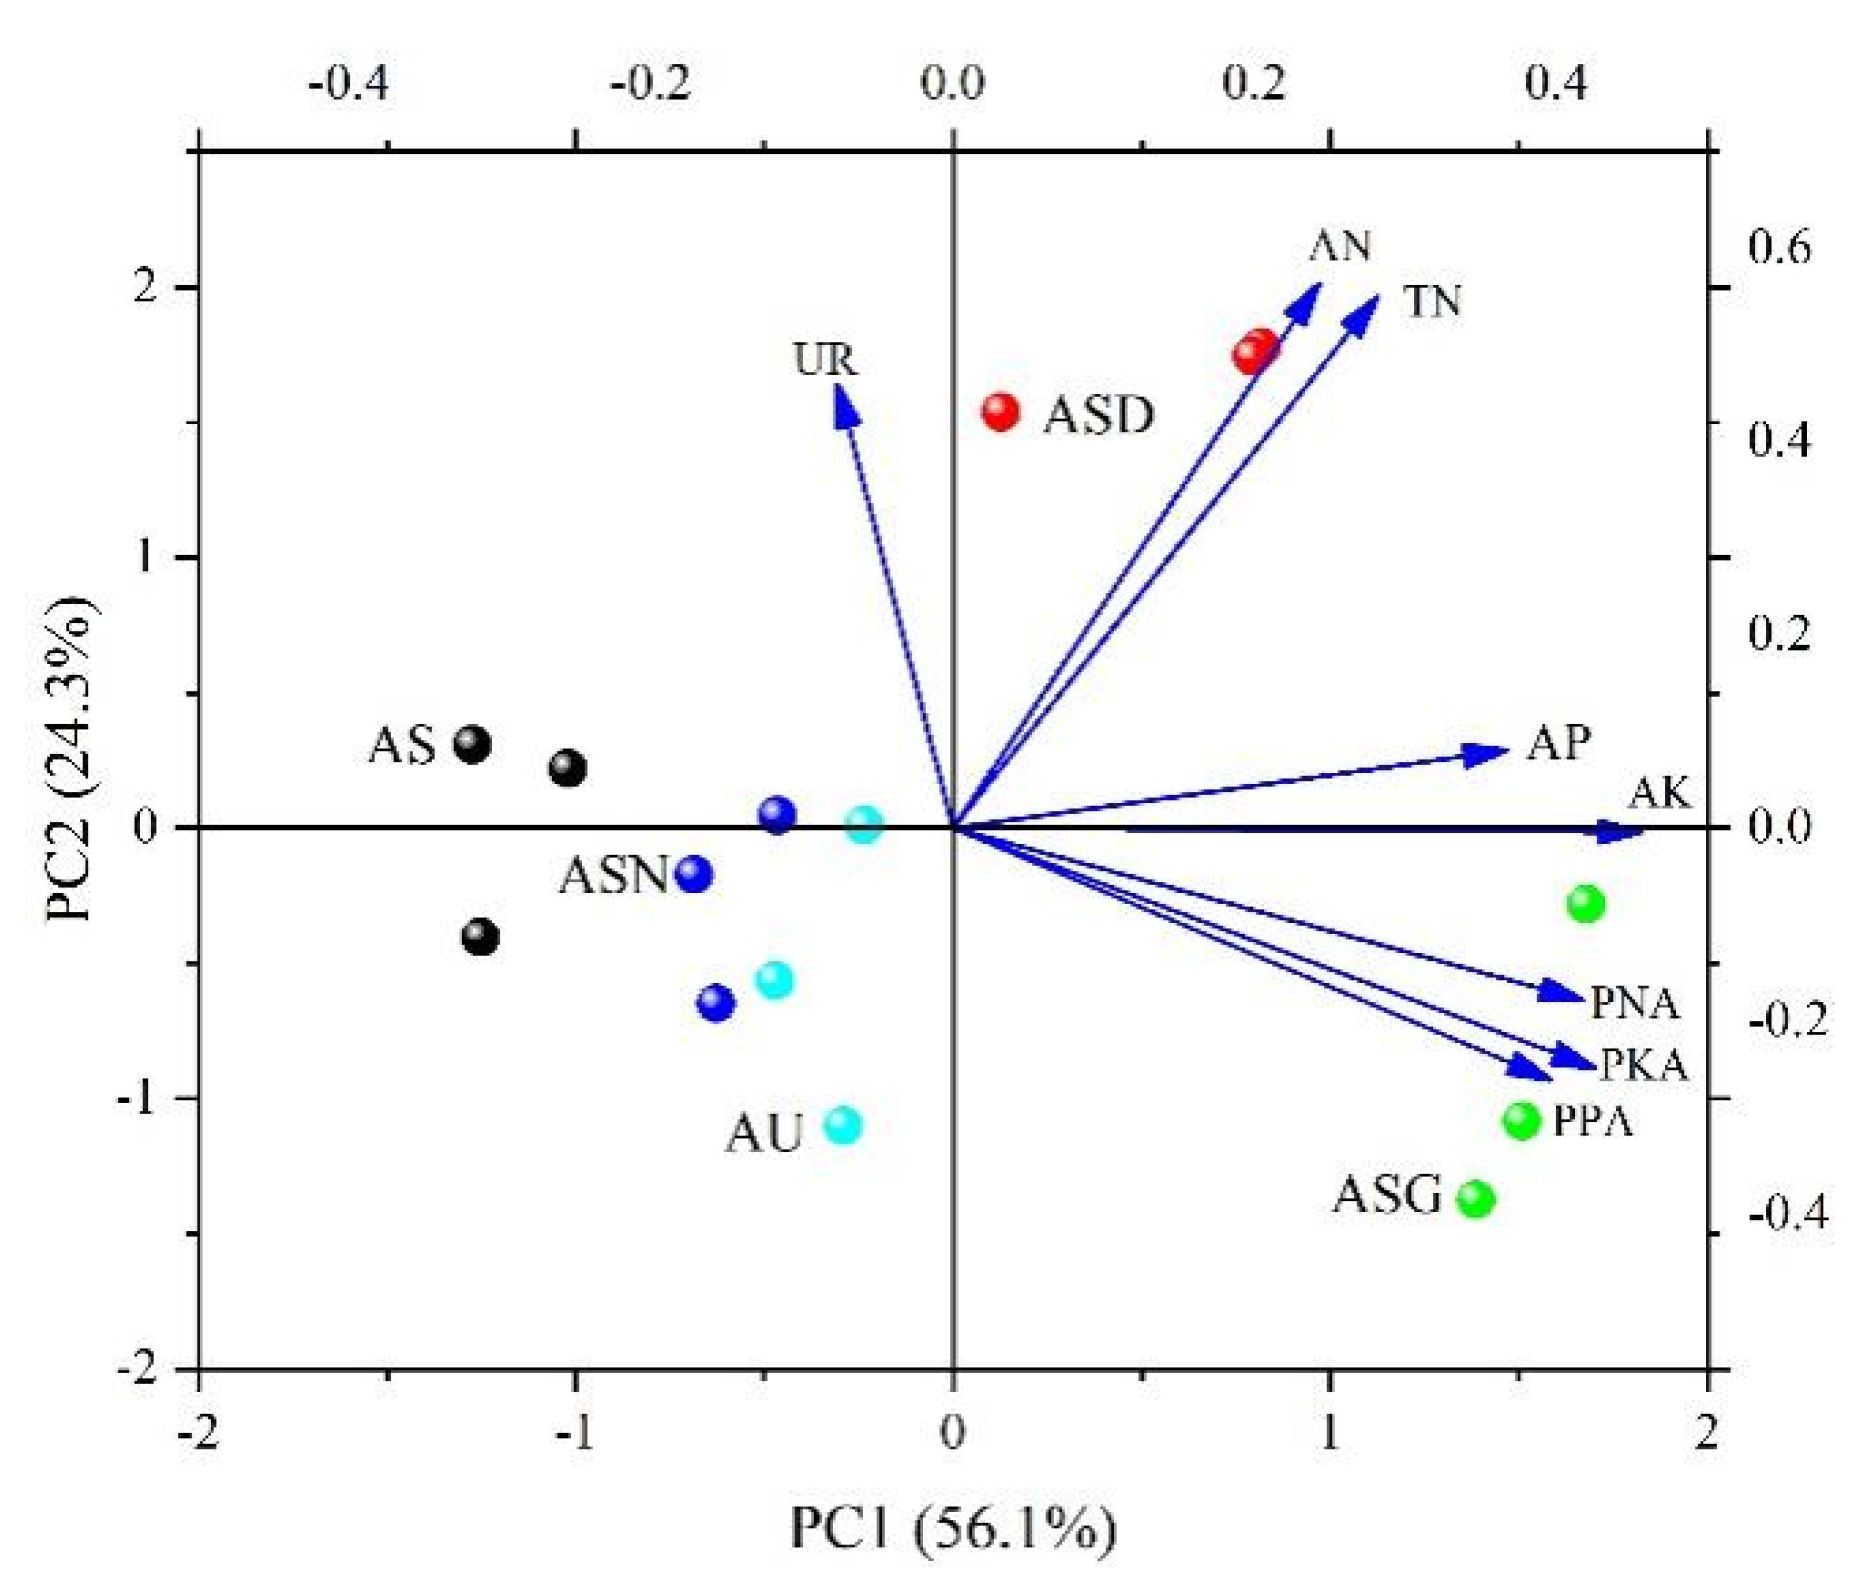
The two principal components PC1 and PC2 interpreted 84.34% of the 8 indicators to quantify soil and plant nutrient status. On the whole, the soil and plant nutrient status under the coating treatment was better than that under other treatments, typically, the nutrient status under ASD treatment was the best, while that under AS treatment was the worst. Plant nutrient accumulation showed a high correlation with soil available phosphorus and available potassium, a low correlation with soil total nitrogen and alkali-hydrolyzed nitrogen, and a negative correlation with urease activity (Figure 8).
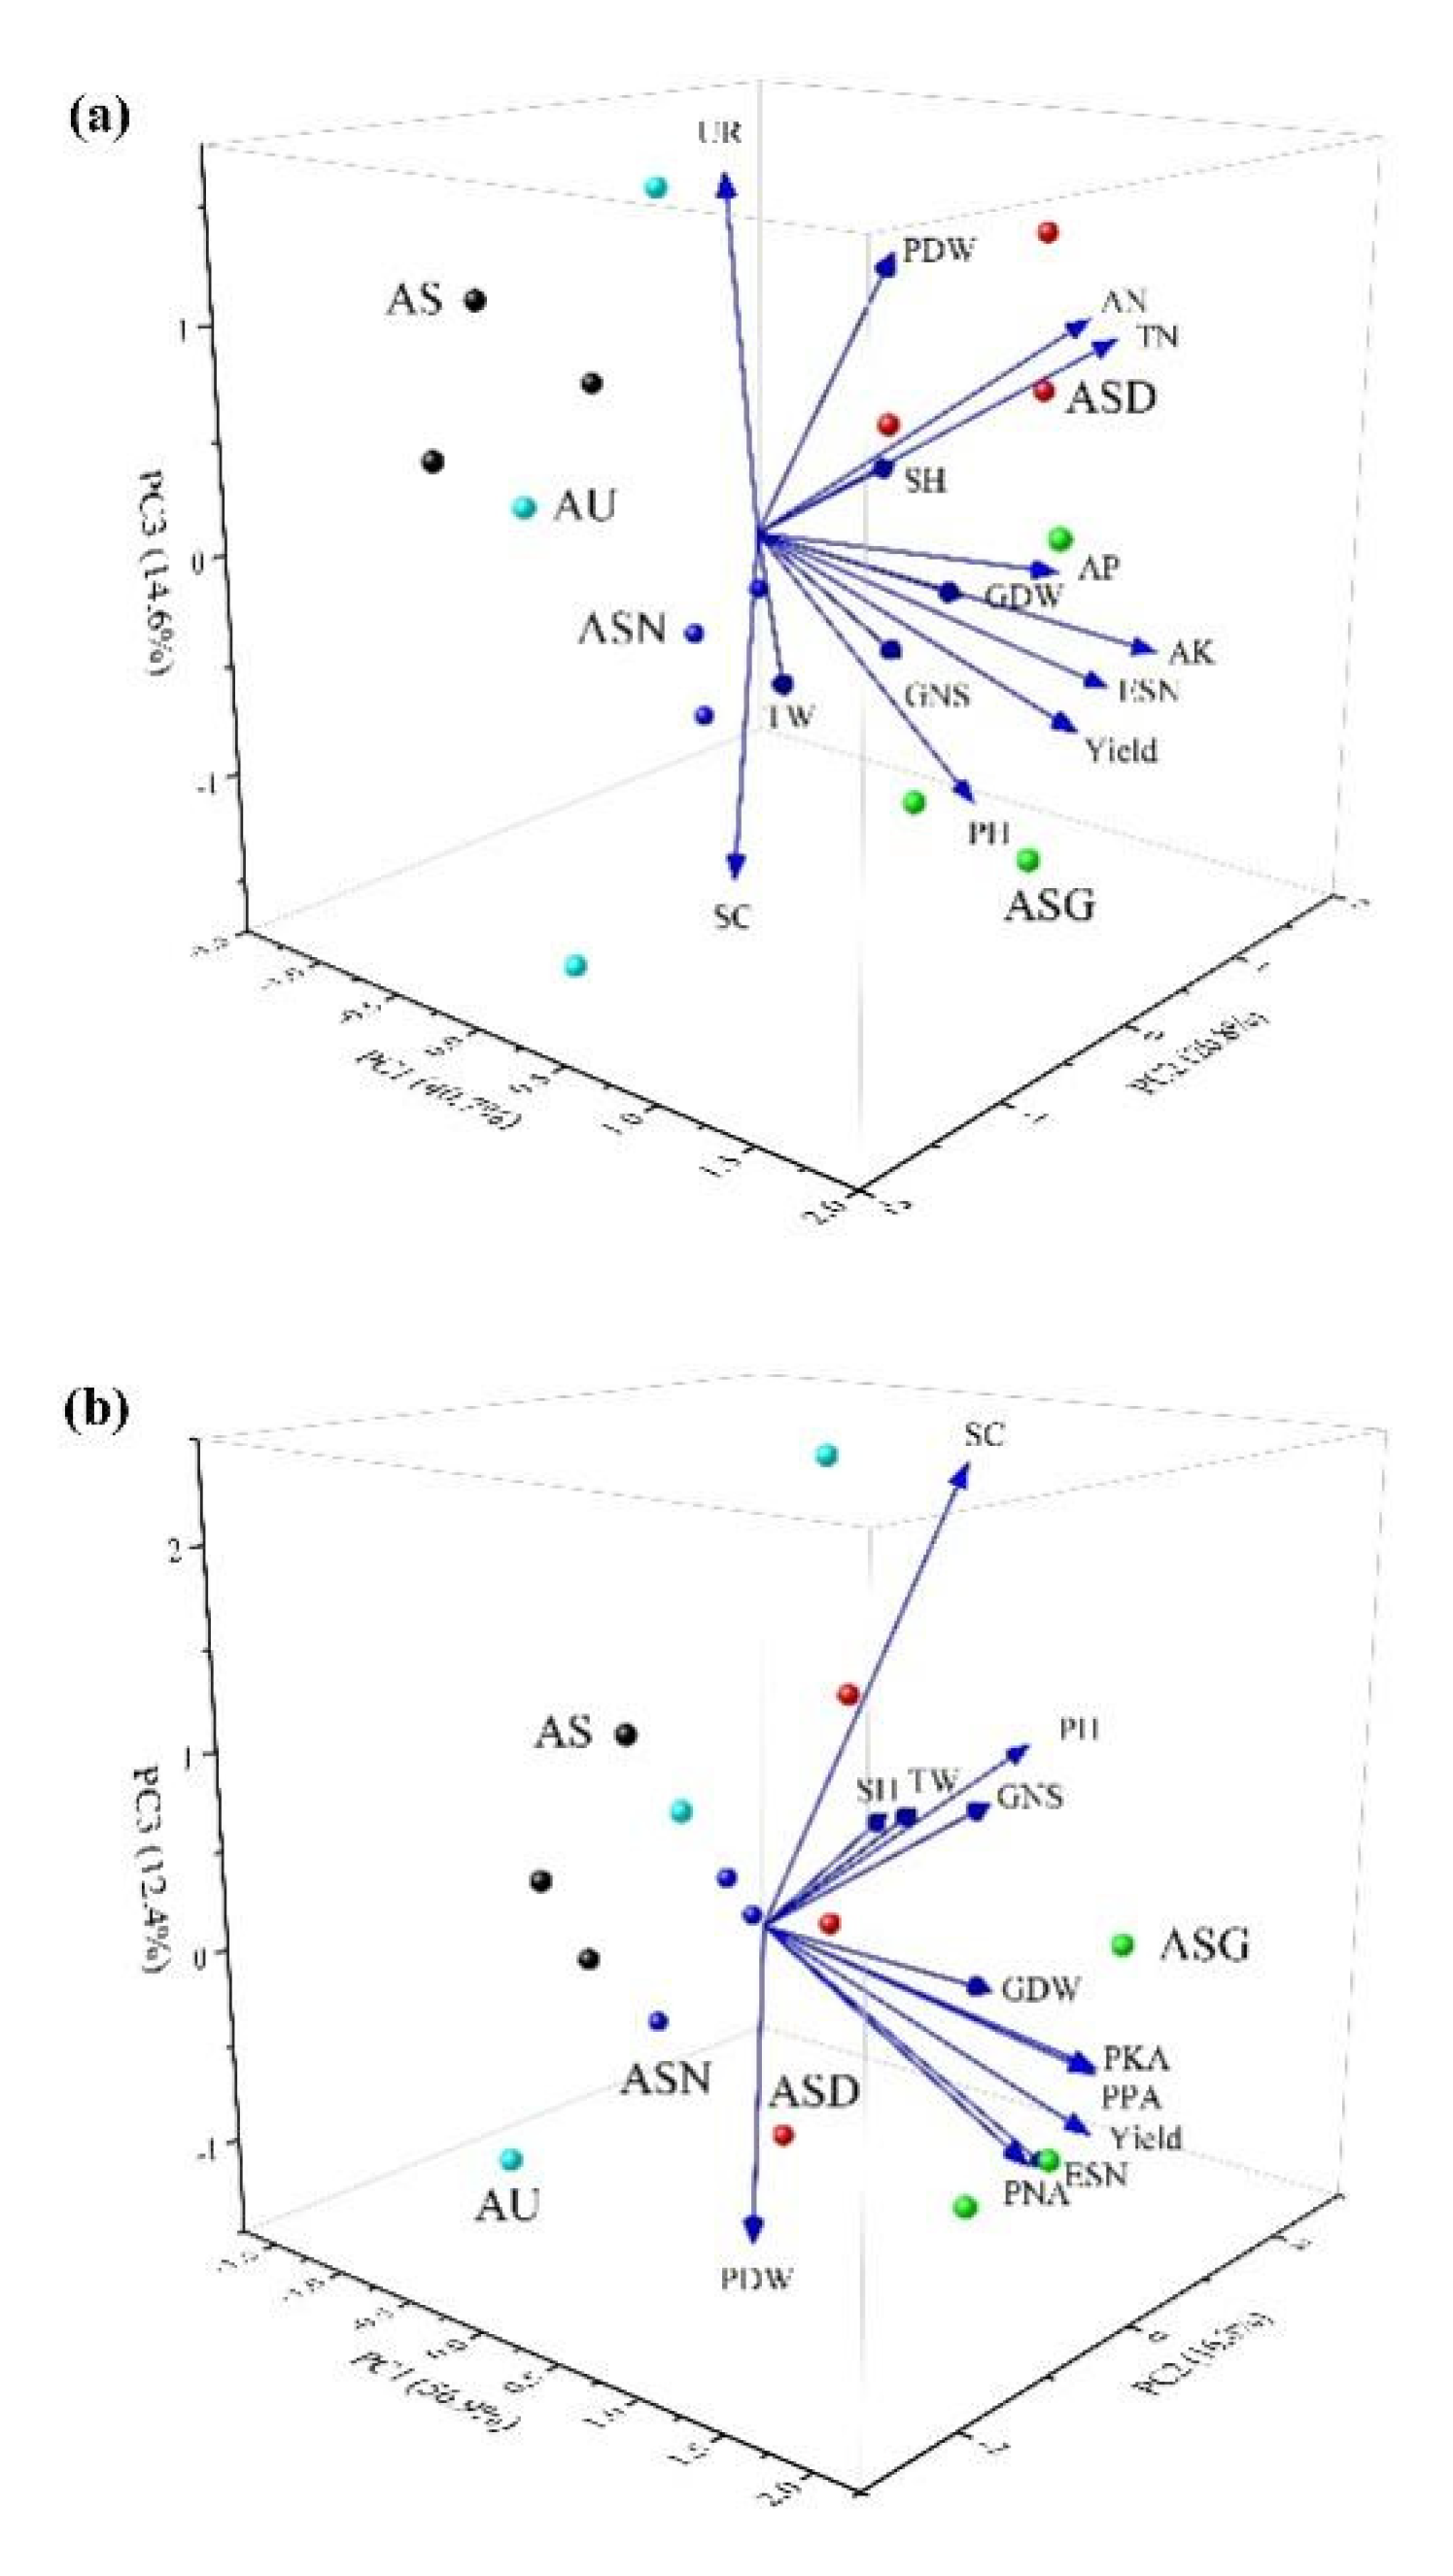
The three principal components PC1, PC3 and PC2 accounted for 76.12% of the 14 indicators to quantify soil nutrient and maize growth status. The soil nutrient and maize growth conditions were better under the coating treatment, which were the best under ASG treatment, and the worst under AS treatment. Urease activity was moderately correlated with 1000-grain weight, TN and grain number per spike, while AK was strongly correlated with grain number per spike, and AP was weakly correlated with plant height, effective spike number and yield (Figure 9a).
The three principal components PC1, PC3 and PC2 explained 86.14% of the 12 indicators to quantify plant nutrient and maize growth status. Typically, the coating treatment achieved a good effect on plant nutrients and maize growth. ASG treatment led to the best plant nutrient and growth status, while AS treatment induced the worst effect. Plant nutrients were correlated with maize biomass, and strongly correlated with maize yield (Figure 9b).

4. Discussion

4.1. Ammonium Sulfate Coupled with Aids Could Inhibit Nitrogen Leaching to Deeper Soil Layer

The initial leaching rate of total nitrogen and ammonium nitrogen from ammonium sulfate fertilizer was significantly lower compared to urea, while the cumulative leaching rate of total nitrogen and ammonium nitrogen during the entire leaching period was also significantly lower than that of urea. This discrepancy can be attributed to the fact that urea is an organic nitrogen fertilizer containing amide nitrogen, which differs from rapidly available nitrogen fertilizers like ammonium sulfate [23]. In soil, urease hydrolysis initially forms ammonium nitrogen when soil pores are saturated with water, leading to reduced adsorption sites for ammonium ions and subsequent leaching with water. Furthermore, this study revealed a higher cumulative leaching rate of nitrate nitrogen in ordinary ammonium sulfate fertilizers compared to urea. This observation may be explained by the predominance of ammonium nitrogen as the main form of leached nitrate in urea-treated soils resulting in lower levels of nitrification substrate compared to ordinary ammonium sulfate treatments. The application of a nitrification inhibitor effectively suppresses the conversion of nitrate nitrogen to ammonium nitrogen, thereby prolonging the retention time of ammonium nitrogen in the soil and reducing the content of nitrate nitrogen. Consequently, it mitigates the leaching of nitrate nitrogen [24]. In addition, the acidic nature of ammonium sulfate fertilizer can lead to a decrease in soil pH upon its application, which subsequently affects the activity of enzymes involved in nitrification and slows down this process. Moreover, humic acid possesses a significant specific surface area that facilitates nitrogen adsorption, thereby increasing the adsorption sites for ammonium nitrogen within the soil [25]. Additionally, humic acid contains various functional groups such as phenolic hydroxyl and carboxylic groups that can form stable complexes with ammonium ions known as ammonium humate. As a result, humic acid enhances soil fixation capacity for ammonium nitrogen and reduces nitrate formation. Furthermore, due to the presence of a greasy film layer on its surface, ammonium sulfate effectively prevents direct contact between itself and the soil matrix. This barrier effect helps avoid rapid fertilizer release and subsequent loss of nitrogen through leaching.

4.2. Oil-Coated Ammonium Sulfate Improved Maize Yield Due to Higher Effective Spike Number

Three types of slow-/controlled-release fertilizers have been identified [26,27]. The first type comprises chemically synthetic sustained-release fertilizers, while the second type consists of stable fertilizers [28,29,30]. For instance, in this study, ammonium sulfate was combined with nitrification inhibitors to impede the transformation of ammonium nitrogen into nitrate nitrogen by inhibiting the activities of nitrification bacteria during the reaction process after fertilizer application to soil. This approach enhances the efficiency of ammonium sulfate fertilizer, reduces leaching loss and denitrification loss [31,32]. The third type encompasses coated controlled-release fertilizers such as grease-coating ammonium sulfate and oil-humic acid-coating ammonium sulfate used in this study [33]. These coatings release nutrients based on crop-specific fertilizer characteristics during different growth stages, thereby improving nutrient uptake and utilization efficiency for crops [33,34].
The coating treatment in this study enhanced the accumulation of nitrogen, phosphorus, and potassium within above-ground plants as well as maize growth and development. Moreover, the oil-coated treatment exhibited a superior promoting effect compared to the oil-humic acid coated treatment. This can be attributed to the fact that ammonium sulfate is classified as a physiological acid fertilizer, while humic acid also possesses acidic properties. Properly adjusting the pH of calcareous cinnamon soil can facilitate plant nutrient accumulation and maize growth; however, excessive reduction may impede these processes [35]. The oil-humic acid coating treatment did not show significant differences from conventional urea treatment, whereas combining ammonium sulfate with a nitrification inhibitor resulted in the least favorable outcome. This could be due to an imbalance between soil nitrogen release in ammonium sulfate with nitrifying inhibitors and nitrogen absorption by plants.
As demonstrated by a three-year field experiment, the application of slow-release fertilizer significantly increased the 1000-grain weight, grain number per spike, and yield of two varieties of spring maize compared to conventional fertilization. Specifically, the yields of SY30 and JY877 varieties increased by 8.1% and 6.2%, respectively [36]. According to Zhao et al [37], sulfur-coating nitrogen fertilizer or resin-coating nitrogen fertilizer resulted in separate yield increases of maize by 10.04% and 9.68%, respectively, compared to ordinary nitrogen fertilizer. Similarly, Sun et al [38] reported that slow-release urea improved rice yields by 15% and 11% under non-flooding plastic film mulching and traditional flooded rice cultivation methods when compared to conventional urea application practices. Furthermore, in a five-year field experiment conducted by Sun et al [38], controlled-release fertilizer combined with straw application led to an apparent increase in rice yield ranging from 6.8% to18.2% relative to conventional fertilization methods involving straw application [39]. In this study, maize yields showed significant improvements ranging from 43.21 % to 51.10% under oil-coating treatment as well as 11.63% to 17.7% under oil-humic acid coating treatment when compared with non-sustained release treatment conditions. Thus, the coating treatments effectively enhanced the slow-/controlled-release properties of ammonium sulfate while promoting maize yield improvement. Typically, the oil-coated ammonium sulfate exhibited superior slow-/controlled-release characteristics for nutrients resulting in improved maize yields.

4.3. Oil-Coated Ammonium Sulfate Improved Fertilizer Utilization

Our findings indicate that slow-/controlled-release ammonium sulfate fertilizer application during the shooting stage resulted in higher total nitrogen and alkali-hydrolyzed nitrogen contents in soil compared to non-slow-/controlled-release processing. Furthermore, combining ammonium sulfate with a nitrification inhibitor led to lower available nutrient contents in soil than coating ammonium sulfate treatment. This can be attributed to the fact that ammonium sulfate is an ammonium nitrogen fertilizer applied as NH4+-N, while the nitrification inhibitor effectively inhibits NH4+-N transformation into NO3-N, resulting in higher soil nitrogen supply during the seedling stage than maize's demand for nitrogen, leading to insufficient nitrogen supply for maize later on. In contrast, urea functions as an amide nitrogen fertilizer with only a minor fraction being directly absorbed by plants upon soil application. The majority of urea undergoes conversion into ammonium nitrogen facilitated by soil enzymes [40,41], leading to subsequent release of soil nitrogen following treatment with urea combined with a nitrification inhibitor, which aligns with the pattern of maize nitrogen uptake. Consequently, the combination of urea and nitrification inhibitor exhibits superior efficacy on crops compared to ammonium sulfate, while the effect of ammonium sulfate combined with nitrification inhibitor treatment is weaker than that achieved through coating treatment. Meta-analysis conducted by Zhao et al [42] revealed that humic acid application improves soil conditions, activates phosphorus and potassium nutrients in the soil, regulates nitrogen transformation, and enhances soil nitrogen content [43], corroborating our findings in this study. According to our results, the oil-humic acid-coating ammonium sulfate treatment yields better soil conditions compared to the oil-coating treatment.
Efficiency of fertilizers is considered a crucial criterion for sustainable agricultural development and environmental sustainability. Conventional fertilizers are associated with several drawbacks, including rapid volatilization, easy absorption and fixation by soil, and various pathways for nutrient loss. In contrast, slow-/controlled-release fertilizers effectively enhance fertilizer utilization efficiency while reducing nutrient losses [44,45]. As reported by Li et al [46,47], stable nitrogen fertilizer application rates were reduced by 20% compared to conventional urea under conditions of stable or slightly increased maize yield, resulting in improved nitrogen fertilizer utilization rates. Furthermore, Wang et al [48] found that relative to conventional fertilization, the use of slow-release fertilizers with a significant reduction in amount (31%) significantly increased nitrogen and phosphorus utilization rates by 15.8% and 9.6%, respectively. According to our findings, the partial productivity of nitrogen, phosphorus, and potassium fertilizers increased significantly under the coating treatment compared to conventional fertilizers. Furthermore, the oil-coating ammonium sulfate treatment exhibited a remarkable increase in partial productivity compared to the oil-humic acid-coating ammonium sulfate treatment. Additionally, the grain nitrogen, phosphorus, and potassium balance noticeably improved under the oil-coating treatment compared to other treatments. Conversely, under the oil-humic acid-coating treatment, there was an elevation in grain nitrogen and phosphorus balance relative to conventional ammonium sulfate treatment but no significant difference when compared with conventional urea treatment.

5. Conclusion

Under equivalent nitrogen content conditions, the soil's availability of nutrients, above-ground plant nutrient accumulation, growth status, and maize yield were significantly enhanced by the coating treatments compared to conventional fertilization. The oil coating treatment resulted in a remarkable increase in maize yield ranging from 43.21% to 51.10%, while the oil-humic acid-coating treatment led to an elevation of 11.63% to 17.77%. Path analysis revealed that dry grain weight, spike length, 1000-grain weight, effective spike number, and grain number per spike directly influenced maize yield. Principal component analysis indicated that ASD treatment optimized both soil and plant nutrient conditions, whereas ASG treatment optimized plant nutrients and maize growth conditions as well as soil nutrients and maize growth conditions. Therefore, considering equivalent nitrogen content along with comprehensive evaluation of soil nutrients, plant nutrient accumulation, maize growth status, yield potentiality and fertilizer utilization efficiency; It can be concluded that the slow-release effect of oil-coating ammonium sulfate exhibits optimal performance for enhancing production and efficiency.

Acknowledgments

This research was supported by the Shanxi Provincial Key R&D Program (201803D221003-2), the Shanxi Provincial Postgraduate Innovation Project (2021Y338) and the National Natural Science Foundation of China (32372819).

Declaration of competing interest

The authors declare that they have no conflict of interest.

References

  1. Zhang W S, Liang Z Y, He X M, Wang X Z, Shi X J, Zou C Q, Chen X P. The effects of controlled release urea on maize productivity and reactive nitrogen losses: a meta-analysis. Environment Pollution 2019, 246, 559–565. [Google Scholar] [CrossRef] [PubMed]
  2. Guo J J, Fan J L, Zhang F C, Yan S C, Zheng J, Wu Y, Li J, Wang Y l, Sun X, Liu X Q, Xiang Y Z, Li Z J. Blending urea and slow-release nitrogen fertilizer increases dry-land maize yield and nitrogen use efficiency while mitigating ammonia volatilization. Science of the Total Environment 2021, 790, 148058. [Google Scholar] [CrossRef] [PubMed]
  3. Grant C A, Wu R. , Selles F, Harker K N, Clayton G W, Bittman S, Zebarth B J, Lupwayi N Z. Crop yield and nitrogen concentration with controlled release urea and split applications of nitrogen as compared to non-coated urea applied at seeding. Field Crop Research 2012, 127, 170–180. [Google Scholar] [CrossRef]
  4. Vo P T, Nguyen H T, Trinh H T, Nguyen V M, Le A T, Huy T Q, Nguyen T T. The nitrogen slow-release fertilizer based on urea incorporating chitosan and poly (vinyl alcohol) blend. Environmental Technology & Innovation 2021, 22, 101528. [Google Scholar]
  5. Azeem B, KuShaari K, Man Z B, Basit A, Thanh T H. Review on materials & methods to produce controlled release coated urea fertilizer. Control Release 2014, 181, 11–21. [Google Scholar]
  6. Timilsena Y P, Adhikari R. , Casey P, Muster T, Adhikari B. Enhanced efficiency fertilisers: a review of formulation and nutrient release patterns. Journal of the Science of Food & Agriculture 2015, 95, 1131–1142. [Google Scholar]
  7. Yang Y, Ni X, Zhou Z, Yu L, Liu B, Yang Y, Wu Y. Performance of matrix-based slow-release urea in reducing nitrogen loss and improving maize yields and profits. Field crops research 2017, 212, 73–81. [Google Scholar] [CrossRef]
  8. Guan Y, Song C, Gan Y, Li F M. Increased maize yield using slow-release attapulgite-coated fertilizers. Agronomy for sustainable development 2014, 34, 657–665. [Google Scholar] [CrossRef]
  9. Ma Q, Wang X, Li H, Li H, Cheng L, Cheng L, Zhang F, Shen J. Localized application of NH4+-N plus P enhances zinc and iron accumulation in maize via modifying root traits and rhizosphere processes. Field Crops Research 2014, 164, 107–116. [Google Scholar] [CrossRef]
  10. Chien S H, Gearhart M M, Villagarcía S. Comparison of ammonium sulfate with other nitrogen and sulfur fertilizers in increasing crop production and minimizing environmental impact: A Review. Soil Science 2011, 176, 327–335. [Google Scholar] [CrossRef]
  11. Alam T, Suryanto P, Kastono D, Putra E T S, Handayani S, Widyawan M H, Muttaqin A S, Kurniasih B. Interactions of biochar briquette with ammonium sulfate fertilizer for controlled nitrogen loss in soybean intercopping with Melaleuca cajuputi. Legume Research, 2021. [CrossRef]
  12. Casteel S N, Chien S H, Gearhart M M. Field evaluation of ammonium sulfate versus two fertilizer products containing ammonium sulfate and elemental sulfur on soybeans. Communications in Soil Science and Plant Analysis 2019, 50, 2941–2947. [Google Scholar] [CrossRef]
  13. Hailegnaw N S, Mercl F, Kulhánek M, Száková J, Tlustoš P. Co-application of high temperature biochar with 3,4-dimethylpyrazole-phosphate treated ammonium sulphate improves nitrogen use efficiency in maize. Scientific Reports 2021, 11, 1–13. [Google Scholar]
  14. Ai Y C, Zhang Y C, Ning Y W. Prospect of agricultural application of ammonium sulfate as by-product of ammonia desulfurization. Jiangsu Agricultural Science 2018, 46, 308–313 (In Chinese). (In Chinese) [Google Scholar]
  15. Fu L H, Liu A H. China Statistical Yearbook. National Bureau of Statistics 2021, 385-414. (In Chinese).
  16. Carlos S S, Rosa E, Kaseker J F, Sokal T F, Nohatto M A. Maize productivity as a result of application of controlled and slow release urea. Revista Brasileira de Milho e Sorgo 2020, 19, e1116. [Google Scholar]
  17. Khan A Z, Afzal M, Muhammad A, Akbar H, Amin N. Influence of slow release urea fertilizer on growth, yield and n uptake on maize under calcareous soil conditions. Pure & Applied Biology 2015, 4, 70–79. [Google Scholar]
  18. Campos O R, Mattiello E M, Cantarutti R B, Vergutz L. Nitrogen release from urea with different coatings or urease inhibitor. Journal of the Science of Food & Agriculture 2018, 98, 775–780. [Google Scholar]
  19. Bao S, D. 2016. Methods of agricultural chemical analysis of soil. Beijing: China Agricultural Science and Technology Press. (In Chinese).
  20. Guo Z, P. 1986. Quantitative characters genetic analysis. Beijing: Beijing Normal University Publishing House. (In Chinese).
  21. Tales T, Murilo V G M, Vítor G A, Magno B A, Cimélio B. Assessing linkage between soil phosphorus forms in contrasting tillage systems by path analysis. Soil & Tillage Research 2018, 175, 276–280. [Google Scholar]
  22. Luciano C G, Djalma E S, Tales T, Murilo G V, Danilo R S, João K, Gustavo B. Plant uptake of legacy phosphorus from soils without P fertilization. Nutrient Cycling in Agroecosystems 2021, 119, 139–151. [Google Scholar] [CrossRef]
  23. Gao Y X, Xue S, Liu K X, et al. Mixture of controlled-release and conventional urea fertilizer application changed soil aggregate stability, soil humic acid molecular composition, and nitrogen uptake. Science of The Total Environment 2021, 789, 147778. [Google Scholar] [CrossRef]
  24. Meng X T, Li Y Y, Yao H Y, Wang J, Dai F, Wu Y P, Chapman S. Nitrification and urease inhibitors improve rice nitrogen uptake and prevent denitrification in alkaline paddy soil. Applied Soil Ecology 2020, 154, 103665. [Google Scholar] [CrossRef]
  25. 25. Said-Pullicino D, Cucu M A, Sodano M, Birk J J, Glaser B, Celi L. Nitrogen immobilization in paddy soils as affected by redox conditions and rice straw incorporation. Geoderma, 2014, 228-229, 44-53.
  26. Shaviv, A. Controlled release fertilizers. 2005. Germany: Frankfurt.
  27. Wu Z J, Chen L J. 2003. Slow release/controlled release fertilizers: Principles and applications. Beijing: Science Press. (In Chinese).
  28. Hou J, Dong Y, Fan Z. Effects of coated urea amended with biological inhibitors on physiological characteristics, yield, and quality of peanut. Communications in soil science and plant analysis 2014, 45, 896–911. [Google Scholar] [CrossRef]
  29. Farmaha B, S. Evaluating Animo model for predicting nitrogen leaching in rice and wheat. Arid Land Research and Management 2014, 28, 25–35. [Google Scholar] [CrossRef]
  30. Li X, Zhang G, Xu H, Cai Z, Yagi K. Effect of timing of joint application of hydroquinone and dicyandiamide on nitrous oxide emission from irrigated lowland rice paddy field. Chemosphere 2009, 75, 1417–1422. [Google Scholar] [CrossRef] [PubMed]
  31. Gu Z, Xie Y, Gao Y, Ren X, Cheng C, Wang S. Quantitative assessment of soil productivity and predicted impacts of water erosion in the black soil region of northeastern China. Science of the total environment 2018, 637, 706–716. [Google Scholar]
  32. Zhu Q, Liu X, Hao T, Zeng M, Shen J, Zhang F, De V W. Modeling soil acidification in typical Chinese cropping systems. Science of the Total environment 2018, 613, 1339–1348. [Google Scholar]
  33. Fujinuma R, Balster N J, Norman J M. An Improved Model of Nitrogen Release for Surface-applied Controlled-release Fertilizer. Soil Science Society of America Journal 2009, 73, 2043–2050. [Google Scholar] [CrossRef]
  34. Incrocci L, Maggini R, Cei T, Carmassi G, Botrini L, Filippi F, Clemens R, Terrones C, Pardossi A. Innovative controlled-release polyurethane-coated urea could reduce N leaching in tomato crop in comparison to conventional and stabilized fertilizers. Agronomy 2020, 10, 1827. [Google Scholar] [CrossRef]
  35. Kiran J K, Khanif Y M, Amminuddin H, Anuar A R. Effects of controlled release urea on the yield and nitrogen nutrition of flooded rice. Communications in soil science and plant analysis 2010, 41, 811–819. [Google Scholar] [CrossRef]
  36. Li G H, Fu P X, Cheng G G, Lu W P, Lu D L. Delaying application time of slow-release fertilizer increases soil rhizosphere nitrogen content, root activity, and grain yield of spring maize. The Crop Journal 2022, 6, 1798–1806. [Google Scholar]
  37. Zhao B, Dong S, Zhang J, Liu P. Effects of controlled-release fertiliser on nitrogen use efficiency in summer maize. PloS one 2013, 8, e70569. [Google Scholar]
  38. Sun Y, Mi W, Su L, Shan Y, Wu L. Controlled-release fertilizer enhances rice grain yield and N recovery efficiency in continuous non-flooding plastic film mulching cultivation system. Field Crops Research 2019, 231, 122–129. [Google Scholar] [CrossRef]
  39. Sun H, Zhou S, Zhang J, Zhang X, Wang C. Effects of controlled-release fertilizer on rice grain yield, nitrogen use efficiency, and greenhouse gas emissions in a paddy field with straw incorporation. Field Crops Research 2020, 253, 107814. [Google Scholar] [CrossRef]
  40. Palanivell P, Ahmed O H, Susilawati K, Ab Majid N M. Mitigating ammonia volatilization from urea in waterlogged condition using clinoptilolite zeolite. International Journal of Agriculture and Biology 2015, 17, 149–155. [Google Scholar]
  41. Cancellier E L, Silva D R G, Faquin V, Gonçalves B D A, Cancellier L L, Spehar C R. Ammonia volatilization from enhanced-efficiency urea on no-till maize in brazilian cerrado with improved soil fertility. Ciência e Agrotecnologia 2016, 40, 133–144. [Google Scholar] [CrossRef]
  42. Zhao C L, Liu T X, Gao Y X, Chen S G, Li Q Y, Li P P, Ding F J. Effects of Adding Humic Acid on Wheat Yield, Nutrient Uptake and the Soil Properties. Humic Acid 2022, (02), 5-11. (In Chinese).
  43. Nan J, Chen X, Wang X, Lashari M S, Wang Y, Guo Z, Du Z. Effects of applying flue gas desulfurization gypsum and humic acid on soil physicochemical properties and rapeseed yield of a saline-sodic cropland in the eastern coastal area of China. Journal of soils and sediments 2016, 16, 38–50. [Google Scholar] [CrossRef]
  44. Ke J, Xing X, Li G, Ding Y, Dou F, Wang S, Liu Z H, Tang S, Ding C Q, Chen, L. Effects of different controlled-release nitrogen fertilizers on ammonia volatilisation, nitrogen use efficiency and yield of blanket-seedling machine-transplanted rice. Field Crops Research 2017, 205, 147–156. [Google Scholar] [CrossRef]
  45. Li Y F, Fang X L, Liu Y X, Liu P, Liu W J, Wang Y, Chen G H. Characteristics of nutrient accumulation distribution and its correlation with yield components in southern double-season early rice areas under triple maturity pattern. Chinese Journal of Tropical Crops 2022, 1-10. (In Chinese).
  46. Li Q, Yang A, Wang Z, Roelcke M, Chen X, Zhang F, Liu X. Effect of a new urease inhibitor on ammonia volatilization and nitrogen utilization in wheat in north and northwest China. Field Crops Research 2015, 175, 96–105. [Google Scholar] [CrossRef]
  47. Li Q, Cui X, Liu X, Roelcke M, Pasda G, Zerulla W, Wissemeier AH, Chen X, Goulding K, Zhang F. A new urease-inhibiting formulation decreases ammonia volatilization and improves maize nitrogen utilization in North China Plain. Scientific Reports 2017, 7, 43853. [Google Scholar] [CrossRef]
  48. Wang C, Lv J, Coulter J A, Xie J, Yu J, L J, Zhang J, Tang C N, Niu T H, Gan, Y. Slow-release fertilizer improves the growth, quality, and nutrient utilization of wintering Chinese chives (Allium tuberosum Rottler ex Spreng.). Agronomy 2020, 10, 381. [Google Scholar] [CrossRef]
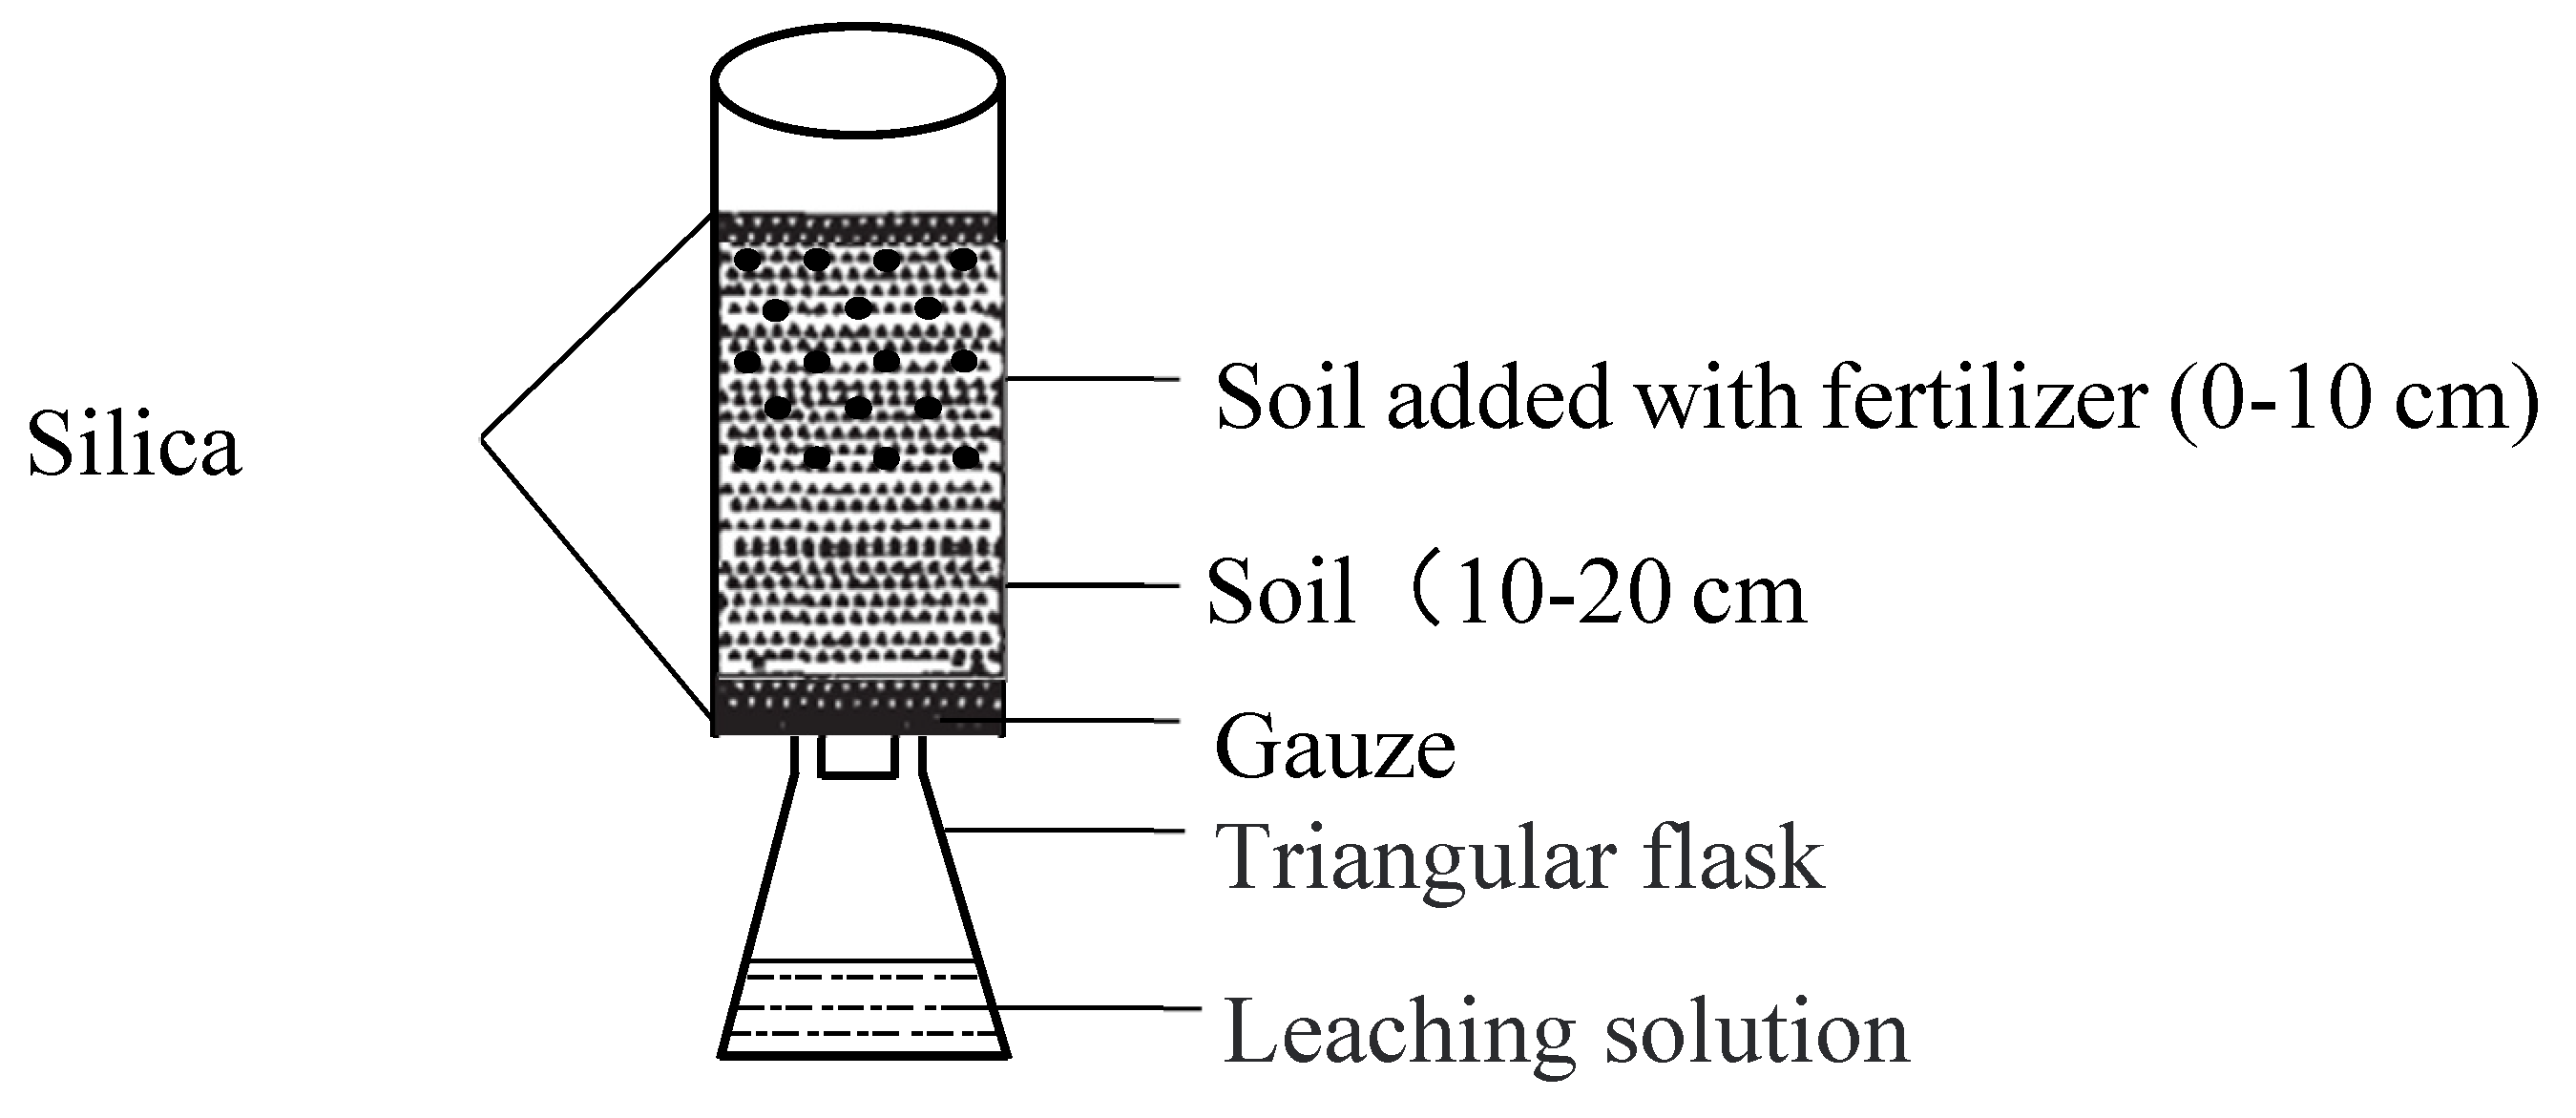
Figure 1. Simulation device.
Preprints 104252 g001
Figure 2. Leaching rate curve of soil N under different fertilization treatments.
Preprints 104252 g002
Figure 3. Soil total nitrogen, ammonium nitrogen, nitrate nitrogen contents of different fertilization treatments in 0-10 and 10-20 cm soil layers. Different lowercases indicate significant differences (P<0.05) within treatments in the 0-10 cm soil layer, different capital letters indicate significant differences (P<0.05) within treatments in the 10-20 cm soil layer, the same as below.
Preprints 104252 g003
Figure 4. Impacts of diverse fertilization treatments on 1000-grain weight (a), effective spike number (b), grain number per spike (c) and yield (d) of maize. Diverse letters stand for significant differences at 0.05 level.
Preprints 104252 g004
Figure 5. Principal component analysis of different slow-/controlled-release sulfuric acid treatments based on maize biomass and yield. PH, plant height; PDW, plant dry weight; GDW, grain dry weight; SC, spike coarse; SL, spike length; TW, 1000-grain weight; ESN, effective spike number; GNS, grain number per spike.
Preprints 104252 g005
Figure 6. Path analysis of influencing factors for maize yield.
Preprints 104252 g006
Figure 7. Impacts of diverse fertilizer treatments on soil total nitrogen (a), urease (b), alkali-hydrolyzed nitrogen (c), plant nitrogen accumulation (d), nitrogen partial factor productivity (e) and grain nitrogen balance (f). Diverse letters stand for significant differences at P<0.05.
Preprints 104252 g007
Figure 8. Principal component analysis of different slow-/controlled-release sulfuric acid treatments based on soil nutrient and plant nutrient accumulation. TN, soil total nitrogen; UR, urease; AN, soil alkaline hydrolyzable nitrogen; AP, soil available phosphorus; AK, soil available potassium; PNA, plant nitrogen accumulation; PPA, plant phosphorus accumulation; PKA, plant potassium accumulation.
Preprints 104252 g008
Figure 9. Principal component analysis of different slow-/controlled-release sulfuric acid treatments based on soil nutrients and biomass (a) and plant nutrients and biomass (b). TN, soil total nitrogen; UR, urease; AN, soil alkali-hydrolyzed nitrogen; AP, soil available phosphorus; AK, soil available potassium; PNA, plant nitrogen accumulation; PPA, plant phosphorus accumulation; PKA, plant potassium accumulation; PH, plant height; PDW, plant dry weight; GDW, grain dry weight; SC, spike coarse; SL, spike length; TW, 1000-grain weight; ESN, effective spike number; GNS, grain number per spike.
Preprints 104252 g009
Table 1. Experimental treatment design.
Treatment Fertilizer types N fertilizer Slow control material P fertilizer K fertilizer
AU Urea Urea+(NH4)2HPO4 / (NH4)2HPO4 KCl
AS Ammonium sulfate Ammonium sulfate+(NH4)2HPO4 / (NH4)2HPO4 KCl
ASN Ammonium sulfate +Nitrification inhibitor Ammonium sulfate+(NH4)2HPO4 Nitrification inhibitor (1% of the pure N content) (NH4)2HPO4 KCl
ASG Oil coated ammonium sulfate Ammonium sulfate+(NH4)2HPO4 Oil coated (9% of AS application) (NH4)2HPO4 KCl
ASD Oil-humic acid coated ammonium sulfate Ammonium sulfate+(NH4)2HPO4 Oil-humic acid coated (0.9% of AS application) (NH4)2HPO4 KCl
Table 2. First-order kinetic equation of cumulative N leaching rate.
Treatments Nt=N0(1-e-kt) R2 Se
CK Nt=0.048(1-e-0.458t) 0.949** 0.071
AU Nt=0.830(1-e-1.188t) 0.954** 0.210
AS Nt=0.646(1-e-0.176t) 0.984** 0.024
ASN Nt=0.851(1-e-0.049t) 0.999** 0.006
ASG Nt=1.800(1-e-0.017t) 0.999** 0.004
ASD Nt=0.783(1-e-0.065t) 0.997** 0.010
Note: ** indicates significant at 0.01 level.
Table 3. Effects of different fertilization treatments on the maize growth parameters.
Treatment Plant height
(cm)
Plant dry
weight (g)
Grain dry
weight (g/spike)
Spike coarse
(cm)
Spike length
(cm)
AU 260.67±12.77ab 333.93±35.49a 204.71±9.28b 16.27±0.12b 21.11±0.51b
AS 245.00±7.64b 327.24±13.10ab 202.61±8.07b 16.18±0.10ab 21.08±0.32b
ASN 268.33±8.33ab 259.13±3.14b 180.36±6.04c 15.91±0.10c 19.81±0.29c
ASG 269.67±12.35ab 363.50±25.14a 231.28±4.71a 16.75±0.10a 22.27±0.16a
ASD 279.67±2.91a 330.59±18.23ab 205.50±6.96b 16.20±0.10ab 21.45±0.27ab
Note: Diverse letters after values within one column stand for significant differences at 0.05 level.
Table 4. Impacts of diverse fertilizer treatments on soil available P(K), plant P(K) accumulation, P(K) partial factor productivity and grain P(K) balance.
Index Treatment
AU AS ASN ASG ASD
Available P in Soil (mg·kg-1) 5.55±0.28a 2.41±0.22b 3.43±0.76b 5.76±0.49a 5.62±0.51a
Available K in Soil (mg·kg-1) 99.04±0.41cd 90.03±1.53d 107.04±2.08c 140.05±2.00a 120.04±3.61b
P accumulation in Plant (kg·hm-2) 60.80±4.37bc 49.65±3.72c 58.43±3.20bc 90.05±7.24a 65.91±3.91b
K accumulation in Plant (kg·hm-2) 19.80±1.25b 14.82±0.91c 16.84±1.10c 34.24±0.57a 21.21±0.61b
P partial factor productivity (kg·kg-1) 88.06±2.70c 83.46±0.87c 86.22±3.77c 126.11±3.06a 98.29±1.00b
K partial factor productivity (kg·kg-1) 0.27±0.02b 0.21±0.02b 0.28±0.02b 0.41±0.05a 0.29±0.02b
Grain P balance (kg·kg-1) 132.08±4.05c 125.19±1.30c 129.33±3.26c 189.16±4.59a 147.4±1.49b
Grain K balance (kg·kg-1) 0.046±0.005a 0.027±0.003b 0.012±0.000c 0.053±0.001a 0.023±0.000b
Note: Diverse letters after values within one column stand for significant differences at P<0.05.
Disclaimer/Publisher’s Note: The statements, opinions and data contained in all publications are solely those of the individual author(s) and contributor(s) and not of MDPI and/or the editor(s). MDPI and/or the editor(s) disclaim responsibility for any injury to people or property resulting from any ideas, methods, instructions or products referred to in the content.
Copyright: This open access article is published under a Creative Commons CC BY 4.0 license, which permit the free download, distribution, and reuse, provided that the author and preprint are cited in any reuse.
Prerpints.org logo

Preprints.org is a free preprint server supported by MDPI in Basel, Switzerland.

Subscribe

© 2024 MDPI (Basel, Switzerland) unless otherwise stated