Submitted:
17 April 2024
Posted:
18 April 2024
You are already at the latest version
Abstract
Keywords:
1. Introduction
2. Results
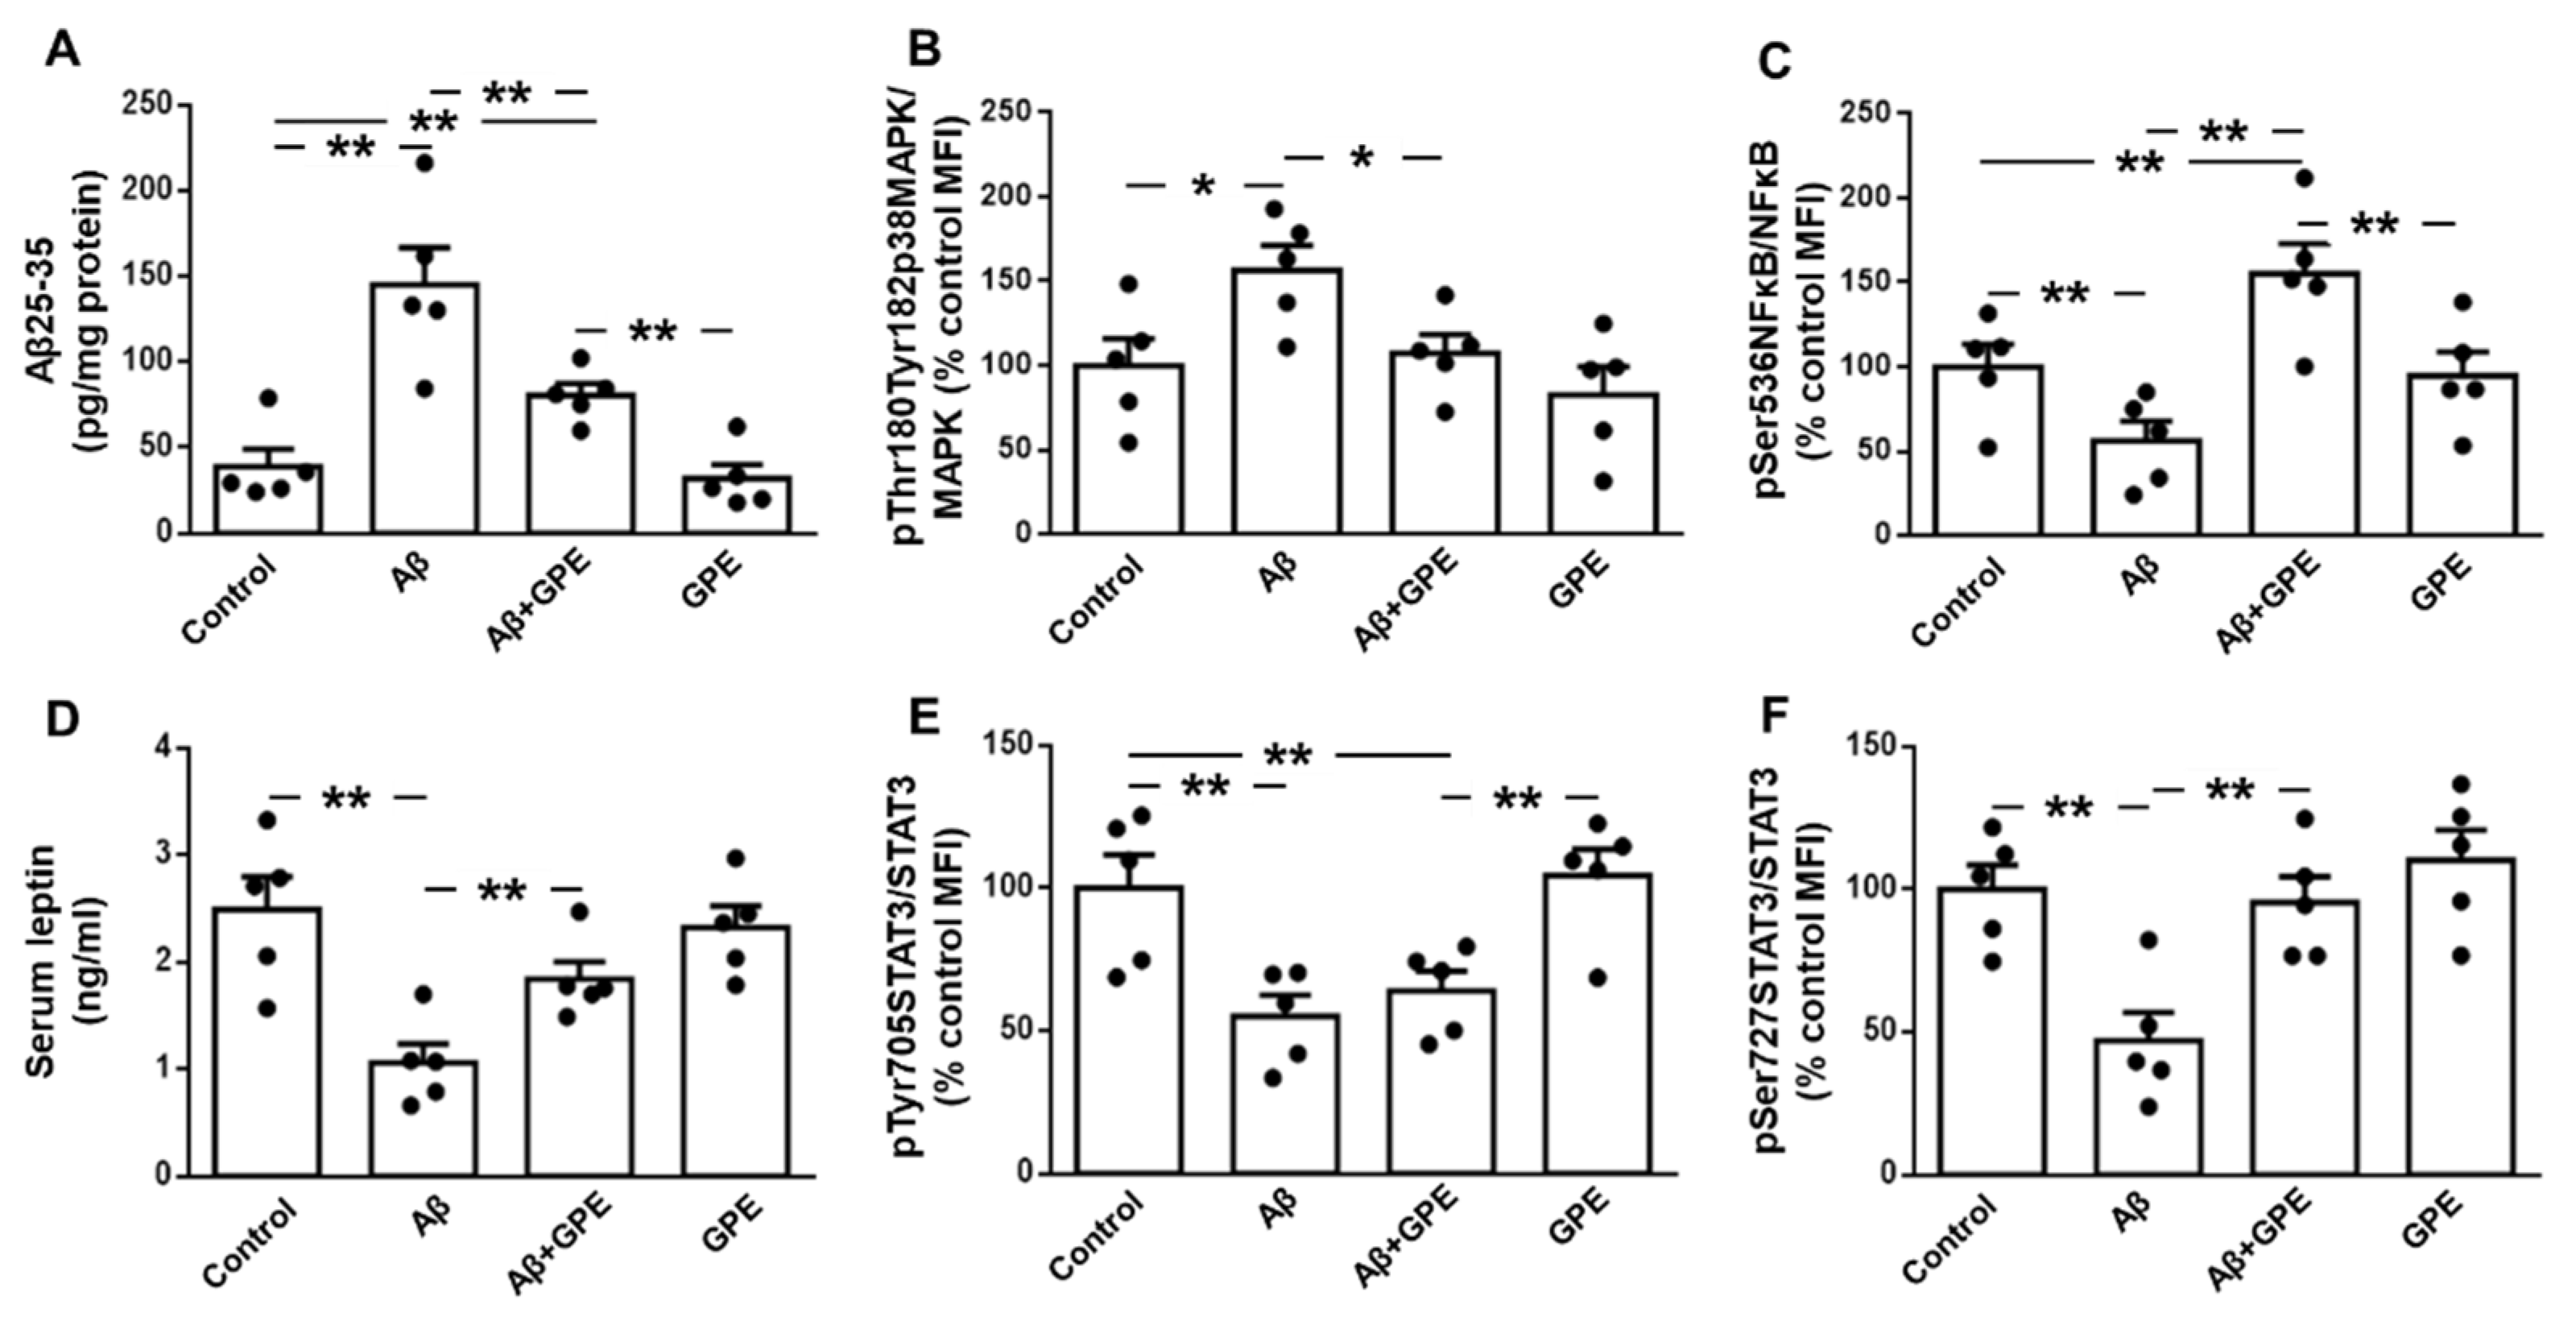
2.1. GPE Reduces Hippocampal Aβ25-35 Levels and Activation of Inflammatory Pathways After Aβ25-35 Infusion
2.2. GPE Partially Counteracts the Inhibitory Effects of Aβ25-35 on the Activation of Leptin Signaling
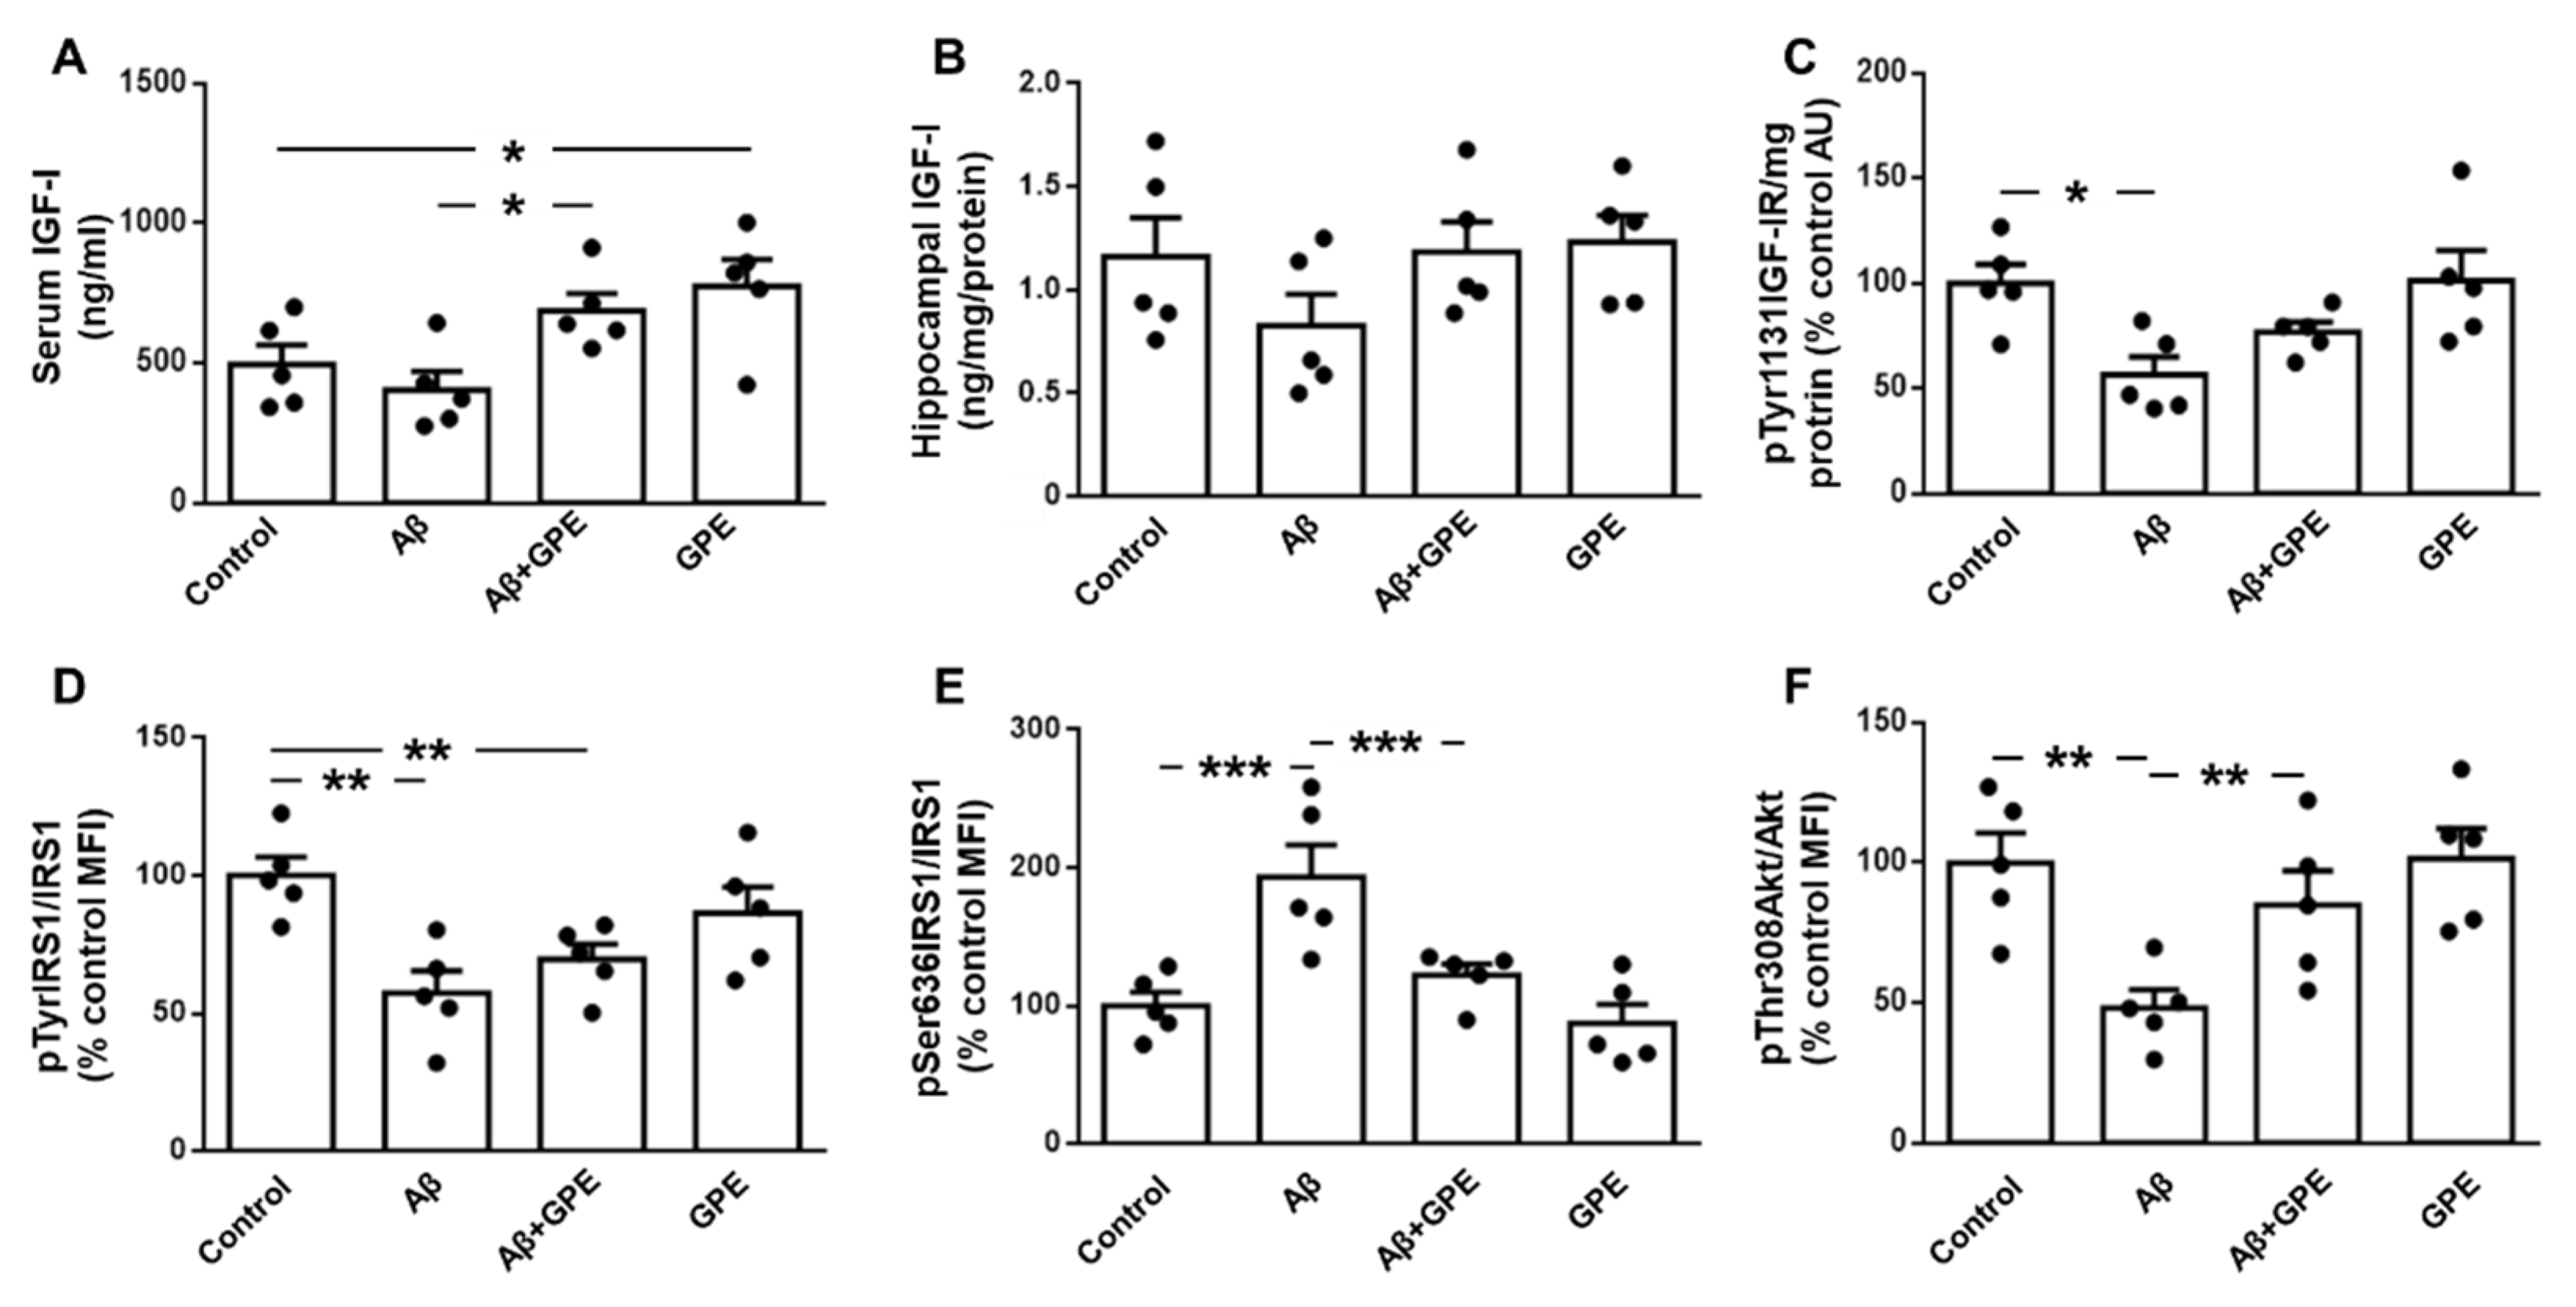
2.3. Aβ25-35-Induced Downregulation of IGF-I-Related Signalling is Prevented by GPE Treatment
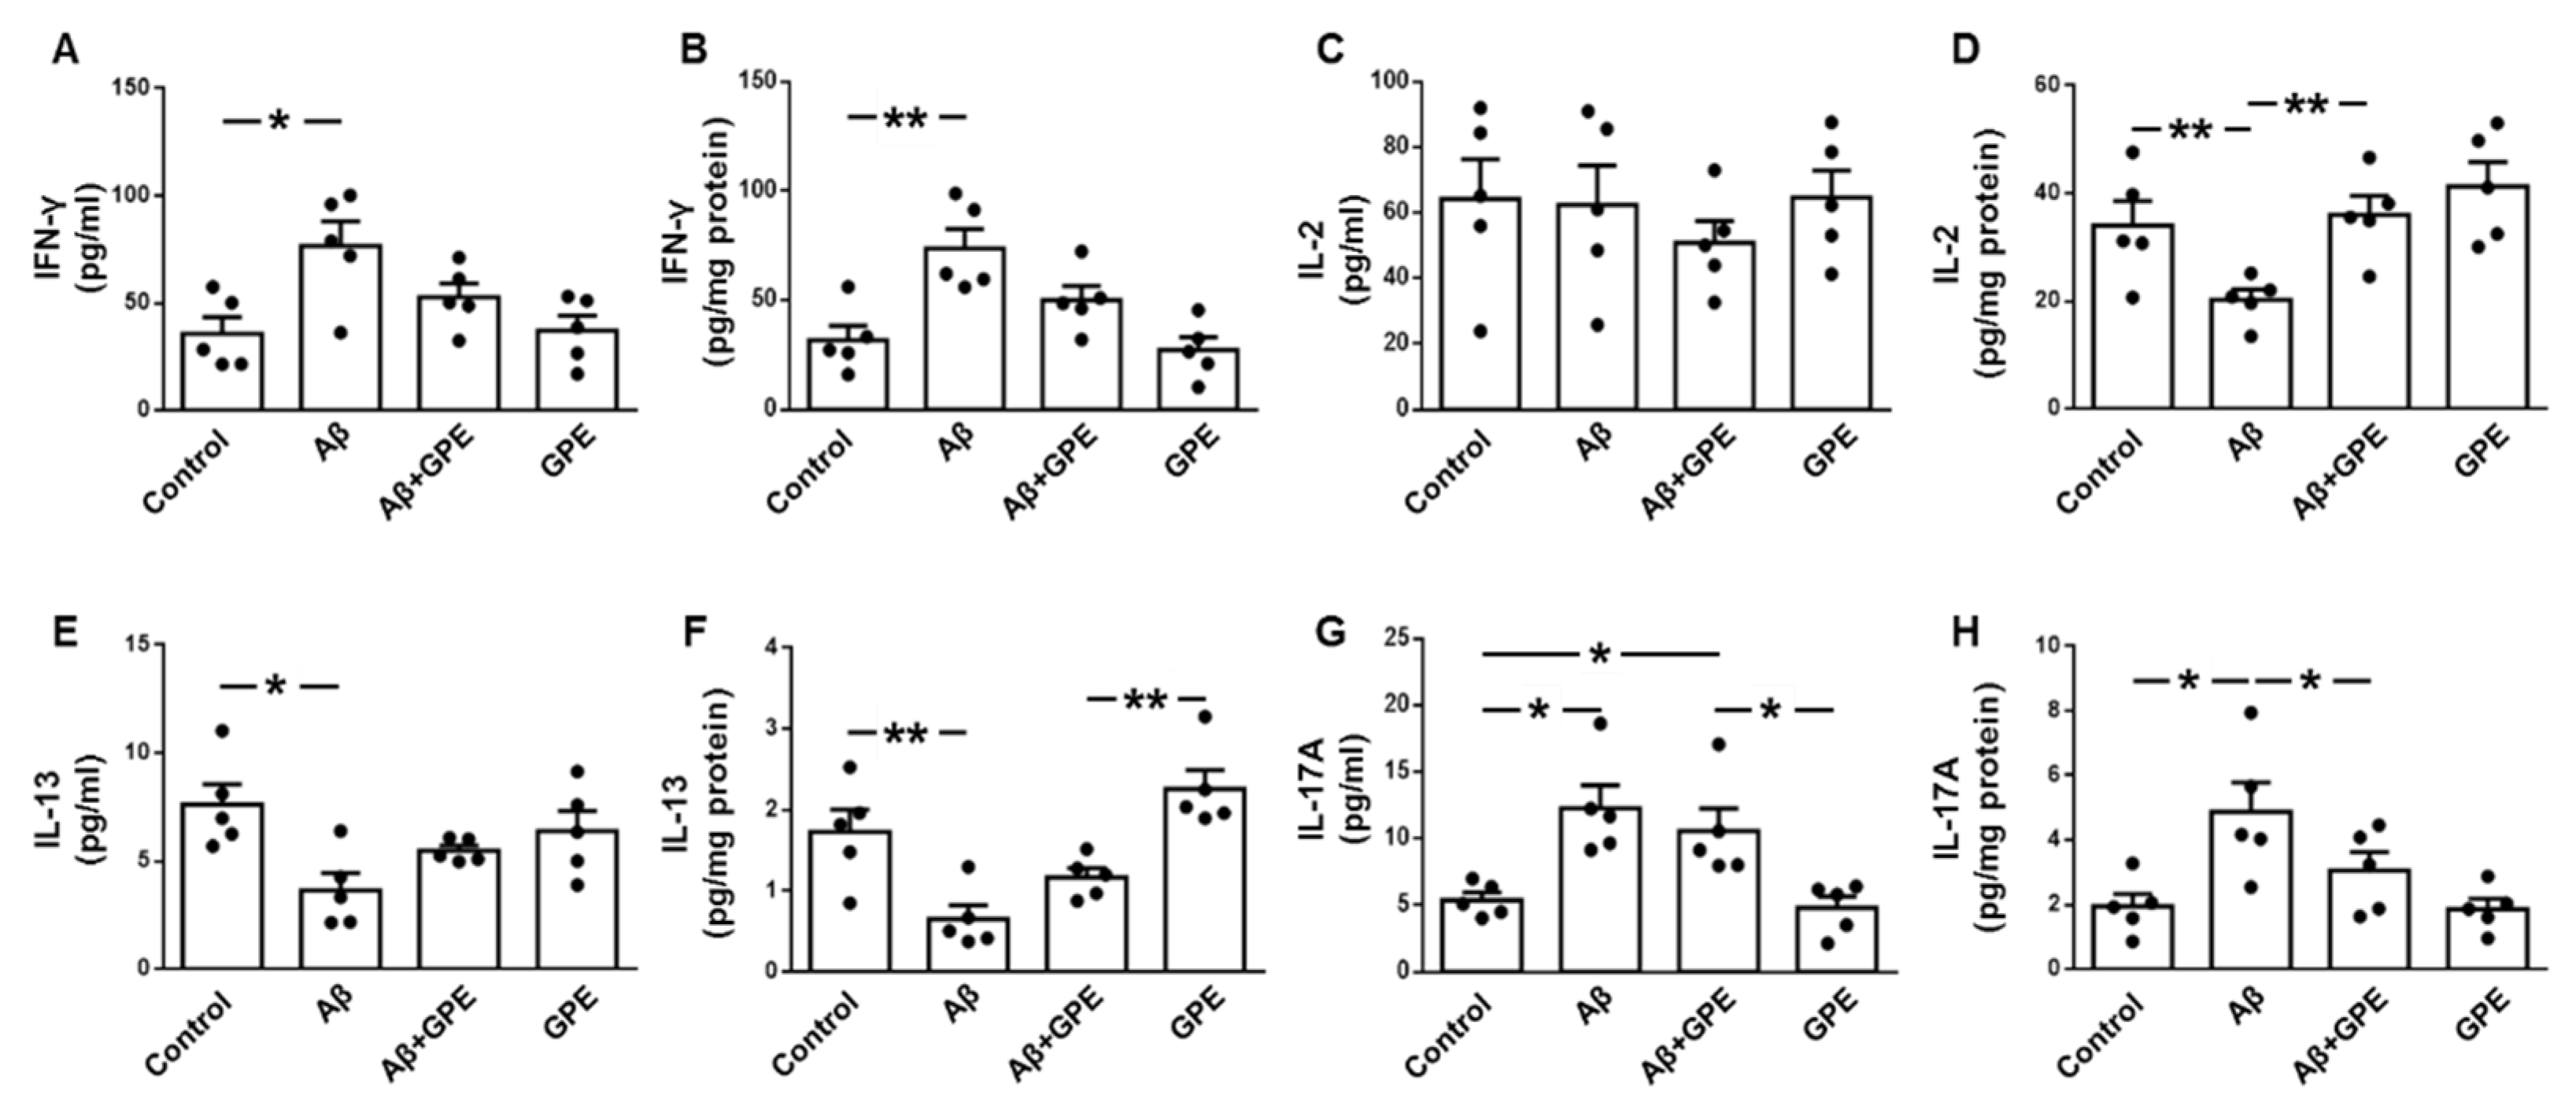
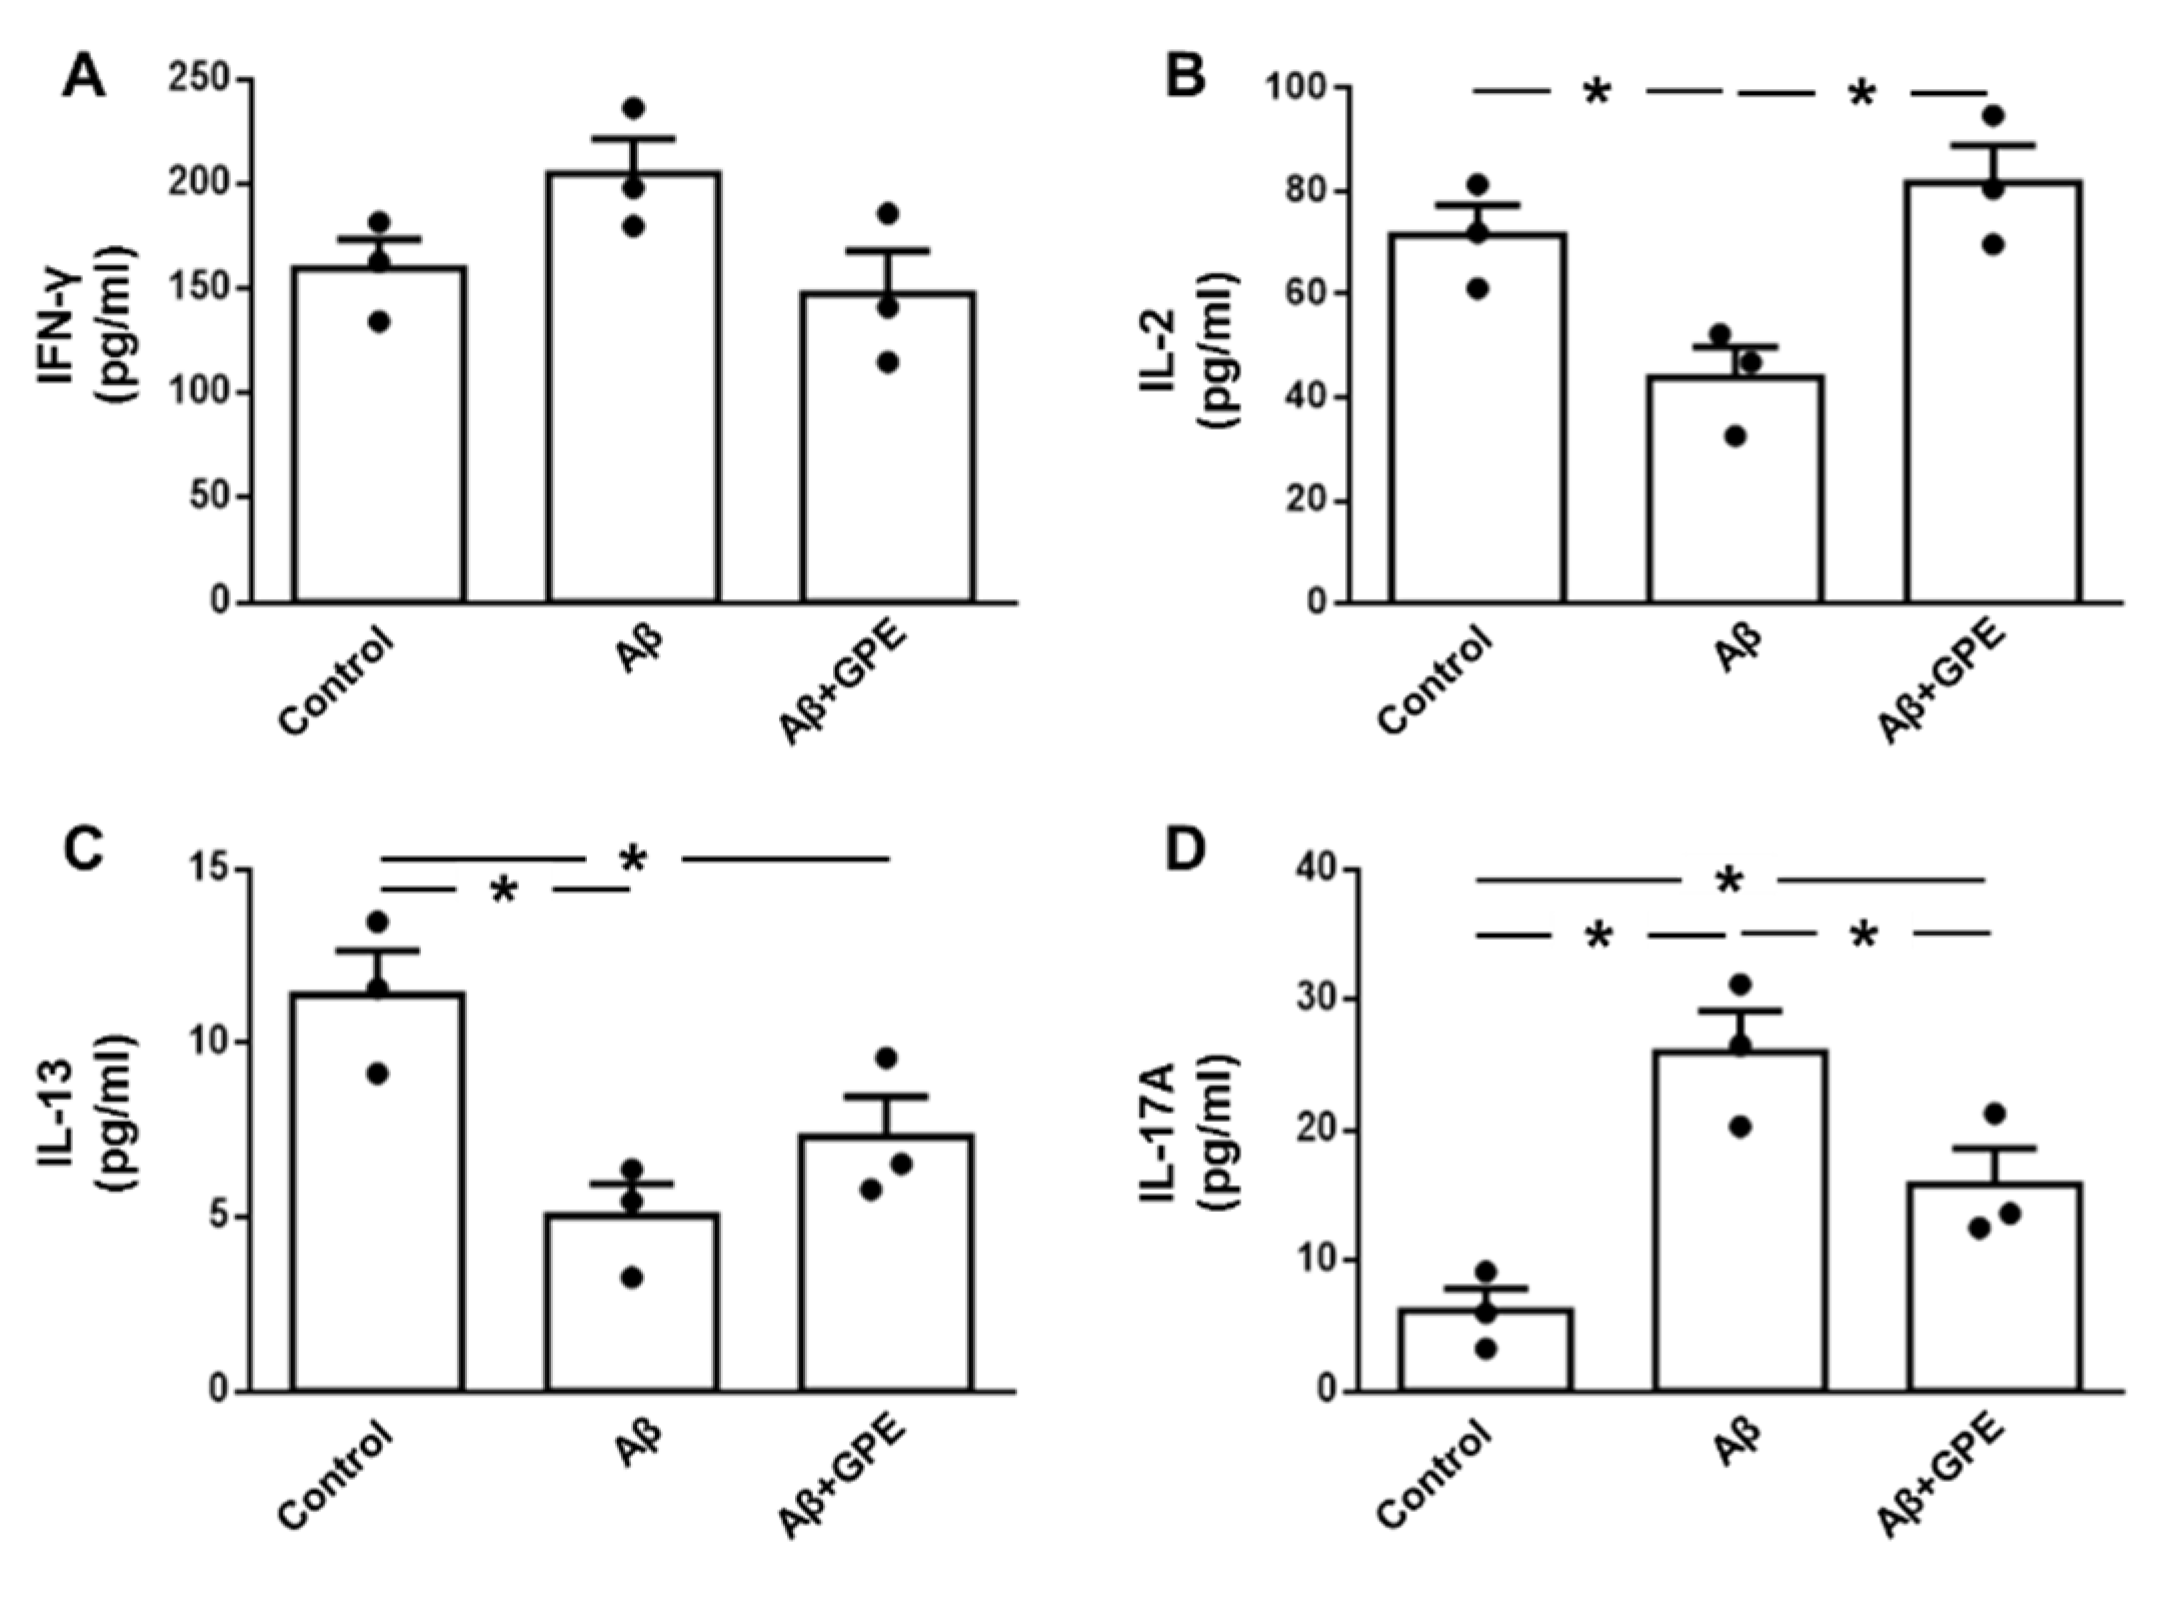
2.4. Effects of Aβ25-35 and GPE on Serum and Hippocampal Cytokine Content
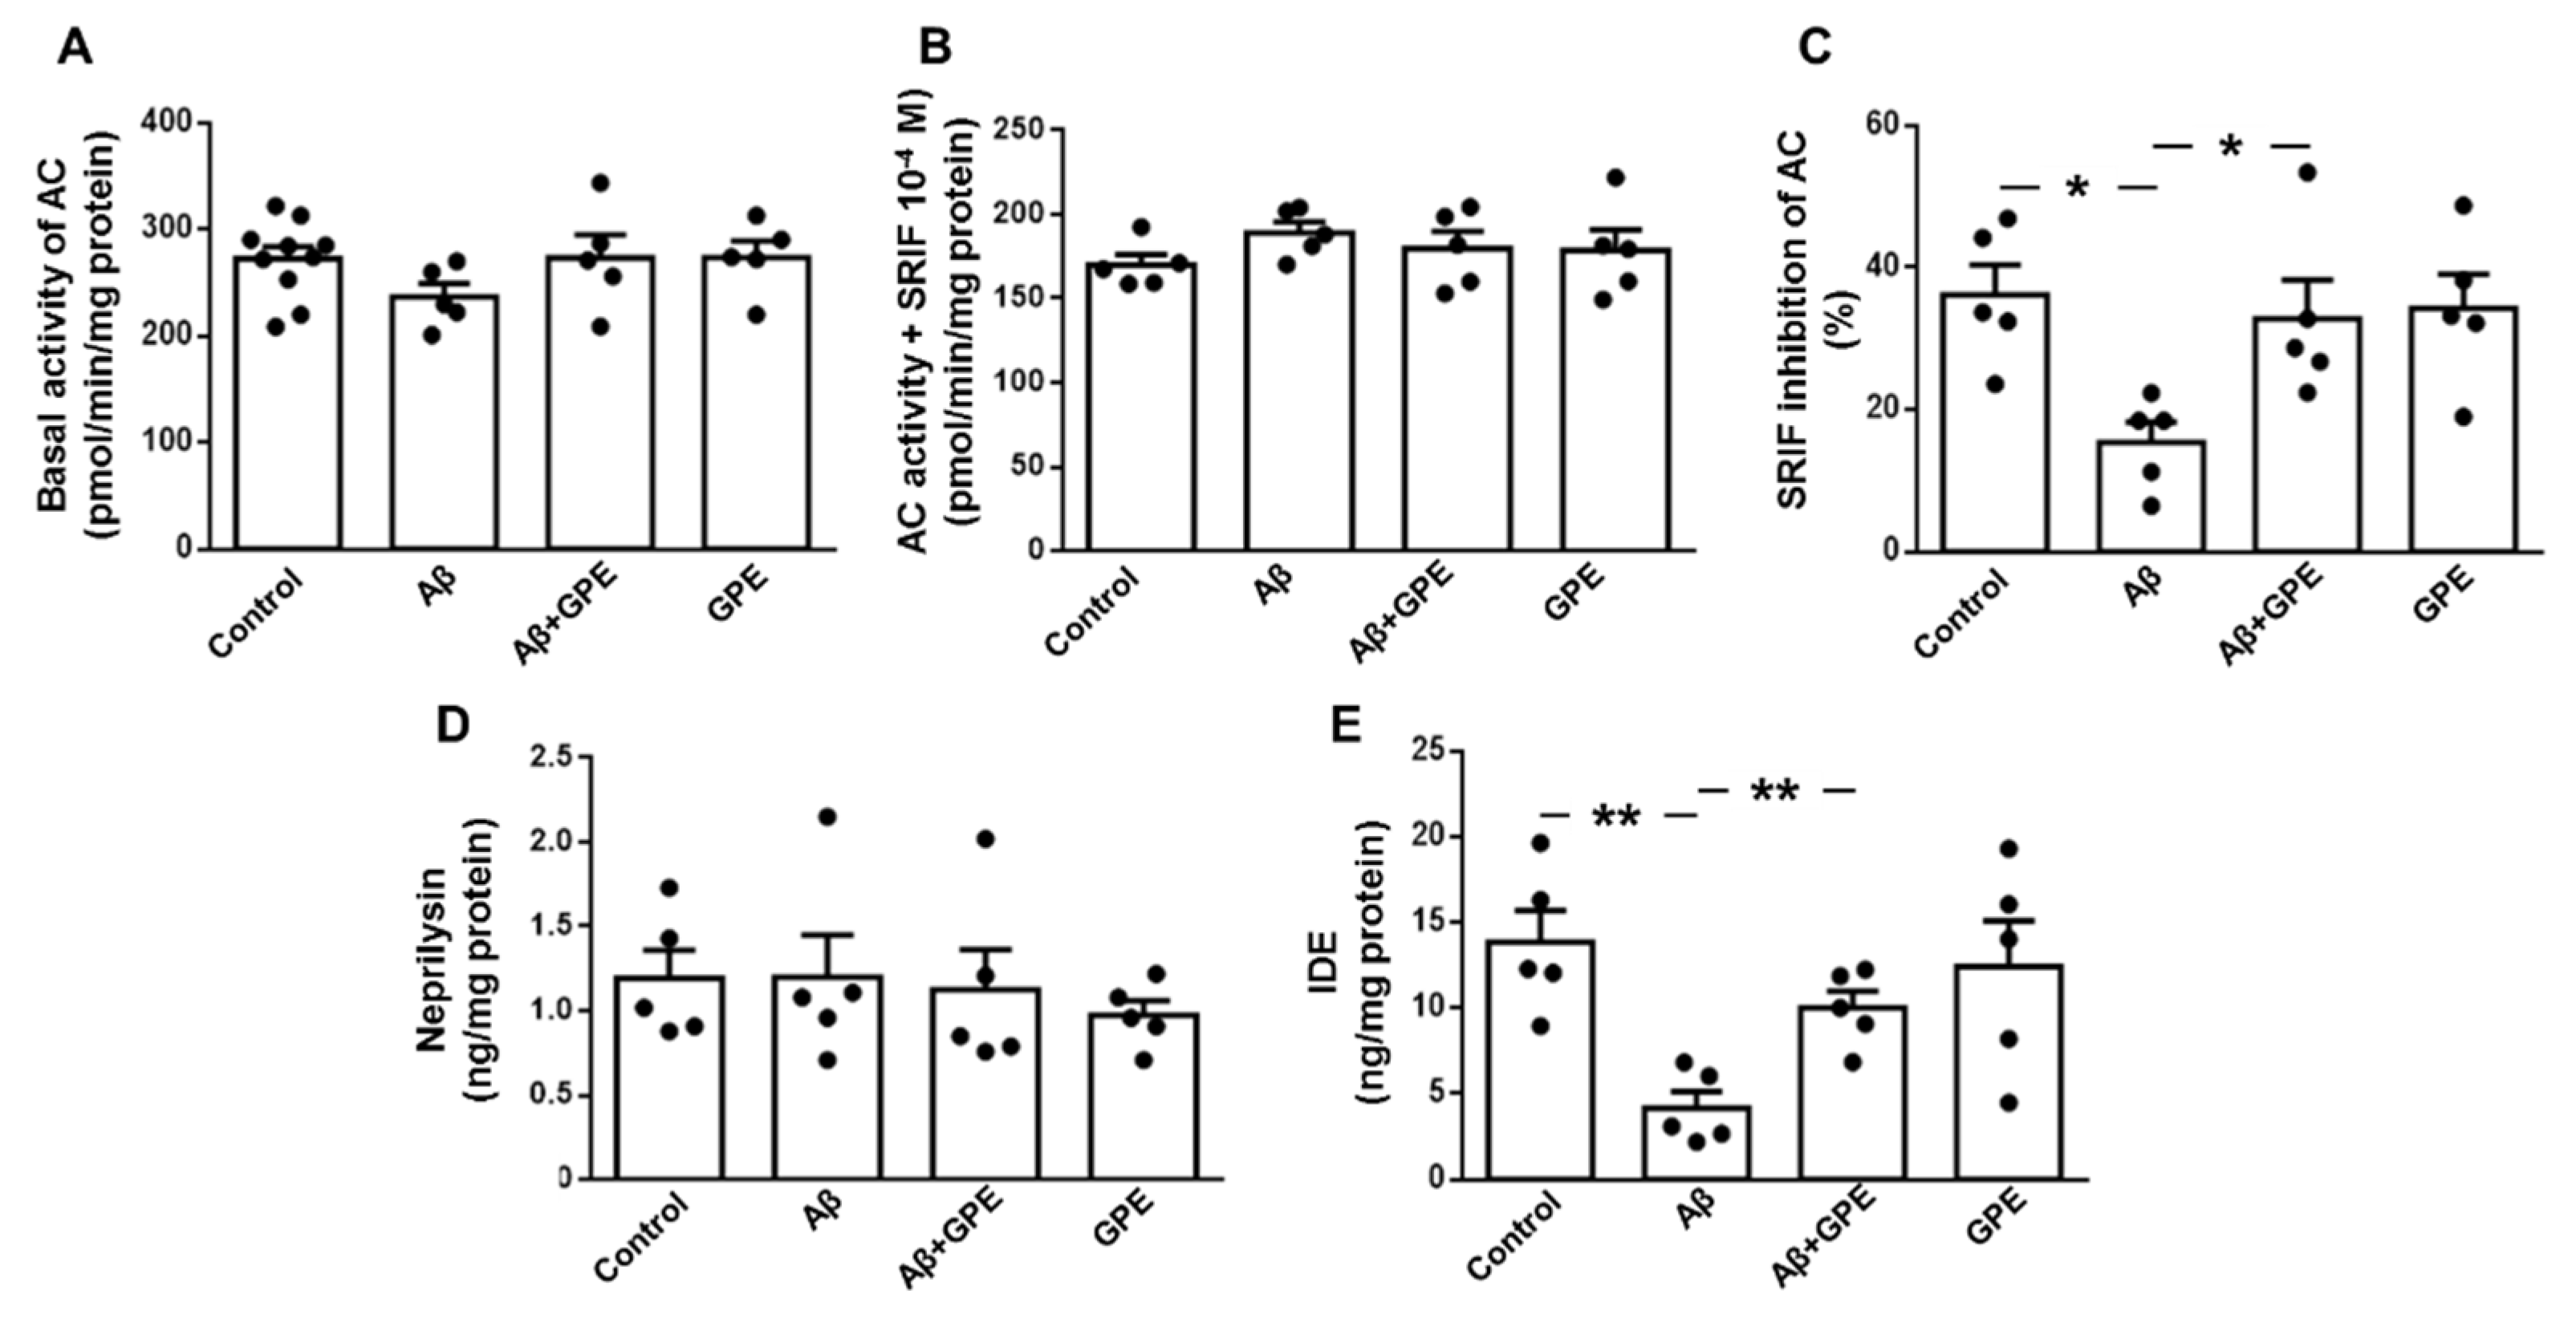
2.5. Aβ25-35 and GPE Are Involved in Modulating the Activity of AC and the Levels of an Aβ-Degrading Enzyme
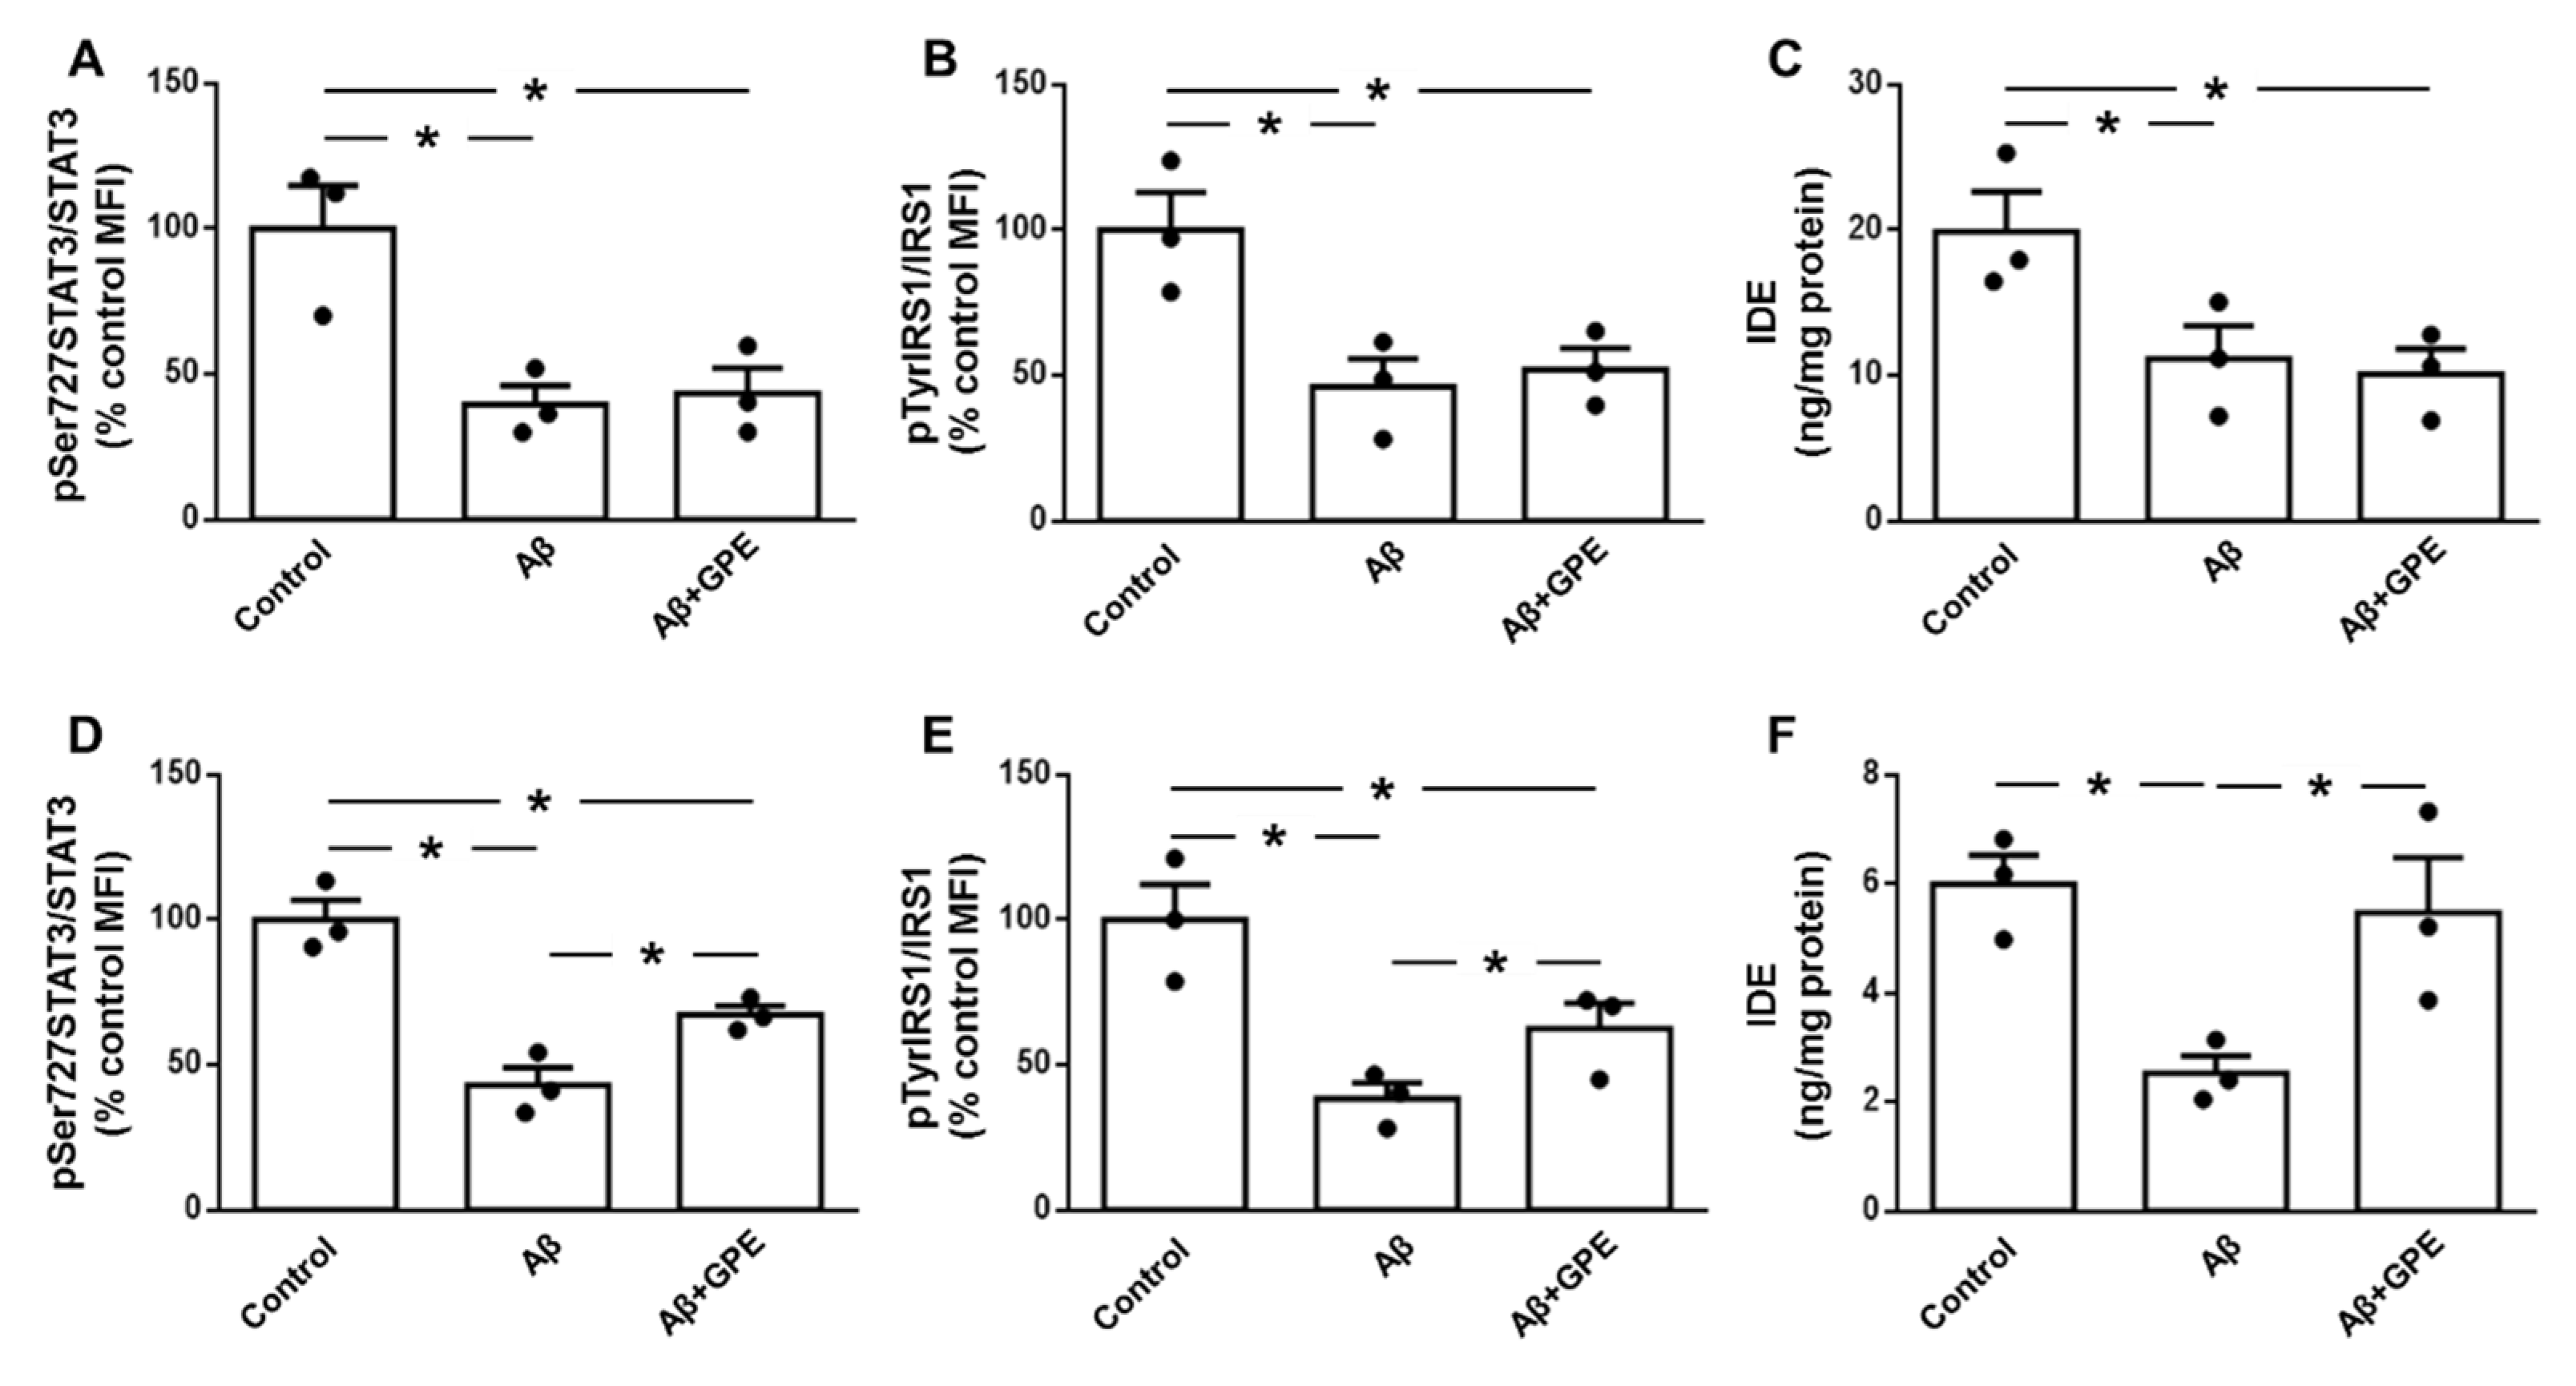
2.6. GPE does not Alter the Aβ25-35-Induced Decrease in Leptin and IGF Signaling in Neuronal Cultures
2.7. GPE Co-Administration Modifies Aβ25-35-Induced Changes in Glial Cell Signaling and Cytokine Secretion
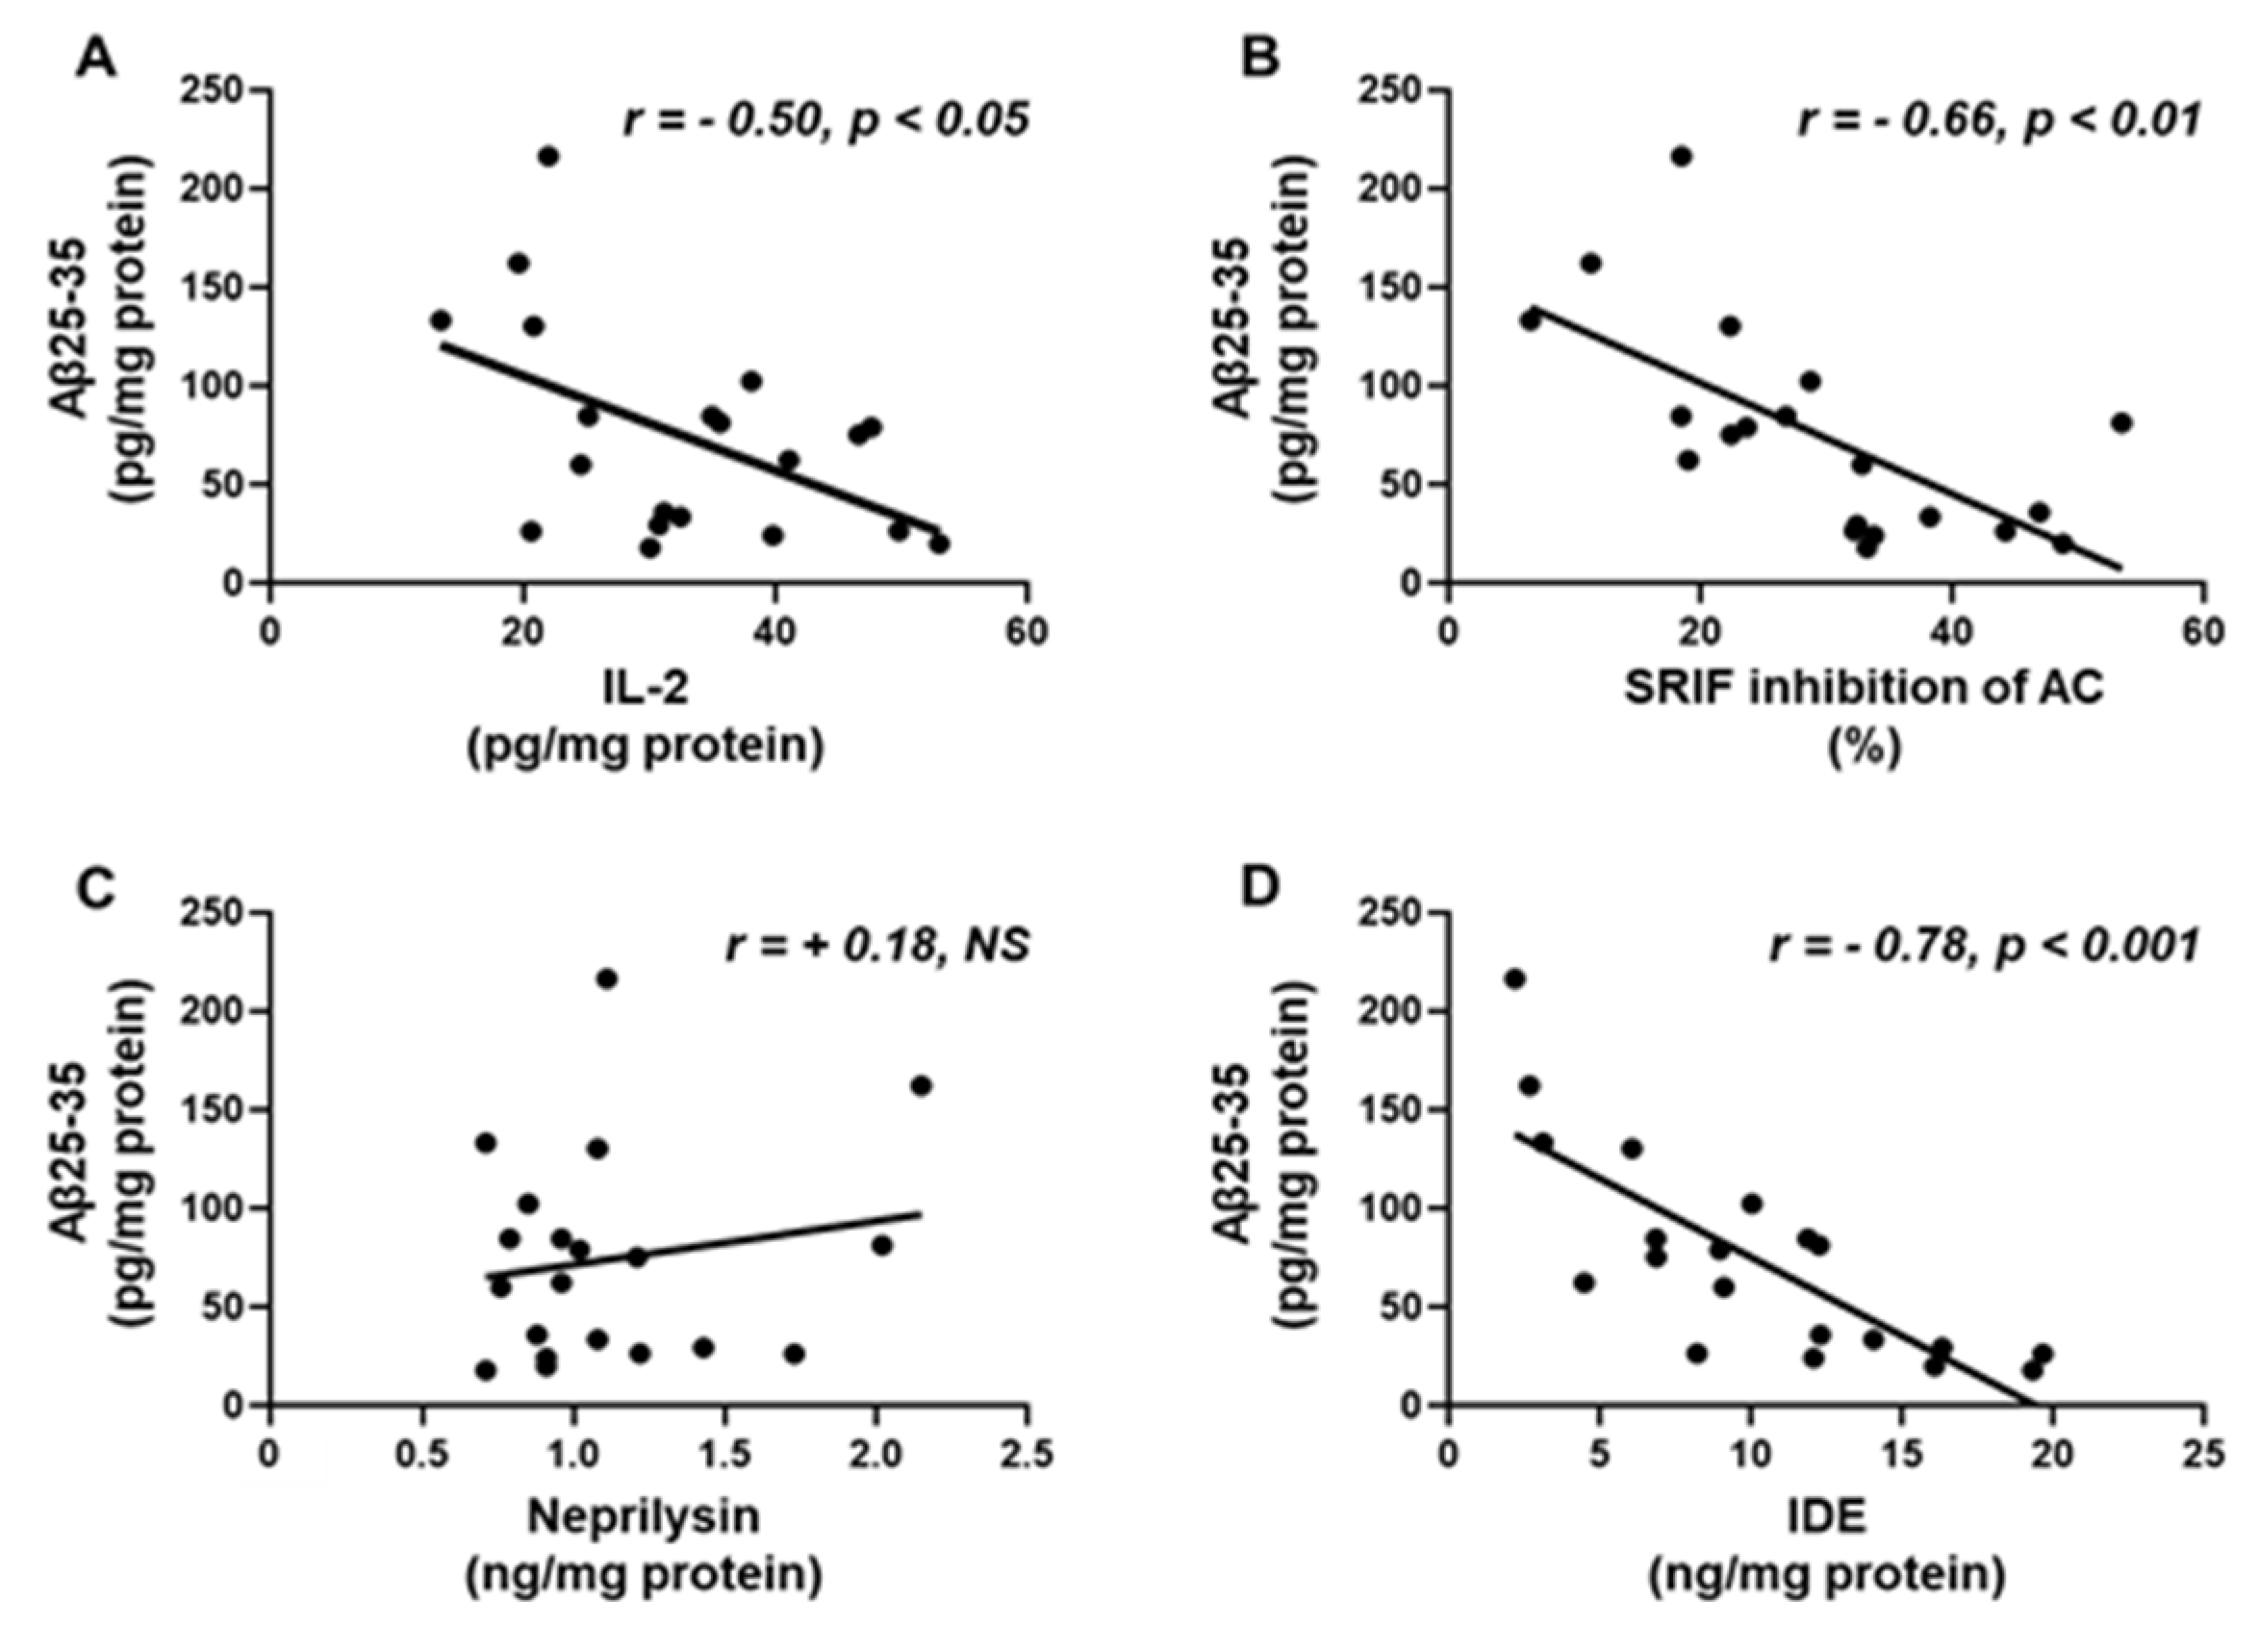
2.8. Aβ25-35 Content Shows an Inverse Relation to IL-2, SRIF Functionality and IDE
2.9. Correlation of Aβ25-35, SRIF Functionality and Aβ-Degrading Enzymes with Phosphorylation of Signaling Targets and Cytokine Levels in the Hippocampus
3. Discussion
4. Materials and Methods
4.1. Materials
4.2. Preparation of Aβ25-35
4.3. Animals and Experimental Design
4.5. Tissue Homogenization and Protein Quantification
4.6. ELISAs
4.6.1. Aβ25-35
4.6.2. Aβ-Degrading Enzymes
4.6.3. IGF-I
4.6.4. Phosphorylation of IGF-I Receptor
4.6.5. Leptin
4.7. Multiplexed Bead Immunoassays
4.8. Adenylyl Cyclase Assay
4.9. Cell Cultures and Treatments
4.9.1. Culture of Rat Hippocampal Neurons
4.9.2. Mixed Glial Culture
4.10. Statistical Analysis
Author Contributions
Funding
Institutional Review Board Statement
Informed Consent Statement
Data Availability Statement
Acknowledgments
Conflicts of Interest
Abbreviations
| Aβ | Amyloid-β peptide |
| AC | Adenylate cyclase |
| AD | Alzheimer´s disease |
| Akt | Protein kinase B |
| ANOVA | Analysis of variance |
| APP | Amyloid precursor protein |
| AU | Absorbance units |
| DMEM | Dulbecco’s modified Eagle medium |
| ELISA | Enzyme-linked immunosorbent assay |
| FBS | Fetal bovine serum |
| GFAP | Glial fibrillary acidic protein |
| GPE | Glycine-proline-glutamate |
| GSK3β | Glycogen synthase kinase 3β |
| HRP | Horseradish peroxidase |
| IDE | Insulin-degrading enzyme |
| IFN-γ | Interferon-γ |
| IGF-I | Insulin-like growth factor I |
| IGF-IR | IGF-I receptor |
| IL | Interleukin |
| IRS1 | Insulin receptor substrate 1 |
| JAK2 | Janus kinase 2 |
| MFI | Median fluorescent intensity |
| NFκB | Nuclear factor kappa B |
| Ovx | Ovariectomized |
| p | Phosphorylated |
| PI3K | Phosphatidylinositol 3-kinase |
| PS1 | Presenilin-1 |
| p38MAPK | p38 mitogen-activated protein kinase |
| SOCS3 | Suppressor of cytokine signaling 3 |
| SRIF | Somatostatin |
| STAT3 | Signal transducer and activator of transcription 3 |
References
- Ludewig, S.; Korte, M. Novel insights into the physiological function of the APP (Gene) family and its proteolytic fragments in synaptic plasticity. Front. Mol. Neurosci. 2017, 9, 161. [CrossRef]
- Li, R.; Li, Y.; Zuo, H.; Pei, G.; Huang, S.; Hou, Y. Alzheimer’s amyloid-beta accelerates cell senescence and suppresses SIRT1 in human neural stem cells. Biomolecules 2024, 14, 189. [CrossRef]
- Fornari Laurindo, L.; Aparecido Dias, J.; Cressoni Araújo, A.; Torres Pomini, K.; Machado Galhardi, C.; Rucco Penteado Detregiachi, C.; Santos de Argollo Haber, L.; Donizeti Roque, D.; Dib Bechara, M.; Vialogo Marques de Castro, M.; et al. Immunological dimensions of neuroinflammation and microglial activation: exploring innovative immunomodulatory approaches to mitigate neuroinflammatory progression. Front. Immunol. 2024, 14, 1305933. [CrossRef]
- Merighi, S.; Nigro, M.; Travagli, A.; Gessi, S. Microglia and Alzheimer’s disease. Int. J. Mol. Sci. 2022, 23, 12990. [CrossRef]
- Wang, H.; Sun, M.; Li, W.; Liu, X.; Zhu, M.; Qin, H. Biomarkers associated with the pathogenesis of Alzheimer’s disease. Front. Cell. Neurosci. 2023, 17, 1279046. [CrossRef]
- Kim, J.; Yoo, I.D.; Lim, J.; Moon, J.S. Pathological phenotypes of astrocytes in Alzheimer’s disease. Exp. Mol. Med. 2024, 56, 95-99. [CrossRef]
- Salman, M.; Akram, M.; Shahrukh, M.; Ishrat, T.; Parvez, S. Effects of pramipexole on beta-amyloid(1-42) memory deficits and evaluation of oxidative stress and mitochondrial function markers in the hippocampus of Wistar rat. Neurotoxicology 2022, 92, 91-101. [CrossRef]
- Fekete, C.; Vastagh, C.; Dénes, Á.; Hrabovszky, E.; Nyiri, G.; Kalló, I.; Liposits, Z.; Sárvári, M. Chronic amyloid beta oligomer infusion evokes sustained inflammation and microglial changes in the rat hippocampus via NLRP3. Neuroscience 2019, 405, 35-46. [CrossRef]
- Aguado-Llera, D.; Arilla-Ferreiro, E.; Campos-Barros, A.; Puebla-Jiménez, L.; Barrios V. Protective effects of insulin-like growth factor-I on the somatostatinergic system in the temporal cortex of beta-amyloid-treated rats. J. Neurochem. 2005, 92, 607-615. [CrossRef]
- Kubo, T.; Nishimura, S.; Kumagae, Y.; Kaneko, I. In vivo conversion of racemized beta-amyloid ([D-Ser 26]A beta 1-40) to truncated and toxic fragments ([D-Ser 26]A beta 25-35/40) and fragment presence in the brains of Alzheimer’s patients. J. Neurosci. Res. 2002, 70, 474-483. [CrossRef]
- Pirhaghi, M.; Mamashli, F.; Moosavi-Movahedi, F.; Arghavani, P.; Amiri, A.; Davaeil, B.; Mohammad-Zaheri, M.; Mousavi-Jarrahi, Z.; Sharma, D.; Langel, Ü.; et al. Cell-penetrating peptides: promising therapeutics and drug-delivery systems for neurodegenerative diseases. Mol. Pharm. 2024. [CrossRef]
- Guan, J.; Thomas, G.B.; Lin, H.; Mathai, S.; Bachelor, D.C.; George, S.; Gluckman, P.D. Neuroprotective effects of the N-terminal tripeptide of insulin-like growth factor-1, glycine-proline-glutamate (GPE) following intravenous infusion in hypoxic-ischemic adult rats. Neuropharmacology 2004, 47, 892-903. [CrossRef]
- Burgos-Ramos, E.; Martos-Moreno, G.A.; López, M.G.; Herranz, R.; Aguado-Llera, D.; Egea, J.; Frechilla, D.; Cenarruzabeitia, E.; León, R.; Arilla-Ferreiro, E.; et al. The N-terminal tripeptide of insulin-like growth factor-I protects against beta-amyloid-induced somatostatin depletion by calcium and glycogen synthase kinase 3 beta modulation. J. Neurochem. 2009, 109, 360-370. [CrossRef]
- Silva-Reis, S.C.; Sampaio-Dias, I.E.; Costa, V.M.; Correia, X.C.; Costa-Almeida, H.F.; García-Mera, X.; Rodríguez-Borges, J.E. Concise overview of glypromate neuropeptide research: from chemistry to pharmacological applications in neurosciences. ACS Chem. Neurosci. 2023, 14, 554-572. [CrossRef]
- Herrero-Labrador, R.; Trueba-Saiz, A.; Martinez-Rachadell, L.; Fernandez de Sevilla, M.E.; Zegarra-Valdivia, J.A.; Pignatelli, J.; Diaz-Pacheco, S.; Fernandez, A.M.; Torres Aleman, I. Circulating insulin-like growth factor I is involved in the effect of high fat diet on peripheral amyloid beta clearance. Int. J. Mol. Sci. 2020, 21, 9675. [CrossRef]
- Almengló, C.; Devesa, P.; Devesa, J.; Arce, V.M. GPE promotes the proliferation and migration of mouse embryonic neural stem cells and their progeny in vitro. Int. J. Mol. Sci. 2017, 18, 1280. [CrossRef]
- Messier, C.; Teutenberg, K. The role of insulin, insulin growth factor, and insulin-degrading enzyme in brain aging and Alzheimer’s disease. Neural Plast. 2005, 12, 311-328. [CrossRef]
- Yook, J.S.; Rakwal, R.; Shibato, J.; Takahashi, K.; Koizumi, H.; Shima, T.; Ikemoto, M.J.; Oharomari, L.K.; McEwen, B.S.; Soya, H. Leptin in hippocampus mediates benefits of mild exercise by an antioxidant on neurogenesis and memory. Proc. Natl. Acad. Sci. USA 2019, 116, 10988-10993. [CrossRef]
- Al-Kuraishy, H.M.; Al-Gareeb, A.I.; Alsayegh, A.A.; Hakami, Z.H.; Khamjan, N.A.; Saad, H.M.; Batiha, G.E.; De Waard, M. A potential link between visceral obesity and risk of Alzheimer’s disease. Neurochem. Res. 2023, 48, 745-766. [CrossRef]
- Tundo, G.R.; Di Muzio, E.; Ciaccio, C.; Sbardella, D.; Di Pierro, D.; Polticelli, F.; Coletta, M.; Marini, S. Multiple allosteric sites are involved in the modulation of insulin-degrading-enzyme activity by somatostatin. FEBS J. 2016, 283, 3755-3770. [CrossRef]
- Christian, F.; Smith, E.L.; Carmody, R.J. The regulation of NF-κB subunits by phosphorylation. Cells 2016, 5, 12. [CrossRef]
- Grønborg, M.; Wulff, B.S.; Rasmussen, J.S.; Kjeldsen, T.; Gammeltoft S. Structure-function relationship of the insulin-like growth factor-I receptor tyrosine kinase. J. Biol. Chem. 1993, 268, 23435-23440. PMID: 7693688.
- Tzatsos, A. Raptor binds the SAIN (Shc and IRS-1 NPXY binding) domain of insulin receptor substrate-1 (IRS-1) and regulates the phosphorylation of IRS-1 at Ser-636/639 by mTOR. J. Biol. Chem. 2009, 284, 22525-22534. [CrossRef]
- Saito, T.; Iwata, N.; Tsubuki, S.; Takaki, Y.; Takano, J.; Huang, S.M.; Suemoto T.; Higuchi M.; Saido T.C. Somatostatin regulates brain amyloid beta peptide Abeta42 through modulation of proteolytic degradation. Nat. Med. 2005, 11, 434-439. [CrossRef]
- Sandoval, K.; Umbaugh, D.; House, A.; Crider, A.; Witt, K. Somatostatin receptor subtype-4 regulates mRNA expression of amyloid-beta degrading enzymes and microglia mediators of phagocytosis in brains of 3xTg-AD mice. Neurochem. Res. 2019, 44, 2670-2680. [CrossRef]
- Weggen, S.; Rogers, M.; Eriksen, J. NSAIDs: small molecules for prevention of Alzheimer’s disease or precursors for future drug development? Trends Pharmacol. Sci. 2007, 28, 536-543. [CrossRef]
- Campolongo, P.; Ratano, P.; Ciotti, M.T.; Florenzano, F.; Nori, S.L.; Marolda, R.; Palmery, M.; Rinaldi, A.M.; Zona, C.; Possenti, R.; et al. Systemic administration of substance P recovers beta amyloid-induced cognitive deficits in rat: involvement of Kv potassium channels. PLoS One 2013, 8, e78036. [CrossRef]
- Tang, L.; Xiang, Q.; Xiang, J.; Zhang, Y.; Li, J. Tripterygium glycoside ameliorates neuroinflammation in a mouse model of Abeta25-35-induced Alzheimer’s disease by inhibiting the phosphorylation of IkappaBalpha and p38. Bioengineered 2021, 12, 8540-8554. [CrossRef]
- Napolitano, M.; Costa, L.; Piacentini, R.; Grassi, C.; Lanzone, A.; Gulino, A. 17β-estradiol protects cerebellar granule cells against β-amyloid-induced toxicity via the apoptotic mitochondrial pathway. Neurosci. Lett. 2014, 561, 134-139. [CrossRef]
- Lopez-Lee, C.; Torres, E.R.S.; Carling, G.; Gan, L. Mechanisms of sex differences in Alzheimer’s disease. Neuron 2024, S0896-6273(24)00050-3. [CrossRef]
- Brandt, N.; Vierk, R.; Rune, G.M. Sexual dimorphism in estrogen-induced synaptogenesis in the adult hippocampus. Int. J. Dev. Biol. 2013, 57, 351-356. [CrossRef]
- Fei, X.; Zhang, P.Y.; Zhang, X.; Zhang, G.Q.; Bao, W.P.; Zhang, Y.Y.; Zhang, M.; Zhou, X. IL-17A monoclonal antibody partly reverses the glucocorticoids insensitivity in mice exposed to Ozonec. Inflammation 2017, 40, 788-797. [CrossRef]
- Yuan, R.; Wang, L.; Deng, Z.H.; Yang, M.M.; Zhao, Y.; Hu, J.; Zhang, Y.; Li, Y.; Liu, M.; Liu, S.F., et al. Protective effects of mesenchymal stem cells against central nervous system injury in heat stroke. Curr. Stem Cell. Res. Ther. 2023, 18, 401-409. [CrossRef]
- Oliva, A.A. Jr.; Kang, Y.; Sanchez-Molano, J.; Furones, C.; Atkins, C.M. STAT3 signaling after traumatic brain injury. J. Neurochem. 2012, 120, 710-720. [CrossRef]
- Espírito-Santo, S.A.; Nunes-Tavares, N.; Mendonça, H.R.; Serfaty, C.A.; Sholl-Franco, A.; Campello-Costa, P. Intravitreal Interleukin-2 modifies retinal excitatory circuits and retinocollicular innervation. Exp. Eye Res. 2021, 204, 108442. [CrossRef]
- Cecon, E.; Lhomme, T.; Maurice, T.; Luka, M.; Chen, M.; Silva, A.; Wauman, J.; Zabeau, L.; Tavernier, J.; Prévot, V.; et al. Amyloid beta peptide is an endogenous negative allosteric modulator of leptin receptor. Neuroendocrinology 2021, 111, 370-387. [CrossRef]
- Arora, T.; Caviedes, P.; Sharma, S.K. Effects of a tripeptide on mitogen-activated protein kinase and glycogen synthase kinase activation in a cell line derived from the foetal hippocampus of a trisomy 16 mouse: an animal model of Down syndrome. Neurotox. Res. 2020, 37, 714-723. [CrossRef]
- Minelli, A.; Conte, C.; Cacciatore, I.; Cornacchia, C.; Pinnen, F. Molecular mechanism underlying the cerebral effect of Gly-Pro-Glu tripeptide bound to L-dopa in a Parkinson’s animal model. Amino Acids 2012, 43, 1359-1367. [CrossRef]
- Park, S.; Hong, S.M.; Sung, S.R.; Jung, H.K. Long-term effects of central leptin and resistin on body weight, insulin resistance, and beta-cell function and mass by the modulation of hypothalamic leptin and insulin signaling. Endocrinology 2008, 149, 445-454. [CrossRef]
- King, A.; Brain, A.; Hanson, K.; Dittmann, J.; Vickers, J.; Fernandez-Martos, C. Disruption of leptin signalling in a mouse model of Alzheimer’s disease. Metab. Brain Dis. 2018, 33, 1097-1110. [CrossRef]
- Barrios, V.; Frago, L.M.; Canelles, S.; Guerra-Cantera, S.; Arilla-Ferreiro, E.; Chowen, J.A.; Argente, J. Leptin modulates the response of brown adipose tissue to negative energy balance: implication of the GH/IGF-I axis. Int. J. Mol. Sci. 2021, 22, 2827. [CrossRef]
- Maragakis, N.J.; Rothstein, J.D.; Mechanisms of disease: astrocytes in neurodegenerative disease. Nat. Clin. Pract. Neurol. 2006, 2, 679-689. [CrossRef]
- Guan, J.; Gluckman, P.D. IGF-1 derived small neuropeptides and analogues: a novel strategy for the development of pharmaceuticals for neurological conditions. Br. J. Pharmacol. 2009, 157, 881-891. [CrossRef]
- Aguado-Llera, D.; Canelles, S.; Fernández-Mendívil, C.; Frago, L.M.; Argente, J.; Arilla-Ferreiro, E.; López, M.G.; Barrios, V. Improvement in inflammation is associated with the protective effect of Gly-Pro-Glu and cycloprolylglycine against Aβ-induced depletion of the hippocampal somatostatinergic system. Neuropharmacology 2019, 151, 112-126. [CrossRef]
- Svedin, P.; Guan, J.; Mathai, S.; Zhang, R.; Wang, X.; Gustavsson, M.; Hagberg, H.; Mallard, C. Delayed peripheral administration of a GPE analogue induces astrogliosis and angiogenesis and reduces inflammation and brain injury following hypoxia-ischemia in the neonatal rat. Dev. Neurosci. 2007, 29, 393-402. [CrossRef]
- Shapiro, M.R.; Peters, L.D.; Brown, M.E.; Cabello-Kindelan, C.; Posgai, A.L.; Bayer, A.L.; Brusko, T.M. Insulin-like growth factor-1 synergizes with IL-2 to induce homeostatic proliferation of regulatory T cells. J. Immunol. 2023, 211, 1108-1122. [CrossRef]
- Relic, B.; Guicheux, J.; Mezin, F.; Lubberts, E.; Togninalli, D.; Garcia, I.; van den Berg, W.B.; Guerne, P.A. IL-4 and IL-13, but not IL-10, protect human synoviocytes from apoptosis. J. Immunol. 2001, 166, 2775-2782. [CrossRef]
- Marella, S.; Sharma, A.; Ganesan, V.; Ferrer-Torres, D.; Krempski, J.W.; Idelman, G.; Clark, S.; Nasiri, Z.; Vanoni, S.; Zeng, C.; et al. IL-13-induced STAT3-dependent signaling networks regulate esophageal epithelial proliferation in eosinophilic esophagitis. J. Allergy Clin. Immunol. 2023, 152, 1550-1568. [CrossRef]
- Turkez, H.; Cacciatore, I.; Marinelli, L.; Fornasari, E.; Aslan, M.E.; Cadirci, K.; Kahraman, C.Y.; Caglar, O.; Tatar, A.; Di Biase, G.; et al. Glycyl-L-prolyl-L-glutamate pseudotripeptides for treatment of Alzheimer’s disease. Biomolecules 2021, 11, 126. [CrossRef]
- Doherty, G.H.; Beccano-Kelly, D.; Yan, S.D.; Gunn-Moore, F.J.; Harvey, J. Leptin prevents hippocampal synaptic disruption and neuronal cell death induced by amyloid beta. Neurobiol. Aging. 2013, 34, 226-237. [CrossRef]
- Gonzalez, G.A.; Montminy, M.R. Cyclic AMP stimulates somatostatin gene transcription by phosphorylation of CREB at serine 133. Cell 1989, 59, 675-680. [CrossRef]
- Sandoval, K.; Umbaugh, D.; House, A.; Crider, A.; Witt, K. Somatostatin receptor subtype-4 regulates mRNA expression of amyloid-beta degrading enzymes and microglia mediators of phagocytosis in brains of 3xTg-AD mice. Neurochem. Res. 2019, 44, 2670-2680. [CrossRef]
- Burgos-Ramos, E.; Hervás-Aguilar, A.; Aguado-Llera, D.; Puebla-Jiménez, L.; Hernández-Pinto, A.M.; Barrios, V.; Arilla-Ferreiro, E. Somatostatin and Alzheimer’s disease. Mol. Cell. Endocrinol. 2008, 286, 104-111. [CrossRef]
- El Sayed, N.S.; Kandil, E.A.; Ghoneum, M.H. Enhancement of insulin/PI3K/Akt signaling pathway and modulation of gut microbiome by probiotics fermentation technology, a kefir grain product, in sporadic Alzheimer’s disease model in mice. Front. Pharmacol. 2021, 12, 666502. [CrossRef]
- Guan. J.; Harris. P.; Brimble, M.; Lei, Y.; Lu, J.; Yang, Y.; Gunn, A.J. The role for IGF-1-derived small neuropeptides as a therapeutic target for neurological disorders. Expert Opin. Ther. Targets 2015, 19, 785-793. [CrossRef]
- Arora, T.; Sharma, S.K. Cyclic glycine-proline improves memory and reduces amyloid plaque load in APP/PS1 transgenic mouse model of Alzheimer’s disease. Int. J. Alzheimers Dis. 2023, 2023, 1753791. [CrossRef]
- Rezaei, M.H.; Madadizadeh, E.; Aminaei, M.; Abbaspoor, M.; Schierbauer, J.; Moser, O.; Khoramipour, K.; Chamari, K. Leptin signaling could mediate hippocampal decumulation of beta-amyloid and tau induced by high-intensity interval training in rats with type 2 diabetes. Cell. Mol. Neurobiol. 2023, 43, 3465-3478. [CrossRef]
- Alves, S.; Churlaud, G.; Audrain, M.; Michaelsen-Preusse, K.; Fol, R.; Souchet, B.; Braudeau, J.; Korte, M.; Klatzmann, D.; Cartier, N. Interleukin-2 improves amyloid pathology, synaptic failure and memory in Alzheimer’s disease mice. Brain 2017, 140, 826-842. [CrossRef]
- Kawahara, K.; Suenobu, M.; Yoshida, A.; Koga, K.; Hyodo, A.; Ohtsuka, H.; Kuniyasu, A.; Tamamaki, N.; Sugimoto, Y.; Nakayama, H. Intracerebral microinjection of interleukin-4/interleukin-13 reduces beta-amyloid accumulation in the ipsilateral side and improves cognitive deficits in young amyloid precursor protein 23 mice. Neuroscience 2012, 207, 243-260. [CrossRef]
- Cao, M.; Liu, J.; Zhang, X.; Wang, Y.; Hou Y.; Song, Q.; Cui, Y.; Zhao, Y.; Wang, P. IL-17A promotes the progression of Alzheimer’s disease in APP/PS1 mice. Immun. Ageing 2023, 20, 74. [CrossRef]
- Shallie, O.F.; Dalle, E.; Mabandla, M.V. Memory decline correlates with increased plasma cytokines in amyloid-beta (1-42) rat model of Alzheimer’s disease. Neurobiol. Learn. Mem. 2020, 169, 107187. [CrossRef]
- Foley, K.E.; Winder, Z.; Sudduth, T.L.; Martin, B.J.; Nelson, P.T.; Jicha, G.A.; Harp, J.P.; Weekman, E.M.; Wilcock, D.M. Alzheimer’s disease and inflammatory biomarkers positively correlate in plasma in the UK-ADRC cohort. Alzheimers Dement. 2024, 20, 1374-1386. [CrossRef]
- Burgos-Ramos, E.; Hervás-Aguilar, A.; Puebla-Jiménez, L.; Boyano-Adánez, M.C.; Arilla-Ferreiro, E. Chronic but not acute in-tracerebroventricular administration of amyloid beta-peptide (25-35) decreases somatostatin content, adenylate cyclase activity, somatostatin-induced inhibition of adenylate cyclase activity, and adenylate cyclase I levels in the rat hippocampus. J. Neurosci. Res. 2007, 85, 433-442. [CrossRef]
- Dao, A.T.; Zagaar, M.A.; Levine, A.T.; Salim, S.; Eriksen, J.L.; Alkadhi, K.A. Treadmill exercise prevents learning and memory impairment in Alzheimer’s disease-like pathology. Curr. Alzheimer Res. 2013, 10, 507-515. [CrossRef]
- Nag, S.; Yee, B.K.; Tang, F. Reduction in somatostatin and substance P levels and choline acetyltransferase activity in the cortex and hippocampus of the rat after chronic intracerebroventricular infusion of beta-amyloid (1-40). Brain Res. Bull. 1999, 50, 251-262. [CrossRef]
- Glowinski, J.; Iversen, L.L. Regional studies of catecholamines in the rat brain. I. The disposition of [3H]norepinephrine, [3H]dopamine and [3H]dopa in various regions of the brain. J. Neurochem. 1966, 13, 655-669. [CrossRef]
- Reubi, J.C.; Perrin, M.H.; Rivier, J.E.; Vale, W. High affinity binding sites for a somatostatin-28 analog in rat brain. Life Sci. 1981, 28, 2191-2198. [CrossRef]
- Gilman, A.G. A protein binding assay for adenosine 3´:5´-cyclic monophosphate. Proc. Natl. Acad. Sci. USA 1970, 67, 305-312. [CrossRef]
| Aβ25-35 (pg/mg) | SRIF inhibition AC (%) | IDE (ng/mg) | |
|---|---|---|---|
| r p | r p | r p | |
| p-p38MAPK/MAPK (%) | + 0.53 * | - 0.59 ** | - 0.45 * |
| pSerNFκB/NFκB (%) | - 0.40 NS | + 0.49 * | + 0.38 NS |
| pTyrSTAT3/STAT3 (%) | - 0.74 *** | + 0.57 ** | + 0.60 ** |
| pSerSTAT3/STAT3 (%) | - 0.76 *** | + 0.65 ** | + 0.71 *** |
| pTyrIGF-IR/mg protein | - 0.63 ** | + 0.61 ** | + 0.53 * |
| pTyrIRS1/IRS1 (%) | - 0.61 ** | + 0.41 NS | + 0.42 NS |
| pSerIRS1/IRS1 (%) | + 0.86 *** | - 0.67 ** | - 0.72 *** |
| pThrAkt/Akt (%) | - 0.66 ** | + 0.62 ** | + 0.55 * |
| IFN-γ (pg/mg) | + 0.80 *** | - 0.60 ** | - 0.72 *** |
| IL-2 (pg/mg) | - 0.50 * | + 0.37 NS | + 0.70 *** |
| IL-13 (pg/mg) | - 0.78 *** | + 0.51 * | + 0.69 *** |
| IL-17A (pg/mg) | + 0.60 ** | - 0.54 * | - 0.59 ** |
Disclaimer/Publisher’s Note: The statements, opinions and data contained in all publications are solely those of the individual author(s) and contributor(s) and not of MDPI and/or the editor(s). MDPI and/or the editor(s) disclaim responsibility for any injury to people or property resulting from any ideas, methods, instructions or products referred to in the content. |
© 2024 by the authors. Licensee MDPI, Basel, Switzerland. This article is an open access article distributed under the terms and conditions of the Creative Commons Attribution (CC BY) license (http://creativecommons.org/licenses/by/4.0/).


