1. Introduction
Since its inception in 2009 (Nakamoto 2009), Bitcoin has been a subject of fascination and speculation, with its price volatility and decentralized nature captivating the interest of investors and enthusiasts worldwide. One of the key events within the Bitcoin ecosystem that has garnered significant attention is the process known as "Bitcoin halving" (Chohan 2019; M’bakob 2024; Meynkhard 2019; Schär 2020). This periodic phenomenon, encoded into the cryptocurrency's protocol, involves a reduction in the rewards that miners receive for validating transactions on the blockchain (Coinbase 2024; Conway 2024; Crawley 2020; Schär 2020).
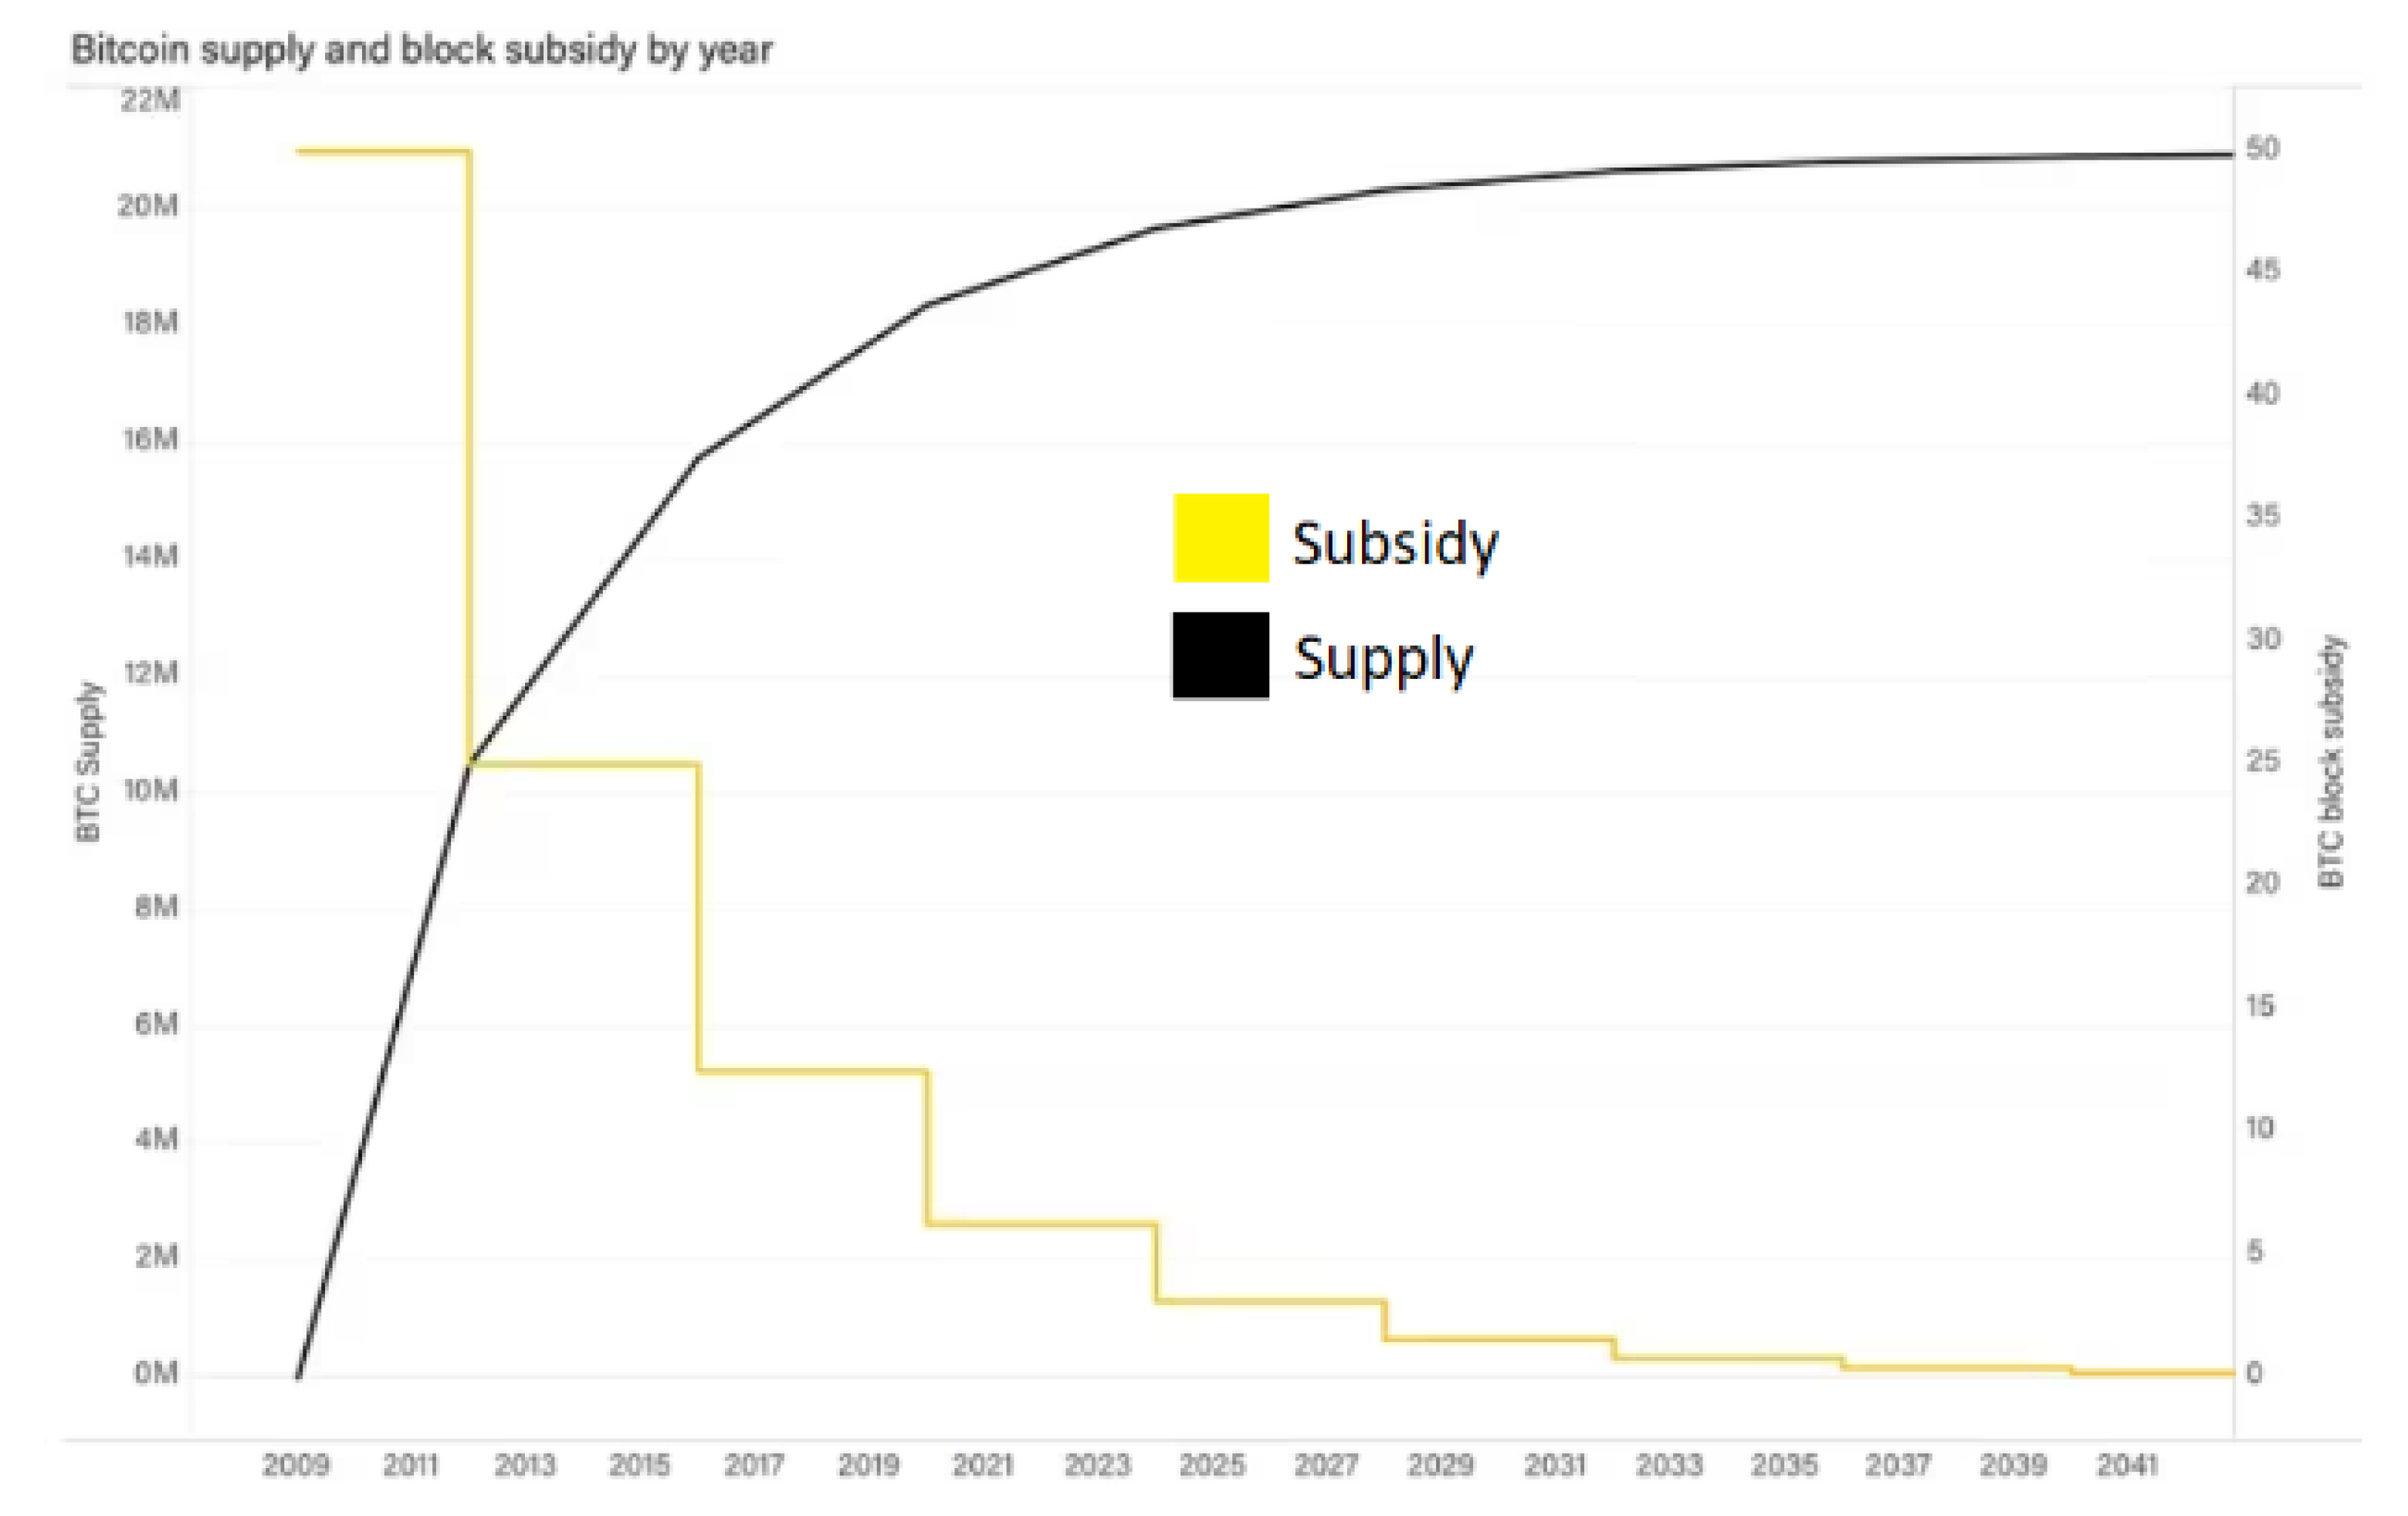
Bitcoin is capped at a total of 21 million coins. The foundational code guarantees the existence of only 21 million bitcoins. This fixed supply of Bitcoin serves as a robust economic assertion and reinforces its valuation framework. Bitcoin is disseminated through the process of mining. The 21 million bitcoins that are currently available to mine are anticipated to be fully mined by the year 2140. Given the current emission rate, all mineable bitcoins are likely to be exhausted before this projected timeframe. Close to 90% of Bitcoin's overall supply has already been mined, with approximately 900 bitcoins being mined daily. In order to sustain emission and bolster scarcity, the volume of bitcoins issued per block undergoes periodic reductions. This mechanism of decreasing bitcoin issuance per block is commonly referred to as Bitcoin Halving. Following a set block height, the quantity of bitcoins issued per block is halved from the previous amount. Bitcoin experiences a new halving event after every 210000 blocks or roughly every 4 years.
Four years after bitcoin’s genesis block and after over 10 million Bitcoins and 210000 blocks have been mined, the first halving occurred on November 28, 2012. The first halving event reduced the Bitcoin mining reward to 25 Bitcoins per block from an initial 50 Bitcoins per block. The second Bitcoin Halving occurred on July 09, 2016. And the Bitcoin mining reward reduced from 25 Bitcoins to 12,5 Bitcoins. The last Bitcoin halving happened on May 11, 2020, at the block height of 630000. Bitcoin’s block reward was reduced from 12,5 to 6,25. (coingecko.com 2024)
The next Bitcoin halving is expected to happen on April 20, 2024, at the block height of 840000. When this happens, Bitcoin’s block reward will be reduced to 3,125.
The
Figure 1 below (Hertig 2024) illustrates the developments in tokenomics and miners’ rewards as a result of bitcoin halving. It shows a consistent decrease in block rewards as the supply gradually slows down with each halving. (coingecko.com 2024)
The bitcoin supply has been completely mined in the year 2140, so than the miners’ encouragement will be sustained by transaction fees paid by users of the bitcoin blockchain.
These events have a profound impact on the supply of new Bitcoin entering circulation, leading to discussions and debates about their implications for the market (El Mahdy 2021; Mahdy 2021; Masters 2019; Meynkhard 2019; Pan et al. 2020; Patel 2021; Ramadhani 2022; Schär 2020). Understanding the dynamics of Bitcoin halving events is crucial for grasping the broader trends in the cryptocurrency landscape and anticipating potential price movements.
This article aims to delve into the historical context of Bitcoin halving events, examining the conditions and prices of Bitcoin before and after each halving. By conducting a systematic analysis of past halving events and comparing their outcomes, this study seeks to shed light on the patterns and trends associated with these milestone occurrences. Additionally, this article will explore future expectations and predictions for the upcoming Bitcoin halving event.
Through this exploration of Bitcoin halving events, we aim to provide a comprehensive understanding of their impact on the cryptocurrency market and offer insights into what the future may hold for Bitcoin and the broader blockchain ecosystem.
In the Whitepaper by Nakamoto (Nakamoto 2009) the concept of Bitcoin halving was introduced as a mechanism to control the issuance of new coins and maintain scarcity within the blockchain ecosystem. The author emphasized the importance of halving events in regulating the supply of Bitcoin and its impact on mining incentives.
The phenomenon of Bitcoin halving has been a subject of extensive research and analysis within the cryptocurrency community, attracting the attention of scholars, economists, and market analysts. Several studies (binance.com 2024; bitpanda.com 2024; Chan et al. 2023a, 2023b; Chaturved 2024; Chohan 2019; Coinbase 2024; CoinDCX 2024; Conway 2024; Crawley 2020; Cuthbertson 2024; El Mahdy 2021; ET Spotlight team 2024; Howcroft and Wilkes 2024; Kuhn 2024; Mahdy 2021; Masters 2019; M’bakob 2024; Meynkhard 2019; Pan et al. 2020; Patel 2021; Ramadhani 2022; Samizadeh 2024b, 2024a; Schär 2020; Singla et al. 2023; Valamontes 2024; Whittaker 2024;
www.ig.com 2024; Zhao 2024) have explored the implications of halving events on the supply dynamics, price stability, and market sentiment of Bitcoin. Conway (Conway 2024) and many other experts (Coinbase 2024; CoinDCX 2024; Cuthbertson 2024; ET Spotlight team 2024; Jahanshahloo et al. 2023; Meynkhard 2019; Schär 2020) emphasize that the Bitcoin Halving is when Bitcoin's mining reward split in the half. It takes the blockchain network about four years to open 210000 more blocks, a standard set by the blockchain's creators to continuously reduce the rate at which the cryptocurrency is introduced. Halving refers to the number of coins that miners receive for adding new transactions to the blockchain being cut in half, added Crawley (Crawley 2020).
Some research findings (de la Horra et al. 2019) show that Bitcoin behaves as a speculative asset in the short term. In the long term, however, speculation does not seem to influence demand for Bitcoin.
The results of research work by Curtois et al. (Courtois et al. 2013), about the reward halving scheme in Bitcoin, consider that the current Bitcoin specification mandates a strong 4-year cyclic property, and they find this property totally unreasonable and harmful and explain why and how it needs to be changed.
In the work of some experts, we can find thoughts and comparisons of Bitcoin with fiat currencies and, or gold (Jiménez et al. 2024; Baur and Mcdermott 2009; Dyhrberg 2016). In fact, the Commodity Futures Trading Commission (CFTC), states that Bitcoin is determined to be a commodity (as gold) under the Commodity Exchange Act (Lucking et al. 2019). However, the mining cost is the underlying value of Bitcoin. (Jiménez et al., 2024)
Wang et al. (Wang et al. 2020), Meynkhard (Meynkhard 2019) and Cuthbertson (Cuthbertson 2024) point out that it is noteworthy that every transaction made is verified by a miner, which solves a difficult mathematical puzzle (a block) avoiding double spending and being recorded in a decentralized ledger, in a blockchain. This verification provides a reward to the miner issuing new coins which is the main incentive to solve this algorithm. But this reward is not always the same, the Bitcoin protocol was designed to reduce the reward to half every 210,000 blocks which, in time, is around every four years. This event is named, Bitcoin halving, Bitcoin mining difficulty or halvening, which follows a geometric series diagram and converts Bitcoin into a deflationary currency.
Therefore, Bitcoin's fundamental thought could be the halving effect, occurred every four years. These investigations view this event as a structural change and a potential source of price performance based on historical data as well as other market-specific influencing factors (Ciaian et al., 2015; Meynkhard 2019; Wang et al. 2020)
The Bitcoin halving cycle suggests that Bitcoin price movement follows specific sequences and is independent of other assets. This has significant implications for Bitcoin properties, encompassing its risk profile, volatility dynamics, safe haven properties, and hedge properties. For instance, Bitcoin should be negatively correlated to the stock market to exhibit safe haven and hedge properties according to the framework proposed (Baur et al. 2009).
However, Bitcoin halving cycle implies independence (no correlation) of stock market movements. Given the predictability of the Bitcoin price movement, Bitcoin could exhibit time-varying properties that might not be inherent. Furthermore, given the distinctiveness of the three stages within a cycle, there could be certain volatility dynamics that are specific to each stage. While the Bitcoin halving cycle may impact Bitcoin safe haven, hedge properties, and volatility dynamics, these findings may not hold significance without significant industrial and institutional exposures and interests (Chan et al. 2023a, 2023b)
Some authors focused on the price of the Bitcoin and analysis of financial bubbles (Agosto and Cafferata 2020; Azamjon et al. 2016; Bendiksen and Gibbons 2018, 2019a, 2019b; Butek 2016; Deutsch 2018; Fantazzini and Kolodin 2020; John et al. 2022; Kiffer and Rajaraman 2021; M’bakob 2024; Phiri, 2022; Prasad 2022; Riposo 2023; Sedlmeir et al. 2020b, 2020a; Wu et al. 2023), others on the prediction of future developments (Cuthbertson 2024; Katanich 2024). Some researcher works compare the development not only of Bitcoin, but also of other cryptocurrencies (Albrecher et al. 2022; Bakhtiar et al. 2023; Cengiz 2021; Gkillas and Longin 2019; Katanich 2024; Kawaguchi and Noda 2022; Lucking et al. 2019; Rashid et al. 2023; Sen and Jena 2022; Singla et al. 2023; Touloupou et al. 2022; Trucíos and Taylor 2023; Vaddadi et al. 2023; Yuan et al. 2022). A different point of view was used in the works (Bâra and Oprea 2024; Eksi and Schreitl 2022; Hayes 2015; Lasi and Saul 2020; Samizadeh 2024a; Jiménez et al. 2024) with use of models to analyze and predict the market and price changes.
Halving presents a complex scenario, signifying different outcomes for distinct stakeholders. From an investor's perspective, halving represents a shift towards reduced bitcoin creation rates and a potential decline in miner sell-offs. Historical patterns suggest a favorable impact of the anticipated scarcity on investor sentiment, triggering an optimistic outlook towards bitcoin's valuation and potentially driving increased investment activity. While past mining events have yielded positive outcomes, the influence of halving events on bitcoin's market price remains subject to fluctuations, heavily contingent on the prevailing market environment (coingecko.com 2024).
Leading up to the 2020 halving, bitcoin's price surged by approximately 40%, fueled by speculative behavior among investors and the ensuing market projections. Post-halving, bitcoin's value soared to triple its previous all-time high, hitting a new peak of 67000 USD.
For miners, halving signifies a diminished reward structure, posing financial challenges. The operation and maintenance of a bitcoin mining facility entail substantial costs, with miners relying on block rewards to offset these expenditures as a primary revenue source. Upon halving, miners experience a 50% reduction in revenue, significantly impacting their income streams. Considering prevailing market values and operational costs, miners may be compelled to close down mining operations if revenue fails to cover operational expenses adequately. As miners discontinue operations, the overall mining hashrate is anticipated to decline. A drop in mining hashrate has the potential to impede the efficiency of the bitcoin network, resulting in delayed transaction processing on the blockchain. Restoration of hashrate levels could occur if bitcoin's price undergoes sustained growth, encouraging miners to re-enter the mining sphere upon achieving profitability once again.
2. Methodology
This study employs a methodology to analyze and compare the historical data surrounding Bitcoin halving events, focusing on understanding the conditions and price movements of Bitcoin both before and after each halving. The analysis is structured to provide a comprehensive examination of the impact of these events on the cryptocurrency market and to draw meaningful insights for future predictions.
To begin, extensive historical data related to Bitcoin prices, market trends, and halving events were collected from reputable sources, including cryptocurrency exchanges, market data providers, and blockchain analytics platforms. These data formed the foundation for the comparative analysis of the last three Bitcoin halving events that occurred in 2012, 2016, and 2020.
The analysis involves a detailed examination of price trends, and market behavior, in the lead-up to each halving event and in the subsequent months that follow. By tracking the price movements and market reactions during these critical periods, this study aims to identify patterns, correlations, and potential causal relationships between Bitcoin halving events and market dynamics.
Moreover, as part of the analysis, we will use technical analysis indicators, these are Relative Strength Index (RIS) and Moving Average Convergence Divergence (MACD). In this way, we will try to provide a comprehensive view of how the halving over the years of Bitcoin's existence has affected its prices and how the aforementioned indicators have proved to be useful in its analysis.
The methodology includes statistical analysis and visualization techniques to present the data in a clear and concise manner. Charts and graphs are utilized to illustrate the key findings and trends emerging from the analysis of previous halving events, facilitating a deeper understanding of the market dynamics at play.
In addition to the retrospective analysis, this study also incorporates qualitative assessments and expert opinions to inform the predictions and expectations for the upcoming Bitcoin halving event. By synthesizing historical data with expert insights, this methodology seeks to offer a well-rounded perspective on the potential outcomes and scenarios that may unfold in the aftermath of the next halving event.
Overall, this methodology is designed to provide a framework for analyzing and comparing Bitcoin halving events, offering valuable insights into the historical trends and future expectations for the cryptocurrency market. Through a meticulous and systematic approach, this study aims to contribute to the growing body of knowledge on the impact of halving events on Bitcoin and the broader blockchain ecosystem.
We set two research questions.
Research question 1: Bitcoin, as a deflationary currency, has a fixed supply of 21 million BTC. Demand changes over time and depends on various factors. Bitcoin halving occurs every 4 years, when miners' block rewards will be slashed by half, thus decreasing the amount of BTC produced daily. The Bitcoin price is determined through supply and demand. A finite supply of Bitcoin mitigates inflation and deflation risks. Can we assume that when the supply decreases, the price increases?
Hypothesis 1: The Bitcoin price increased to reach the peak, within 6 months after the halving in each of the monitored periods.
Hypothesis 2: Following Bitcoin halving events, there is a consistent pattern where price peaks occur 6 months after the halving, followed by a subsequent decline leading to a trough at 18 months post-halving.
We followed these steps to do data processing and hypotheses evaluation methodology:
- -
We obtained historical data of Bitcoin daily price from 18 of July 2010 to 19 of March 2024, in csv format from a publicly available dataset (kaggle.com 2024)
- -
We used the mathematical and statistical analysis to describe the Bitcoin price development in time periods: 1st period is after 1st Bitcoin halving 28.11.2012 – 8.7.2016; 2nd period is after 2nd Bitcoin halving 9.7.2016 – 10.5.2020, and the 3rd period is after 3rd Bitcoin halving 11.5.2020 – 19.3.2024. We used also regression analysis, graphical display of data, and the rainbow chart.
- -
We used also regression analysis to evaluate hypotheses. The main purpose of regression analysis is to examine and characterize the interrelationships between variables. Its task is to find a mathematical function, also called a regression function, or regression model that will best describe the course of dependence between variables, in our case it is a simple analysis where we deal with one independent variable, the dependent variable Y will depend on the independent variable X. For the purposes of the regression analysis, we set the independent variable as the number of days after the halving event. This variable represents the time elapsed since the Bitcoin halving event occurred. We set also the dependent variable as the Bitcoin price, with the special attention at the peak or trough. This variable reflects the value of Bitcoin at the highest price peak or lowest price trough following each halving event.
3. Results
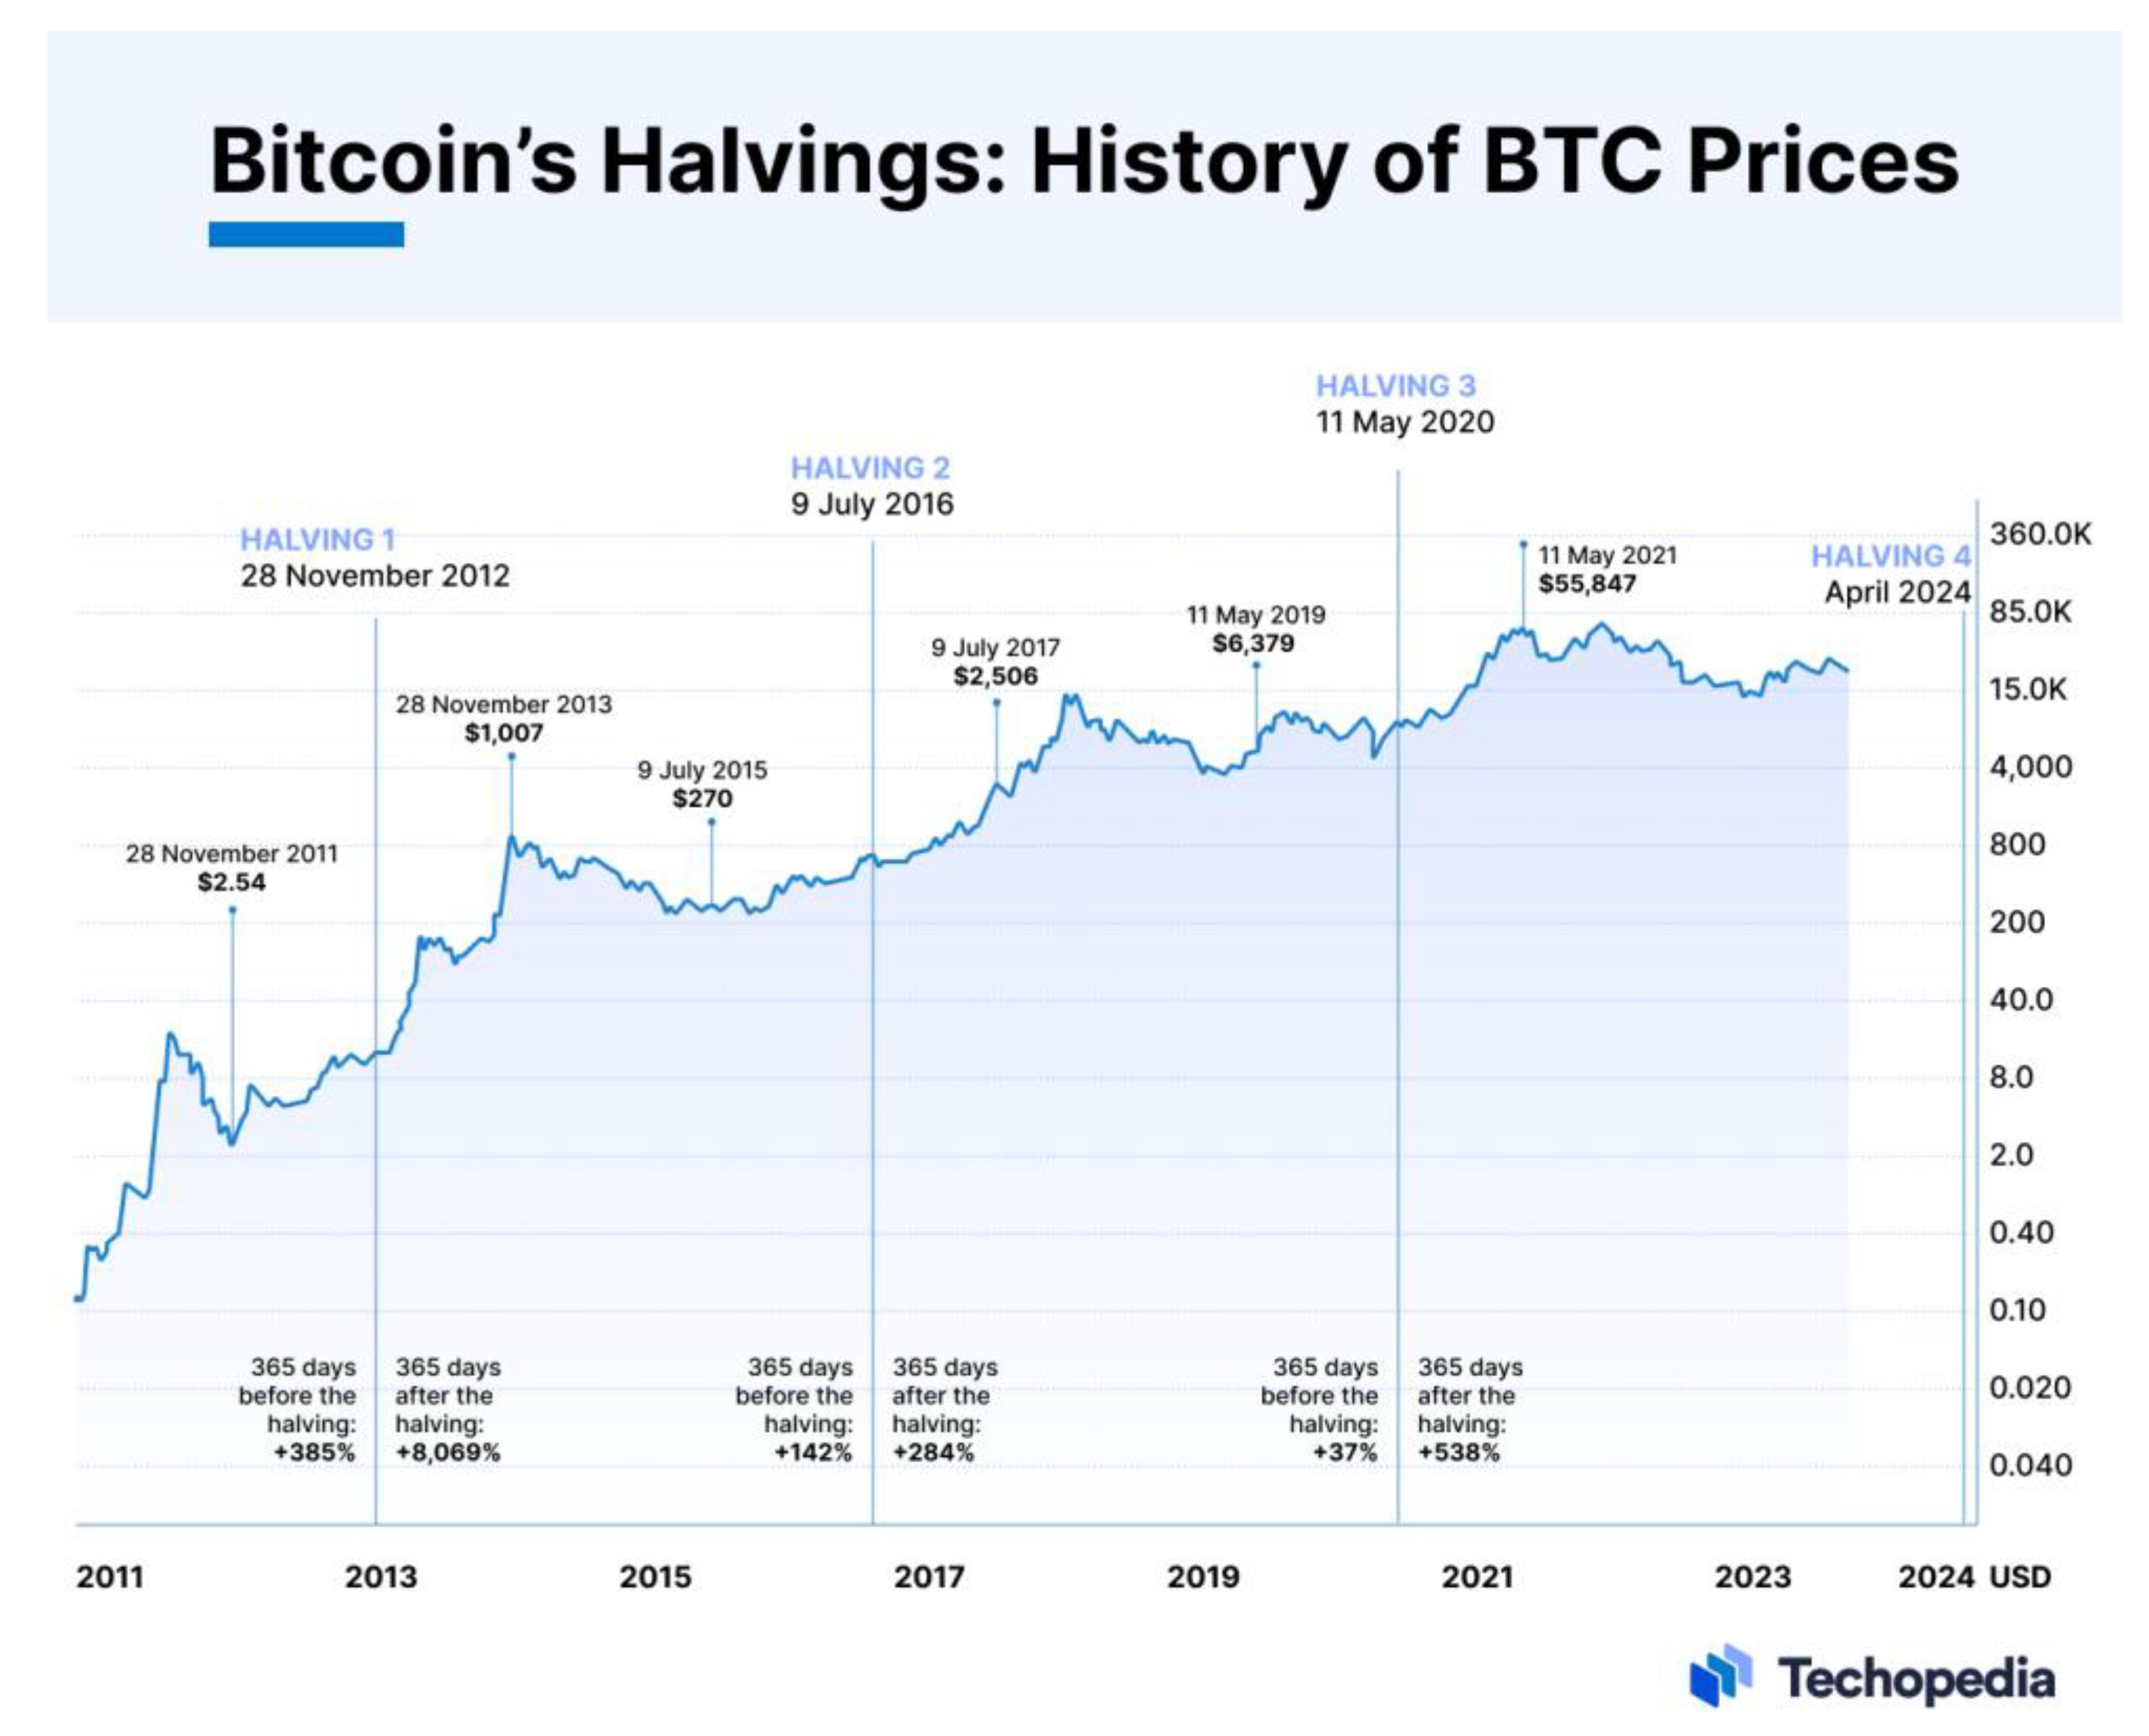
We focused on the three previous Bitcoin halving events that took place in 2012, 2016 and 2020, how it describes the
Figure 2 below (Dierks 2024). First, we will describe the data in individual years, so that we can then proceed to comparisons. The data were downloaded from ConiMarketCap (Coinmarketcap.Com 2024). We used Trading View online platform to create the graphs and charts.
3.1. First Bitcoin halving
The first Bitcoin halving took place on November 28, 2012, which was approximately four years after its launch. The Bitcoin market was relatively new and small at this time, and there was very little data available to develop an accurate technical analysis of Bitcoin's price. The first halving cut the mining reward in half, from 50 BTC to 25 BTC per block. This event represented a significant moment in the history of bitcoin, as it demonstrated the viability of the cryptocurrency economic model.
After the first halving, the price of Bitcoin rose from about 12 USD to 260 USD within a year. It took about 400 days for the price to peak after the halving. This increase in price was caused by a decrease in supply, which made Bitcoin more scarce and therefore more valuable. The halving caused an increase in competition among miners and thus increased the cost of mining it, which also led to an increase in the price of Bitcoin.
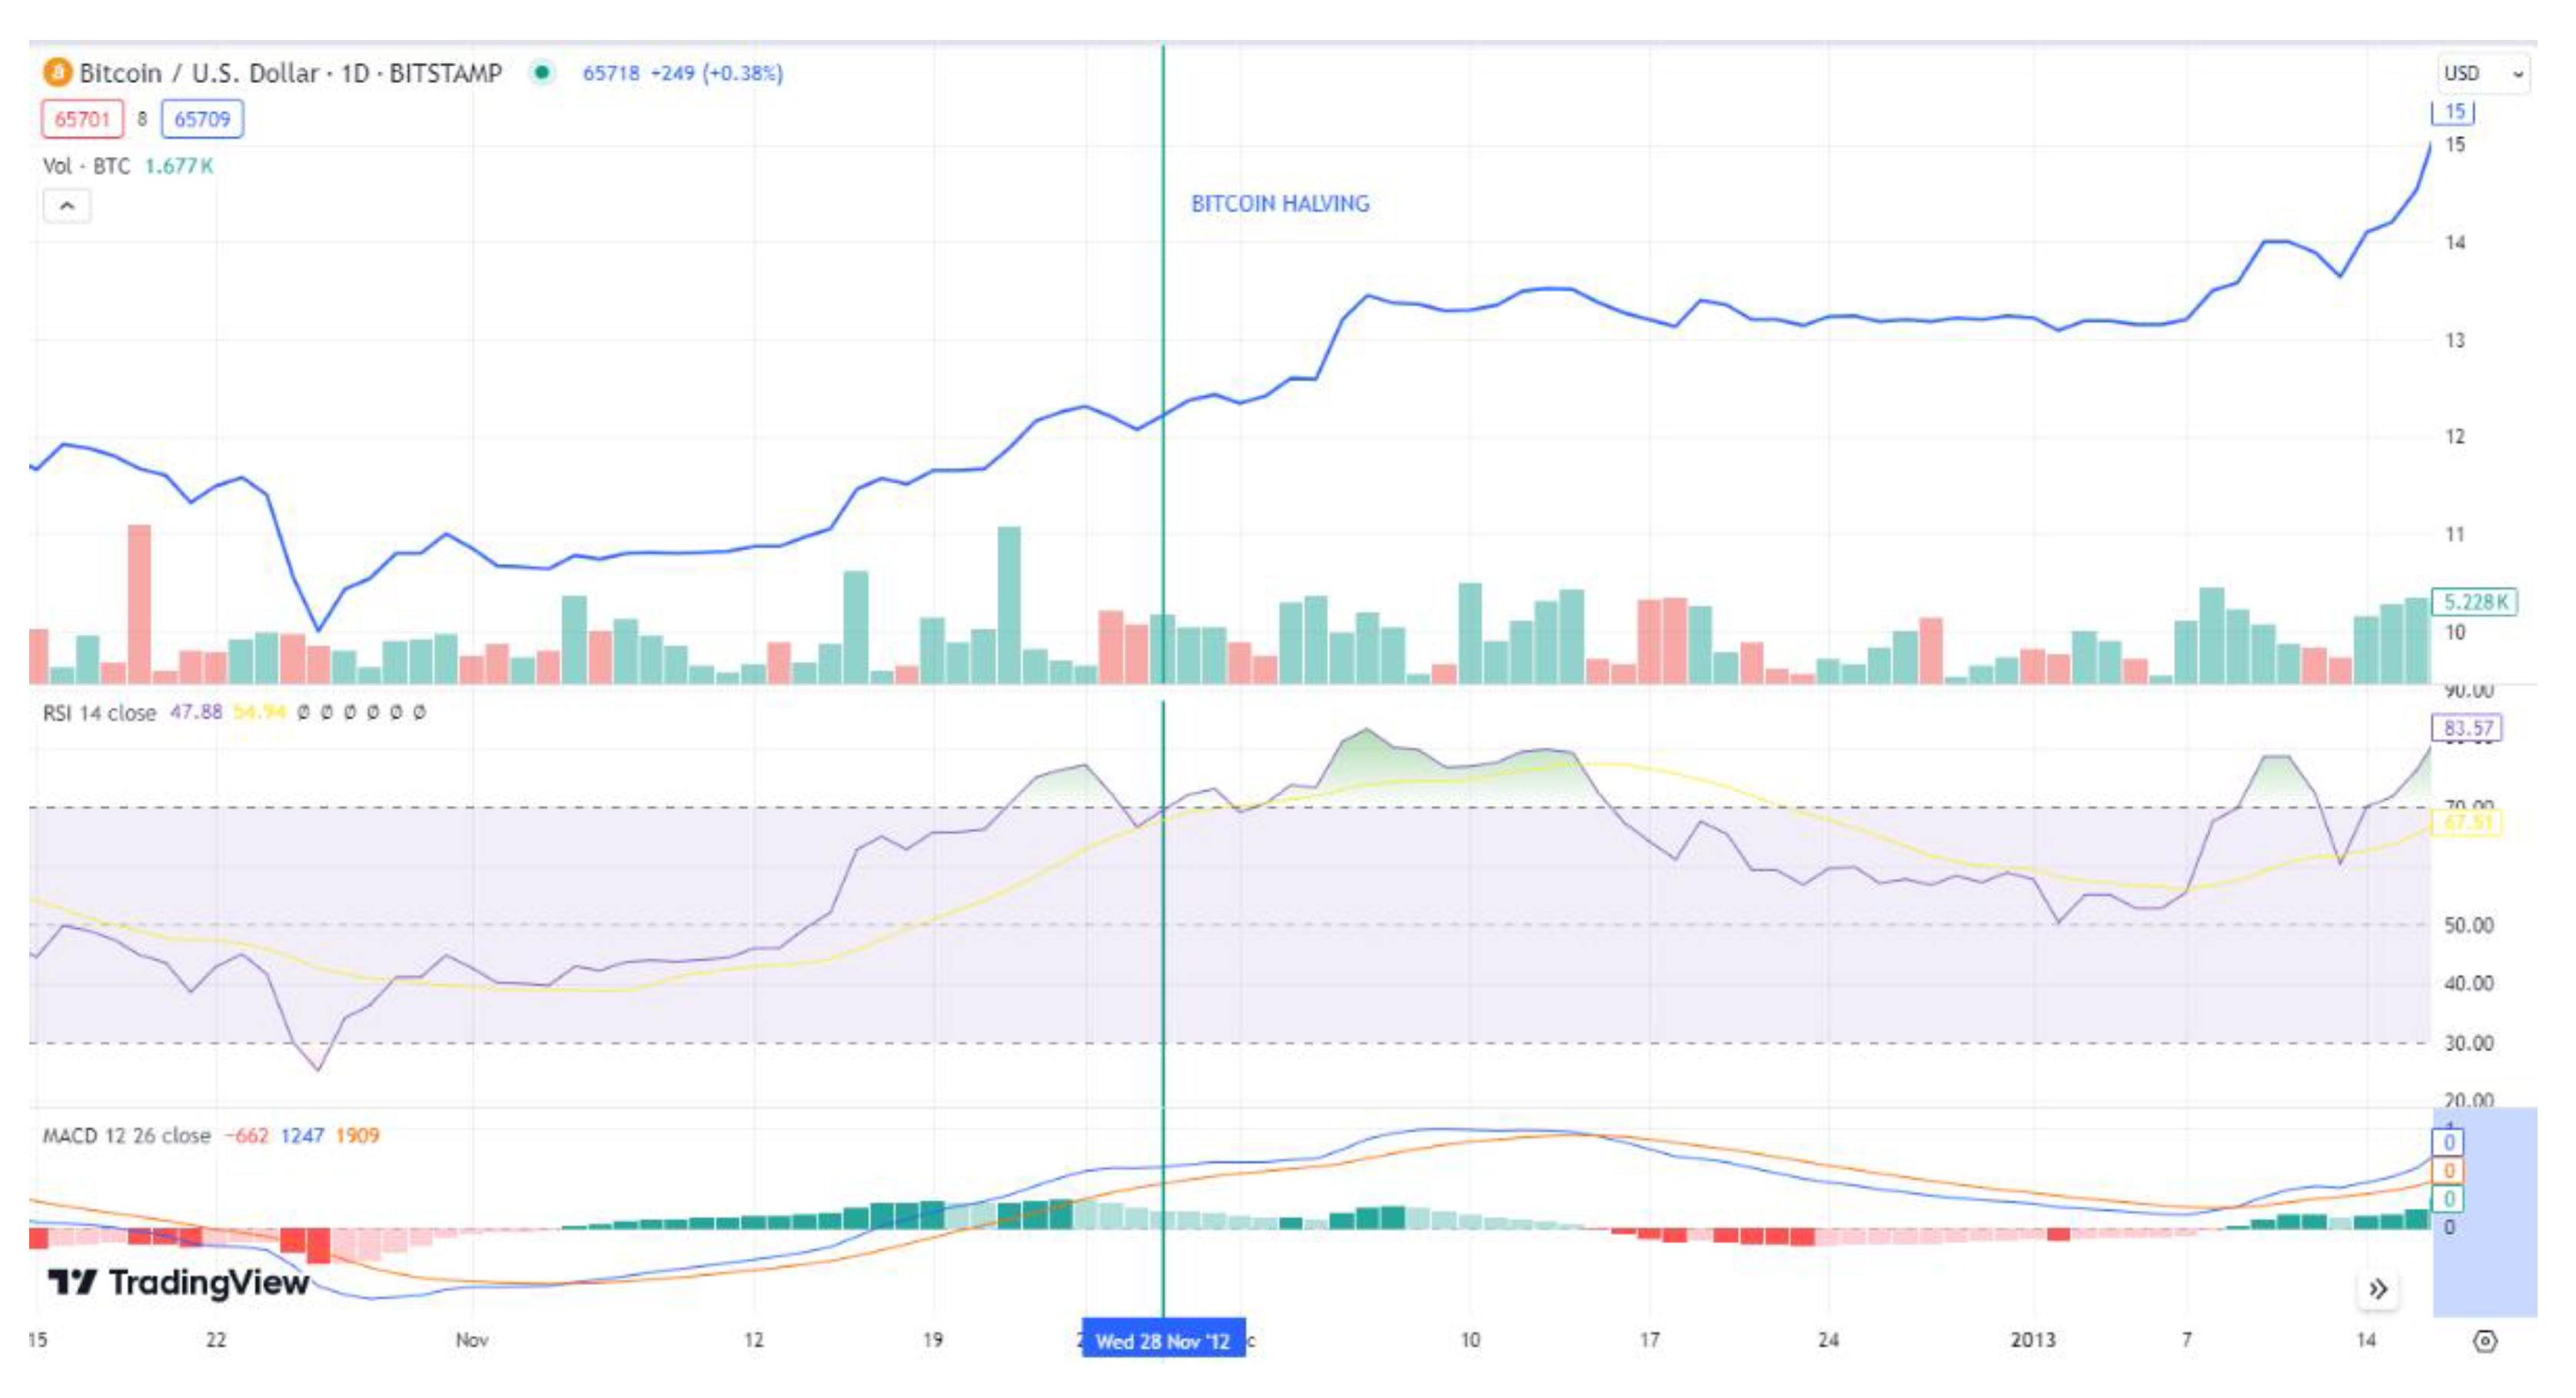
The
Figure 3 shows the price of Bitcoin and the levels of the MACD and RIS indicators at the time of the first Bitcoin halving. On the chart, we can see that the MACD indicator was below zero at the time of the first halving and the signal line became divergent from the line chart, which means that the Bitcoin market was in a bullish trend at that moment. The intersection of the MACD curve with the signal line was reached at the beginning of November, and thus the Bitcoin market entered the bullish trend approximately three weeks before the halving. The MACD curve together with the signal curve remained above the zero value even after the halving event, which indicated that the price could continue to rise.
RIS – during the first Bitcoin halving, this indicator was at a level around 70, which indicates overbought market, which may lead to a drop in price.
From the analysis of the first halving period, several signs of a bullish trend can be seen. Since Bitcoin was a new cryptocurrency with a small user community at the time, it was difficult to predict the direction of the future price movement.
3.2. The period between the first and second halving
After the first halving, Bitcoin went through a period of consolidation and its prices gradually increased. In March 2013, Bitcoin reached a new all-time high and crossed the mark 20 USD. Overall, Bitcoin was able to reach 260 USD within a few months after the halving. This massive price increase was followed by a correction and its price dropped to around 10 USD. The price of Bitcoin eventually stabilized in the range of 80-100 USD over the course of the following year and was therefore a significant increase compared to the pre-halving price. During this period, between the first and second halving, the Bitcoin ecosystem became more mature. It was able to do this despite the problems caused by the collapsing Mt.Gox exchange (it was the largest cryptocurrency exchange at the time).
This period is characterized by significant fluctuations in the price and overall instability of the Bitcoin market. External factors also influenced the market, such as the interest of institutional investors in bitcoin. The Bitcoin ecosystem continued to grow, the number of merchants accepting bitcoin as a payment method increased, and significantly more venture capital began flowing into bitcoin startups. Bitcion's price gradually increased until the second halving, which occurred in 2016 (Meynkhard 2019).
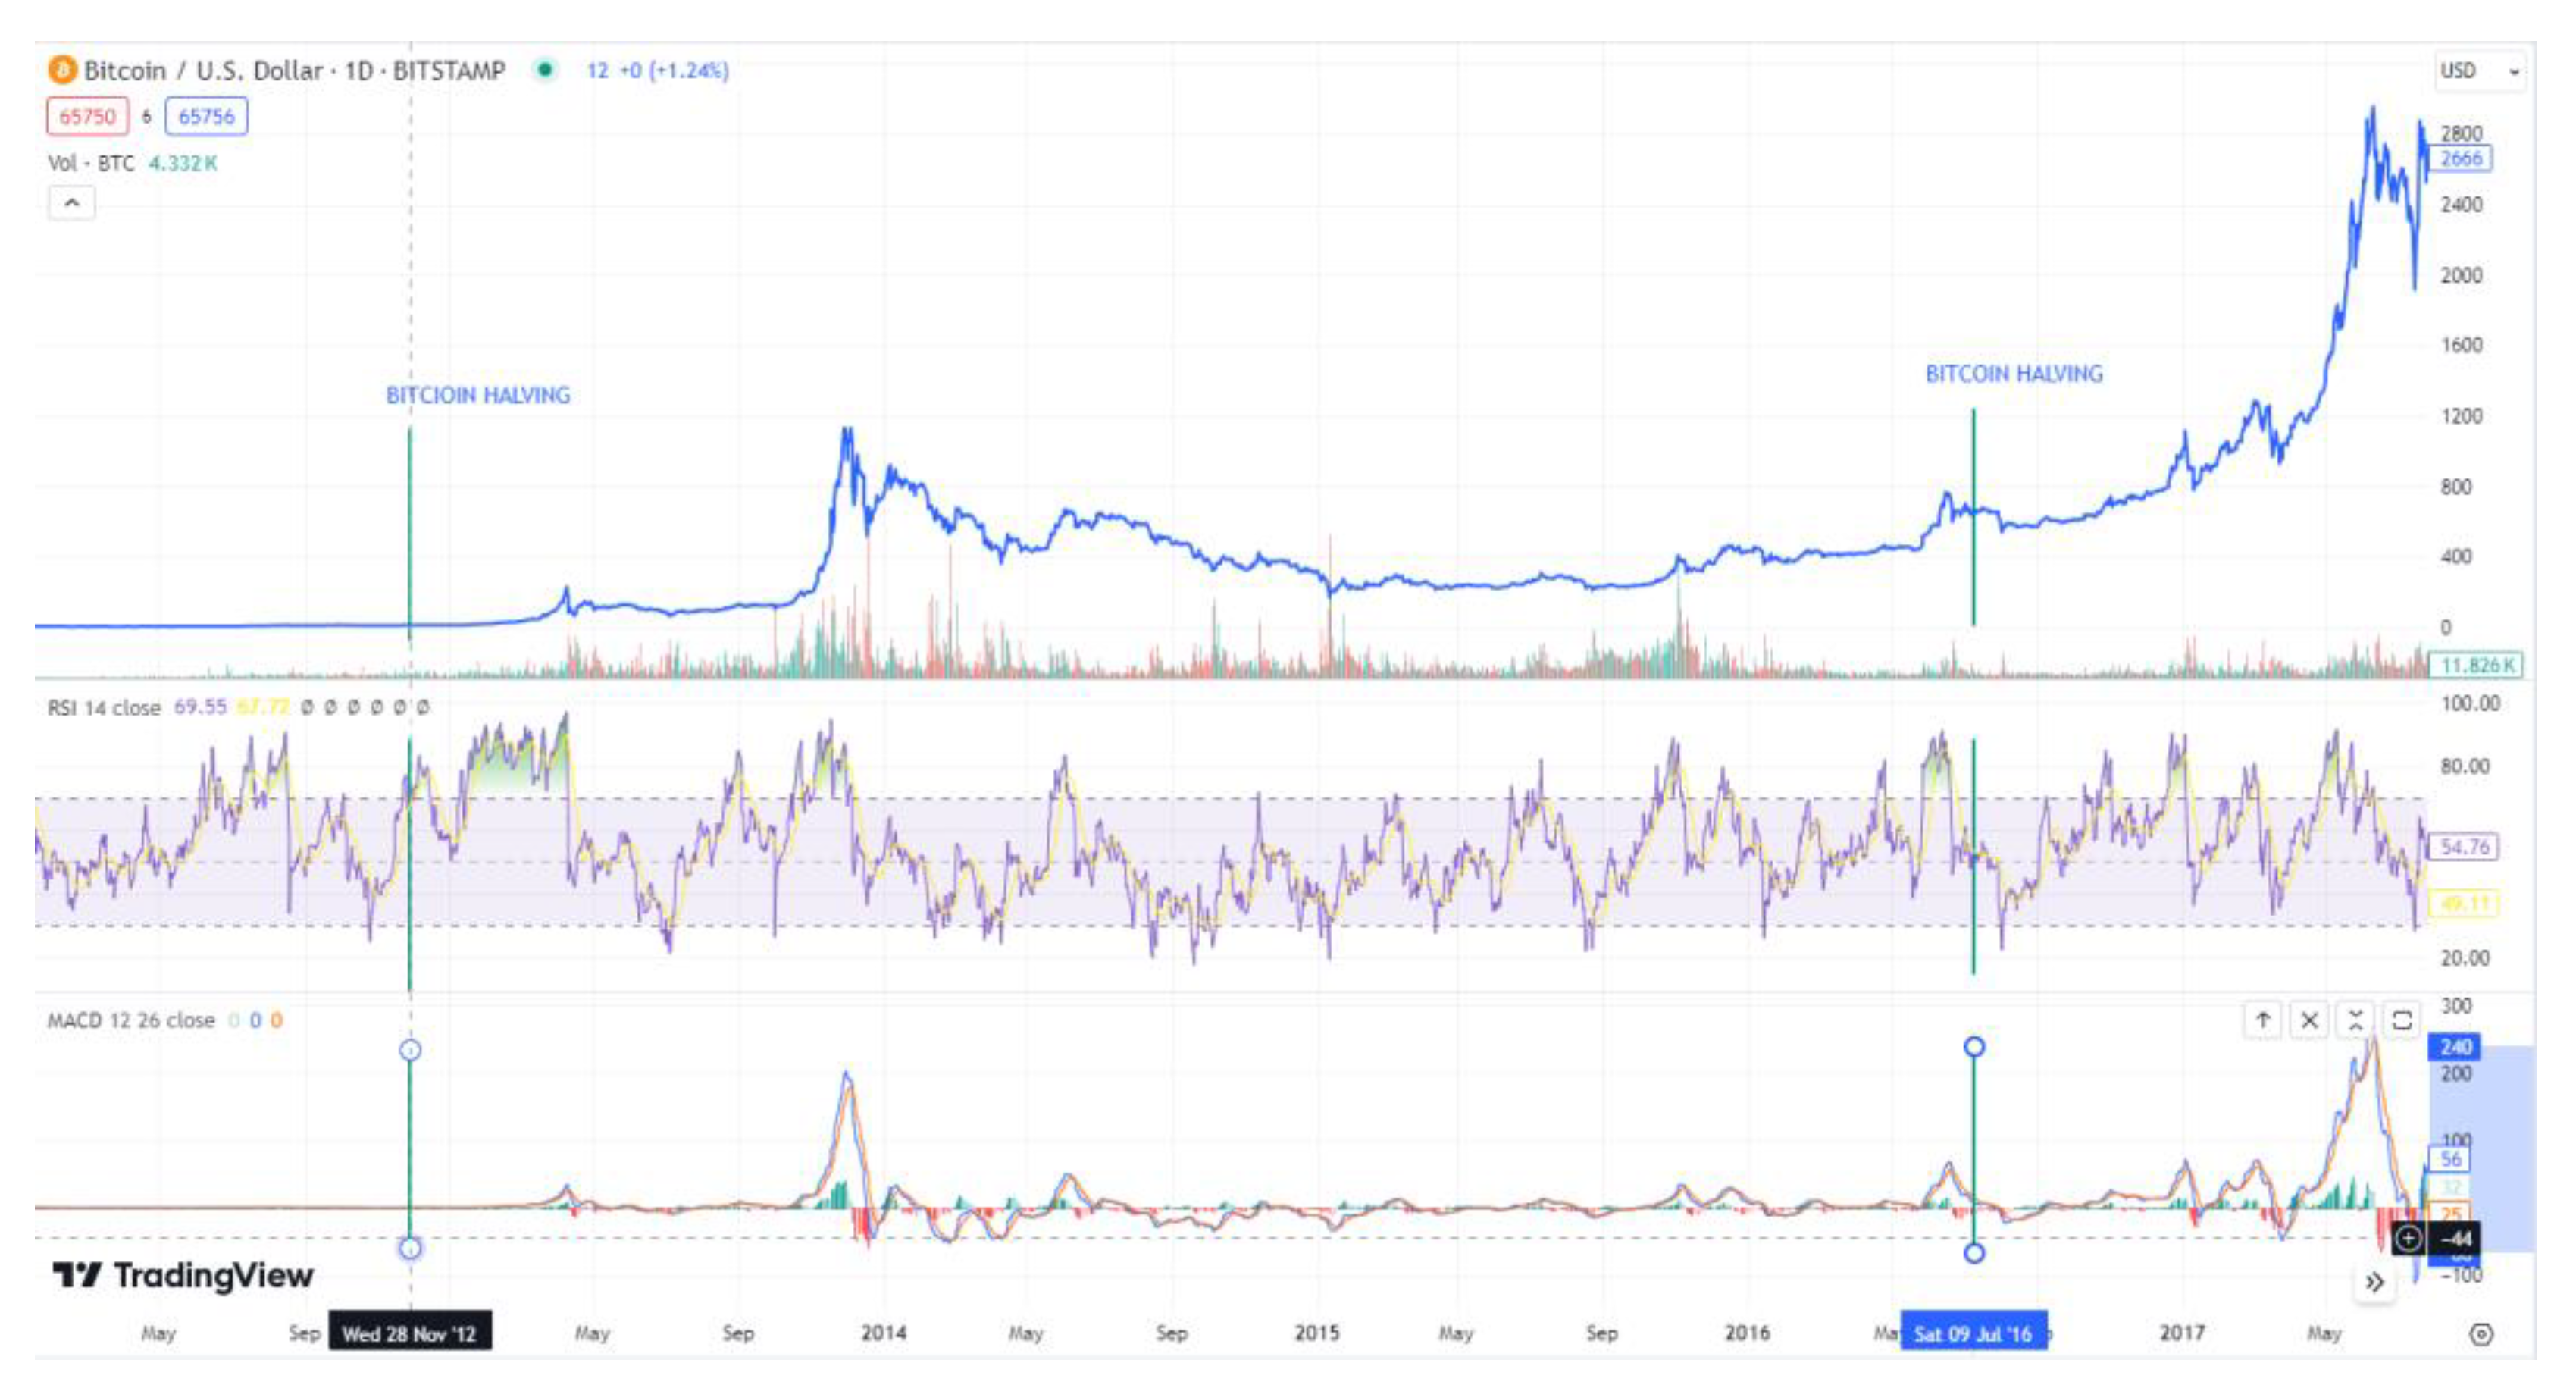
The
Figure 4 shows the price together with the indicators in the range between the first and second halving. When using indicators of technical analysis, it is possible to observe significant changes in the market. For example, the MACD indicator showed that the market was in an upward trend in the first third of the selected period and also at the end of the period before the second Bitcoin halving. On the MACD line chart, the crossings of the MACD curve with the signal curve are marked by red ellipses, the so-called bullish crossover", which symbolizes a reversal to a bullish trend. This indicated that the price may continue to rise.
The RIS indicator showed that there was overbought several times during this period. However, this condition has always turned out to be a temporary price correction rather than a long-term price reduction. It is clear from the chart that the Bitcoin market was in an overbought state between the first and second halving.
From the analysis of the period between the first and second halving, it follows that this time period was characterized by great instability and significant price fluctuations, which could cause possible changes in trends and market overbought, new markets and trading platforms will also appear, which increased the volume of trading and thus also market liquidity.
3.3. The second Bitcoin halving
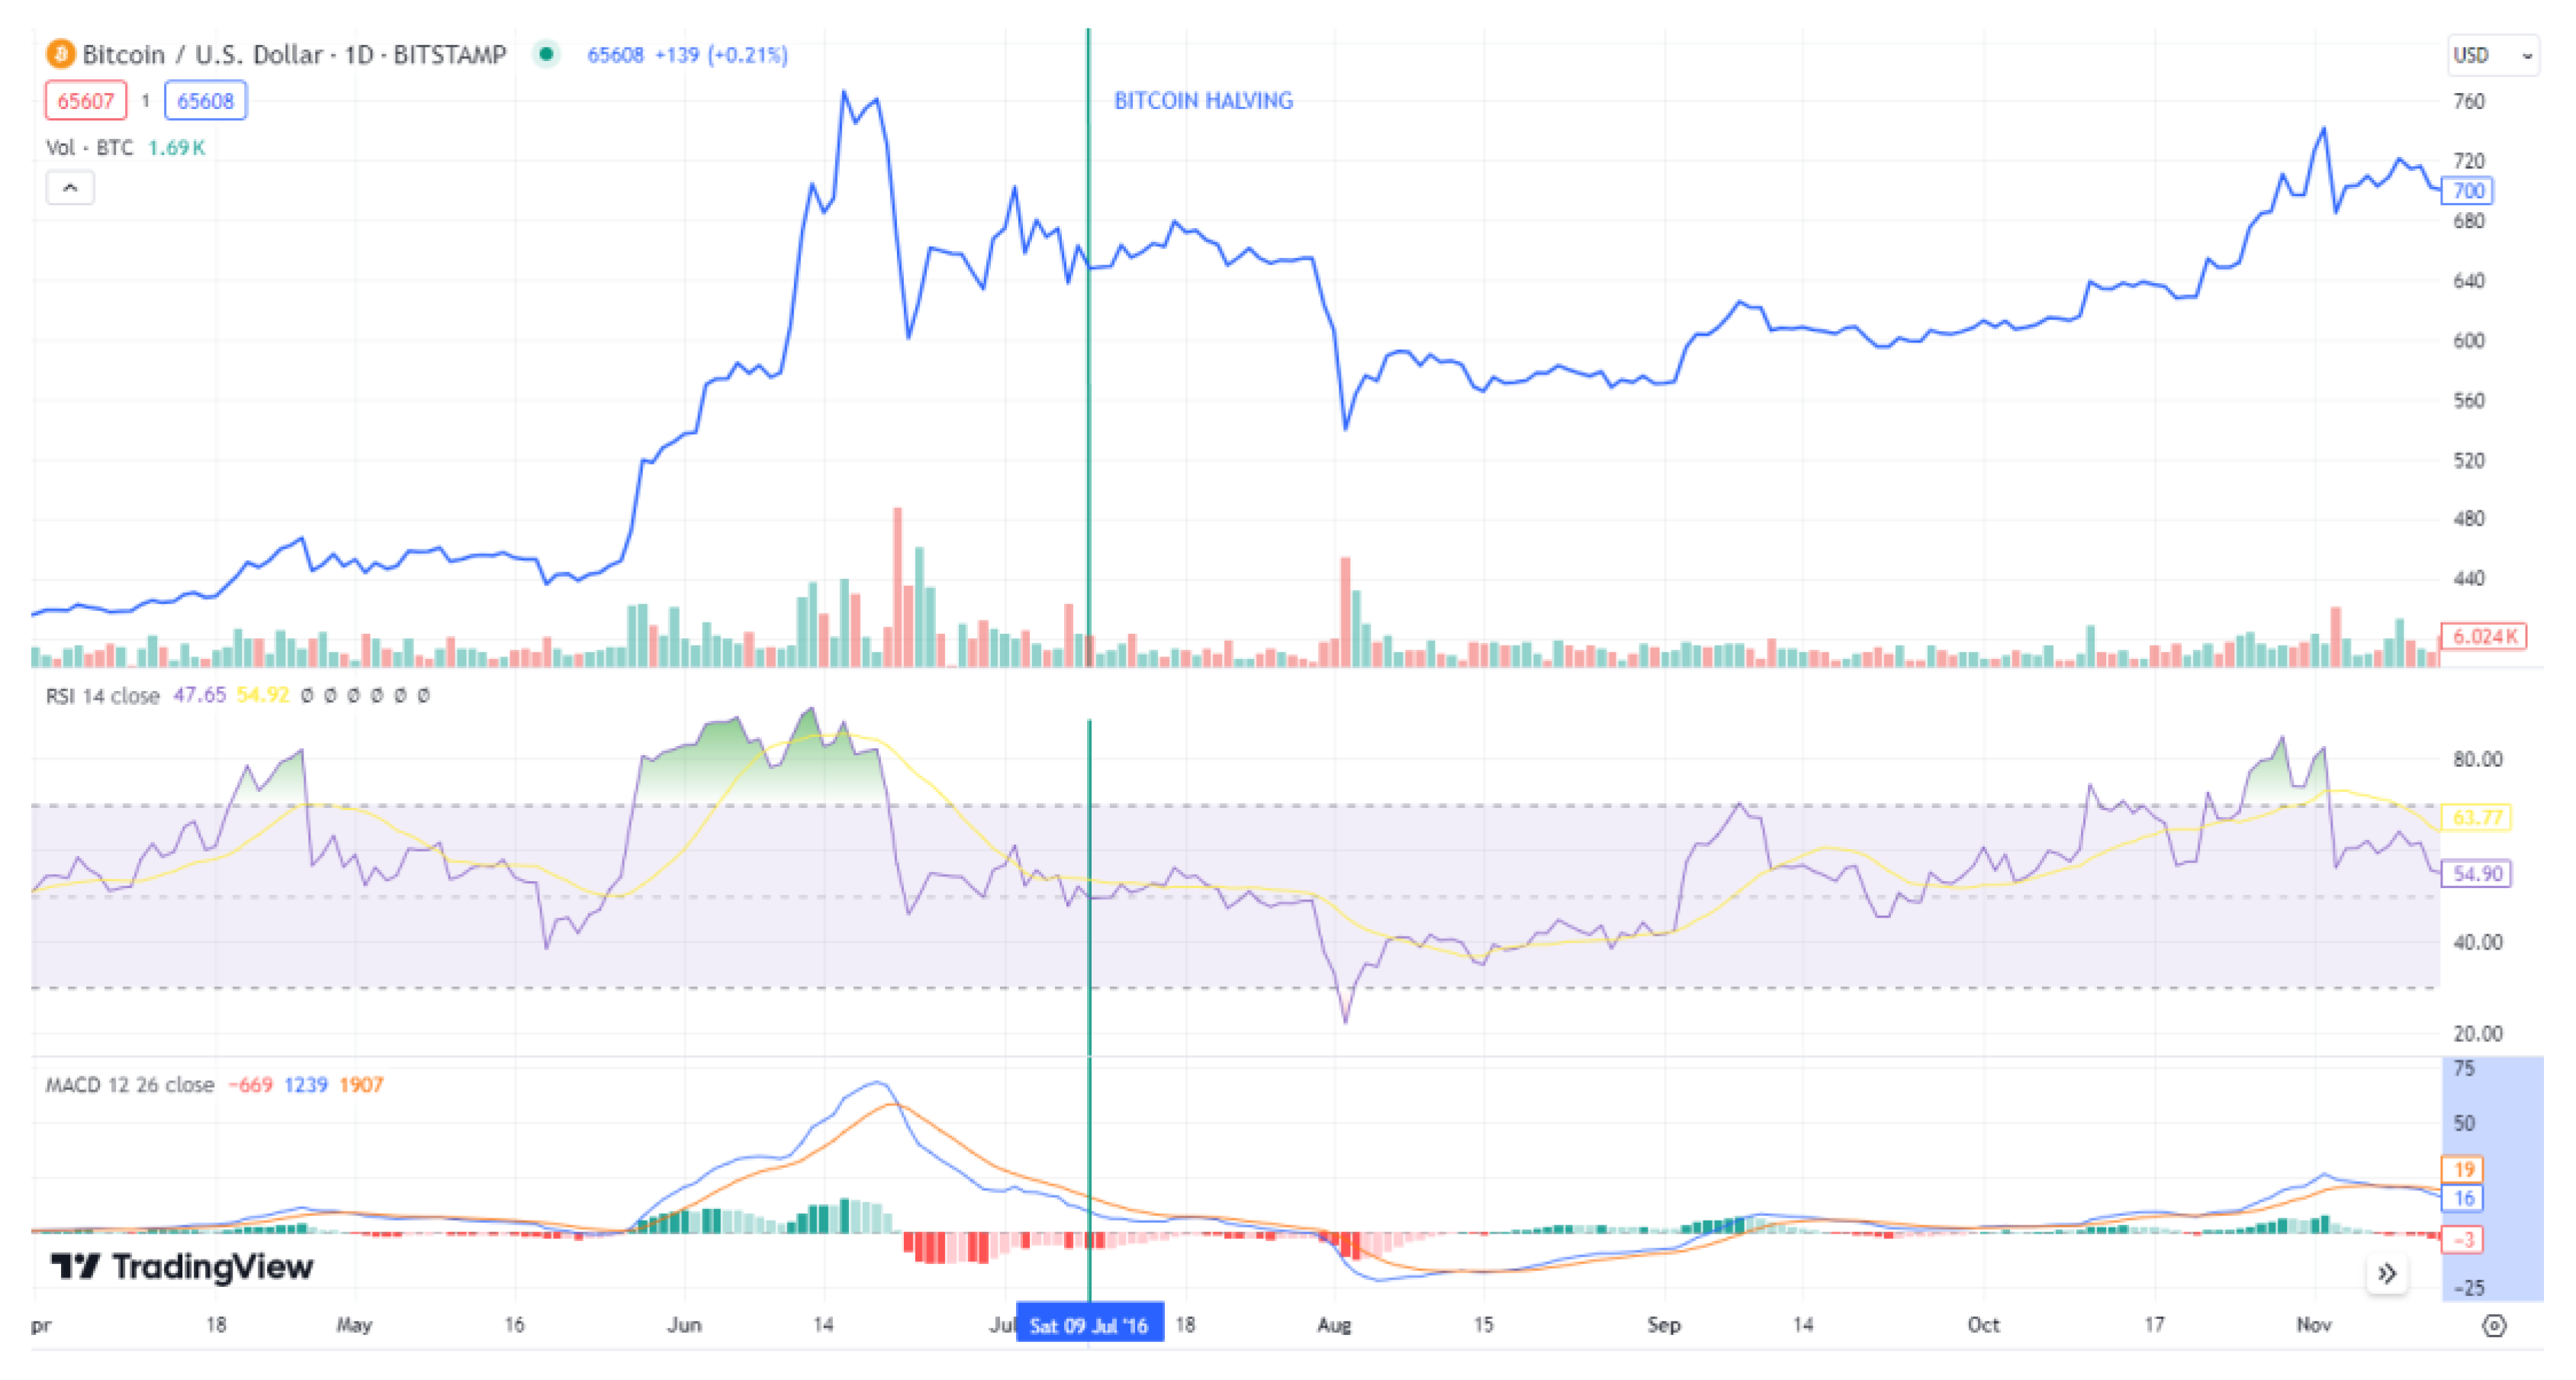
In July 2016, the second Bitcoin halving event took place, which resulted in the reduction of the mining reward per block from 25 BTC to 12,5 BTC. This event is linked to the increased public interest in Bitcoin, which was also caused by more businesses and merchants starting to accept it as a payment method, despite the prevailing instability in the global market. The second halving, unlike the first, had a shorter consolidation, after which the price rebounded quickly, culminating in a surge that saw its value increase significantly from around 600 USD to over 19000 USD by December 2017. This increase was mainly attributed to a supply shock due to the process of halving the reward and also due to a greater appreciation of its function as a store of value. From this, the company promised itself better protection against the economic uncertainties prevailing at the time.
In the
Figure 5 the MACD indicator shows that the Bitcoin market was in a bullish period during the second halving as the MACD curve was at zero and the signal line became divergent from the line chart. This indicated that the price should continue to rise.
The RIS indicator, on the other hand, shows that the Bitcoin market was overbought at the time of the second halving. The price managed to stay at a relatively stable level and the corrections were low, temporary and not long-term.
Based on the results of the analysis, it was shown that during the second halving, the volatility was lower compared to the period between the first and second halving. The period is marked by possible changes in trends and an overbought state of the bitcoin market, a significant number of new investors and an increased volume of transactions. Bitcoin continued to be in a cycle of constant instability and price fluctuations. However, at the same time, the growing interest in cryptocurrency indicated the potential for price growth and the development of the cryptocurrency market.
3.4. The period between the second and third Bitcoin halving
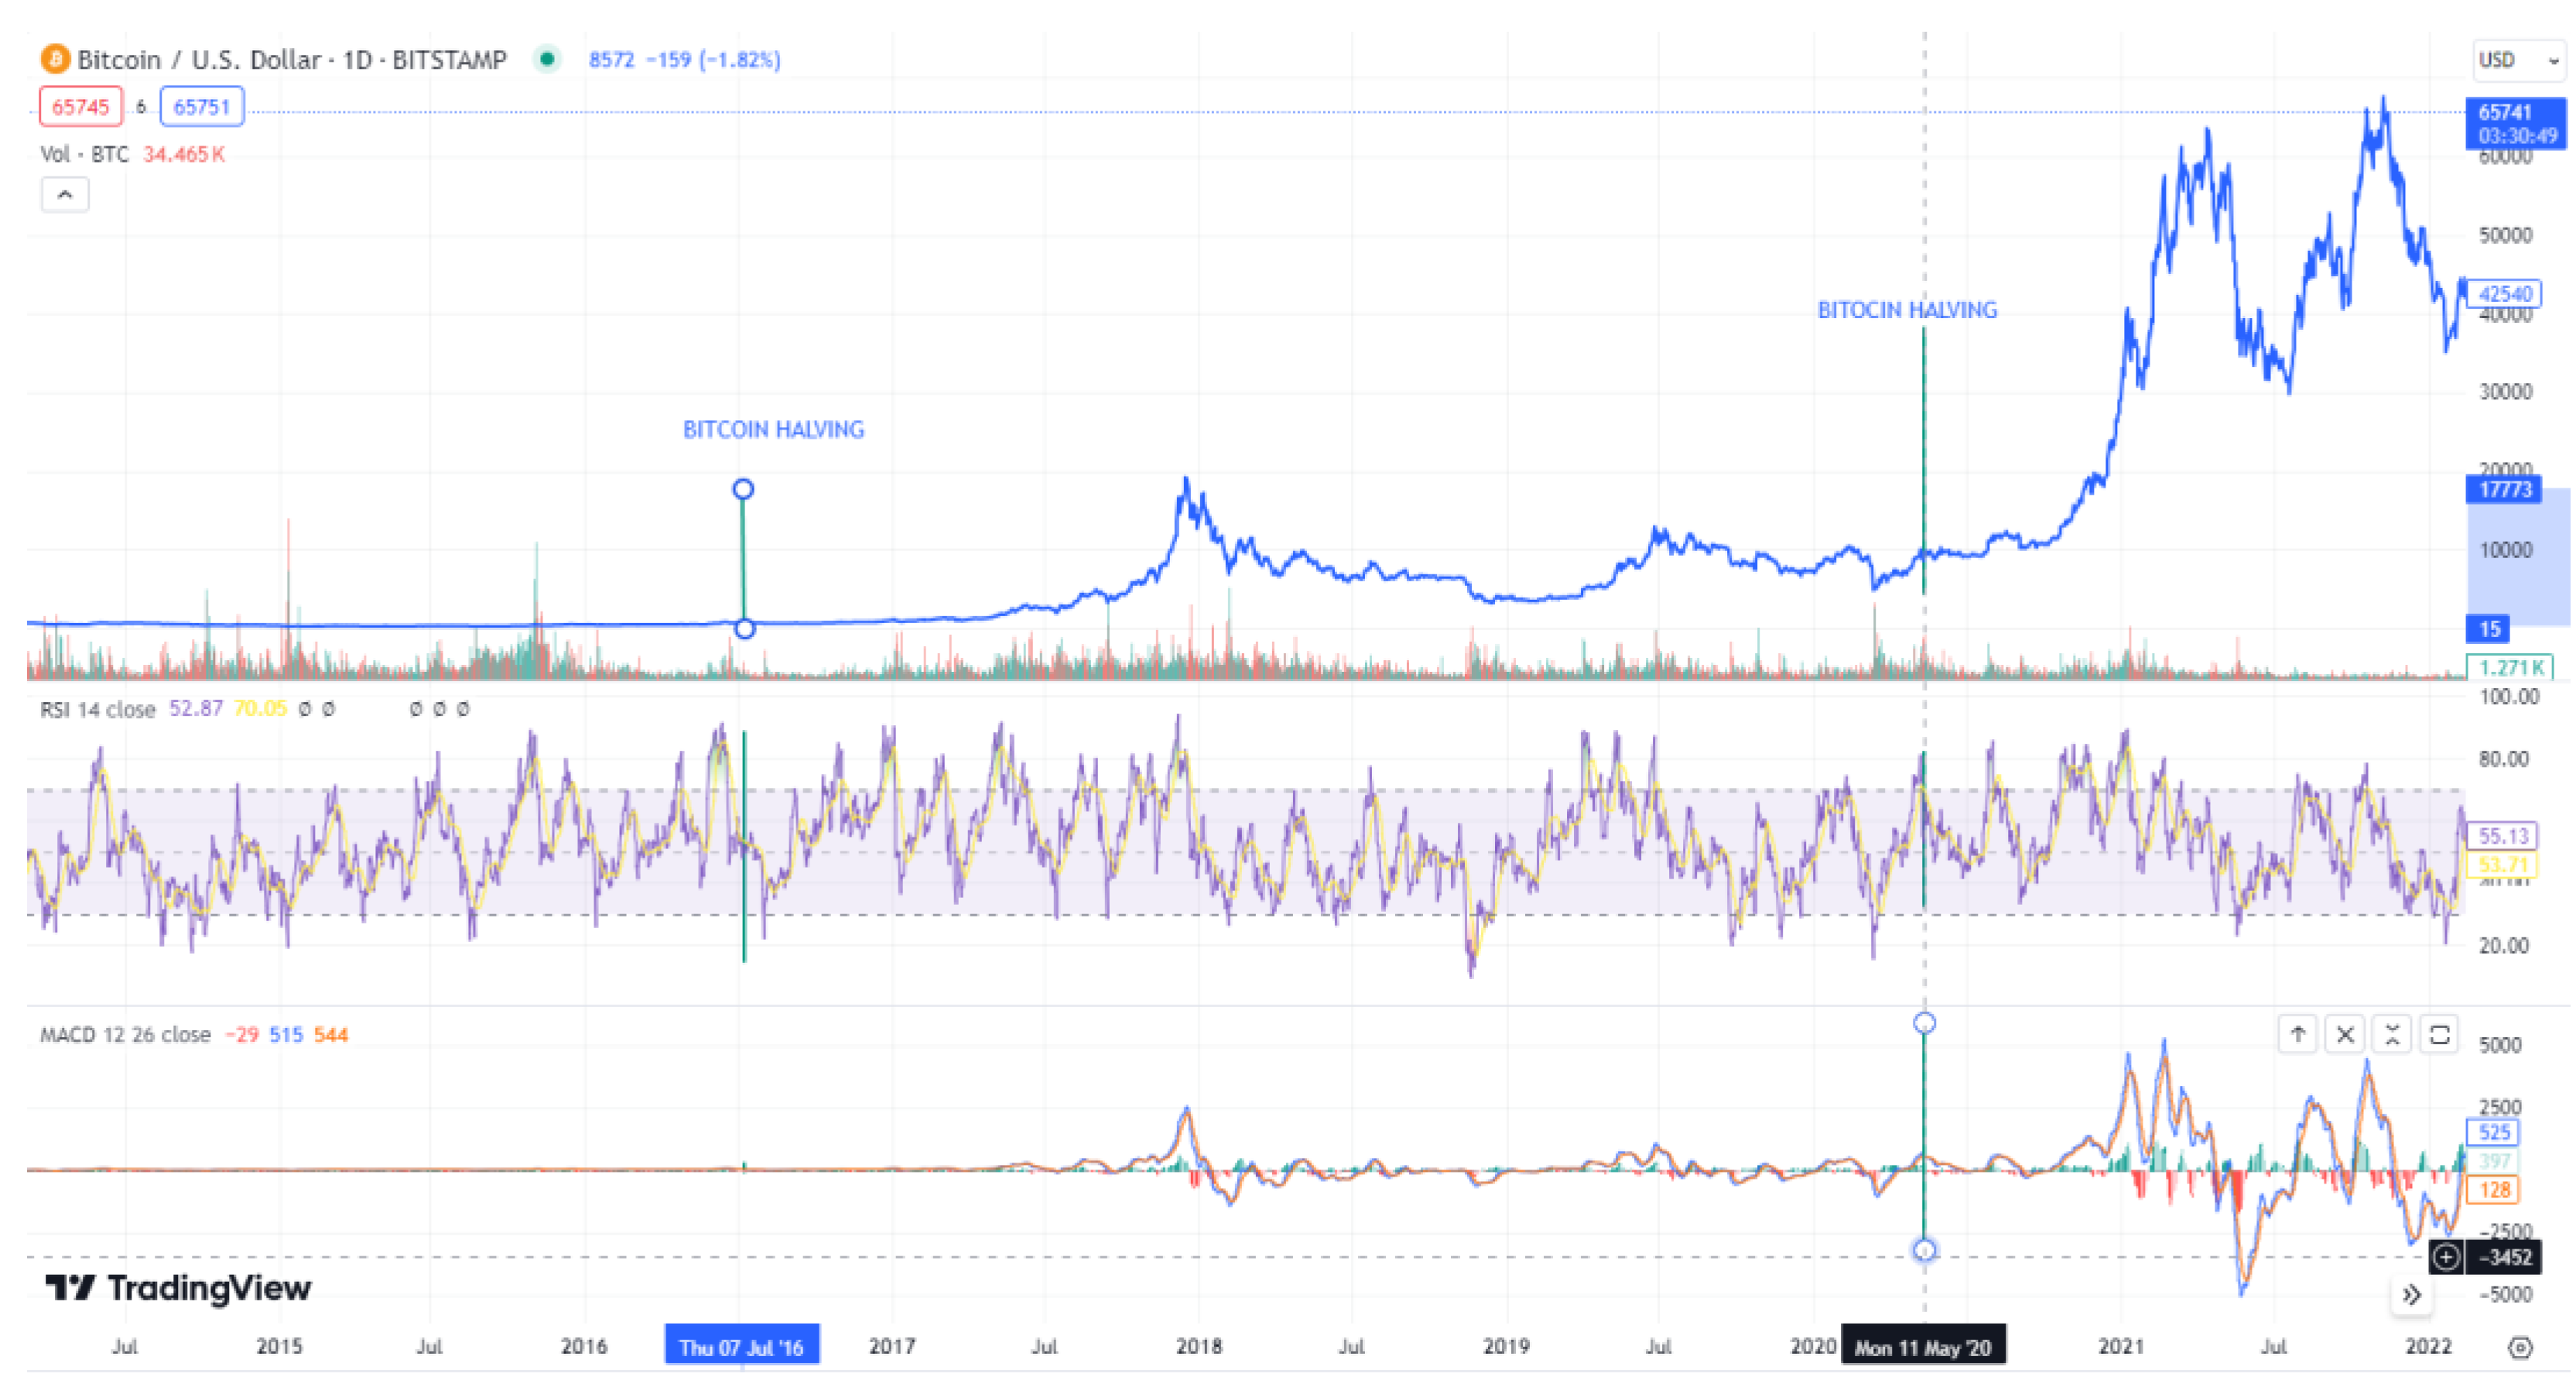
The period of significant growth in the price of Bitcoin that began in late 2017 was the result of a variety of factors, including increased media attention, the launch of new bitcoin futures markets, and the entry of new entrants into the market. Notably, this followed a two-year bear market period. During this period, the price of bitcoin rose from around 600 USD to its all-time high of nearly 20000 USD. Nevertheless, the price later collapsed when the market went through a correction and lost almost 80% of its value. This correction lasted until the end of 2018 and the beginning of 2019, during which the price of bitcoin ranged from 3000 to 6000 USD. This value is significantly higher than before the second halving. After this period, the market started to recover again, and the price of Bitcoin gradually increased.
In the
Figure 6, we can see how the MACD indicator indicated a strong bullish trend. It is a convenient illustration of when bullish and bearish crossovers perfectly mirrored the price movement and showed a change in trend. During both significant increases in the price of Bitcoin, the MACD curve along with the signal curve were above the zero level of this MACD chart.
The RIS showed at the time when the price of Bitcoin was increased during 2017 that the market was overbought, but not unsustainably overbought, so the bullish trend could continue for some time. However, instead of falling, Bitcoin continued to rise and RIS remained elevated for several months, leading some traders to lose significant profits. At the beginning of 2018, a change followed, which is seen in the graph - this change represented the transition of an overbought market to an oversold market.
An analysis of the development of the price of Bitcoin between the second and third halving pointed to a strong bullish trend that persisted for almost the entire four years. This period in the Bitcoin market was characterized by high price growth and several milestones.
3.5. The third Bitcoin halving
The third Bitcoin halving was on 11 May 2020, and it meant a reduction of the reward from 12,5 BTC to 6,25 BTC. It took place in a different market environment compared to the previous ones. Bitcoin was already known, used by the general public, its liquidity increased significantly, the interest of institutions that had a significant influence on the overall market and the movements of their assets are more voluminous compared to individual traders increased. These institutional investments are also believed to have had a significant impact on Bitcoin during the third halving. Another significant impact was the COVID-19 pandemic, which significantly affected the overall global economy. The price of Bitcoin surged just before the halving, hitting a near three-month high of 10000 USD. But the effects of the halving were not as dramatic as expected. A few days after the halving, the price had only minor fluctuations, and over time, within two months, the price climbed to 12000 USD, which represented a 20% increase.
The MACD indicator (
Figure 7) was below the zero level a month before the halving, which represents a bearish trend. But there was a bullish crossover, when the MACD curve crossed the signal curve downward, which indicated an increase in the price of bitcoin. After the halving, the indicator was mostly negative and in a bearish trend. However, it gradually stabilized and diverged positively after a few weeks, indicating a potential move to a bullish trend.
This was also confirmed by RIS, which just before the halving indicated that the market was overbought, and after the halving, these indications gradually decreased and indicated an approaching bullish trend.
3.6. The period after the third Bitcoin halving
The third halving confirmed Bitcoin traders in the opinion that this cryptocurrency has potential for long-term investment. The immediate impact of the halving on the price was not as significant as initially expected. This halving was followed by about a six-month period of reduced volatility and consolidation.
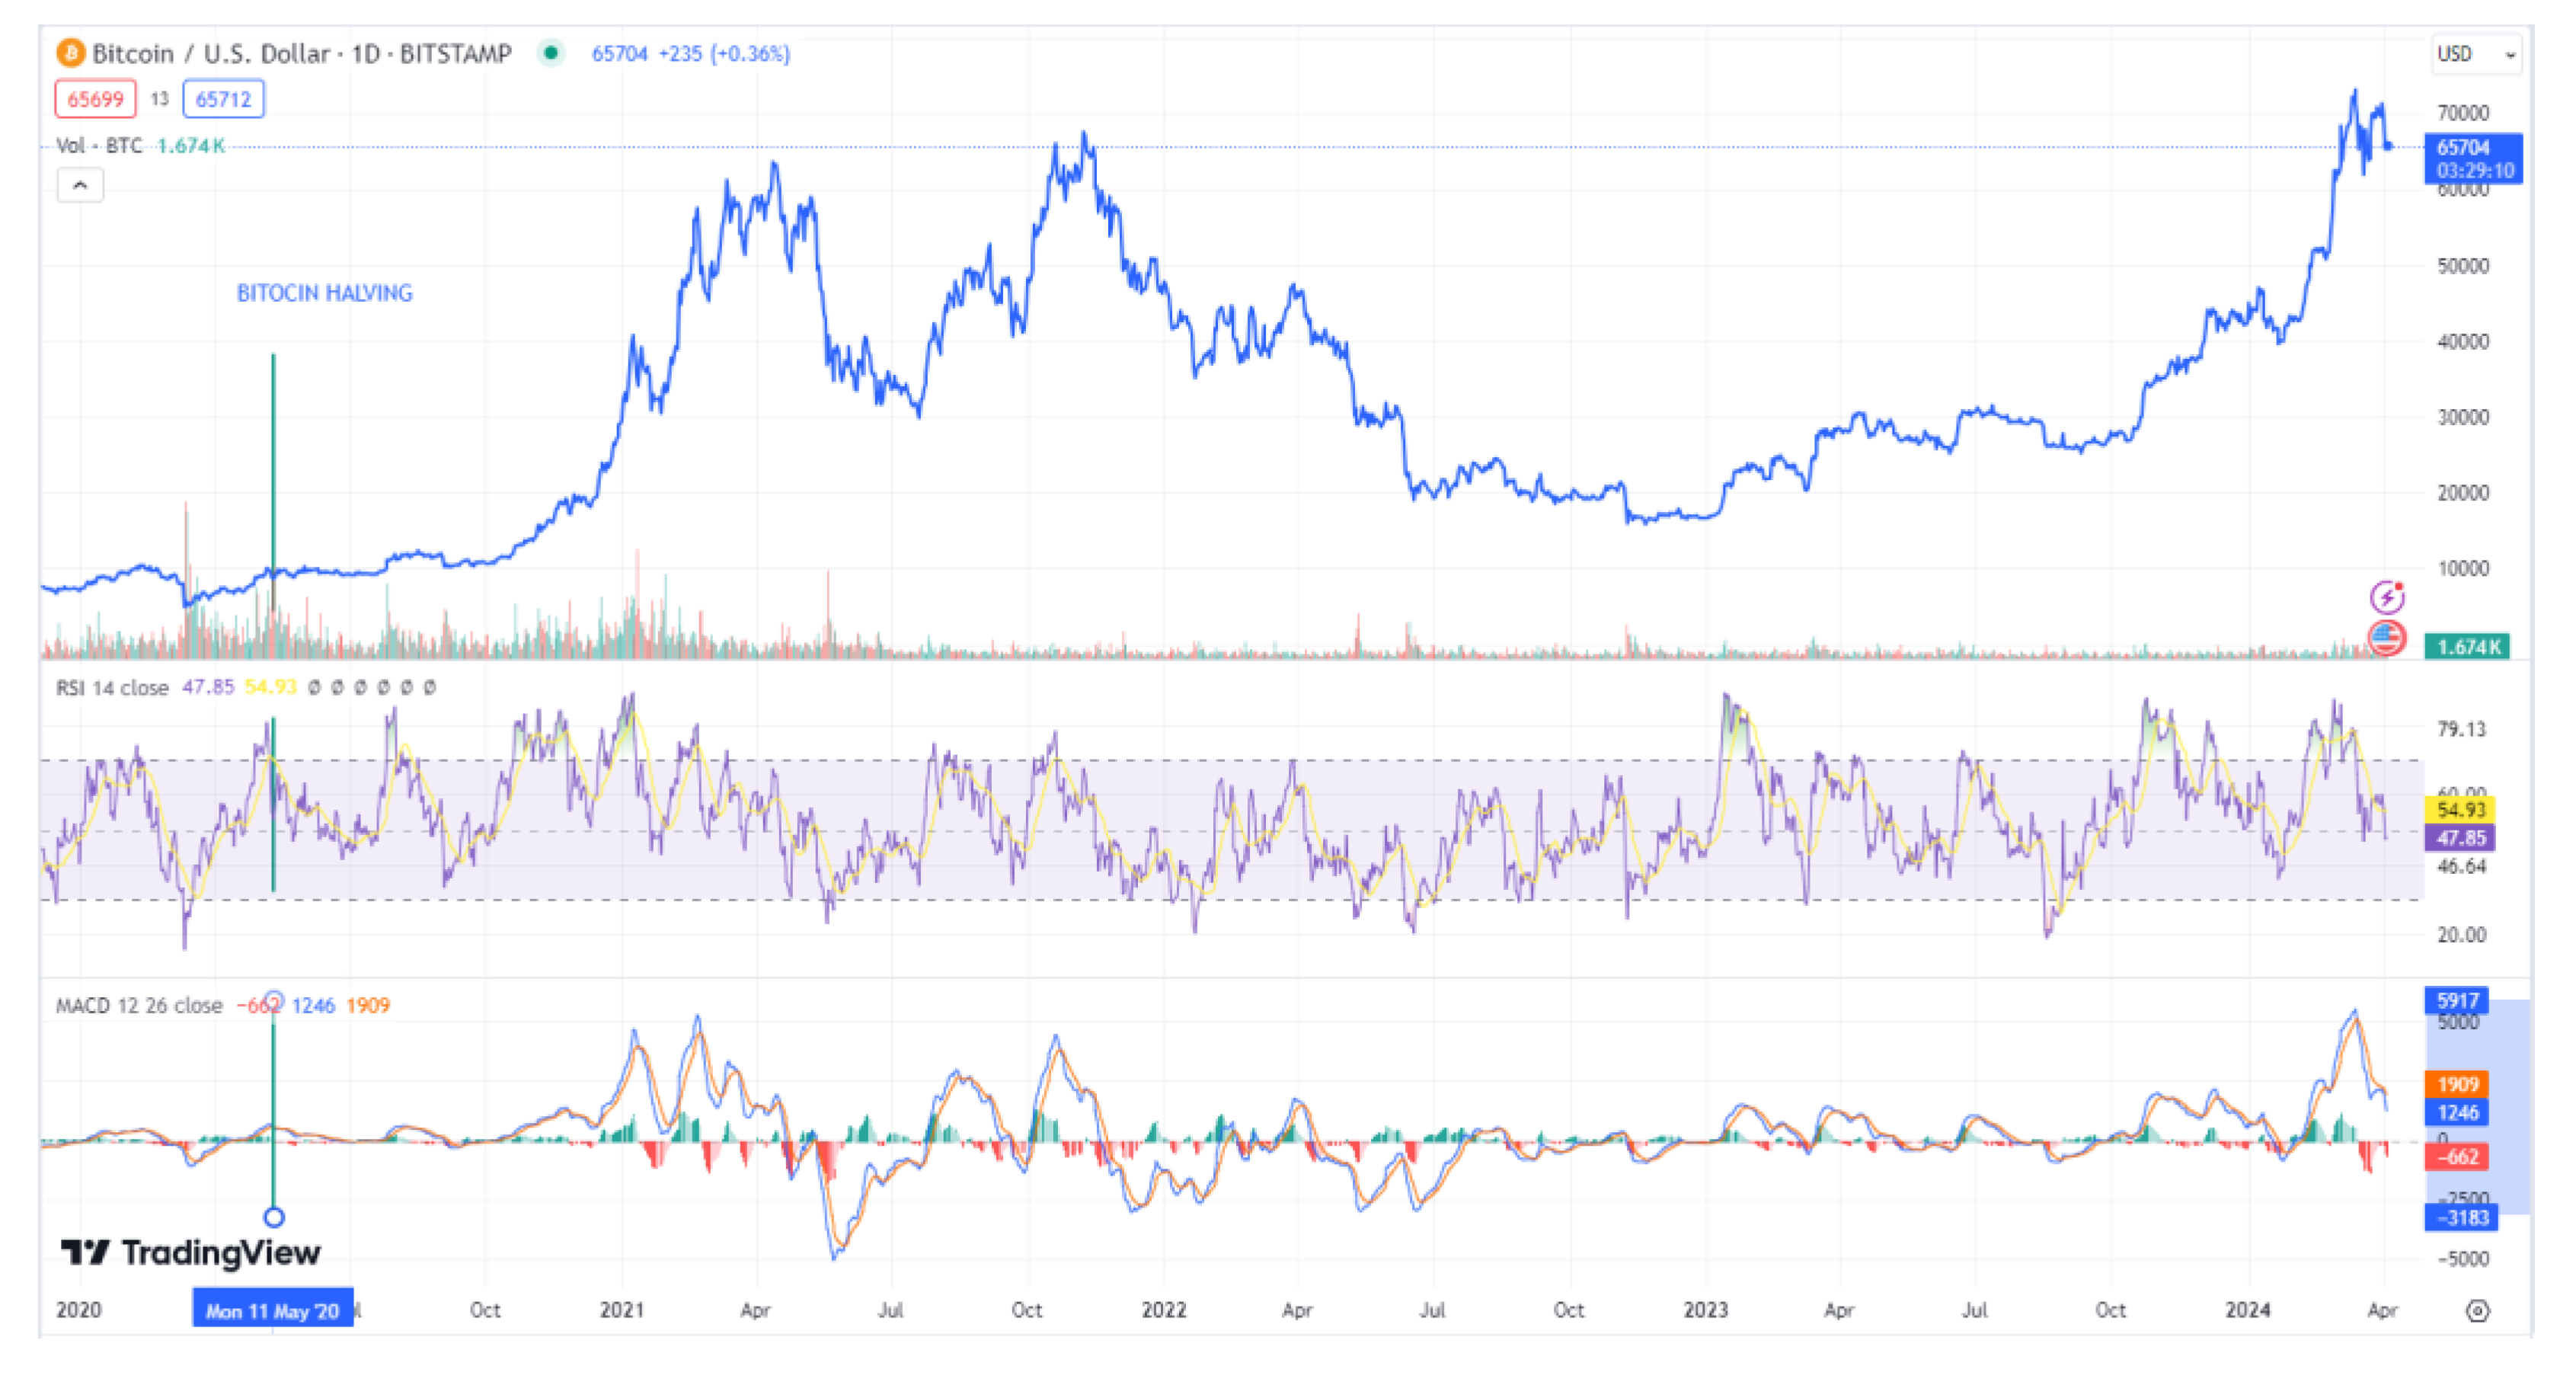
Further price development was subsequently replaced by turbulent growth after a calm halving period, when the price of bitcoin climbed from the original 8000 USD to a new historical high of 60000 USD by April 2021. This increase was significantly supported by the growing interest of investors. The price later fell by more than 50%, trading at 30000 USD. After a few months, the price of Bitcoin went through another rally and rose to more than 65000 USD, more than six times the price compared to the price before the third halving.
The
Figure 8 shows the price of Bitcoin in the period from the third halving to today, and the MACD and RIS indicator, which reflect the movement of the price of Bitcoin. Green circles mark bullish crossovers, which show the beginnings of bullish trends, that is, that the price has started to rise, red circles indicate that the price will fall.
With the RIS indicator, we can see when the curve got above the level of 70. This proves that the market is considerably overbought. In both cases of market overbought, there was a correction and thus a price reduction.
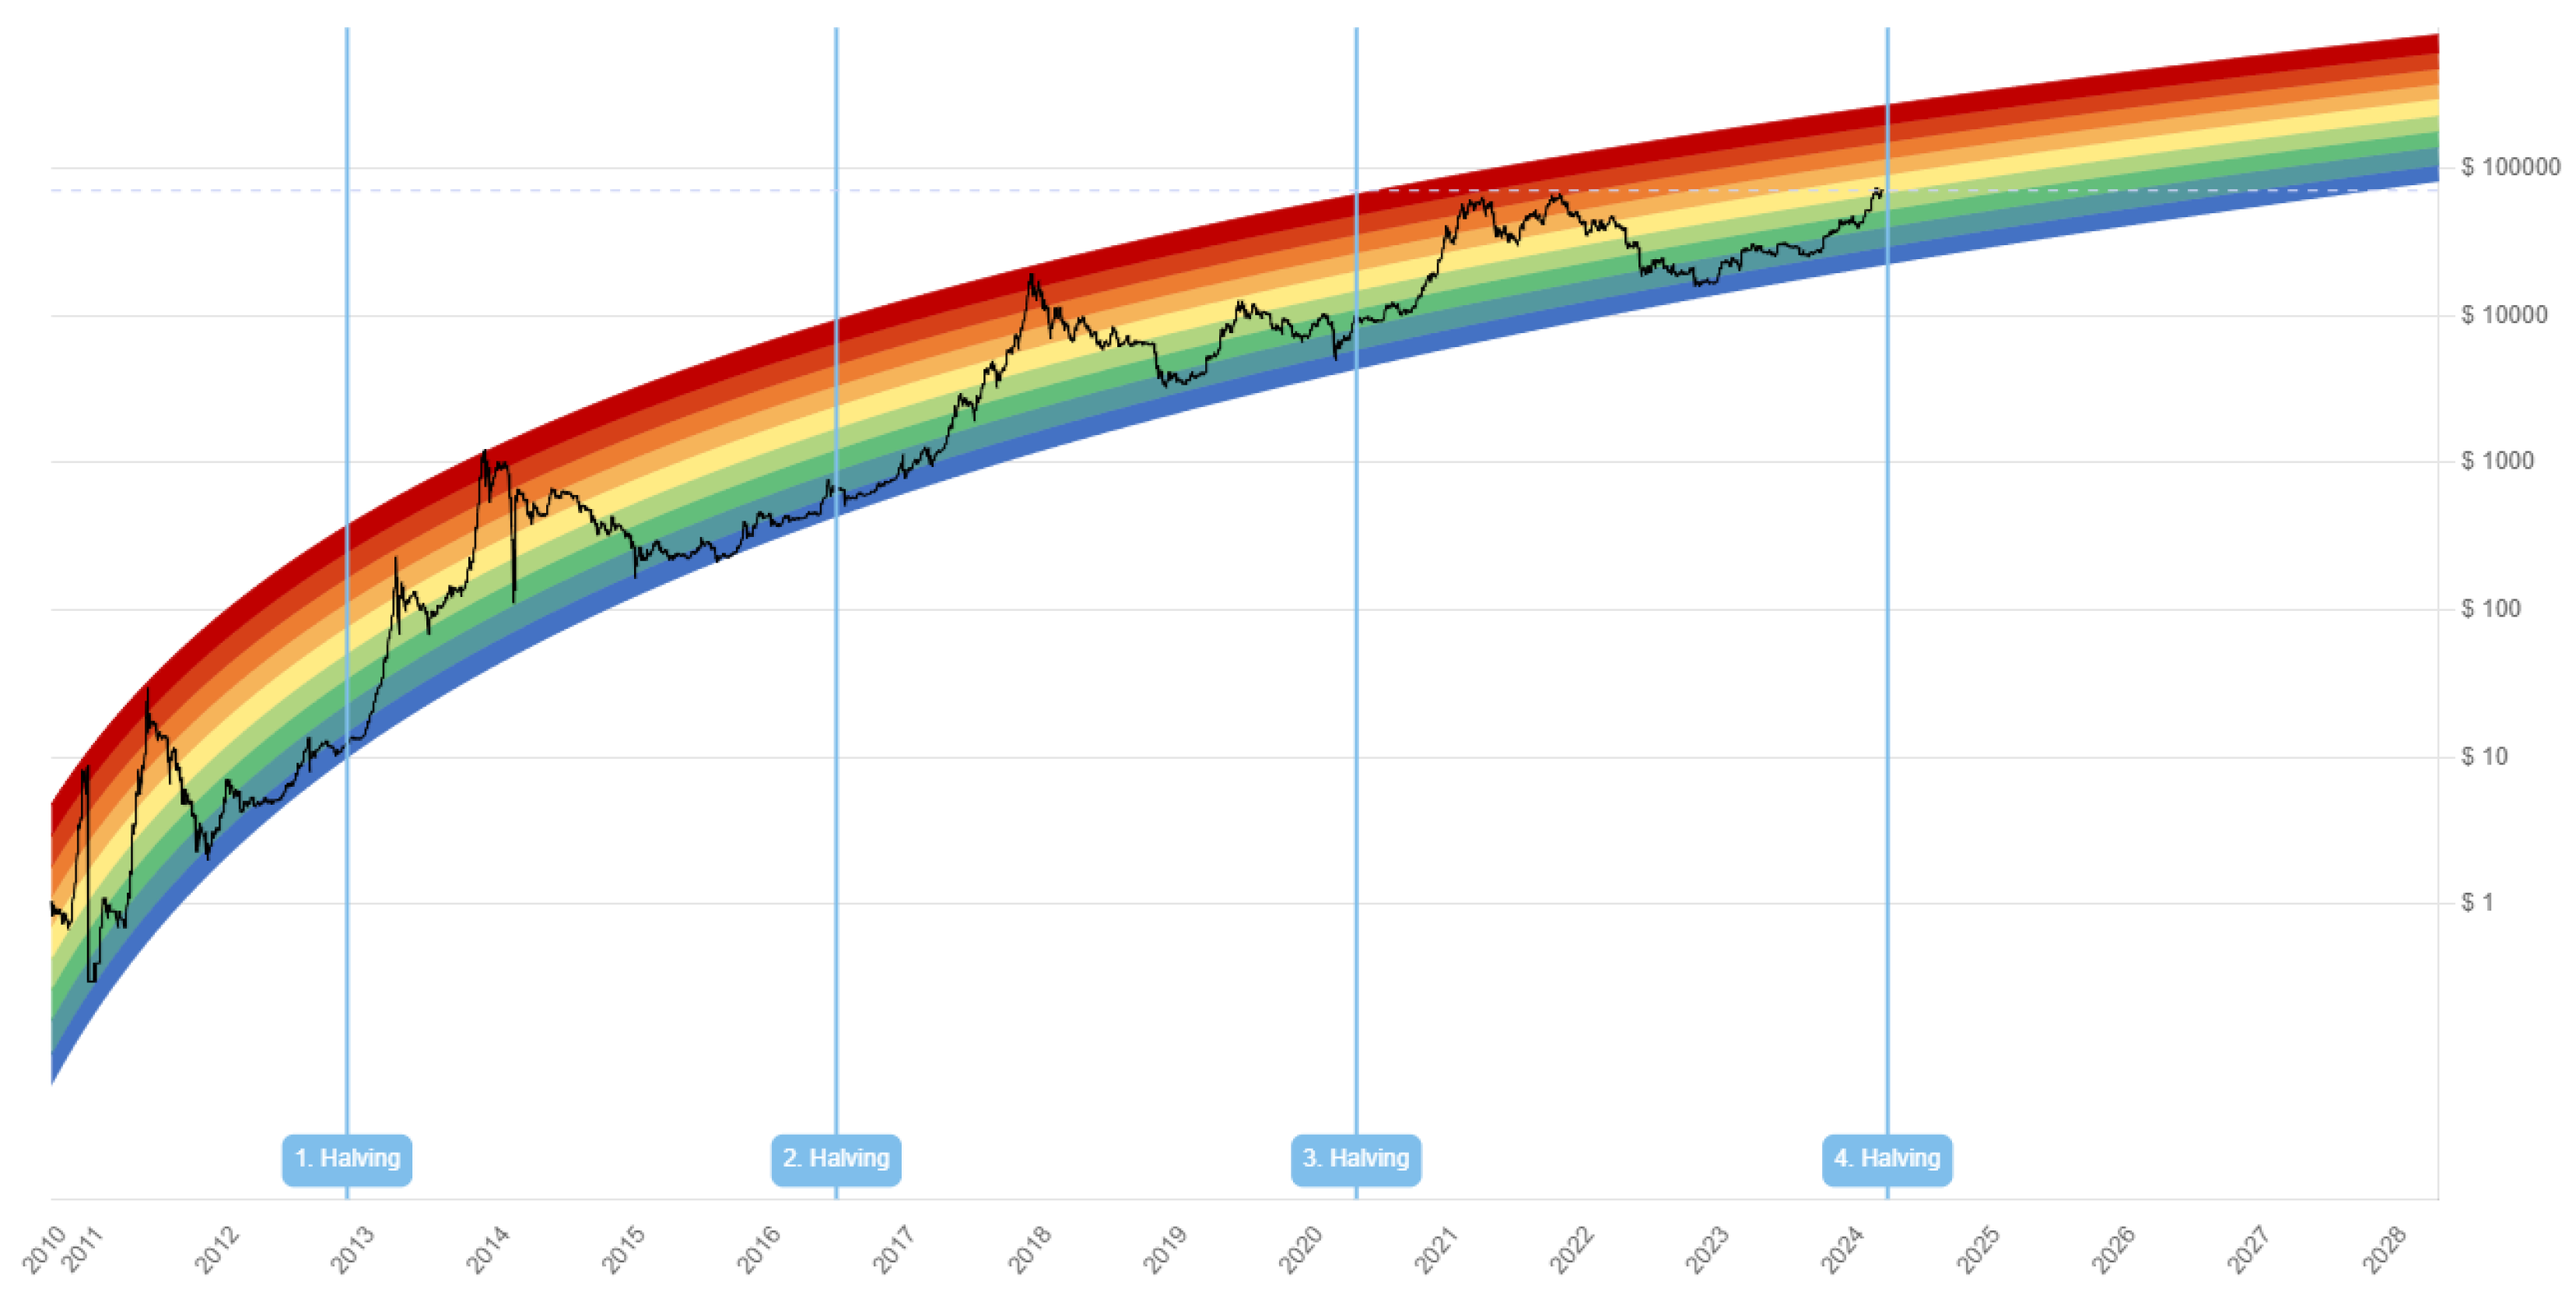
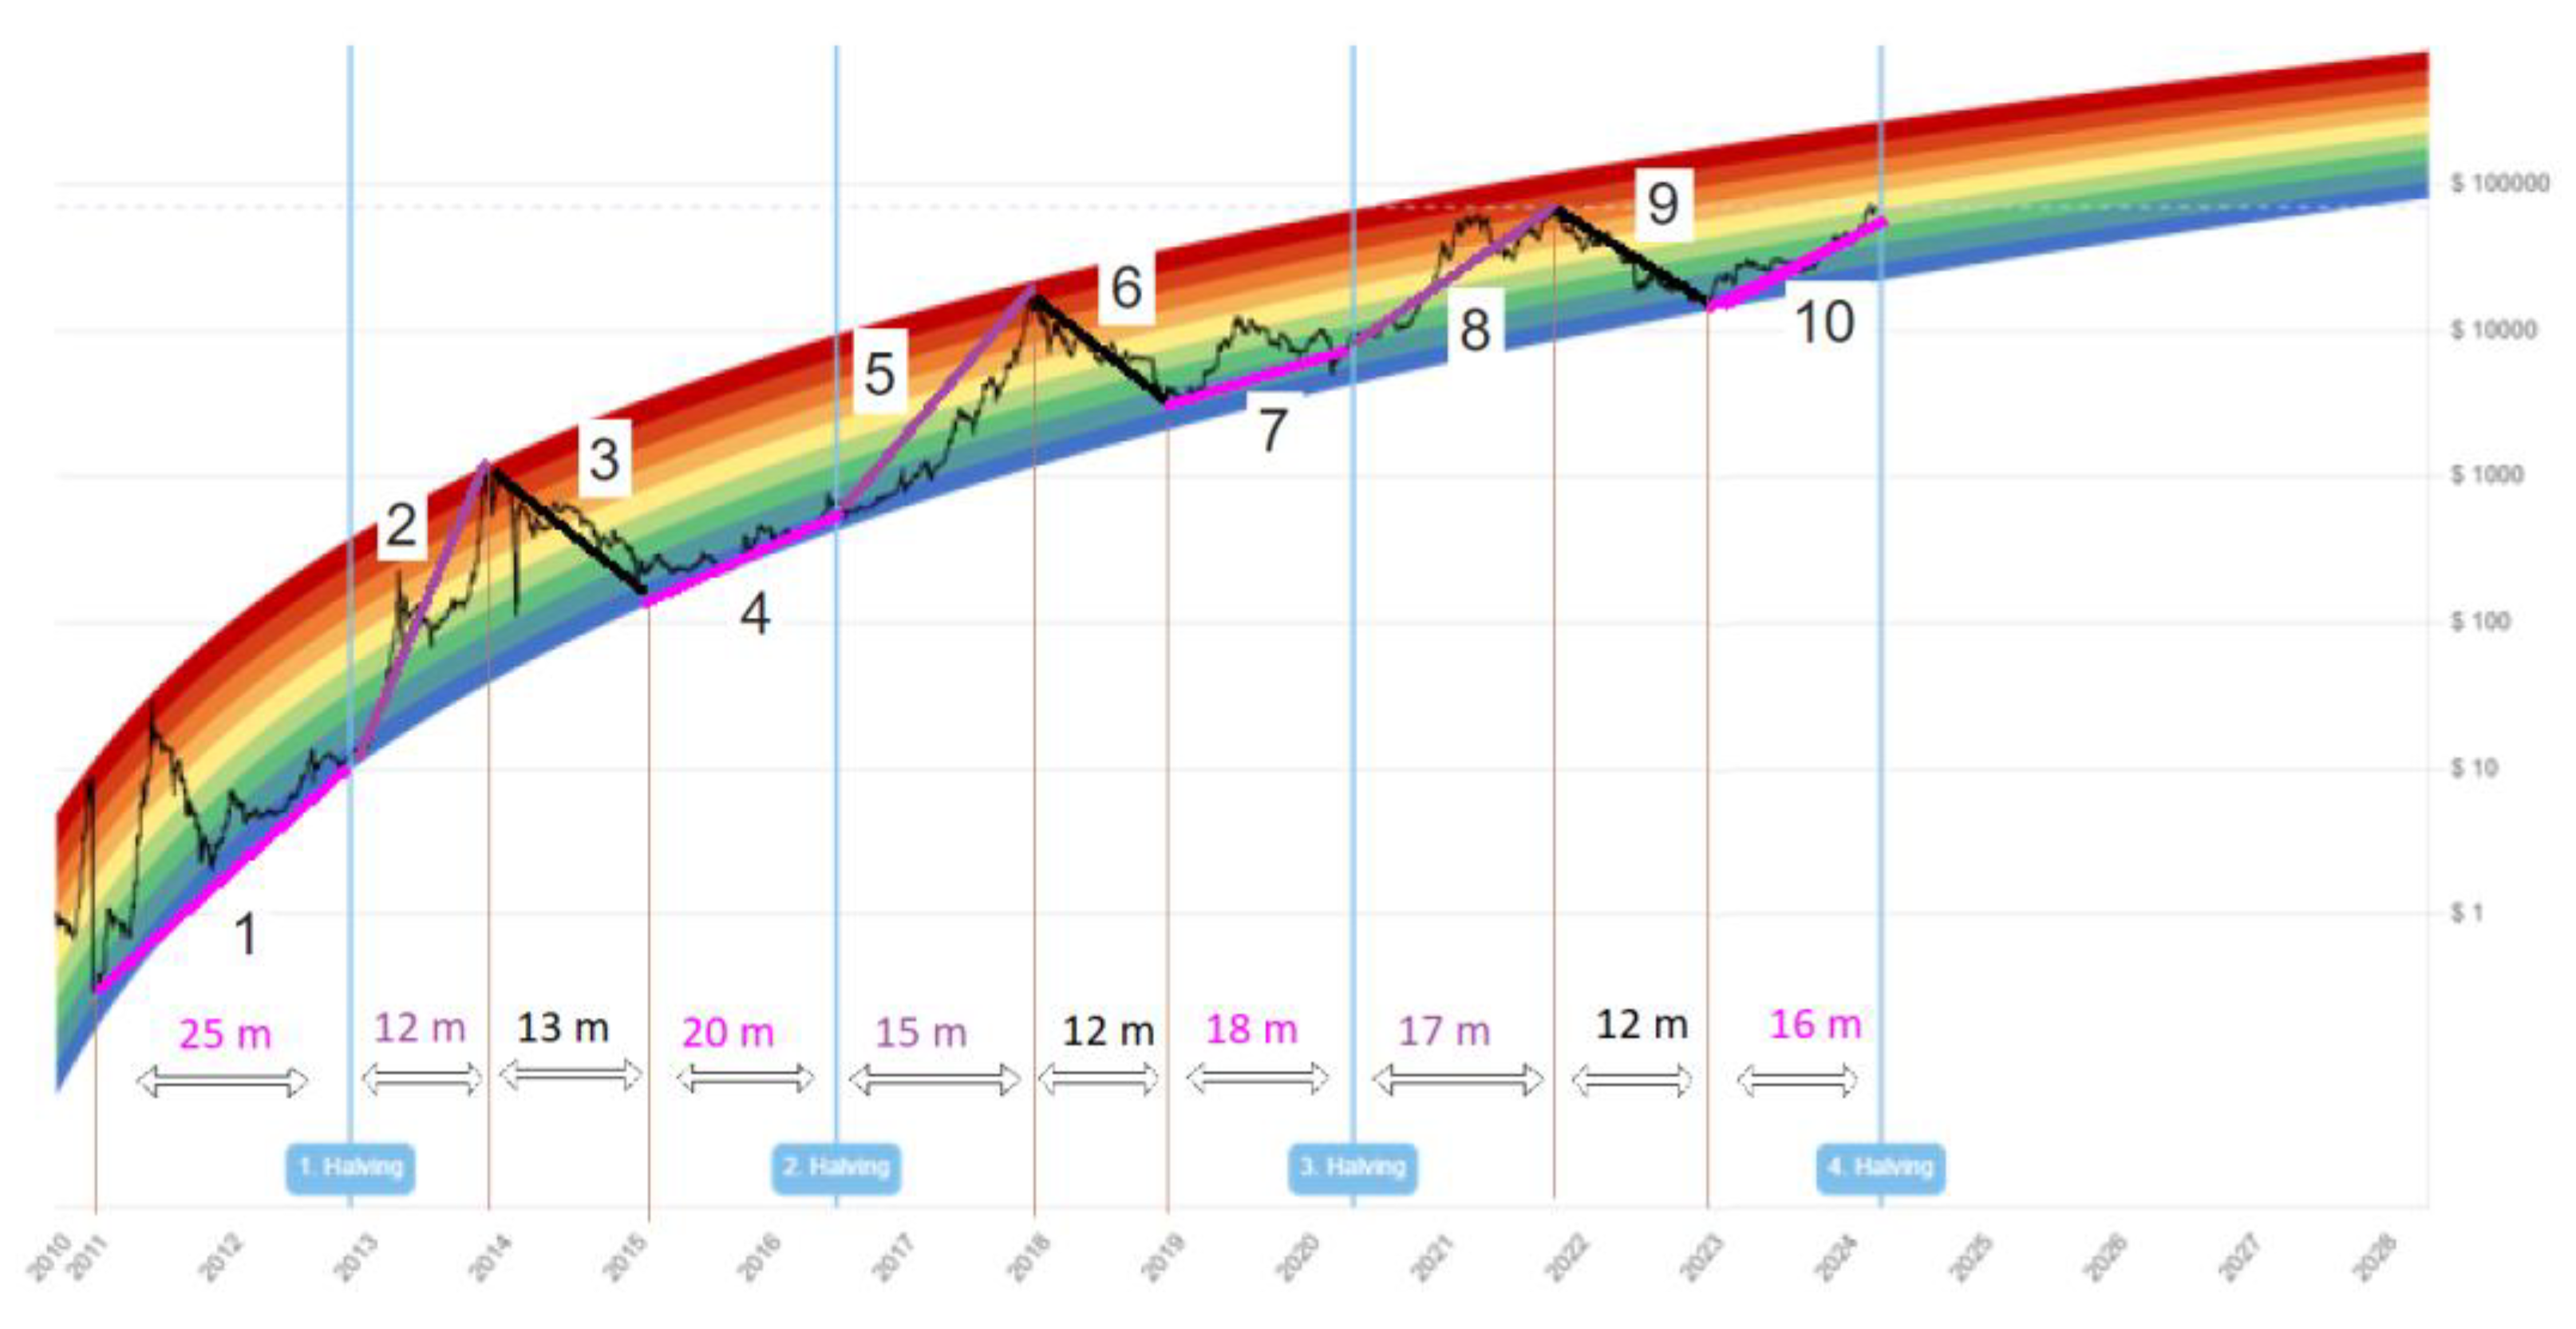
Since the third halving, a lot has happened with the Bitcoin market, and this has also been reflected in its price movements. From the analysis of individual periods, we can see that bitcoin halving is the "catalyst" of price increases, which leads to new historical highs. If we want to look at the development of the price of Bitcoin over the entire period of its "life", we have to display the prices in logarithmic values. Such a view is offered by the Rainbow Chart, a tool used to analyze the historical long-term price movements of Bitcoin, which uses a colorful rainbow scheme to display different price levels (Rainbow Chart, 2024).
Looking at the past behavior of Bitcoin (
Figure 9), we see that the price was always within the first three lower bands at the time of the halving. Subsequently, it reached its peak - the dark red phase. The exception is the last halving of 2020, after which the highest price stopped at the dark orange band. As the next halving is expected to happen in April 2024, we can see that Bitcoin is currently volatile and significant rises and subsequent falls can be seen within a few days.
3.7. Hypothesis evaluation
We have provided a detailed analysis of the historical price movements of Bitcoin following previous halving events. We displayed the results on the
Figure 10.
From the previous halvings, we can see that due to decreasing supply and increasing demand, the price of Bitcoin increased significantly after each halving (in the long run). However, the consequences of the halving led to the formation of bubbles in over a year and a crash in the months following the peak. This is evidenced by the three previous halvings. The development of the economic cycle began in November 2010, when Bitcoin reached its first bottom with a market price of 0,06 USD. This was followed by a rally that lasted 37 months (Number 1, the first pink and purple line,
Figure 10) and stopped at the first peak in December 2013 at a price of 1147 USD. The price peak occurred 12 months after the halving (Number 2, the first purple line,
Figure 10). A decline followed that lasted 13 months and ended on the second day of January 2015 at 152 USD (Number 3, the first black line,
Figure 10). Then the economy improved again and continued to grow for 35 months (Number 4, the second pink and purple line,
Figure 10), reaching a second peak in December 2017 at 19987 USD. The price peak occurred 15 months after the halving (Number 5, the second purple line,
Figure 10). However, there was another decline after that, which lasted for 12 months and ended on the third day in December 2018 with a price of 3130 USD (Number 6, the second black line,
Figure 10). After this decline, the economy recovered again, and it took another 35 months for the value of Bitcoin to reach its third peak in November 2021 at 69040 USD (Number 7, the third pink and purple line). And the peak occurred 17 months after the halving (Number 8, the third purple line). There was the last decline after that, which lasted for 12 months and ended on the 23rd day in November 2022 with a price of 16195 USD (Number 9, the last black line,
Figure 10). We see new historical highs on March 13, 2024, when the price rose to 73135 USD per 1 BTC, 16 months after the previous fall (Number 10, the fourth pink line,
Figure 10). Over the next few days, it dropped to a "bottom" of 61906 USD (19. March 2024) to oscillate again. As of today, 31. March 2024, the price for 1 BTC is 71256 USD.
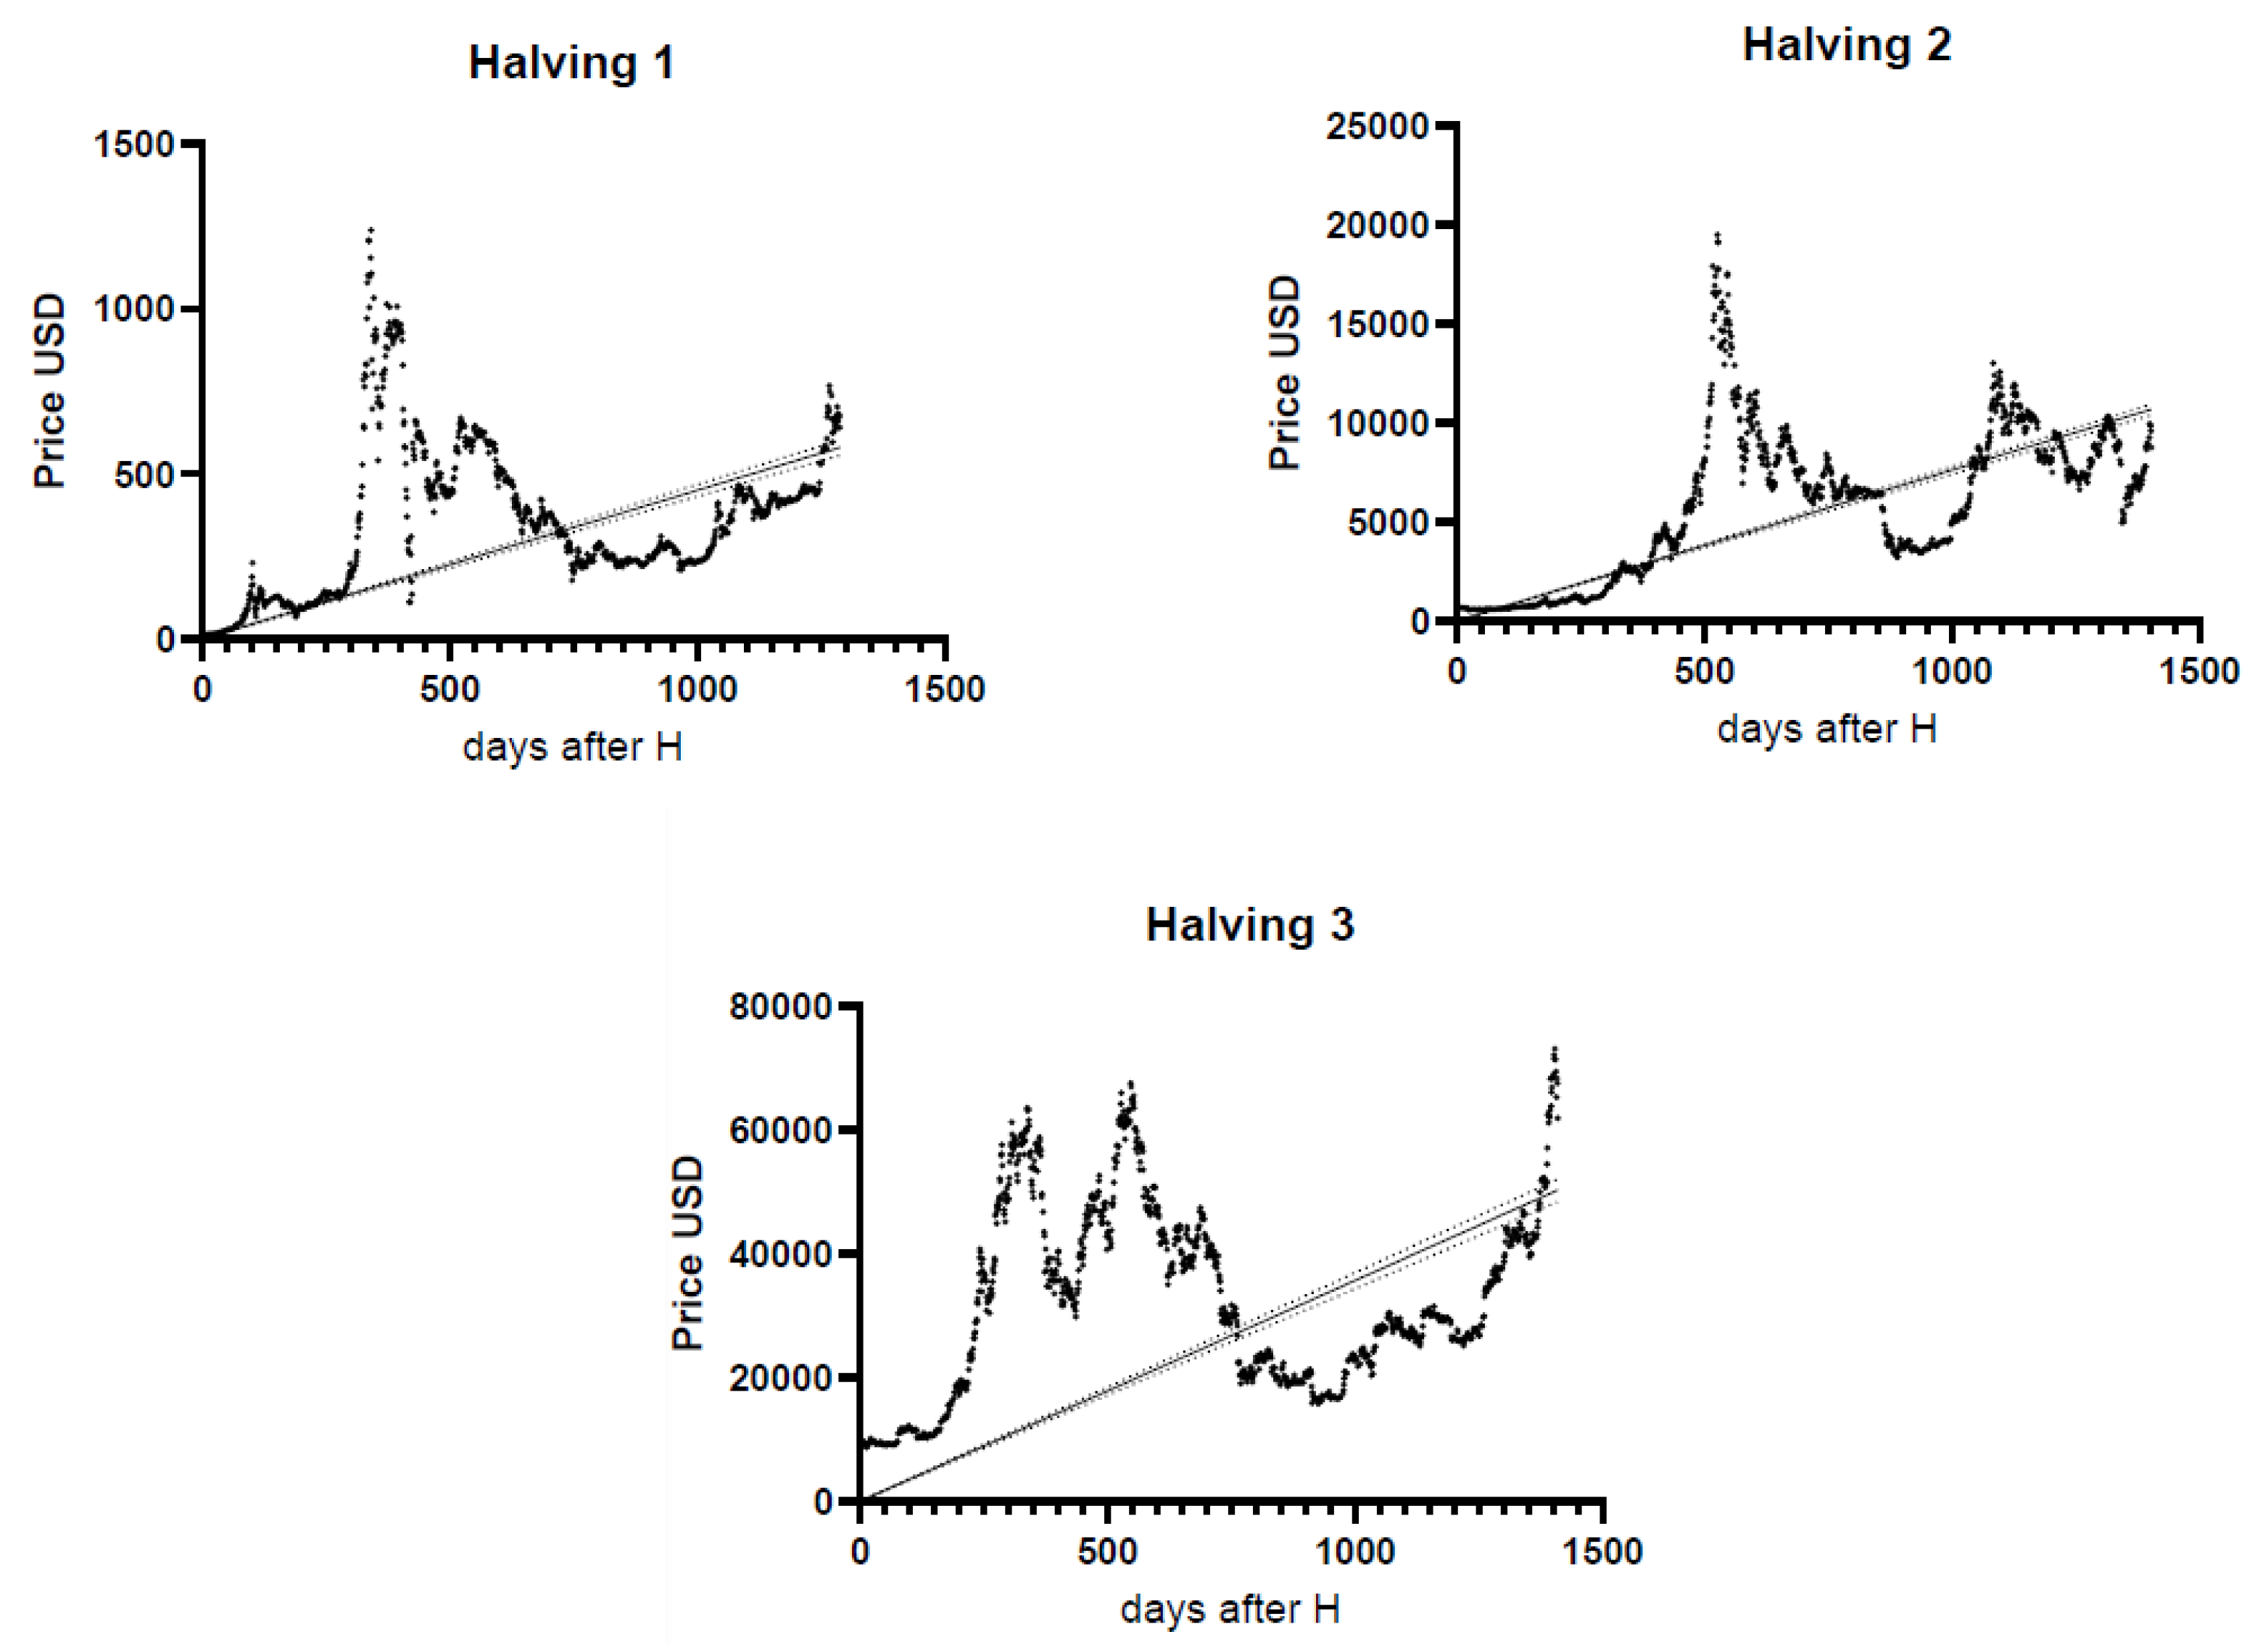
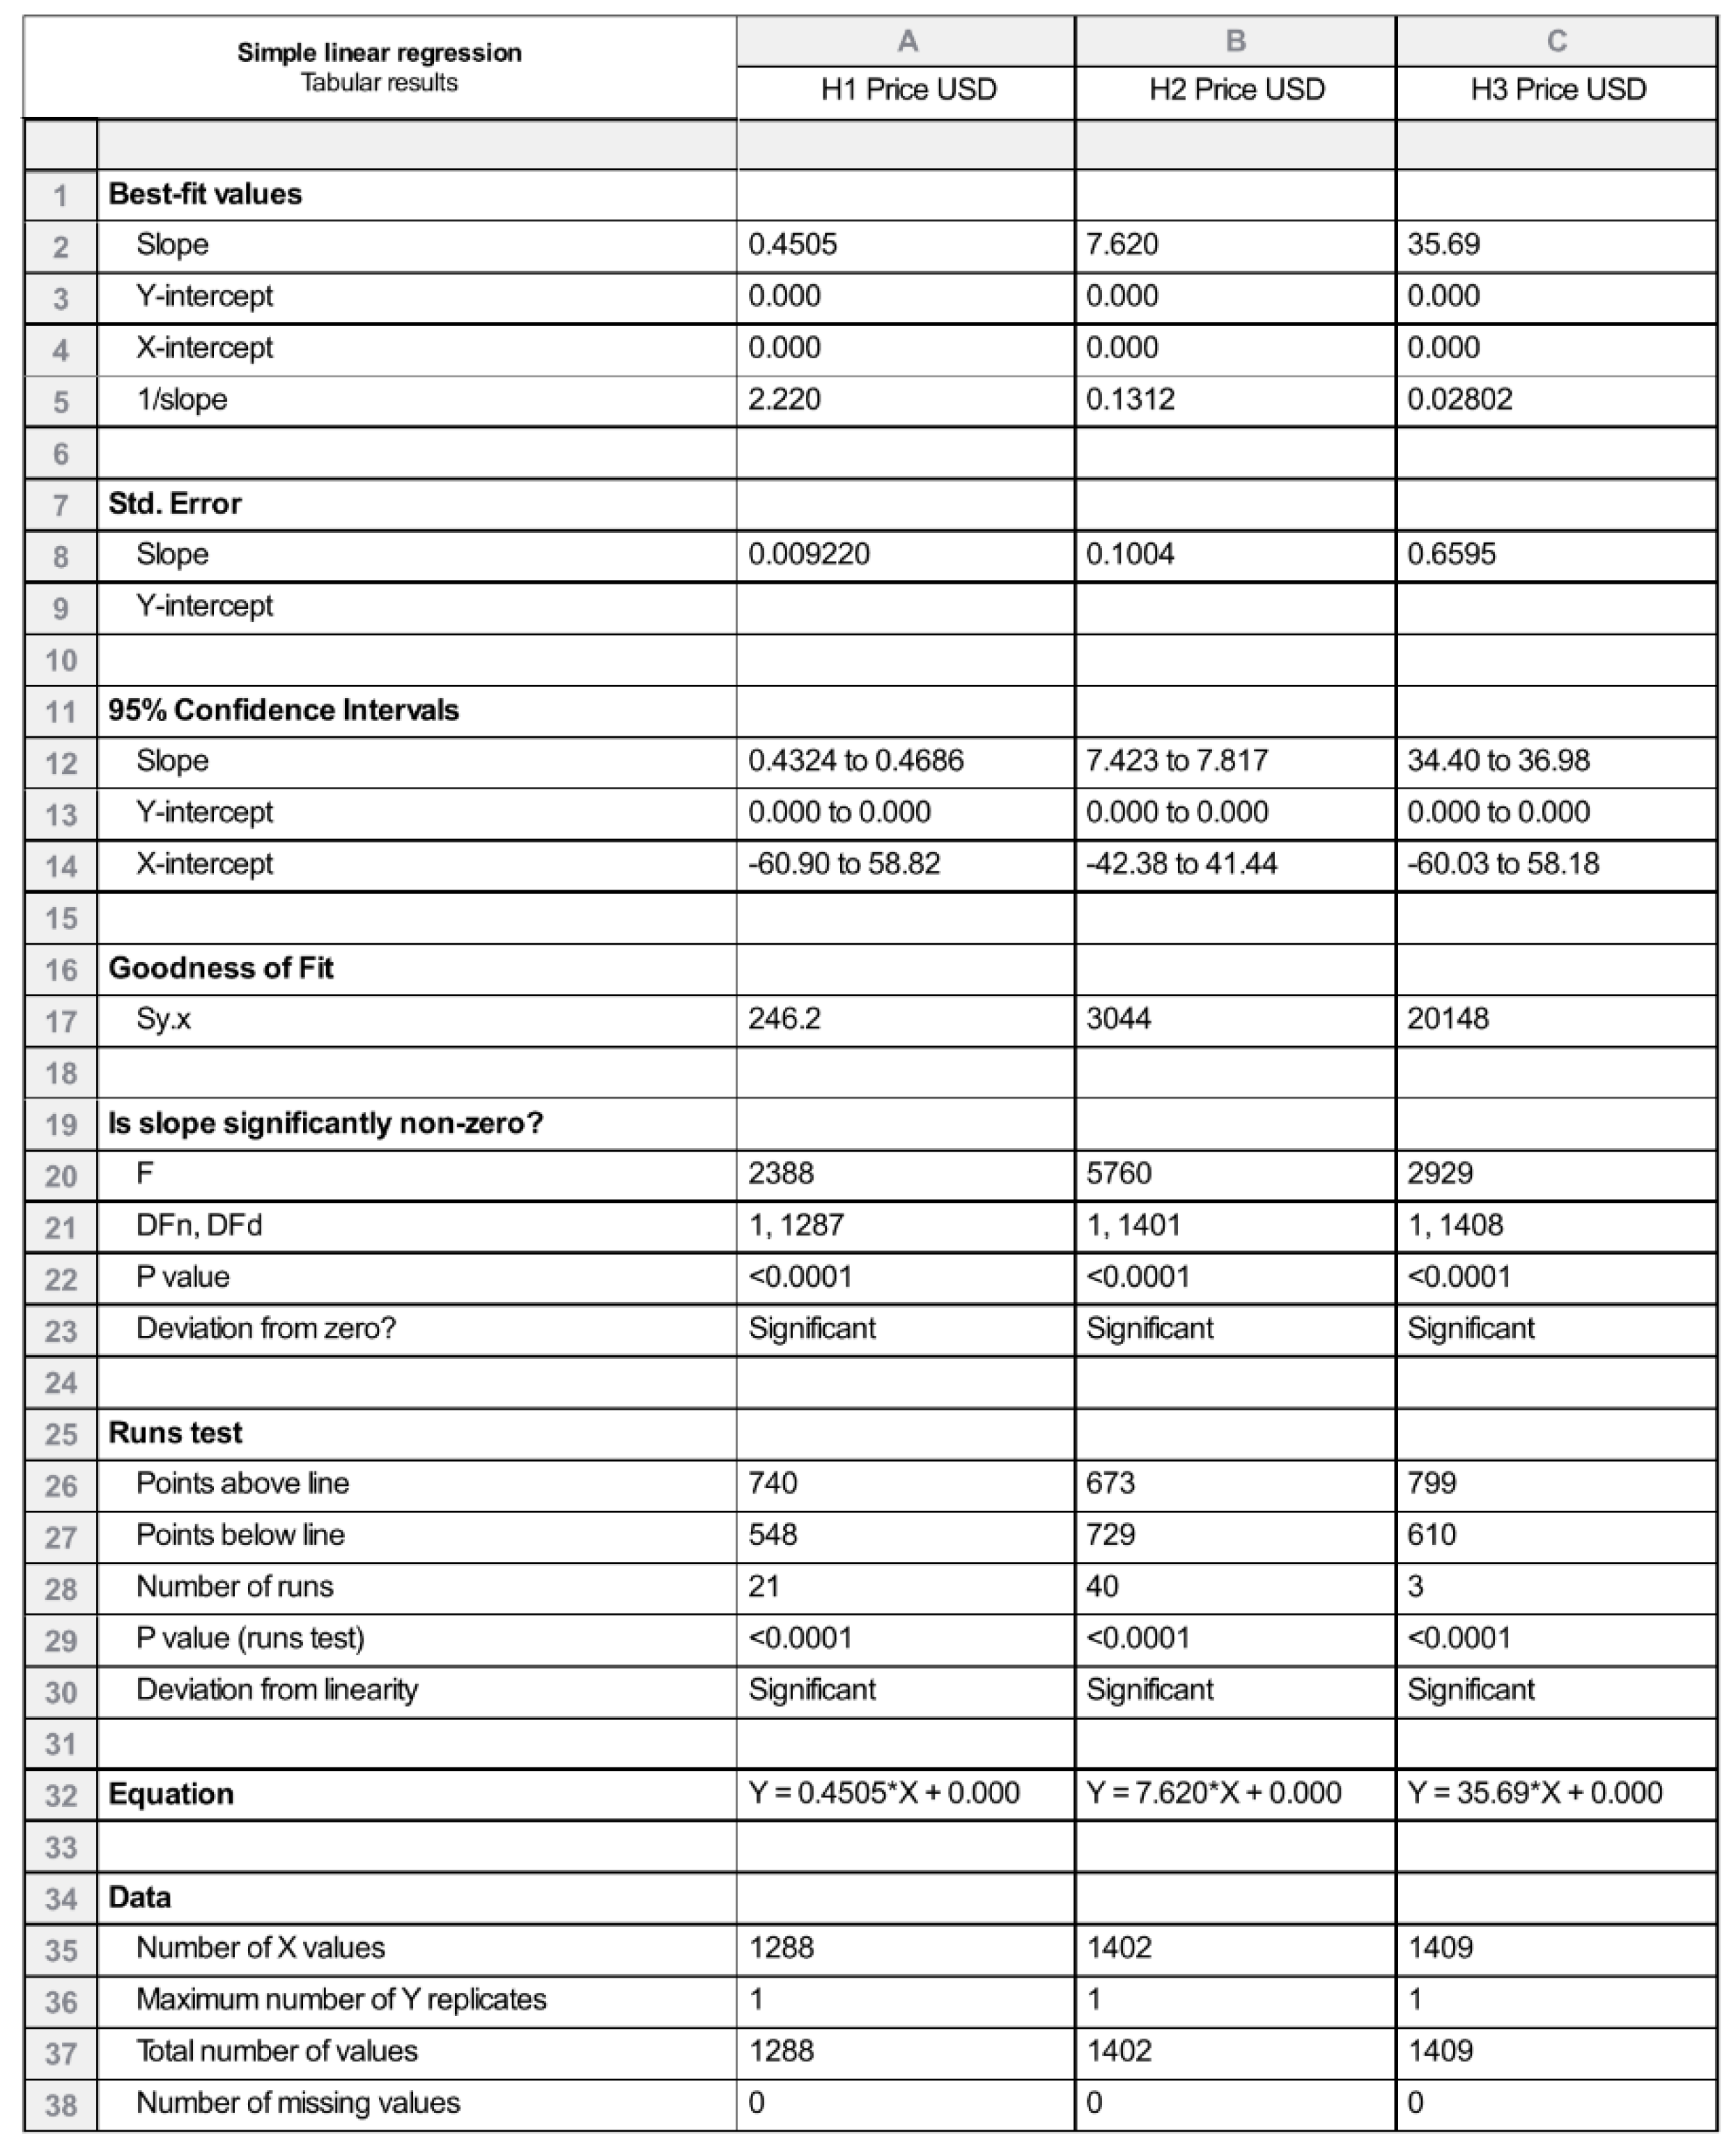
Mathematical evaluation of the hypothesis can be done using statistical analysis techniques such as simple regression analysis. We used GraphPad Software.
Figure 11 shows the results from regression analysis after each of 3 Bitcoin Halvings. Calculations and results are presented in
Figure 12. As in many experiments, the relationship between X (days after Bitcoin Halving) and Y (Bitcoin Price in USD) is curved, making linear regression inappropriate. From the development of the curve, however, it can be seen that even if it is not a linear dependence, the resulting curve shows certain similar signs in the period after the 2nd and 3rd Halving (peak around day 537, trough around day 907).
In our work we can abstract away the other variables that affect the price of Bitcoin, but just like in theory and in practice, the price of Bitcoin depends on supply and demand.
Due to the fact that Bitcoin is constantly traded back and forth on crypto exchanges, its price is in constant flux, and exchanges set the price based on the last trade that was made. The stock exchange acts only as a trade intermediary.
Bitcoin's price is primarily affected by its supply, the market's demand, availability, competing cryptocurrencies, and investor sentiment. Bitcoin supply is limited—there is a finite number of bitcoins, and the final coins are projected to be mined in 2140. Bitcoin Halving events are important from the point of view of slowing down the increase in supply.
We recommend further studies in this area, focusing on investor and user behavior; and Cryptocurrency exchange-traded funds (ETFs).
Hypothesis 1: The Bitcoin price increased to reach the peak, within 6 months after the halving in each of the monitored periods.
6 months ≥ xt, where x - number of months after the Bitcoin halving that the Bitcoin price reach the top, t - time order of Bitcoin halving (1, 2, 3).
The results show the peaks were reached after: x1= 12, x2=15 and x3=17 months after the Bitcoin halving events. 6 months < x1 and also 6 months < x2 and also 6 months < x3.
Hypothesis 1 was not confirmed.
Hypothesis 2: Following Bitcoin halving events, there is a consistent pattern where price peaks occur 6 months after the halving, followed by a subsequent decline leading to a trough at 18 months post-halving.
6 months = xt, where x - number of months after the Bitcoin halving that the Bitcoin price reached the top, t - time order of Bitcoin halving (1, 2, 3)
18 months = zt, where z - number of months after the Bitcoin halving that the Bitcoin price reached the bottom, t - time order of Bitcoin halving (1, 2, 3)
The results show the peaks were reached after: x1= 12, x2=15 and x3=17 months after the Bitcoin halving events, and the bottoms were reached after: z1= 25, z2=27, and z3=29 months after the Bitcoin halving events. Results:
6 months < x1 and 18 months < z1
6 months < x2 and 18 months < z2
6 months < x3 and 18 months < z3
Hypothesis 2 was not confirmed.
The data indicate that there is a mathematical model:
m
t – the number of months after the next halving, that the Bitcoin price will raise the peak/bottom; m
(t-1) – the number of months after the last halving that the Bitcoin price reached the top/bottom in the previous period.
If the suppose are correct, the next peak will be reached 19 months and the trough 31 months after Bitcoin Halving 2024. Which means that if the Bitcoin halving takes place in April 2024, the next Bitcoin price peak will be reached in November 2025, and the bottom in November 2026.
4. Discussion
The concept of Bitcoin halving plays a pivotal role in both economic dynamics and the sustainability of the cryptocurrency. From an economic standpoint, Bitcoin halving introduces a unique scarcity element to the cryptocurrency. By diminishing the rate at which new bitcoins are introduced into the market, Bitcoin halving effectively curtails the supply side of the equation. This approach aligns with the escalating demand for Bitcoin, resulting in a continual reduction in its supply rate to meet the growing market appetite.
The Bitcoin system is a decentralized monetary system in that any participant can potentially verify and record transactions onto a public ledger. Bitcoin is a decentralized digital currency that operates without a government authority. It depends on a peer-to-peer network to perform the verification and recording functions. When a buyer uses the crypto-currency bitcoin to pay for a transaction, the transaction record is transparent in that it is viewed and verified by all participants of the peer-to-peer network. The process of validating transactions, mining, requires miners, who are rewarded in bitcoin. These rewards make a new supply of bitcoins. In comparison of the traditional fiat currencies, Bitcoin is a deflationary currency, which significantly changes the view of the traditional concept of supply and demand. The supply is fixed at 21 million and there is no further "reprinting" of money, the money supply is released gradually. With each confirmation of transactions, that is the process of mining, the miner receives a reward in bitcoins. We can say that mining is the emission of money. However, this reward is halved every 4 years. Thus, this halving reduces the supply increment in the bitcoin market. Therefore, "amount” of bitcoins cannot be increased, the supply is limited in time, but the demand is affected by various factors, such as the popularity of cryptocurrencies, the uncertainty of economic policy, and others, and changes every day. Bitcoin ETF issuers are buying more than 10-12 times the amount of BTC produced daily, leading to a 2% price increase of roughly 1000 USD per day, which conditions the increase in the price of Bitcoin.
Essentially, this practice reinforces Bitcoin's position as a formidable store of value. The deliberate reduction of supply relative to an ever-increasing demand ensures that Bitcoin accrues greater worth over extended periods. Beyond conventional demand-supply principles, Bitcoin halving's impact on the cryptocurrency's valuation transcends mere economic metrics, resonating deeply with market sentiments and the universal preference for limited resources.
An estimated 3 million bitcoins are presently inaccessible due to forgotten wallet credentials, misplaced storage devices, or Bitcoin holdings belonging to deceased individuals. The irreversible loss of a significant portion of these bitcoins underscores the deflationary nature of Bitcoin, a characteristic that is further amplified by the periodic halving events.
In terms of sustainability, Bitcoin mining plays a dual role by incentivizing miners to secure the network while validating transactions. Miners actively safeguard the integrity of the blockchain, protecting it from potential adversarial activities. As long as new bitcoins continue to be minted, miners are inclined to participate in the validation process, thereby upholding the network's security.
Bitcoin halving not only maintains the equilibrium of supply but also bolsters the mining ecosystem. By fostering scarcity, driving valuation up, and moderating Bitcoin's emission rate, halving acts as a compelling incentive for an expanding network of miners committed to safeguarding the blockchain for the long haul.
5. Conclusions
In conclusion, this study has delved into the intricacies of Bitcoin halving events, shedding light on their historical significance and impact on the cryptocurrency market. Through a meticulous analysis of past halving events in 2012, 2016, and 2020, this research has unveiled compelling insights into the patterns and trends surrounding these milestone occurrences.
The comparative analysis of price movements, market behavior, and investor sentiment before and after each halving event has revealed a nuanced interplay between supply dynamics, demand shifts, and price discovery mechanisms within the Bitcoin ecosystem. While past halving events have been associated with periods of heightened volatility and speculative fervor, they have also demonstrated a long-term positive trajectory for Bitcoin's price.
Looking towards the future, the predictions and expectations for the upcoming Bitcoin halving event present a spectrum of outlooks, all with rising price of Bitcoin. Drawing on historical data, expert insights, and market trends, this study has provided a comprehensive assessment of the previous halvings.
As Bitcoin continues to evolve and mature as a digital asset, the lessons learned from previous halving events serve as valuable guideposts for understanding the cyclic nature of supply reduction and its impact on market dynamics. By synthesizing historical trends with future predictions, this research contributes to a deeper understanding of Bitcoin's trajectory and the broader implications of halving events on the cryptocurrency landscape.
In closing, this study underscores the importance of ongoing research and analysis in navigating the complexities of Bitcoin halving events and their implications for investors, stakeholders, and enthusiasts. By continuing to monitor and study these pivotal moments in Bitcoin's lifecycle, we can gain valuable insights into the evolving nature of the cryptocurrency market and its sustainability and resilience in the face of macroeconomic challenges and technological advancements.
Author Contributions
Conceptualization, Juraj Fabuš and Iveta Kremeňová; Data curation, Juraj Fabuš and Terézia Kvasnicová-Galovičová; Formal analysis, Natália Stalmašeková and Terézia Kvasnicová-Galovičová; Funding acquisition, Natália Stalmašeková; Investigation, Iveta Kremeňová; Methodology, Juraj Fabuš; Project administration, Natália Stalmašeková; Resources, Juraj Fabuš; Software, Natália Stalmašeková and Terézia Kvasnicová-Galovičová; Supervision, Iveta Kremeňová; Validation, Juraj Fabuš and Iveta Kremeňová; Visualization, Terézia Kvasnicová-Galovičová; Writing – original draft, Juraj Fabuš and Natália Stalmašeková; Writing – review & editing, Juraj Fabuš and Terézia Kvasnicová-Galovičová. All authors have read and agreed to the published version of the manuscript.
Funding
The paper is published with the support of project VEGA 1/0460/22, VEGA 1/0333/24 and project CIS 07711134 by Ministry of Educations SR.
Conflicts of Interest
All authors declare no conflict of interest.
References
- (Agosto and Cafferata. 2020) Agosto, A., and Cafferata, A. (2020). Financial bubbles: A study of co-explosivity in the cryptocurrency market. Risks, 8(2). [CrossRef]
- (Albrecher et al. 2022) Albrecher, H., Finger, D., and Goffard, P. O. (2022). Blockchain mining in pools: Analyzing the trade-off between profitability and ruin. Insurance: Mathematics and Economics, 105, 313–335. [CrossRef]
- (Azamjon et al. 2016) Azamjon, M., Sattarov, O., and Daeyoung, N. A. (2016). Enhanced Bitcoin Price Direction Forecasting with DQN. [CrossRef]
- ( Bakhtiar et al. 2023) Bakhtiar, T., Luo, X., and Adelopo, I. (2023). The impact of fundamental factors and sentiments on the valuation of cryptocurrencies. Blockchain: Research and Applications, 4(4). [CrossRef]
- (Bâra and Oprea 2024) Bâra, A., and Oprea, S.-V. (2024). The Impact of Academic Publications over the Last Decade on Historical Bitcoin Prices Using Generative Models. Journal of Theoretical and Applied Electronic Commerce Research, 19(1), 538–560. [CrossRef]
- (Baur and Mcdermott 2009) Baur, D. G., and Mcdermott, T. K. (2009). Is Gold a Safe Haven? International Evidence. http://ssrn.com/abstract=1516838Electroniccopyavailableat:https://ssrn.com/abstract=1516838Electroniccopyavailableat:https://ssrn.com/abstract=1516838Electroniccopyavailableat:http://ssrn.com/abstract=1516838.
- (Bendiksen and Gibbons 2018) Bendiksen, C., and Gibbons, S. (2018). THE BITCOIN MINING NETWORK The Bitcoin Mining Network-Trends, Marginal Creation Cost, Electricity Consumption and Sources. In CoinShares Research.
- (Bendiksen and Gibbons 2019a) Bendiksen, C., and Gibbons, S. (2019a). Bitcoin Mining Network Report December 2019 Research CoinShares. Coin Shares Research.
- (Bendiksen and Gibbons 2019b) Bendiksen, C., and Gibbons, S. (2019b). THE BITCOIN MINING NETWORK Trends, Average Creation Costs, Electricity Consumption and Sources. https://www.academia.edu/85064964/The_Bitcoin_Mining_Network_Trends_Average_Creation_Costs_Electricity_Consumption_and_Sources_June_2019_.
- binance.com 2024) www.binance.com. (2024, March 25). When Is the Next Bitcoin Halving in 2024? Https://Www.Binance.Com/En/Events/Bitcoin-Halving. https://www.binance.com/en/events/bitcoin-halving.
- (bitpanda.com 2024) www.bitpanda.com. (2024, March 25). Bitcoin Halving Countdown 2024. Https://Www.Bitpanda.Com/En/Bitcoin-Halving-Countdown. https://www.bitpanda.com/en/bitcoin-halving-countdown.
- (Butek 2016) Butek, M. (2016). Limits of Use of Bitcoin As a Global Means of Exchange. Globalization and Its Socio-Economic Consequences, 16Th International Scientific Conference Proceedings, Pts I-V.
- (Cengiz 2021) Cengiz, F. (2021). What the EU’s new MiCA regulation could mean for cryptocurrencies. Lse - Europp, May 2020.
- (Chan et al. 2023) Chan, J. Y. Le, Phoong, S. W., Phoong, S. Y., Cheng, W. K., and Chen, Y. L. (2023). The Bitcoin Halving Cycle Volatility Dynamics and Safe Haven-Hedge Properties: A MSGARCH Approach. Mathematics, 11(3). [CrossRef]
- (Chaturved 2024) Chaturved, P. (2024, March 1). Most anticipated crypto event in 2024: The Bitcoin halving Read more at: https://economictimes.indiatimes.com/markets/cryptocurrency/most-anticipated-crypto-event-in-2024-the-bitcoin-halving/articleshow/108131126.cms?utm_source=contentofinterest&utm_medium=text&utm_campaign=cppst. Https://Economictimes.Indiatimes.Com/Markets/Cryptocurrency/Most-Anticipated-Crypto-Event-in-2024-the-Bitcoin-Halving/Articleshow/108131126.Cms?From=mdr.
- (Chohan 2019) Chohan, U. W. (2019). The Next Bitcoin Halving. SSRN Electronic Journal. [CrossRef]
- (Ciaian et al. 2015) Ciaian, P., Rajcaniova, M., and Kancs, A. (2015). The economics of BitCoin price formation. Applied Economics, 48(19), 1799–1815.
- (Coinbase 2024) www.coinbase.com (2024, March 20). The Bitcoin Halving: Everything you need to know. https://www.coinbase.com/bitcoin-halving.
- (CoinDCX.com 2024) CoinDCX.com (2024, March 20). Bitcoin Halving 2024 Explained: Why It Matters? Next Halving Date and Countdown. https://coindcx.com/blog/bitcoin-halving-2024/.
- (Coingecko.com 2024) www.coingecko.com. (2024, March 3). What is Bitcoin Halving? https://www.coingecko.com/.
- (coinmarketcap.com 2024) https://coinmarketcap.com/. (2024, March 20). Https://Coinmarketcap.Com/.
- (Conway 2024) Conway, L. (2024, March 6). What Is Bitcoin Halving? Definition, How It Works, Why It Matters. Https://Www.Investopedia.Com/Bitcoin-Halving-4843769. https://www.investopedia.com/bitcoin-halving-4843769.
- (Courtois et al. 2013) Courtois, N. T., Grajek, M., and Naik, R. (2013). The Unreasonable Fundamental Incertitudes Behind Bitcoin Mining. https://arxiv.org/abs/1310.7935.
- (Crawley 2020) Crawley, J. (2020). Bitcoin halving: What does this mean and what will its effect be? Finextra. https://www.finextra.com/the-long-read/40/bitcoin-halving-what-does-this-mean-and-what-will-its-effect-be.
- (Cuthbertson 2024) Cuthbertson, A. (2024, February 29). Bitcoin halving explained: What is ‘historic’ crypto event and will price hit new record? Https://Www.Independent.Co.Uk/Tech/Bitcoin-Halving-2024-Explained-Price-Prediction-B2504532.Html.
- (de la Horra et al. 2019) de la Horra, L., de la Fuente, G., and Perote, J. (2019). The drivers of Bitcoin demand: A short and long-run analysis. International Review of Financial Analysis, 62, 21–34.
- (Deutsch 2018) Deutsch, H.-P. (2018). Bitcoin Mining Profitability The Good, the Bad and the Ugly. SSRN Electronic Journal. [CrossRef]
- (Dierks 2024) Dierks, D. (2024, January 19). When is the next Bitcoin halving? Everything you need to know. Https://Www.Finextra.Com/the-Long-Read/920/When-Is-the-next-Bitcoin-Halving-Everything-You-Need-to-Know.
- (Dyhrberg 2016) Dyhrberg, A. H. (2016). Bitcoin, gold and the dollar – A GARCH volatility analysis. Finance Research Letters, 16, 85–92.
- (Eksi and Schreitl 2022) Eksi, Z., and Schreitl, D. (2022). Closing a Bitcoin Trade Optimally under Partial Information: Performance Assessment of a Stochastic Disorder Model. Mathematics, 10(1). [CrossRef]
- (El Mahdy 2021) El Mahdy, D. (2021). The Economic Effect of Bitcoin Halving Events on the U.S. Capital Market. In Accounting and Finance Innovations. IntechOpen. [CrossRef]
- (ET Spotlight team 2024) ET Spotlight team (2024, March 15). Bitcoin Halving 2024 Explained: How it works and Why does it Matter. Https://Economictimes.Indiatimes.Com/Markets/Cryptocurrency/Bitcoin-Halving-2024-Explained-How-It-Works-Why-Does-It-Matter/Articleshow/108519138.Cms. https://economictimes.indiatimes.com//markets/cryptocurrency/bitcoin-halving-2024-explained-how-it-works-why-does-it-matter/articleshow/108519138.cms?utm_source=contentofinterest&utm_medium=text&utm_campaign=cppst.
- (Fantazzini and Kolodin 2020) Fantazzini, D., and Kolodin, N. (2020). Does the Hashrate Affect the Bitcoin Price? Journal of Risk and Financial Management, 13(11). [CrossRef]
- (Gkillas and Longin 2019) Gkillas, K., and Longin, F. (2019). Is bitcoin the new digital gold? Evidence from extreme price movements in financial markets*. https://www.longin.fr/Recherche_Publications/Articles_pdf/Gkillas_Longin_Is_Bitcoin_new_digital_Gold.pdf.
- (Hayes 2015) Hayes, A. (2015). A Cost of Production Model for Bitcoin. SSRN Electronic Journal. [CrossRef]
- (Hertig 2024) Hertig, A. (2024, March 8). Bitcoin Halving, Explained. Https://Www.Coindesk.Com/Learn/Bitcoin-Halving-Explained/.
- (Howcroft and Reggiori 2024) Howcroft, E., and Reggiori Wilkes, T. (2024, March 14). Bitcoin halving: When will it happen and what does it mean for the price? Https://Www.Reuters.Com/Technology/What-Is-Bitcoins-Halving-Does-It-Matter-2024-03-13/.
- (Jahanshahloo et al. 2023) Jahanshahloo, H., Irresberger, F., and Urquhart, A. (2023). Bitcoin under the microscope. British Accounting Review. [CrossRef]
- (Jiménez et al. 2024) Jiménez, I., Mora-Valencia, A., and Perote, J. (2024). Bitcoin halving and the integration of cryptocurrency and forex markets: An analysis of the higher-order moment spillovers. International Review of Economics and Finance, 92, 302–315. [CrossRef]
- (John et al. 2022) John, K., O’hara, M., and Saleh, F. (2022). Bitcoin and Beyond. [CrossRef]
- (kaggle.com 2024) www.kaggle.com. (2024, March 23). DATA SET. Https://Www.Kaggle.Com/Datasets/Krairy/Bitcoin-Daily-Price-and-Vol-Jul-2010-Mar-2024?Resource=download.
- (Katanich 2024) Katanich, D. (2024, March 15). Bitcoin price predictions: How much more could the cryptocurrency rise in 2024? Https://Www.Euronews.Com/Business/2024/02/06/Bitcoin-Price-Predictions-How-Much-More-Can-the-Cryptocurrency-Rise-in-2024.
- (Kawaguchi and Noda 2022) Kawaguchi, K., and Noda, S. (2022). Security-Cost Efficiency of Competing Proof-of-Work Cryptocurrencies. SSRN Electronic Journal. [CrossRef]
- (Kiffer and Rajaraman 2021) Kiffer, L., and Rajaraman, R. (2021). HaPPY-Mine: Designing a Mining Reward Function. Lecture Notes in Computer Science (Including Subseries Lecture Notes in Artificial Intelligence and Lecture Notes in Bioinformatics), 12675 LNCS. [CrossRef]
- (Kuhn 2024) Kuhn, D. (2024, March 19). The Bitcoin Halving Really Is Different This Time. Consenses Magazine. https://www.coindesk.com/consensus-magazine/2024/03/19/the-bitcoin-halving-really-is-different-this-time/.
- (Lasi and Saul 2020) Lasi, D., and Saul, L. (2020). A System Dynamics Model of Bitcoin: Mining as an Efficient Market and the Possibility of ‘Peak Hash’. Applied Economics and Finance, 7(4). [CrossRef]
- (Lookintobitcoin.com 2024) Rainbow chart. (2024, March 6). www.Lookintobitcoin.com/Charts/Bitcoin-Rainbow-Chart.
- (Lucking et al. 2019) Lucking, D., Aravind Allen, V., and Llp, O. (2019). Cryptocurrency as a commodity: The CFTC’s Regulatory framework. Fintech, 2–9.
- (Mahdy 2021) Mahdy, D. El. (2021). The Economic Effect of Bitcoin Halving Events on the U.S. Capital Market. www.intechopen.com.
- (Masters 2019) Masters, J. (2019). Impact of the 2020 Bitcoin Halving: A Mathematical, Social, and Econometric Analysis. https://www.researchgate.net/publication/337823952.
- (M’bakob 2024) M’bakob, G. B. (2024). Bubbles in Bitcoin and Ethereum: The role of halving in the formation of super cycles. Sustainable Futures, 7. [CrossRef]
- (Meynkhard 2019) Meynkhard, A. (2019). Fair market value of bitcoin: Halving effect. Investment Management and Financial Innovations, 16(4), 72–85. [CrossRef]
- (Nakamoto 2009) Nakamoto, S. (2009). Bitcoin: A Peer-to-Peer Electronic Cash System. https://bitcoin.org/bitcoin.pdf.
- (Pan et al. 2020) Pan, L., Feng, L., and Jiayin, Q. (2020). Adaptive Evolution Mechanism of Blockchain Community Based on Token-based Halving Event. Proceedings - 2020 Chinese Automation Congress, CAC 2020. [CrossRef]
- (Patel 2021) Patel, A. (2021). The Economic Impact of Bit Coin Halving Events in The United States. We’Ken- International Journal of Basic and Applied Sciences, 6(2). [CrossRef]
- (Phiri 2022) Phiri, A. (2022). Can wavelets produce a clearer picture of weak-form market efficiency in Bitcoin? Eurasian Economic Review, 12(3). [CrossRef]
- (Prasad 2022) Prasad, E. (2022). After the fall: Bitcoin’s true legacy may be blockchain technology. Bulletin of the Atomic Scientists, 78(4). [CrossRef]
- (Ramadhani 2022) Ramadhani, M. H. Z. K. (2022). The Impact of Bitcoin Halving Day on Stock Market in Indonesia. Journal of International Conference Proceedings, 5(3), 127–137. [CrossRef]
- (Rashid et al. 2023) Rashid, A., Bakry, W., and Al-Mohamad, S. (2023). Are cryptocurrencies a future safe haven for investors? The case of Bitcoin. Economic Research-Ekonomska Istrazivanja, 36(2). [CrossRef]
- (Riposo 2023) Riposo, J. (2023). Some fundamentals of mathematics of blockchain. In Some Fundamentals of Mathematics of Blockchain. [CrossRef]
- (Samizadeh 2024a) Samizadeh, I. (2024a). Enhanced Bitcoin Price Forecasting for the 2024 Halving Using the Prophet Model.
- (Samizadeh 2024b) Samizadeh, I. (2024b). Leveraging Random Forest Algorithms for Enhanced Bitcoin Price Forecasting 2024 Halving. [CrossRef]
- (Schär 2020) Schär, F. (2020). Bitcoin Halving. https://www.researchgate.net/publication/343725174.
- (Sedlmeir et al. 2020a) Sedlmeir, J., Buhl, H. U., Fridgen, G., and Keller, R. (2020a). A look at current developments in blockchains and their effects on energy consumption | Ein Blick auf aktuelle Entwicklungen bei Blockchains und deren Auswirkungen auf den Energieverbrauch. Informatik-Spektrum, 43(6).
- (Sedlmeir et al. 2020b) Sedlmeir, J., Buhl, H. U., Fridgen, G., and Keller, R. (2020b). Ein Blick auf aktuelle Entwicklungen bei Blockchains und deren Auswirkungen auf den Energieverbrauch. Informatik-Spektrum, 43(6). [CrossRef]
- (Sen and Jena 2022) Sen, A., and Jena, G. (2022). The Latest Trend in India Cryptocurrency. International Interdisciplinary Humanitarian Conference for Sustainability, IIHC 2022 - Proceedings. [CrossRef]
- (Singla et al. 2023) Singla, A., Singla, M., and Gupta, M. (2023). Unpacking the Impact of Bitcoin Halving on the Crypto Market: Benefits and Limitations. Scientific Journal of Metaverse and Blockchain Technologies, 1(1), 43–50. [CrossRef]
- (Touloupou et al. 2022) Touloupou, M., Themistocleous, M., Iosif, E., and Christodoulou, K. (2022). A Systematic Literature Review Toward a Blockchain Benchmarking Framework. In IEEE Access (Vol. 10, pp. 70630–70644). Institute of Electrical and Electronics Engineers Inc. [CrossRef]
- (Trucíos and Taylor 2023) Trucíos, C., and Taylor, J. W. (2023). A comparison of methods for forecasting value at risk and expected shortfall of cryptocurrencies. Journal of Forecasting, 42(4). [CrossRef]
- (Vaddadi et al. 2023) Vaddadi, V. R., Vardhan Raj Annepu, P., Gollapalli, N., Challa, A., Andhavarapu, S. B., and Kumar Botta, P. (2023). Exploiting Cyber Threats and Protecting Cryptocurrencies Toward Bitcoin Exchanges. 5th Biennial International Conference on Nascent Technologies in Engineering, ICNTE 2023. [CrossRef]
- (Valamontes 2024) Valamontes, A. (2024). Navigating the Fourth Bitcoin Halving Economic Impacts and Innovations.
- (Wang et al. 2020) Wang, C., Chu, X., and Qin, Y. (2020). Measurement and Analysis of the Bitcoin Networks: A View from Mining Pools. Proceedings - 2020 6th International Conference on Big Data Computing and Communications, BigCom 2020. [CrossRef]
- (Whittaker 2024) Whittaker, M. (2024, March 25). Bitcoin Halving 2024 – What You Need To Know. Https://Www.Forbes.Com/Uk/Advisor/Investing/Cryptocurrency/Bitcoin-Halving/.
- (Wu et al. 2023) Wu, R., Alamgir Hossain, M., and Hossain, M. A. (2023). Factors Affecting the Volatility of Bitcoin Prices. [CrossRef]
- (www.ig.com 2024) www.ig.com. (2024, March 25). Bitcoin halving 2024: what to know. Https://Www.Ig.Com/En/Bitcoin-Btc/Bitcoin-Halving. https://www.ig.com/en/bitcoin-btc/bitcoin-halving.
- (Yuan et al. 2022) Yuan, X., Su, C. W., and Peculea, A. D. (2022). Dynamic linkage of the bitcoin market and energy consumption:An analysis across time. Energy Strategy Reviews, 44. [CrossRef]
- (Zhao 2024) Zhao, M. (2024, February 9). 2024 Halving: This Time It’s Actually Different. Https://Www.Grayscale.Com/Research/Reports/2024-Halving-This-Time-Its-Actually-Different.
|
Disclaimer/Publisher’s Note: The statements, opinions and data contained in all publications are solely those of the individual author(s) and contributor(s) and not of MDPI and/or the editor(s). MDPI and/or the editor(s) disclaim responsibility for any injury to people or property resulting from any ideas, methods, instructions or products referred to in the content. |
© 2024 by the authors. Licensee MDPI, Basel, Switzerland. This article is an open access article distributed under the terms and conditions of the Creative Commons Attribution (CC BY) license (http://creativecommons.org/licenses/by/4.0/).
