Submitted:
18 April 2024
Posted:
22 April 2024
You are already at the latest version
Abstract
Keywords:
1. Introduction
2. Lamb Wave Localization Imaging Algorithm
2.1. DaS Algorithm
2.2. ORAPID Algorithm
2.3. IRAPID algorithm
3. Experiment
3.1. Preparation of CFRP Bending Plate
3.2. Experimental Procedure
4. Results and Discussion
4.1. DaS Algorithm Localization Results
4.2. ORAPID Algorithm Localization Results
4.3. IRAPID Algorithm Localization Results
5. Conclusions
- (1)
- Compared with the DaS algorithm and the ORAPID algorithm, the IRAPID algorithm has achieved more accurate results in the localization of delamination damage at each frequency.
- (2)
- In the range of frequency variation considered, the stability of the IRAPID algorithm for delamination damage localization is superior to that of the DaS algorithm and the ORAPID algorithm.
- (3)
- The localization of delamination damage will become increasingly challenging due to the increase in its size.
- (4)
- The accuracy of delamination damage localization in different axial directions will vary due to the existence of bending structures. The accuracy of delamination damage localization is higher in the Y-axis direction than in the X-axis direction.
- (5)
- To a certain extent, it mitigates the potential localization errors associated with single-frequency detection by averaging the localization results across various frequencies. Lamb waves with multiple frequencies can be employed for delamination damage localization detection, and the detection results at each frequency are averaged to enhance the reliability of localization.
Author Contributions
Funding
Data Availability Statement
Conflicts of Interest
References
- Bin Mohamed Rehan, M.S.; Rousseau, J.; Fontaine, S.; Gong, X.J. Experimental Study of the Influence of Ply Orientation on DCB Mode-I Delamination Behavior by Using Multidirectional Fully Isotropic Carbon/Epoxy Laminates. Composite Structures 2017, 161, 1–7. [Google Scholar] [CrossRef]
- Hegde, S.; Satish Shenoy, B.; Chethan, K.N. Review on Carbon Fiber Reinforced Polymer (CFRP) and Their Mechanical Performance. Materials Today: Proceedings 2019, 19, 658–662. [Google Scholar] [CrossRef]
- Huo, R.; Chen, L.; Liu, J.; Peng, D. The Application of Transfer Matrix Method in Acoustic Performance Analysis of Composite Materials and Acoustic Protection Design of Ship. IOP Conf. Ser.: Mater. Sci. Eng. 2019, 544, 012047. [Google Scholar] [CrossRef]
- Wang, Z.W.; Zhao, J.P.; Zhang, X. Finite Element Analysis of Composite Laminates Subjected to Low-Velocity Impact Based on Multiple Failure Criteria. Mater. Res. Express 2018, 5, 065320. [Google Scholar] [CrossRef]
- May, M.; Rupakula, G.D.; Matura, P. Non-Polymer-Matrix Composite Materials for Space Applications. Composites Part C: Open Access 2020, 3, 100057. [Google Scholar] [CrossRef]
- Langat, R.K.; De Luycker, E.; Cantarel, A.; Rakotondrabe, M. Integration Technology with Thin Films Co-Fabricated in Laminated Composite Structures for Defect Detection and Damage Monitoring. Micromachines 2024, 15, 274. [Google Scholar] [CrossRef] [PubMed]
- Singh, A.P.; Sharma, M.; Singh, I. A Review of Modeling and Control during Drilling of Fiber Reinforced Plastic Composites. Composites Part B: Engineering 2013, 47, 118–125. [Google Scholar] [CrossRef]
- Vishwakarma, A.; Behera, A.; Thawre, M.M.; Ballal, A.R. Effect of Thickness Variation on Static Behaviour of Carbon Fiber Reinforced Polymer Multidirectional Laminated Composite. Mater. Res. Express 2019, 6, 115312. [Google Scholar] [CrossRef]
- Shyha, I.; Soo, S.L.; Aspinwall, D.; Bradley, S. Effect of Laminate Configuration and Feed Rate on Cutting Performance When Drilling Holes in Carbon Fibre Reinforced Plastic Composites. Journal of Materials Processing Technology 2010, 210, 1023–1034. [Google Scholar] [CrossRef]
- Singh, T.J.; Samanta, S. Characterization of Kevlar Fiber and Its Composites: A Review. Materials Today: Proceedings 2015, 2, 1381–1387. [Google Scholar] [CrossRef]
- McConnell, V.P. Ballistic Protection Materials a Moving Target. Reinforced Plastics 2006, 50, 20–25. [Google Scholar] [CrossRef]
- Ameri, B.; Moradi, M.; Mohammadi, B.; Salimi-Majd, D. Investigation of Nonlinear Post-Buckling Delamination in Curved Laminated Composite Panels via Cohesive Zone Model. Thin-Walled Structures 2020, 154, 106797. [Google Scholar] [CrossRef]
- Cairns, D.S.; Nelson, J.W.; Woo, K.; Miller, D. Progressive Damage Analysis and Testing of Composite Laminates with Fiber Waves. Composites Part A: Applied Science and Manufacturing 2016, 90, 51–61. [Google Scholar] [CrossRef]
- Mehdikhani, M.; Gorbatikh, L.; Verpoest, I.; Lomov, S.V. Voids in Fiber-Reinforced Polymer Composites: A Review on Their Formation, Characteristics, and Effects on Mechanical Performance. Journal of Composite Materials 2019, 53, 1579–1669. [Google Scholar] [CrossRef]
- Woo, K.; Nega, B.F.; Cairns, D.S.; Lua, J. Delamination Behavior of L-Shaped Composite Beam with Manufacturing Defects. J Mech Sci Technol 2020, 34, 3709–3720. [Google Scholar] [CrossRef]
- Li, J.G.; Liu, P.F.; Chu, J.K. Finite Element Analysis of Delamination Behaviors of Composite Laminates under Hygrothermal Environment Using Virtual Crack Closure Technique. J Fail. Anal. and Preven. 2019, 19, 147–153. [Google Scholar] [CrossRef]
- Kharghani, N.; Guedes Soares, C. Behavior of Composite Laminates with Embedded Delaminations. Composite Structures 2016, 150, 226–239. [Google Scholar] [CrossRef]
- Yamanaka, T.; Heidari-Rarani, M.; Lessard, L.; Feret, V.; Hubert, P. A New Finite Element Method for Modeling Delamination Propagation without Additional Degrees of Freedom. Composite Structures 2016, 147, 82–98. [Google Scholar] [CrossRef]
- Jin, F.; Xu, P.; Xia, F.; Liang, H.; Yao, S.; Xue, J. Buckling of Composite Laminates with Multiple Delaminations: Part I Theoretical and Numerical Analysis. Composite Structures 2020, 250, 112491. [Google Scholar] [CrossRef]
- Higuchi, R.; Warabi, S.; Ishibashi, W.; Okabe, T. Experimental and Numerical Investigations on Push-out Delamination in Drilling of Composite Laminates. Composites Science and Technology 2020, 198, 108238. [Google Scholar] [CrossRef]
- Geng, D.; Liu, Y.; Shao, Z.; Lu, Z.; Cai, J.; Li, X.; Jiang, X.; Zhang, D. Delamination Formation, Evaluation and Suppression during Drilling of Composite Laminates: A Review. Composite Structures 2019, 216, 168–186. [Google Scholar] [CrossRef]
- Hocheng, H.; Chen, C.C.; Tsao, C.C. Prediction of Critical Thrust Force for Tubular Composite in Drilling-Induced Delamination by Numerical and Experimental Analysis. Composite Structures 2018, 203, 566–573. [Google Scholar] [CrossRef]
- Ouyang, T.; Sun, W.; Bao, R.; Tan, R. Effects of Matrix Cracks on Delamination of Composite Laminates Subjected to Low-Velocity Impact. Composite Structures 2021, 262, 113354. [Google Scholar] [CrossRef]
- Sivakumar, V.; Gautham Barathwaj, P.; Santosh Kumar, M.; Srikar, D. Delamination Propagation Study on Aircraft Composite Rib Subjected to Fatigue Loading. J Fail. Anal. and Preven. 2020, 20, 1351–1363. [Google Scholar] [CrossRef]
- Gong, Y.; Zhao, L.; Zhang, J.; Hu, N. A Novel Model for Determining the Fatigue Delamination Resistance in Composite Laminates from a Viewpoint of Energy. Composites Science and Technology 2018, 167, 489–496. [Google Scholar] [CrossRef]
- Gong, Y.; Zhao, L.; Zhang, J.; Hu, N.; Zhang, C. Development of a Standardized Test Procedure and an Improved Data Reduction Method for the Mixed-Mode I/II Delamination in Composite Laminates. Composites Science and Technology 2021, 201, 108488. [Google Scholar] [CrossRef]
- Carrino, S.; Maffezzoli, A.; Scarselli, G. Active SHM for Composite Pipes Using Piezoelectric Sensors. Materials Today: Proceedings 2021, 34, 1–9. [Google Scholar] [CrossRef]
- Raišutis, R.; Kažys, R.; Žukauskas, E.; Mažeika, L.; Vladišauskas, A. Application of Ultrasonic Guided Waves for Non-Destructive Testing of Defective CFRP Rods with Multiple Delaminations. NDT & E International 2010, 43, 416–424. [Google Scholar] [CrossRef]
- Cantero-Chinchilla, S.; Malik, M.K.; Chronopoulos, D.; Chiachío, J. Bayesian Damage Localization and Identification Based on a Transient Wave Propagation Model for Composite Beam Structures. Composite Structures 2021, 267, 113849. [Google Scholar] [CrossRef]
- De Luca, A.; Perfetto, D.; De Fenza, A.; Petrone, G.; Caputo, F. Guided Waves in a Composite Winglet Structure: Numerical and Experimental Investigations. Composite Structures 2019, 210, 96–108. [Google Scholar] [CrossRef]
- Munian, R.K.; Roy Mahapatra, D.; Gopalakrishnan, S. Ultrasonic Guided Wave Scattering Due to Delamination in Curved Composite Structures. Composite Structures 2020, 239, 111987. [Google Scholar] [CrossRef]
- Hunten, K.A.; Barnard Feeney, A.; Srinivasan, V. Recent Advances in Sharing Standardized STEP Composite Structure Design and Manufacturing Information. Computer-Aided Design 2013, 45, 1215–1221. [Google Scholar] [CrossRef]
- Seeger, J.; Wolf, K. Multi-Objective Design of Complex Aircraft Structures Using Evolutionary Algorithms. Proceedings of the Institution of Mechanical Engineers, Part G: Journal of Aerospace Engineering 2011, 225, 1153–1164. [Google Scholar] [CrossRef]
- Rao, J.; Ratassepp, M.; Lisevych, D.; Hamzah Caffoor, M.; Fan, Z. On-Line Corrosion Monitoring of Plate Structures Based on Guided Wave Tomography Using Piezoelectric Sensors. Sensors 2017, 17, 2882. [Google Scholar] [CrossRef] [PubMed]
- He, J.; Huo, H.; Guan, X.; Yang, J. A Lamb Wave Quantification Model for Inclined Cracks with Experimental Validation. Chinese Journal of Aeronautics 2021, 34, 601–611. [Google Scholar] [CrossRef]
- Shoja, S.; Berbyuk, V.; Boström, A. Delamination Detection in Composite Laminates Using Low Frequency Guided Waves: Numerical Simulations. Composite Structures 2018, 203, 826–834. [Google Scholar] [CrossRef]
- Sha, G.; Xu, H.; Radzieński, M.; Cao, M.; Ostachowicz, W. Wavelet-Aided Guided Wavefield Imaging of Delaminations in Laminated Composite Plates. Smart Mater. Struct. 2020, 29, 105029. [Google Scholar] [CrossRef]
- Michalcová, L.; Hron, R. Quantitative Evaluation of Delamination in Composites Using Lamb Waves. IOP Conf. Ser.: Mater. Sci. Eng. 2018, 326, 012006. [Google Scholar] [CrossRef]
- Feng, B.; Ribeiro, A.L.; Ramos, H.G. Interaction of Lamb Waves with the Edges of a Delamination in CFRP Composites and a Reference-Free Localization Method for Delamination. Measurement 2018, 122, 424–431. [Google Scholar] [CrossRef]
- Huang, L.; Zeng, L.; Lin, J.; Zhang, N. Baseline-Free Damage Detection in Composite Plates Using Edge-Reflected Lamb Waves. Composite Structures 2020, 247, 112423. [Google Scholar] [CrossRef]
- Zhang, H.; Hua, J.; Gao, F.; Lin, J. Efficient Lamb-Wave Based Damage Imaging Using Multiple Sparse Bayesian Learning in Composite Laminates. NDT & E International 2020, 116, 102277. [Google Scholar] [CrossRef]
- Zhao, X.; Royer, R.L.; Owens, S.E.; Rose, J.L. Ultrasonic Lamb Wave Tomography in Structural Health Monitoring. Smart Mater. Struct. 2011, 20, 105002. [Google Scholar] [CrossRef]
- Huang, L.; Zeng, L.; Lin, J.; Luo, Z. An Improved Time Reversal Method for Diagnostics of Composite Plates Using Lamb Waves. Composite Structures 2018, 190, 10–19. [Google Scholar] [CrossRef]
- Wang, S.; Wu, W.; Shen, Y.; Liu, Y.; Jiang, S. Influence of the PZT Sensor Array Configuration on Lamb Wave Tomography Imaging with the RAPID Algorithm for Hole and Crack Detection. Sensors 2020, 20, 860. [Google Scholar] [CrossRef] [PubMed]
- Guo, J.; Zeng, X.; Liu, Q.; Qing, X. Lamb Wave-Based Damage Localization and Quantification in Composites Using Probabilistic Imaging Algorithm and Statistical Method. Sensors 2022, 22, 4810. [Google Scholar] [CrossRef]
- Huo, H.; He, J.; Guan, X. A Bayesian Fusion Method for Composite Damage Identification Using Lamb Wave. Structural Health Monitoring 2021, 20, 2337–2359. [Google Scholar] [CrossRef]


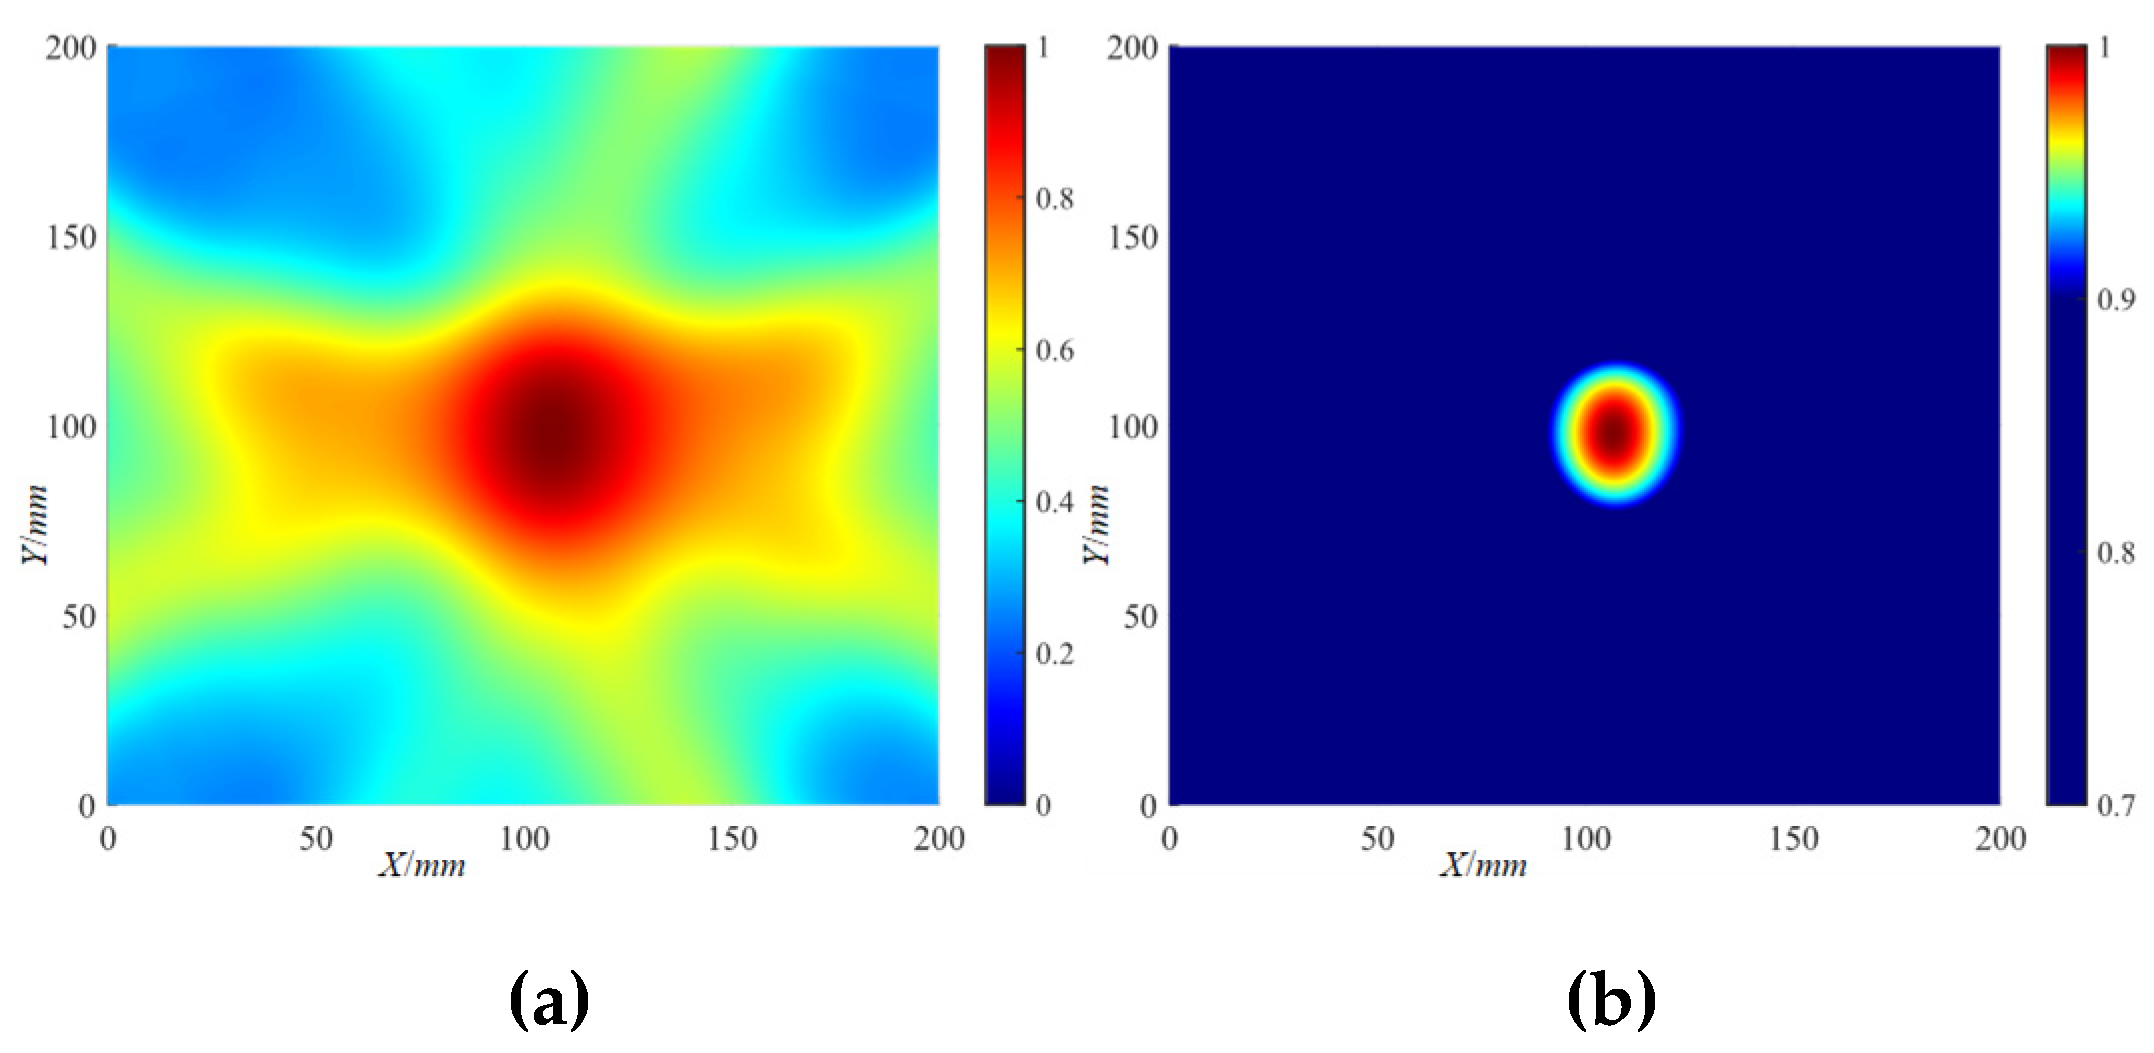


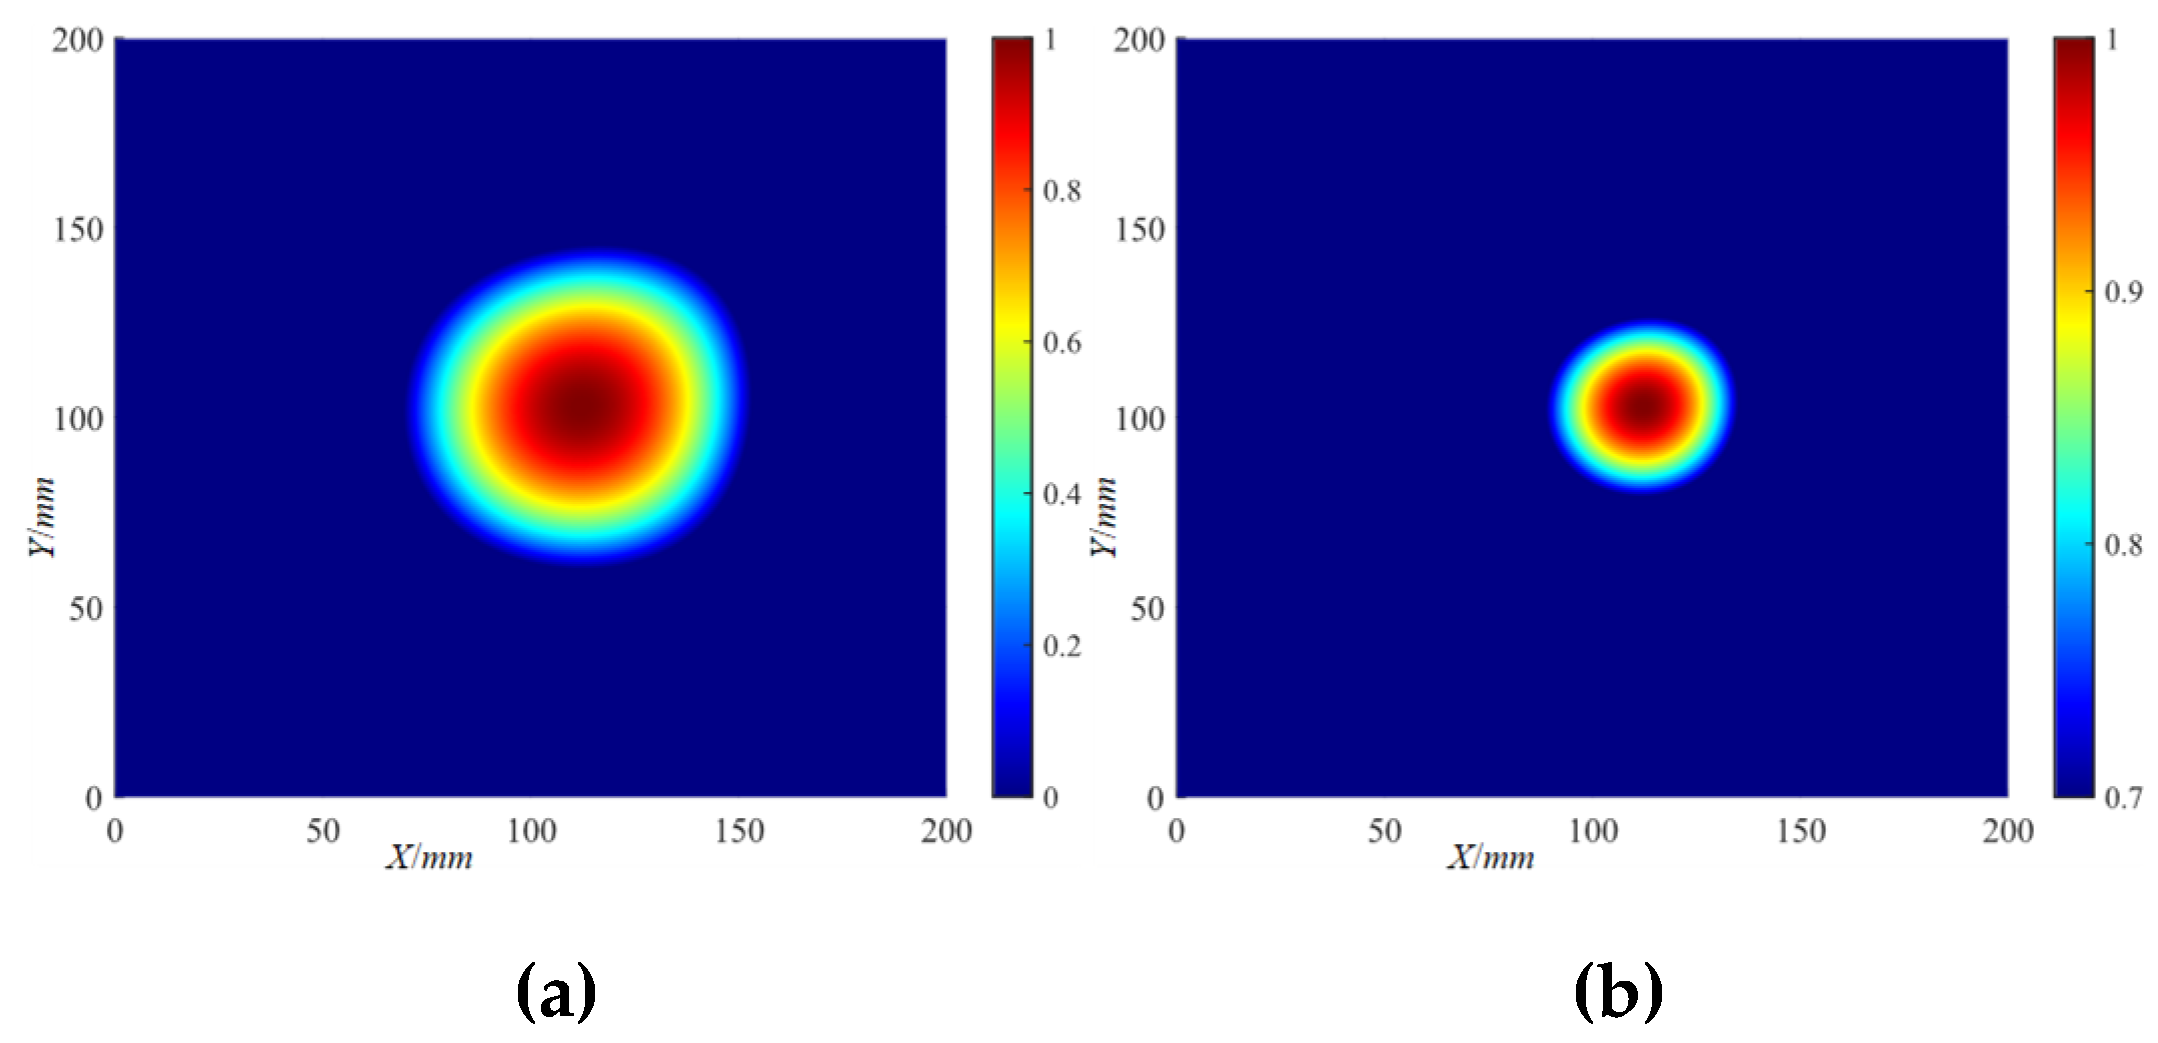
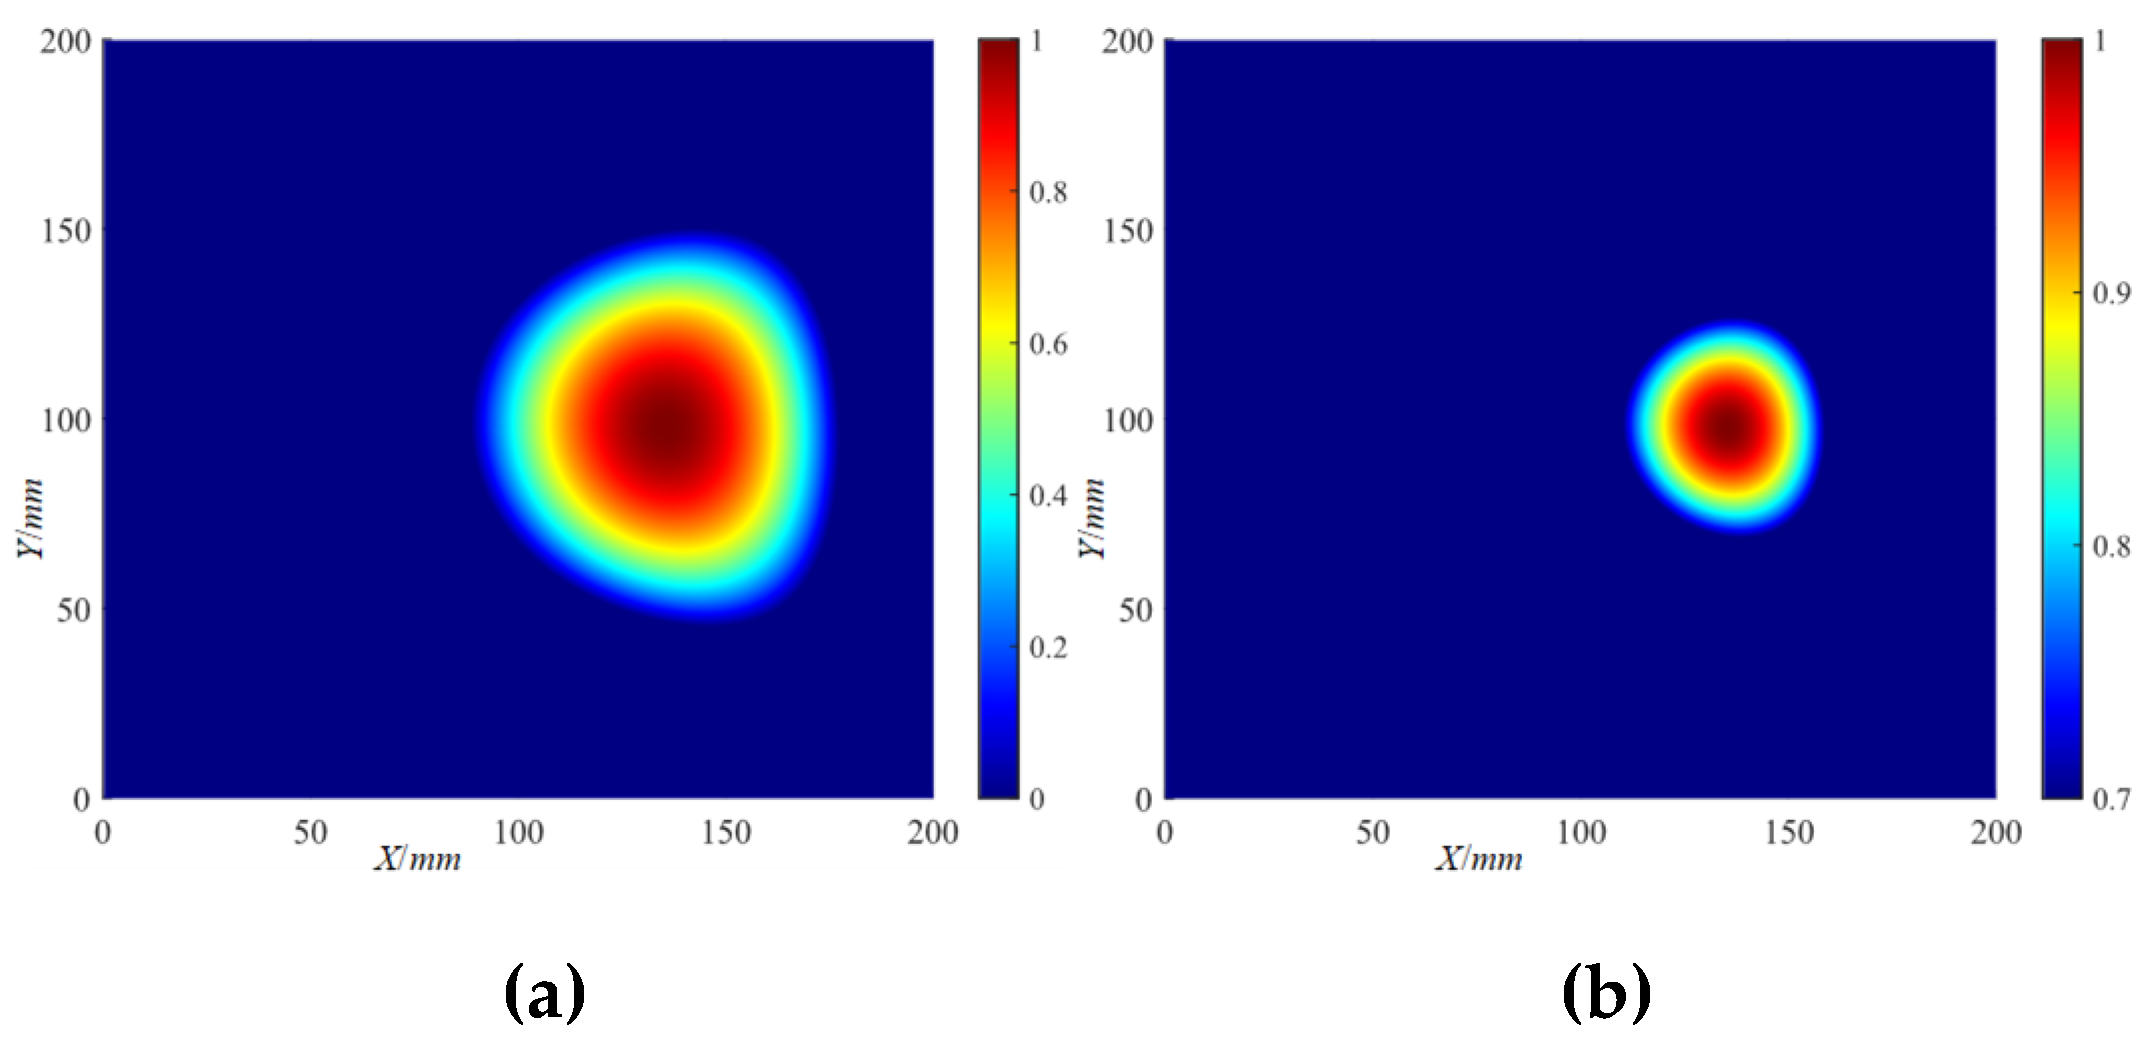


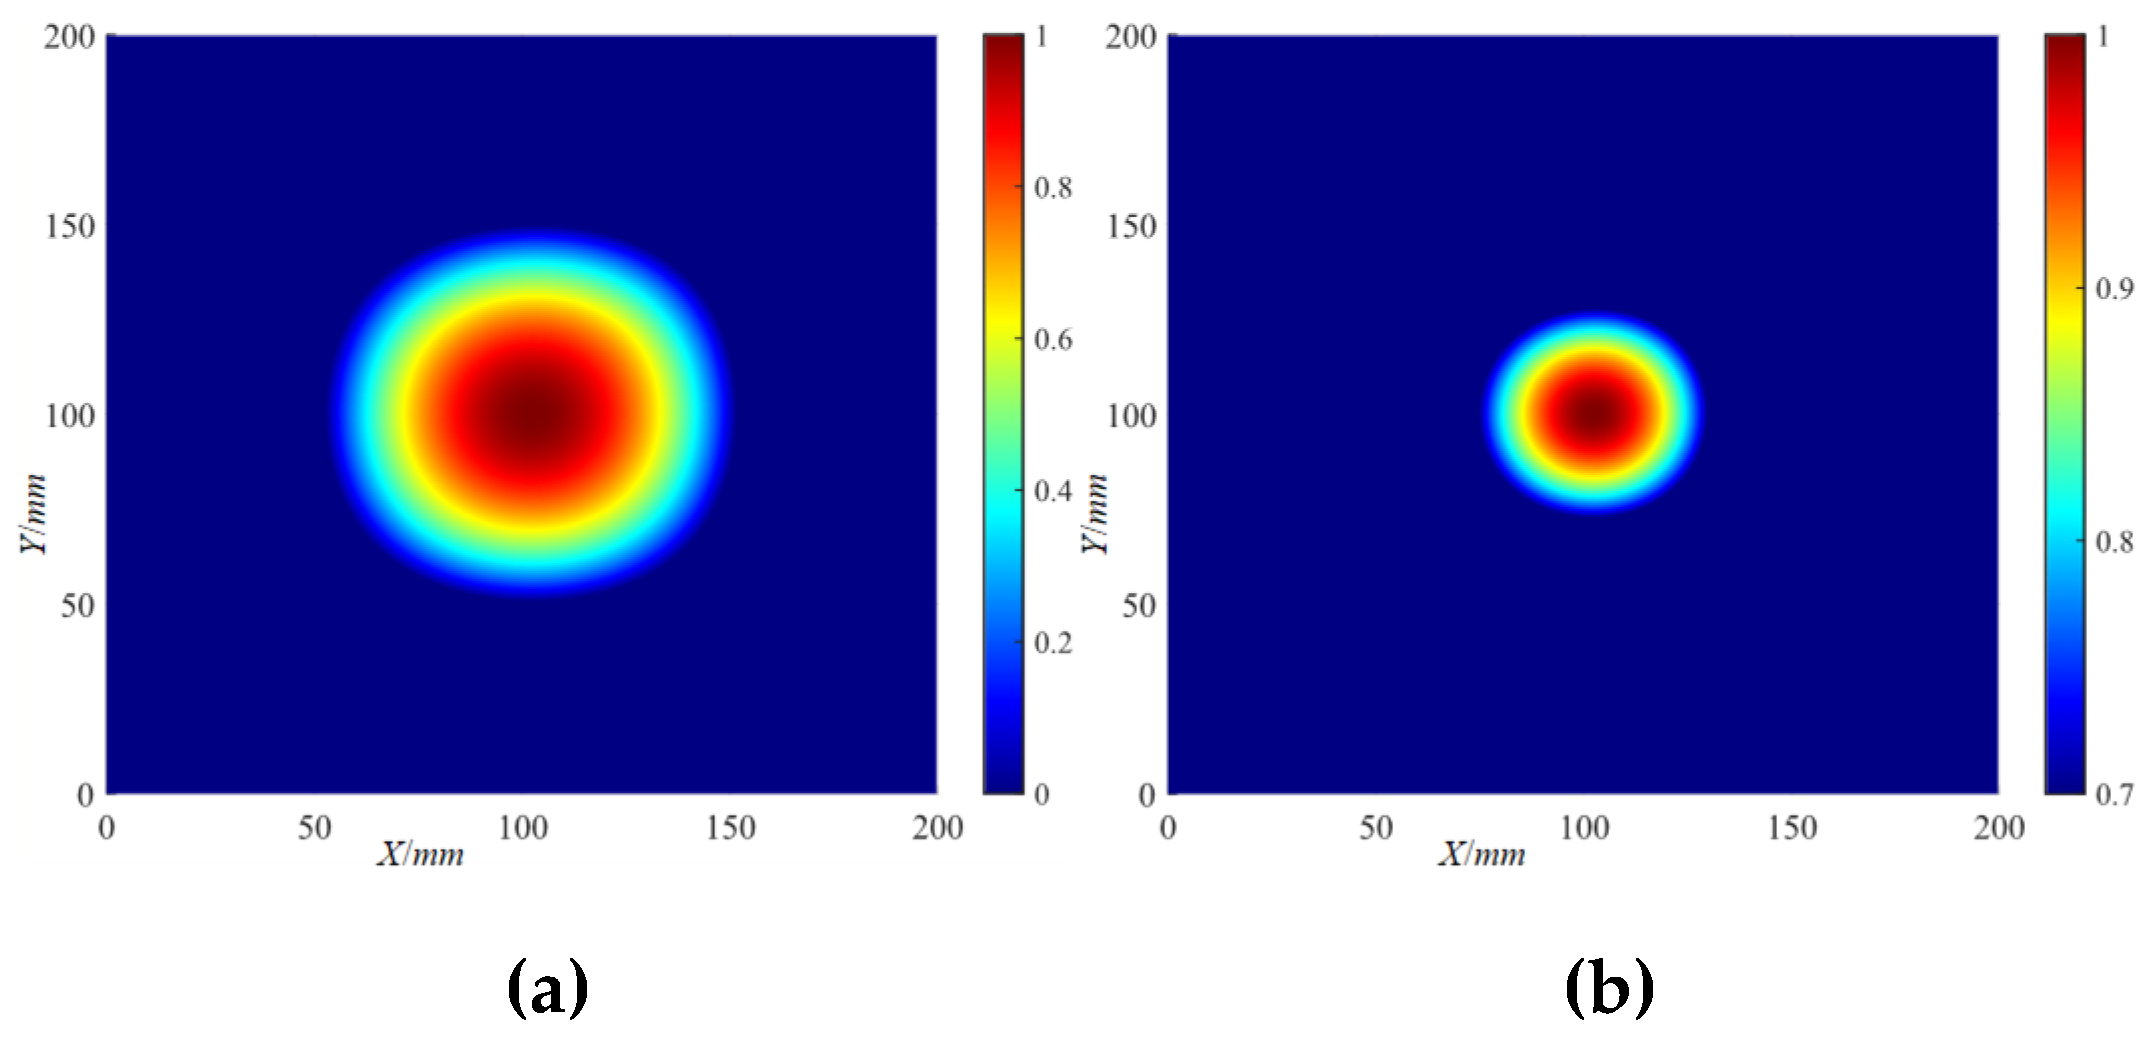
| f (kHz) | 220 | 230 | 240 | 250 | 260 | 270 | 280 | 290 | 300 | 310 | 320 |
| V (m/s) | 5263.9 | 5035.3 | 4915.5 | 4667.3 | 4569.4 | 4343.0 | 4280.0 | 4148.6 | 4122.1 | 4067.5 | 4058.7 |
| f (kHz) | 220 | 230 | 240 | 250 | 260 | 270 | 280 | 290 | 300 | 310 | 320 | fm | |
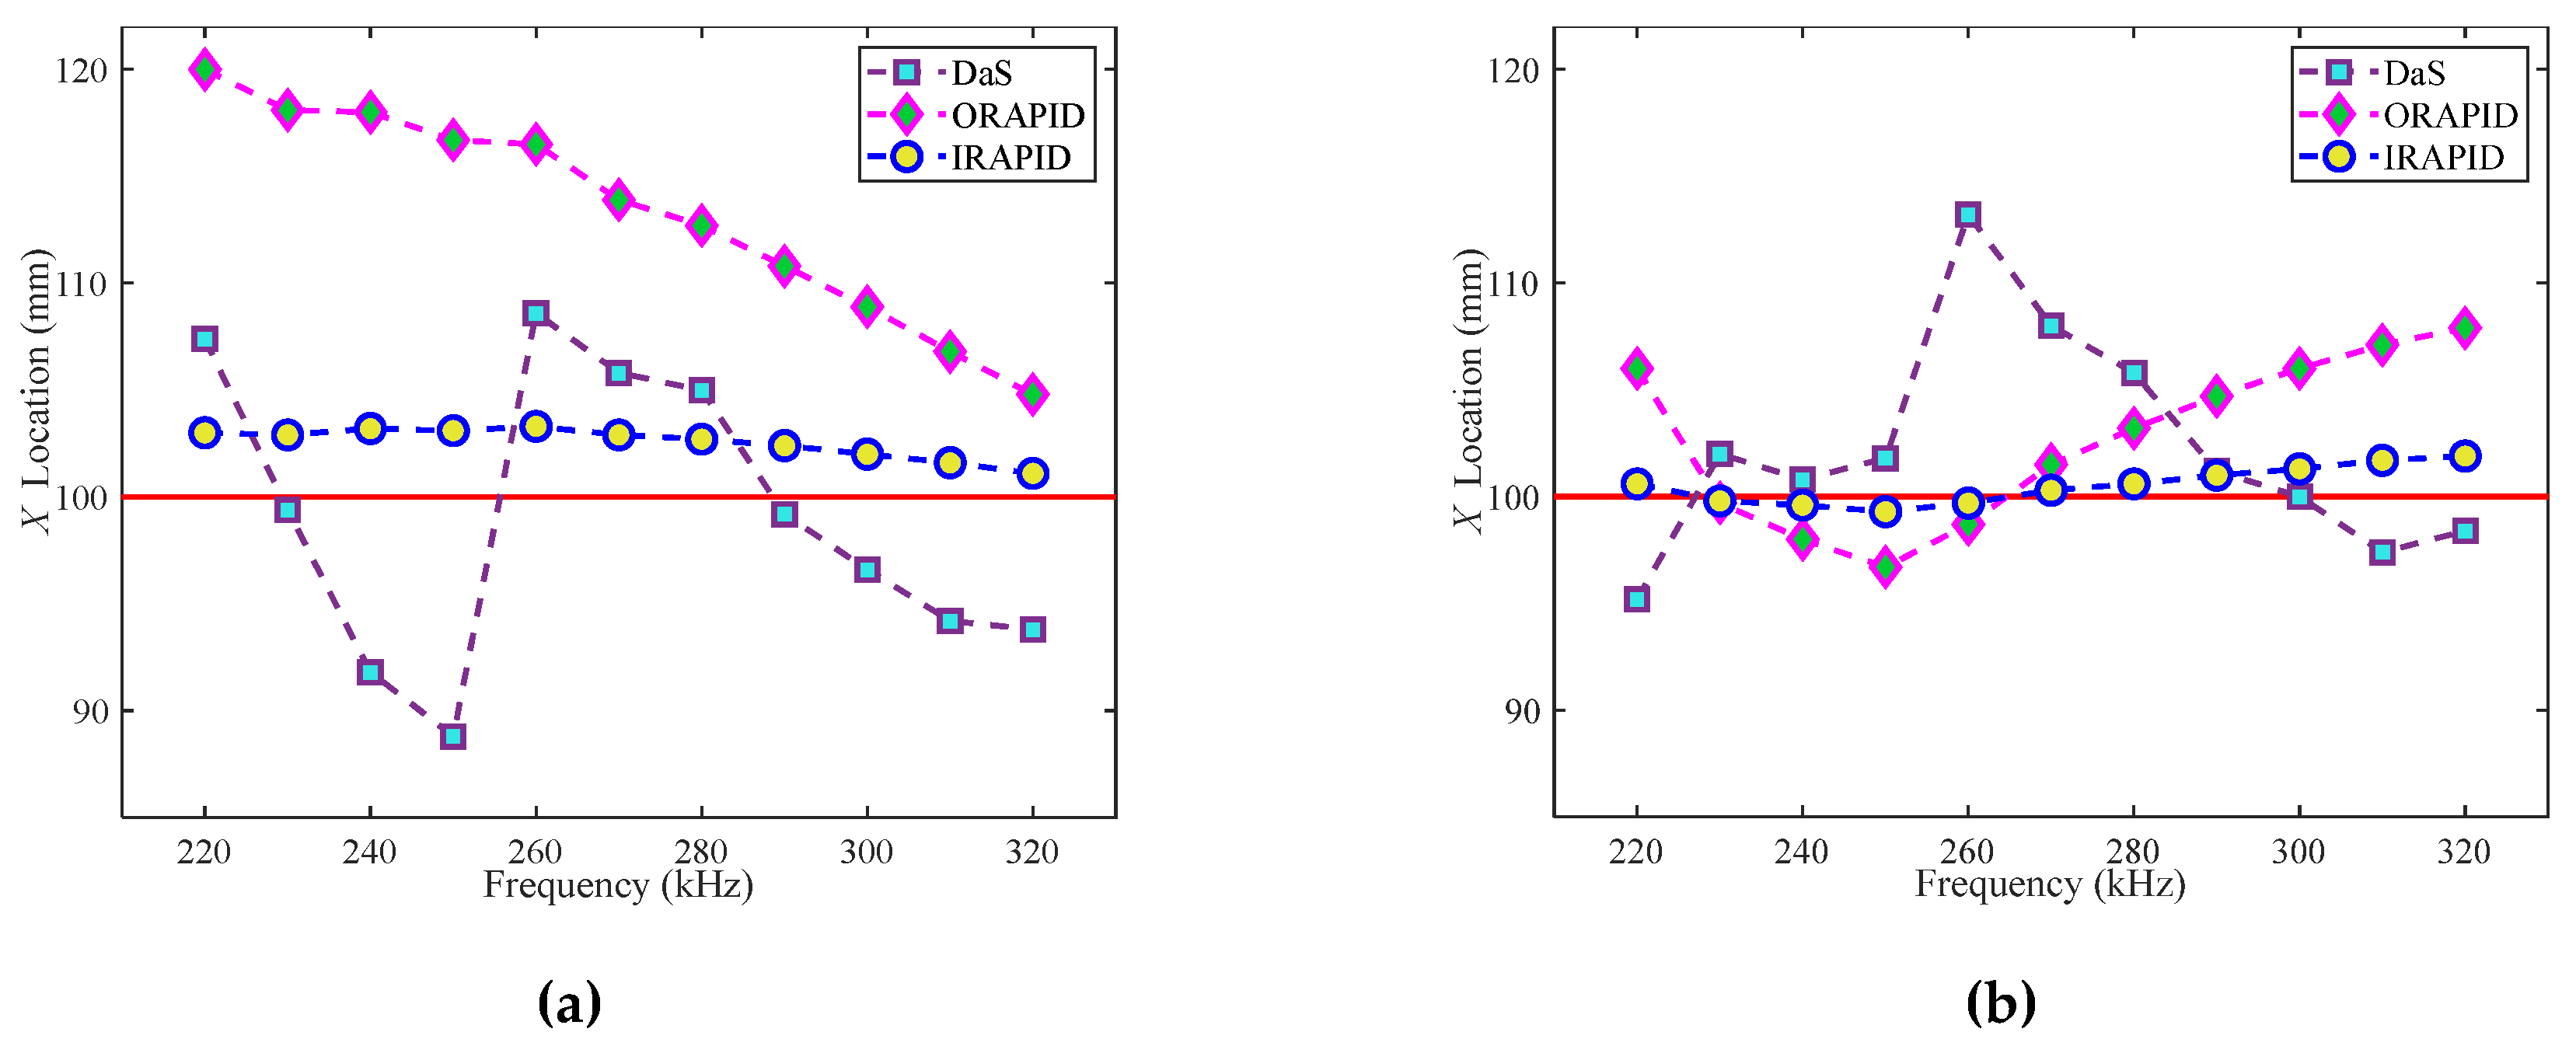
| X | Φ20(mm) | 107.4 | 99.4 | 91.8 | 88.8 | 108.6 | 105.8 | 105.0 | 99.2 | 96.6 | 94.2 | 93.8 | 98.6 |
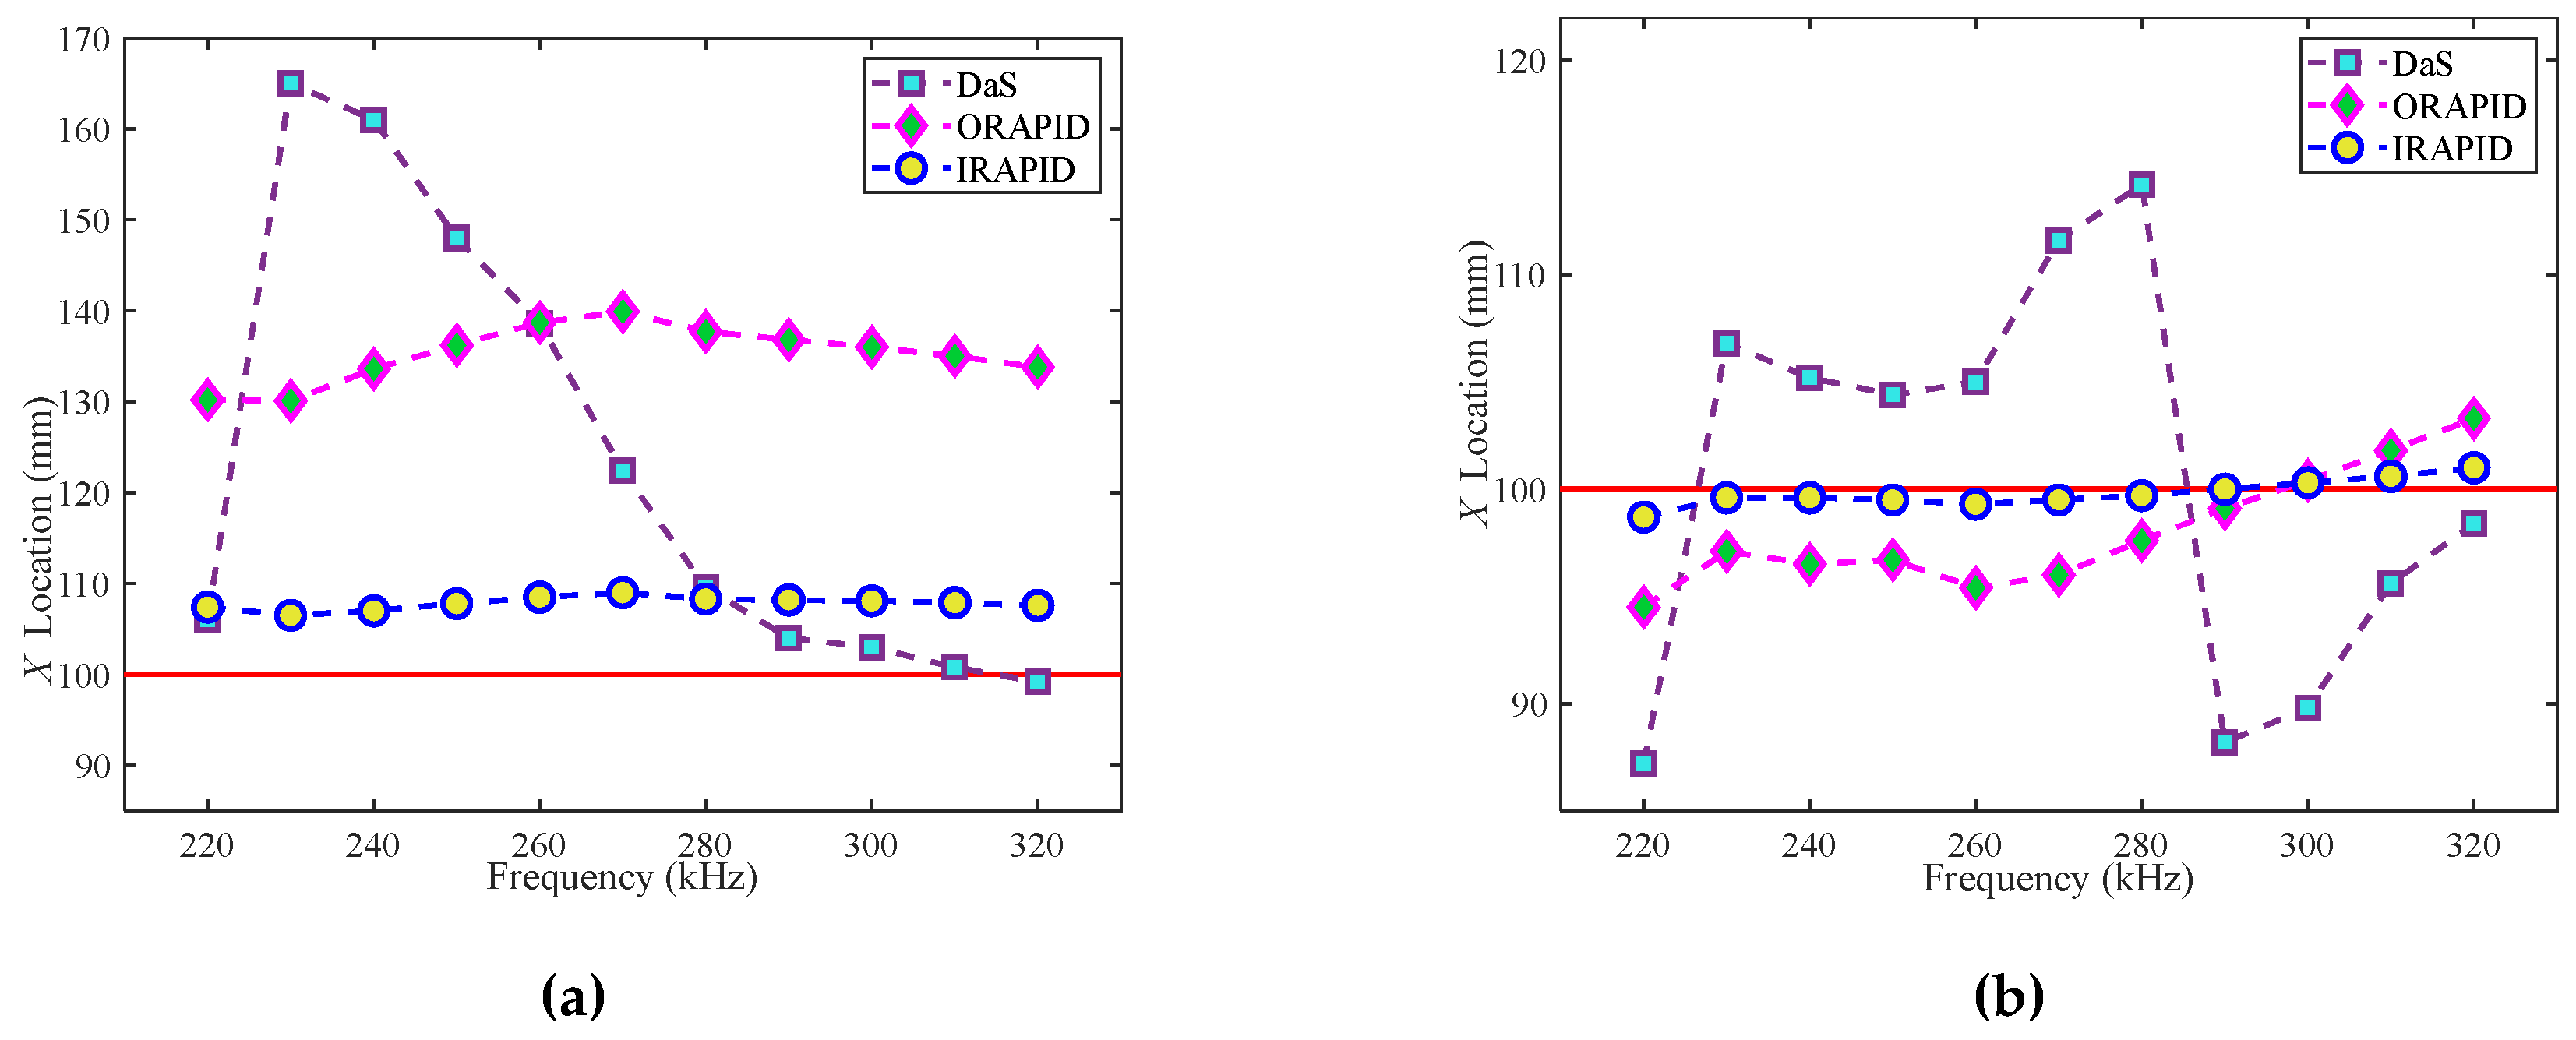
| Φ40(mm) | 106.0 | 165.0 | 161.0 | 148.0 | 138.6 | 122.4 | 109.6 | 104.0 | 103.0 | 100.8 | 99.2 | 106.6 | |
| Y | Φ20(mm) | 95.2 | 102.0 | 100.8 | 101.8 | 113.2 | 108.0 | 105.8 | 101.2 | 100.0 | 97.4 | 98.4 | 101.0 |
| Φ40(mm) | 87.2 | 106.8 | 105.2 | 104.4 | 105.0 | 111.6 | 114.2 | 88.2 | 89.8 | 95.6 | 98.4 | 98.4 | |
| f (kHz) | 220 | 230 | 240 | 250 | 260 | 270 | 280 | 290 | 300 | 310 | 320 | fm | |
| X | Φ20(mm) | 120.0 | 118.1 | 118.0 | 116.7 | 116.5 | 113.9 | 112.7 | 110.8 | 108.9 | 106.8 | 104.8 | 112.2 |
| Φ40(mm) | 130.2 | 130.1 | 133.6 | 136.2 | 138.7 | 139.9 | 137.7 | 136.8 | 136.0 | 135.0 | 133.8 | 135.3 | |
| Y | Φ20(mm) | 106.0 | 99.7 | 98.0 | 96.7 | 98.7 | 101.5 | 103.2 | 104.7 | 106.0 | 107.1 | 107.9 | 103.2 |
| Φ40(mm) | 94.5 | 97.1 | 96.5 | 96.7 | 95.4 | 96.0 | 97.6 | 99.1 | 100.4 | 101.8 | 103.3 | 98.1 | |
| f (kHz) | 220 | 230 | 240 | 250 | 260 | 270 | 280 | 290 | 300 | 310 | 320 | fm | |
| X | Φ20(mm) | 103.0 | 102.9 | 103.2 | 103.1 | 103.3 | 102.9 | 102.7 | 102.4 | 102.0 | 101.6 | 101.1 | 102.5 |
| Φ40(mm) | 107.4 | 106.5 | 107.0 | 107.8 | 108.5 | 109.0 | 108.3 | 108.2 | 108.1 | 107.9 | 107.6 | 107.9 | |
| Y | Φ20(mm) | 100.6 | 99.8 | 99.6 | 99.3 | 99.7 | 100.3 | 100.6 | 101.0 | 101.3 | 101.7 | 101.9 | 100.6 |
| Φ40(mm) | 98.7 | 99.6 | 99.6 | 99.5 | 99.3 | 99.5 | 99.7 | 100.0 | 100.3 | 100.6 | 101.0 | 99.8 | |
| f (kHz) | 220 | 230 | 240 | 250 | 260 | 270 | 280 | 290 | 300 | 310 | 320 | fm | |
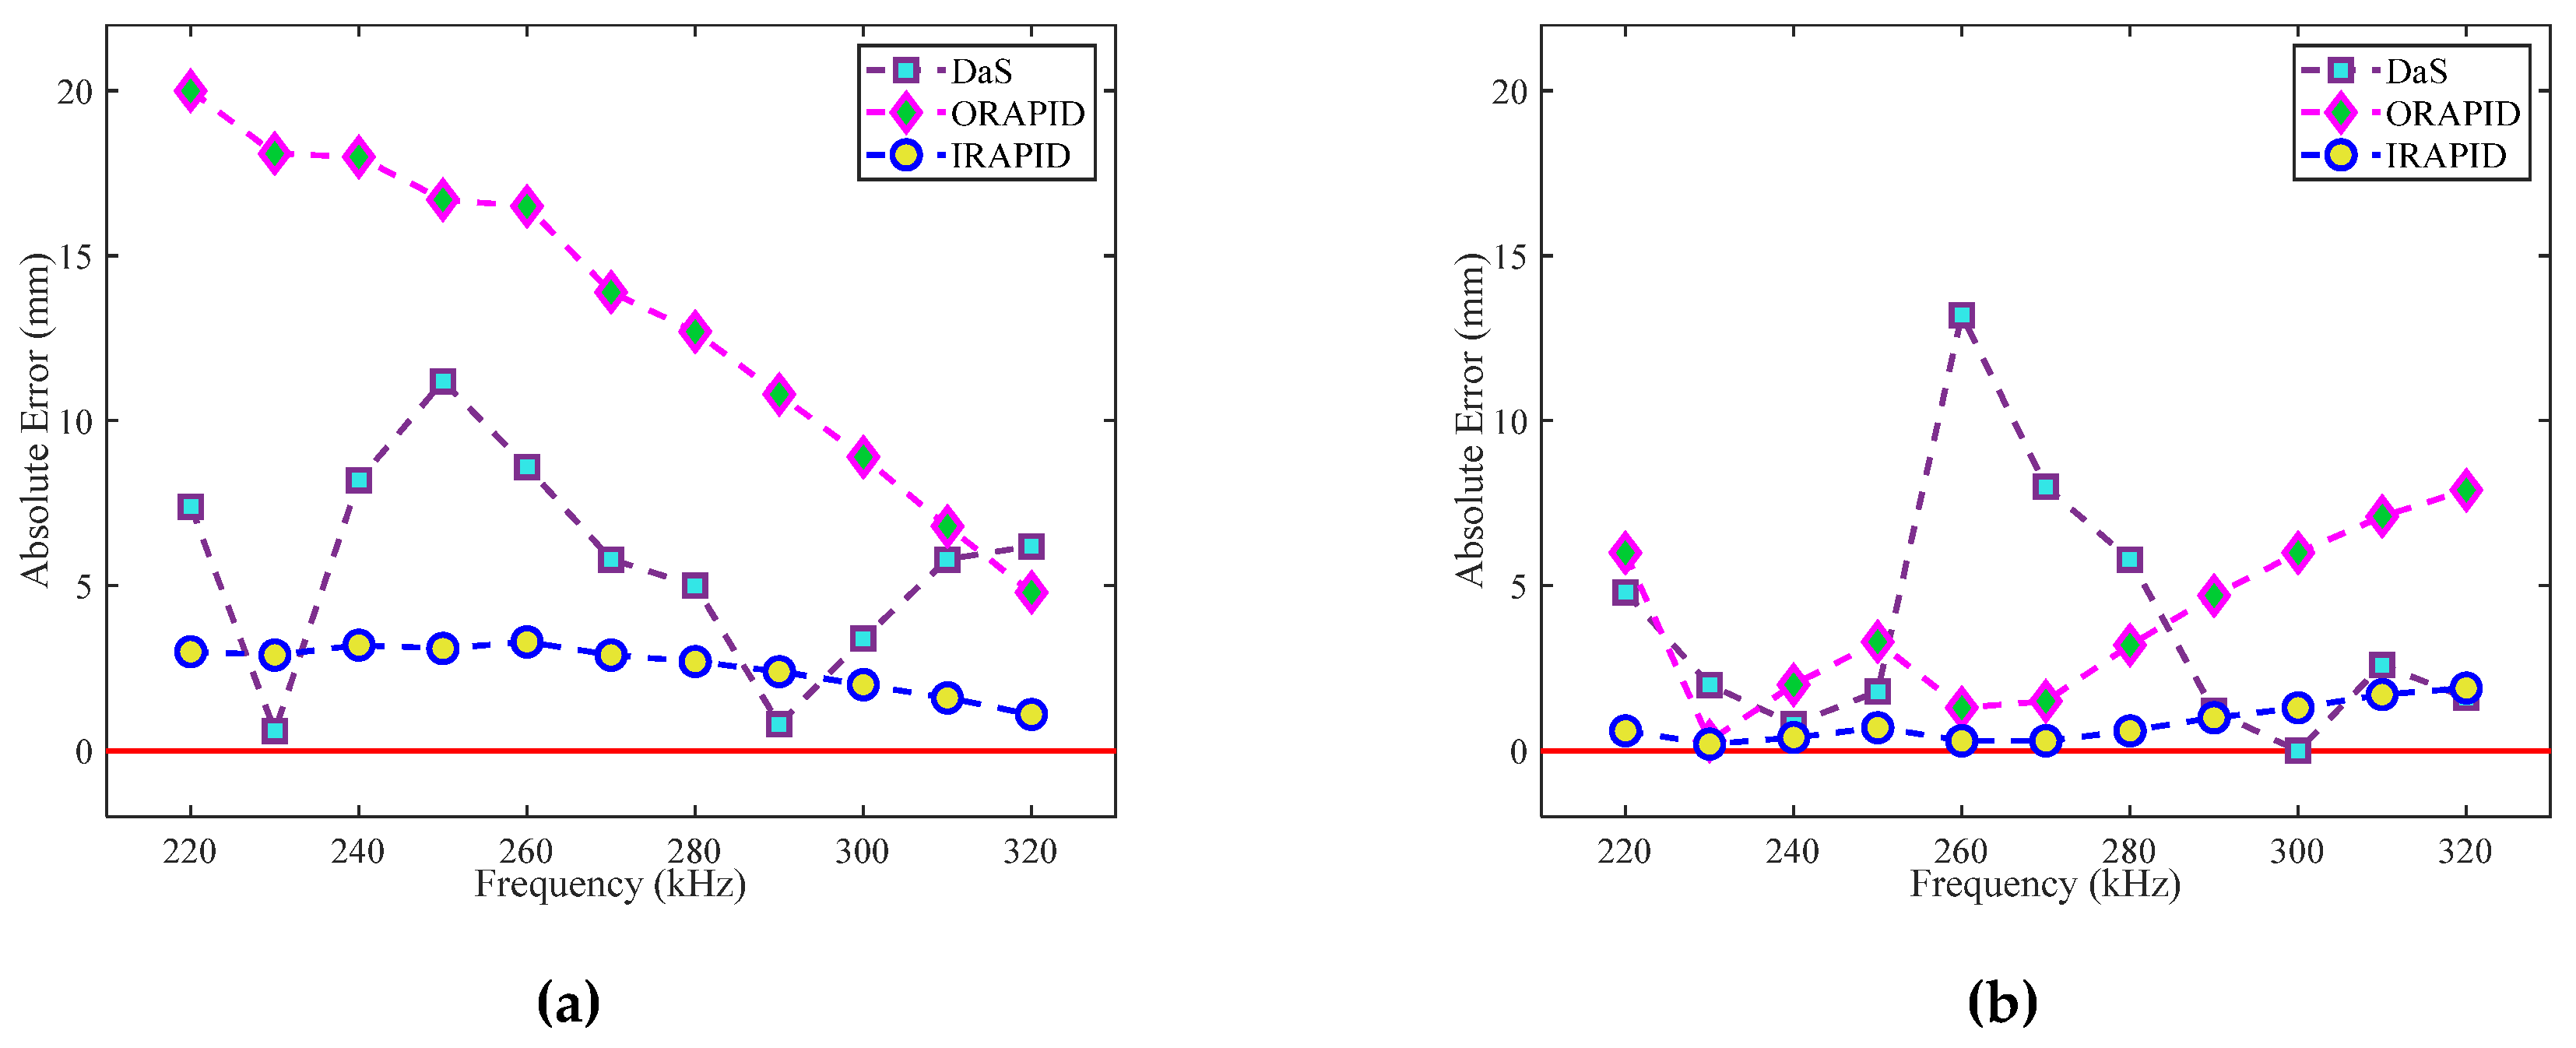
| DaS | X(mm) | 7.4 | 0.6 | 8.2 | 11.2 | 8.6 | 5.8 | 5.0 | 0.8 | 3.4 | 5.8 | 6.2 | 5.7 |
| Y(mm) | 4.8 | 2.0 | 0.8 | 1.8 | 13.2 | 8.0 | 5.8 | 1.2 | 0 | 2.6 | 1.6 | 3.8 | |
| ORAPID | X(mm) | 20.0 | 18.1 | 18.0 | 16.7 | 16.5 | 13.9 | 12.7 | 10.8 | 8.9 | 6.8 | 4.8 | 13.4 |
| Y(mm) | 6.0 | 0.3 | 2.0 | 3.3 | 1.3 | 1.5 | 3.2 | 4.7 | 6.0 | 7.1 | 7.9 | 3.9 | |
| IRAPID | X(mm) | 3.0 | 2.9 | 3.2 | 3.1 | 3.3 | 2.9 | 2.7 | 2.4 | 2.0 | 1.6 | 1.1 | 2.6 |
| Y(mm) | 0.6 | 0.2 | 0.4 | 0.7 | 0.3 | 0.3 | 0.6 | 1.0 | 1.3 | 1.7 | 1.9 | 0.8 | |
| f (kHz) | 220 | 230 | 240 | 250 | 260 | 270 | 280 | 290 | 300 | 310 | 320 | fm | |
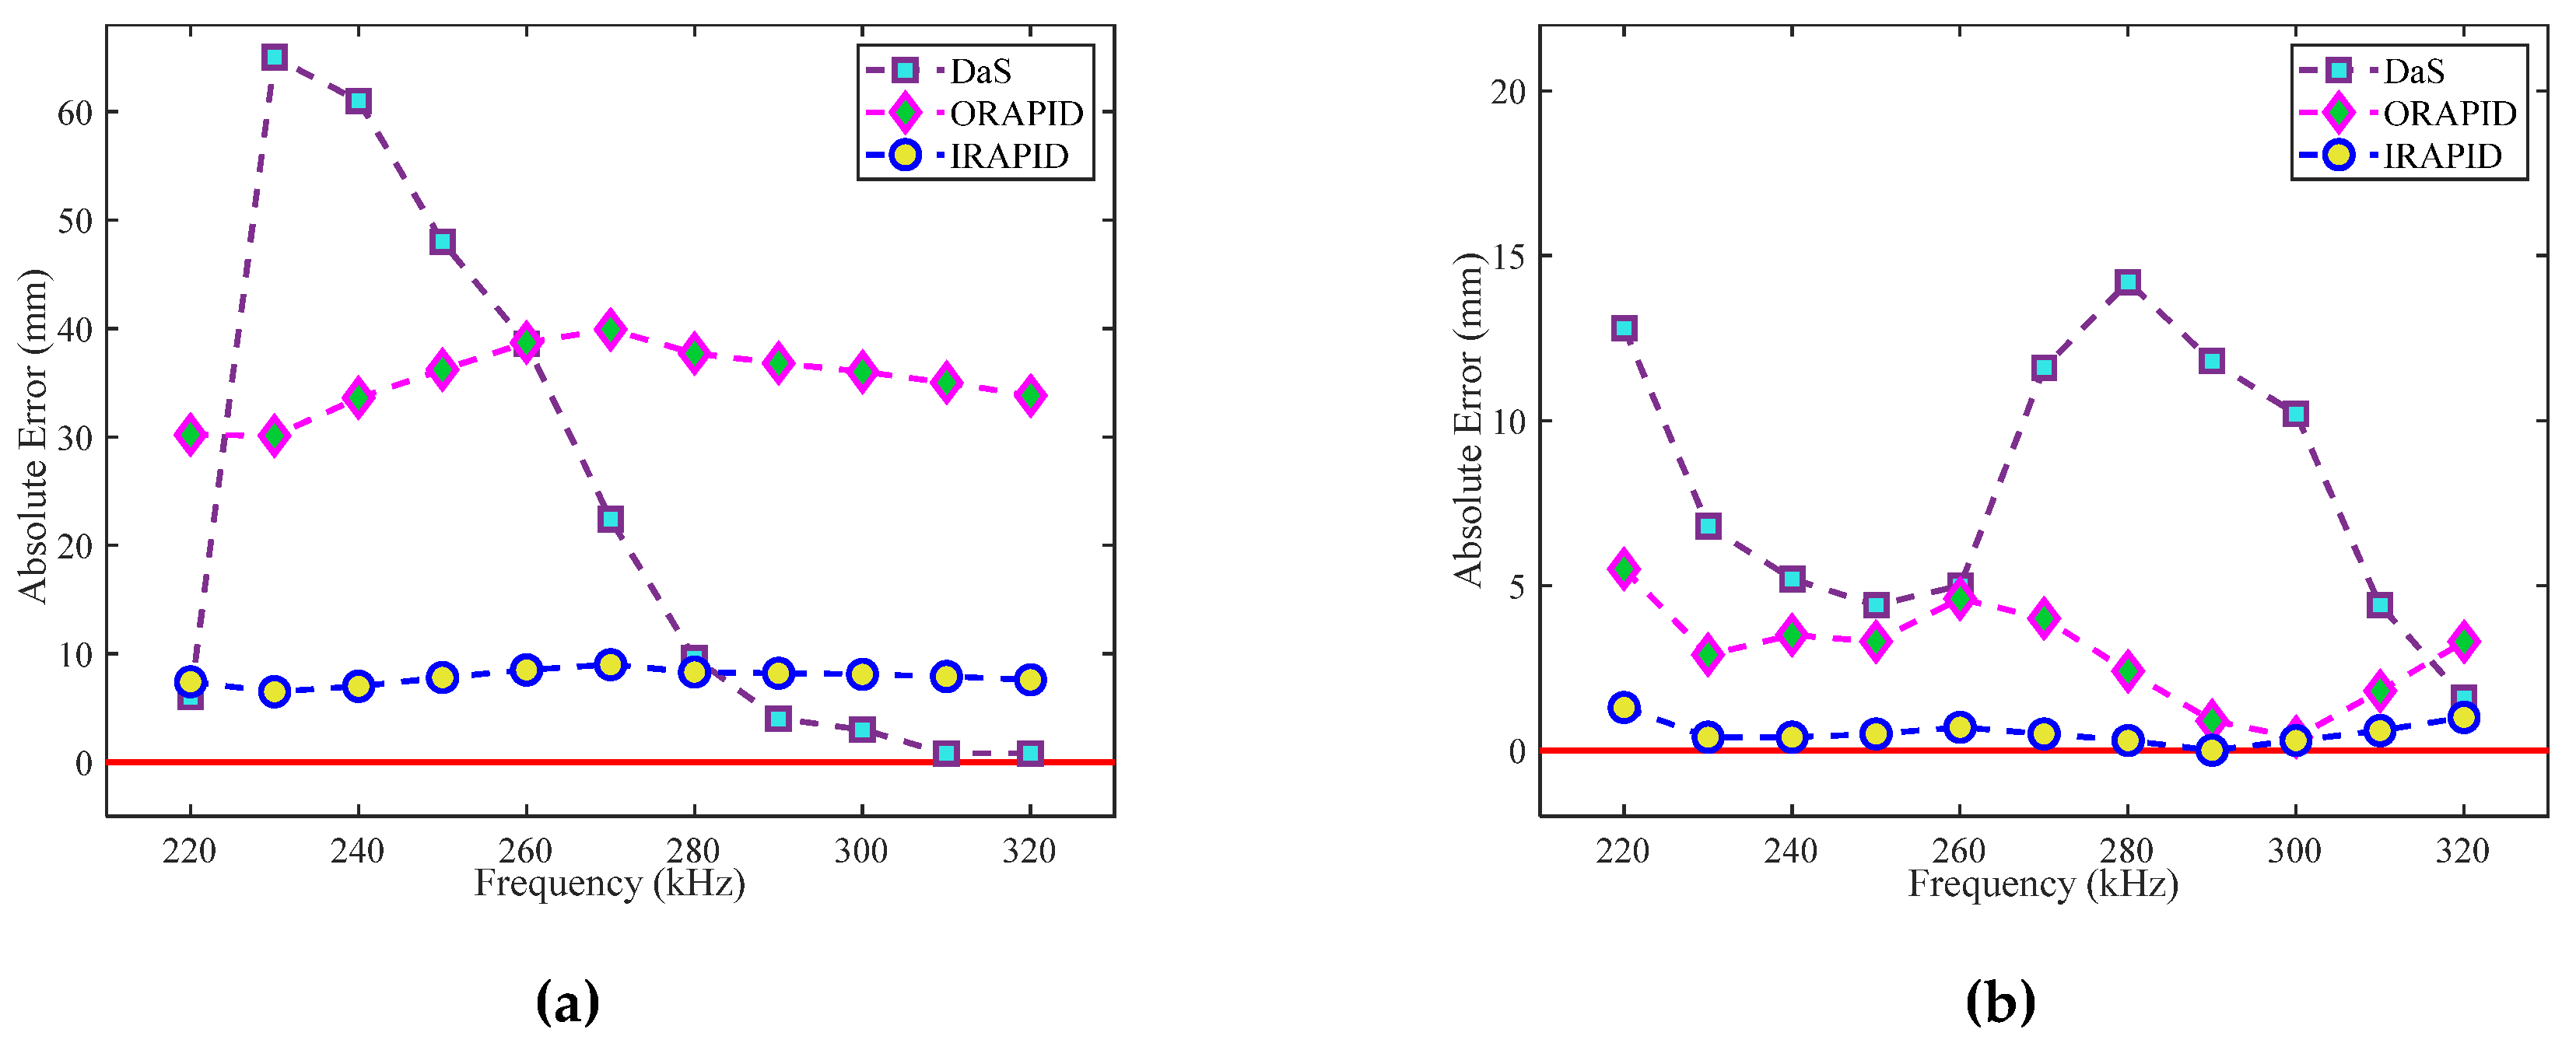
| DaS | X(mm) | 6.0 | 65.0 | 61.0 | 48.0 | 38.6 | 22.4 | 9.6 | 4.0 | 3.0 | 0.8 | 0.8 | 23.6 |
| Y(mm) | 12.8 | 6.8 | 5.2 | 4.4 | 5.0 | 11.6 | 14.2 | 11.8 | 10.2 | 4.4 | 1.6 | 8.0 | |
| ORAPID | X(mm) | 30.2 | 30.1 | 33.6 | 36.2 | 38.7 | 39.9 | 37.7 | 36.8 | 36.0 | 35.0 | 33.8 | 35.3 |
| Y(mm) | 5.5 | 2.9 | 3.5 | 3.3 | 4.6 | 4.0 | 2.4 | 0.9 | 0.4 | 1.8 | 3.3 | 3.0 | |
| IRAPID | X(mm) | 7.4 | 6.5 | 7.0 | 7.8 | 8.5 | 9.0 | 8.3 | 8.2 | 8.1 | 7.9 | 7.6 | 7.8 |
| Y(mm) | 1.3 | 0.4 | 0.4 | 0.5 | 0.7 | 0.5 | 0.3 | 0 | 0.3 | 0.6 | 1.0 | 0.5 | |
Disclaimer/Publisher’s Note: The statements, opinions and data contained in all publications are solely those of the individual author(s) and contributor(s) and not of MDPI and/or the editor(s). MDPI and/or the editor(s) disclaim responsibility for any injury to people or property resulting from any ideas, methods, instructions or products referred to in the content. |
© 2024 by the authors. Licensee MDPI, Basel, Switzerland. This article is an open access article distributed under the terms and conditions of the Creative Commons Attribution (CC BY) license (http://creativecommons.org/licenses/by/4.0/).


