1. Introduction
Isoquinoline alkaloids are plant natural products and are considered an active prin-ciple in numerous important medicinal herbs mainly from the families Papaveraceae and Berberidaceae. The study of the interaction of alkaloids with plasma proteins, in particular with albumin, is an important topic, often discussed in the literature [
1,
2,
3,
4,
5,
6,
7,
8]. The interest in the subject is understandable because the mechanism and strength of interaction of molecules with potential pharmaceutical use with proteins present in the human body has a significant impact on the biodistribution of these substances. It is well known that a drug administered to a patient, after absorption, binds to plasma proteins or remains in the bloodstream unbound. The unbound fraction of the drug is the active fraction, while the part of the active substance bound in a complex with a protein, e.g. albumin or orosomucoid, is a kind of storage from which subsequent doses can be released. Thus, the method of binding to plasma proteins and the stability of the resulting complex has a significant impact on the action of the drug and its side effects. As mentioned above, a large group of alkaloids has already been studied in this aspect. However, there have been no reports presented in the literature so far, describing the interaction of protopine (PP) and allocryptopine (ACP) with plasma proteins. Therefore, these two isoquinoline alkaloids are being of our concern as this study would fill in the existing gap in this matter.
Plasma proteins are a large group of macromolecules that play various functions in the human body. More than 280 different blood proteins have been identified so far [
9]. For the analysis with chosen alkaloids, we selected two plasma proteins: albumin (HSA) and orosomucoid (α-1-acid glycoprotein, AAG), both of human origin. Both proteins are drug transporters [
10]. HSA is the molecule found in the plasma in the highest concentration. AGG, on the other hand, is also an acute phase protein, the concentration of which increases several times in pathological conditions [
10,
11]. Therefore, the analysis of the interaction with both these proteins plays a significant role in the study of the pharmacokinetics and pharmacodynamics of drug candidates among the huge number of structurally diverse natural products.
Proteins, under the influence of interaction and binding into a complex with small molecules, can change their structure. Spectroscopic methods are ideal for studying these types of changes. Therefore, due to the presence of fluorescent amino acids in the protein molecule and the chiral carbon atoms in the protein chain, fluorescence, and circular dichroism spectroscopy methods provide important data. UV-Vis spectroscopy is also a useful technique in this case [
12,
13,
14].
In our research, we used all three of these analytical methods. In addition, the spectroscopic studies were supported by computational methods, i.e., molecular docking and molecular dynamics simulation.
2. Results
2.1. Determination of Binding Constants
Previous studies have shown that protopine and allocryptopine exhibit fluorescence at an excitation wavelength of 285 nm, which is also commonly used to excite protein fluorescence [
15]. Due to the overlapping effect in fluorescence characteristics, it has been challenging to determine the nature of the interactions between PP and ACP and plasma proteins using fluorescence spectroscopy alone. This might explain a deficit of literature describing these interactions. Hence, we decided to use UV-Vis spectroscopy to examine these interactions. The blood plasma proteins are multifunction macromolecules which share structural similarities, resulting from the fact that they are composed mainly of L-amino acids. Consequently, characteristic, typical peaks for these molecules, in the UV absorption spectra exist. Proteins exhibit bands at 180-230 nm, and 260-280 nm wavelength range, due to π-π* energy transfer which is exhibited by peptide bonds or aromatic side chains of amino acids, respectively [
16,
17]. The titration of protein solution (HSA and AAG) by studied alkaloids (ACP and PP) changed both the absorbance and the position of the maximum peak. This methodological pivot allowed us to explore and elucidate these interactions more effectively.
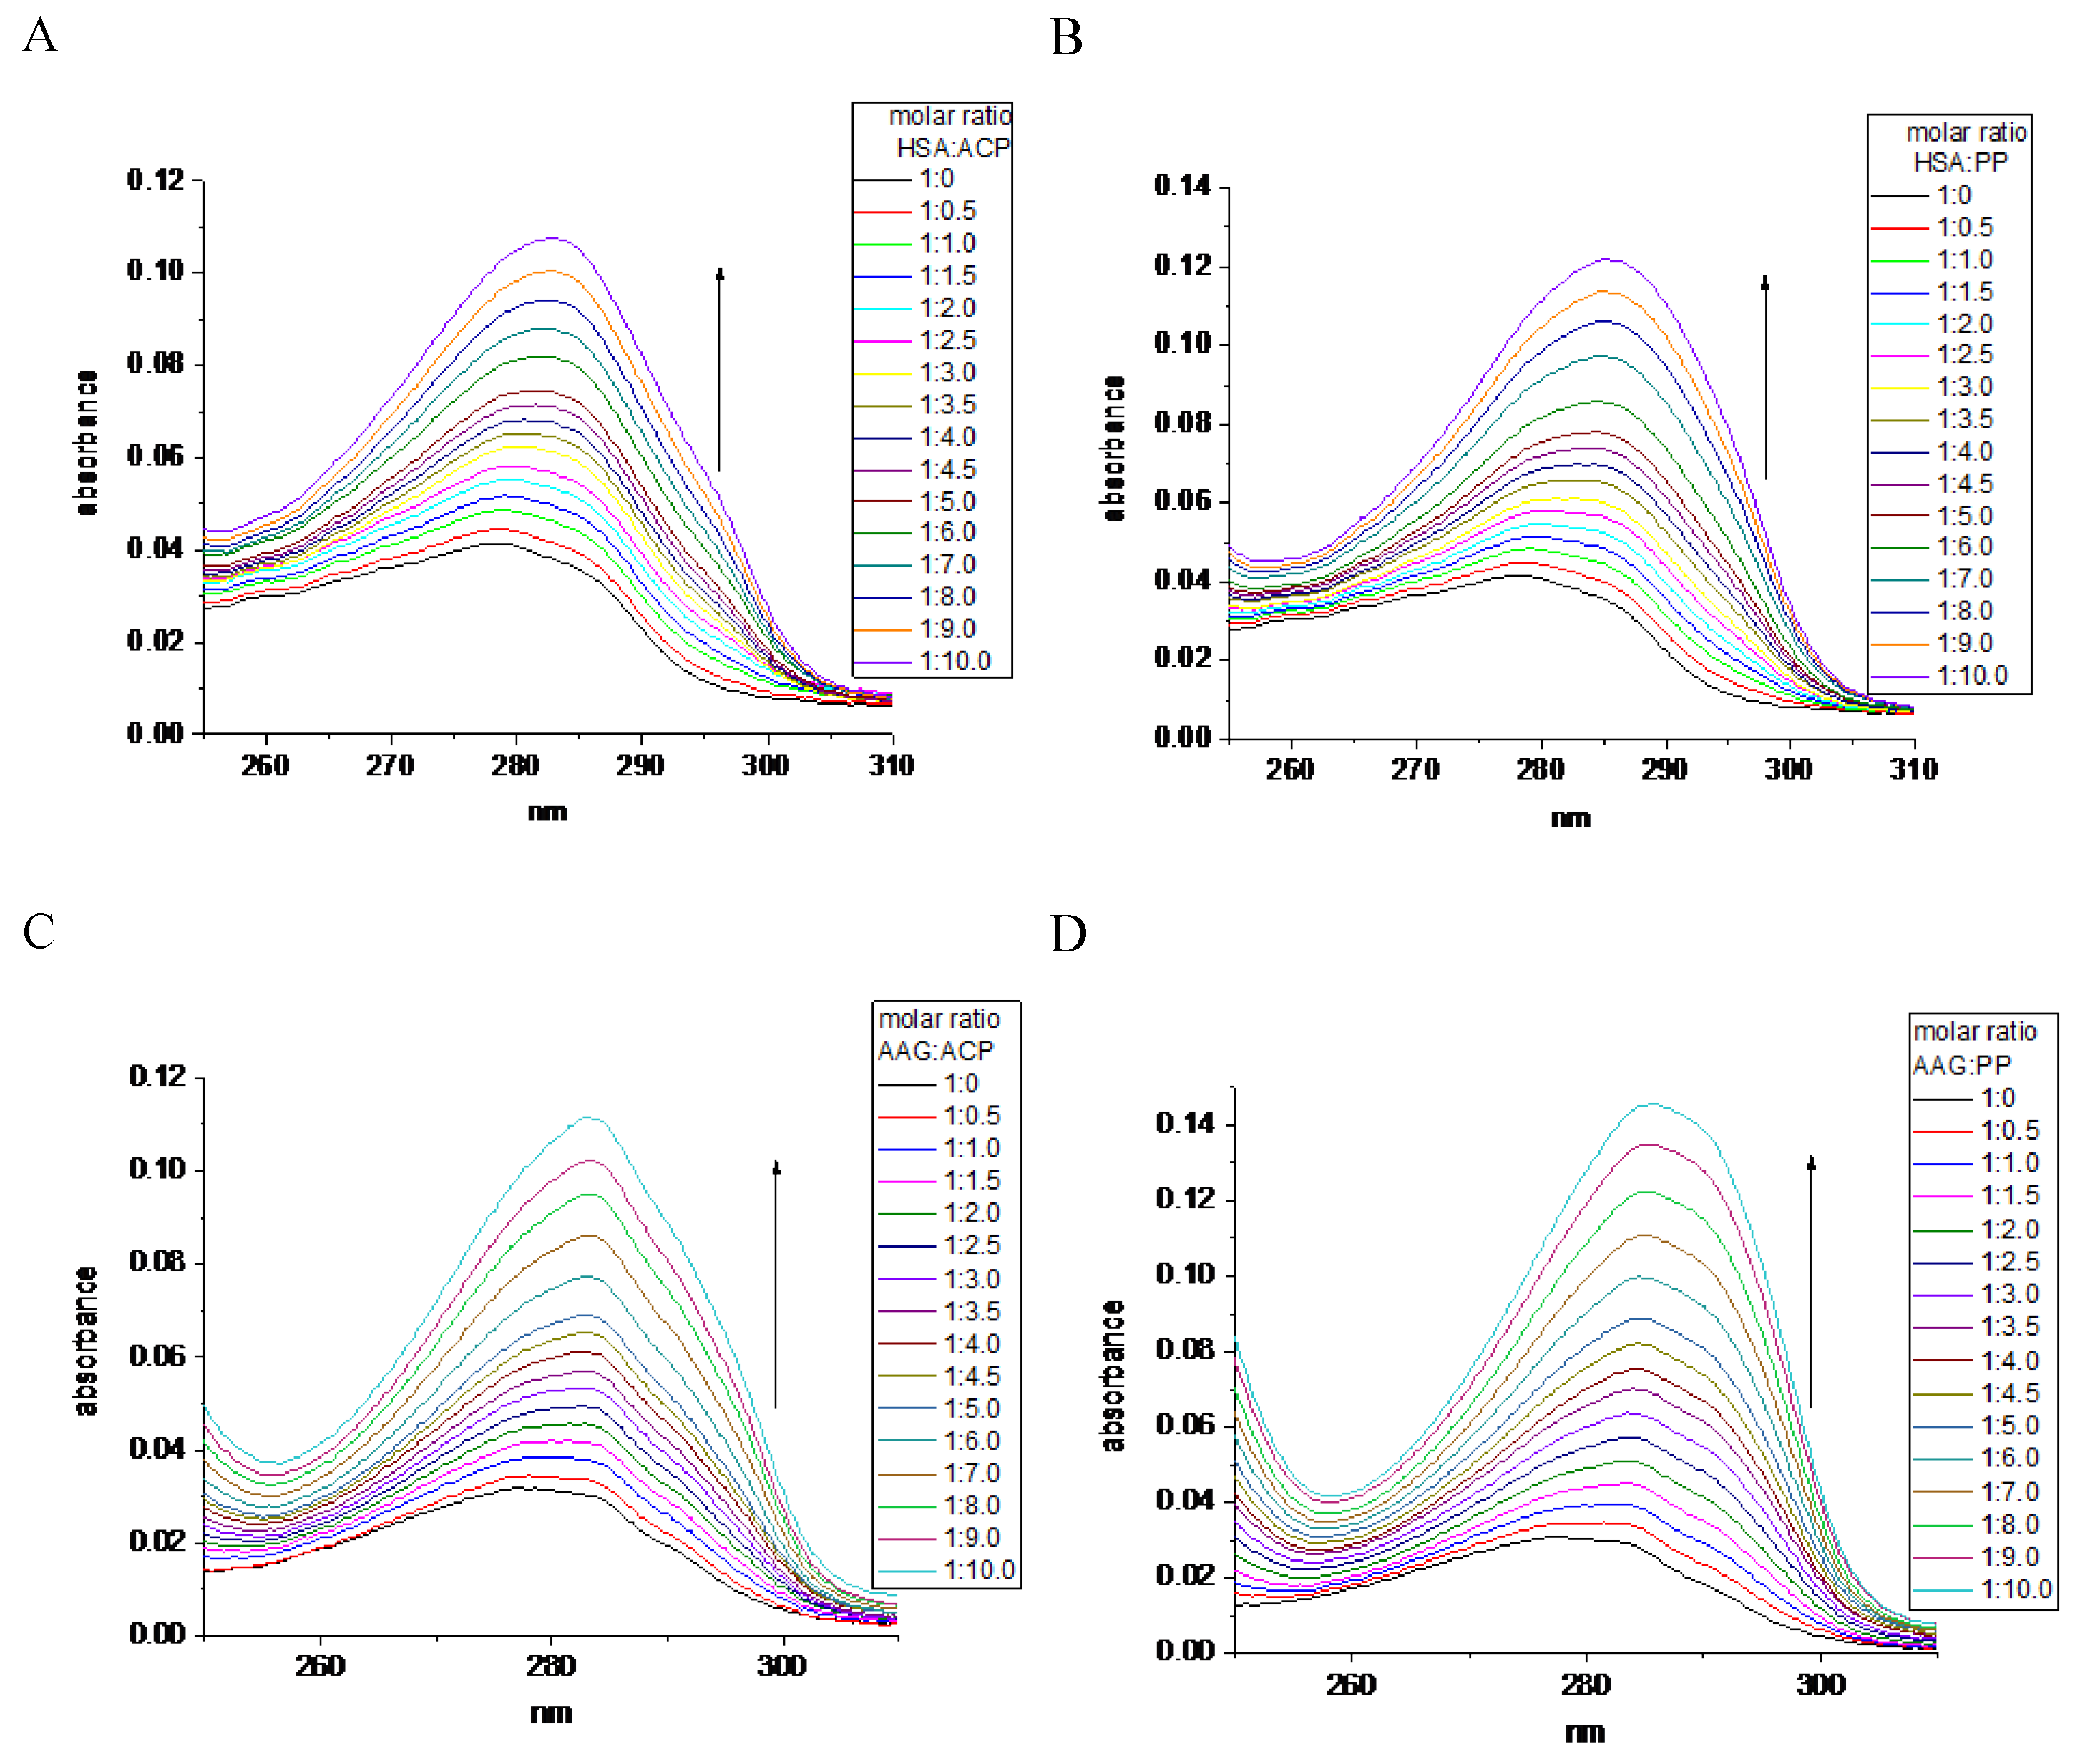
Generally, the addition of the investigated alkaloids to the protein solution affected an increase in absorbance (
Figure 1). These results demonstrated the hyperchromic effect. The value of the percentage of chromaticity is a little bit larger for PP (71.50%) than for ACP (65.52%) in interaction with HSA. A similar trend was shown for the interaction of these alkaloids with AAG, where PP caused 81.93% hyperchromicity while ACP showed 73.50% (
Table 1). Also, the 2-3 nm of red shift occurred after alkaloids addition. These results confirm peptide/alkaloid complex formation, for which the equilibrium reaction can be expressed as follows (E0):
The equilibrium of apparent association constants (K
app) presents the following equation (E1):
The apparent association constants (K
app) describing the interaction between components can be determined by Benesi - Hildebrand procedure via monitoring the changes in UV absorption spectra [
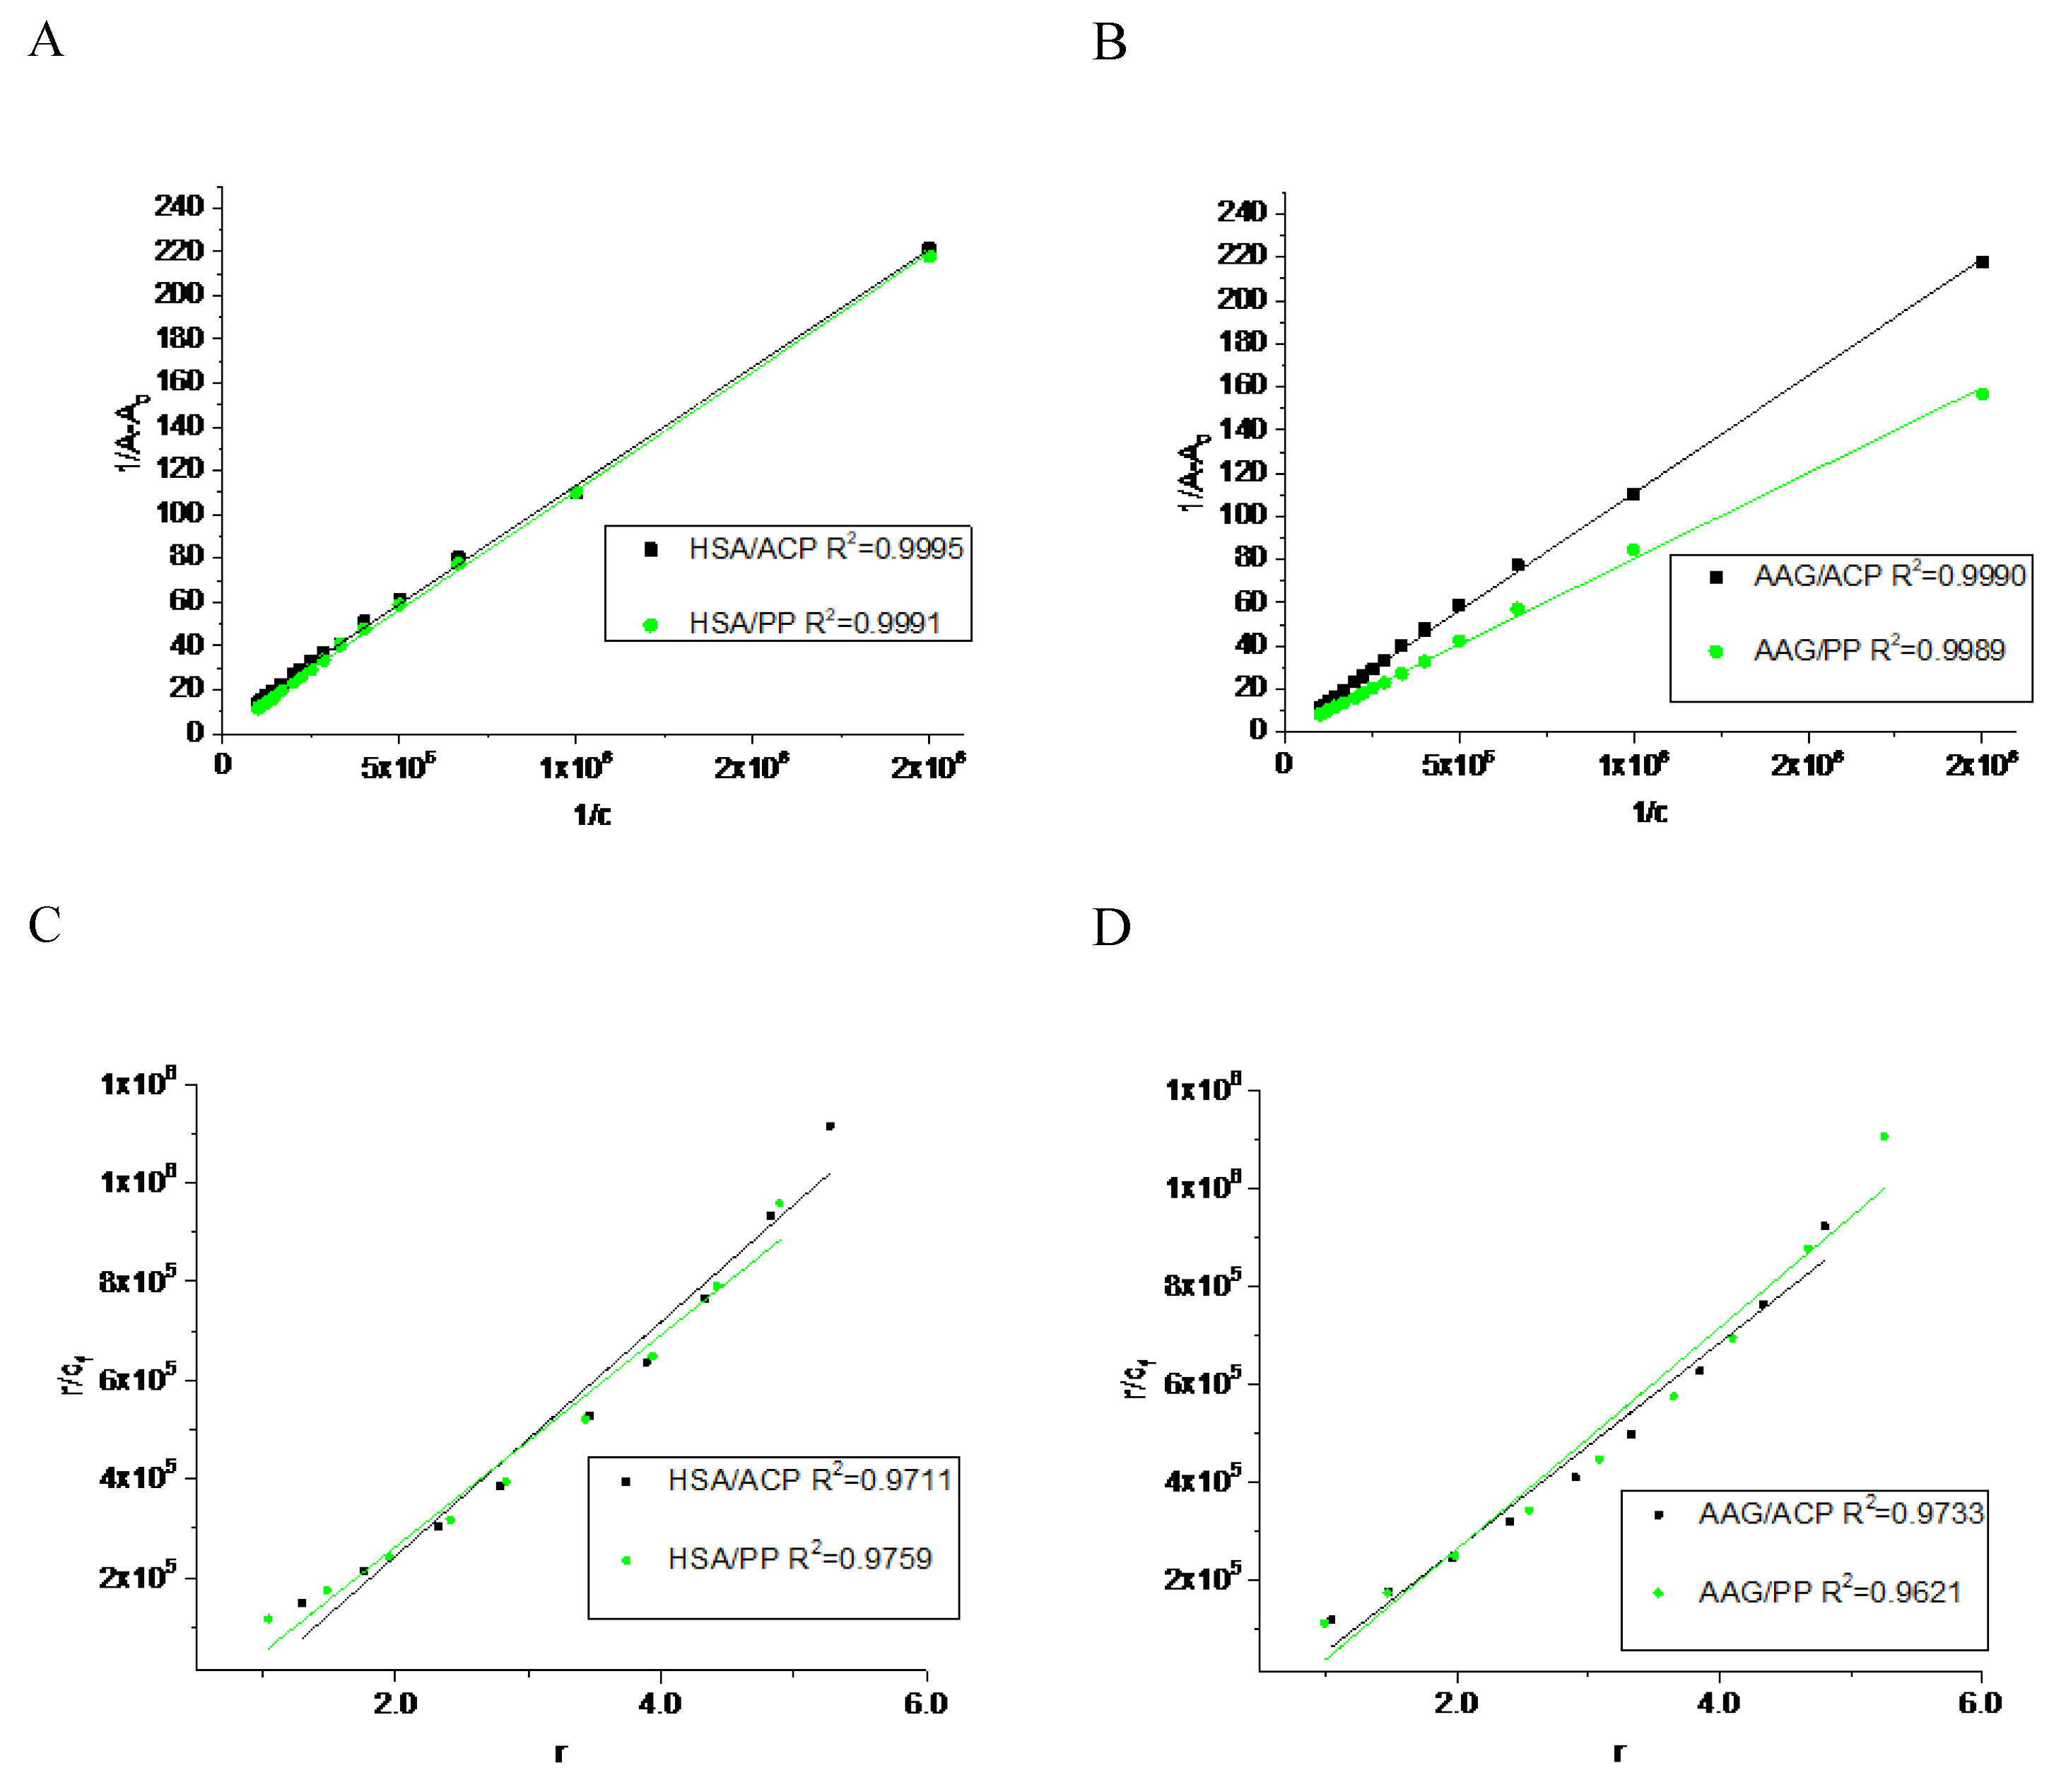
18]. The linear plot of double-reciprocal function (
Figure 2A,B) suggests that both studied alkaloids are binding by HSA and AAG with similar impact. The complex formation processes are spontaneous due to the negative value of standard Gibbs free energy (ΔG) of these equilibrium reactions (
Table 1). The comparison of the apparent association constants (K
app) values suggests that the alkaloids exhibit more stable complexes with HSA than with AAG (
Table 1). Furthermore, ACP shows a stronger affinity for both proteins than PP and a higher affinity to HSA than to AAG. It can be concluded that the ACP is bound with HSA with the highest affinity. Additionally, the stoichiometry analysis of the complexes’ stoichiometry was performed. The Scatcher plots for all studied systems are linear functions, and suggest the formation of equimolar complexes (
Figure 2C,D). The calculated number of binding sites (n) in proteins is shown in
Table 1, and all the values approach to one.
2.2. Analysis of Binding Sites and Interactions Mode
The results obtained from spectroscopic measurements indicate the interaction of ACP and PP with HSA and AAG, and the complex formation in all analyzed systems. Molecular docking studies and molecular dynamic simulation were used to characterize the mode of interactions and predict the binding site. First, a molecular docking procedure to two Sudlow’s drug binding sites of human albumin, site 1 (IIA) and site 2 (IIIA) [
19,
20], was performed. The binding affinity for the best conformers is shown in
Table 2. All values are negative, which indicates the possibility of the formation of stable complexes. For allocryptopine, it was −6.3 kcal/mol for site IIA and −7.7 kcal/mol for site IIIA. For protopine: −6.5 kcal/mol and −7.7 kcal/mol, respectively. These results suggest that site IIIA is some more preferable. In the second step, the stability of the complexes and the binding free enthalpy were calculated using the molecular dynamic method. The conformer with the most negative binding affinity, obtained from the docking study was simulated for a 100 ns period. As shown in
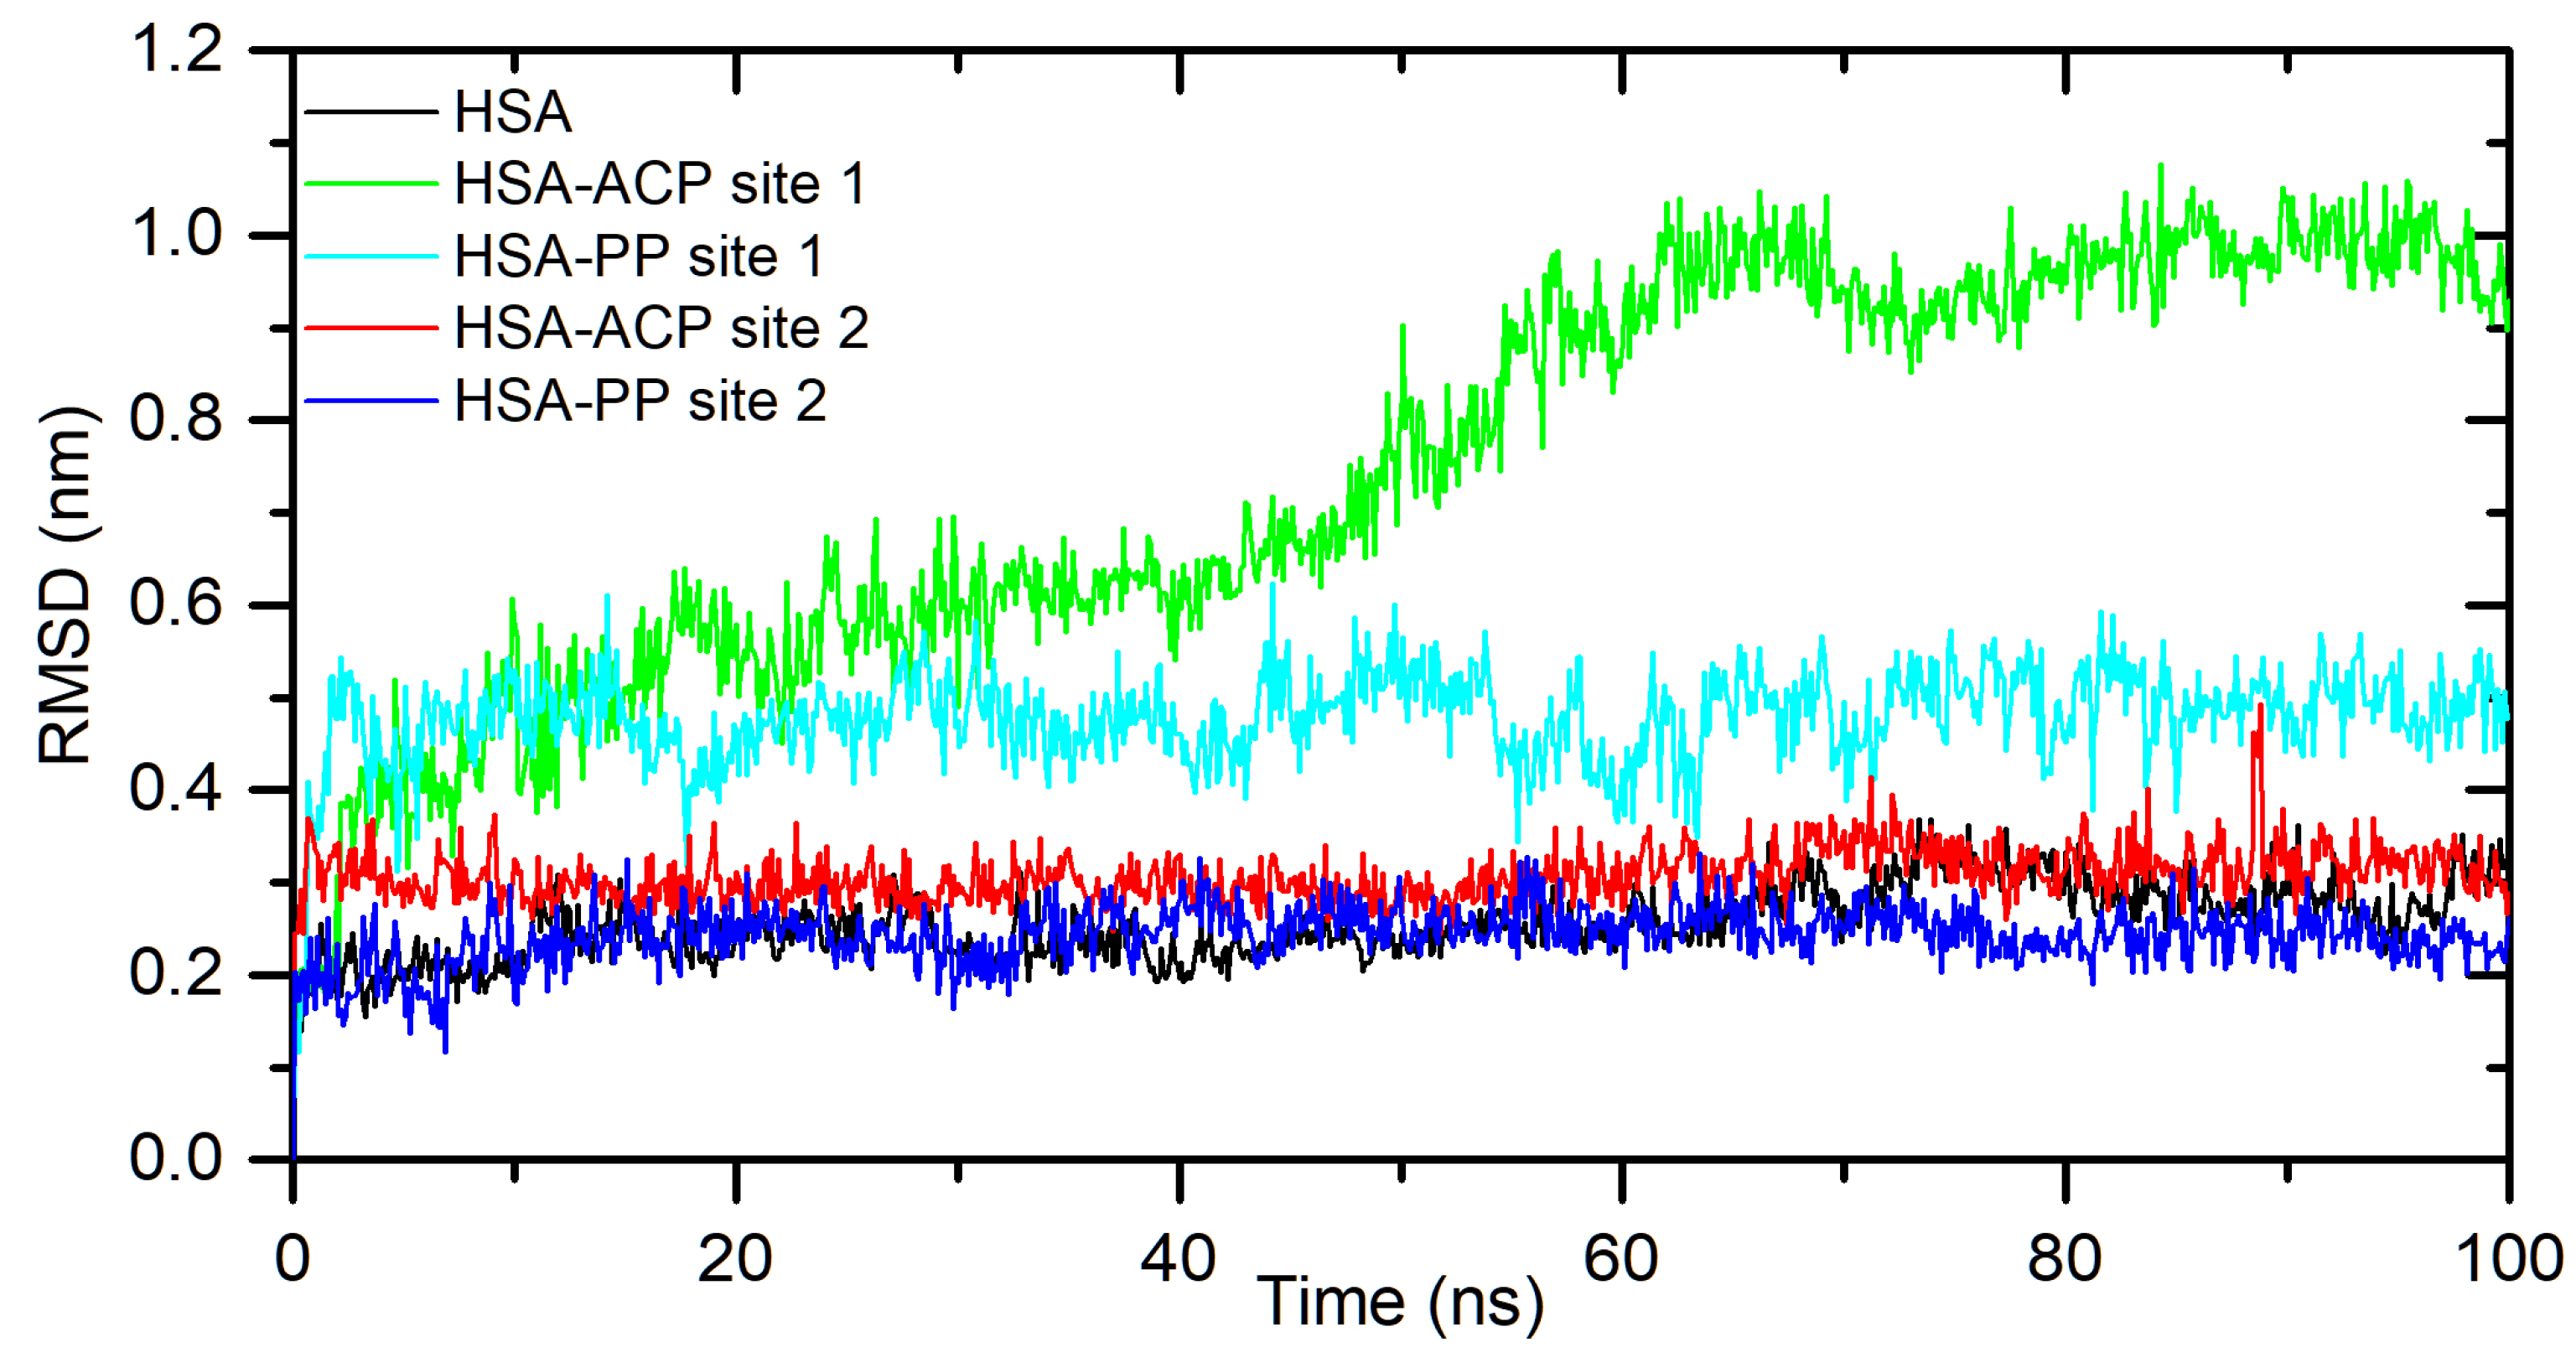
Figure 3, for the HSA-ACP system, where allocryptopine is docked at site 1, the complex stabilizes after 60 ns. After stabilization, the averaged root mean square deviation (RMSD), structural drift from the initial position, was calculated as 0.97±0.04 nm. For the HSA-ACP complex, where the allocryptopine is docked at site 2, the structural fluctuations are smaller. After about 2 ns, the complex is stable. The averaged RMSD value from 2 to 100 ns was calculated as 0.31±0.03 nm. Also, for the HSA-PP system, smaller fluctuations were observed for the protopine docked at site 2. After about 10 ns complex is stable and averaged RMSD (10-100 ns) is 0.25±0.02 nm. For the ligand docked at site 1, the complex stabilizes after about 55 ns and the average RMSD is 0.49±0.04 nm. The compactness of the HSA is characterized by the radius of gyration (Rg). The plot of Rg values against simulation time is presented in
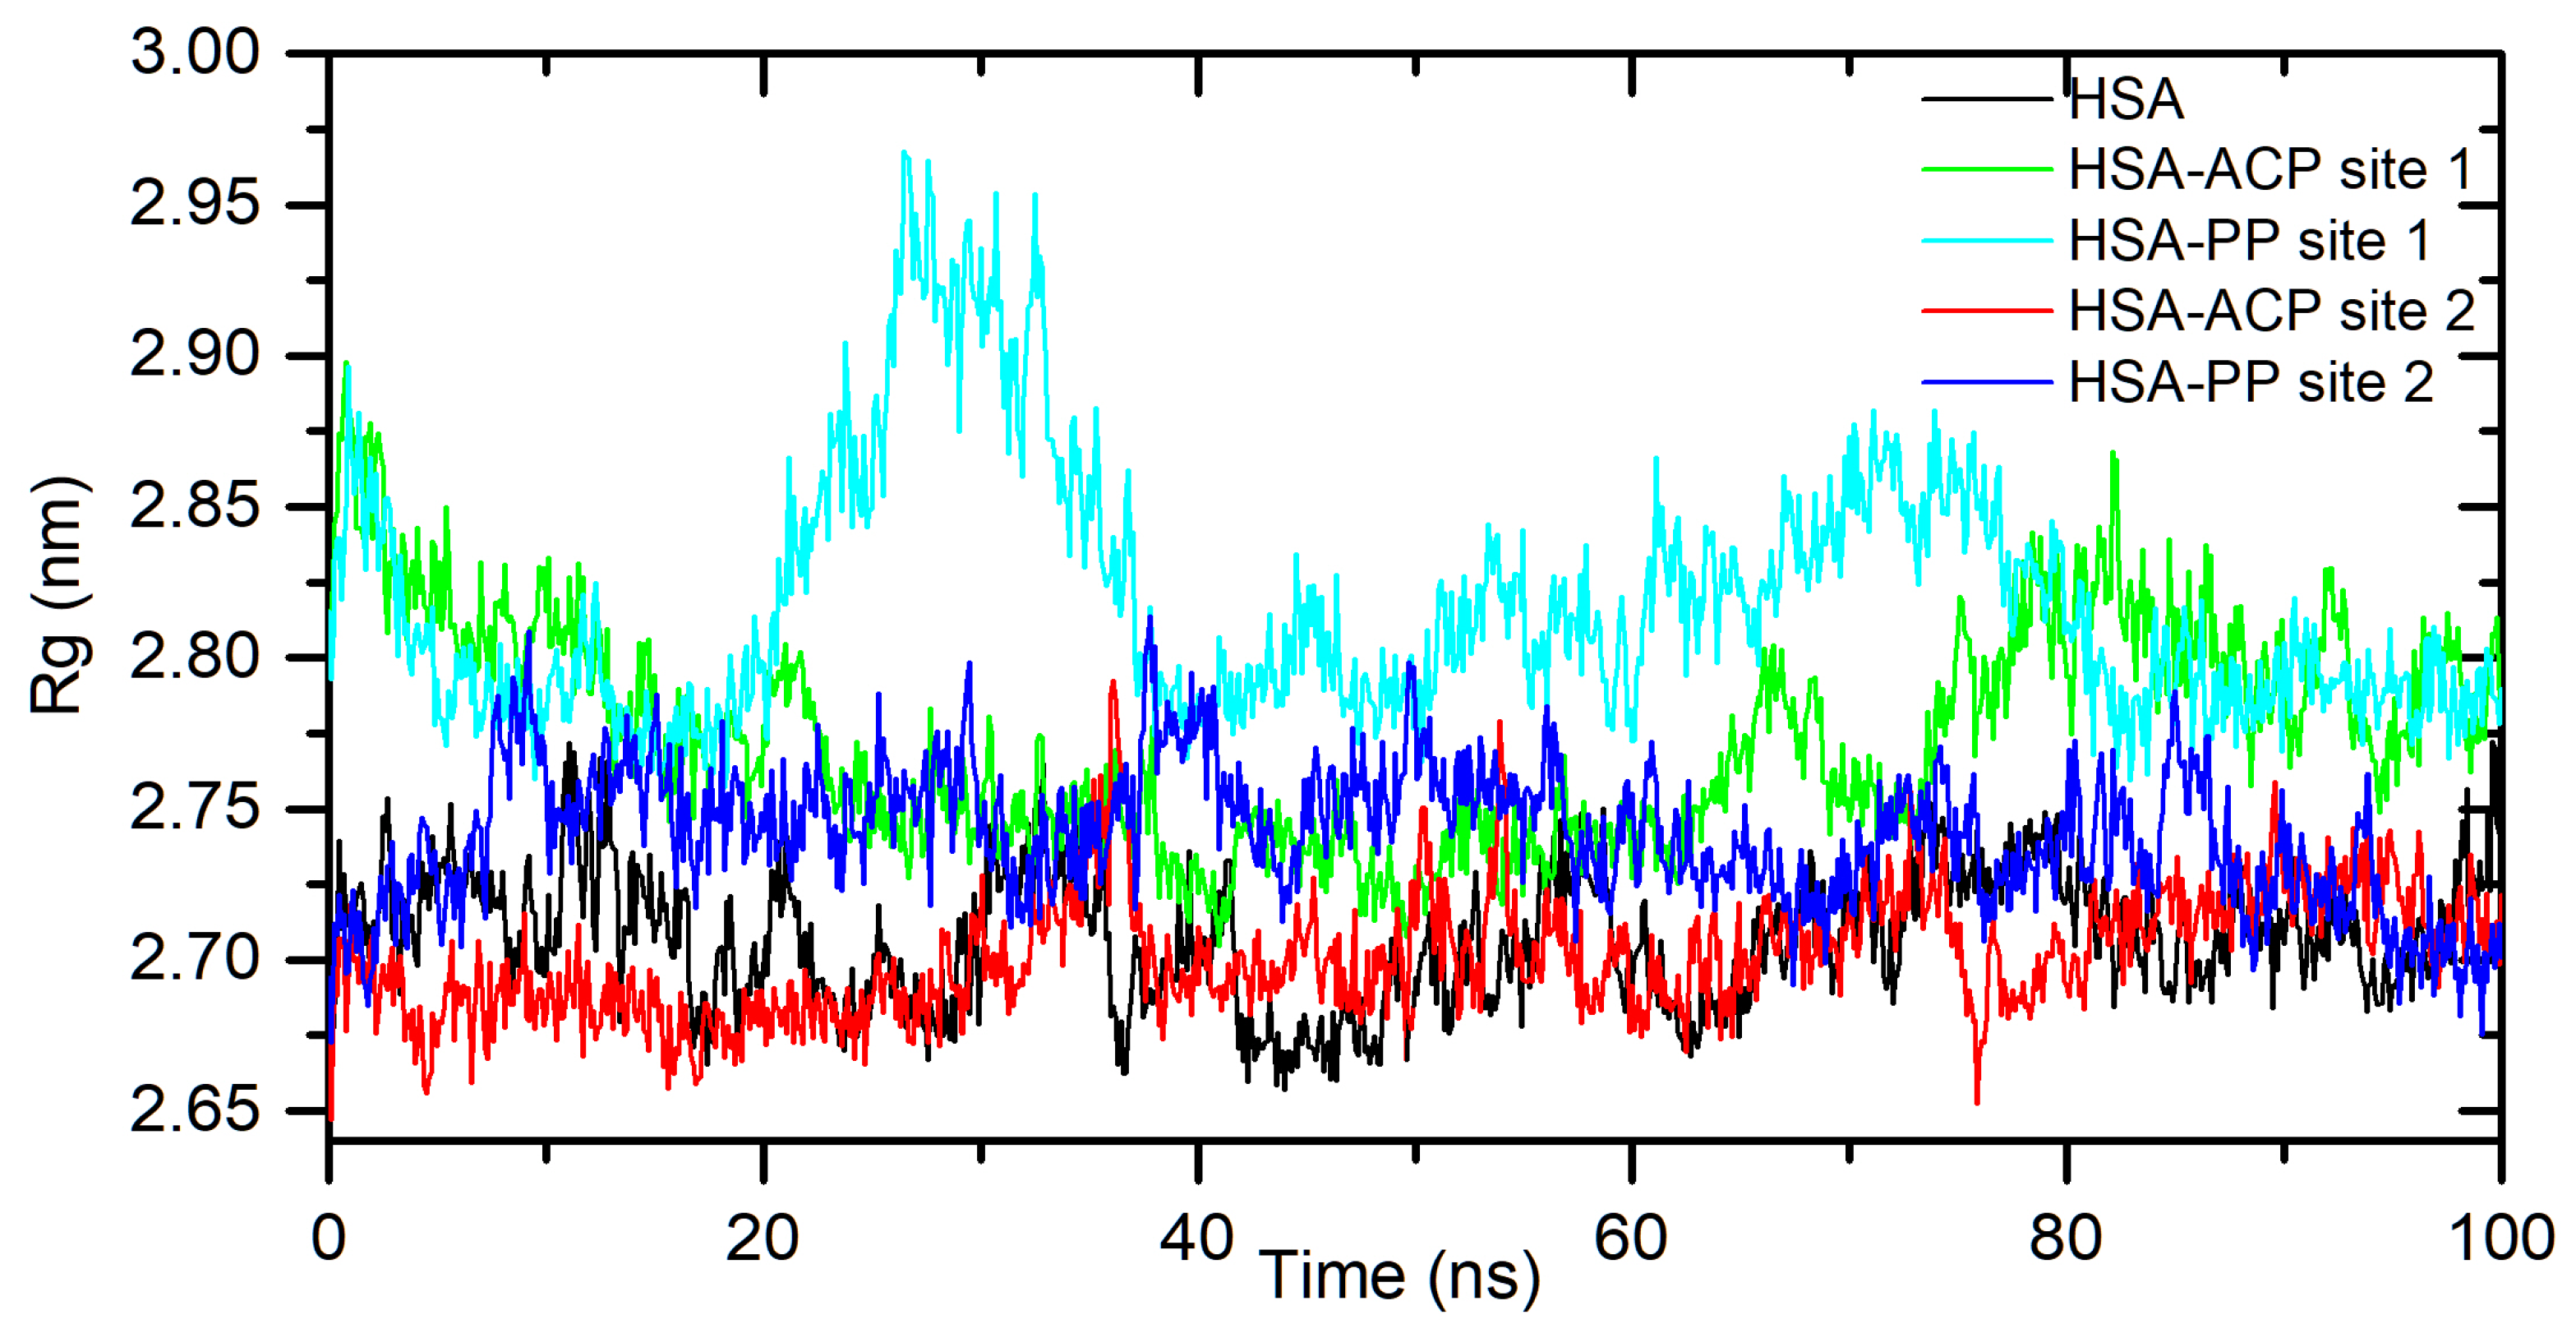
Figure 4. At the starting point, the Rg value of the unliganded HSA is 2.69 nm. During the simulation, only slight fluctuations were observed. For complexes with docked ligands in site 2, the initial Rg value is close to unliganded HSA, i.e. 2.68 nm for ACP and 2.69 nm for PP. After simulation time, for both complexes, Rg is slightly lower than for free albumin (
Figure 4). This means that HSA is slightly more compact after binding allocryptopine and protopine. For the systems with ligands docked at site 1, the initial Rg and after 100 ns is larger than for site 2 (
Figure 4). In the third step, the binding free energy was calculated from MD complex trajectories using the gmx_MMPBSA tool [
21]. The calculation was performed with frames after complex stabilization. The results are given in
Table 2. The average ΔG
bind was found as −17.6 kcal/mol and −20.1 kcal/mol for the HSA-ACP system with ligands at site 1 and site 2. For the HSA-PP complex, −12.3 kcal/mol and −18.4 kcal/mol, respectively. The ΔGbind values are smaller for site 1 than for site 2. In summary, the in silico studies quite clearly suggest that drug binding site 2 (IIIA) should be preferred over site 1 (IIA). In the next part of this work, we will confirm this hypothesis using binding site markers.
These findings were verified by experimental methods. We conducted competitive studies with markers that bind to specific sites in protein molecules. This type of research allows us to prove that a stable complex is formed between the macromolecule and the tested compound in a specific way. Fluorescence spectroscopy was used to consider this issue. The HSA is an essential factor, which plays a crucial role in the pharmacokinetics of many drugs, affecting their efficacy. Moreover, albumin is a multi-carrier agent which also transports fatty acids, endo- and exogenous ligands. The albumin has well known two drug binding Sudlow’s sites: site 1 and site 2, which are the most important in drug transport. Binding site 1 is specific for heterocyclic compounds and site 2 is the preferred interaction place for aromatic compounds [
20,
22]. The binding displacement study can indicate which of these cavities is more favorable for ligand. The dansyl amino acids exhibit the phenomenon of fluorescence. The dansylated glycine (dGly) is a marker for drug binding site 1, while the dansyl phenylalanine (dPhe) enters in binding site 2 [
11,
23]. The dansyl amino acids possess different physicochemical properties because of differences in side chains, and it determines which binding site in the protein is preferable. The dGly has no side chains and is specific for site 1 as good as different polar dansylated amino acids (e.g. dAsn, dGlu, dArg). However, dPhe with a hydrophobic phenyl ring is dedicated to the second drug binding site [
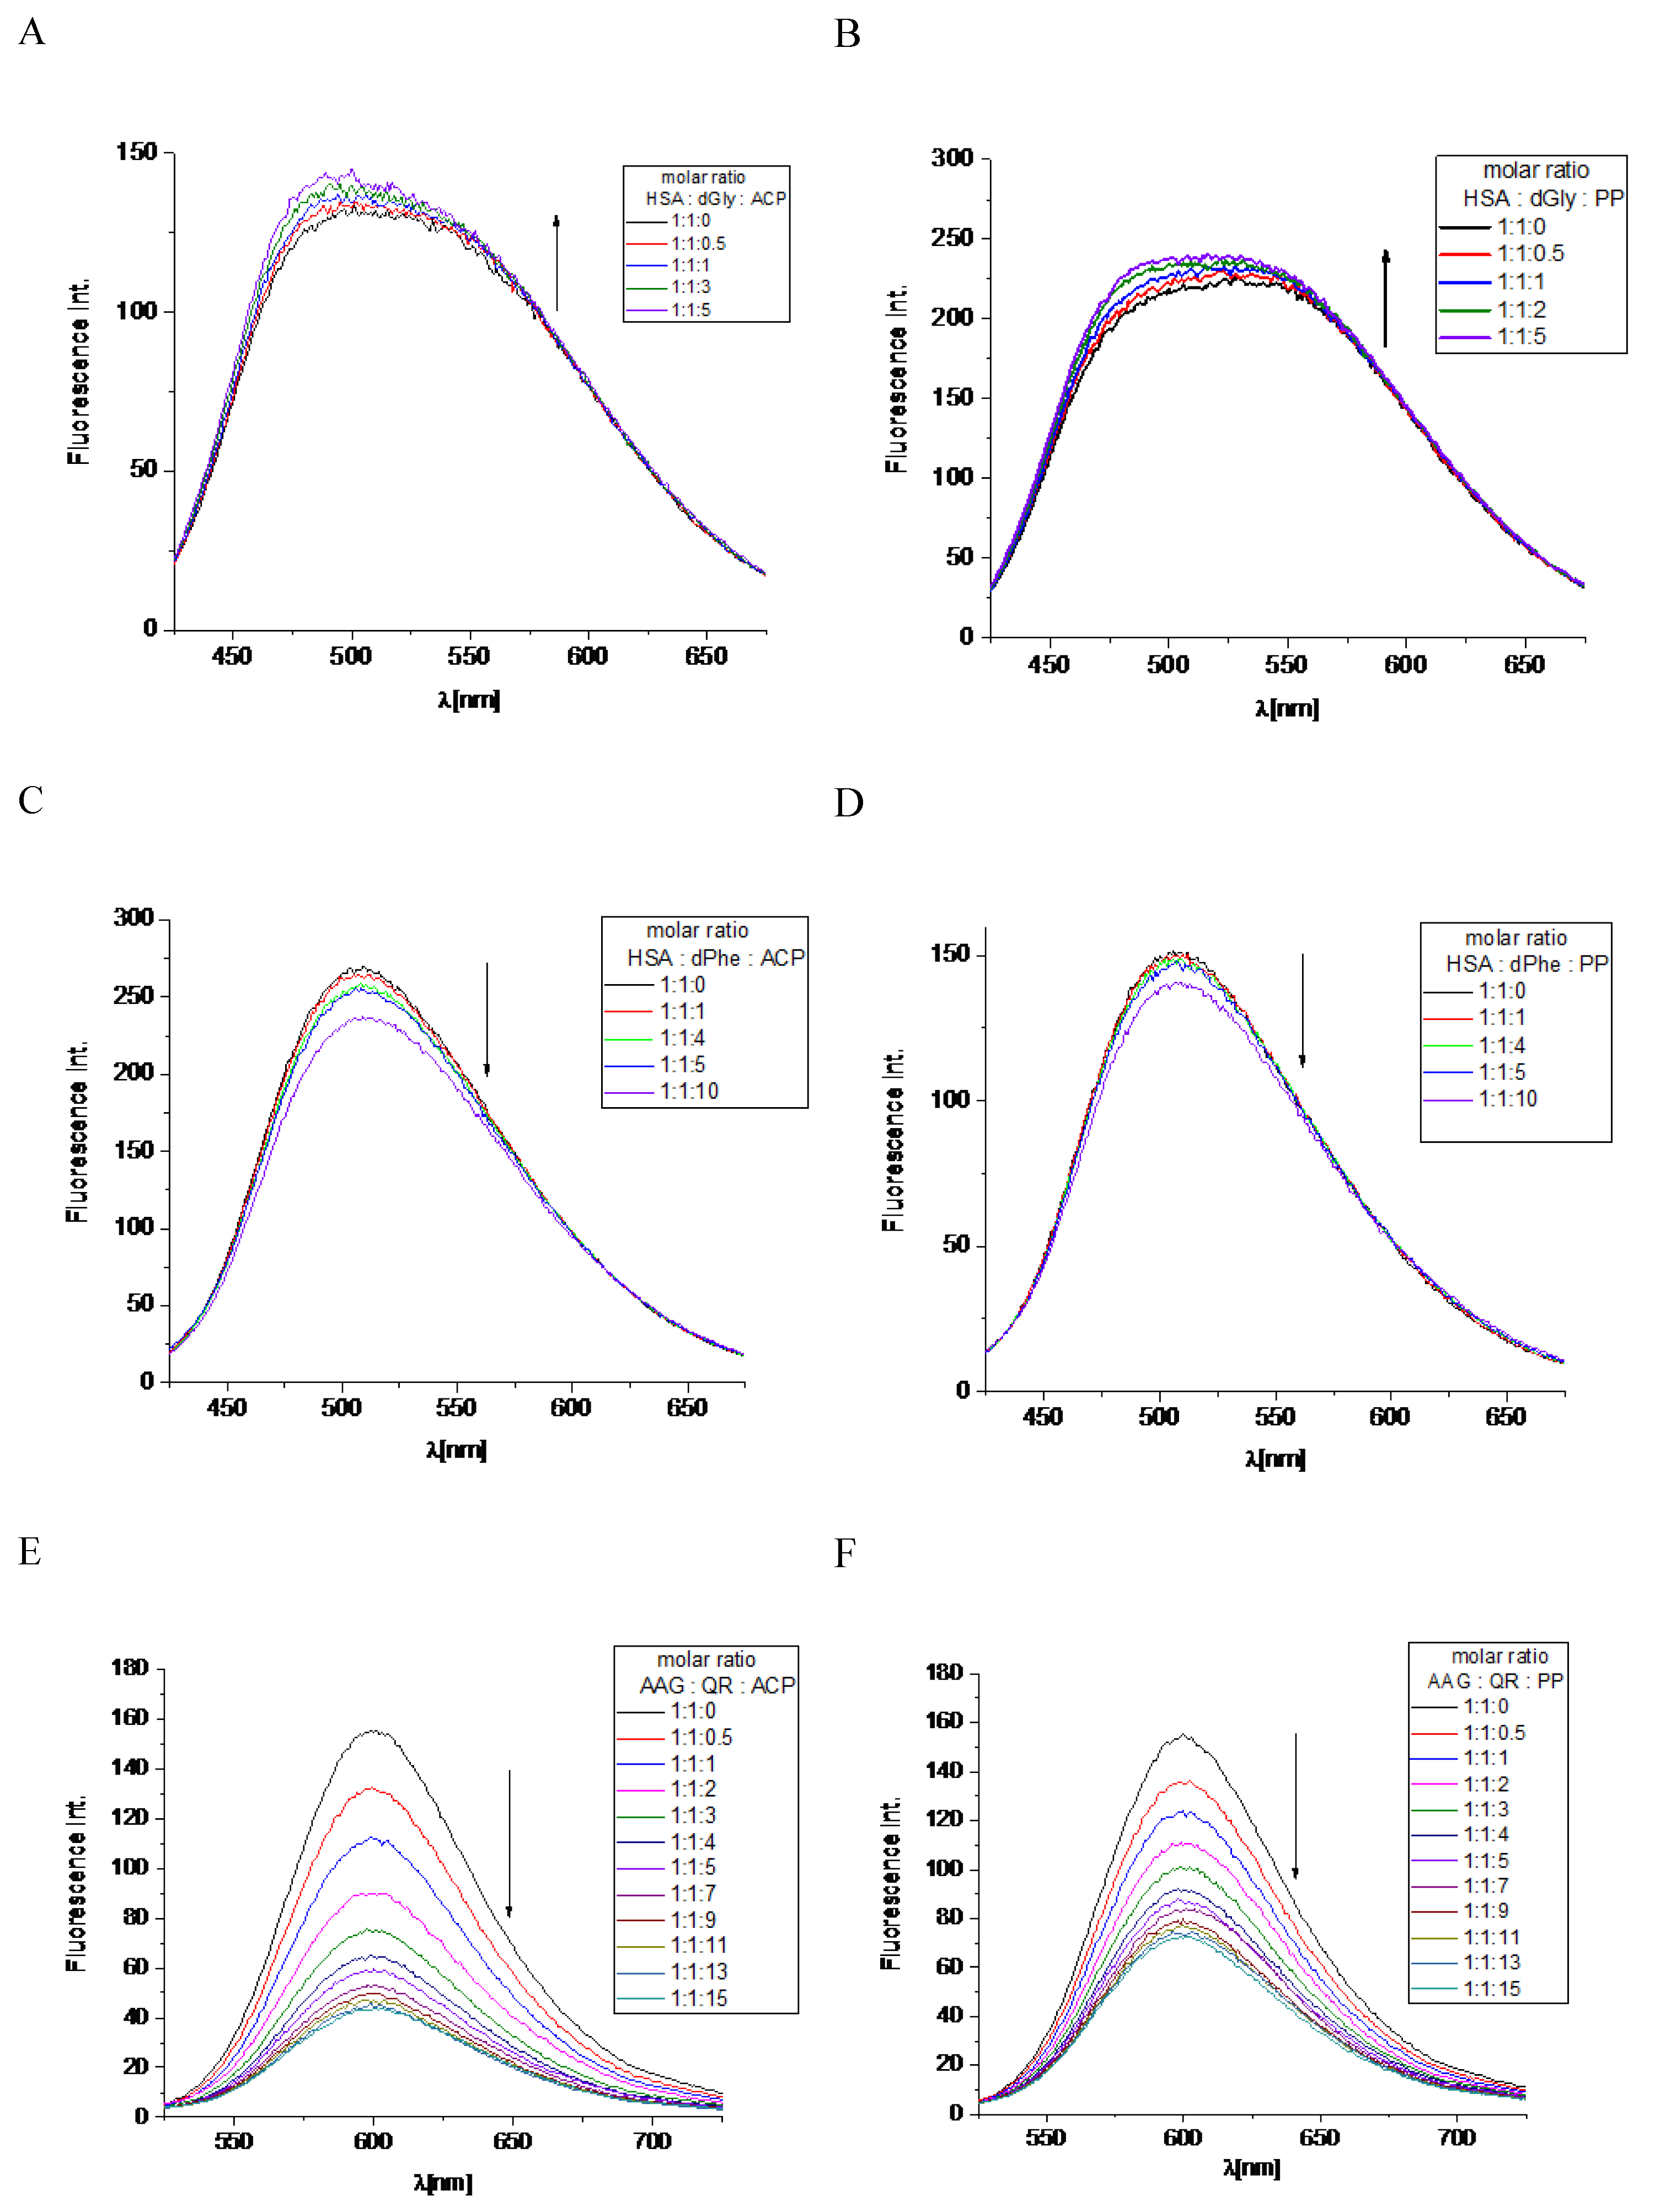
23]. The titration of complex HSA/dGly by studied alkaloids: ACP, PP was performed. Both alkaloids lead to increasing fluorescence intensity with a slight move to higher energy wavelength (
Figure 5A,B). This indicates that these compounds do not occupy the binding site 1. The observed increase in the intensity of the tested band is probably related only to the change in the concentration of reagents in the analyzed solution. However, the stepwise addition by steps of ACP and PP to the solution with HSA/dPhe induced the reduction of the fluorescence intensity (
Figure 5C,D), which suggests the marker exchange by alkaloids. In the final condition, the ACP caused about 12% of dPhe replacement, whereas for PP the obtained value is up than 6% (
Table 3). Undoubtedly, drug binding site 2 is a more desirable interaction space for ACP and PP alkaloids. These findings well correspond to K
app values calculated from UV-Vis spectroscopy results. As described above, the ACP has a higher affinity to HSA than the PP compound (
Table 2).
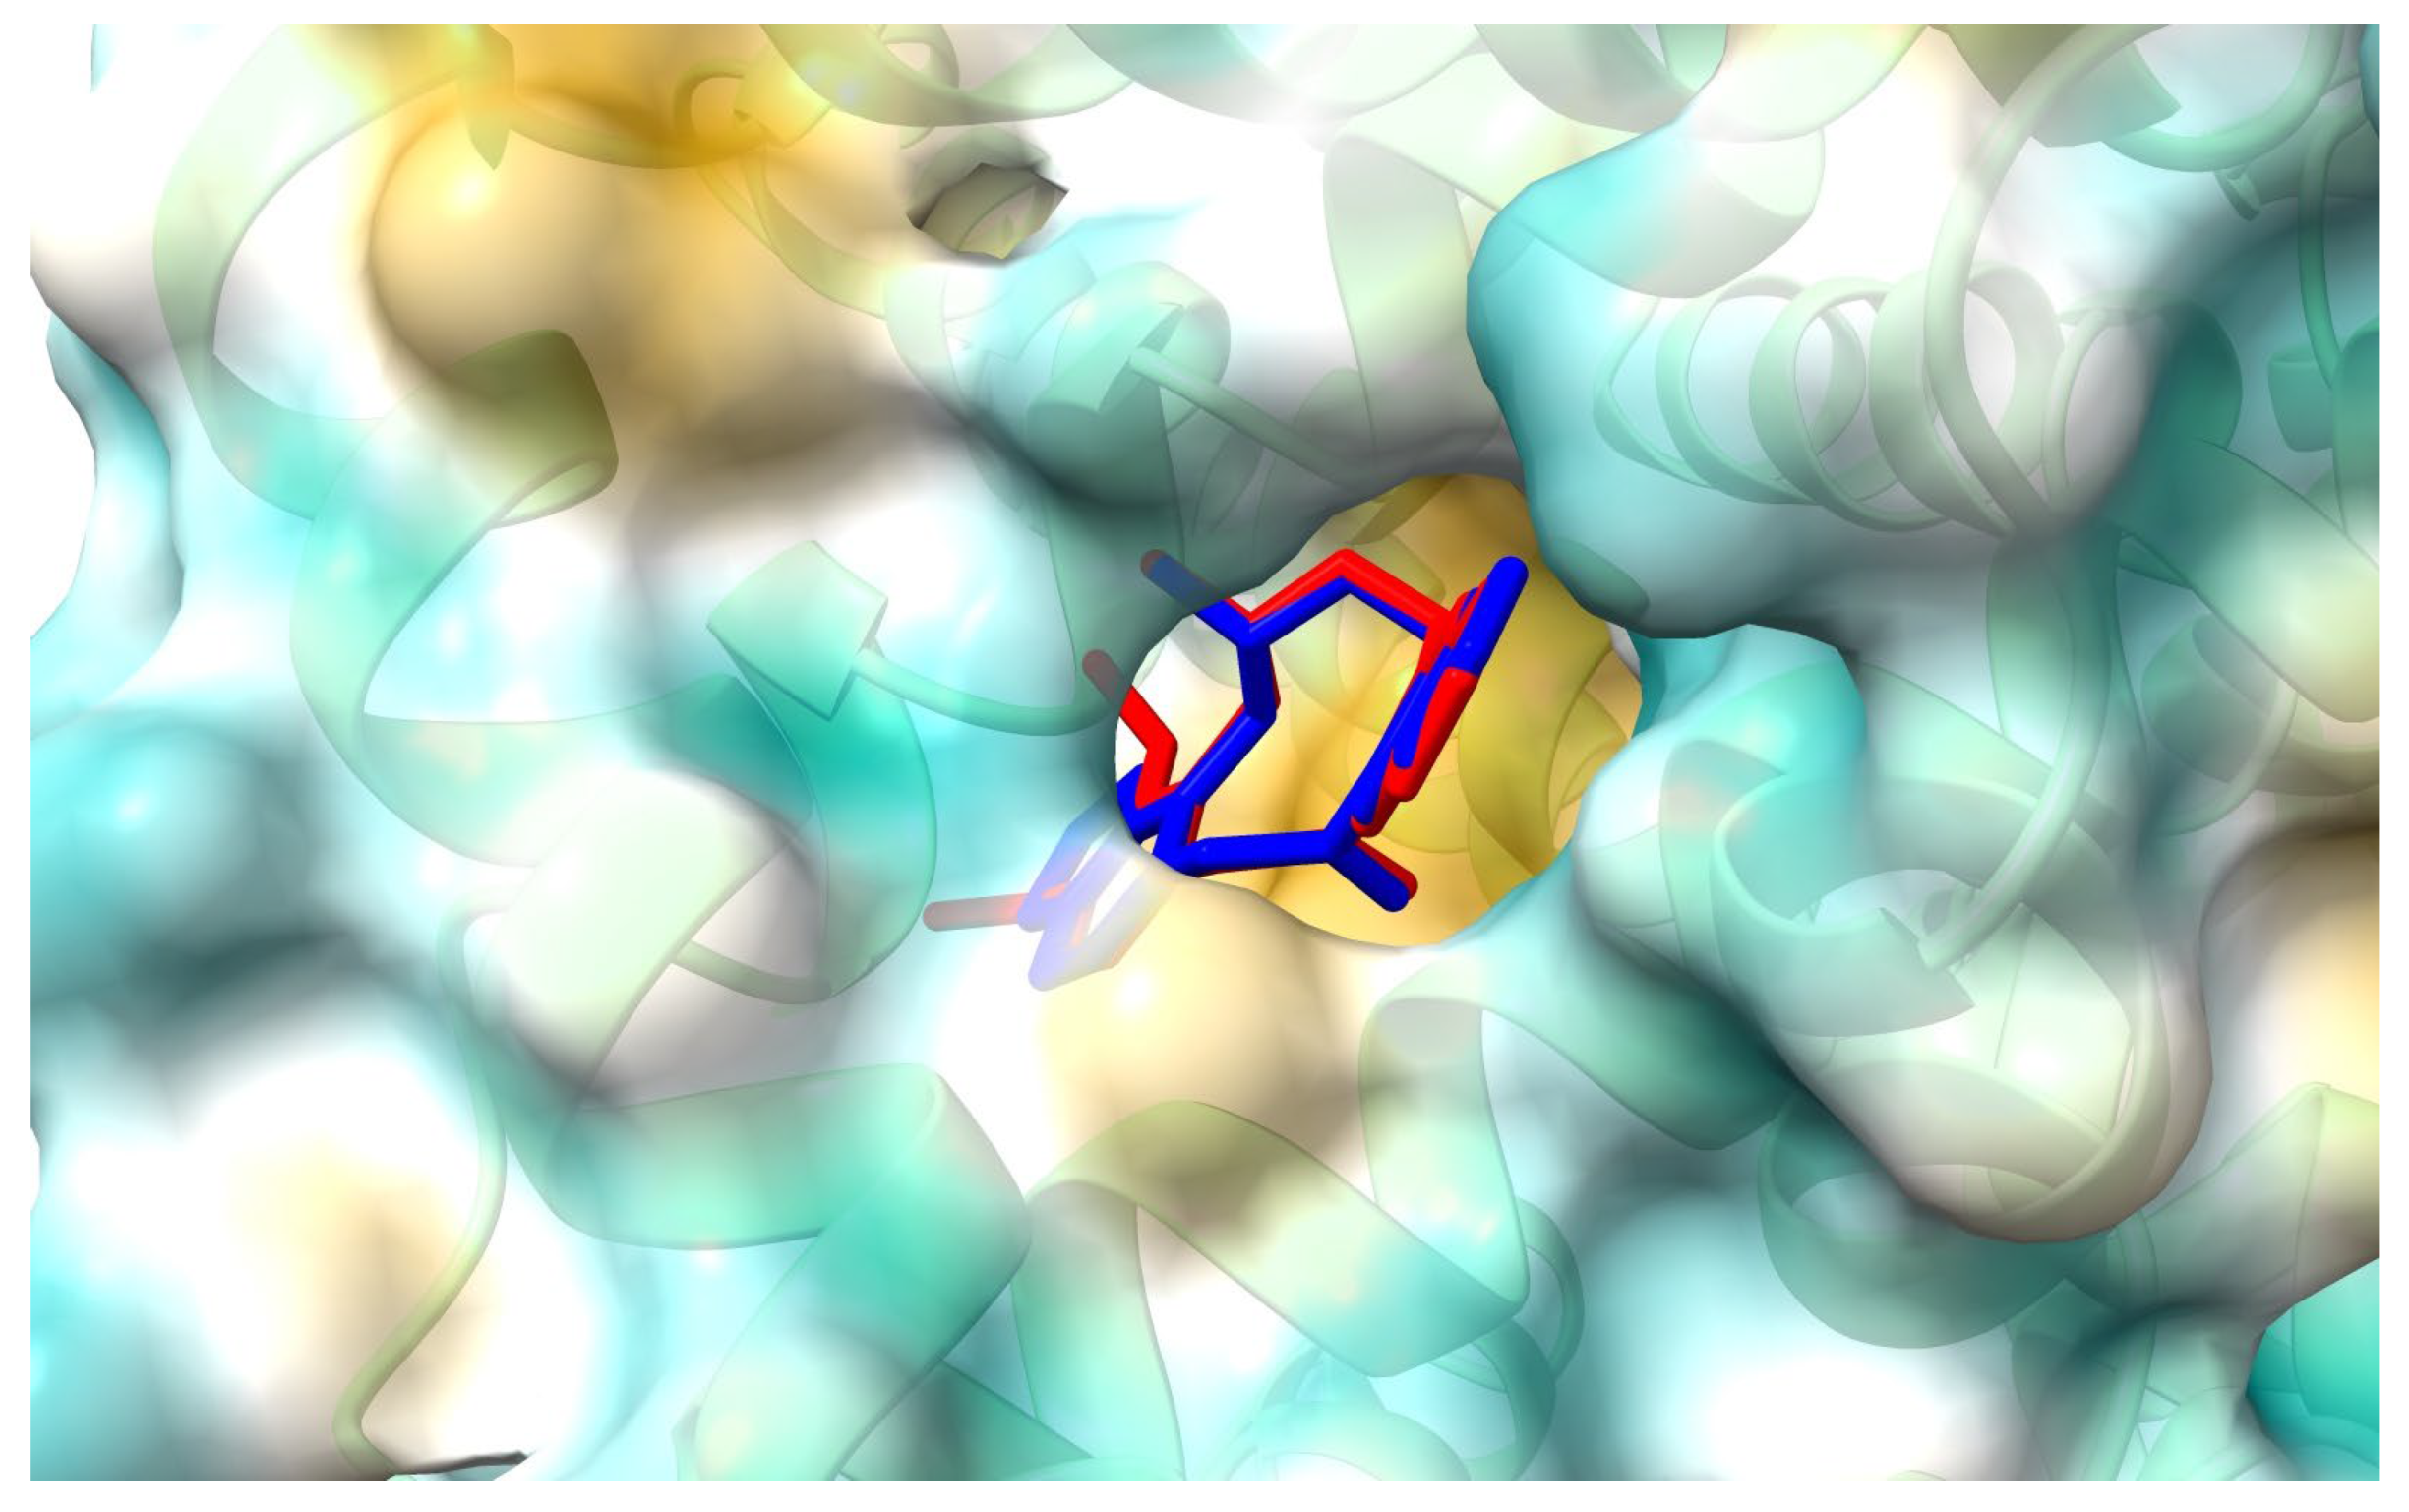
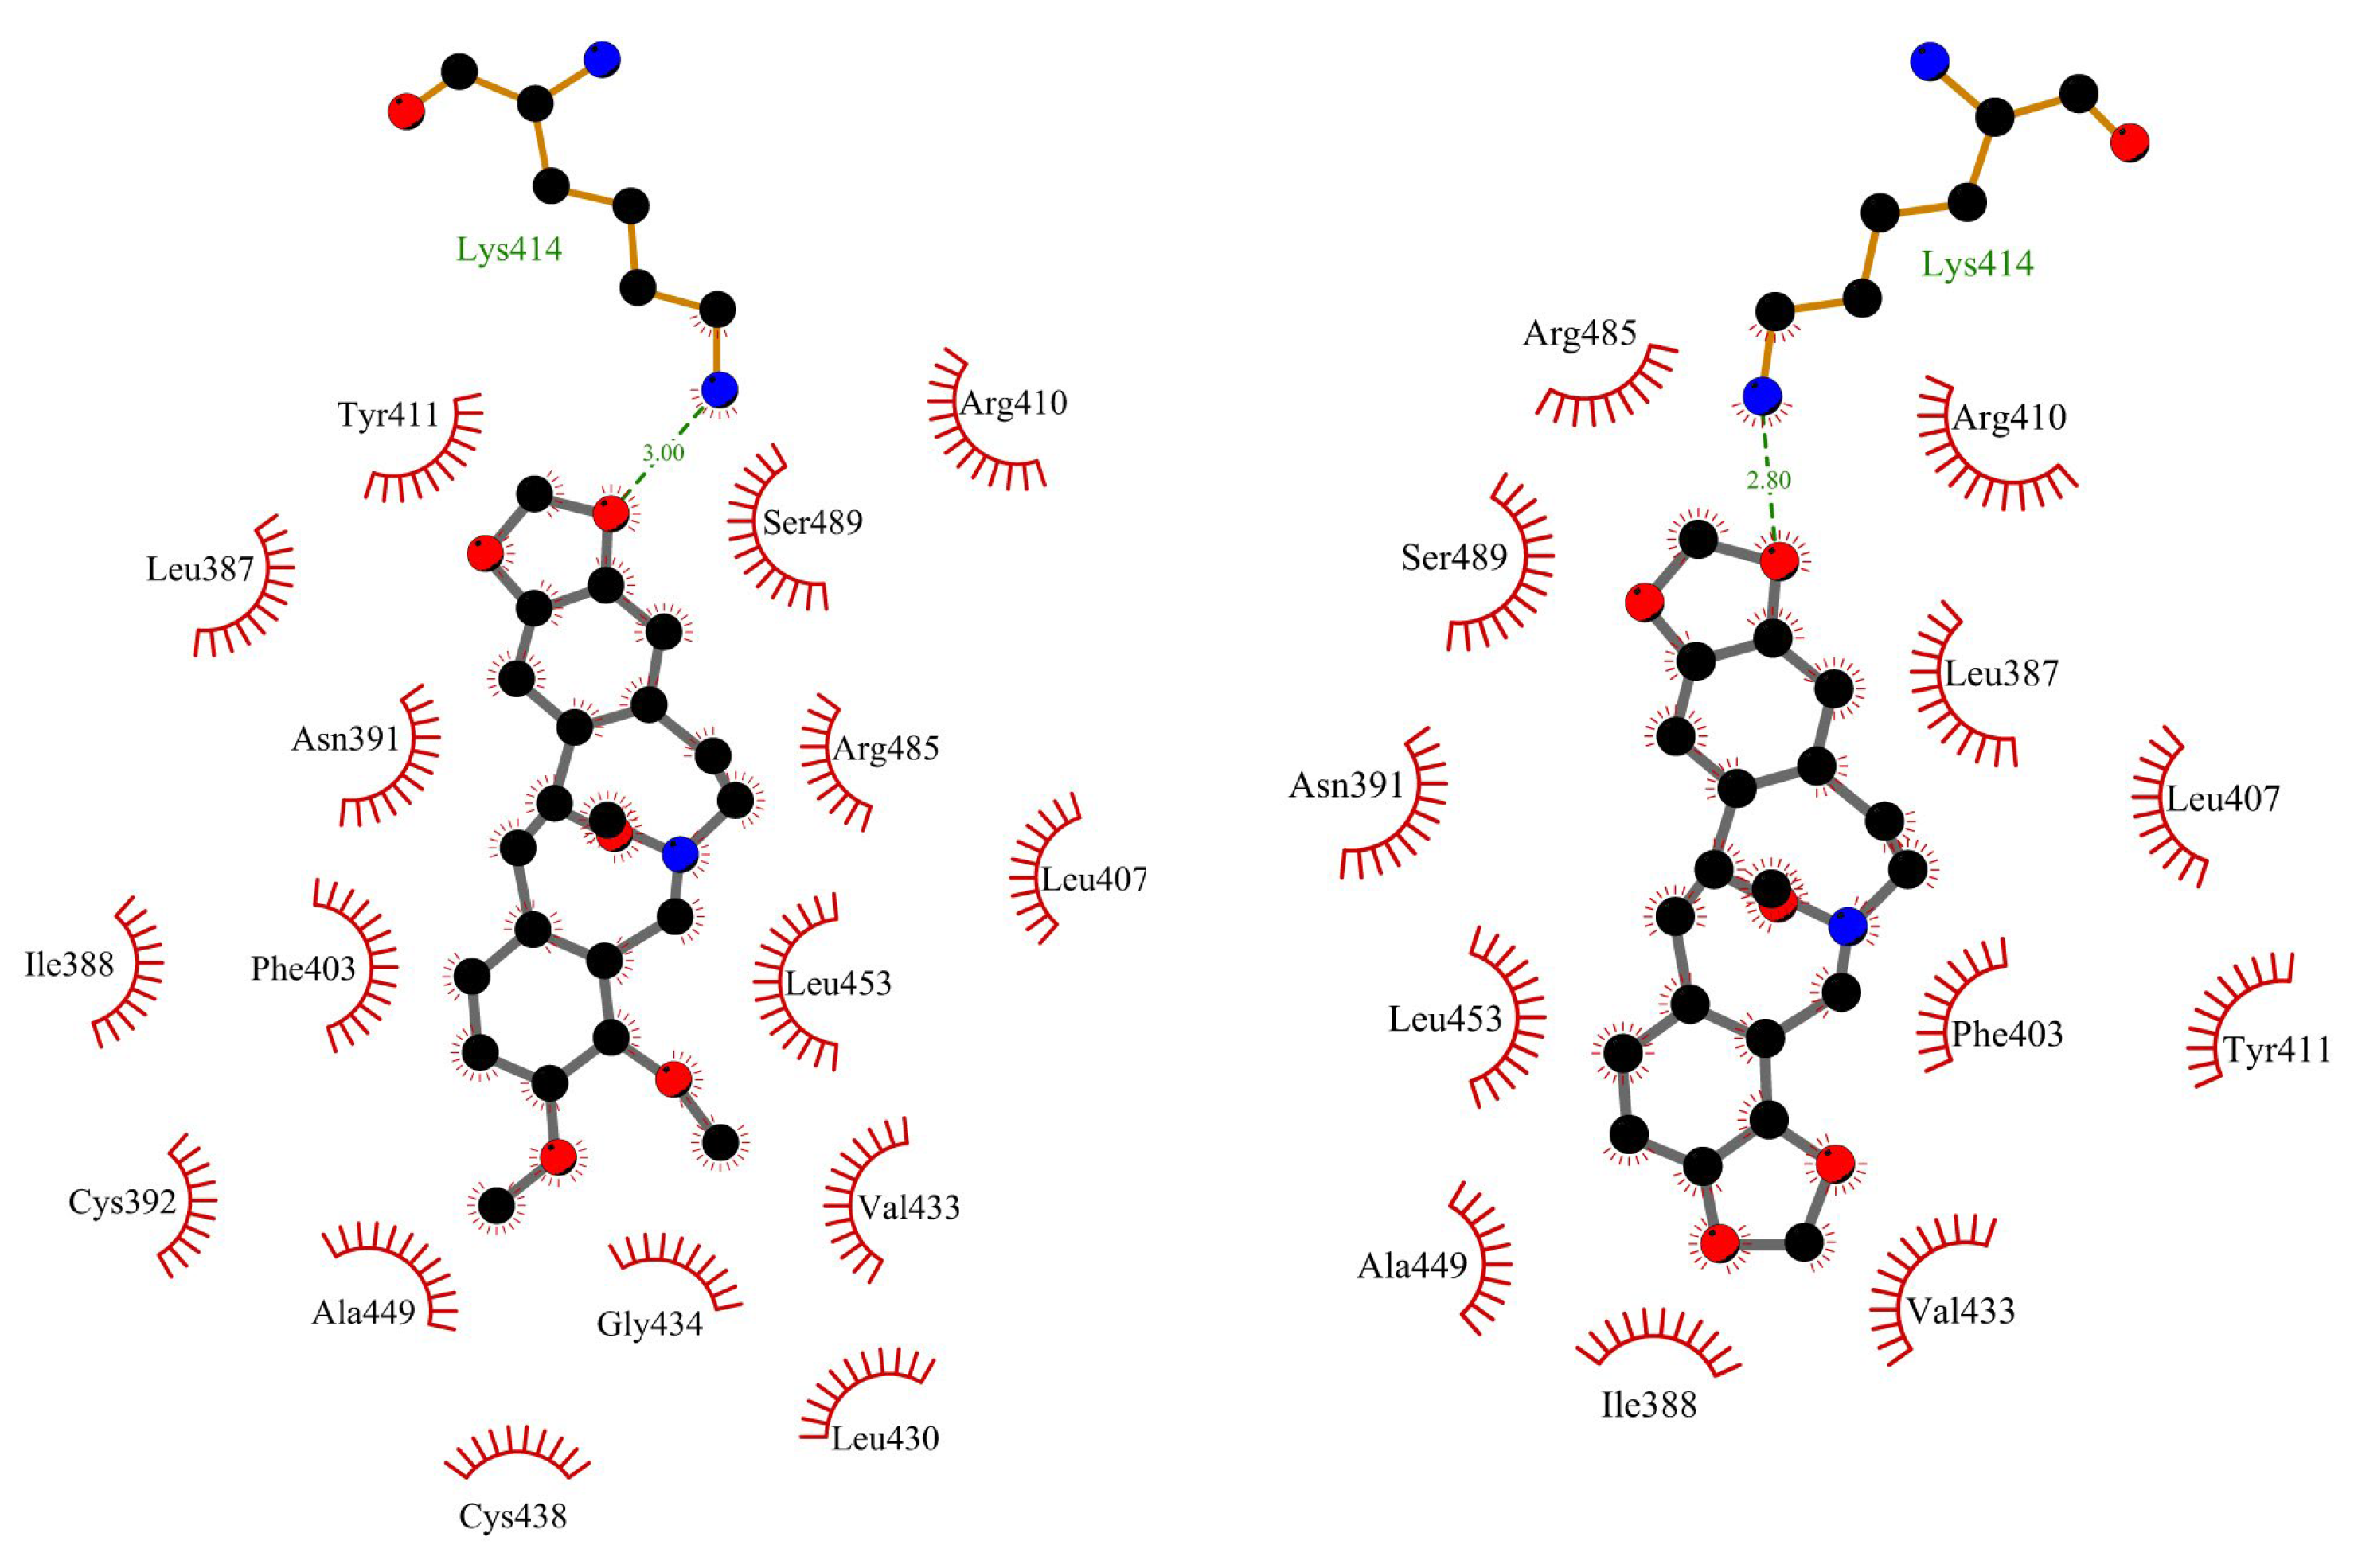
Figure 6 and
Figure 7 show the position of ACP and PP at albumin’s binding site 2 and a 2D plot of interaction mode. The orientation in the pocket and the interactions for both compounds are very similar. One hydrogen bond, between the nitrogen atom at Lys414 and the oxygen atom in the dioxolane ring, has been found. 1,3-Benzodioxole moiety also interacts with HSA via contacts with Leu387 (π-alkyl), Arg410 (π-cation), Ser489 (π-donor). The middle ring of the molecule is involved in π-sigma and alkyl interactions with Asn391, Arg485, Leu407, and Leu453. The second 1,3-Benzodioxole group of protopine or dimethoxyphenyl moiety of allocryptopine is located deeper in the pocket and interacts by hydrophobic contacts, π-alkyl, and alkyl, with Phe403, Leu453, Ala449, Val433, Cys392, Gly434, Cys383, Leu430, Ile388.
The
in silico studies were also made to characterize a binding mode for interactions between ACP and PP with α1-acid glycoprotein. The binding affinity, from the molecular docking approach, was calculated as: −8.8 kcal/mol for AAG-ACP and −9.8 kcal/mol for AAG-PP (
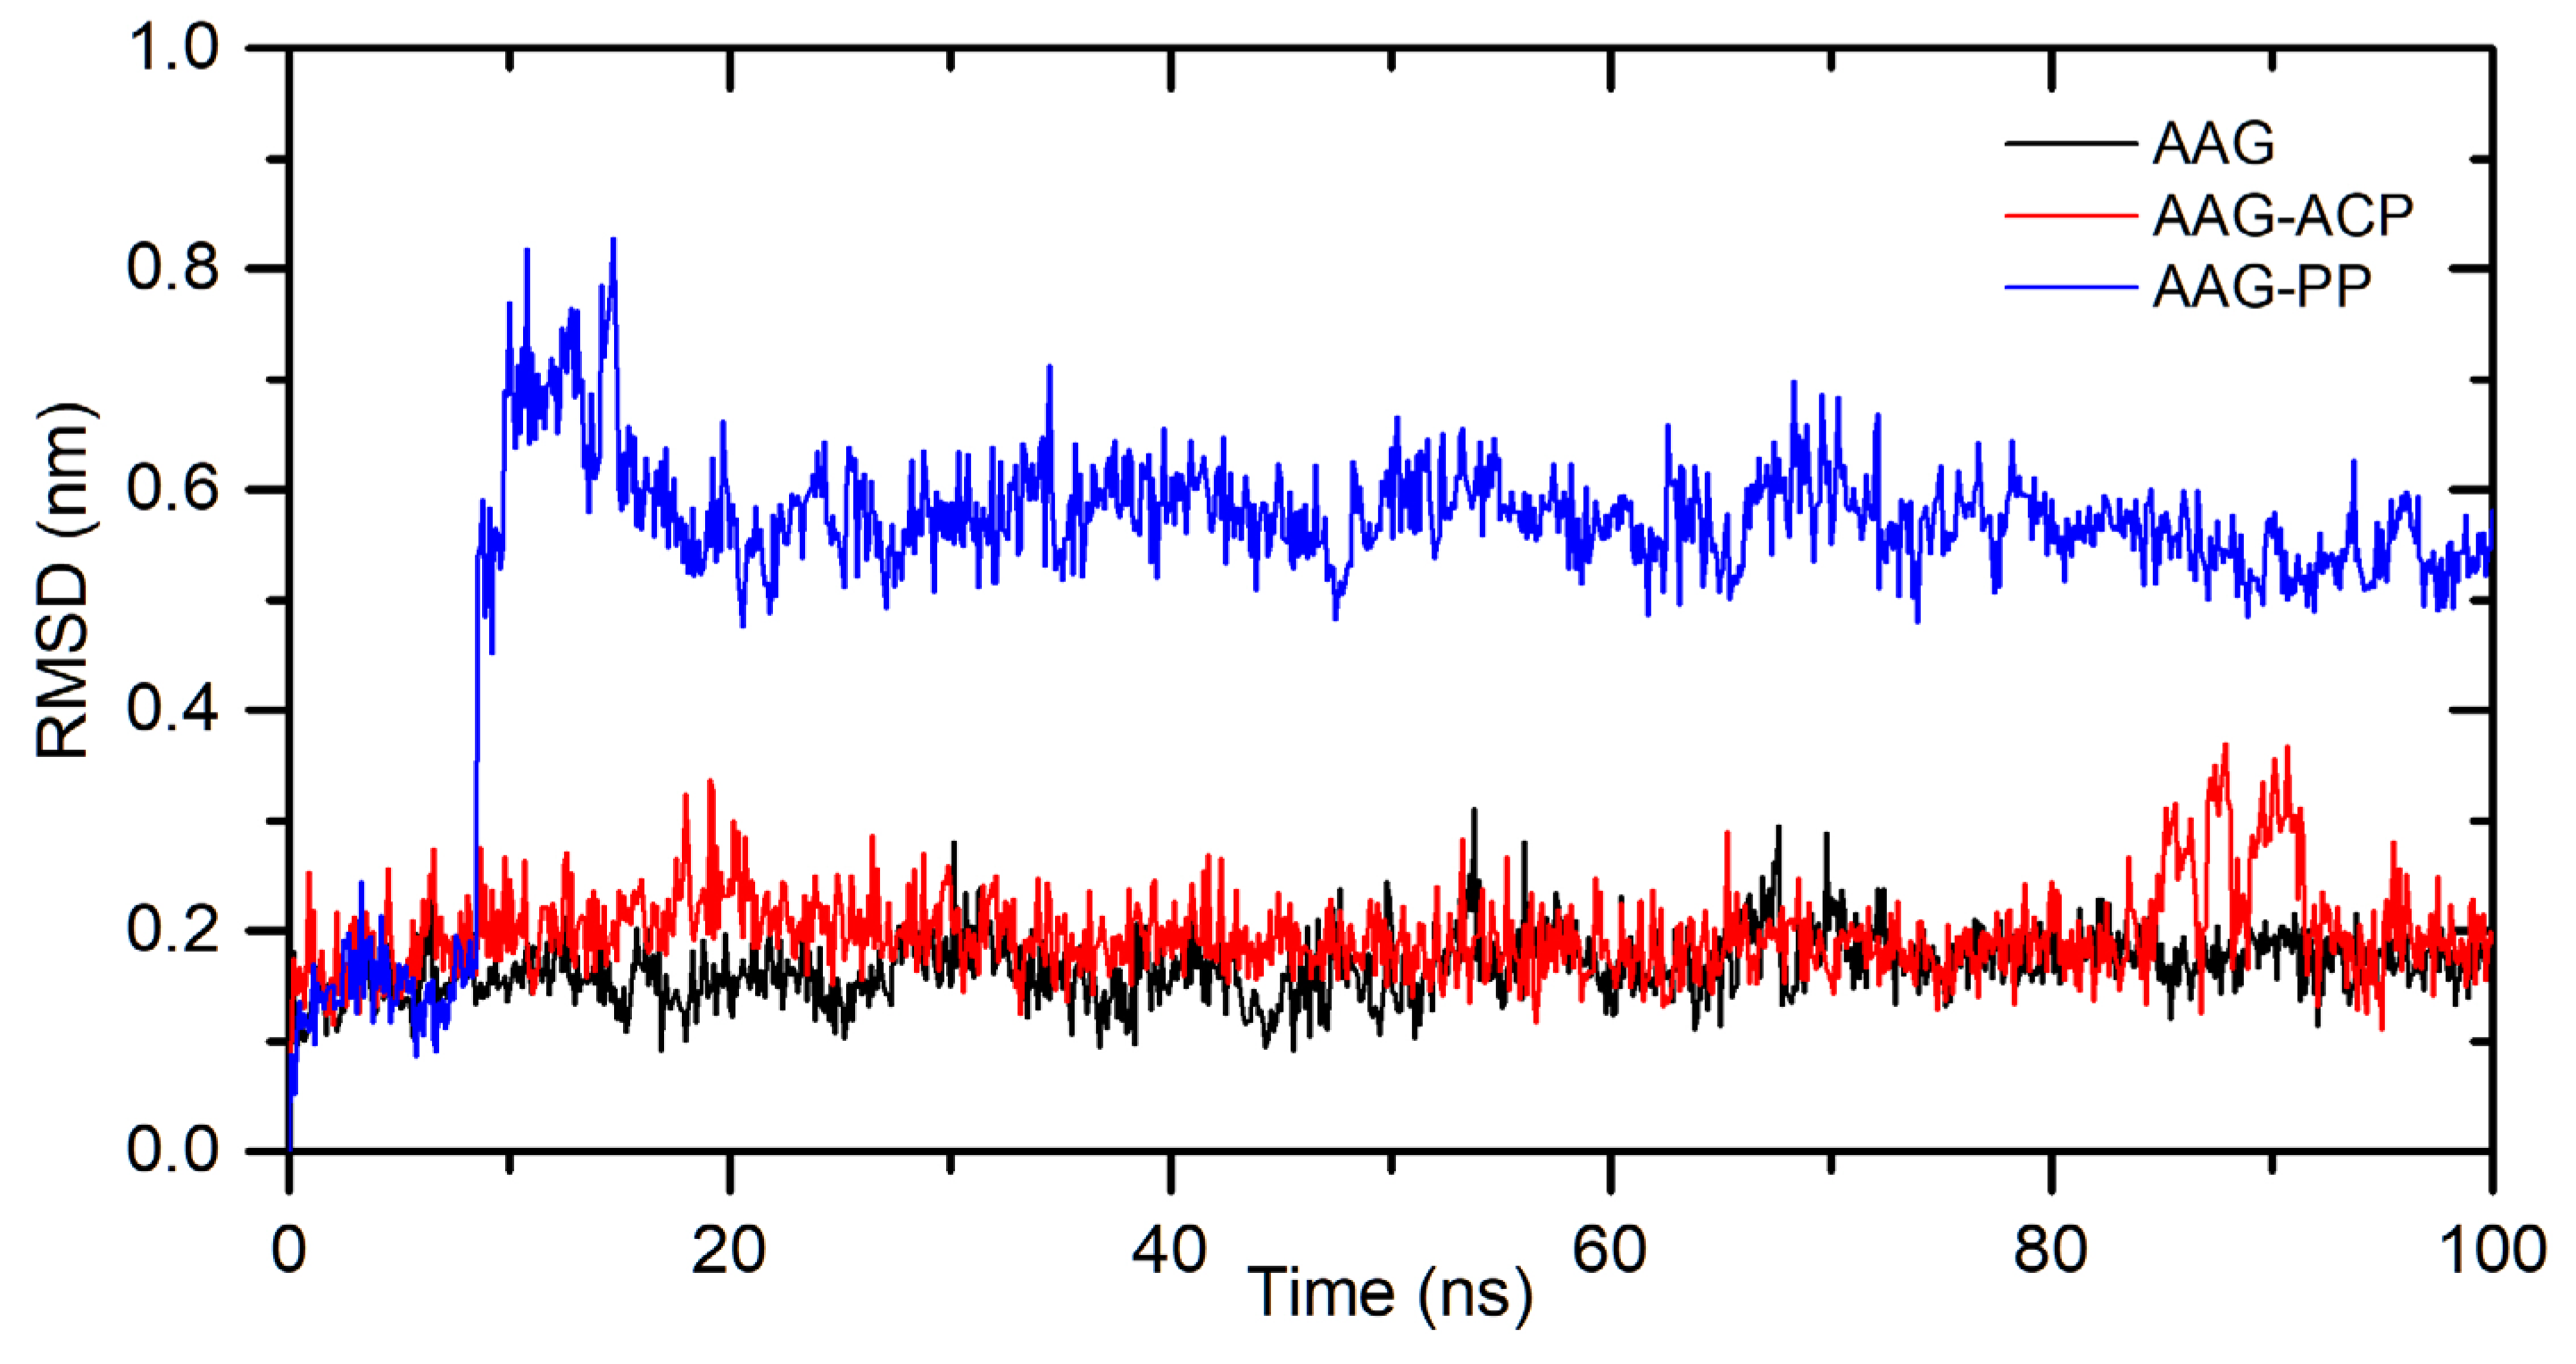
Table 2). This suggests strong interactions and complex formation. The stability of the complexes was simulated for 100 ns using the molecular dynamics method. The results are shown in
Figure 8. For AAG-ACP, the system stabilizes after about 10 ns. The averaged root mean square deviation (RMSD) was calculated as 0.20±0.04 nm (10-100 ns). This is only slightly more than for unbound protein (0.17±0.03 nm). For AAG-PP, RMSD increases rapidly from 8.5 to 10 ns. Between 10-20 ns some fluctuations are observed. After 20 ns complex is stable. The averaged RMSD was calculated as 0.57±0.04 nm (20-100 ns). The plot of Rg values against simulation time is presented in
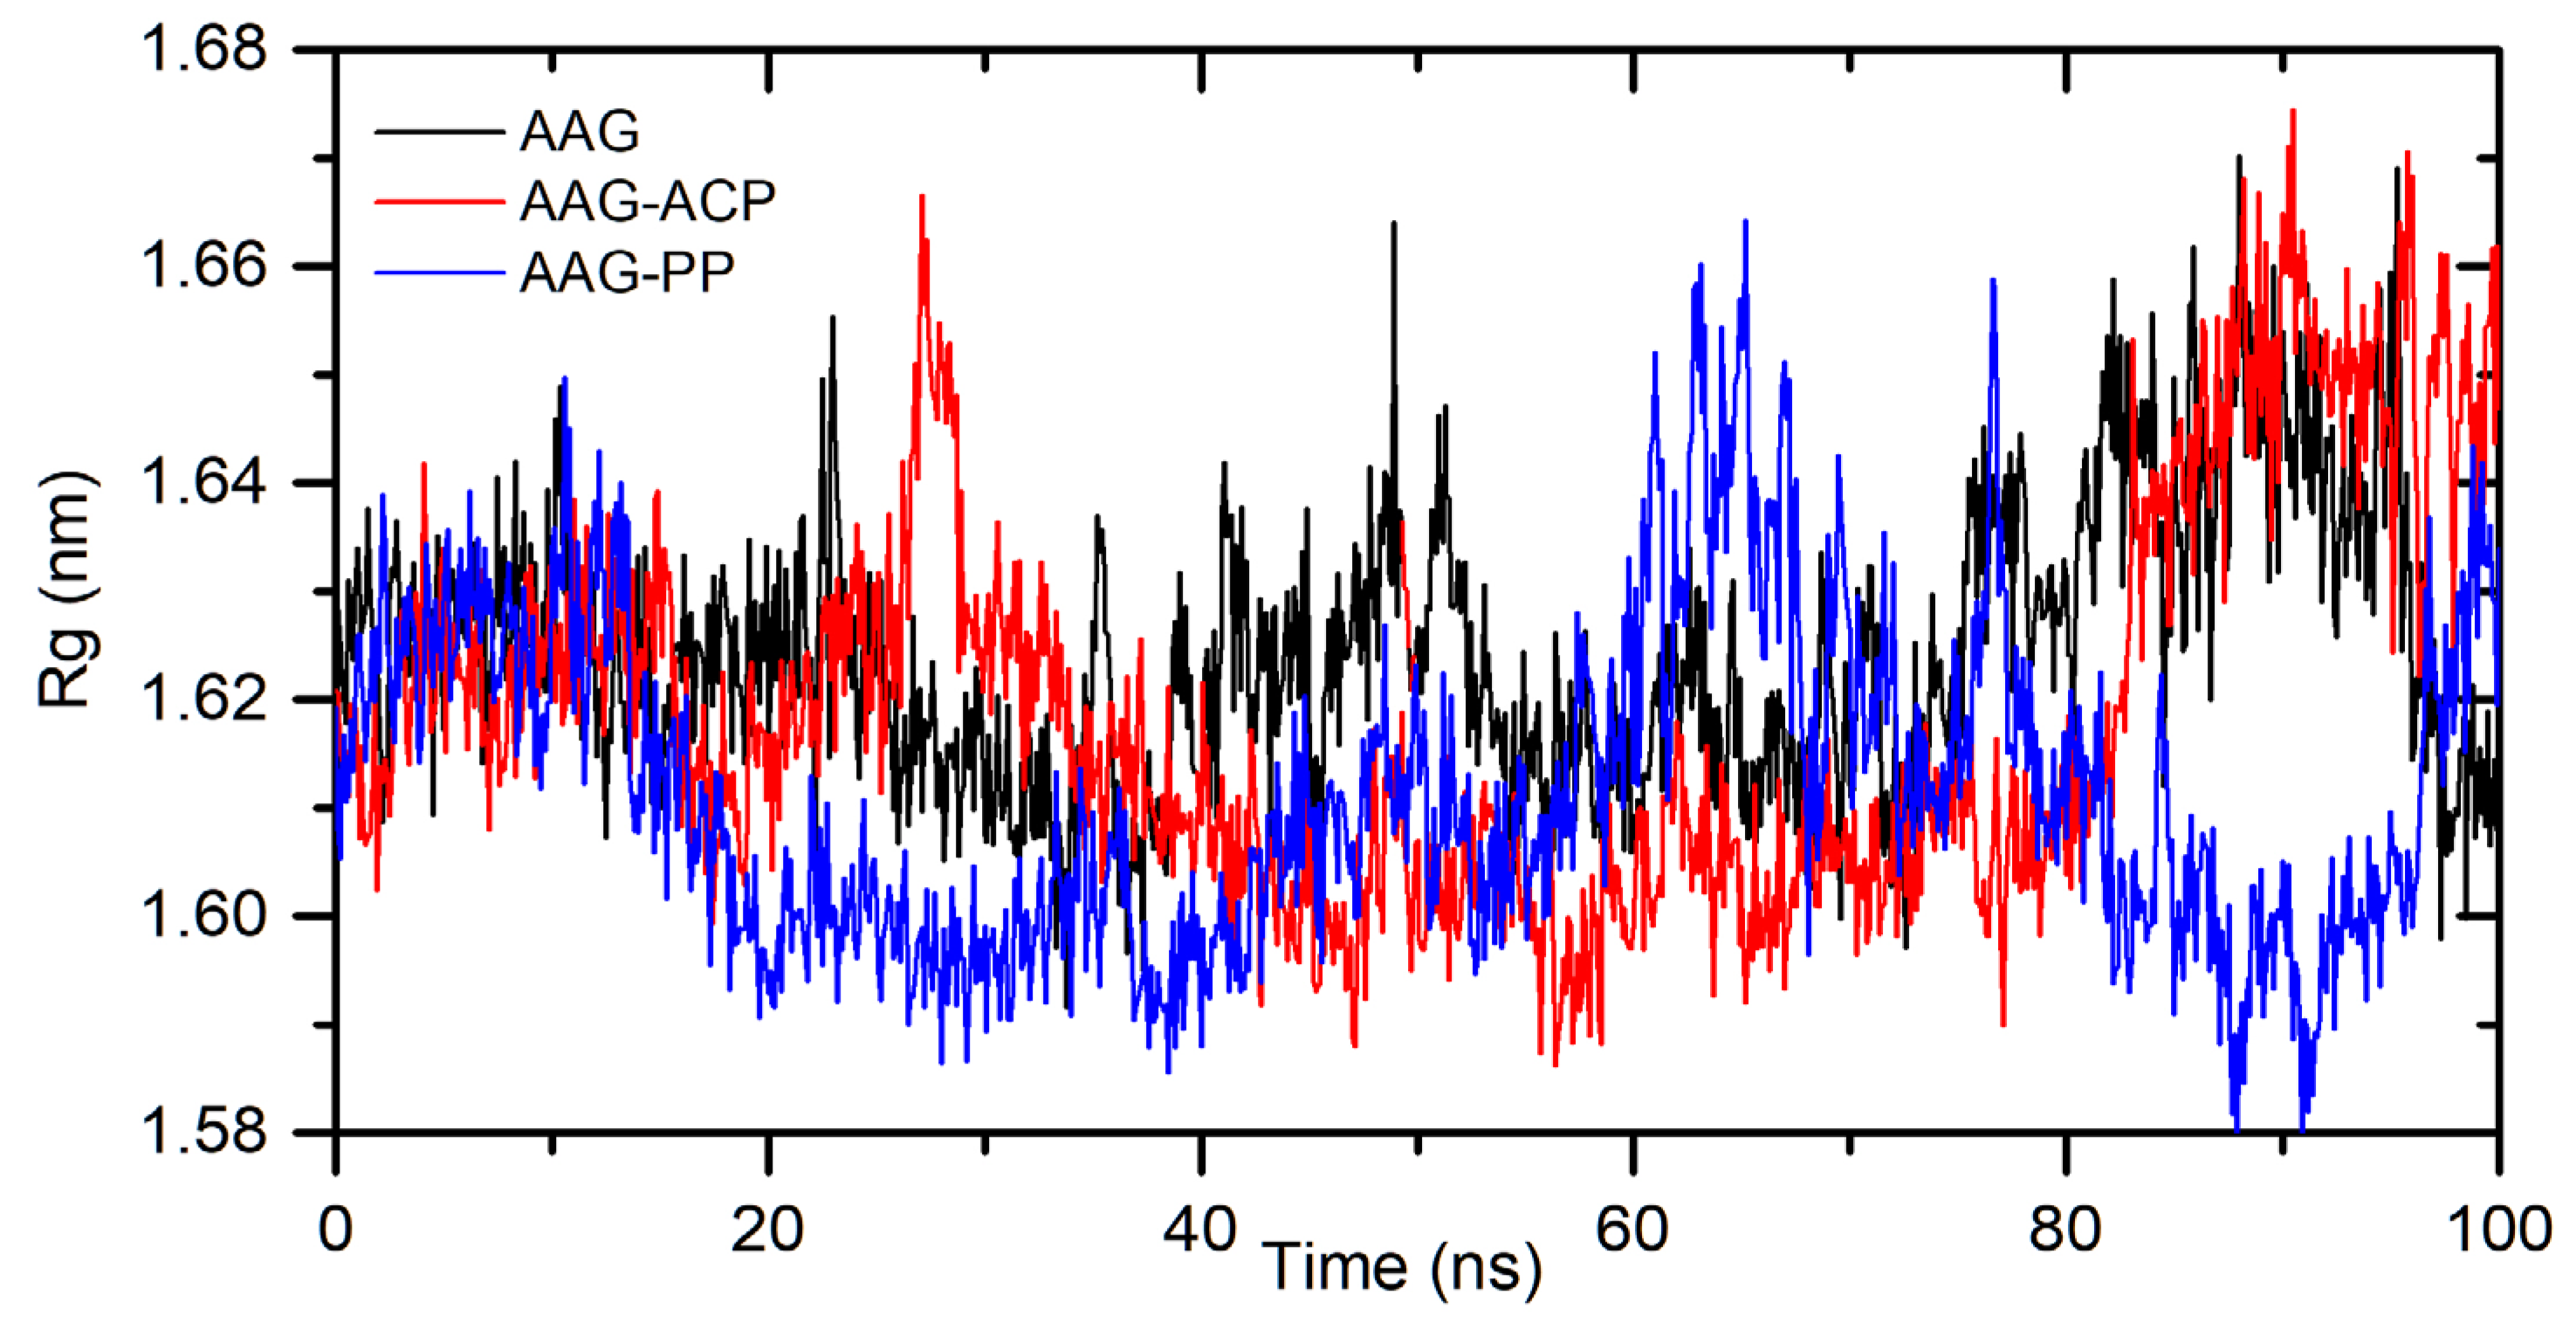
Figure 9. At the initial state, the Rg value of the free AAG, AAG-ACP, and AAG-PP was found as 2.69 nm for all systems. During the simulation, some fluctuations were observed. After simulation time, for both complexes, Rg is slightly higher than for free AAG (
Figure 9). However, the average values are close to each other, i.e. 1.62±0.01 nm, 1.61±0.02 nm, and 1.61±0.02 nm for AAG, AAG-ACP, and AAG-PP respectively. The binding free energy, calculated from dynamic simulation, is given in
Table 2. The average ΔG
bind after stabilization was found as −17.0 kcal/mol for AAG-ACP and −23.3 kcal/mol for AAG-PP. Negative energy indicates the formation of complexes.
The competition binding assay was also used to characterize the alkaloids’ interaction with AAG. The AAG, similar to HSA, is one of the major drug transporters in plasma protein. The AAG usually binds basic molecules but it is also able to associate neutral lipophilic and some acidic compounds [
24]. In the AAG molecule, it can be distinguished two drug binding sites which are suitable for basic ligands and one more for acidic molecules [
25]. However, only one main site is of clinical relevance [
26]. One of the most commonly used marker for examining binding site in AGP is the quinaldine red (QR) which is a specific fluorescent probe [
27,
28,
29]. Stepwise addition of ACP and PP to the AAG/QR complex resulted in a decrease in fluorescence intensity (
Figure 5E,F). That effect proved the studied alkaloids replaced the QR in AAG binding cavity. In the tested concentration range, the exchange of the QR marker by ACP occurs to a greater extent. The percentage of replacement was equal to 71.9% here, while PP only reached 53.7% (
Table 3). This observation is consistent with the value of the interaction constant K
app of alkaloids with AAG, which is slightly higher for ACP (
Table 1).
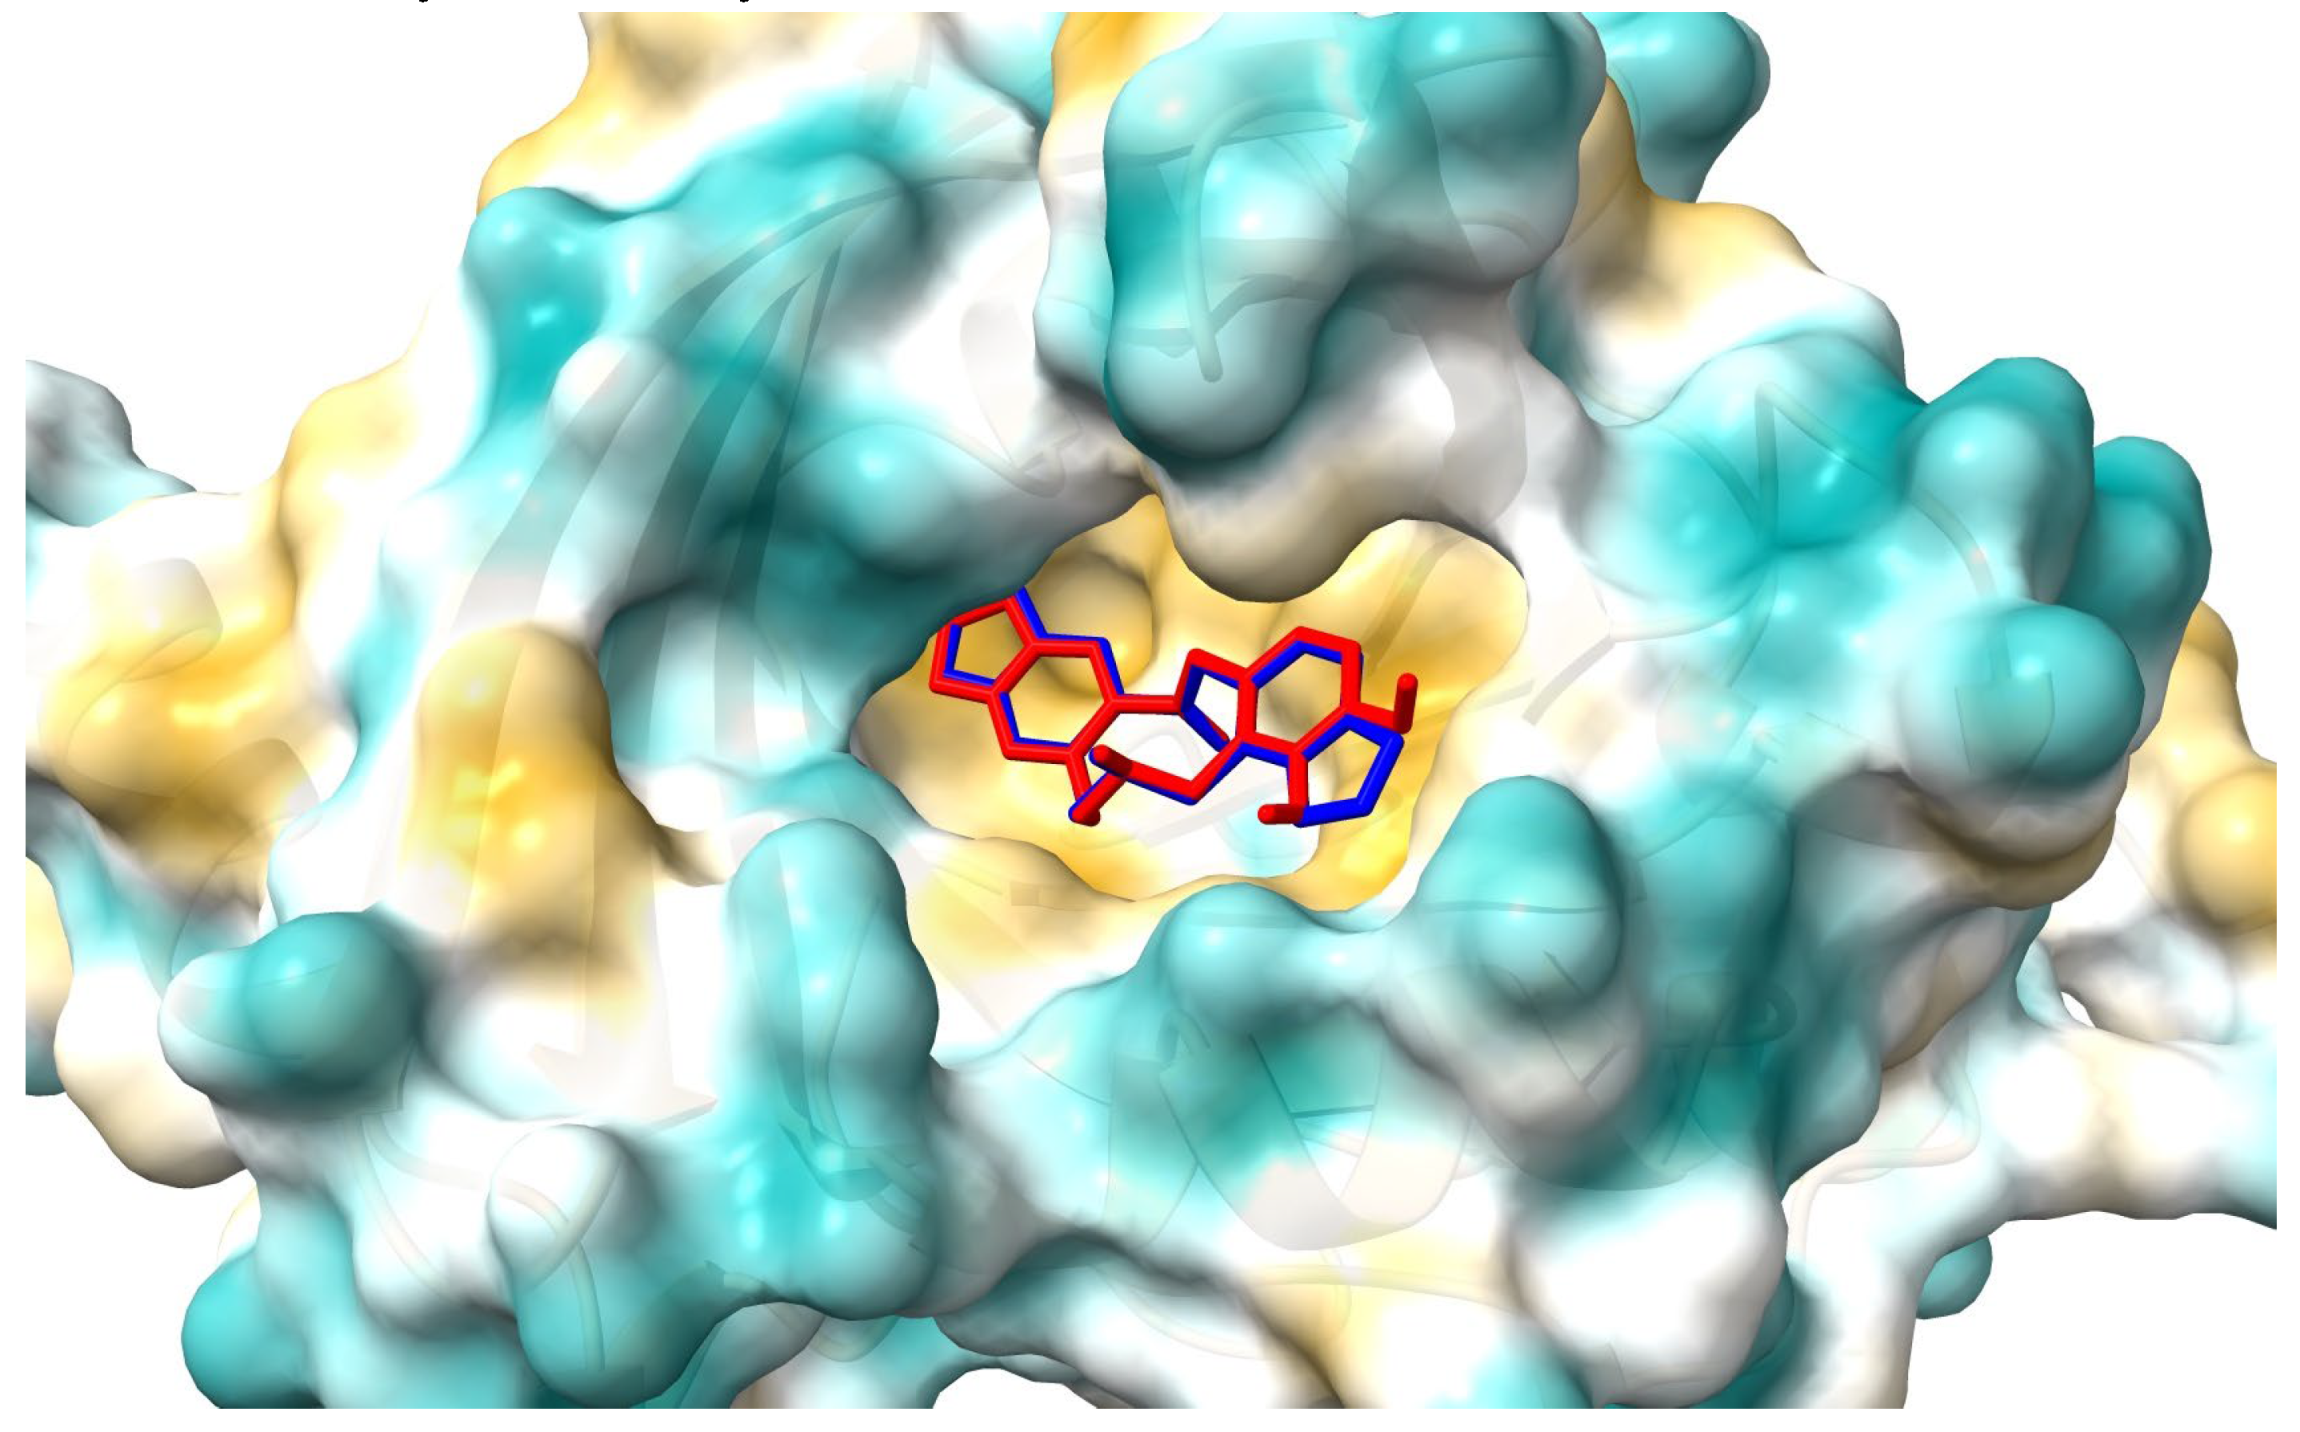
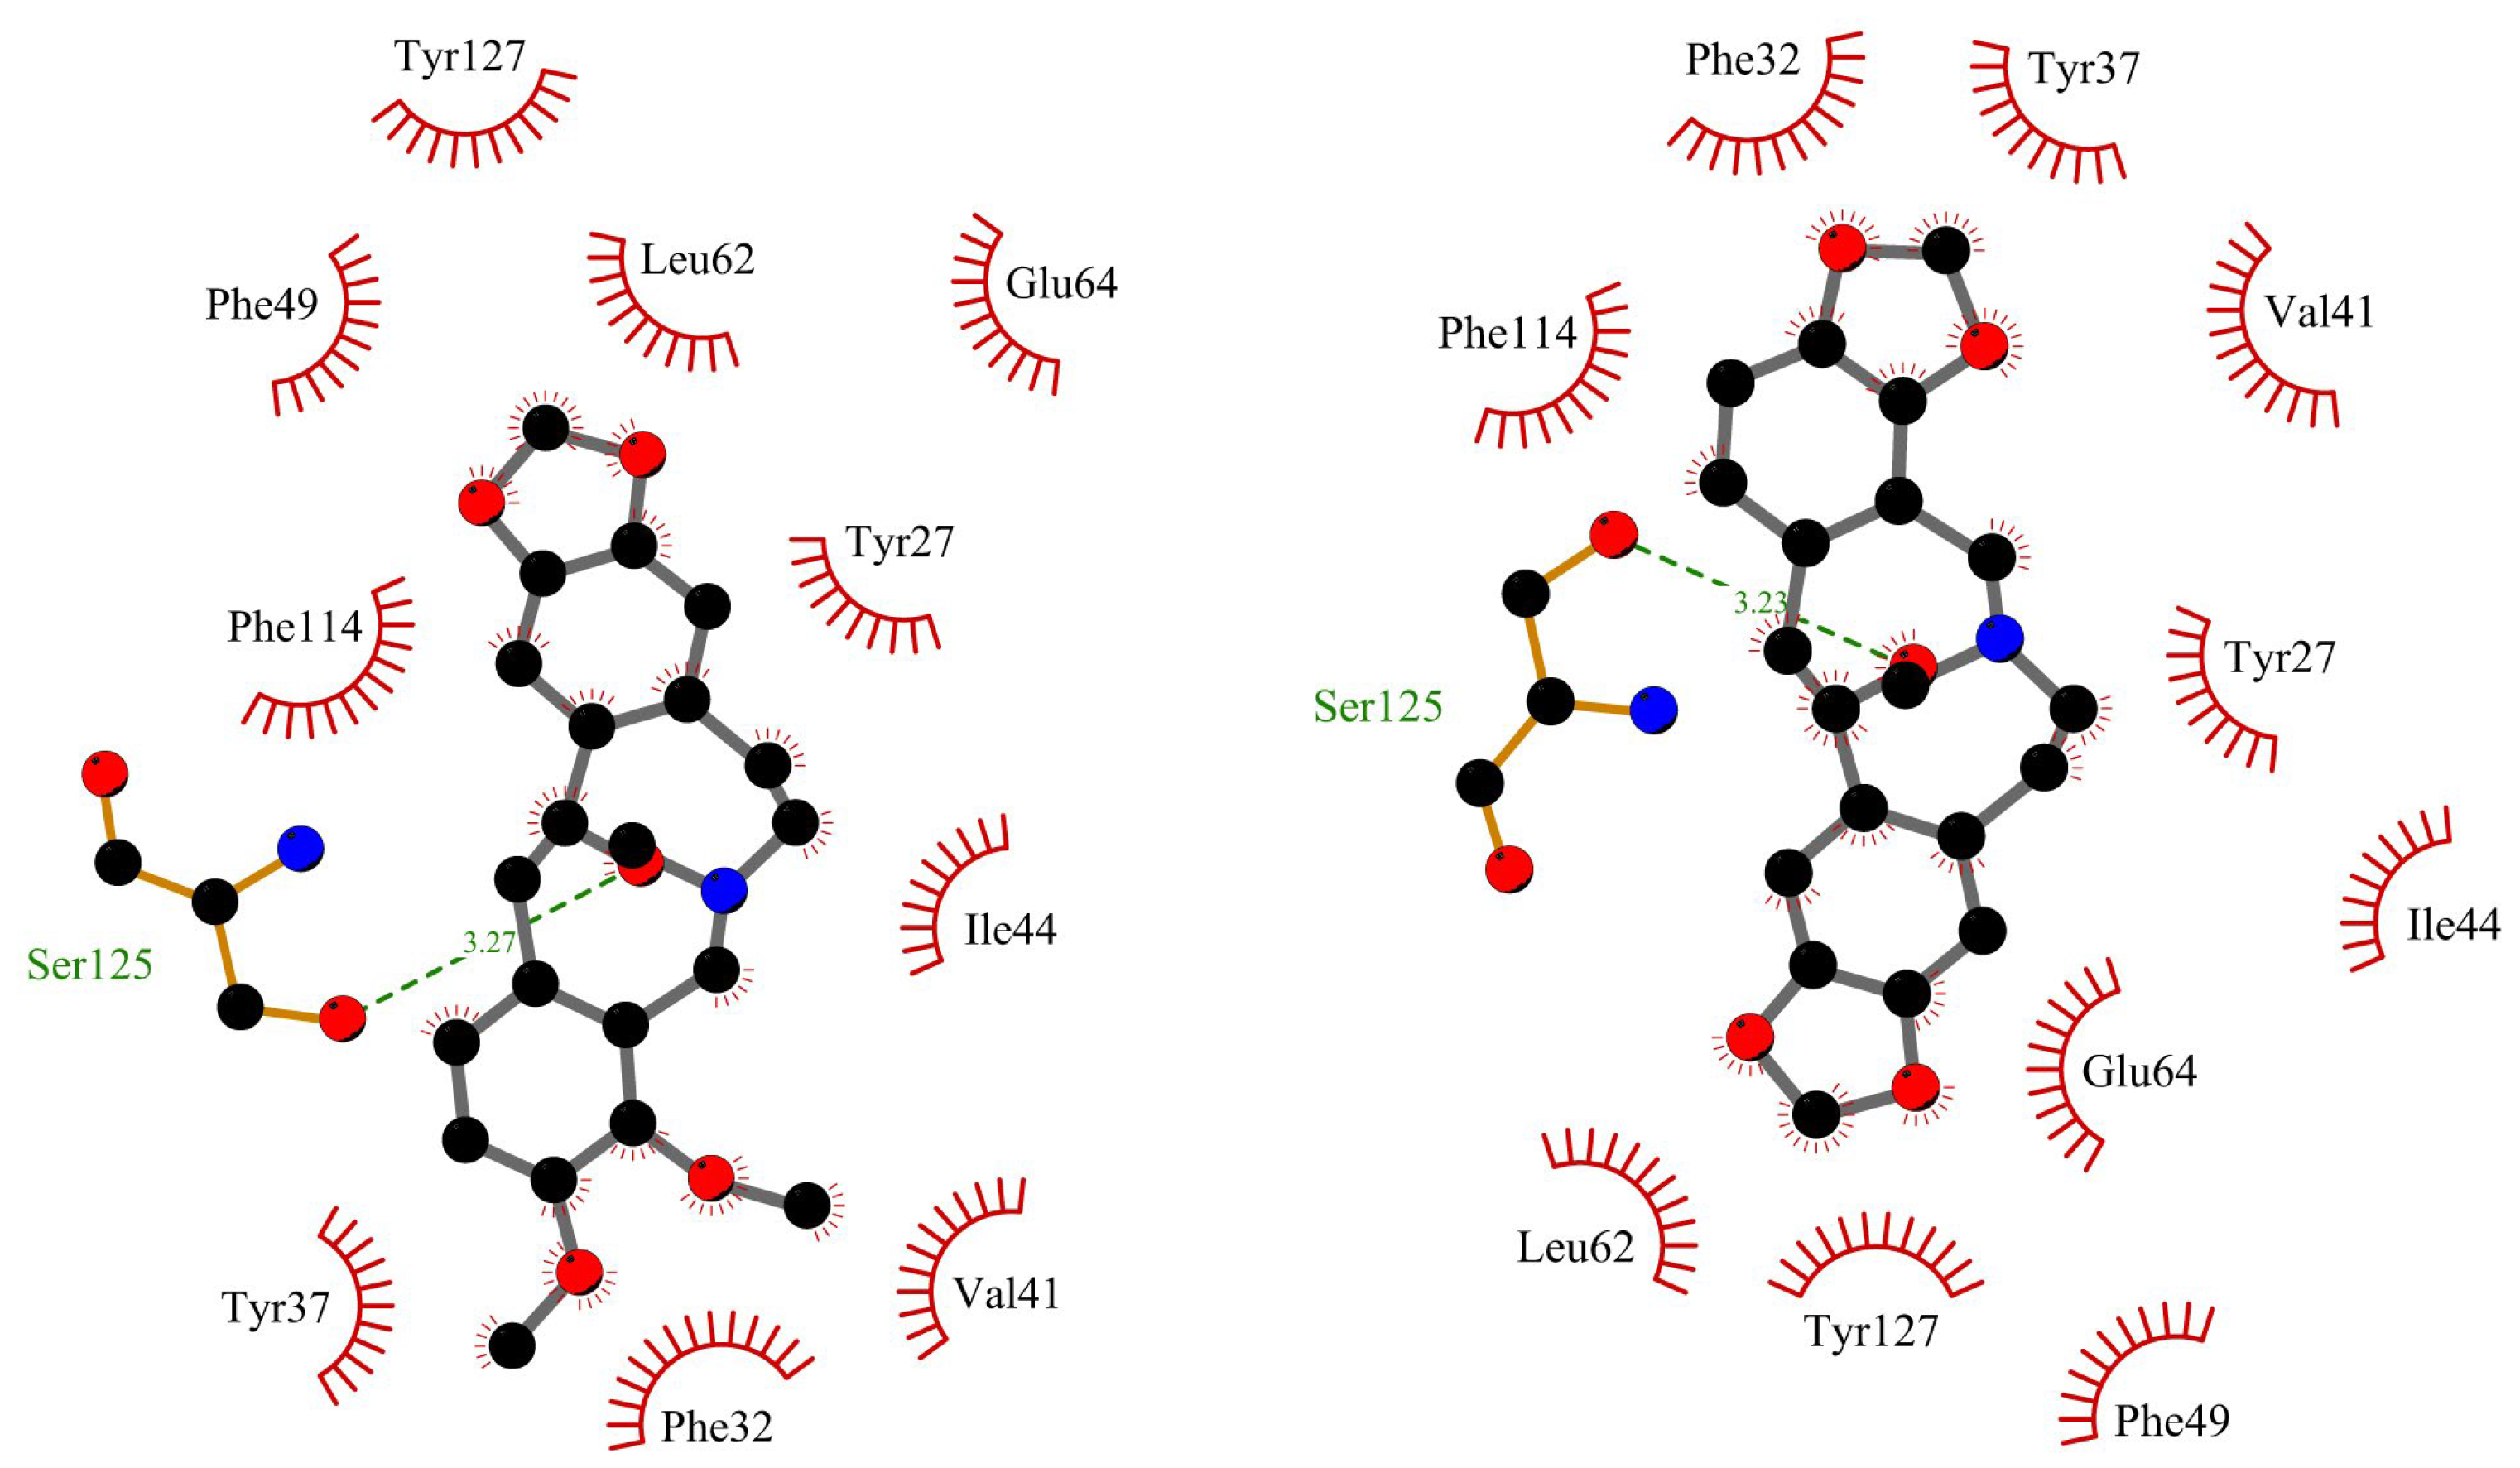
Figure 10 and
Figure 11 show the position of allocryptopine and protopine at α1-acid glycoprotein’s binding pocket and a 2D plot of interaction mode. The location in the cavity and the interactions for both compounds are very similar. 1,3-Benzodioxole moiety is situated deeper at the pocket and interacts with Phe49 (π-alkyl), Leu62 (alkyl), Tyr127 (π-donor). One hydrogen bond, between the oxygen atom at Ser125 and the carbonyl group of a middle 10-membered ring, is formed. The second 1,3-Benzodioxole ring (PP) or dimethoxyphenyl moiety (ACP) is located at the entrance to the pocket. The alkyl contacts with Tyr37, π-alkyl with Val, and π-π stacked with Phe32 were found.
2.3. The Changes in Protein Secondary Structures
We have also used the CD spectroscopy, which is a useful method to observe the protein spectra after the interaction with small molecules [
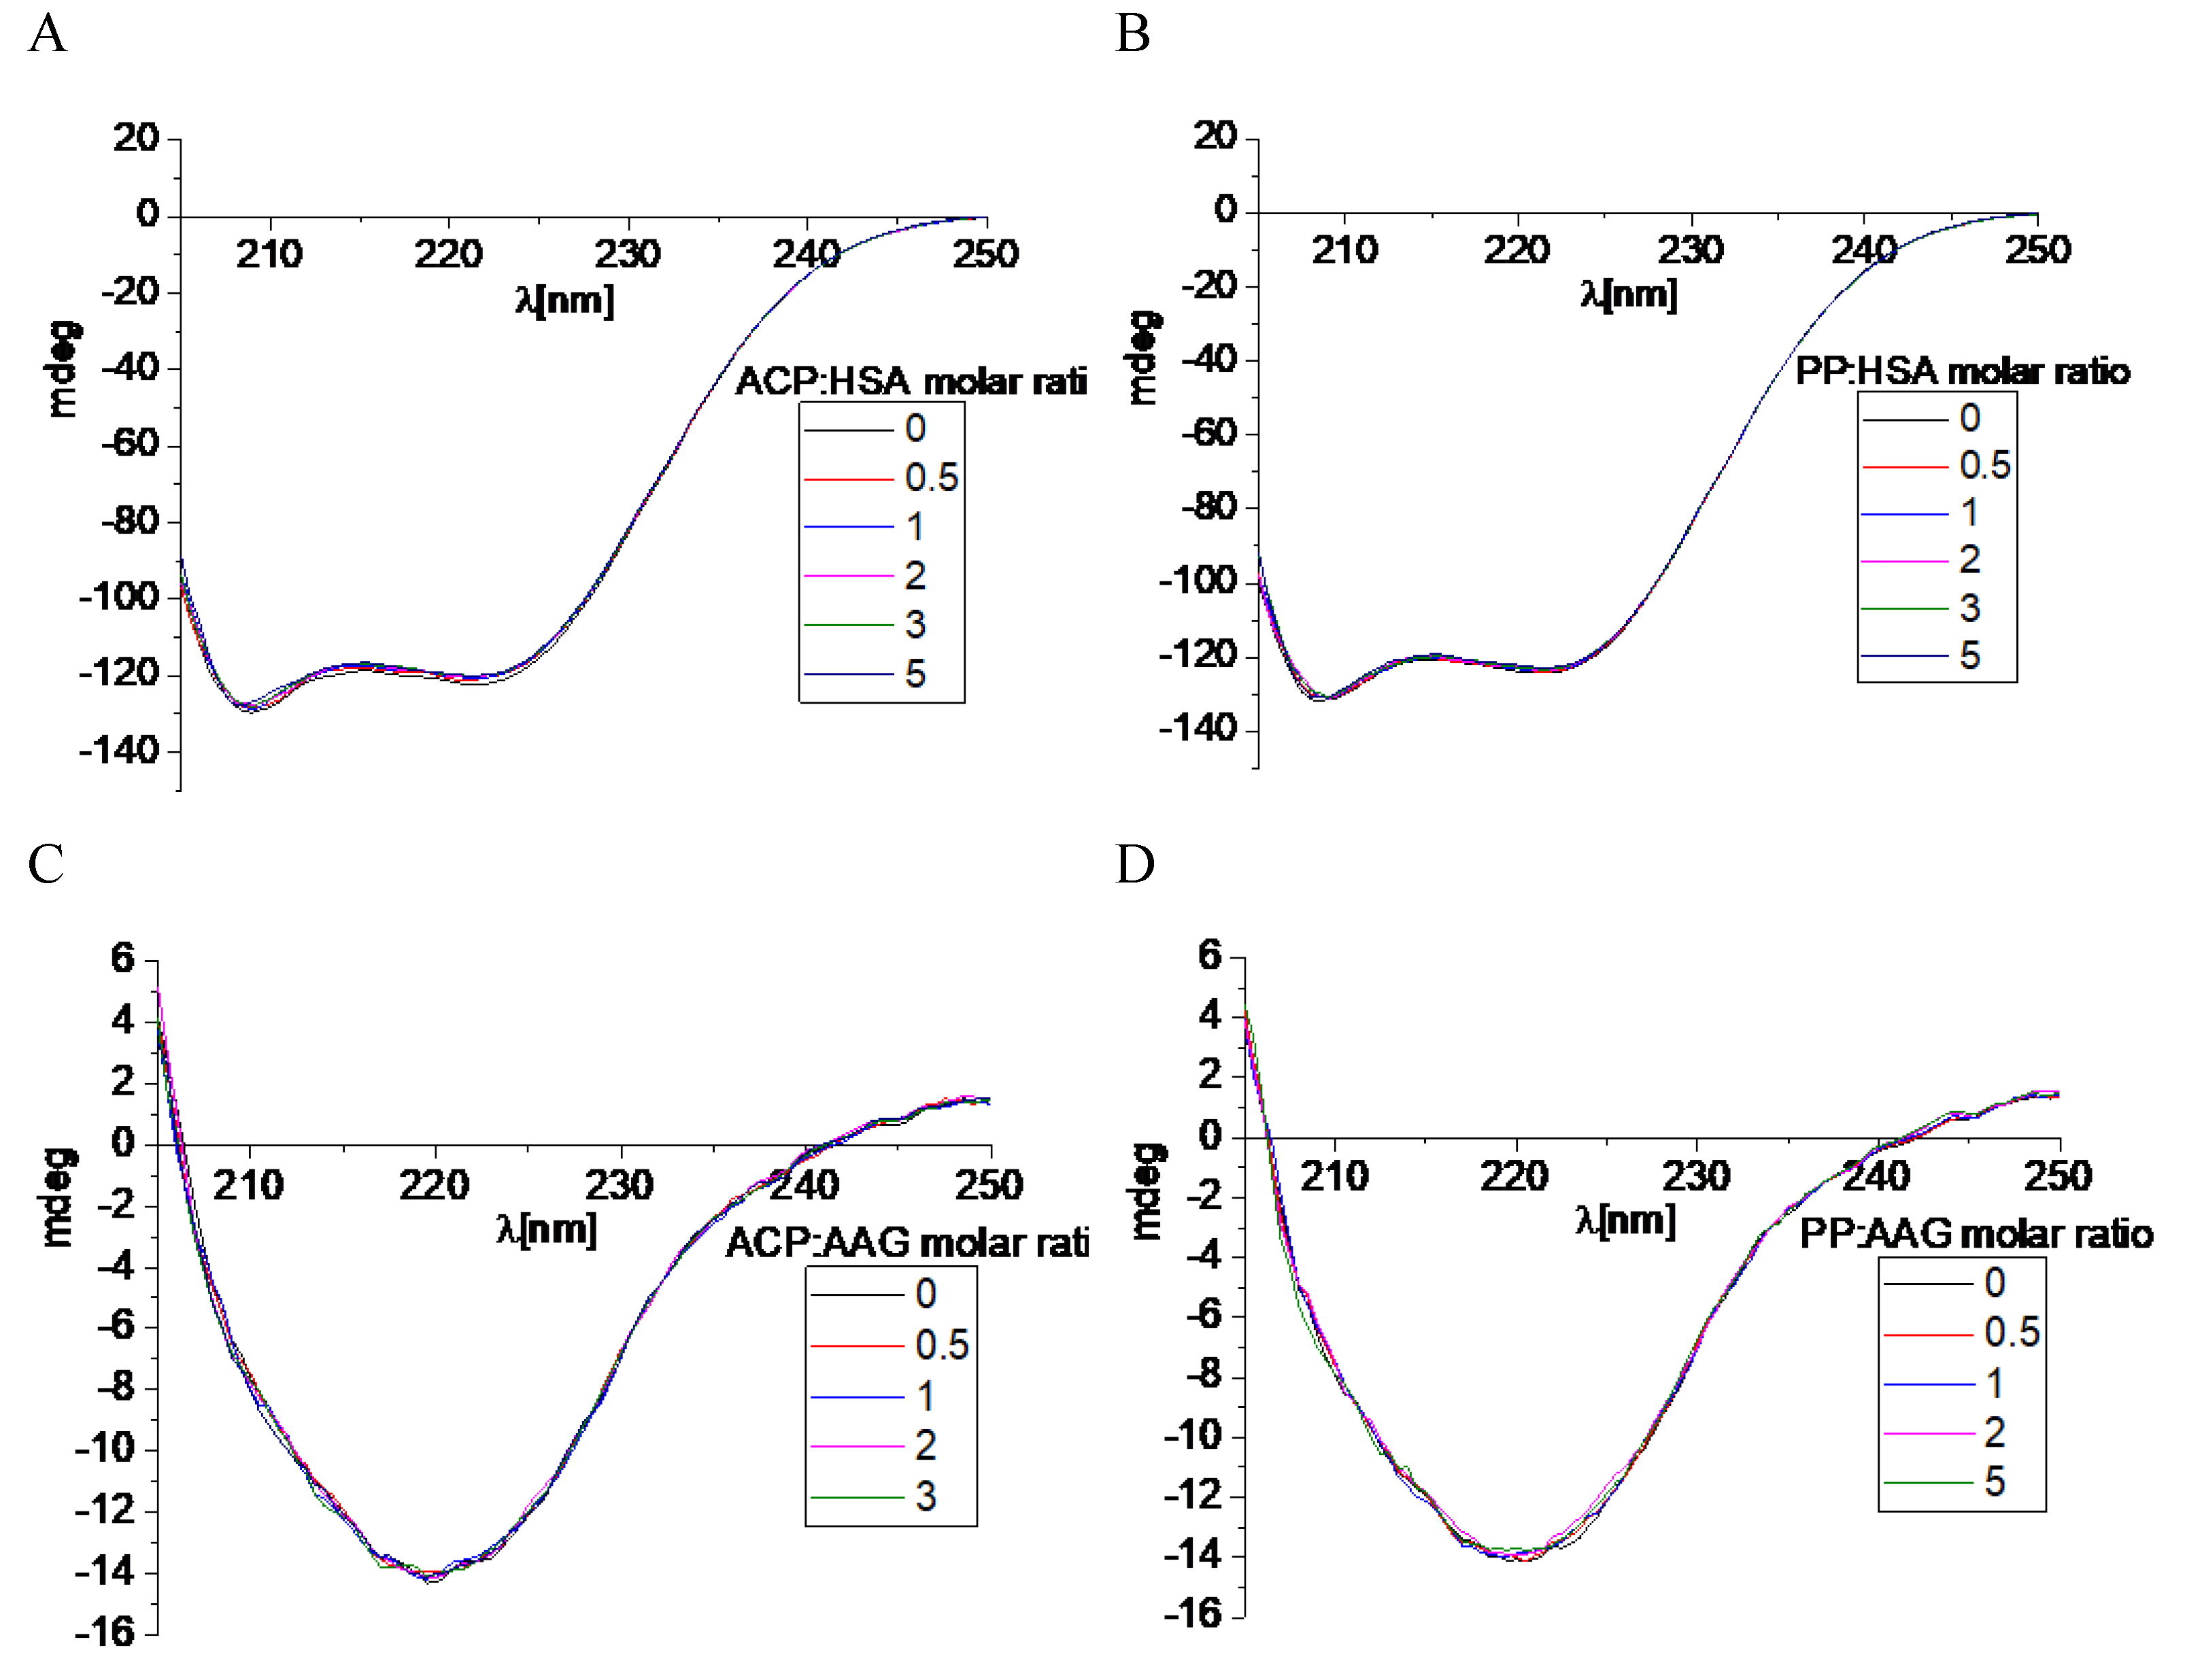
30]. This analytical technique allows to see every change in the secondary or tertiary structure which is manifested by changes in the course of the recorded spectrum. Both analyzed macromolecules: HSA and AAG show spectra characteristic of the predominant α-helix and β-sheet structures, respectively. Two negative bands were visible in the spectrum for albumin, located near 209 and 220 nm (
Figure 12). Whereas dominating β-sheet structure in the case of AAG was characterized by one negative band located around 220 nm (
Figure 12) [
31]. The CD spectra were also measured after adding a small portion of ACP and PP (
Figure 12). It was observed that with the increase of the alkaloid concentration, the course of the spectra practically did not change. The intensity of the bands shifted slightly towards less negative values.
Obtained results were analyzed also by the CD Multivariate SSE program. This analysis made it possible to calculate the percentage of individual forms of the secondary structure in protein molecules, both before the addition and during the increasing concentration of ACP and PP in the tested systems. Calculated values are summarized in
Table 4 and
Table 5. The obtained values also confirm the insignificant influence of ACP and PP on the secondary structure of the tested plasma proteins. The content of the α-helix in the HSA molecule decreases by 0.9% in the case of ACP and by 0.3% in the case of PP, with a five-fold excess of the analyzed alkaloids (
Table 4). In the case of AAG, this change is even smaller and amounts to 0.1% and 0.2% for ACP and PP, respectively (
Table 5). Therefore, summing up, the CD results clearly show that the formation of complexes between the tested alkaloids and plasma proteins does not affect the spatial structure of the analyzed macromolecules.
3. Discussion
The experimental investigation into the interactions between human serum albumin (HSA), α-1-acid glycoprotein (AAG), and the alkaloids allocryptopine (ACP) and protopine (PP) has provided valuable insights into the binding dynamics and affinities of these compounds. Both analyzed proteins have Trp residues in their sequences: one in HSA and three in AAG [
11]. Therefore, fluorescence spectroscopy could potentially be well-chosen method to determine how PP and ACP interact with analyzed macromolecules and to calculate the binding constants for the complexes formed. Unfortunately, the spectroscopic properties of the alkaloids selected for research stand in the way. Kubala and co-workers proved in their work that both protopine and allocryptopine exhibit the phenomenon of fluorescence at the excitation line of 285 nm [
15]. Unluckily, these are the same conditions used to excite protein fluorescence. Thus, it is not possible to observe the interaction between PP, ACP and analyzed plasma proteins with fluorescence spectroscopy because the effect for both groups of molecules overlaps. Therefore, these compounds have not yet been described in the literature in this aspect. For example, the extensive studies have been carried out on other isoquinoline alkaloids such as berberine, chelerythrine and sanguinarine. Data revealed that formation of berberine/HSA complexes is thermodynamically spontaneous, exothermic process with the association constant 4.071 ∙ 10
4 dm
3mol
-1 (close to the value obtained here for ACP) [
32]. Our study revealed that ACP and PP have negligible impact on the secondary structure of plasma proteins. Li et al. demonstrated that berberine affects the structure of protein through reduction of α-helix. The interactions of berberine in the Sudlow site I of HSA is primarily influenced by hydrophobic and electrostatic forces. Similarly, sanquinarine has been shown to interact with the HSA within subdomain IIA [
33]. The association constants in this case are equal 2.18 ∙ 10
5 dm
3mol
-1 and 5.97 ∙10
4 dm
3mol
-1, for alkanolamine and iminium form, respectively. The data also indicated that the most stabilizing factors are van der Waals interactions and hydrophobic forces. Interestingly, π-electrons of aromatic system of the alkanolamine form of alkaloid can interact with the positively charged binding sites of protein. The structural changes in the protein are influenced by decreasing the α-helix and increasing the random coil structure. Our experimental and computational findings demonstrated a stronger preference for protopine and allocryptopine to bind to site IIIA of the protein. In contrast, chelerythrine primarily interacted with the HSA at the Sudlow I site [
34]. The association constants for both, charged iminium and neutral alkanolamine form, respectively are equal 1.22 ∙ 10
6 dm
3mol
-1 and 1.87 ∙ 10
5 dm
3mol
-1. The iminium form of alkaloid primarily engages through electrostatic interactions, particularly in the exothermic binding process. Conversely, the hydrophobic forces are important in the endothermic binding of alkanolamine form within the protein’s binding cavity.
4. Materials and Methods
Materials
The powder plasma proteins: human serum albumin (HSA) (Sigma-Aldrich Chemie GmbH, St. Louis, MO, USA), and human α-1-acid glycoprotein (AAG) (Sigma-Aldrich Chemie GmbH, St. Louis, MO, USA) were used without other purification. The protein samples were prepared in phosphate buffer saline solution at pH = 7.4 (Sigma-Aldrich Chemie GmbH, St. Louis, MO, USA), and the concentration was 1∙10-6 M. The markers: dansylated-L-glycine (dGly), dansylated-L-phenylalanine (dPhe), and quinaldine red (QR) were dissolved in ethanol (Sigma-Aldrich Chemie GmbH, St. Louis, MO, USA), and stock solutions concentration were 1∙10-3 M. The stock solution of alkaloids was obtained by dissolving in absolute ethanol (Merck KGaA, Darmstadt, Germany) and the concentration was 1∙10-3 M.
Methods
UV absorption spectroscopy
The Jasco V750 spectrophotometer (Jasco, Japan) was used to record the absorption spectra. The measurements were carried out in the wavelength range 250 - 310 nm with 0.5 nm intervals, and the temperature was 297 K. All spectra were collected in quartz cells with a 10 mm path length. The baseline correction was made on the phosphate buffer solution. The proteins solution HSA or AAG were titrated by studied compounds ACP or PP to obtain following molar ratios of proteins HSA/AAG to alkaloids ACP/PP: 1:0.5, 1:1, 1:1.5, 1:2, 1:2.5, 1:3, 1:3.5, 1:4, 1:4.5, 1:5, 1:6, 1:7, 1:8, 1:9, 1:10. The changes in absorption peak were used to calculate the apparent association constants K
app by Benesi - Hilderbrand equation (E2) [
18]:
where A
obs – protein solution absorbance with different alkaloid content at 283 nm, α – the degree of association between protein and alkaloid, ɛ
p – protein molar absorptivity, ɛ
c – the complex molar absorptivity, c
0 – the initial protein concentration, l – the optical path length. Based on Lambert-Beer law the cɛl can be replaced by absorbance A, then the E2 equation takes the following form (E3):
where A
0 – the protein solution absorbance, A
c – the protein/alkaloid complex absorbance. The absorbance changes at 285 nm (HSA), and 283 nm (AAG) as a relation of double-reciprocal concentration is a linear function that allows to determine the constant K
app by UV data fitting to function (E4):
where c
a – the alkaloid concentration in each step. The number of binding sites n was estimated by Scatchard equation (E5) [
35]:
where r – the number of alkaloid moles bound to one mole of protein, c
f – the free concentration of compound, n – the number of equivalent binding sites by protein, K – the binding affinity constant. The standard Gibbs free energy (ΔG) for binding equilibrium was evaluated from equation (E6):
where R – gas constant 8.314 Jmol-1K-1, T – the temperature 298 K, K – binding constant.
Fluorescence spectroscopy
The Cary Eclipse 500 spectrophotometer (Agilent, Santa Clara, CA, USA) was used to perform the fluorescence studies. The measurements were carried out at 297 K and were conducted in a quartz cuvette with a 10 mm path length. The excitation wavelength for HSA with dansylated amino acids complexes was equal to 350 nm, whereas for the AAG/QR set 500 nm. The sample solution was prepared by mixing protein (HSA or AAG) with an equimolar marker (dGly or dPhe or QR) solution, then were added alkaloids (ACP or PP) in appropriate amounts. The percentage of exchange marker in the protein cavity were calculated by equation (E7):
where PMR – the percentage of marker replacement in blood plasma protein, F
0 – the steady-state fluorescence intensities of protein with marker solution, F is the steady-state fluorescence intensities after the addition of alkaloids.
Circular Dichroism spectroscopy
The Jasco J-1500 magnetic circular dichroism spectrometer (JASCO International CO., Tokyo, Japan) was used in circular dichroism spectroscopy. Spectra were collected at room temperature with a 10 nm path length. All HSA and AAG spectra, in the absence and presence of alkaloids, were baseline corrected. The range of scanning was 205–250 nm with a 50 nm/min scan rate speed and response time of 1 s. Three accumulations were used during all measurements. The 2 mL of the protein solution was used and a small portion of alkaloids (stock solution) was added to give the following molar ratios of PP/ACP to HSA/AAG: 0:1, 0.5:1, 1:1, 2:1, 3:1, 5:1. The percentage of content of the secondary structure elements in proteins was analyzed by CD Multivariate SSE programs (JASCO International CO., Tokyo, Japan) with the use of mean residue molar concentration of proteins.
In silico studies
3D ligand structures were optimized in Gaussian 2016 C.01 software package [
36]. The crystal structures of the HSA (2bxg) and AAG (1kq0) were taken from the RCSB PDB Protein Data Bank. Ligands and proteins were prepared using AutoDock Tools 1.5.6 [
37]. From the protein structure co-crystallized molecules and water were removed. Kollman partial charges and non-polar hydrogens have been added. The ACP and PP were prepared as follows: rotatable bonds were ascribed, nonpolar hydrogens were merged, and partial charges were added. AutoDockVina 1.1.2 [
38] was used for docking. The grid box was set according to the binding pocket site in the crystal structure. The docking protocol was first validated by self-docking of the crystallized ligands. The visualizations were done using ChimeraX 1.4 software [
39] and LigPlot + v.2.2 software [
40]. Gromacs 2021.2 software [
41] was used for molecular dynamic simulation. Charmm36m [
42] force field was applied. The topology and the ff parameters were generated using the CHARMM-GUI server [
43,
44]. Molecules were solvated in a regular box of TP water model, extended 10.0 Å beyond the protein structure, and neutralized by KCl (0.15M). The cut-off was set to 1.2 nm for long-range van der Waals and electrostatic interaction. After system energy minimization (5000 steps) the system was equilibrated for 125 ps. Next MD simulation was conducted for the period 100 ns with the step of 2 fs considering constant pressure of 1 bar and constant temperature of 303 K. The binding free energy ΔG
bind was calculated using the gmx_MMPBSA tool v.1.6.1 [
21].
5. Conclusions
The study effectively demonstrates that both ACP and PP can spontaneously bind to HSA and AAG, forming stable complexes, with ACP showing a higher affinity for both proteins.
Despite the initial setback encountered with fluorescence spectroscopy due to the overlapping spectral properties of the proteins and alkaloids, the use of UV-Vis spectroscopy, molecular docking, competitive binding assays, and circular dichroism (CD) spectroscopy has provided a multifaceted view of the binding dynamics. Additionally, the in silico investigations provided evidence for the preference of the site 2 (site IIIA) binding location of human serum albumin to both alkaloids, allocryptopine and protopine, compared to site 1 (site IIA). This preference was manifested through more negative docking energies, quicker and more stable complex formation during molecular dynamics simulations, and more favorable binding free energy profiles.
Our results not only enhance our understanding of the binding nature of these plant bioactive metabolites with HSA but also pave the way for future experimental validation to confirm these computational predictions. Moreover, these findings highlighted the potential implications of such interactions in natural-product based drug design and delivery, where protein binding plays a crucial role in the bioavailability and efficacy of therapeutics.
Author Contributions
Conceptualization, A.J.-D., Ż.C., S.Z., A.Marciniak (A.M.1), A.Matkowski (A.M.2)., A.K. and E.K.; methodology, A.M.1, A.K., E.K.; software, A.M.1, A.K., E.K.; validation, A.M.1, A.K., E.K..; formal analysis, A.M.1, A.K., E.K.; investigation, A.M.1, A.K., E.K., S.Z.; resources, Ż.C., S.Z.; data curation, A.M.1, A.K., E.K., S.Z.; writing—original draft preparation, A.M.1, A.K., E.K., Ż.C.; writing—review and editing, A.M.1, A.K., E.K., Ż.C., S.Z., M.B., W.K. A. M.2.; visualization, A.M.1. A.K., E.K.; supervision, A.M.1., A.K., E.K., Ż.C..; project administration, Ż.C., S.Z., A.M.2..; funding acquisition, A.J.-D. All authors have read and agreed to the published version of the manuscript.
Funding
This study was supported by Wroclaw Medical University grant no. SUBK.D030.23.023 to Anna-Jezierska-Domaradzka.
Acknowledgments
Edward Krzyżak gratefully acknowledges the allotment of the CPU time for calculations in the Wroclaw Center of Networking and Supercomputing (WCSS). Molecular graphics and analyses performed with UCSF ChimeraX, developed by the Resource for Biocomputing, Visualization, and Informatics at the University of California, San Francisco, with support from National Institutes of Health R01-GM129325 and the Office of Cyber Infrastructure and Computational Biology, National Institute of Allergy and Infectious Diseases. This study was supported by Wroclaw Medical University grant no. SUBK.D030.23.023 to Anna-Jezierska-Domaradzka.
Conflicts of Interest
The authors declare no conflict of interest.
Abbreviations
| AAG |
α-1-acid glycoprotein, orosomucoid |
| ACP |
allocryptopine |
| dGly |
dansylated-L-glycine |
| dPhe |
dansylated-L-phenylalanine |
| HSA |
human albumin serum |
| PP |
protopine |
| QR |
quinaldine red |
References
- Ghosh, T.; Bhadra, K. A mini review on human serum albumin - natural alkaloids interaction and its role as drug carrier. J. Biomol. Struct. Dyn. 2024, 1–18. [Google Scholar] [CrossRef] [PubMed]
- Khan, A.Y.; Suresh Kumar, G. Natural isoquinoline alkaloids: binding aspects to functional proteins, serum albumins, hemoglobin, and lysozyme. Biophysical Reviews 2015, 7, 407–420. [Google Scholar] [CrossRef] [PubMed]
- Liu, Y.; Chen, M.; Wang, S.; Lin, J.; Cai, L.; Song, L. New insight into the stereoselective interactions of quinine and quinidine, with bovine serum albumin. J. Mol. Recognit. 2014, 27, 239–249. [Google Scholar] [CrossRef] [PubMed]
- Nafisi, S.; Panahyab, A.; Bagheri Sadeghi, G. Interactions between β-carboline alkaloids and bovine serum albumin: Investigation by spectroscopic approach. J. Lumin. 2012, 132, 2361–2366. [Google Scholar] [CrossRef]
- Marszalek, M.; Konarska, A.; Szajdzinska-Pietek, E.; Wolszczak, M. Interaction of Cationic Protoberberine Alkaloids with Human Serum Albumin. No Spectroscopic Evidence on Binding to Sudlow’s Site 1. J. Phys. Chem. B 2013, 117, 15987–15993. [Google Scholar] [CrossRef] [PubMed]
- Sadeghi, M.; Miroliaei, M.; Taslimi, P.; Moradi, M. In silico analysis of the molecular interaction and bioavailability properties between some alkaloids and human serum albumin. Struct. Chem. 2022, 33, 1199–1212. [Google Scholar] [CrossRef]
- Khan, A.Y.; Hossain, M.; Kumar, G.S. Binding of plant alkaloids berberine and palmatine to serum albumins: a thermodynamic investigation. Mol. Biol. Rep. 2013, 40, 553–566. [Google Scholar] [CrossRef] [PubMed]
- Albani, J.R. Relation between the secondary structure of carbohydrate residues of α1-acid glycoprotein (orosomucoid) and the fluorescence of the protein. Carbohydr. Res. 2003, 338, 1097–1101. [Google Scholar] [CrossRef] [PubMed]
- Anderson, N.L.; Anderson, N.G. The human plasma proteome: history, character, and diagnostic prospects. Mol. Cell. Proteomics 2002, 1, 845–867. [Google Scholar] [CrossRef]
- Bteich, M. An overview of albumin and alpha-1-acid glycoprotein main characteristics: highlighting the roles of amino acids in binding kinetics and molecular interactions. Heliyon 2019, 5, e02879. [Google Scholar] [CrossRef]
- Owczarzy, A.; Zięba, A.; Pożycka, J.; Kulig, K.; Rogóż, W.; Szkudlarek, A.; Maciążek-Jurczyk, M. Spectroscopic studies of quinobenzothiazine derivative in terms of the in vitro interaction with selected human plasma proteins. Part 1. Molecules 2021, 26, 1–21. [Google Scholar] [CrossRef]
- Li, Y.; He, W.; Tian, J.; Tang, J.; Hu, Z.; Chen, X. The effect of Berberine on the secondary structure of human serum albumin. J. Mol. Struct. 2005, 743, 79–84. [Google Scholar] [CrossRef]
- Zhang, G.; Wang, Y.; Zhang, H.; Tang, S.; Tao, W. Human serum albumin interaction with paraquat studied using spectroscopic methods. Pestic. Biochem. Physiol. 2007, 87, 23–29. [Google Scholar] [CrossRef]
- Pignataro, M. F.; Herrera, M. G.; Dodero, V. I. Evaluation of Peptide/Protein Self-Assembly and Aggregation by Spectroscopic Methods. Molecules 2020, 25, 121–140. [Google Scholar] [CrossRef]
- Kubala, M.; Vacek, J.; Popa, I.; Janovská, M.; Kosina, P.; Ulrichová, J.; Trávníček, Z.; Šimánek, V. The Fluorescence Properties and NMR Analysis of Protopine and Allocryptopine. J. Lumin. 2011, 131, 1340–1345. [Google Scholar] [CrossRef]
- Antosiewicz, J.M.; Shugar, D. UV–Vis spectroscopy of tyrosine side-groups in studies of protein structure. Part 2: selected applications. Biophys. Rev. 2016, 8, 163–177. [Google Scholar] [CrossRef]
- Colver, J. The Protein Protocols Handbook, Walker, J.M., Ed.; Humana Press: New York, NY, 1996; ISBN 9781603272599.
- Benesi, H.A.; Hildebrand, J.H. A Spectrophotometric Investigation of the Interaction of Iodine with Aromatic Hydrocarbons. J. Am. Chem. Soc. 1949, 71, 2703–2707. [Google Scholar] [CrossRef]
- Birkett, D.J.; Myers, S.P.; Sudlow, G. Effects of fatty acids on two specific drug binding sites on human serum albumin. Mol. Pharmacol. 1977, 13, 987–992. [Google Scholar]
- Sudlow, G.; Birkett, D.J.; Wade, D.N. Further Characterization of Specific Drug Binding Sites on Human Serum Albumin. Mol. Pharmacol. 1976, 12. [Google Scholar]
- Valdés-Tresanco, M.S.; Valdés-Tresanco, M.E.; Valiente, P.A.; Moreno, E. Gmx_MMPBSA: A New Tool to Perform End-State Free Energy Calculations with GROMACS. J. Chem. Theory Comput. 2021, 17, 6281–6291. [Google Scholar] [CrossRef]
- Otagiri, M. A Molecular Functional Study on the Interactions of Drugs with Plasma Proteins. Drug Metab. Pharmacokinet. 2005, 20, 309–323. [Google Scholar] [CrossRef]
- Ryan, A.J.; Ghuman, J.; Zunszain, P.A.; Chung, C.; Curry, S. Structural basis of binding of fluorescent, site-specific dansylated amino acids to human serum albumin. J. Struct. Biol. 2011, 174, 84–91. [Google Scholar] [CrossRef] [PubMed]
- Kremer, J.M.H.; Wilting, J.; Janssen, L.H.M. Drug binding to human alpha-1-acid glycoprotein in health and disease. Pharmacol. Rev. 1988, 40, 1–47. [Google Scholar] [PubMed]
- Schley, J.; Müller-Oerlinghausen, B. Investigation of the binding of various tricyclic neuroleptics and antidepressants to alpha 1-acid glycoprotein. J. Pharm. Pharmacol. 1986, 38, 102–106. [Google Scholar] [CrossRef]
- Müller, W.E. Drug binding sites on human alpha-1-acid glycoprotein. Prog. Clin. Biol. Res. 1989, 300, 363–378. [Google Scholar] [PubMed]
- Imamura, H.; Maruyama, T.; Otagiri, M. Evaluation of quinaldine red as a fluorescent probe for studies of drug-alpha1-acid glycoprotein interaction. Biol. Pharm. Bull. 1993, 16, 926–929. [Google Scholar] [CrossRef] [PubMed]
- Hazai, E.; Visy, J.; Fitos, I.; Bikádi, Z.; Simonyi, M. Selective binding of coumarin enantiomers to human α1-acid glycoprotein genetic variants. Bioorg. Med. Chem. 2006, 14, 1959–1965. [Google Scholar] [CrossRef] [PubMed]
- Zsila, F.; Visy, J.; Mády, G.; Fitos, I. Selective plasma protein binding of antimalarial drugs to α1-acid glycoprotein. Bioorg. Med. Chem. 2008, 16, 3759–3772. [Google Scholar] [CrossRef]
- Li, Y.; He, W.; Liu, J.; Sheng, F.; Hu, Z.; Chen, X. Binding of the bioactive component Jatrorrhizine to human serum albumin. Biochim. Biophys. Acta-Gen. Subj. 2005, 1722, 15–21. [Google Scholar] [CrossRef]
- Maciążek-Jurczyk, M.; Morak-Młodawska, B.; Jeleń, M.; Kopeć, W.; Szkudlarek, A.; Owczarzy, A.; Kulig, K.; Rogóż, W.; Pożycka, J. The influence of oxidative stress on serum albumin structure as a carrier of selected diazaphenothiazine with potential anticancer activity. Pharmaceuticals 2021, 14. [Google Scholar] [CrossRef]
- Hu, Y.-J.; Liu, Y.; Xiao, X.-H. Investigation of the Interaction between Berberine and Human Serum Albumin. Biomacromolecules 2009, 10, 517–521. [Google Scholar] [CrossRef]
- Hossain, M.; Khan, A. Y.; Suresh Kumar, G. Study on the Thermodynamics of the Binding of Iminium and Alkanolamine Forms of the Anticancer Agent Sanguinarine to Human Serum Albumin. J. Chem. Thermodyn. 2012, 47, 90–99. [Google Scholar] [CrossRef]
- Bhuiya, S.; Haque, L.; Das, S. Association of Iminium and Alkanolamine Forms of the Benzo[c]Phenanthridine Alkaloid Chelerythrine with Human Serum Albumin: Photophysical, Thermodynamic and Theoretical Approach. New J. Chem. 2018, 42, 2180–2196. [Google Scholar] [CrossRef]
- Scatchard, G. The Attractions of Proteins for Small Molecules and Ions. Ann. N. Y. Acad. Sci. 1949, 51, 660–672. [Google Scholar] [CrossRef]
- Frisch, M.J.; Trucks, G.W.; Schlegel, H.B.; Scuseria, G.E.; Robb, M.A.; Cheeseman, J.R.; Scalmani, G.; Barone, V.; Petersson, G.A.; Nakatsuji, H.; et al. Gaussian~16 {R}evision {C}.01 2016. Available online: https://gaussian.com/citation/ (accessed on 1 June 2023).
- Morris, G.M.; Huey, R.; Lindstrom, W.; Sanner, M.F.; Belew, R.K.; Goodsell, D.S.; Olson, A.J. AutoDock4 and AutoDockTools4: Automated Docking with Selective Receptor Flexibility. J. Comput. Chem. 2009, 30, 2785. [Google Scholar] [CrossRef]
- Trott, O.; Olson, A.J. AutoDock Vina: Improving the speed and accuracy of docking with a new scoring function, efficient optimization, and multithreading. J. Comput. Chem. 2010, 31, 455–461. [Google Scholar] [CrossRef]
- Pettersen, E.F.; Goddard, T.D.; Huang, C.C.; Meng, E.C.; Couch, G.S.; Croll, T.I.; Morris, J.H.; Ferrin, T.E. UCSF ChimeraX: Structure visualization for researchers, educators, and developers. Protein Sci. 2021, 30, 70–82. [Google Scholar] [CrossRef]
- Laskowski, R.A.; Swindells, M.B. LigPlot+: Multiple LigandÀProtein Interaction Diagrams for Drug Discovery. J. Chem. Inf. Model 2011, 51, 26. [Google Scholar] [CrossRef] [PubMed]
- Abraham, M.J.; Murtola, T.; Schulz, R.; Páll, S.; Smith, J.C.; Hess, B.; Lindah, E. Gromacs: High performance molecular simulations through multi-level parallelism from laptops to supercomputers. SoftwareX 2015, 1–2, 19–25. [Google Scholar] [CrossRef]
- Huang, J.; Rauscher, S.; Nawrocki, G.; Ran, T.; Feig, M.; De Groot, B.L.; Grubmüller, H.; MacKerell, A.D. CHARMM36m: An improved force field for folded and intrinsically disordered proteins. Nat. Methods 2016, 14, 71–73. [Google Scholar] [CrossRef]
- Jo, S.; Kim, T.; Iyer, V.G.; Im, W. CHARMM-GUI: A web-based graphical user interface for CHARMM. J. Comput. Chem. 2008, 29, 1859–1865. [Google Scholar] [CrossRef] [PubMed]
- Lee, J.; Cheng, X.; Swails, J.M.; Yeom, M.S.; Eastman, P.K.; Lemkul, J.A.; Wei, S.; Buckner, J.; Jeong, J.C.; Qi, Y.; et al. CHARMM-GUI Input Generator for NAMD, GROMACS, AMBER, OpenMM, and CHARMM/OpenMM Simulations Using the CHARMM36 Additive Force Field. J. Chem. Theory Comput. 2016, 12, 405–413. [Google Scholar] [CrossRef] [PubMed]
Figure 1.
The changes in UV absorption spectra during the titration of: A) HSA by ACP, B) HSA by PP, C) AAG by ACP, D) AGG by PP.
Figure 1.
The changes in UV absorption spectra during the titration of: A) HSA by ACP, B) HSA by PP, C) AAG by ACP, D) AGG by PP.
Figure 2.
The UV absorption data analysis plot: the Benesi - Hildebrand for titration of HSA or AAG by A) ACP, B) PP, and the Scatcher plot for titration of HSA or AAG by C) ACP, and D) PP.
Figure 2.
The UV absorption data analysis plot: the Benesi - Hildebrand for titration of HSA or AAG by A) ACP, B) PP, and the Scatcher plot for titration of HSA or AAG by C) ACP, and D) PP.
Figure 3.
The backbone atoms RMDS plots during 100ns MD simulation for unliganded HSA and with ACP and PP docked at site 1 and site 2.
Figure 3.
The backbone atoms RMDS plots during 100ns MD simulation for unliganded HSA and with ACP and PP docked at site 1 and site 2.
Figure 4.
Rg plots of free HSA and for complex with ACP and PP docked at site 1 and site 2, during 100ns MD simulation.
Figure 4.
Rg plots of free HSA and for complex with ACP and PP docked at site 1 and site 2, during 100ns MD simulation.
Figure 5.
The fluorescence spectra of: A) HSA/dGly complex titrated by the studied compound ACP, B) HSA/dGly complex titrated by the studied compound PP, C) HSA/dPhe complex titrated by the studied compound ACP, D) HSA/dPhe complex titrated by the studied compound PP, E) AAG/QR complex titrated by the studied compound ACP, F) AAG/QR complex titrated by the studied compound PP.
Figure 6.
Location of allocryptopine (red) and protopine (blue) at the HSA binding site 2.
Figure 6.
Location of allocryptopine (red) and protopine (blue) at the HSA binding site 2.
Figure 7.
The 2D plot of interactions between allocryptopine (left) and protopine (right) with HSA at the binding site 2.
Figure 7.
The 2D plot of interactions between allocryptopine (left) and protopine (right) with HSA at the binding site 2.
Figure 8.
The backbone atoms RMDS plots during 100ns MD simulation for AAG, AAG-ACP, and AAG-PP.
Figure 8.
The backbone atoms RMDS plots during 100ns MD simulation for AAG, AAG-ACP, and AAG-PP.
Figure 9.
Rg plots during 100ns MD simulation for AAG, AAG-ACP, AAG-PP.
Figure 9.
Rg plots during 100ns MD simulation for AAG, AAG-ACP, AAG-PP.
Figure 10.
Location of allocryptopine (red) and protopine (blue) at the AAG pocket.
Figure 10.
Location of allocryptopine (red) and protopine (blue) at the AAG pocket.
Figure 11.
The 2D plot of interactions between allocryptopine (left) and protopine (right) with AAG.
Figure 11.
The 2D plot of interactions between allocryptopine (left) and protopine (right) with AAG.
Figure 12.
Circular dichroism spectra of HSA and AAG in the absence and presence of ACP and PP.
Figure 12.
Circular dichroism spectra of HSA and AAG in the absence and presence of ACP and PP.
Table 1.
The binding parameters for interaction between HSA and AAG proteins and analyzed ACP and PP alkaloids: the association constant (Kapp), n* - number of binding sites, the standard Gibbs free energy (ΔG), along with the percentage of hyperchromicity effect.
Table 1.
The binding parameters for interaction between HSA and AAG proteins and analyzed ACP and PP alkaloids: the association constant (Kapp), n* - number of binding sites, the standard Gibbs free energy (ΔG), along with the percentage of hyperchromicity effect.
| protein/alkaloid |
Kapp
[dm3mol-1] |
n* |
ΔG
[Jmol-1] |
% chromism |
| HSA/ACP |
5.02·104
|
0.97 |
-2.68·104
|
65.52 |
| HSA/PP |
2.13·104
|
0.77 |
-2.47·104
|
71.50 |
| AAG/ACP |
2.24·104
|
0.75 |
-2.48·104
|
73.50 |
| AAG/PP |
1.34·104
|
0.84 |
-2.35·104
|
81.93 |
Table 2.
The binding affinity (kcal/mol), calculated from molecular docking studies, and the binding free energy (kcal/mol), calculated from molecular dynamics simulations for HSA-ACP, HSA-PP, AAG-ACP, and AAG-PP systems.
Table 2.
The binding affinity (kcal/mol), calculated from molecular docking studies, and the binding free energy (kcal/mol), calculated from molecular dynamics simulations for HSA-ACP, HSA-PP, AAG-ACP, and AAG-PP systems.
| |
ACP |
PP |
| |
Binding Affinity |
Binding Free Energy |
Binding Affinity |
Binding Free Energy |
| HSA, site IIA |
−6.3 |
−17.6 |
−6.5 |
−12.3 |
| HSA, site IIIA |
−7.7 |
−20.1 |
−7.7 |
−18.4 |
| AAG |
−8.8 |
−17.0 |
−9.8 |
−23.3 |
Table 3.
The percentage of marker dPhe and QR replacement (PMR) in proteins HSA or AAG respectively, by the studied compounds ACP and PP. The PMR parameter was calculated according to equation E7.
Table 3.
The percentage of marker dPhe and QR replacement (PMR) in proteins HSA or AAG respectively, by the studied compounds ACP and PP. The PMR parameter was calculated according to equation E7.
molar ratio
HSA : dPhe : compound |
PMR |
| compound |
|---|
| ACP |
PP |
| 1:1:0.5 |
1.8 % |
1.3 % |
| 1:1:1 |
2.5 % |
1.5 % |
| 1:1:4 |
4.8 % |
1.6 % |
| 1:1:5 |
5.5 % |
3.2 % |
| 1:1:10 |
12.1 % |
6.7 % |
molar ratio
AAG : QR : compound
|
|
|
| 1:1:0.5 |
15.4 % |
13.0 % |
| 1:1:1 |
28.1 % |
20.1 % |
| 1:1:2 |
42.6 % |
29.2 % |
| 1:1:3 |
51.6 % |
35.3 % |
| 1:1:4 |
59.0 % |
41.1 % |
| 1:1:5 |
62.2 % |
44.1 % |
| 1:1:7 |
66.0 % |
46.4 % |
| 1:1:9 |
68.0 % |
48.7 % |
| 1:1:11 |
70.1 % |
50.4 % |
| 1:1:13 |
71.6 % |
52.7 % |
| 1:1:15 |
71.9 % |
53.7 % |
Table 4.
The percentage of the secondary structure elements in HSA in the absence and presence of ACP and PP. The values were calculated in the CD Multivariate SSE program.
Table 4.
The percentage of the secondary structure elements in HSA in the absence and presence of ACP and PP. The values were calculated in the CD Multivariate SSE program.
HSA: analyzed
ligand
molar ratio |
% α-helix |
% β-sheet |
% β-turn |
% other |
| ACP |
| 1:0 |
64.8% |
1.5% |
9.7% |
24.0% |
| 1:0.5 |
64.2% |
1.8% |
9.7% |
24.2% |
| 1:1 |
64.1% |
2.2% |
9.7% |
23.9% |
| 1:2 |
63.9% |
2.2% |
9.7% |
24.2% |
| 1:3 |
63.9% |
2.2% |
9.7% |
24.2% |
| 1:5 |
63.9% |
3.0% |
9.6% |
23.5% |
| PP |
| 1:0 |
65.7% |
0.5% |
9.7% |
24.1% |
| 1:0.5 |
65.7% |
1.1% |
9.6% |
23.6% |
| 1:1 |
65.6% |
1.3% |
9.6% |
23.5% |
| 1:2 |
65.4% |
1.1% |
9.6% |
23.8% |
| 1:3 |
65.7% |
1.9% |
9.5% |
22.9% |
| 1:5 |
65.4% |
1.6% |
9.6% |
23.4% |
Table 5.
The percentage of the secondary structure elements in AAG in the absence and presence of ACP and PP. The values were calculated in the CD Multivariate SSE program.
Table 5.
The percentage of the secondary structure elements in AAG in the absence and presence of ACP and PP. The values were calculated in the CD Multivariate SSE program.
AAG: analyzed
ligand
molar ratio |
% α-helix |
% β-sheet |
% β-turn |
% other |
| ACP |
| 1:0 |
20.6% |
36.0% |
10.7% |
32.7% |
| 1:0.5 |
20.5% |
35.8% |
10.8% |
32.9% |
| 1:1 |
20.6% |
35.5% |
10.9% |
33.0% |
| 1:2 |
20.7% |
36.3% |
10.7% |
32.3% |
| 1:3 |
20.7% |
35.8% |
10.8% |
32.7% |
| 1:5 |
20.5% |
35.5% |
10.8% |
33.1% |
| PP |
| 1:0 |
20.7% |
35.6% |
10.8% |
32.9% |
| 1:0.5 |
20.7% |
36.0% |
10.8% |
32.6% |
| 1:1 |
20.7% |
36.1% |
10.8% |
32.4% |
| 1:2 |
20.3% |
35.8% |
10.9% |
33.0% |
| 1:3 |
20.4% |
35.8% |
10.8% |
33.0% |
| 1:5 |
20.5% |
35.9% |
10.8% |
32.8% |
|
Disclaimer/Publisher’s Note: The statements, opinions and data contained in all publications are solely those of the individual author(s) and contributor(s) and not of MDPI and/or the editor(s). MDPI and/or the editor(s) disclaim responsibility for any injury to people or property resulting from any ideas, methods, instructions or products referred to in the content. |
© 2024 by the authors. Licensee MDPI, Basel, Switzerland. This article is an open access article distributed under the terms and conditions of the Creative Commons Attribution (CC BY) license (http://creativecommons.org/licenses/by/4.0/).
