Preprint
Article

Contrasting Disease Progression, Microglia Reactivity, Tolerance, and Resistance to Toxoplasma gondii Infection in Two Mouse Strains

Altmetrics

Downloads

117

Views

67

Comments

0

A peer-reviewed article of this preprint also exists.

Submitted:

18 April 2024

Posted:

22 April 2024

You are already at the latest version

Alerts
Abstract
Our study investigated the innate immune response to Toxoplasma gondii infection by assessing microglial phenotypic changes and sickness behavior as inflammatory response markers post-ocular tachyzoite instillation. Disease progression in Swiss albino mice was compared with documented outcomes in BALB/c mice using identical ocular route and parasite burden (2x10⁵ tachyzoites), with saline as control. Contrary to expectations, Swiss albino mice displayed rapid, lethal disease progression, marked by pronounced sickness behaviors and mortality within 11-12 days post-infection, while survivors showed no apparent signs of infection. Comparative analysis revealed T. gondii-infected BALB/c mice exhibited reduced avoidance of feline odors, while in-fected Swiss albino mice showed enhanced avoidance responses. There was a significant increase in microglial cells in the dentate gyrus molecular layer of infected Swiss albino mice compared to BALB/c mice and their respective controls. Hierarchical cluster and discriminant analyses iden-tified three microglial morphological clusters, differentially affected by T. gondii infection across strains. BALB/c mice exhibited increased microglial branching and complexity, while Swiss al-bino mice showed reduced shrunk microglial arbors, diminishing morphological complexity. These findings highlight strain-specific differences in disease progression and inflammatory reg-ulation, indicating lineage-specific mechanisms in inflammatory responses, tolerance, and re-sistance. These elements are critical in devising control measures for toxoplasmosis.
Keywords: 
Subject: Biology and Life Sciences  -   Neuroscience and Neurology

1. Introduction

Toxoplasma gondii (T. gondii) is a ubiquitous parasitic protozoan known to infect a wide range of warm-blooded animals, including humans. The prevalence of chronic T. gondii infections is notably high worldwide, with significant regional disparities. African countries exhibit the highest prevalence rates at 61.4%, followed by Oceania (38.5%), South America (31.2%), Europe (29.6%), U.S.A./Canada (17.5%), and Asia (16.4%) [1]. These numbers underscore the substantial burden of T. gondii infections globally, impacting budget allocations for the treatment of both acute and chronic cases [2,3]. Moreover, individuals of all ages are susceptible to these infections [4], with heightened risks for immunocompromised individuals and transplant recipients that can be fatal [5].

1.1. Host’s Immune Response, Tolerance, and Resistance

Upon infection, the host’s immune system is mobilized to restore homeostasis and combat the invading pathogen. The immune response can either present as resistance, aiming to eliminate the infectious agent, or as disease tolerance, aiming to alleviate the harmful impacts of the infection [6,7]. The innate immune system, in particular, plays a pivotal role in both resistance and disease tolerance by recognizing pathogen-associated molecular patterns (PAMPs) and then coordinating the inflammatory response [8]. Experimental studies employing murine models have shed light on the T. gondii evasion strategies against the host immune system and have emphasized the interplay between parasite virulence factors and host immune pathways [9,10,11]. While acute infections are typically controlled, chronic infections may persist, leading to cyst formation, particularly within the brain [12,13]. Thus, disease progression and the associated neuropathology are inextricably linked to the host immune response and highlight the central role of inflammatory modulation [14,15,16], with Toxoplasma gondii effectors contributing to the regulation of host inflammatory responses [17].

1.2. Sickness Behavior and Microglial Response

Sickness behavior, encompassing a range of behavioral changes in response to infections, is an adaptive strategy mediated by pro-inflammatory cytokines [18,19]. In murine models, the acute infection-induced sickness behavior is characterized by observable symptoms, such as altered posture, anhedonia, and increased immobility time underpinned by the systemic molecular and cellular response to infection [20]. At the same time, long-term behavioral alterations are associated with sustained neuroinflammation (e.g., Iba1 microglia immunoreactivity and inflammatory cerebral perivascular cuffs) [21,22]. Microglia make up around 7% of non-neuronal cells in various brain structures and in the entire brain of all mammalian species that have been studied so far [23]. Despite their small percentage, microglia are known for their diverse phenotype and significant contributions to maintaining the homeostasis of the central nervous system [24].
When the microglia cells respond to an injury, whether it’s acute or chronic, they change their functional and morphological characteristics [25,26,27,28]. These changes seem to vary depending on the region [29,30] and the species [31,32], and they are regulated by a variety of stimuli that can occur in both healthy and diseased states [33,34,35]. Microglia cells play a crucial role in the pathological progression of all brain diseases [27], and they exhibit multiple morpho-functional characteristics in response to them. It has been demonstrated that reactive microglia increase IL-1β expression levels, and this is correlated with different morphotypes of microglia that have been identified by hierarchical cluster analysis of morphometric parameters [36,37].
Microglia, as the principal immune effectors within the brain, play a crucial role in mediating sickness behaviors and serve as indicators of neuroinflammatory responses [35,36,38], which may exert adaptive or maladaptive effects, depending on the context [39]. Investigating the influence of parasites on innate mouse behavior and olfactory preferences in this context provides valuable insights into the interplay between host behavior and immune responses [40].

1.3. Microglia and Toxoplasmosis

During T. gondii infection, immune sensors recognize parasite components, triggering the production of pro-inflammatory mediators [41]. Interferon-γ emerges as a key mediator of resistance against T. gondii and has a crucial role in the transition from acute to chronic infection stages [42,43]. Notably, behavioral changes associated with T. gondii infection are linked to distinct stages of the parasite lifecycle [44,45], with encysted bradyzoites implicated in modulating host behavior [46,47]. Microglia respond to T. gondii infection by producing immune mediators and interacting with lymphocytes, contributing to acquired immunity [48]. Moreover, chronic T. gondii infection elicits morphological and numerical changes in microglia, associated with altered behavioral responses [49].
The complex relationship between the immune responses of the host, their behavior when sick, and the dynamics of microglia during T. gondii infection highlights the multifaceted nature of interactions between hosts and parasites. By investigating these mechanisms, we can better understand the pathogenesis of T. gondii and identify potential therapeutic targets to reduce the impact of toxoplasmosis on the health and behavior of the host. By correlating microglial reactivity with sickness behavior in two distinct mouse strains this study aims to elucidate the role of inflammatory regulation in host tolerance and resistance to T. gondii infection.

2. Results

2.1. Comparative Microglial Numerical Changes in control and T. gondii Infected Mice

The comprehensive analysis of microglial counts in both control and infected albino Swiss mice, presented in Table 1, reveals that ocular infection with T. gondii at 12 days post-infection (dpi) significantly increases the microglial population within the molecular layer of the dentate gyrus. In contrast, BALB/c mice infected with the same pathogen also exhibited changes in microglial numbers, albeit to a lesser extent and at a later time point (22 dpi).
Infected albino Swiss mice showed a significant 1.6-fold increase in the total microglia compared to the control mice. This increase indicates a strong microgliosis induction in the dentate gyrus’s molecular layer 12 days post-infection. The control mice had an estimated total of 4,862 ± 932 microglia, while the infected mice had an estimated 7,959 ± 917 microglia. The two-tailed t-test showed t = -5.54, p = 0.0004, and Cohen’s effect size D = 3.35, considered a significant and large effect. The Cohen’s effect size for BALB/c was also significant (> 0.8). The control mice had an estimated total of 4,349 ± 1,171 microglia, while the infected mice had an estimated 5,870 ± 531 microglia, with t = -2.6, p = 0.03, and D = 1.8. However, the effect size for BALB/c was approximately half of what was observed in albino Swiss mice. For a more detailed analysis of the numerical changes in microglia within the BALB/c lineage, please refer to the study published elsewhere [49].

2.2. Behavioral Changes

- Mouse preferences in the three-chambers olfactory test and in the open arena
At the acute stage of the disease, all infected Swiss albino mice exhibited classic sickness behaviors, including ruffled fur, reduced locomotor activity, tremors, and a hunched posture, though the severity varied. Of the 21 Swiss albino mice, five succumbed to the infection on the 11th day post-infection. The surviving 16 mice underwent behavioral testing and were euthanized on the 12th day post-infection for neuropathological analysis. In contrast, the BALB/c mice (n = 27) infected with the same pathogen did not show typical acute sickness behaviors but did exhibit increased immobility.
In the olfactory test, the BALB/c mice spent more time in the compartment containing feline feces, in contrast to albino Swiss mice that exhibited reduced = time in such environments as shown in Figure 1A. This suggests differing responses to feline odours between the two strains. Both strains exhibited similar tendencies in the open field test, with a preference for staying within the peripheral space rather than venturing into the center (Figure 1B). Regarding locomotor activity, infected BALB/c mice showed an increase in immobility when compared to their uninfected counterparts, whereas no significant difference in immobility time was observed between infected and uninfected albino Swiss mice (Figure 1C).
These observations of behavioral changes, both similar and contrasting, among the strains are paralleled by a significant increase in the number of microglia in the molecular layer of the dentate gyrus, as illustrated in Figure 1D.

2.3. Microglial Morphotypes in T. gondii Infected and Control Mice

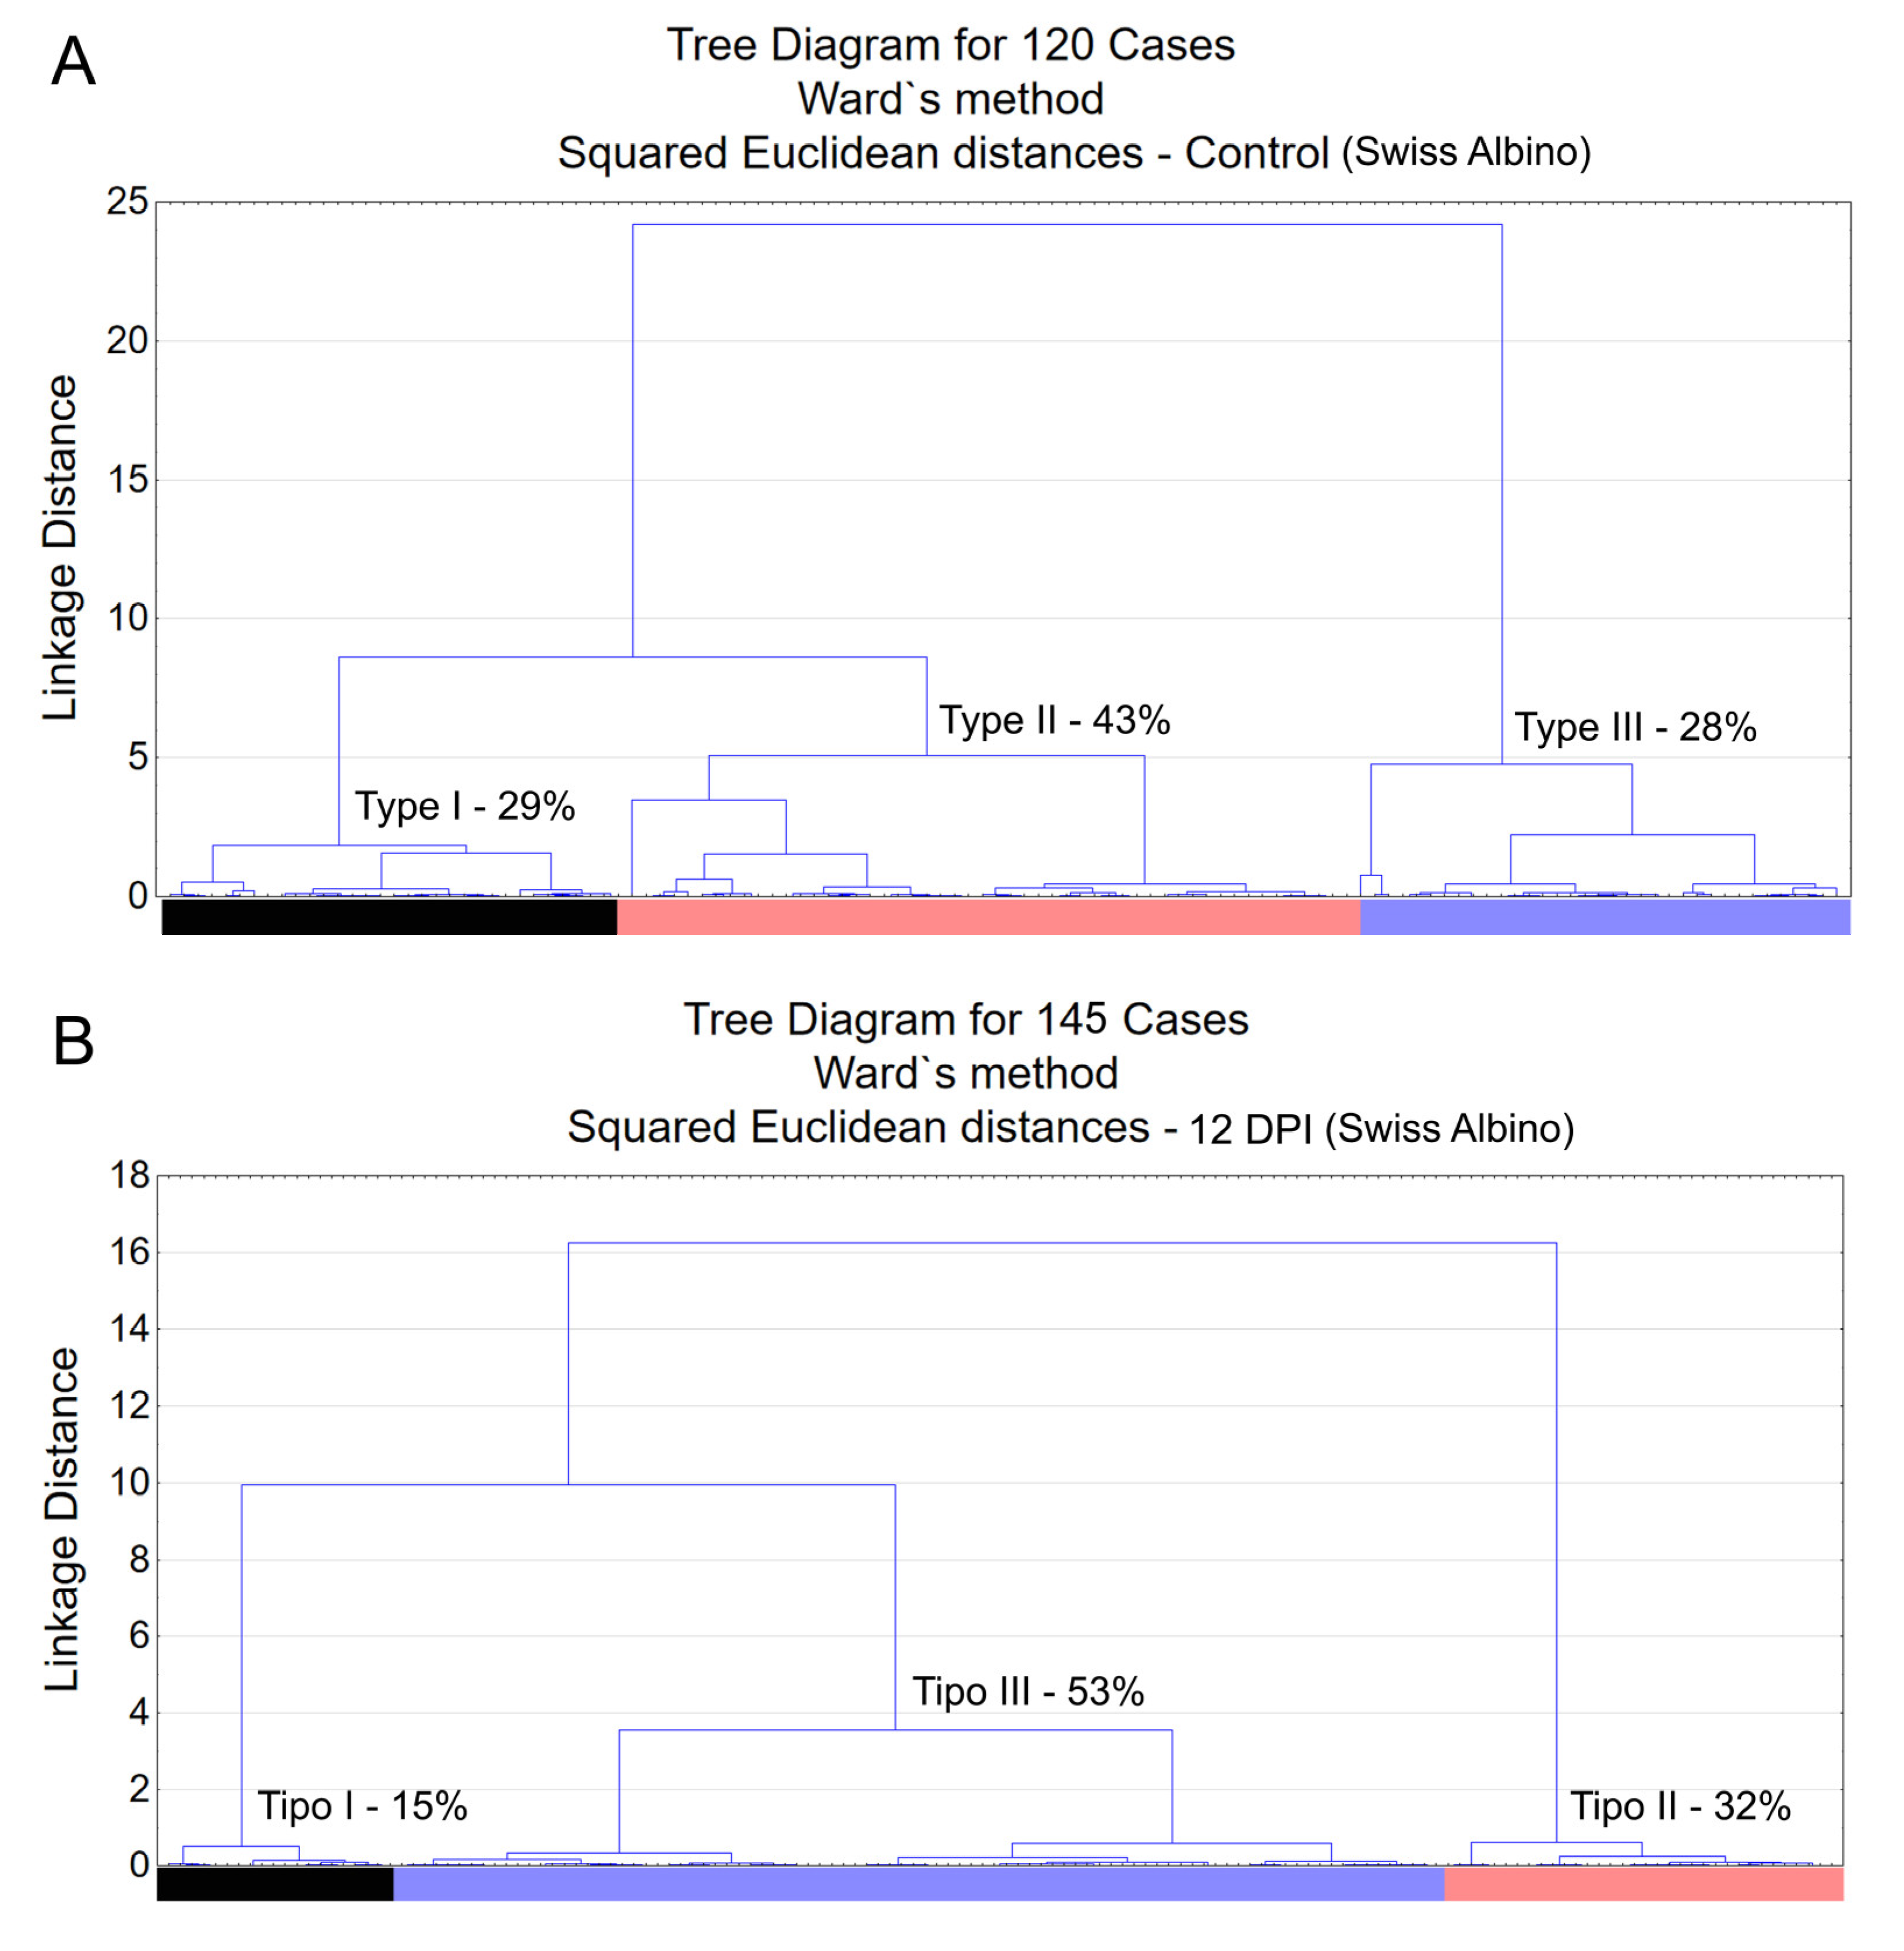
Morphological analysis of immunostained microglia revealed three distinct types of microglia: Type I, Type II, and Type III, as shown in Figure 2. These types represent varying morphological families of microglia, differing in convex hull volume and complexity. In Swiss albino mice infected with T. gondii, there was a notable decrease in both convex hull volume and morphological complexity of microglia compared to controls. This reduction was key to understanding cluster formation within the experimental groups. A pivotal observation was the altered distribution of microglia types in infected mice, with an increase in Type III and a decrease in Types I and II, suggesting changes in microglial reactivity indicative of neuroinflammation.
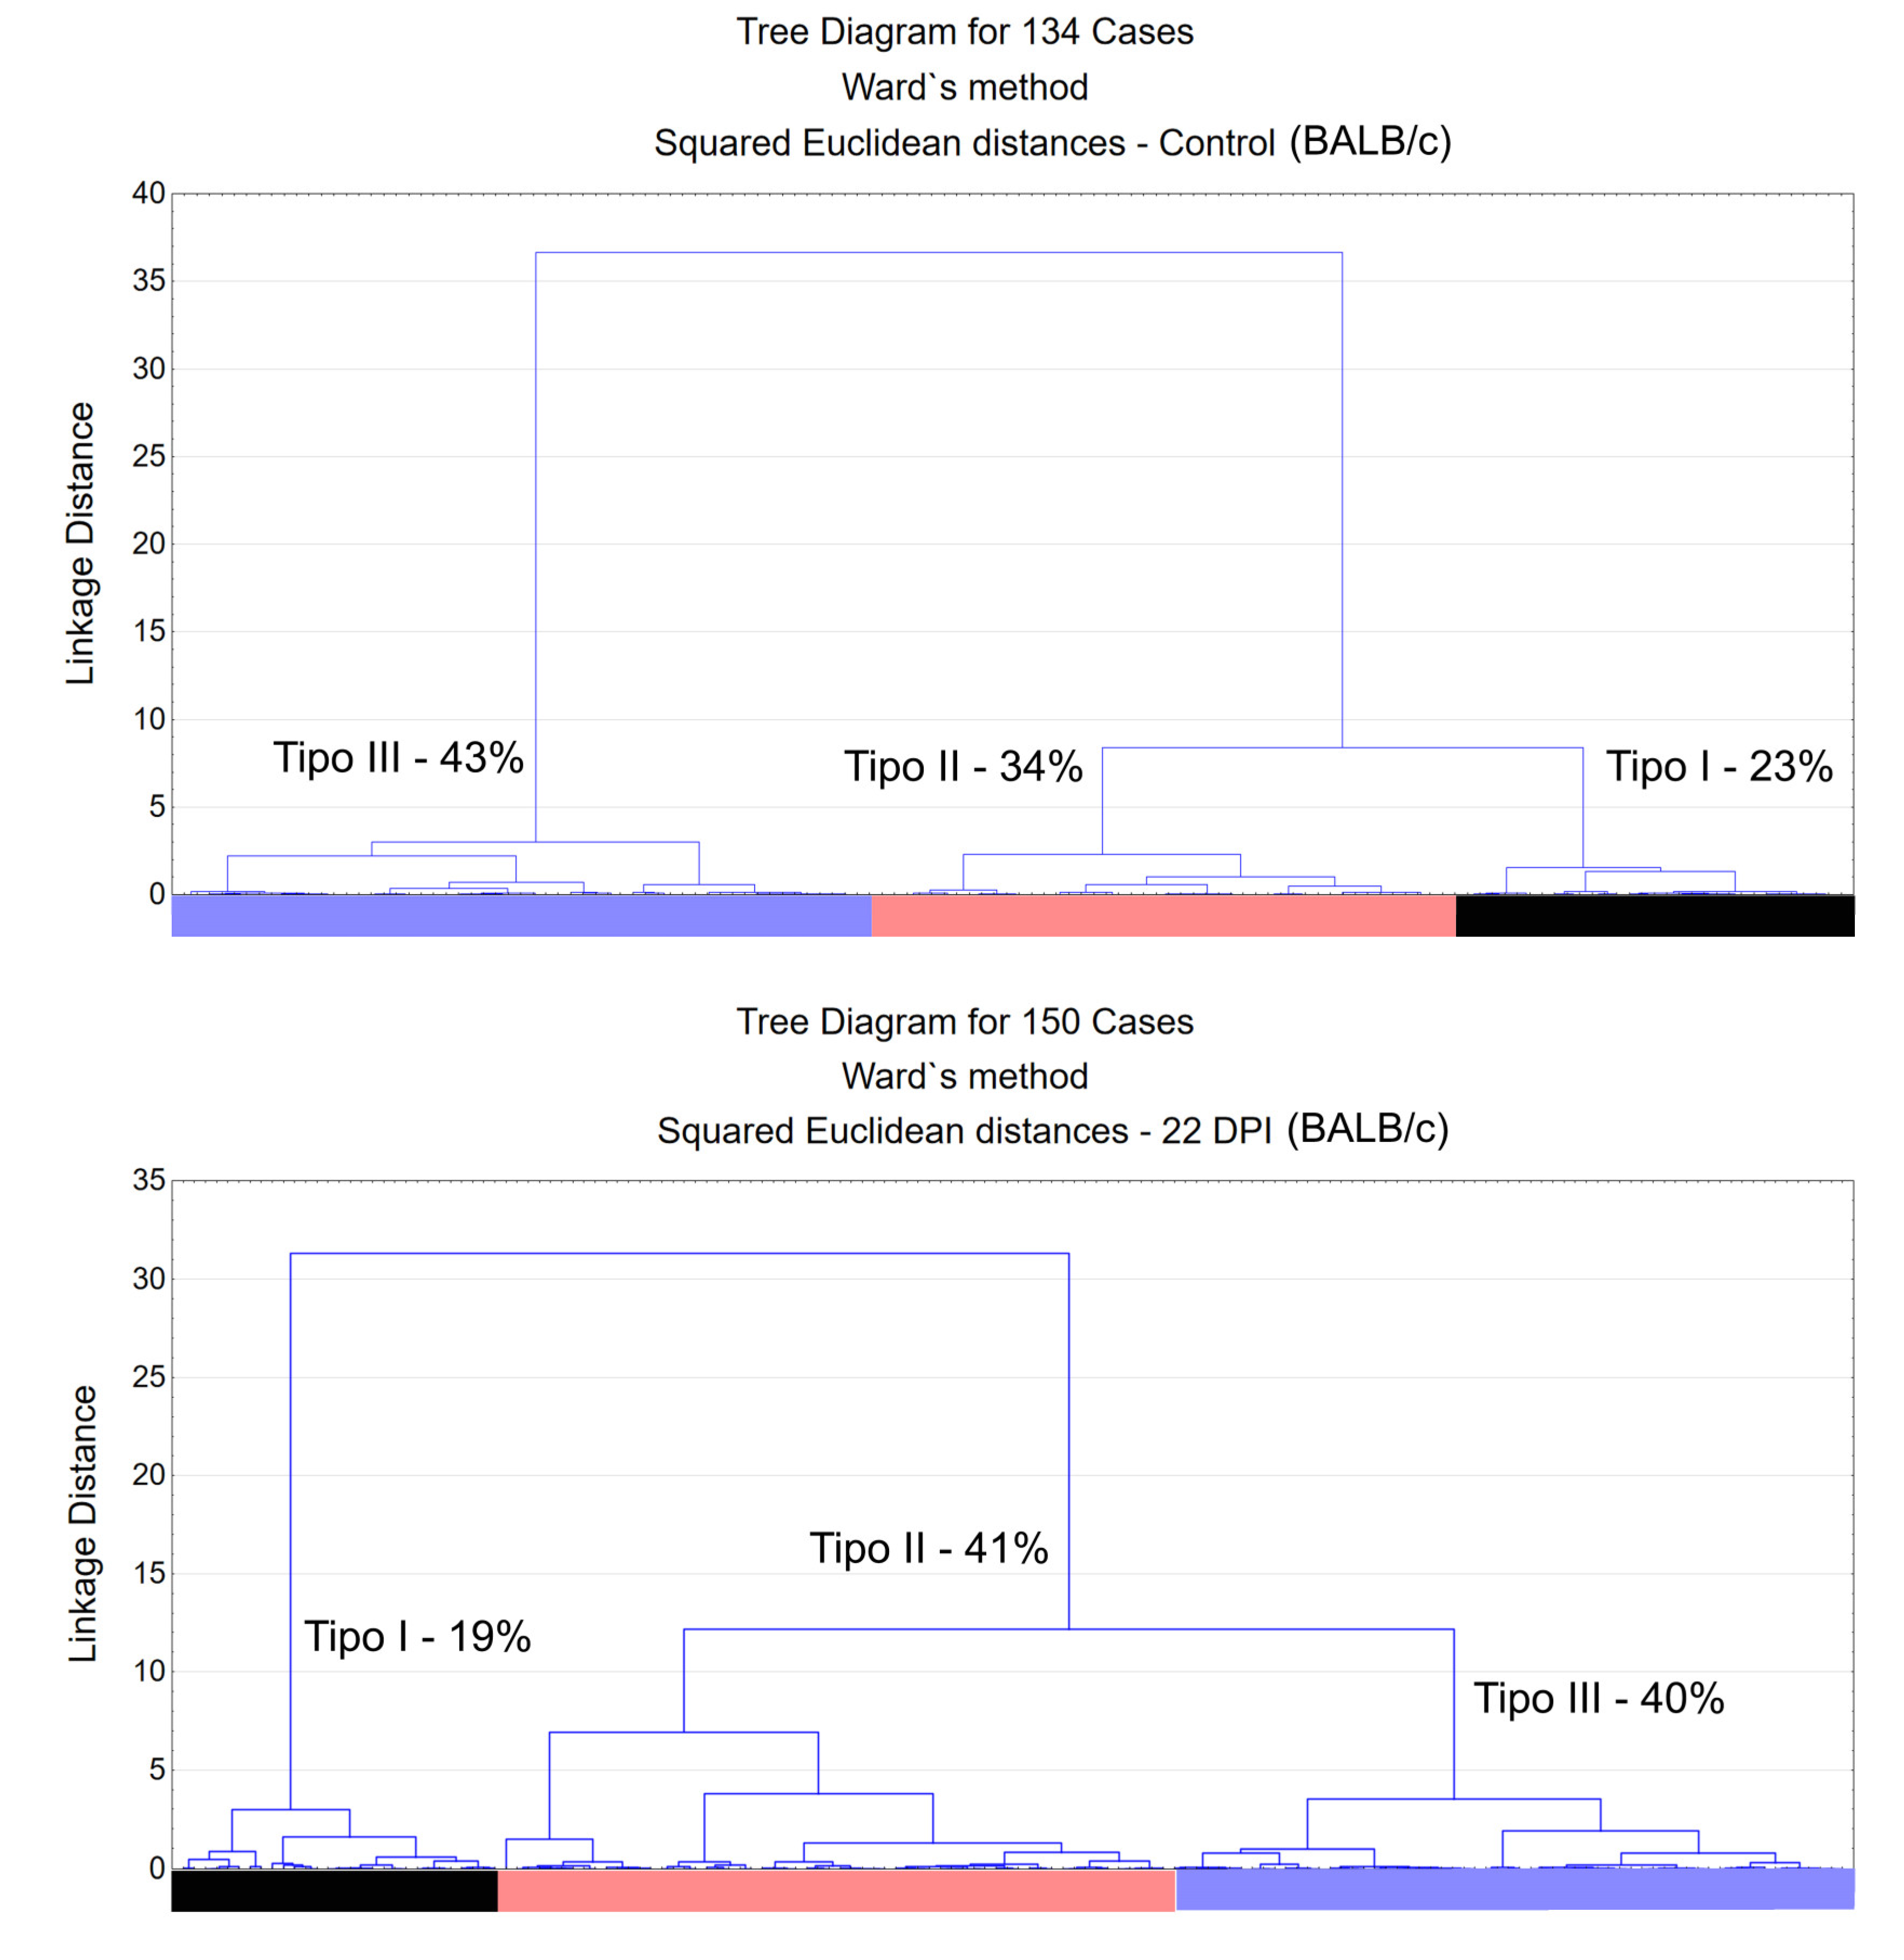
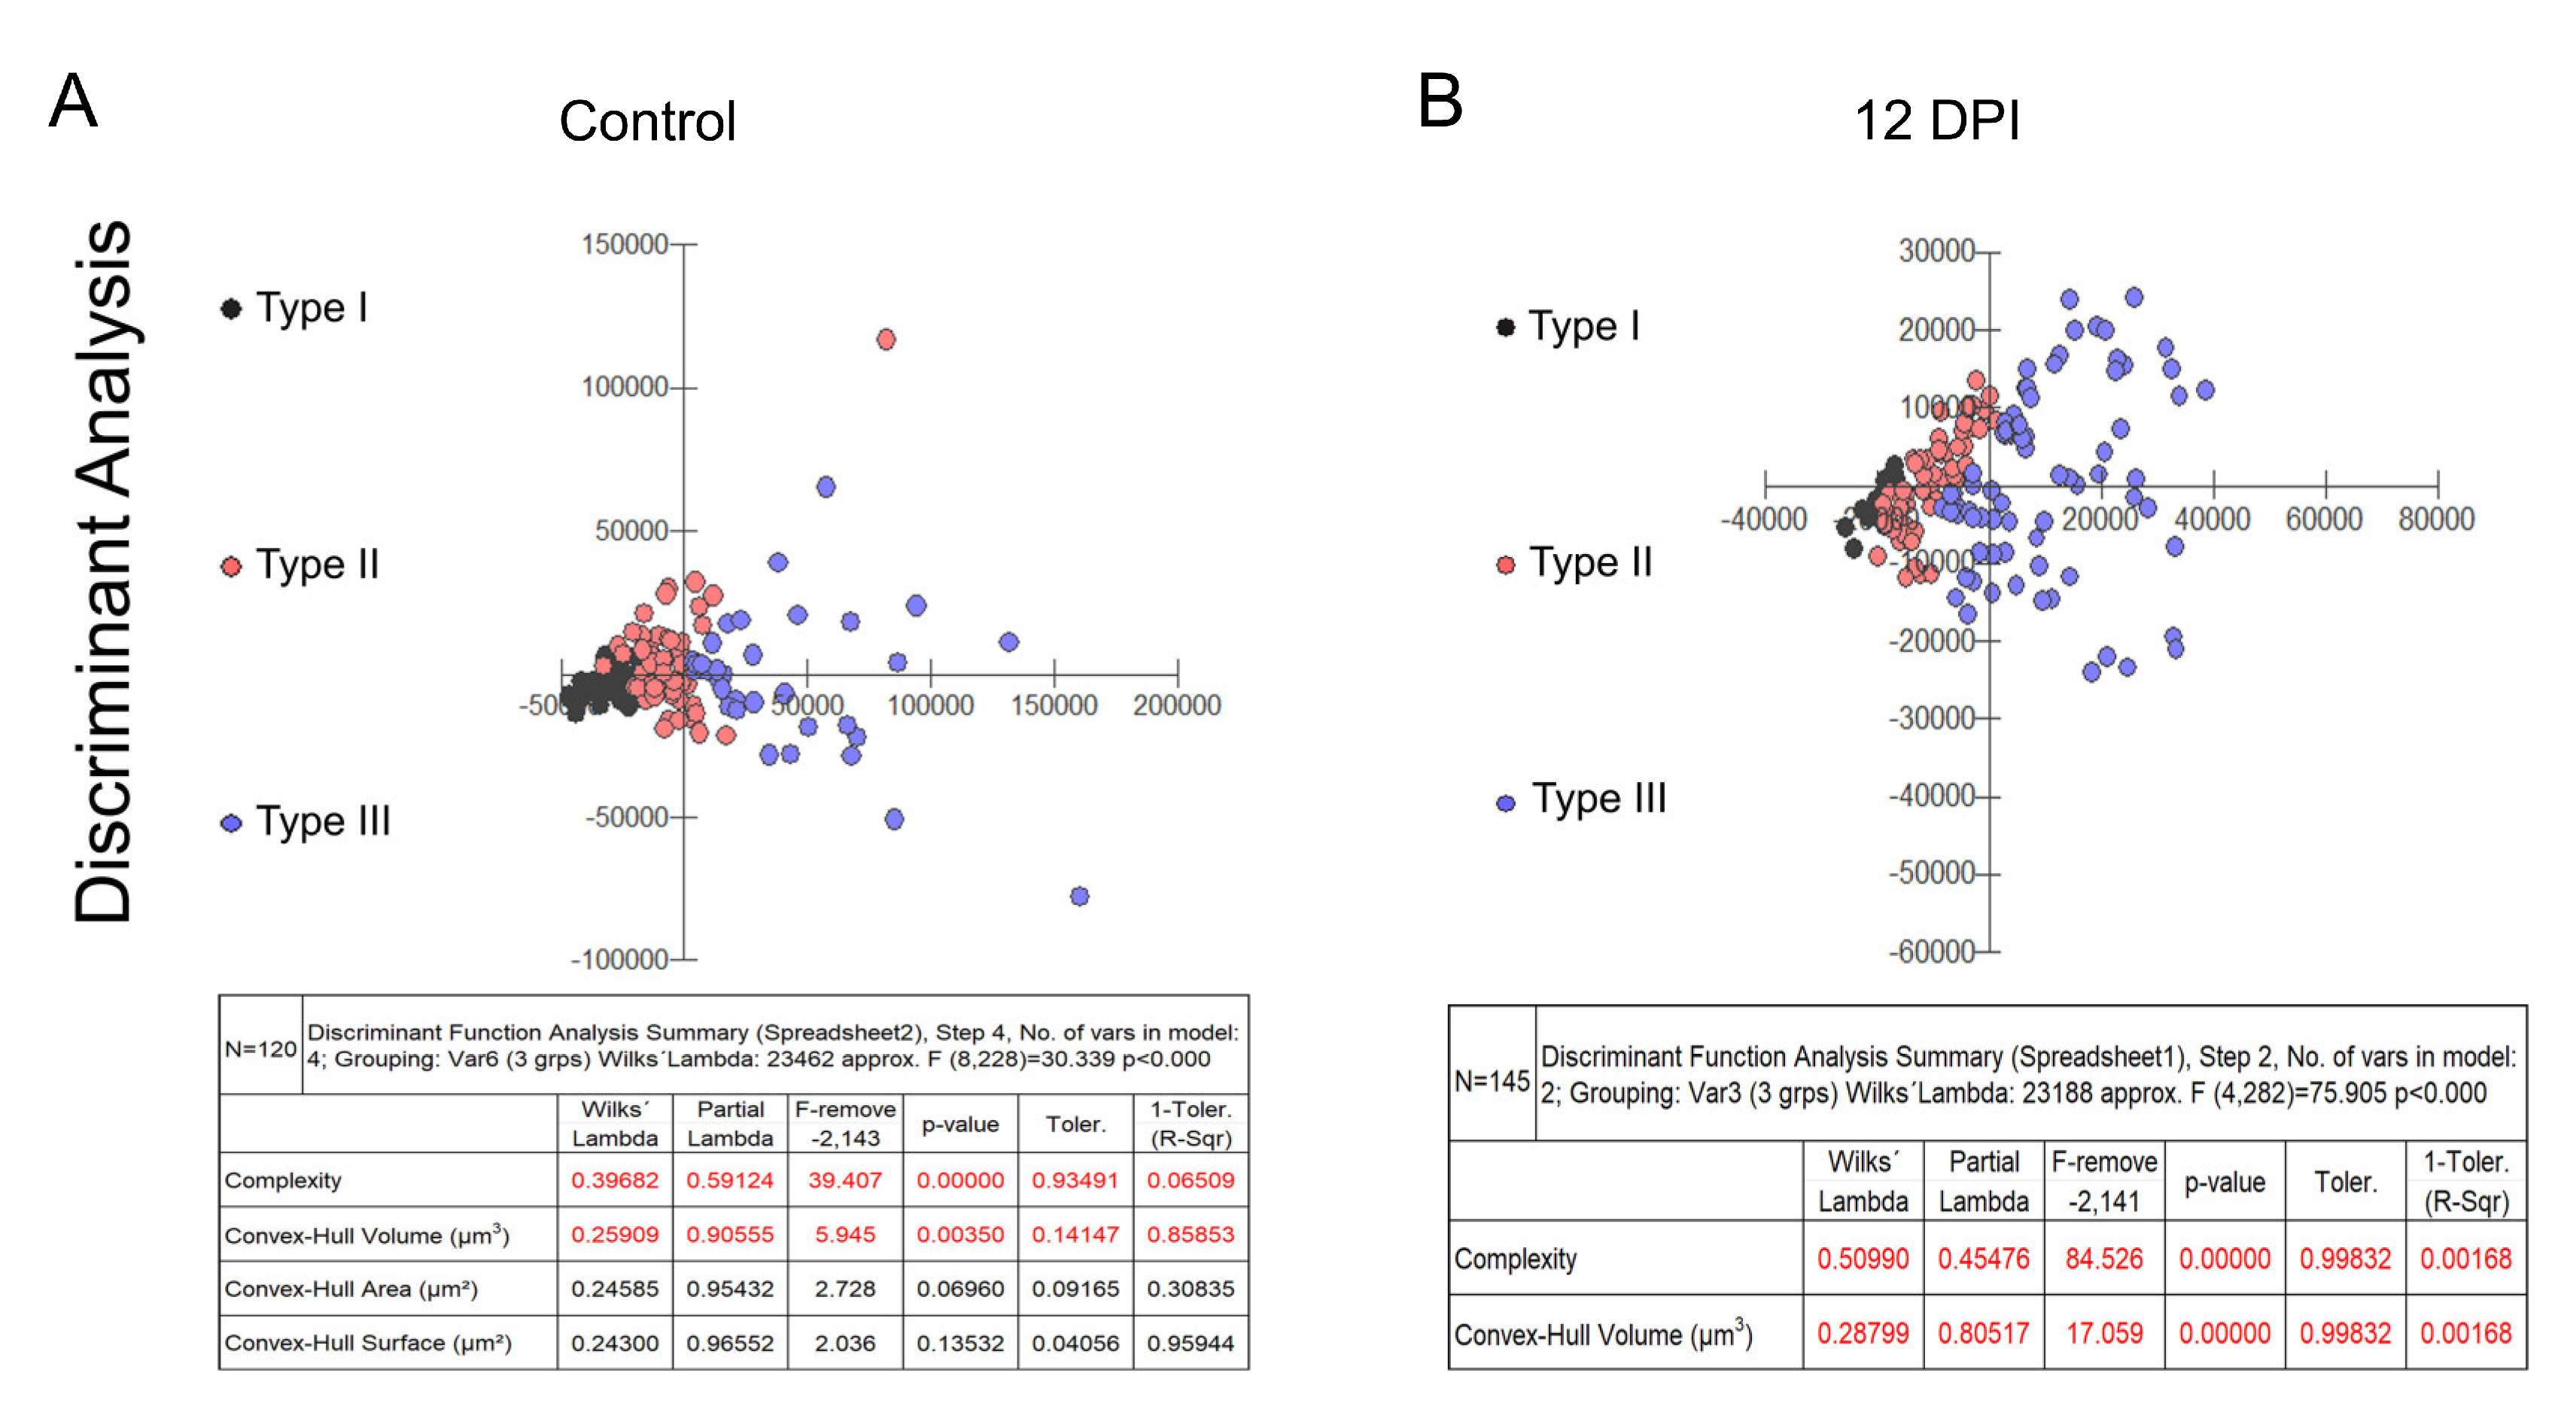
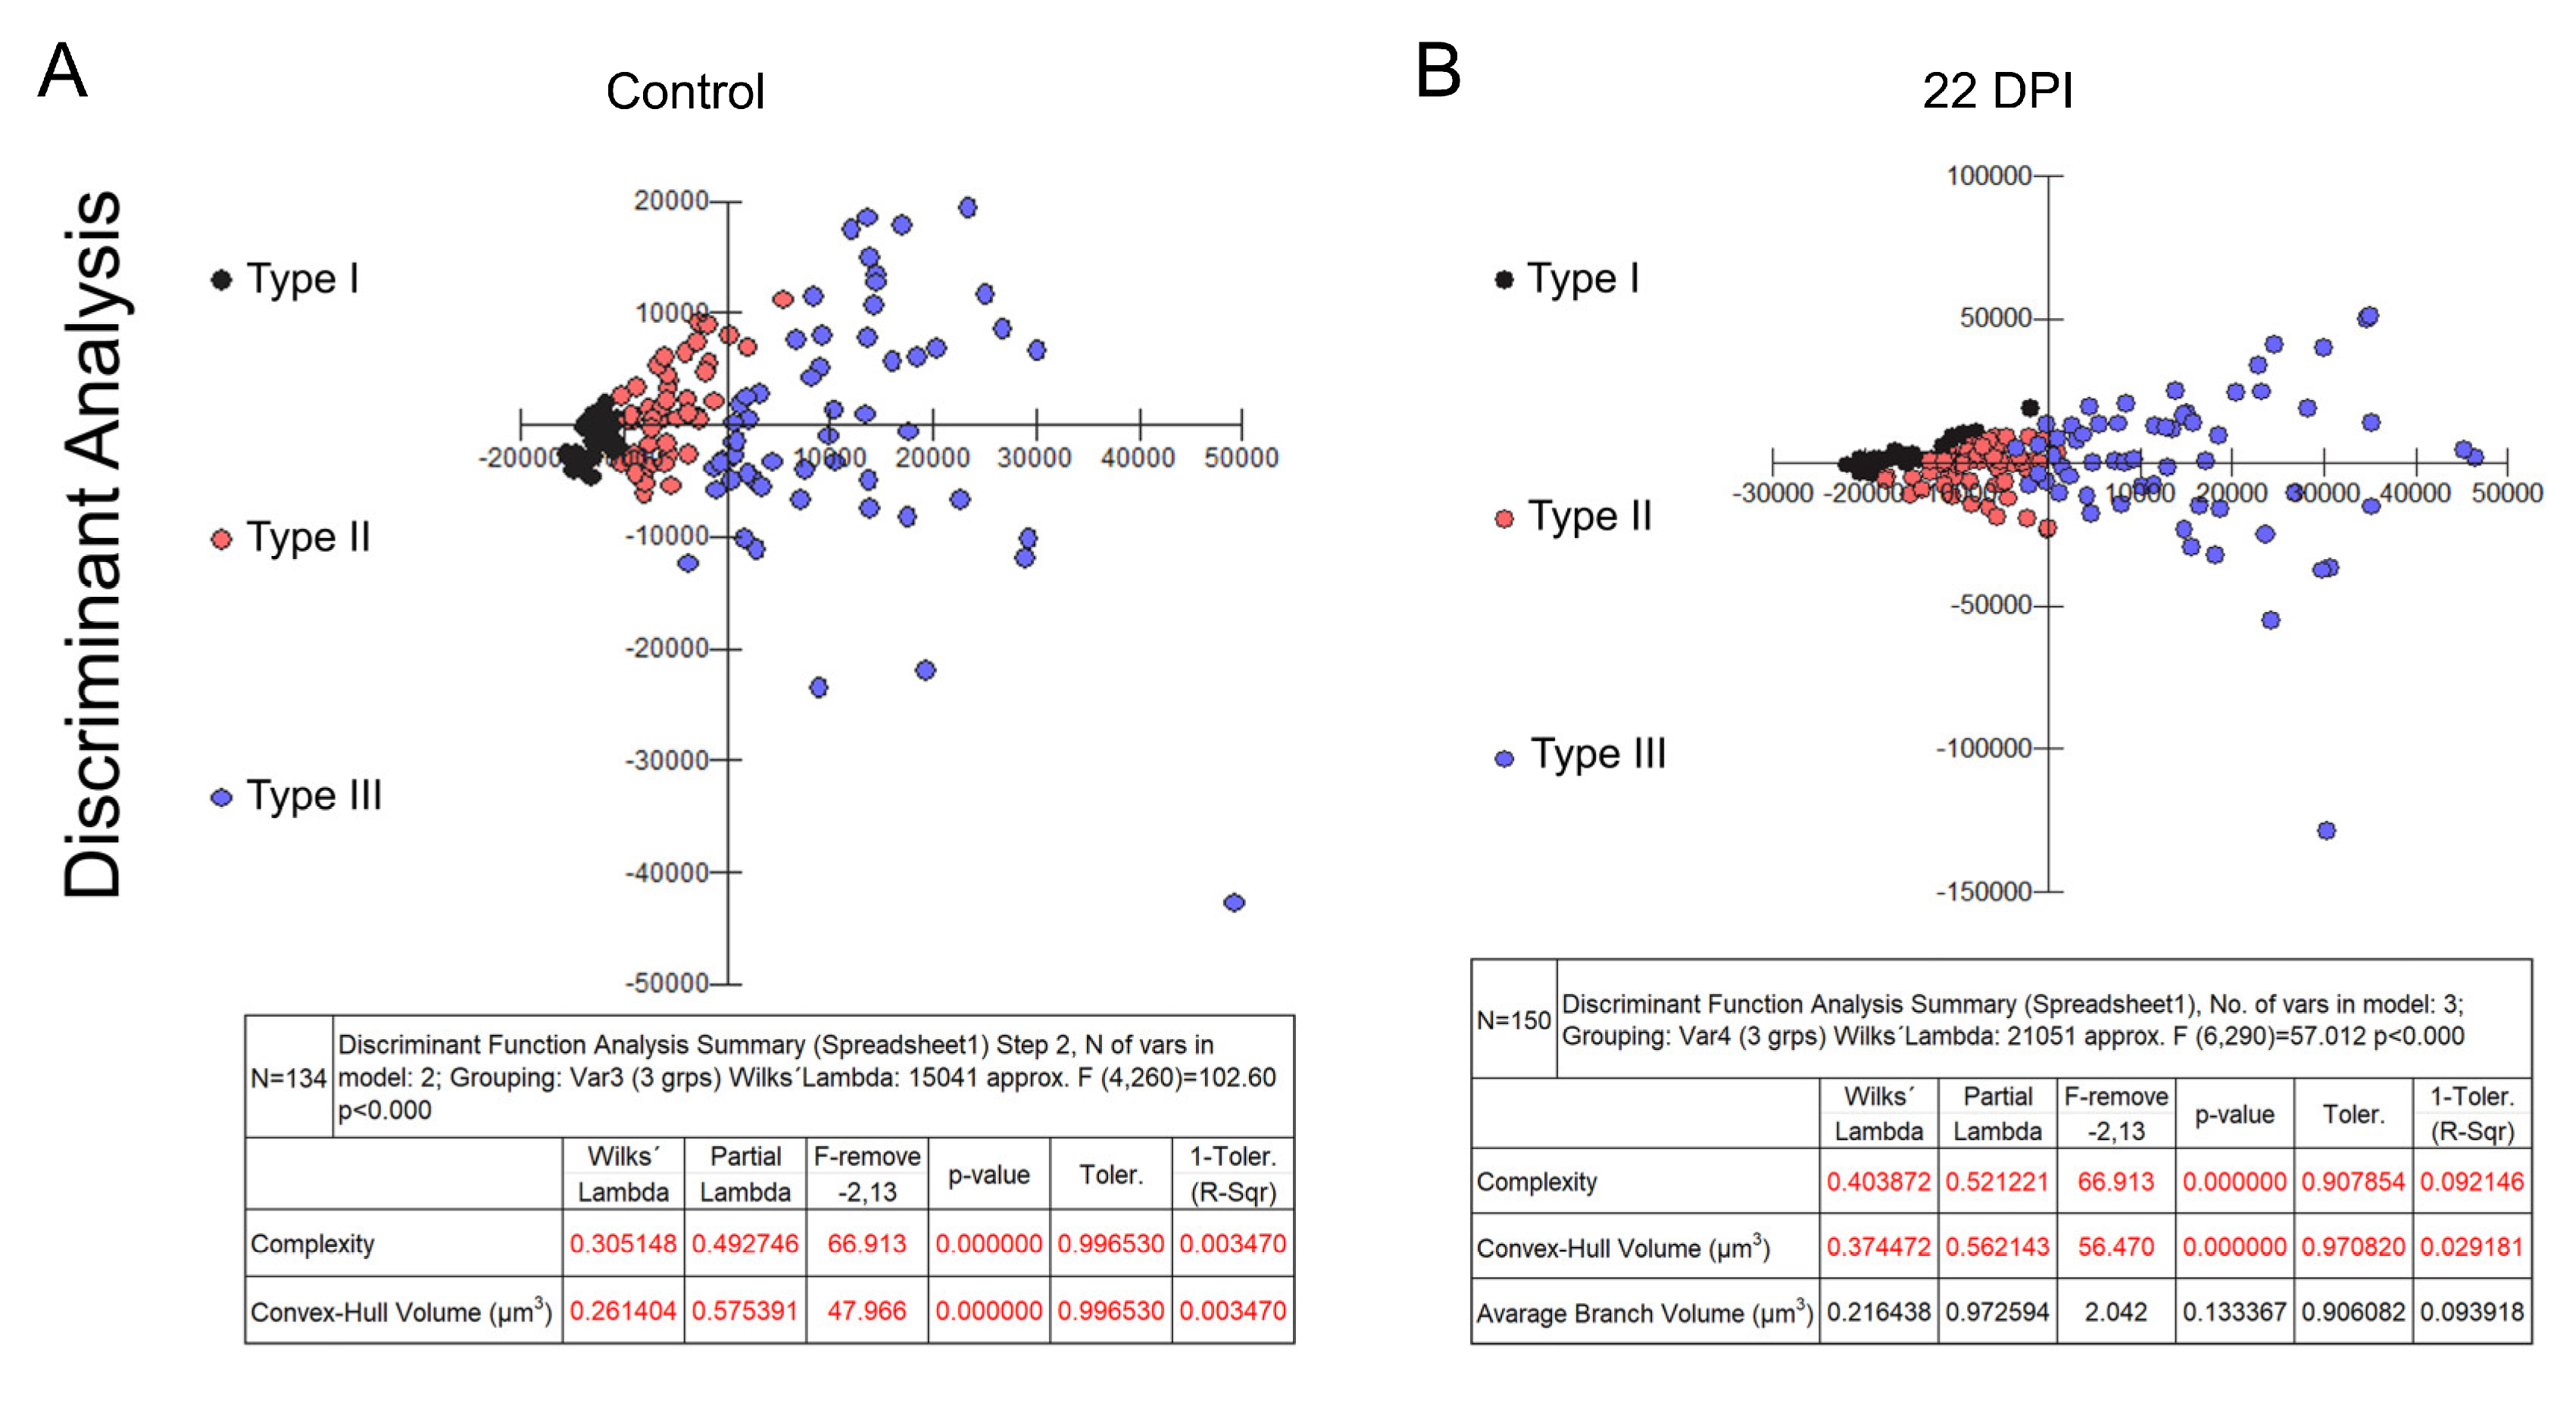
Figure 2 and Figure 3 present dendrograms from hierarchical cluster analysis, illustrating the three distinct morphological microglia families in both control and infected groups of albino Swiss and BALB/c strains. Further, Figure 4 and Figure 5 use discriminant function analysis to validate the cluster analysis, highlighting the influence of each morphometric feature on cluster differentiation.
Types I, II, and III microglia exhibit progressive changes in morphological complexity and convex hull volume. Our findings highlight a shift towards increased Type III microglia in infected mice, indicating a change in microglial population dynamics and suggesting an adaptation to infection.
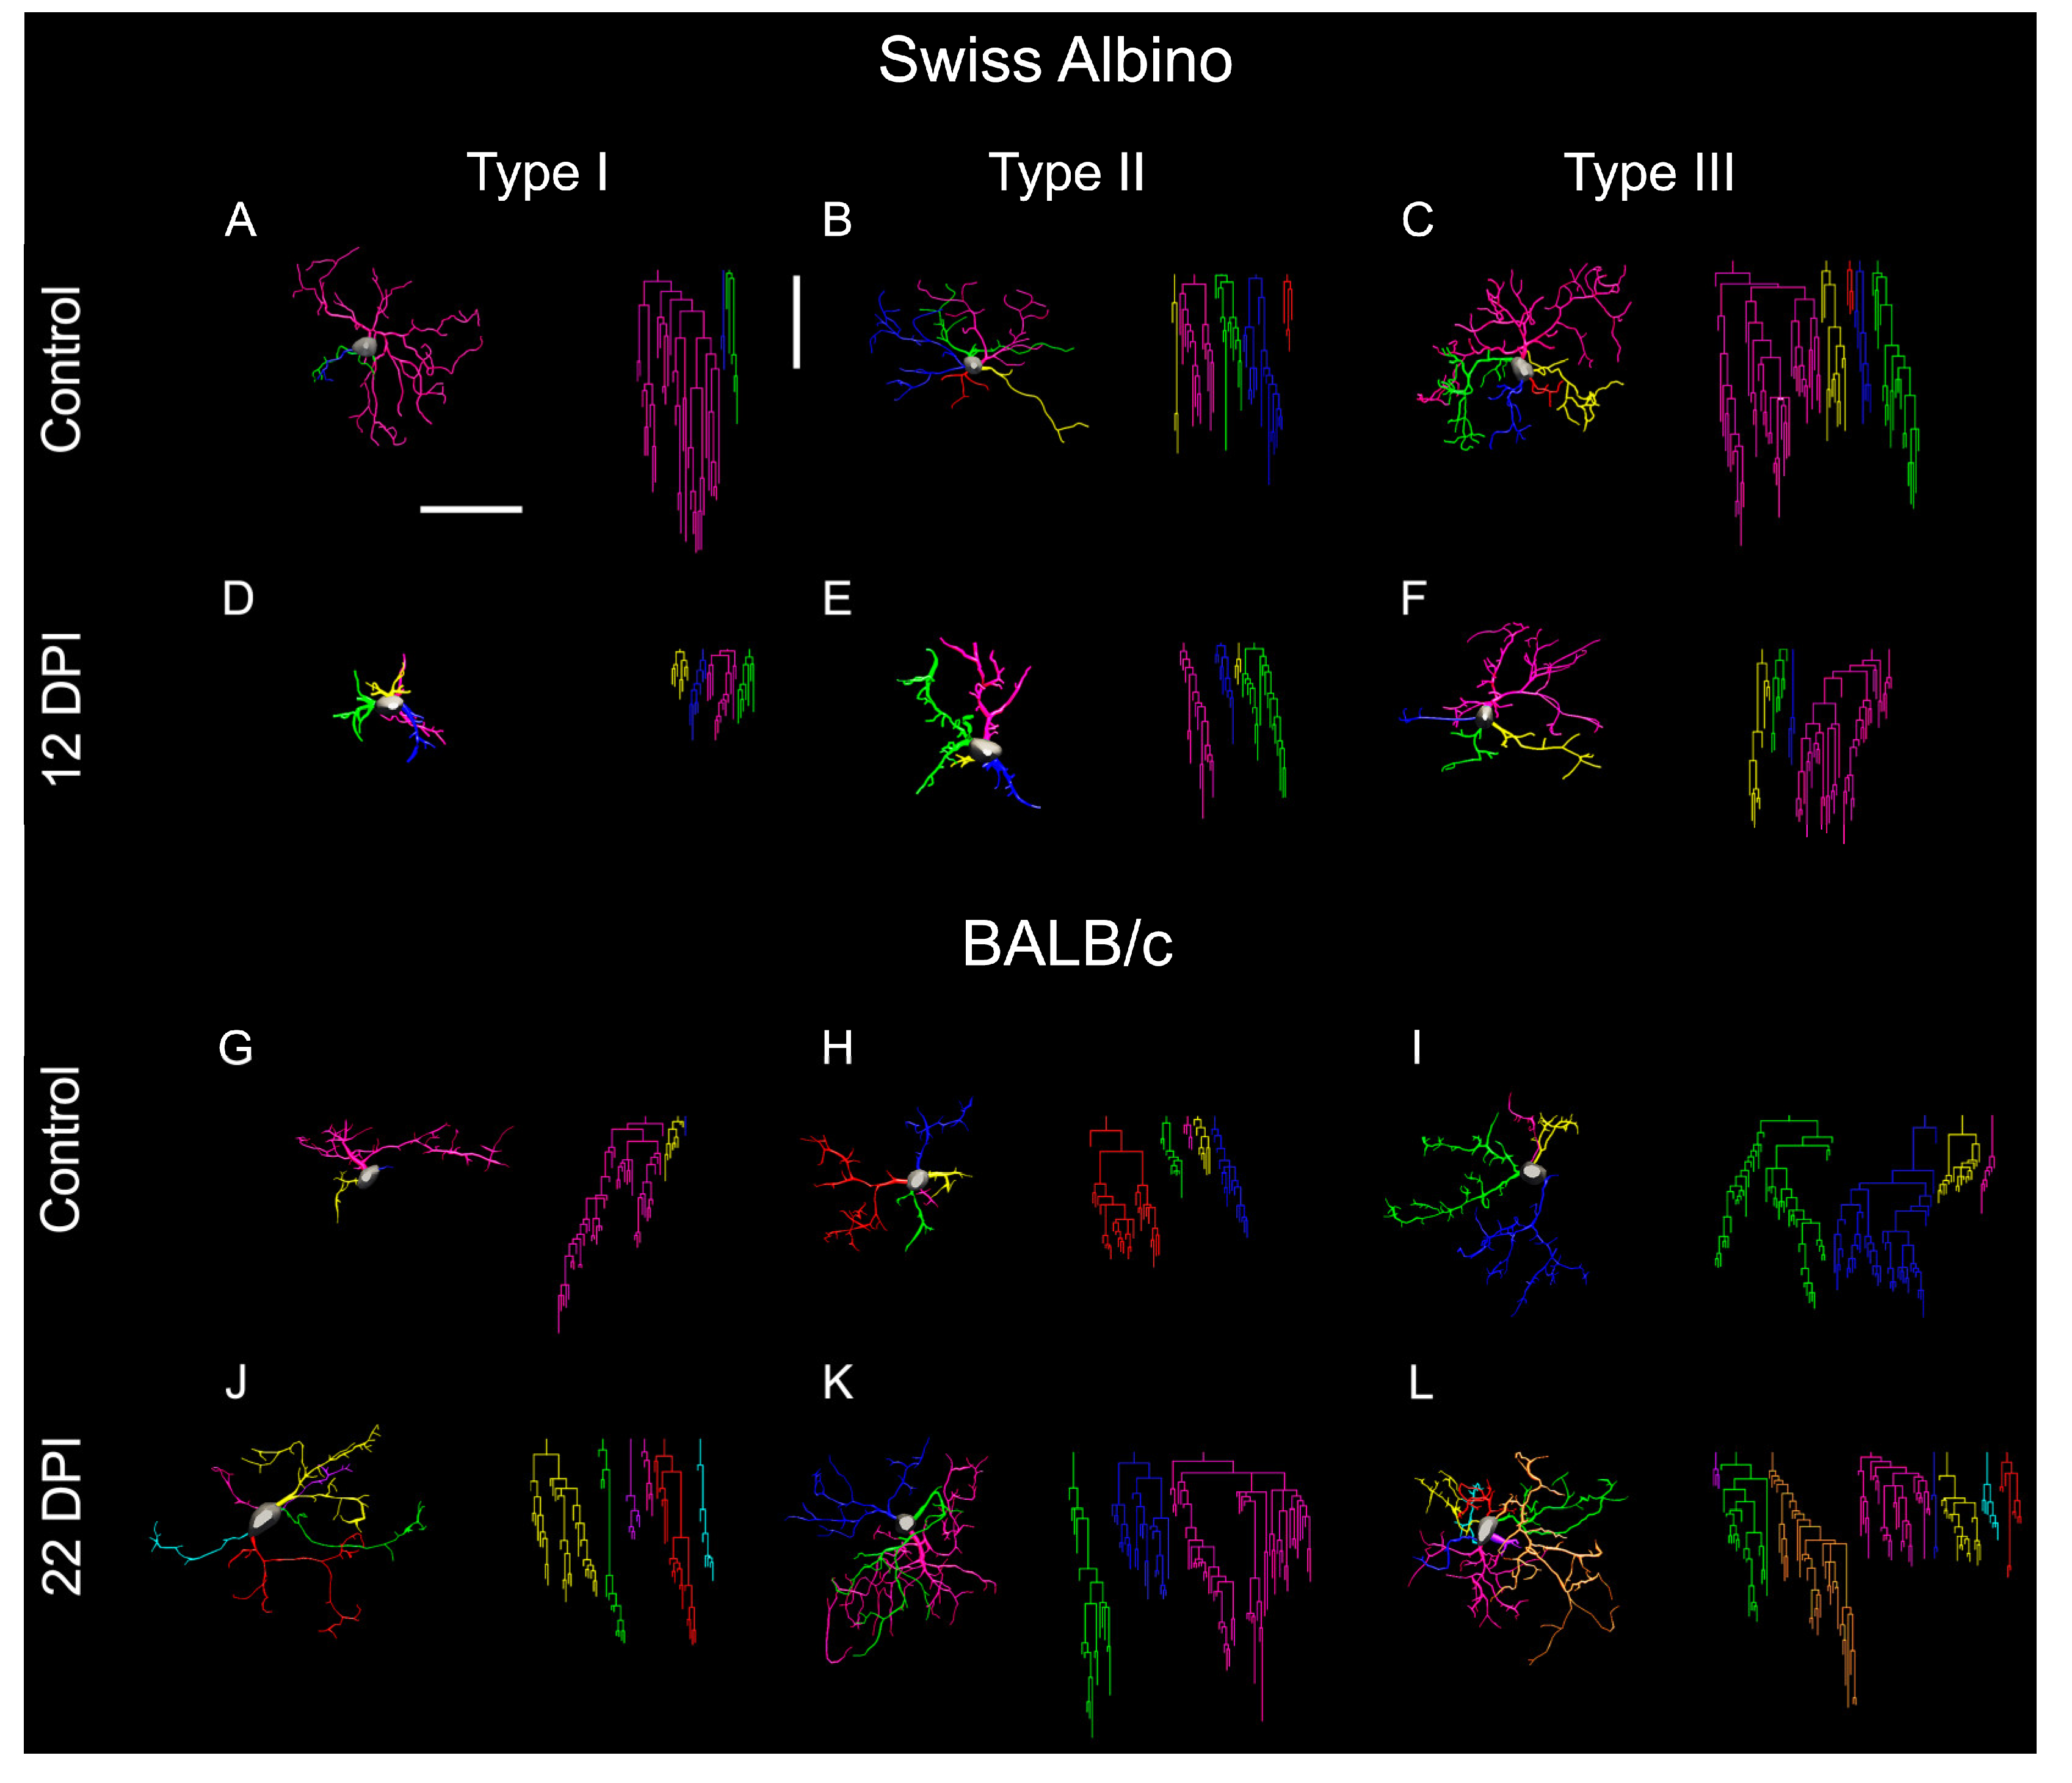
Figure 6 offers a visual summary of microglial alterations following ocular T. gondii infection in both BALB/c and Swiss albino mice. It compares the representative microglia of each morphotype, underscoring the differences in coverage, branch thickness, and complexity. Infected BALB/c mice displayed expanded microglial arbors with greater complexity, whereas Swiss albino mice showed reductions in these aspects, illustrating the diverse impacts of infection on microglial morphology across strains.
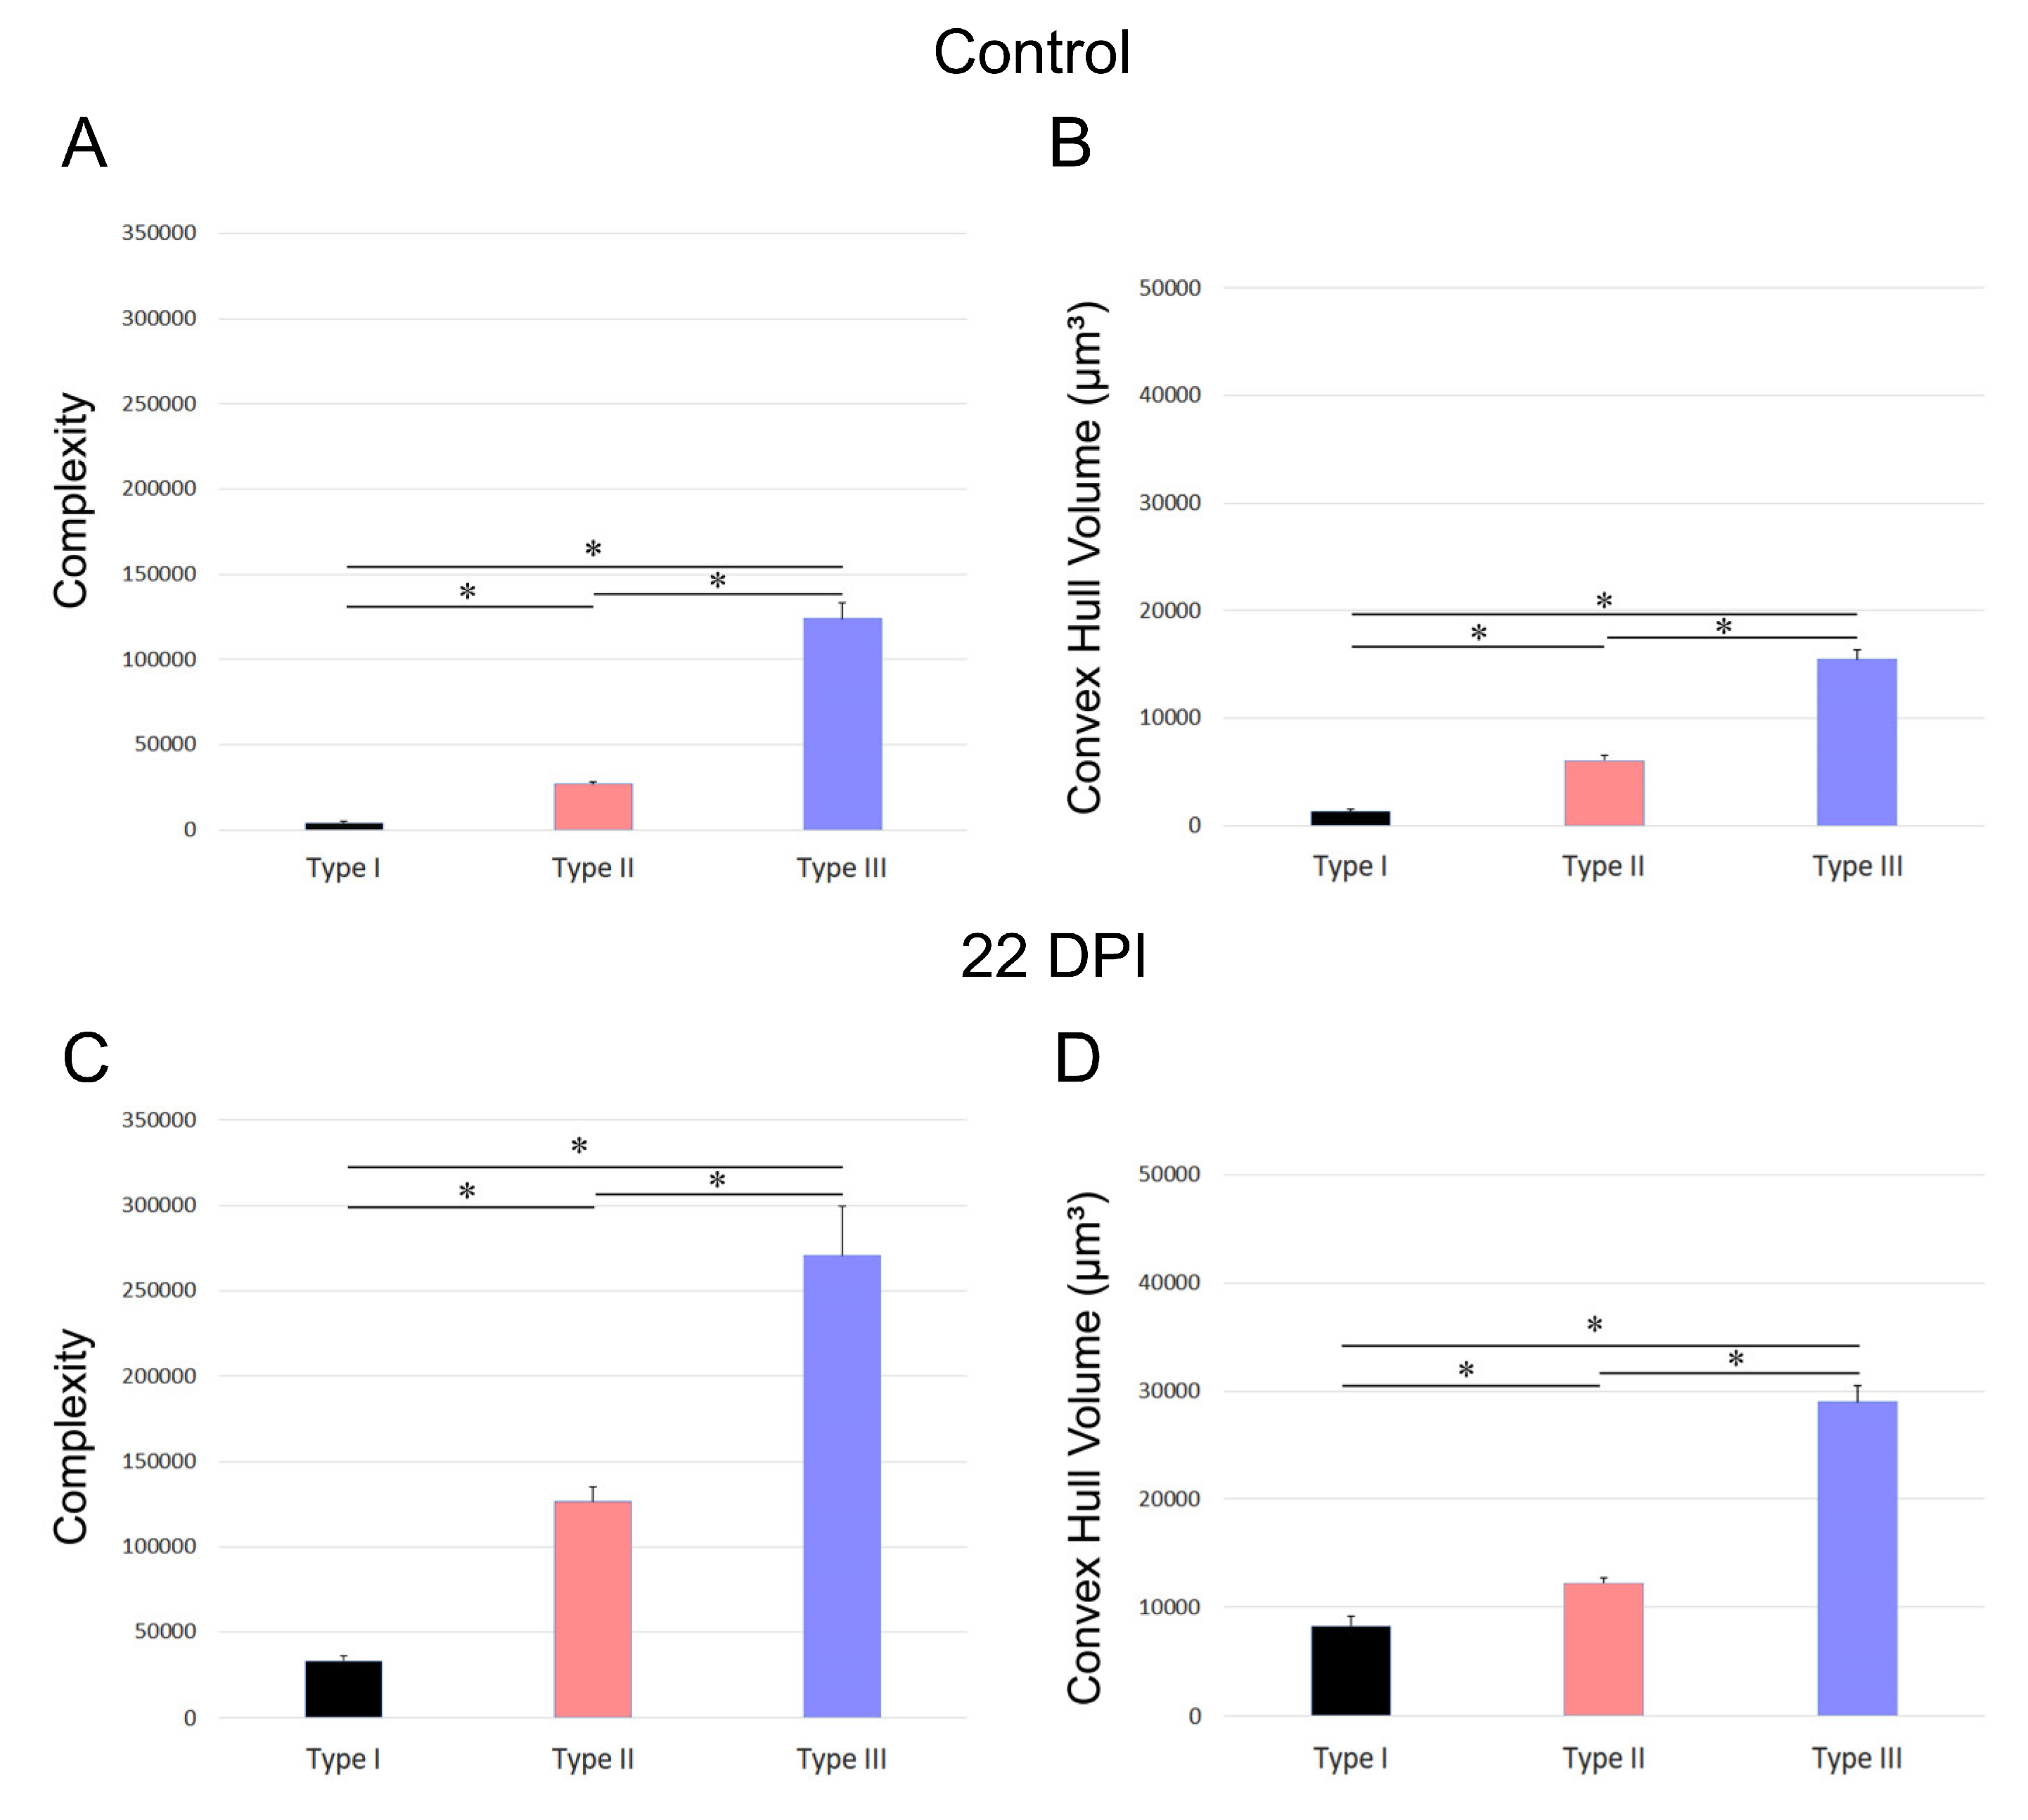
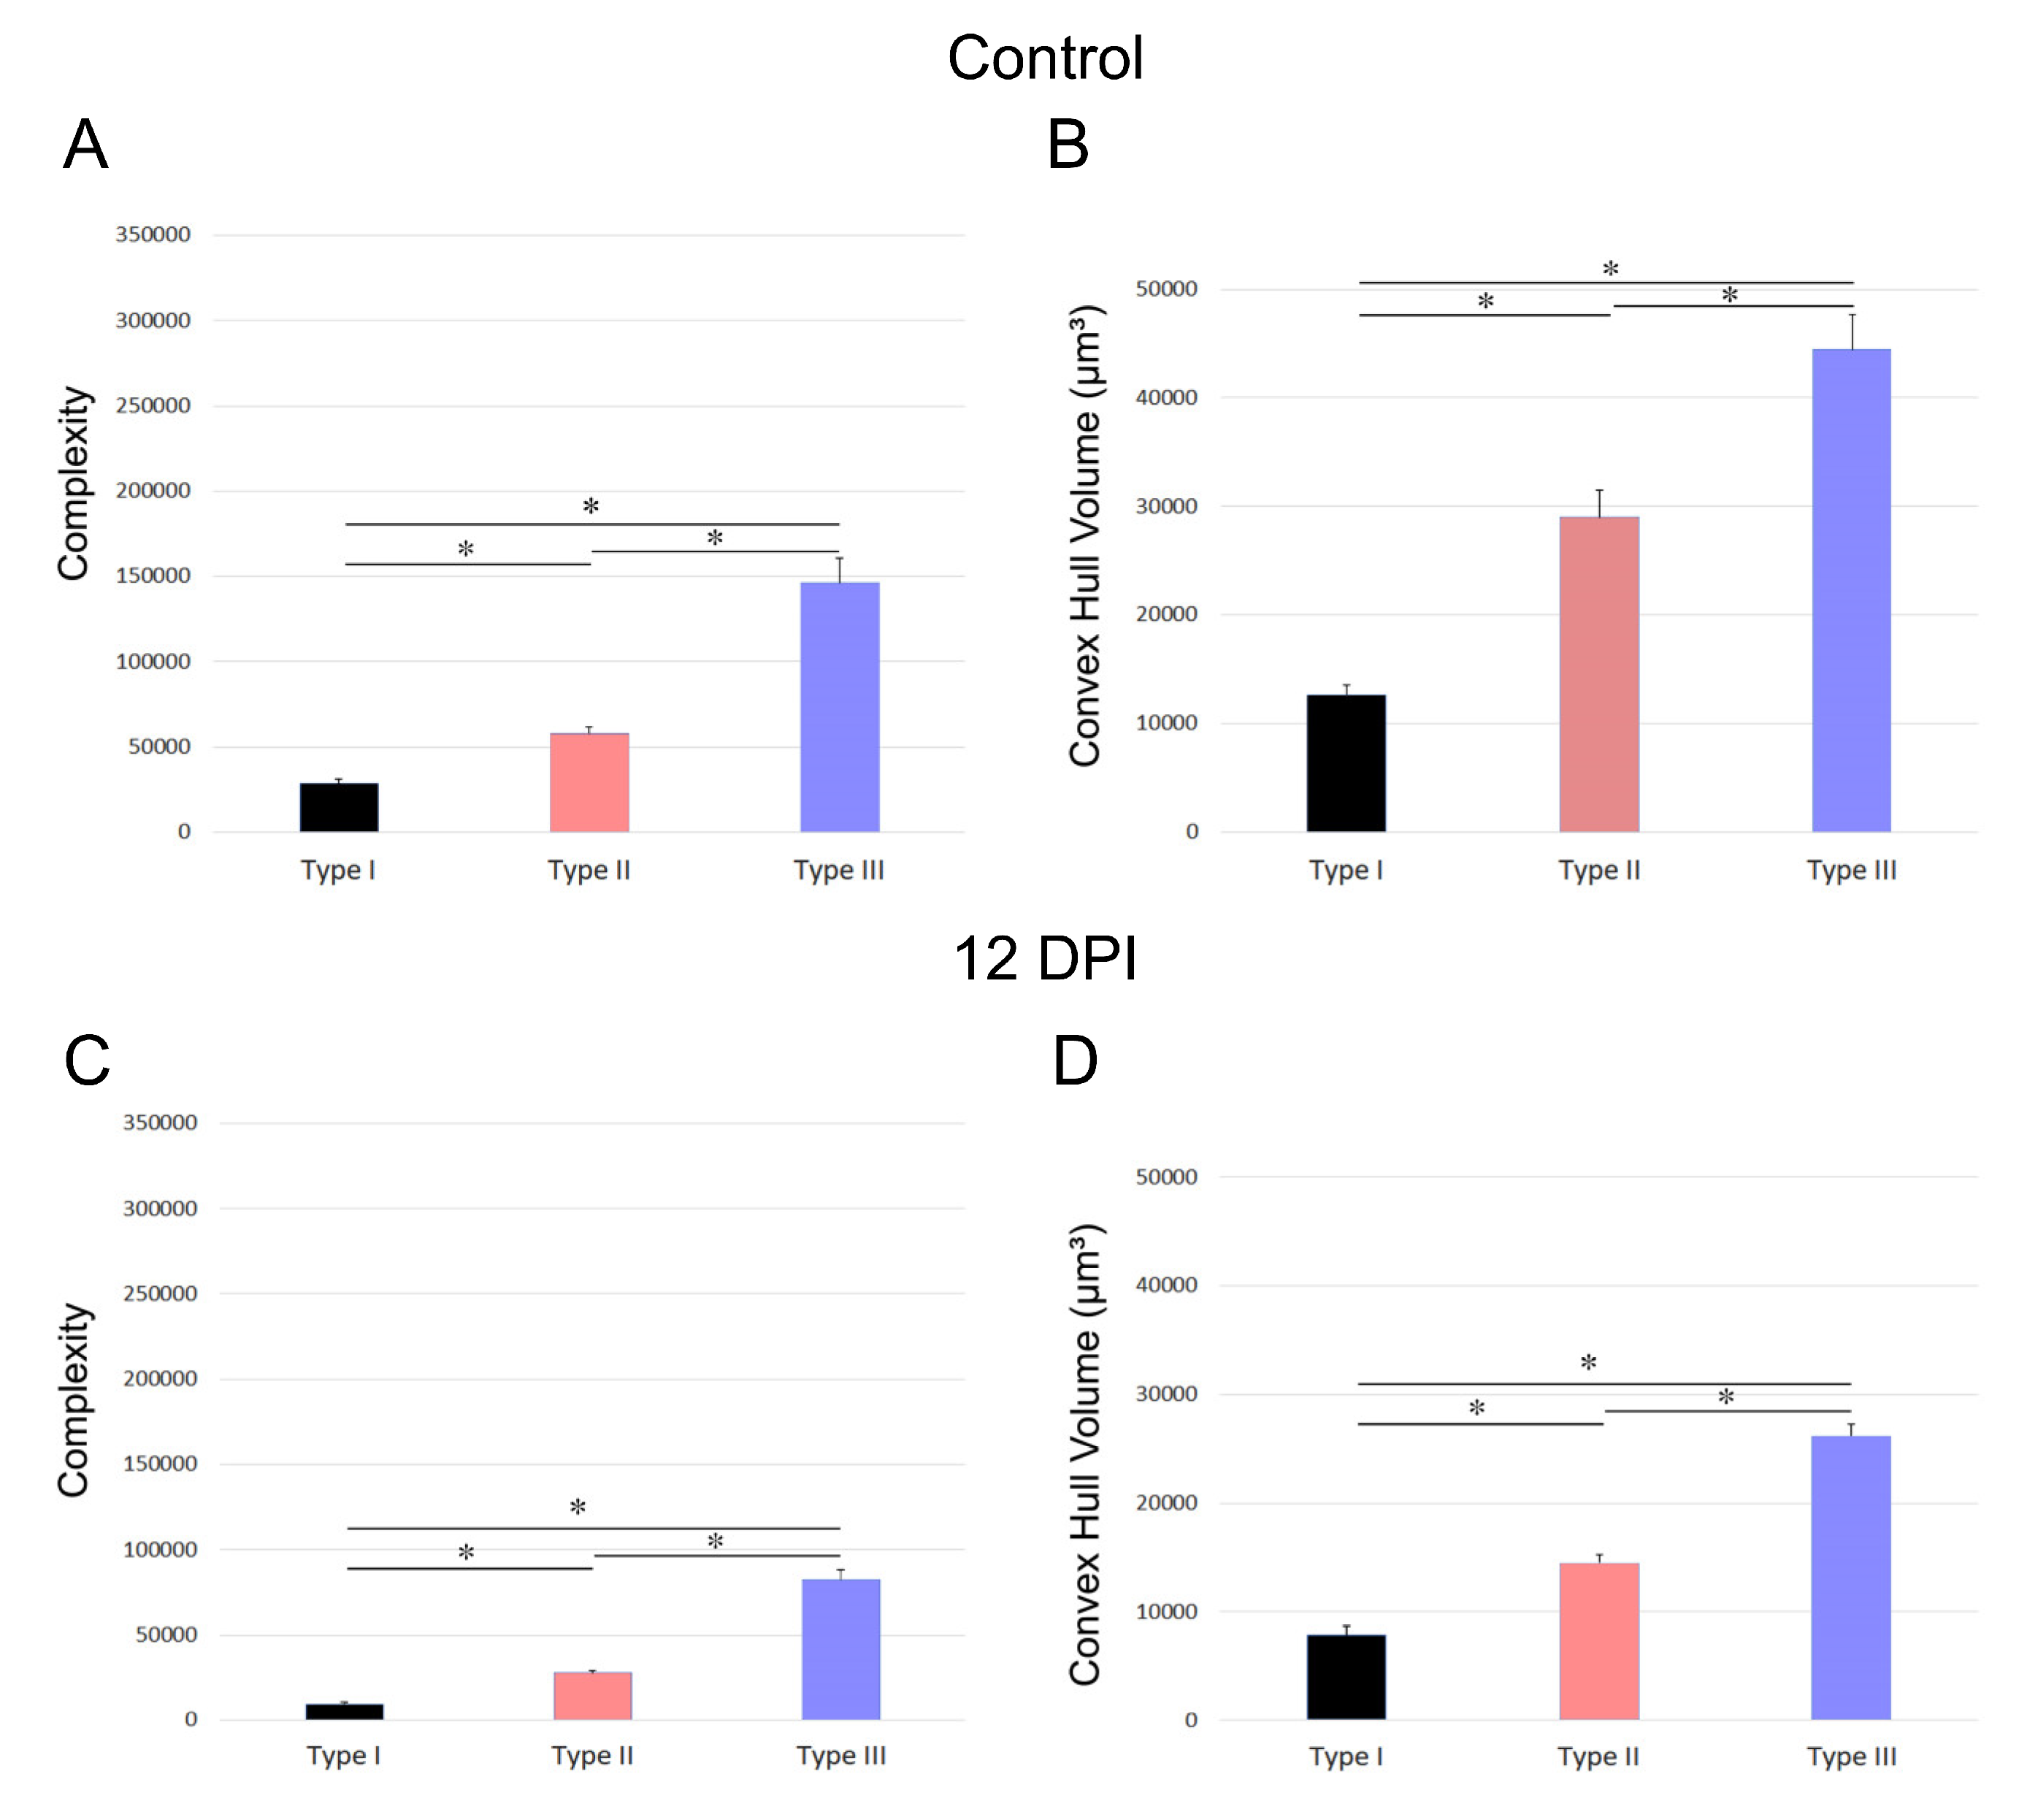
Figure 7 and Figure 8 depict the differences in convex hull volume and morphological complexity across the three identified microglia morphotypes in both control and infected mice of the BALB/c and Swiss albino strains. Figure 7 presents the mean values and standard errors for key morphometric features of microglia in the dentate gyrus molecular layer, crucial for cluster formation. It highlights the variable impact of T. gondii infection on the morphotypes in BALB/c mice. Conversely, Figure 8 focuses on the mean values and standard errors of significant morphometric characteristics of microglia in the Swiss albino strain, illustrating the distinct responses of microglia morphotypes to infection.
The analysis reveals contrasting microglial responses between the BALB/c and Swiss albino strains. In BALB/c mice, microglia displayed expanded branches, while Swiss albino mice exhibited a pattern of branch retraction. Figure 7 and Figure 8 underscore these differences by showing the average convex hull volume occupied by microglia, indicating expansion in the BALB/c lineage and reduction in the Swiss albino lineage.
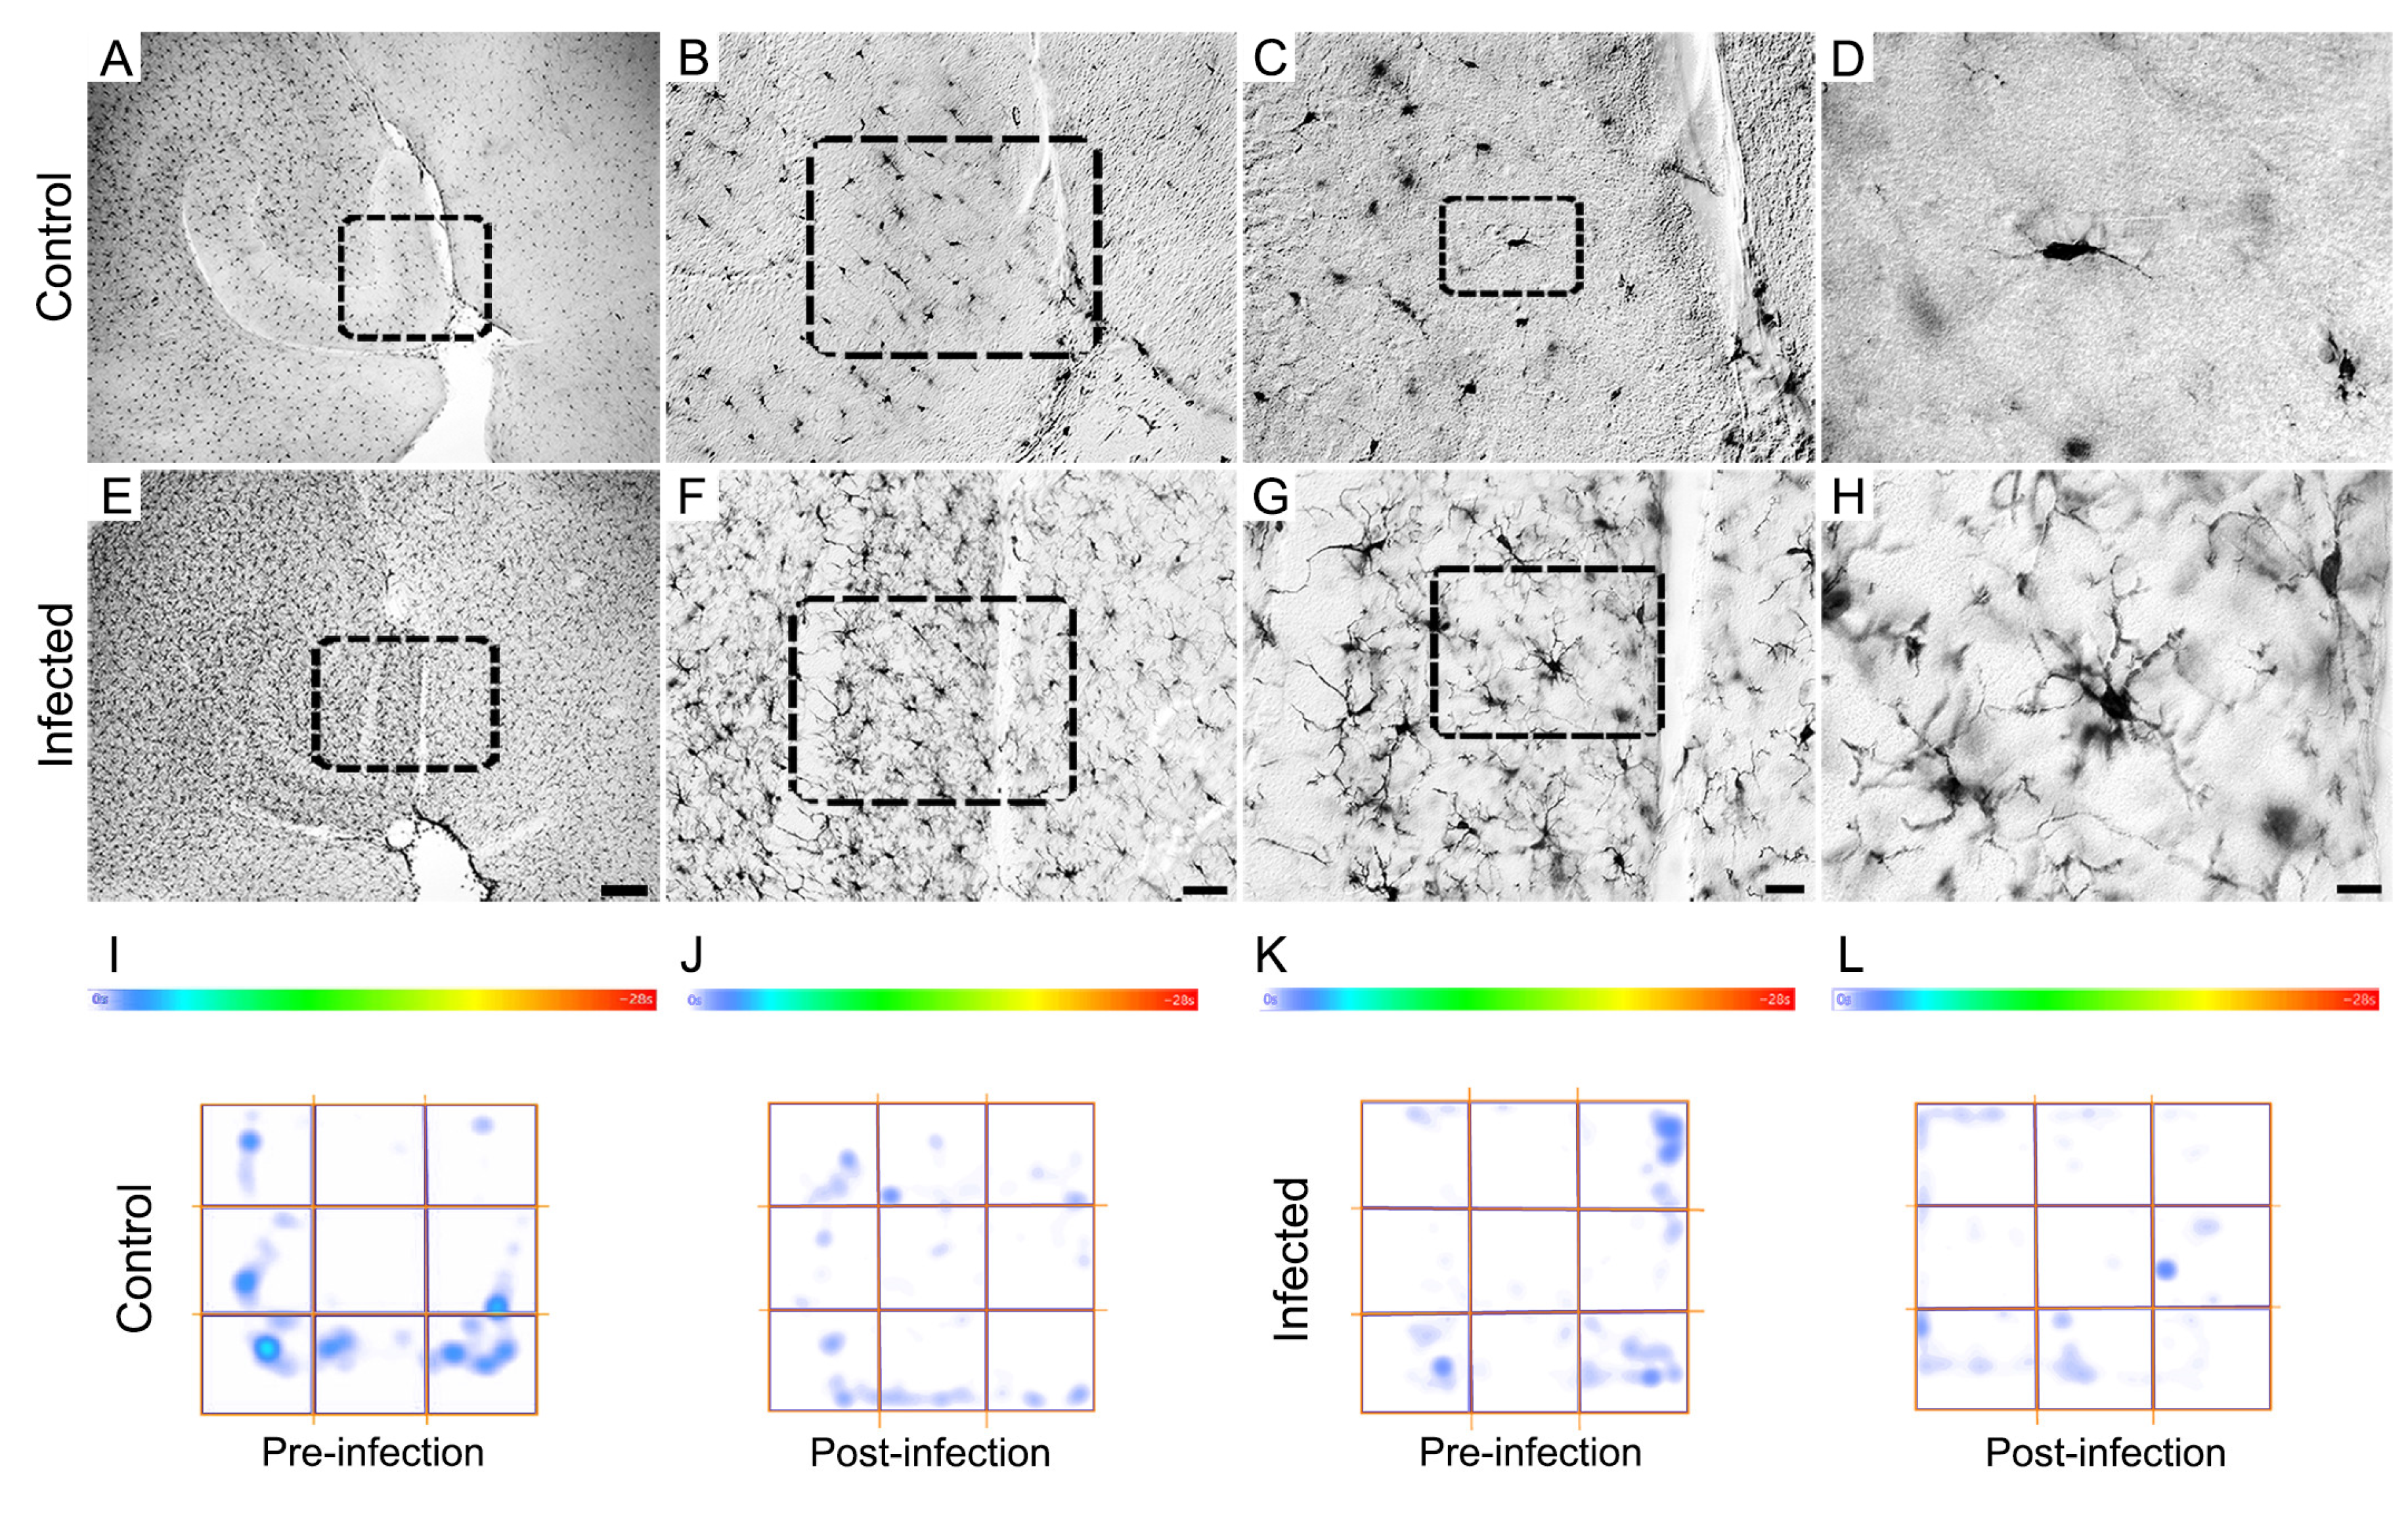
Microglia in the Mol-DG of Swiss albino mice infected with T. gondii exhibit a unique reactive morphology compared to controls, as summarized in Figure 9 (A-H). This reactivity, evident across all distinguished morphotypes, correlates with behavioral changes, such as increased avoidance of feline odors (Figure 1A) and more time spent in the peripheral zones of the open arena (Figure 1B). However, no significant difference was found in immobility between control and infected Swiss albino mice at 12 dpi.
Figure 9 (I-L) shows a heat map of immobility time in the open arena based on photomicrographs of an animal whose immobility pattern closely matches the average, illustrating this behavior.
The correlation between microglial reactivity, behavioral alterations, and the progression of toxoplasmosis in BALB/c and Swiss albino mice suggests that differences in regulation of the inflammatory response may influence the susceptibility and resilience of a strain to the infection.

3. Discussion

This study investigated sickness behavior and the microglial response as indicators of the inflammatory response to toxoplasmosis in two mouse strains: BALB/c and Swiss albino. The findings reveal differences in microglial response and disease progression between these strains, suggesting that BALB/c and Swiss albino mice regulate the inflammatory response to infection in distinct ways. This differential regulation may account for the observed variations in the tolerance and resistance of each strain to the parasite.
The host immune system mounts a coordinated response to infections by pathogens, with the primary goal of restoring homeostasis and safeguarding the individual from tissue damage. To counteract the pathogen, the host employs two main strategies: resistance and tolerance [6,7,72]. The specific nature of these responses can differ across species and even among individuals within the same species. Resistance encompasses both innate and adaptive immune responses designed to curb pathogen replication. In contrast, disease tolerance involves the immune system permitting the coexistence of the pathogen within the host, often with minimal or no clinical symptoms, while still allowing sufficient pathogen replication for transmission.
The behavioral observations in this study indicate that during the acute phase of infection, Swiss albino mice exhibited a dysregulated immune response, leading to the death of five mice by 11 dpi. The mice that survived exhibited reduced aversion to feline odors at 12 dpi, spent more time at the periphery of the open field, but did not demonstrate a significant increase in periods of immobility. In contrast, all infected BALB/c mice survived the initial phase of the infection. By 22 dpi, these mice showed decreased avoidance of feline odors, longer durations of immobility, and increased time spent at the open field’s edges. By day 43 dpi, BALB/c mice continued to spend more time in areas with feline odors, suggesting that the behavioral alterations noted at 22 dpi may have become enduring. The immune response of infected Swiss albino mice is similar to that observed in C57Bl6 infected mice [73,74], and previous reports comparing BALB/c and C57Bl6 lineages have also reported an increase in macrophage numbers during the late stages (56 dpi) of the disease in BALB/c mice compared to C57Bl6 infected mice. Additionally, activation pathways associated with neuropathology and neuroinflammation in BALB/c mice are downregulated compared to their counterparts in C57BL/6 mice [73,74,75]. Such studies highlight how alterations in the host immune response influence pathogenicity to T. gondii infection.
Between 22- and 43-days post-infection, BALB/c mice displayed behavioral changes that correlated with increased microglial activity. The microglia showed expanded trees and greater morphological complexity. By 43 dpi, however, the microglial response had decreased, and cysts were observed in the retina and cerebral cortex. Although the three microglia morphotypes identified at 22 and 43 dpi persisted, they exhibited morphometric features similar to those of control mice, as shown in Figure S2. Further analysis of microglial arbor volume and shape showed that BALB/c mice had more complex and voluminous microglia, while Swiss albino mice displayed shrunken and rounded microglia similar to macrophages. These observations suggest different phases of the microglial inflammatory response between the strains, with differing functions. In Swiss albino mice, a surge in microglial activity at 12 dpi coincided with severe sickness behavior and fatalities at 11 dpi. Conversely, BALB/c mice exhibited behavioral and microglial changes peaking at 22 dpi, which returned to baseline with brain cyst presence at 43 dpi. It might be speculated that the delayed increased microglia number might have protected BALB/c mice from toxoplasmic encephalitis. In contrast, the Swiss albino mice exhibited a doubling in microglia number with macrophage-like morphologies at 12 days, indicating a potentially dysregulated inflammatory response that led to the more severe outcomes in this strain and the downstream failure to develop the odor response. Here, myeloid cell recruitment from the bloodstream into the T. gondii-infected brain may have contributed to the fatal toxoplasmic encephalitis in albino Swiss as previously described in C57Bl/6J [see [76]]. T-cells, particularly CD8+ T cells, also exhibit a marked increase in number in infected C57Bl/6J mice, concomitant with heightened levels of macrophages and activated microglia up to 28 dpi, after which they stabilized. Nonetheless, the virulence and persistence of the parasite in mice are tied to the host’s genetic background.
The severity of Toxoplasma infection in mice is determined by the ability of the parasite to counteract the host resistance to infection that appears to be targeted at interferon-gamma (IFN-γ) through its parasite-kinase [77]. During the acute infection stage, there is an increase in neuronal cell death, activation and infiltration of microglia, expression of both inflammatory and anti-inflammatory cytokines, Stat1 phosphorylation, as well as enhanced microglia reactivity and associated gene transcripts [78]. This suggests that the failure to evade the activation of innate and cellular inflammatory responses, accompanied by downstream neurodegeneration, might be responsible for an excessive inflammatory response [78]. Microglia and macrophages are known to produce IFN-γ in the brain following infection with T. gondii, which is responsible for controlling the behavior of tachyzoites through chemokine and MHC antigen expression [12,13,14,15,16,17,18,19,20,21,22,23,24,25,26,27,28,29,30,31,32,33,34,35,36,37,38,39,40,41,42,43,44,45,46,47,48,49,50,51,52,53,54,55,56,57,58,59,60,61,62,63,64,65,66,67,68,69,70,71,72,73,74,75,76,77,78,79]. This mechanism may stop parasite proliferation in the early stages of the disease in BALB/c mice but not in the Swiss albino [12]. It has also been shown that the host’s tolerance mechanisms require the parasite’s engagement of the scavenger receptor CD36. This engagement is critical for the re-establishment of tissue homeostasis and survival following the acute phase of infection [77].
It was demonstrated that the behavior of rodents infected with T. gondii is affected by the parasite strain and the immune response of mouse model lineage [80,81]. Variations among the three primary strains of T. gondii and their specific interactions within the infected host significantly influence the severity of infection [82]. The acute virulence of the type I genotype, which was used in this study, is consistent with elevated tissue burdens compared to the non-virulent type II and Type III lineages [83]. In a study using BALB/c mice, researchers investigated the impact of using different strains - ME-49 (type II) and VEG (type III) - of T. gondii on outcome [80]. The investigation encompassed assessments of learning and memory capabilities, locomotor activity, and aversion to feline odor. Additionally, the study measured the humoral immune response, the levels of total IgG anti-Toxoplasma, and the parasite load within the CNS. The findings revealed that mice infected with the VEG strain exhibited several notable differences compared to those infected with the ME-49 strain. These included increased levels of total IgG anti-Toxoplasma, a higher parasite burden in the CNS, impaired long-term memory, reduced mobility, and a diminished aversion to feline odor. This suggests that the genetic variation between the T. gondii strains significantly influences the infection’s impact on the host, affecting both the immune response and behavioral outcomes [84].
Comprehensive transcriptional profiling of mice during both the acute and chronic phases revealed that a distinct subset of host genes are induced in the immune response, and some are notably more pronounced during the chronic stage [85]. Such finding indicates an enduring interplay between the pathogen and host that remains evident in the late stages when brain cysts are detected in the parenchyma [85]. In the early stages of a systemic infection caused by T. gondii, the parasite must express a different set of surface antigens inside a modified parasitophorous vacuole to encyst [75,76,77,78,79,80,81,82,83,84,85,86]. According to studies conducted on C57BL/6 mice, by 28 dpi, a chronic infection was established, with a late-stage bradyzoite phenotype dominating the infection. Transcriptomic analysis of C57BL/6 and BALB/c mice during progressive chronic T. gondii infection showed significant changes in host genes [75]. It is of interest to note that during T. gondii infection, human neutrophil-like cells have been found to demonstrate antimicrobial responses to the chronic cyst, suggesting their participation in clearing the parasite [87,88].
- Technical limitations
Comparative studies often yield conflicting results, influenced by factors such as divergent animal lineages, variations in histological techniques, and inconsistencies in defining specific objects and areas for stereological estimates and three-dimensional (3D) reconstructions. To mitigate these sources of non-biological variation, we standardized tissue processing across all samples. It’s important to note that stereological estimates and 3D reconstructions are sensitive to mechanical factors, with severe shrinkage along the z-axis potentially manifesting as curled branches. To counteract this, we took samples from the central portion of the z-axis. Additionally, we adjusted all microglial reconstructions for z-axis shrinkage, adhering to guidelines recommended by Carlo and Stevens [89]To ensure the reliability of our observations, different researchers independently reconstructed microglia within the same regions, allowing us to identify and consider any variations in our data.

4. Materials and Methods

Female albino Swiss mice were housed in compliance with the National Institutes of Health guidelines for laboratory animal care. Ethical approval for the experimental protocol was obtained from both the Ethics Committee on Experimental Animal Research at the Institute of Biological Sciences, Federal University of Pará, Brazil (CEUA nº 7961160818), and the Ethics Committee of the Evandro Chagas Institute (Protocol No.09/2021). All parasite handling procedures adhered strictly to the standards and criteria mandated by the International Biosafety Committee.

4.1. Animal Handling, Anesthesia, and the Instillation of T. gondii into the Eye

Thirty-four-month-old albino Swiss adult female mice from the animal services unit of Instituto Evandro Chagas were used in this study. They were housed in standard laboratory cages, provided ad libitum access to water and food, and maintained in a temperature-controlled environment (23±2°C) with a 12-hour light-dark cycle. Tachyzoites of the T. gondii R.H. strain (Genotype I) was acquired from the Toxoplasmosis Laboratory of Instituto Evandro Chagas.
For the experimental procedure, animals were anesthetized using avertin (0.08mg/5g of body weight). They had the conjunctival sac of their left eye instilled with either 5 µL of an infected suspension containing 48.5 x 10⁶ parasites/mL (infected group) or an equal volume of saline solution (control group). Five subjects from both the infected and control groups were sacrificed at 12 days post-infection (dpi).

4.2. Behavioral Testing: Open Field and Olfactory Discrimination

For each mouse, we used the contrast index to assess the relative occupation of the three compartments in the olfactory test and the periphery vs central areas in the open field task [49,50]. This index provides a valuable method for normalizing the data. It scales the data to a standard range, typically between 0 and 1, making it easier to compare and analyze. This normalization technique also ensures that the data lies within a specific range, helping to reduce the impact of outliers and making the data more interpretable. We also measured immobility during the open field task.
- Open Field Test
The open-field test is a method used to observe the behavior of animals in a new environment. Typically, the animals tend to stay close to the walls of the arena, which is held to be anxiety behavior, although this is a controversial topic [51]. This behavior is thought to be a defense mechanism that helps to reduce potential threats, such as predation [52].
The open-field test comprised a gray polyvinyl chloride box (30 cm × 30 cm × 40 cm) that was divided digitally into equal central and peripheral regions. Each animal was placed individually in the center of the arena, and their exploratory activity was video recorded for three minutes. The ANY-maze (Stoelting Inc.) software was used to determine the distance traveled, immobility, and time spent in each region. The contrast between the time spent in the periphery and the center (C = (Tp – Tc) / (Tp + Tc), where C = contrast, Tp = time spent in the periphery, Tc = time spent in the center) was calculated. The apparatus was sanitized with 70% alcohol after each test to eliminate residual odors. Weekly open field tests were conducted in infected and control groups to monitor behavioral changes during disease progression.
- Olfactory Discrimination Test
Following the previous protocol, the olfactory discrimination (O.D.) test was conducted within a three-compartmental box [49]. The experiment involved placing mice in a test apparatus consisting of three interconnected compartments. The mice were allowed to navigate through the compartments via polyvinyl tubes. Before the experiment, the mice were acclimated to clean compartments for five minutes, and the apparatus was cleaned with 70% alcohol.
During the olfactory test, the central compartment contained clean bedding, while the lateral compartments contained spoiled bedding from mice under examination and a mix of clean straw with feline feces. Each mouse was individually placed in the central compartment facing the wall, and their behavior was recorded for three minutes. We kept track of the amount of time spent in each compartment during the olfactory test and compared it to the total test duration. The contrast index was calculated using the formula C = (Tt – Tf) / (Tt + Tf), where Tt represents the total time and Tf represents the time spent in the compartment containing feline feces. As the contrast index decreased, indicating a greater preference for the compartment with feline feces, the amount of time spent in that specific compartment increased.

4.3. Histological and Immunohistochemical Procedures

Upon reaching the designated survival time, final behavioral tests were conducted before mice underwent weighing, anesthesia via intraperitoneal administration of 2,2,2-tribromoethanol (0.15 ml/g of body weight), and subsequent transcardial perfusion. The perfusion sequence involved heparinized saline followed by 4% paraformaldehyde in 0.1M phosphate buffer (pH 7.2–7.4). As the disease proved fatal for five Swiss albino mice at the 11th dpi, all mice of this lineage were euthanized at 12 dpi. In contrast, all BALB/c mice recovered from the acute stage of the disease and were euthanized at two different time points: 22 or 43 dpi. The five dead albino Swiss mice were not included in the analysis.
Serial anatomical sections (80-µm thick) were obtained using a Vibratome (MICROM, model HM 650 MK, Microm International GmbH, Walldorf, Germany) and subjected to immunolabeling using polyclonal antibodies. Brain sections underwent initial antigen retrieval in 0.2M boric acid (pH 8.0) at 70°C for 60 minutes and subsequent washing in 0.1M saline tris buffer solution (pH 7.2–7.4). Sections were then treated with 10% Casein for 60 minutes and incubated with the primary antibody (Anti-IBA-1 polyclonal antibody, Rabbit/Wako, code 01127991, Wako Pure Chemical Industries Ltd., Osaka, Japan) diluted in tris buffer saline (pH 7.0) at 1:500 concentration for 72 hours.
Selective immunolabeling for T. gondii antigens utilized polyclonal antibodies from the Laboratory of Toxoplasmosis at Instituto Evandro Chagas. These antibodies were generated via oral inoculation of BALB/c mice with 25 µL of a suspension containing ten tissue cysts of T. gondii cystogenic strains (VEG) diluted in 0.9% saline. At 40-45 dpi, blood was collected, and the separated serum samples underwent modified agglutination tests for anti-T. gondii total antibody detection.
The same T. gondii antigen detection procedures were adapted for retinas and brain sections. Brain sections underwent antigen recovery in 0.2M boric acid solution pH 9.0 at 70°C for an hour, followed by permeabilization with 5% Triton X-100 in 0.1M saline phosphate buffer for 5 minutes. A 10% casein solution in 0.1M saline phosphate buffer was employed to minimize nonspecific labeling.
Retinas underwent collagenase treatment (0.01% in 0.1M PBS) for 10 minutes at room temperature to facilitate antibody penetration. Subsequently, they were washed and immersed in a solution of 10% methanol + 3% hydrogen peroxide in 0.1M PBS for 15 minutes, followed by immersion in 0.1M PBS Triton 5% twice for 5 minutes each.
Brain sections and retinas underwent the Mouse-on-Mouse (M.O.M.) protocol (M.O.M. kit, Vector Laboratories, Burlingame, CA, U.S.A.) with M.O.M. IgG blocking for 1 hour, primary antibody incubation for 72 hours, and subsequent incubation with secondary antibodies (Biotinylated, Anti-Mouse IgG, Anti-Rabbit IgG, Vector, code ZB0924, BA-1400).
To reveal horseradish peroxidase (HRP) activity, the glucose-oxidase-DAB-nickel method [53] was employed. Following appropriate agitation, retinas were mounted between two glass slides, while brain sections were mounted on gelatinized slides and left to dry at room temperature. After drying, the retinas and brain sections were counterstained with Giemsa and cresyl violet, respectively, followed by dehydration, and were cleared in alcohol and xylene. Coverslips were added with an embedding medium (Entellan).
The specificity of the immunohistochemical patterns was assessed by omitting the primary antibody [54].

4.4. Stereological Counting Procedures

- Microscopy and Optical fractionator
In brief, we delineated at all levels in the histological sections the region and layers of the dentate gyrus, digitizing directly from sections using low power 4.0x objective on an Optiphot-2 microscope (Nikon, Japan) equipped with a motorized stage (MAC200). This system was coupled to a computer running Stereo Investigator software (MicroBrightField) used to store and analyze the x, y, and z coordinates of digitized points to detect and count unambiguously the objects of interest in the dissector probe, low power objective was replaced by a 100x oil immersion plan apochromatic objective (NIKON, NA 1.4) to count microglia.
- Area and objects of interest
The frontiers of the molecular layer of the dentate gyrus are conspicuous; the border between the polymorphic layer and the CA3 region was arbitrarily defined in horizontal sections with a straight line that connected the tip of the pyramidal cell layer of the CA3 with the two tips of the granular cell layer. CA3 pyramidal and dentate gyrus granular layers appeared as distinct bands easily distinguished from the polymorphic layer. A straight line was used to distinguish the microglia of the CA3 from the microglia of the polymorphic layer. All other layers of the dentate gyrus can be distinguished from each other owing to their distinct appearance, and individual microglia were identified on the sections that had been immunoreacted for IBA-1 (See Figure S1).
After selectively immunolabeling the microglia, we quantified the IBA-1 immunolabeled cells in both control and infected mice using the optical fractionator method [55]. This technique is resistant to histological changes, including tissue shrinkage and damage-induced tissue expansion [56].
For each counting box placed at the molecular layer of the dentate gyrus, the section thickness was meticulously determined using the high-power objective, identifying the upper and lower bounds of the section. Microglial cell bodies that came into focus within the counting box were systematically counted and included in the overall marker sample. This ensures containment within the counting box or at the crossing of the acceptance lines, excluding contact with the rejection line [57].
Total cell numbers were estimated using the number-weighted section thickness to account for uneven cell thickness and distribution at each counting site. The arrangement of counting boxes within a grid was systematically and randomly conducted to achieve an acceptable methodological error coefficient (C.E. < 0.05), utilizing the coefficient of Scheaffer, a previously validated and tested parameter [58].
The estimation of total cell numbers via the optical fractionator involved multiplying the total counted markers within each counting box by three sampling fractions representing the section sampling fraction (ssf), area sampling fraction (asf), and thickness sampling fraction (tsf) after histological procedures. The equation used for estimating the total number of cells is given by:
N=ΣQ∗1/ssf∗1/asf∗1/tsf
where N represents the total number of cells, and ΣQ denotes the number of counted objects (markers) (55, 56, 59). Table 1 provides detailed stereological parameters.
Figure S1 is a composition of screen captures and photomicrographs, a low-power image capturing the molecular layer of the dentate gyrus (shaded green area) - A, along with a grid utilized for cell counting (B), delineating acceptance (green) and rejection (red) lines within counting boxes (C). Additionally, (D) presents high-power photomicrography focusing on the IBA-1 immunolabeled microglia, the object of interest. It is important to note that the counting probes are systematically placed at fixed intervals across the molecular layer of each section, ensuring uniform sampling probability across all regions.
The stereological outcomes from various experimental groups were subjected to parametric statistical analyses utilizing two-tailed t-tests. Differences between groups were deemed significant at a 95% confidence level (p < 0.05).
In the present study, the acceptable level of errors in the cell number estimations was determined by considering the ratio between the intrinsic error introduced by the methodology and the coefficient of variation. To express the accuracy of the estimates, the coefficient of error (CE) was used, and a value of CE ≤ 0 was considered appropriate. This is because the variance introduced by the estimation procedure contributes very little to the observed group variance [58,59,60]. The experimental parameters for IBA-1 cell marker and region were established in pilot experiments and applied consistently across all animals and regions of interest (Table 2).

4.5. Three-Dimensional Reconstructions

When an organism experiences a perturbation to brain homeostasis, microglia morphology often changes in an attempt restore homeostasis and prevent tissue damage [61,62]. It is believed that form and function are interconnected, and the morphology of microglia can be examined to determine its contribution to homeostasis and imbalance. Multiple reactive microglial states are selected by the discrimination of discrete perturbations within the brain parenchyma in both physiological and pathological conditions [63]. This substantial variability is reflected in the dispersion profiles in morphometric analyses of hundreds of cells reconstructed in each experimental group in the present work, requiring multivariate analysis for their morphological classification.
Microscopic three-dimensional reconstruction techniques, coupled with hierarchical cluster analysis of morphometric features, have been pivotal in classifying microglia across diverse species, elucidating their states under both homeostatic and non-homeostatic conditions (37, 50, 64, 65). This methodology provides an objective framework to characterize and quantify the observed morphological changes, offering insights into microglial alterations during normal homeostasis and neuropathological states [66,67,68].

4.6. Stereological Sampling Approach and Hierarchical Cluster Analysis to Classify Microglia

Here, we used hierarchical cluster and discriminant analyses to classify microglial morphology. Microglia in the molecular layer of the dentate gyrus were carefully examined using a 100× oil immersion plan fluoride objective at high resolution (Nikon, numerical aperture - NA 1.3, depth of field - DF = 0.19 µm).
We captured and processed images using Neurolucida Neuron Tracing Software (Neurolucida Explorer 11.03; M.B.F. Bioscience, Williston, VT, U.S.A.). To create three-dimensional (3D) reconstructions, images were acquired with a high-resolution video camera and displayed on H.D. monitors. The morphological intricacies of microglia were carefully digitized point by point using Neurolucida and 3D reconstructions exclusively performed on cells displaying unequivocally intact arbors, with exclusion criteria applied to cells possessing artificially damaged branches (either at the surface or base of the sections) or incomplete immunolabeling. Terminal branches, usually finer in structure, were systematically confirmed before cell selection for 3D reconstruction. Microglia were selectively labeled with the IBA-1 antibody, and the photomicrographs depicted various magnifications of microglia from the 6-month-old mice in the molecular layer of the dentate gyrus (Mol-DG). To address z-axis shrinkage, as detailed in prior work, we applied a correction factor of 75% based on established evidence (Carlo and Stevens 2011).
We used systematic random sampling to ensure equal probability of selecting all dentate gyrus regions in the sample. Random and systematic horizontal section samples were taken from sections covering the entire hippocampal formation. The Mol-DG boxed areas were marked to indicate the location of individual microglia that were selected for 3-D reconstruction. Figure S1D provides a detailed, high-powered view of IBA-1 immunolabeled microglia.
To assess the morphological features in uninfected (control) and T. gondii-infected mice, we employed multivariate hierarchical cluster analysis, a methodology previously applied to classify neuronal types in the nucleus of the solitary tract [69] astrocytes in the dentate gyrus [70], and microglia in the hypoglossal nucleus [68]. We used morphometric features with multimodality indices (M.M.I.) above 0.55 and applied Ward’s hierarchical clustering method, as Schweitzer and Renehan (1997) suggested. We estimated the MMI based on the skewness and kurtosis of our sample for each morphometric variable as MMI = [M32 +1] / [M4 + 3 (n - 1)2 / (n – 2) (n – 3)], where M3 is skewness, M4 is kurtosis, and n is the sample size [69,70,71].
Some morphological features showed multimodality indices (M.M.I.) greater than 0.55. This indicates that their distributions were potentially multimodal or at least bimodal. The morphological classification was explained using a dendrogram and Ward’s method with standardized variables. Discriminant function analysis was then performed to determine the primary variables contributing to cluster formation. This analysis aimed to determine whether the clusters of cell morphologies significantly differed in the mean value of a particular variable. Based on that variable, group membership could be predicted.
We used multivariate F-tests to compare matrices of total variances and covariances to identify any significant differences between groups of variables with M.M.I.s exceeding 0.55. This procedure helped us to identify the morphometric variables that best differentiated the suggested microglia classes identified by cluster analysis. We also computed arithmetic means and standard deviations for the selected variables that proved to be the most reliable predictors for the microglia groups.
We conducted t-tests and two-way ANOVA to find microglia cluster differences within groups. We aimed to detect morphological variances in microglia morphometric features from the dentate gyrus of control and infected mice. We selected a representative cell for each group from three dentate gyrus cell types in control and infected mice. We used a distance matrix to identify the cell closest to all others, indicating its representativeness. This involved calculating a weighted scalar Euclidean distance between all cell pairs within a group, using the STATISTICA data analysis software, version 12, StatSoft, Inc. (2014), for the Euclidean distance matrices and sum of distances.
For behavior changes, we used ANY-maze, Biostat 5.4, and GraphPad Prism 9 for statistical analysis, removing outliers based on standard deviation. t-tests for two related samples on open-field test results and two-way ANOVA assessed interactions between experimental conditions and disease progression over time, were used.

5. Conclusions

In this study, we investigated the alterations in the microglia within the molecular layer of the dentate gyrus and examined the behavioral responses of two mouse strains, BALB/c and Swiss albino, to ocular toxoplasmosis infection. Our results, in conjunction with findings from other researchers, underscore the pivotal role of inflammation in influencing the severity of toxoplasmosis outcomes. Noteworthy is our observation of distinct differences in disease progression between the two mouse strains, highlighting the central role of the inflammatory response in determining an infected hosts capacity to either tolerate or combat the infection. Specifically, the findings point towards a compromised inflammatory response in Swiss albino mice, suggesting that the efficacy of tolerating or resisting Toxoplasma gondii infection is intricately linked to how inflammation is sensed. This research sheds light on the intricate relationship between microglial activation, the inflammatory process, and the hosts defense mechanisms against pathogenic invasions.

Supplementary Materials

The following supporting information can be downloaded at the website of this paper posted on Preprints.org, Figure S1 and Figure S2.

Author Contributions

All listed authors contributed substantially to the conception or design of the work; the acquisition, analysis, or interpretation of data for the work; drafting the work or revising it critically for important intellectual content; and final approval of the version to be published; and agreed to be accountable for all aspects of the work in ensuring that questions related to the accuracy or integrity of any part of the work are appropriately investigated and resolved. DA, DB, CWPD and DGD participated in the data interpretation and contributed to final edition.

Funding

CWPD was supported by Brazilian Research Council - CNPq Grant No: 301268/2019-3 and 407075/2021-6, Fundação Amazônia de Amparo a Estudos e Pesquisas do Pará - FAPESPA, ICAAF No 039/2017, Pró-Reitoria de Pesquisa e Pós-Graduação da Universidade Federal do Pará - PROPESP Edital 2021-PIAPA; Coordenação de Aperfeiçoamento de Pessoal de Nível Superior - CAPES - Pró-Amazônia, Grant No. 3311/2013. DB was supported by Fundação para a Ciência e Tecnologia (FCT-PTDC/MED-NEU/2382/2021, LISBOA-01-0145-FEDER-031395, UIDB/04138/2020 and UIDP/04138/2020).

Institutional Review Board Statement

The experiments were conducted according to the recommendations in the Guide of the National Institutes of Health (N.I.H., U.S.A.) for the use of experimental animals and by the ethics committee of the Institute of Biological Sciences at the Federal University of UFPA, under Protocol No. 7961160818. In this study, the parasite sample of T. gondii used was obtained from the Laboratory of Toxoplasmosis of the Evandro Chagas Institute - I.E.C. All efforts were made to minimize the number of animals used and the stress and discomfort to animals.

Informed Consent Statement

Not applicable.

Data Availability Statement

The data presented in this study are available on request from the corresponding author.

Conflicts of Interest

The authors declare that they have no conflict of interest.

References

  1. Molan, A.; Nosaka, K.; Hunter, M.; Wang, W. Global status of Toxoplasma gondii infection: systematic review and prevalence snapshots. Trop Biomed. 2019, 36, 898–925. [Google Scholar]
  2. Ben-Harari, R.R.; Connolly, M.P. High burden and low awareness of toxoplasmosis in the United States. Postgrad. Med. 2019, 131, 103–108. [Google Scholar] [CrossRef] [PubMed]
  3. Wang, T.; Han, Y.; Pan, Z.; Wang, H.; Yuan, M.; Lin, H. Seroprevalence of Toxoplasma gondii infection in blood donors in mainland China: a systematic review and meta-analysis. Parasite 2018, 25, 36. [Google Scholar] [CrossRef] [PubMed]
  4. Owusu-Dommey, A.; Pogreba-Brown, K.; Villa-Zapata, L. Seroprevalence of Toxoplasma gondii in the U.S.: Evidence from a representative cross-sectional survey. Parasitol. Int. 2020, 79, 102175. [Google Scholar] [CrossRef] [PubMed]
  5. Aerts, R.; Mehra, V.; Groll, A.H.; Martino, R.; Lagrou, K.; Robin, C.; Perruccio, K.; Blijlevens, N.; Nucci, M.; Slavin, M.; et al. Guidelines for the management of Toxoplasma gondii infection and disease in patients with haematological malignancies and after haematopoietic stem-cell transplantation: guidelines from the 9th European Conference on Infections in Leukaemia, 2022. Lancet Infect. Dis. 2023. [Google Scholar] [CrossRef]
  6. Medzhitov, R.; Schneider, D.S.; Soares, M.P. Disease Tolerance as a Defense Strategy. Science 2012, 335, 936–941. [Google Scholar] [CrossRef]
  7. Rivas, F.V.; Chervonsky, A.V.; Medzhitov, R. ART and immunology. Trends Immunol. 2014, 35, 451. [Google Scholar] [CrossRef]
  8. Chen, W.; Gullett, J.M.; Tweedell, R.E.; Kanneganti, T. Innate immune inflammatory cell death: PANoptosis and PANoptosomes in host defense and disease. Eur. J. Immunol. 2023, 53, e2250235. [Google Scholar] [CrossRef]
  9. Ahmadpour, E.; Babaie, F.; Kazemi, T.; Mehrani Moghaddam, S.; Moghimi, A.; Hosseinzadeh, R.; et al. Overview of Apoptosis, Autophagy, and Inflammatory Processes in. Pathogens. 2023, 12. [Google Scholar]
  10. Johnson, H.J.; Koshy, A.A. Latent Toxoplasmosis Effects on Rodents and Humans: How Much is Real and How Much is Media Hype? mBio. 2020, 11. [Google Scholar] [CrossRef]
  11. Tong, W.H.; Pavey, C.; O’handley, R.; Vyas, A. Behavioral biology of Toxoplasma gondii infection. Parasites Vectors 2021, 14, 1–6. [Google Scholar] [CrossRef]
  12. Suzuki, Y. The immune system utilizes two distinct effector mechanisms of T cells depending on two different life cycle stages of a single pathogen, Toxoplasma gondii, to control its cerebral infection. Parasitol. Int. 2020, 76, 102030–102030. [Google Scholar] [CrossRef] [PubMed]
  13. Watson, G.F.; Davis, P.H. Systematic review and meta-analysis of variation in Toxoplasma gondii cyst burden in the murine model. Exp. Parasitol. 2019, 196, 55–62. [Google Scholar] [CrossRef] [PubMed]
  14. Melchor, S.J.; Ewald, S.E. Disease Tolerance in. Front Cell Infect Microbiol. 2019, 9, 185. [Google Scholar] [CrossRef] [PubMed]
  15. Melchor, S.J.; Saunders, C.M.; Sanders, I.; Hatter, J.A.; Byrnes, K.A.; Coutermarsh-Ott, S.; Ewald, S.E. IL-1R Regulates Disease Tolerance and Cachexia in Toxoplasma gondii Infection. J. Immunol. 2020, 204, 3329–3338. [Google Scholar] [CrossRef]
  16. Silva, R.C.M.C.; Travassos, L.H.; Paiva, C.N.; Bozza, M.T. Heme oxygenase-1 in protozoan infections: A tale of resistance and disease tolerance. PLOS Pathog. 2020, 16, e1008599. [Google Scholar] [CrossRef]
  17. Melo, M.B.; Jensen, K.D.; Saeij, J.P. Toxoplasma gondii effectors are master regulators of the inflammatory response. Trends Parasitol. 2011, 27, 487–495. [Google Scholar] [CrossRef]
  18. Piotti, P.; Pierantoni, L.; Albertini, M.; Pirrone, F. Inflammation and Behavior Changes in Dogs and Cats. Veter- Clin. North Am. Small Anim. Pr. 2024, 54, 1–16. [Google Scholar] [CrossRef]
  19. Kealy, J.; Murray, C.; Griffin, E.W.; Lopez-Rodriguez, A.B.; Healy, D.; Tortorelli, L.S.; Lowry, J.P.; Watne, L.O.; Cunningham, C. Acute Inflammation Alters Brain Energy Metabolism in Mice and Humans: Role in Suppressed Spontaneous Activity, Impaired Cognition, and Delirium. J. Neurosci. 2020, 40, 5681–5696. [Google Scholar] [CrossRef]
  20. Mahmoud, M.E.; Fereig, R.; Nishikawa, Y. Involvement of Host Defense Mechanisms against Toxoplasma gondii Infection in Anhedonic and Despair-Like Behaviors in Mice. Infect. Immun. 2017, 85. [Google Scholar] [CrossRef]
  21. Estato, V.; Stipursky, J.; Gomes, F.; Mergener, T.C.; Frazão-Teixeira, E.; Allodi, S.; Tibiriçá, E.; Barbosa, H.S.; Adesse, D. The Neurotropic Parasite Toxoplasma gondii Induces Sustained Neuroinflammation with Microvascular Dysfunction in Infected Mice. Am. J. Pathol. 2018, 188, 2674–2687. [Google Scholar] [CrossRef] [PubMed]
  22. Barrios, L.C.; Pinheiro, A.P.D.S.; Gibaldi, D.; Silva, A.A.; e Silva, P.M.R.; Roffê, E.; Santiago, H.d.C.; Gazzinelli, R.T.; Mineo, J.R.; Silva, N.M.; et al. Behavioral alterations in long-term Toxoplasma gondii infection of C57BL/6 mice are associated with neuroinflammation and disruption of the blood brain barrier. PLOS ONE 2021, 16, e0258199. [Google Scholar] [CrossRef] [PubMed]
  23. Dos Santos, S.E.; Medeiros, M.; Porfirio, J.; Tavares, W.; Pessôa, L.; Grinberg, L.; Leite, R.E.; Ferretti-Rebustini, R.E.L.; Suemoto, C.K.; Filho, W.J.; et al. Similar Microglial Cell Densities across Brain Structures and Mammalian Species: Implications for Brain Tissue Function. J. Neurosci. 2020, 40, 4622–4643. [Google Scholar] [CrossRef]
  24. Masuda, T.; Sankowski, R.; Staszewski, O.; Prinz, M. Microglia Heterogeneity in the Single-Cell Era. Cell Rep. 2020, 30, 1271–1281. [Google Scholar] [CrossRef]
  25. E Hirbec, H.; Noristani, H.N.; Perrin, F.E. Microglia Responses in Acute and Chronic Neurological Diseases: What Microglia-Specific Transcriptomic Studies Taught (and did Not Teach) Us. Front Aging Neurosci. 2017, 9, 227. [Google Scholar] [CrossRef]
  26. Bollinger, J.L.; Collins, K.E.; Patel, R.; Wellman, C.L. Behavioral stress alters corticolimbic microglia in a sex- and brain region-specific manner. PLOS ONE 2017, 12, e0187631–e0187631. [Google Scholar] [CrossRef] [PubMed]
  27. Sierra, A.; Paolicelli, R.C.; Kettenmann, H. Cien Años de Microglía: Milestones in a Century of Microglial Research. Trends Neurosci. 2019, 42, 778–792. [Google Scholar] [CrossRef]
  28. Nimmerjahn, A.; Kirchhoff, F.; Helmchen, F. Resting Microglial Cells Are Highly Dynamic Surveillants of Brain Parenchyma in Vivo. Science 2005, 308, 1314–1318. [Google Scholar] [CrossRef]
  29. Hart, A.D.; Wyttenbach, A.; Perry, V.H.; Teeling, J.L. Age related changes in microglial phenotype vary between CNS regions: Grey versus white matter differences. Brain, Behav. Immun. 2012, 26, 754–765. [Google Scholar] [CrossRef]
  30. Lawson, L.J.; Perry, V.H.; Dri, P.; Gordon, S. Heterogeneity in the distribution and morphology of microglia in the normal adult mouse brain. Neuroscience 1990, 39, 151–170. [Google Scholar] [CrossRef]
  31. Gorse, K.M.; Lafrenaye, A.D. The Importance of Inter-Species Variation in Traumatic Brain Injury-Induced Alterations of Microglial-Axonal Interactions. Front. Neurol. 2018, 9, 778. [Google Scholar] [CrossRef] [PubMed]
  32. Geirsdottir, L.; David, E.; Keren-Shaul, H.; Weiner, A.; Bohlen, S.C.; Neuber, J.; Balic, A.; Giladi, A.; Sheban, F.; Dutertre, C.-A.; et al. Cross-Species Single-Cell Analysis Reveals Divergence of the Primate Microglia Program. Cell 2019, 179, 1609–1622. [Google Scholar] [CrossRef] [PubMed]
  33. Wolf, S.A.; Boddeke, H.W.G.M.; Kettenmann, H. Microglia in Physiology and Disease. Annu. Rev. Physiol. 2017, 79, 619–643. [Google Scholar] [CrossRef]
  34. Stratoulias, V.; Venero, J.L.; Tremblay, M.-È.; Joseph, B. Microglial subtypes: diversity within the microglial community. EMBO J. 2019, 38, e101997. [Google Scholar] [CrossRef] [PubMed]
  35. Savage, J.C.; Carrier, M.; Tremblay, M.-. Ève Morphology of Microglia Across Contexts of Health and Disease. Methods Mol. Biol. 2019, 2034, 13–26. [Google Scholar] [CrossRef] [PubMed]
  36. Fernández-Arjona, M.D.M.; Grondona, J.M.; Fernández-Llebrez, P.; López-Ávalos, M.D. Microglial Morphometric Parameters Correlate With the Expression Level of IL-1β, and Allow Identifying Different Activated Morphotypes. Front Cell Neurosci. 2019, 13, 472. [Google Scholar] [CrossRef] [PubMed]
  37. Fernández-Arjona, M.d.M.; Grondona, J.M.; Granados-Durán, P.; Fernández-Llebrez, P.; López-Ávalos, M.D. Microglia Morphological Categorization in a Rat Model of Neuroinflammation by Hierarchical Cluster and Principal Components Analysis. Front. Cell. Neurosci. 2017, 11, 235–235. [Google Scholar] [CrossRef] [PubMed]
  38. Savage, J.C.; St-Pierre, M.-K.; Hui, C.W.; Tremblay, M.-E. Microglial Ultrastructure in the Hippocampus of a Lipopolysaccharide-Induced Sickness Mouse Model. Front. Neurosci. 2019, 13, 1340. [Google Scholar] [CrossRef] [PubMed]
  39. Paolicelli, R.C.; Sierra, A.; Stevens, B.; Tremblay, M.-E.; Aguzzi, A.; Ajami, B.; Amit, I.; Audinat, E.; Bechmann, I.; Bennett, M.; et al. Microglia states and nomenclature: A field at its crossroads. Neuron 2022, 110, 3458–3483. [Google Scholar] [CrossRef]
  40. Johnson, S.K.; Johnson, P.T. Toxoplasmosis: Recent Advances in Understanding the Link Between Infection and Host Behavior. Annu. Rev. Anim. Biosci. 2021, 9, 249–264. [Google Scholar] [CrossRef]
  41. Sasai, M.; Pradipta, A.; Yamamoto, M. Host immune responses toToxoplasma gondii. Int. Immunol. 2018, 30, 113–119. [Google Scholar] [CrossRef]
  42. Suzuki, Y.; Orellana, M.A.; Schreiber, R.D.; Remington, J.S. Interferon-gamma: the major mediator of resistance against Toxoplasma gondii. Science. 1988, 240, 516–518. [Google Scholar] [CrossRef]
  43. Jeffers, V.; Tampaki, Z.; Kim, K.; Sullivan, W.J. A latent ability to persist: differentiation in Toxoplasma gondii. Cell. Mol. Life Sci. 2018, 75, 2355–2373. [Google Scholar] [CrossRef]
  44. Xiao, J.; Li, Y.; Prandovszky, E.; Kannan, G.; Viscidi, R.P.; Pletnikov, M.V.; Yolken, R.H. Behavioral Abnormalities in a Mouse Model of Chronic Toxoplasmosis Are Associated with MAG1 Antibody Levels and Cyst Burden. PLOS Neglected Trop. Dis. 2016, 10, e0004674–e0004674. [Google Scholar] [CrossRef]
  45. Afonso, C.; Paixão, V.B.; Costa, R.M. Chronic Toxoplasma Infection Modifies the Structure and the Risk of Host Behavior. PLOS ONE 2012, 7, e32489. [Google Scholar] [CrossRef]
  46. Shen, B.; Yuan, Y.; Cheng, J.; Pan, M.; Xia, N.; Zhang, W.; Wang, Y.; Zhou, Y.; Zhao, J. Activation of chronic toxoplasmosis by transportation stress in a mouse model. Oncotarget 2016, 7, 87351–87360. [Google Scholar] [CrossRef]
  47. Sullivan, W.J.; Jeffers, V. Mechanisms of Toxoplasma gondii persistence and latency. FEMS Microbiol Rev. 2012, 36, 717–733. [Google Scholar] [CrossRef]
  48. Suzuki, Y.; Claflin, J.; Wang, X.; Lengi, A.; Kikuchi, T. Microglia and macrophages as innate producers of interferon-gamma in the brain following infection with Toxoplasma gondii. Int. J. Parasitol. 2005, 35, 83–90. [Google Scholar] [CrossRef]
  49. Soares, G.L.d.S.; de Leão, E.R.L.P.; Freitas, S.F.; Alves, R.M.C.; Tavares, N.d.P.; Costa, M.V.N.; de Menezes, G.C.; de Oliveira, J.H.P.; Guerreiro, L.C.F.; de Assis, A.C.L.; et al. Behavioral and Neuropathological Changes After Toxoplasma gondii Ocular Conjunctival Infection in BALB/c Mice. Front. Cell. Infect. Microbiol. 2022, 12, 812152. [Google Scholar] [CrossRef]
  50. de Sousa, A.A.; dos Reis, R.R.; de Lima, C.M.; de Oliveira, M.A.; Fernandes, T.N.; Gomes, G.F.; et al. Three-dimensional morphometric analysis of microglial changes in a mouse model of virus encephalitis: age and environmental influences. European Journal of Neuroscience. 2015, 42, 2036–2050. [Google Scholar] [CrossRef]
  51. Rosso, M.; Wirz, R.; Loretan, A.V.; Sutter, N.A.; da Cunha, C.T.P.; Jaric, I.; Würbel, H.; Voelkl, B. Reliability of common mouse behavioural tests of anxiety: A systematic review and meta-analysis on the effects of anxiolytics. Neurosci. Biobehav. Rev. 2022, 143, 104928. [Google Scholar] [CrossRef]
  52. Ennaceur, A. Tests of unconditioned anxiety — Pitfalls and disappointments. Physiol. Behav. 2014, 135, 55–71. [Google Scholar] [CrossRef] [PubMed]
  53. Shu, S.; Ju, G.; Fan, L. The glucose oxidase-DAB-nickel method in peroxidase histochemistry of the nervous system. Neurosci. Lett. 1988, 85, 169–171. [Google Scholar] [CrossRef]
  54. Saper, C.B.; Sawchenko, P.E. Magic peptides, magic antibodies: Guidelines for appropriate controls for immunohistochemistry. J. Comp. Neurol. 2003, 465, 161–163. [Google Scholar] [CrossRef]
  55. West, M.J. Design-based stereological methods for counting neurons. Prog Brain Res. 2002, 135, 43–51. [Google Scholar]
  56. West, M.J.; Slomianka, L.; Gundersen, H.J. Unbiased stereological estimation of the total number of neurons in thesubdivisions of the rat hippocampus using the optical fractionator. Anat Rec. 1991, 231, 482–497. [Google Scholar] [CrossRef]
  57. Gundersen, H.J.G.; Jensen, E.B. The efficiency of systematic sampling in stereology and its prediction*. J. Microsc. 1987, 147, 229–263. [Google Scholar] [CrossRef]
  58. Glaser, E.M.; Wilson, P.D. The coefficient of error of optical fractionator population size estimates: a computer simulation comparing three estimators. J. Microsc. 1998, 192, 163–171. [Google Scholar] [CrossRef]
  59. West, M.J. Stereological methods for estimating the total number of neurons and synapses: issues of precision and bias. Trends Neurosci. 1999, 22, 51–61. [Google Scholar] [CrossRef]
  60. Slomianka, L.; West, M. Estimators of the precision of stereological estimates: An example based on the CA1 pyramidal cell layer of rats. Neuroscience 2005, 136, 757–767. [Google Scholar] [CrossRef]
  61. Tan, Y.-L.; Yuan, Y.; Tian, L. Microglial regional heterogeneity and its role in the brain. Mol. Psychiatry 2019, 25, 351–367. [Google Scholar] [CrossRef] [PubMed]
  62. Bernier, L.P.; Bohlen, C.J.; York, E.M.; Choi, H.B.; Kamyabi, A.; Dissing-Olesen, L.; et al. Nanoscale Surveillance of the Brain by Microglia via cAMP-Regulated Filopodia. Cell Rep. 2019, 27, 2895–2908e4. [Google Scholar] [CrossRef] [PubMed]
  63. Illes, P.; Rubini, P.; Ulrich, H.; Zhao, Y.; Tang, Y. Regulation of Microglial Functions by Purinergic Mechanisms in the Healthy and Diseased CNS. Cells 2020, 9, 1108. [Google Scholar] [CrossRef] [PubMed]
  64. Creão, L.S.d.S.; Neto, J.B.T.; de Lima, C.M.; dos Reis, R.R.; de Sousa, A.A.; dos Santos, Z.A.; Diniz, J.A.P.; Diniz, D.G.; Diniz, C.W.P. Microglial Metamorphosis in Three Dimensions in Virus Limbic Encephalitis: An Unbiased Pictorial Representation Based on a Stereological Sampling Approach of Surveillant and Reactive Microglia. Brain Sci. 2021, 11, 1009. [Google Scholar] [CrossRef] [PubMed]
  65. Carvalho-Paulo, D. ; JB T, C SF, TCG O, AA dS, RR R, et al. Microglial morphology across distantly related species: phylogenetic, environmental and age influences on microglia reactive and surveillance states. Frontiers in Immunology [Internet]. 2021, 12:[12, 683026 p.].
  66. Torres-Platas, S.G.; Comeau, S.; Rachalski, A.; Bo, G.D.; Cruceanu, C.; Turecki, G.; Giros, B.; Mechawar, N. Morphometric characterization of microglial phenotypes in human cerebral cortex. J. Neuroinflammation 2014, 11, 12–12. [Google Scholar] [CrossRef] [PubMed]
  67. Papageorgiou, I.E.; Fetani, A.F.; Lewen, A.; Heinemann, U.; Kann, O. Widespread activation of microglial cells in the hippocampus of chronic epileptic rats correlates only partially with neurodegeneration. Anat. Embryol. 2014, 220, 2423–2439. [Google Scholar] [CrossRef] [PubMed]
  68. Yamada, J.; Jinno, S. Novel objective classification of reactive microglia following hypoglossal axotomy using hierarchical cluster analysis. J. Comp. Neurol. 2012, 521, 1184–1201. [Google Scholar] [CrossRef] [PubMed]
  69. Schweitzer, L.; Renehan, W. The use of cluster analysis for cell typing. Brain Res. Protoc. 1997, 1, 100–108. [Google Scholar] [CrossRef] [PubMed]
  70. Diniz, D.G.; de Oliveira, M.A.; de Lima, C.M.; Fôro, C.A.R.; Sosthenes, M.C.K.; Bento-Torres, J.; Vasconcelos, P.F.d.C.; Anthony, D.C.; Diniz, C.W.P. Age, environment, object recognition and morphological diversity of GFAP-immunolabeled astrocytes. Behav. Brain Funct. 2016, 12, 1–19. [Google Scholar] [CrossRef]
  71. Kolb, H.; Fernandez, E.; Schouten, J.; Ahnelt, P.; Linberg, K.A.; Fisher, S.K. Are there three types of horizontal cell in the human retina? J Comp Neurol. 1994, 343, 370–386. [Google Scholar] [CrossRef]
  72. Råberg, L.; Graham, A.L.; Read, A.F. Decomposing health: tolerance and resistance to parasites in animals. Philos. Trans. R. Soc. B: Biol. Sci. 2008, 364, 37–49. [Google Scholar] [CrossRef]
  73. Zhang, Y.; He, J.; Zheng, H.; Huang, S.; Lu, F. Association of TREM-1, IL-1β, IL-33/ST2, and TLR Expressions With the Pathogenesis of Ocular Toxoplasmosis in Mouse Models on Different Genetic Backgrounds. Front. Microbiol. 2019, 10, 2264. [Google Scholar] [CrossRef]
  74. Lee, J.-H.; Yuk, J.-M.; Cha, G.-H.; Lee, Y.-H. Expression of cytokines and co-stimulatory molecules in the Toxoplasma gondii-infected dendritic cells of C57BL/6 and BALB/c mice. Parasites, Hosts Dis. 2023, 61, 138–146. [Google Scholar] [CrossRef]
  75. Bergersen, K.V.; Barnes, A.; Worth, D.; David, C.; Wilson, E.H. Targeted Transcriptomic Analysis of C57BL/6 and BALB/c Mice During Progressive Chronic Toxoplasma gondii Infection Reveals Changes in Host and Parasite Gene Expression Relating to Neuropathology and Resolution. Front. Cell. Infect. Microbiol. 2021, 11. [Google Scholar] [CrossRef] [PubMed]
  76. Biswas, A.; Bruder, D.; Wolf, S.A.; Jeron, A.; Mack, M.; Heimesaat, M.M.; et al. Ly6C(high) monocytes control cerebral toxoplasmosis. J Immunol. 2015, 194, 3223–3235. [Google Scholar] [CrossRef]
  77. Zhao, Y.; Reyes, J.; Rovira-Diaz, E.; Fox, B.A.; Bzik, D.J.; Yap, G.S. Cutting Edge: CD36 Mediates Phagocyte Tropism and Avirulence of Toxoplasma gondii. J. Immunol. 2021, 207, 1507–1512. [Google Scholar] [CrossRef] [PubMed]
  78. Hwang, Y.S.; Shin, J.-H.; Yang, J.-P.; Jung, B.-K.; Lee, S.H.; Shin, E.-H. Characteristics of Infection Immunity Regulated by Toxoplasma gondii to Maintain Chronic Infection in the Brain. Front. Immunol. 2018, 9, 158. [Google Scholar] [CrossRef] [PubMed]
  79. Blanchard, N.; Dunay, I.R.; Schlüter, D. Persistence of Toxoplasma gondii in the central nervous system: a fine-tuned balance between the parasite, the brain and the immune system. Parasite Immunol. 2015, 37, 150–158. [Google Scholar] [CrossRef]
  80. Bezerra, E.C.M.; dos Santos, S.V.; dos Santos, T.C.C.; de Andrade, H.F.; Meireles, L.R. Behavioral evaluation of BALB/c (Mus musculus) mice infected with genetically distinct strains of Toxoplasma gondii. Microb. Pathog. 2018, 126, 279–286. [Google Scholar] [CrossRef]
  81. Dubey, J.P.; Ferreira, L.R.; Martins, J.; McLeod, R. Oral oocyst-induced mouse model of toxoplasmosis: effect of infection with Toxoplasma gondii strains of different genotypes, dose, and mouse strains (transgenic, out-bred, in-bred) on pathogenesis and mortality. Parasitology. 2012, 139, 1–13. [Google Scholar] [CrossRef]
  82. Saeij, J.P.; Boyle, J.P.; Boothroyd, J.C. Differences among the three major strains of Toxoplasma gondii and their specific interactions with the infected host. Trends Parasitol. 2005, 21, 476–481. [Google Scholar] [CrossRef] [PubMed]
  83. Calero-Bernal, R.; Fernández-Escobar, M.; Katzer, F.; Su, C.; Ortega-Mora, L.M. Unifying Virulence Evaluation in Toxoplasma gondii: A Timely Task. Front. Cell. Infect. Microbiol. 2022, 12, 868727. [Google Scholar] [CrossRef] [PubMed]
  84. Desmettre, T. Toxoplasmosis and behavioural changes. 2020, 43, e89–e93. [CrossRef]
  85. Pittman, K.J.; Aliota, M.T.; Knoll, L.J. Dual transcriptional profiling of mice and Toxoplasma gondii during acute and chronic infection. BMC Genom. 2014, 15, 806. [Google Scholar] [CrossRef] [PubMed]
  86. Radke, J.B.; Worth, D.; Hong, D.; Huang, S.; Sullivan, W.J.; Wilson, E.H.; White, M.W. Transcriptional repression by ApiAP2 factors is central to chronic toxoplasmosis. PLOS Pathog. 2018, 14, e1007035. [Google Scholar] [CrossRef] [PubMed]
  87. Bergersen, K.V.; Ramirez, A.D.; Kavvathas, B.; Mercer, F.; Wilson, E.H. Human neutrophil-like cells demonstrate antimicrobial responses to the chronic cyst form of Toxoplasma gondii. Parasite Immunol. 2023, 45, e13011. [Google Scholar] [CrossRef] [PubMed]
  88. Suzuki, Y.; Lutshumba, J.; Chen, K.C.; Abdelaziz, M.H.; Sa, Q.; Ochiai, E. IFN-γ production by brain-resident cells activates cerebral mRNA expression of a wide spectrum of molecules critical for both innate and T cell-mediated protective immunity to control reactivation of chronic infection with Toxoplasma gondii. Front. Cell. Infect. Microbiol. 2023, 13, 1110508. [Google Scholar] [CrossRef]
  89. Carlo, C.; Stevens, C. Analysis of differential shrinkage in frozen brain sections and its implications for the use of guard zones in stereology. J. Comp. Neurol. 2011, 519, 2803–2810. [Google Scholar] [CrossRef]
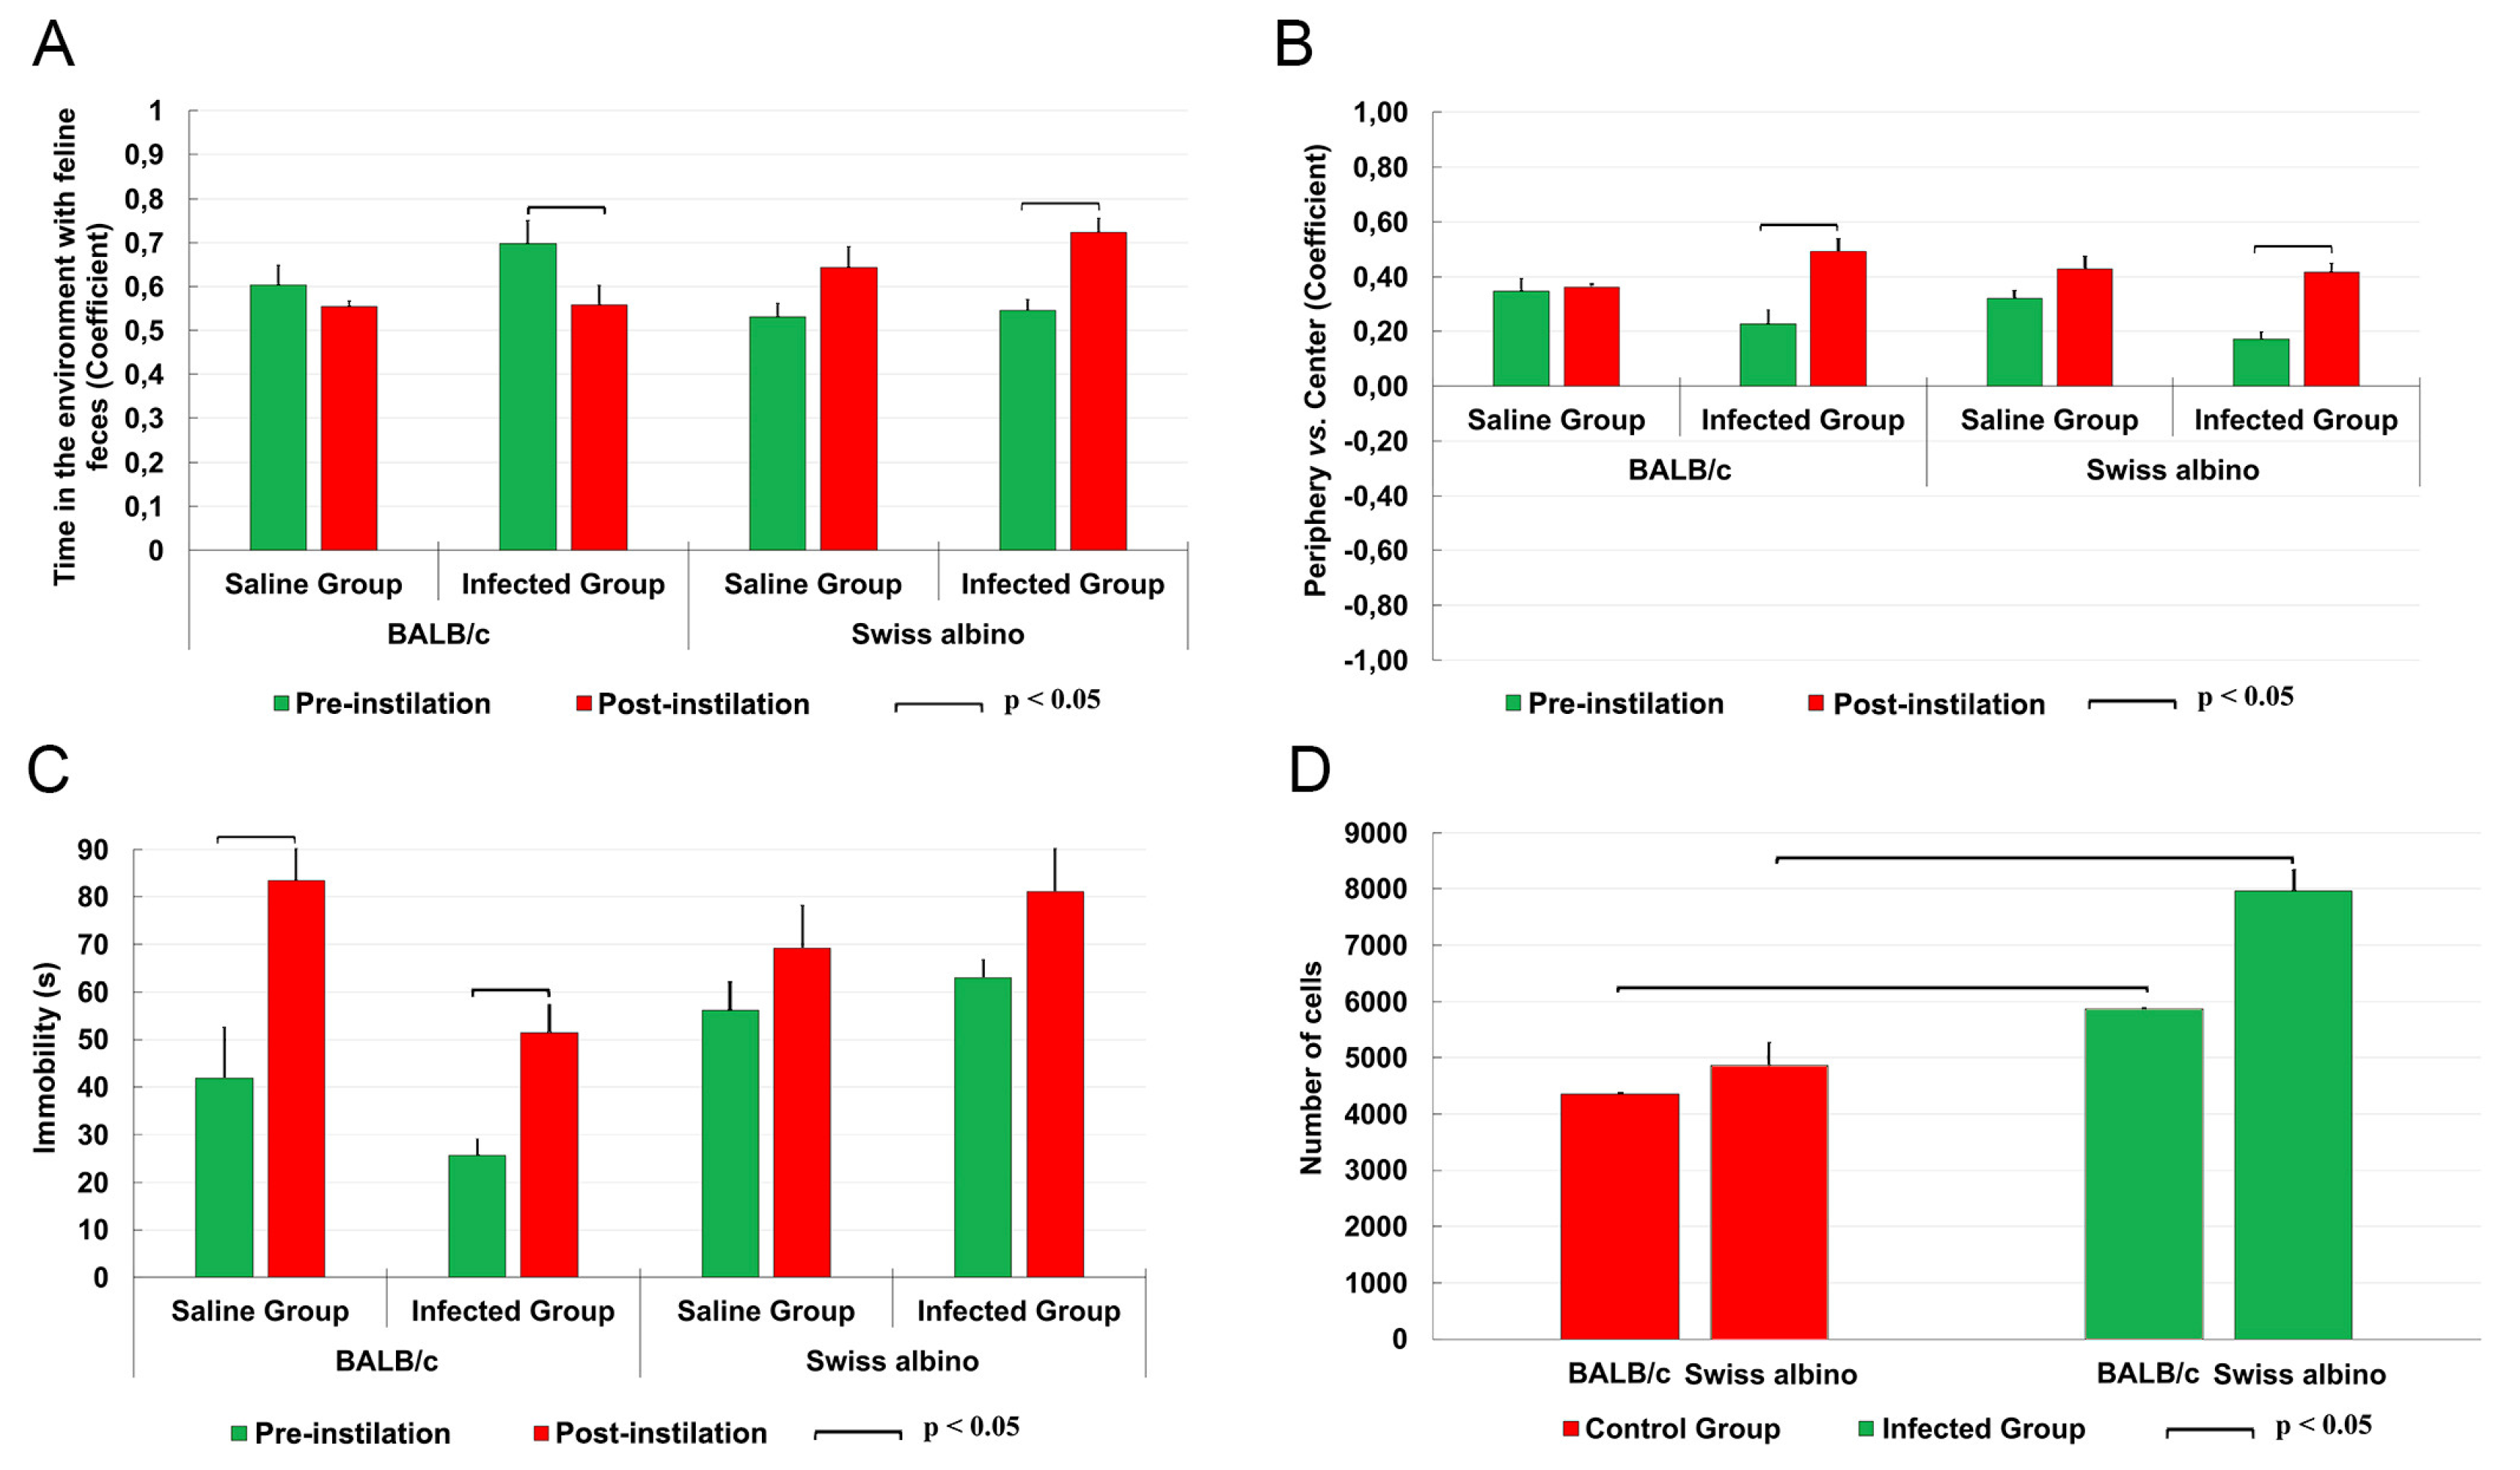
Figure 1. Comparative behavioral changes (A-C) and stereological estimation of total microglial numbers in the molecular layer of the dentate gyrus (D) in infected (green columns) and control (red columns) mice. Olfactory findings in infected mice (A) revealed a significant increase (BALB/c) and reduction (Swiss albino) in time spent in compartments with feline odorants compared to controls. In the open field arena, infected BALB/c mice displayed a significant increase in immobility compared to controls, while Swiss albino mice maintained their mobility levels (B); both strains showed consistent distribution patterns between the center and periphery of the open field (C). Notably, infected mice from both strains exhibited a significant increase in the total number of microglia (D).
Preprints 104321 g001
Figure 2. Dendrogram resulting from hierarchical cluster analysis applied to multimodal variables extracted from 3D reconstructions of microglia in the molecular layer of the dentate gyrus of control animals (top) and T. gondii infected (down) Swiss albino mice. Observe three distinct morphological families in both control and infected groups, with notable shifts in the percentage values of the morphotype III following infection.
Preprints 104321 g002
Figure 3. Dendrogram resulting from hierarchical cluster analysis applied to the multimodal variables found in the 3D reconstructions of microglia in the molecular layer of the dentate gyrus of control animals (above) and infected (below) BALB/c mice. The relative percentage shifts in morphological types exhibit subtle alterations after ocular infection by T. gondii in the BALB/c lineage.
Preprints 104321 g003
Figure 4. Graphic representations of discriminant analysis and corresponding tables displaying the relative contributions of morphometric variables influencing cluster formation in control (A) and infected (B) groups within the Swiss albino lineage. Note the distinctive shift in the relative proportion of type III microglia (depicted as blue dots), along with the proportional decrease in types I (black dots) and II (red dots) among the infected subjects.
Preprints 104321 g004
Figure 5. Graphic representations of discriminant analysis and corresponding tables displaying the relative contributions of morphometric variables influencing cluster formation in control (A) and infected (B) groups within the Swiss albino lineage. Note the distinctive shift in the relative proportion of type III microglia (depicted as blue dots), along with the proportional decrease in types I (black dots) and II (red dots) among the infected subjects.
Preprints 104321 g005
Figure 6. Microglial morphological alterations induced by T. gondii ocular infection in the molecular layer of the dentate gyrus of BALB/c and Swiss albino mice. Each row exhibits cells representing the average of Type I, II, and III categories, illustrating a spectrum of progressive morphological complexity. These categories denote variations in morphological features, particularly greater convex hull volume and morphological complexity, which were identified as key contributing variables for cluster formation within each experimental group. Notably, both strains displayed significant yet opposed microglial morphological changes: BALB/c mice exhibited extended microglial branches by 22 dpi, whereas Swiss albino counterparts showed shortened branches by 12 dpi. Horizontal and vertical scale bars: 25µm.
Preprints 104321 g006
Figure 7. Graphic representation of mean values and standard errors of the morphometric features of microglia of the molecular layer of dentate gyrus that most contributed to cluster formation. Notice that the three distinct morphotypes were affected differentially by T. gondii infection in BALB/c.
Preprints 104321 g007
Figure 8. Mean values and standard errors of morphometric features of microglia within the molecular layer, significantly contributing to cluster formation. Notably, the differential impact of T. gondii infection on the three distinct morphotypes is also evident within the Swiss albino strain.
Preprints 104321 g008
Figure 9. Photomicrographs with low-, medium- and high-power objectives of microglia in the molecular layer of the dentate gyrus of control (A - D) and T. gondii infected (E – H)) with correspondent heat maps of the immobile time (I – L). Although counterintuitive, infected animals show reactive microglial morphology, immobility showed no significant increase after T. gondii infection. Scale bar: A and E: 200µm, B and F: 50µm, C and G: 20µm, and D and H: 10µm.
Preprints 104321 g009
Table 1. Stereological estimates of microglia total number in the molecular layer of the dentate gyrus of control and T. gondii infected Swiss albino female mice.
Animal Total Number Thickness (µm) CE Scheaffer
Control
Animal 6 4448 41.20 0.042
Animal 7 4243 40.50 0.043
Animal 12M 6018 34.80 0.046
Animal 6M 5688 35.20 0.048
Animal 7M 3913 22.50 0.043
Mean 4862 34.84 0.043
SD 931.9 7.498 0.044
CV 0.191 0.215
CV² 0.036 0.046
CE2 0.001 0.001
CE² / CV² 0.027 0.021
CV² - CE² 0.035 0.045
CVB² (%) 97.22 97.82
12 DPI
Animal 18 6392 34.80 0.032
Animal 22 7355 41.00 0.033
Animal 37 8793 51.50 0.033
Animal 41 8640 37.40 0.029
Animal 42 8347 38.10 0.029
Animal 43 8229 51.00 0.037
Mean 7959 42.30 0.032
SD 916.8
CV 0.115 0.170
CV² 0.013 0.020
CE2 0.001 0.001
CE² / CV² 0.076 0.050
CV² - CE² 0.012 0.019
CVB² (%) 92.30 95.00
CVB2 = CV2 – CE2; CV = coefficient of variation; CE = Coefficient of Error; CVB = biological coefficient of variation. SD = standard deviation.
Table 2. Stereological parameters for microglia counting in the molecular layer of the dentate gyrus of Swiss albino female mice.
Animal Thickness (µm) No. of Sections No. of Probes Probe (µm) Grid (µm) Dissector height (µm) Interval
Control
Animal 6 41.2 6 721 50x50 70x70 15 1/3
Animal 7 40.5 6 706 50x50 70x70 15 1/3
Animal 12M 34.8 5 492 50x50 70x70 15 1/5
Animal 6M 35.2 5 438 50x50 70x70 15 1/5
Animal 7M 22.5 5 420 50x50 70x70 15 1/5
12 DPI
Animal 18 34.8 5 638 50x50 70x70 15 1/3
Animal 22 41.0 6 810 50x50 70x70 15 1/3
Animal 37 51.5 6 797 50x50 70x70 15 1/3
Animal 41 37.4 6 907 50x50 70x70 15 1/3
Animal 42 38.1 5 808 50x50 70x70 15 1/3
Animal 43 51.0 6 661 50x50 70x70 15 1/3
Disclaimer/Publisher’s Note: The statements, opinions and data contained in all publications are solely those of the individual author(s) and contributor(s) and not of MDPI and/or the editor(s). MDPI and/or the editor(s) disclaim responsibility for any injury to people or property resulting from any ideas, methods, instructions or products referred to in the content.
Copyright: This open access article is published under a Creative Commons CC BY 4.0 license, which permit the free download, distribution, and reuse, provided that the author and preprint are cited in any reuse.
Prerpints.org logo

Preprints.org is a free preprint server supported by MDPI in Basel, Switzerland.

Subscribe

© 2024 MDPI (Basel, Switzerland) unless otherwise stated