1. Introduction
Of late, graph data structures are being widely used to express complex structures in fields, such as social networks, Internet of Things, mobile devices, and bioinformatics. For instance, in social networks, users can be represented as vertices and their follow or friend relationships as edges [
1,
2,
3,
4]. These are continuously updated with the registration of new users or changes in relationships among the existing users. Similarly, in bioinformatics, genetic information can be represented as vertices and the relationships among genes as edges, which also change with new gene discoveries or research findings. Such graphs change in real time and quickly accumulate information. Graphs with vertices and edges that change frequently are called dynamic graphs [
5,
6]. In contrast, static graphs refer to those with a fixed structure that does not change over time. Efficient analysis algorithms can be developed for static graphs owing to the consistency of their entire graph structure [
7,
8,
9,
10].
In dynamic graphs involve data that change continuously and are generated over time. They may also require sequential process changes, such as addition or deletion of vertices or edges; these changes occur in real time in the graph structure. As mentioned above, in a social network environment, data are updated with each event, such as adding or deleting friends, or interactions, such as comments or likes on posts. These data can be applied to human network analysis, user interest recommendations, etc. [
11,
12,
13,
14,
15,
16].
In a dynamic environment, changes in the graph occur through the addition of new vertices, deletion of existing vertices, and creation and removal of edges. In such an environment, complex analysis and processing algorithms that reflect changes in the graph in real time are required. One of the main challenges in a dynamic environment is that the size of the graph continuously increases over time. To efficiently manage infinitely increasing data within a limited storage space, graph compression is essential, allowing for the efficient use of storage space to accommodate increasing amounts of data [
17,
18,
19,
20,
21,
22]. Techniques that incorporate graph pattern mining methods also exist [
23,
24,
25,
26,
27,
28]. Generally, graph compression is performed using graph mining techniques to select frequently occurring sub-graphs as reference patterns and recording changes that occur in these reference patterns. These techniques can effectively compress data, while preserving important information of the graph.
Existing methods of compressing graphs have the advantage of high compression rates [
13,
22]; however, they are not suitable for real-time data processing owing to their significant computational costs in the preprocessing stage. These approaches involve a time-consuming compression process, especially imposing constraints on immediate processing in a graph stream environment. High accuracy and compression rates are provided by pattern extraction techniques, such as [
14,
15,
16,
23,
24,
25,
26]; however, their long processing times during graph compression also render them difficult to be applied in real-time environments. As a solution to these issues, research on the use of provenance has been proposed [
29,
30,
31].
Provenance is metadata that tracks the change history and origin of data, allowing for the tracking of data changes. For example, in the case of Wikipedia, the process of multiple users creating, modifying, and deleting documents is recorded as provenance data, increasing the size of the original data by tens of times. This implies that managing provenance data can be more complex and challenging than managing the original data. However, if provenance data are used effectively, they can make graph storage more efficient and lead to more effective pattern management.
This study proposes a new graph stream compression scheme that combines existing techniques for compressing large static graphs with provenance techniques. This method compresses graph streams incrementally, taking into account changes in vertices and edges over time. Especially, it records and compresses changes in vertices, edges, and patterns in an in-memory environment using provenance data. The proposed technique manages patterns based on provenance, and maintains their size, thus effectively managing important patterns and increasing the space efficiency of pattern management by maintaining only essential patterns. Moreover, it assigns scores to the latest patterns to respond to real-time changes in the graph stream and maintains a certain level of compression rate. This study also proves the superiority of the proposed scheme compared to existing graph compression schemes that utilize pattern mining techniques. The experimental results confirm that the proposed pattern dictionary management technique effectively improves upon existing pattern dictionary-based graph compression methods and outperforms graph compression techniques in a stream environment.
This paper is organized as follows.
Section 2 analyzes the existing schemes and enumerates the limitations of existing methods.
Section 3 describes the proposed graph compression scheme.
Section 4 presents a performance evaluation of the proposed scheme to confirm its superiority over the existing methods.
2. Related Work
This section explains techniques focused on the structure of graphs and techniques for compressing frequent patterns in graphs within the realm of existing graph compression research. Some of the previous studies proposed focusing on the graph’s structural characteristics. StarZIP [
13] performs structural compression by identifying and reordering only sub-graph sets in a star shape, applying an encoding technique for compression, and incrementally processing the graphs. It also uses snapshots to create graph stream objects, which are then shattered to transform undirected graphs into directed ones. GraphZIP [
22] compresses graph streams using clique-shaped sub-graphs. This technique decomposes the original graph into a set of cliques and then compresses each set of clique graphs. During this process, it focuses on minimizing the disk I/O by using efficient graph representation structures, such as CSC(Compressed Sparse Column) or CSR(Compressed Sparse Row). The main goal of these methods is to maximize space efficiency by compressing the graph as much as possible, not considering frequent or important patterns.
Research on compressing frequent patterns in graphs utilizes graph mining techniques. Graph mining is a process of extracting useful information and patterns from graphs, used for analyzing large volumes of complex network data. During this process, various algorithms and techniques are applied to consider the relationships among vertices and edges, graph structure, and dynamic changes. Frequent pattern mining [
1,
5,
6,
7,
11,
15,
21] is a method of extracting meaningful information or patterns from data, used in various fields, such as pattern analysis, anomaly detection, and recommendation services. FP-Growth is a method that efficiently finds frequent patterns using an FP-tree structure [
32]. In this method, minimum support is applied to find patterns that appear more than a certain number of times, and the support represents the proportion of the data that include a specific pattern out of the total data. The FP-Tree starts with a null root node(vertex), storing the item and its repetition count in each vertex, and the final FP-Tree is constructed after reading all transactions. However, unlike frequent pattern mining in static environments, the same in graph stream environments becomes more complex owing to dynamic data changes and in information overflow. FP-streaming [
14] dynamically detects frequent patterns by time to solve the problem of time-varying data input amounts. In these methods, the construction process of the pattern tree is similar to that of the FP-Tree. The tree is constructed using a given similarity and support, managing time and support information in a table to detect all frequent patterns.
GraphZip [
11] proposes a dictionary-based compression method that increases compression efficiency by utilizing frequent patterns in graph streams. This technique applies dictionary-based compression along with the minimum description length principle to identify the maximum compression patterns in the graph stream. The input data comprise vertices, edges, and their labels; the process starts with storing vertex information and then processing edge information in a stream format. It sets a batch size to process vertices in bulk, and starts with a single edge to expand and generate patterns. Scores are assigned to the generated patterns, and all patterns are scored taking into account the occurrence frequency at the time of appearance and total number of edges. Then, they are sorted in a descending order to remove patterns that exceed the dictionary size. For each batch, the collected patterns are compressed and the information is recorded in a file. This process is repeated to complete the compression. However, a limitation of GraphZip [
11] is that it does not utilize time-related information in pattern management. For example, a pattern that appeared early in the graph, but no longer appears later may still be maintained in memory if it is large and has received a high score. This can lead to wasted storage space and performance degradation. This issue becomes more critical in a graph stream environment, wherein data changes continuously. Therefore, considering changes in the importance of patterns over time is an essential element in graph stream compression.
The studies reported in [
29,
30,
31] suggest a graph pattern-based compression method for large RDF documents using metadata, namely provenance data, which represents information or history of the data. This method uses an approach that reduces the size of string data by encoding specific graph patterns. While this study exhibits a superior compression performance to existing methods, it uses a statistics-based compression approach, which means that the compression performance can vary with parameter adjustments, and some data loss can possibly occur. Furthermore, the compression process using provenance data can take longer than the existing techniques. This is because compression methods including provenance data require processing and storing additional information. This is a significant factor impacting their overall performance as finding a balance between compression efficiency and processing time can be a major constraint, especially in applications where real-time data processing is emphasized.
3. Proposed Graph Compression Scheme
3.1. Overall Processing Procedure
This study proposes a graph stream compression scheme based on a pattern dictionary using provenance. The proposed scheme selects sub-graph patterns with high influence in the graph as reference patterns, considering the relationship between each pattern and its sub-patterns during this process and assigning scores accordingly. Previous studies [
13,
22] proposed methods that offer high compression rates. However, they are not suitable for real-time data generation environments due to the significant amounts of time taken in the preprocessing stage to identify graph structures (star, clique, bipartite, etc.). Moreover, as the values being transformed increase, efficiency may decline compared to storing uncompressed data, and if specific graph structures are not found, the compression rate may decrease, leading to overall performance degradation.
On the other hand, the scheme proposed in [
19] selects common graphs that appear in both vertices and edges as reference patterns, and describes the changed parts in those patterns. However, this scheme is not suitable for stream environments, as it is constrained by the maximum size of graph patterns and the pattern search time increases with the size of the patterns. Additionally, if a completely different pattern from the reference patterns appears, the applicable patterns may be limited or nonexistent, necessitating a re-search for patterns, which can cause a decrease in the compression rate. Other considerations exist when detecting frequent patterns in a graph stream and applying them to compression. First, efficiently using limited storage space, while also performing rapid frequent pattern detection is necessary.
In graph streams, data are continuously input and the analysis target data changes in real time. Therefore, after a certain amount of data has been entered, it is necessary to delete data to free up memory for analyzing the next input data. Additionally, as the data entering over time varies, not always do the same patterns appear, and they can change over time. Therefore, repeatedly verifying the isomorphism of the sub-graphs being compared for pattern detection is necessary.
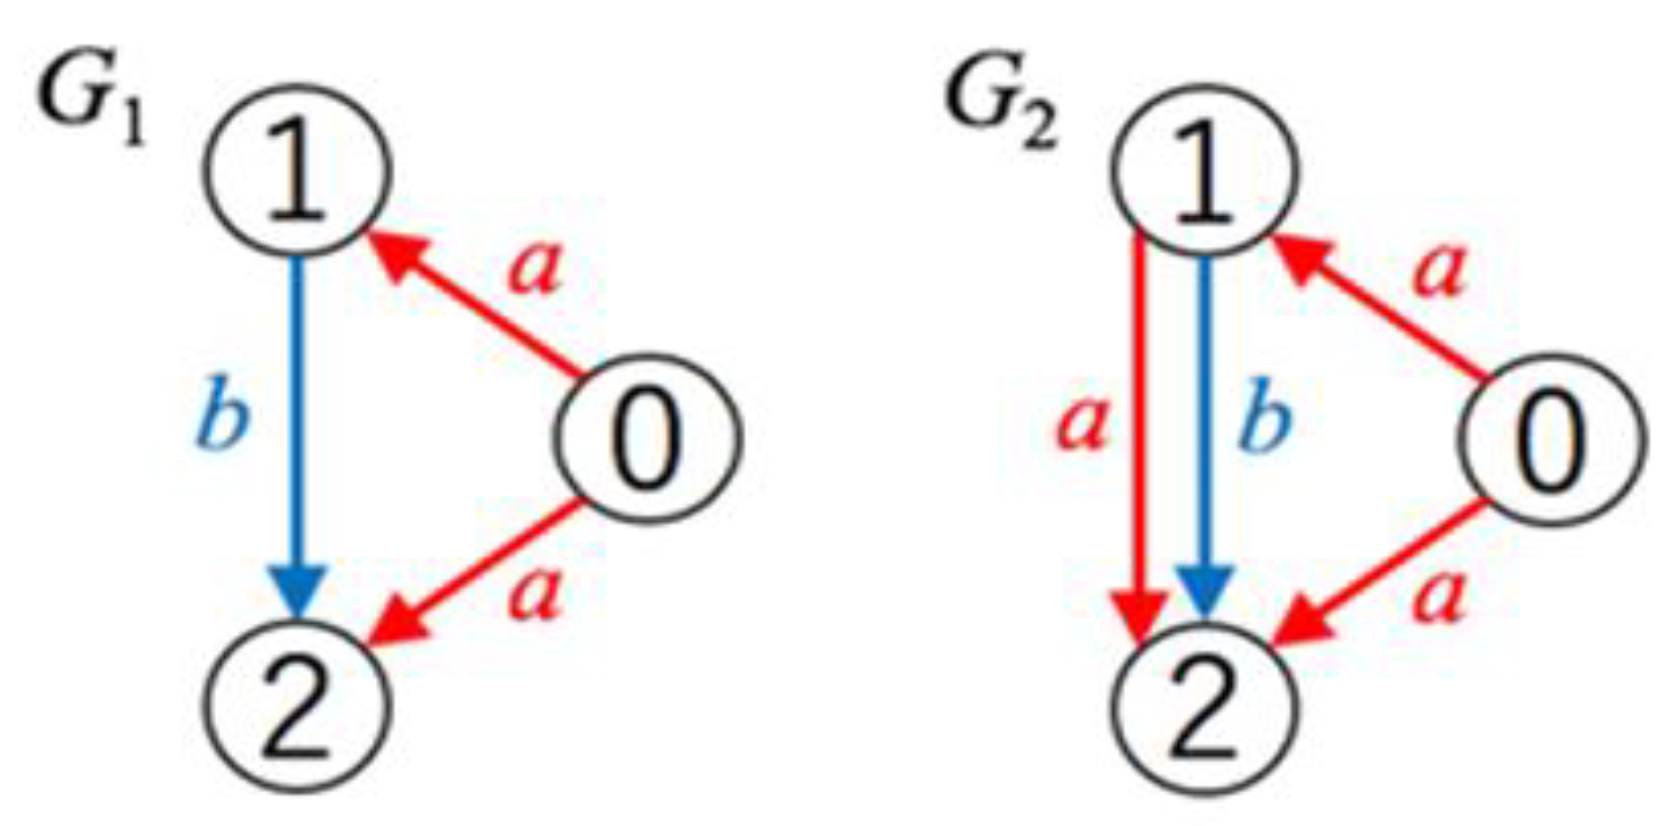
Figure 1 shows the isomorphic patterns of subgraphs. Typical subgraph isomorphism algorithms [
3] involve finding patterns that match the graph's pattern perfectly; however, in this study, when graphs
and
exist, it means that the subgraph of
is isomorphic to
. Therefore, patterns, such as
are also considered isomorphic graphs. Lastly, finding the pattern with the highest compression rate, considering time and frequency is crucial. This allows for efficient application of frequent patterns to compression.
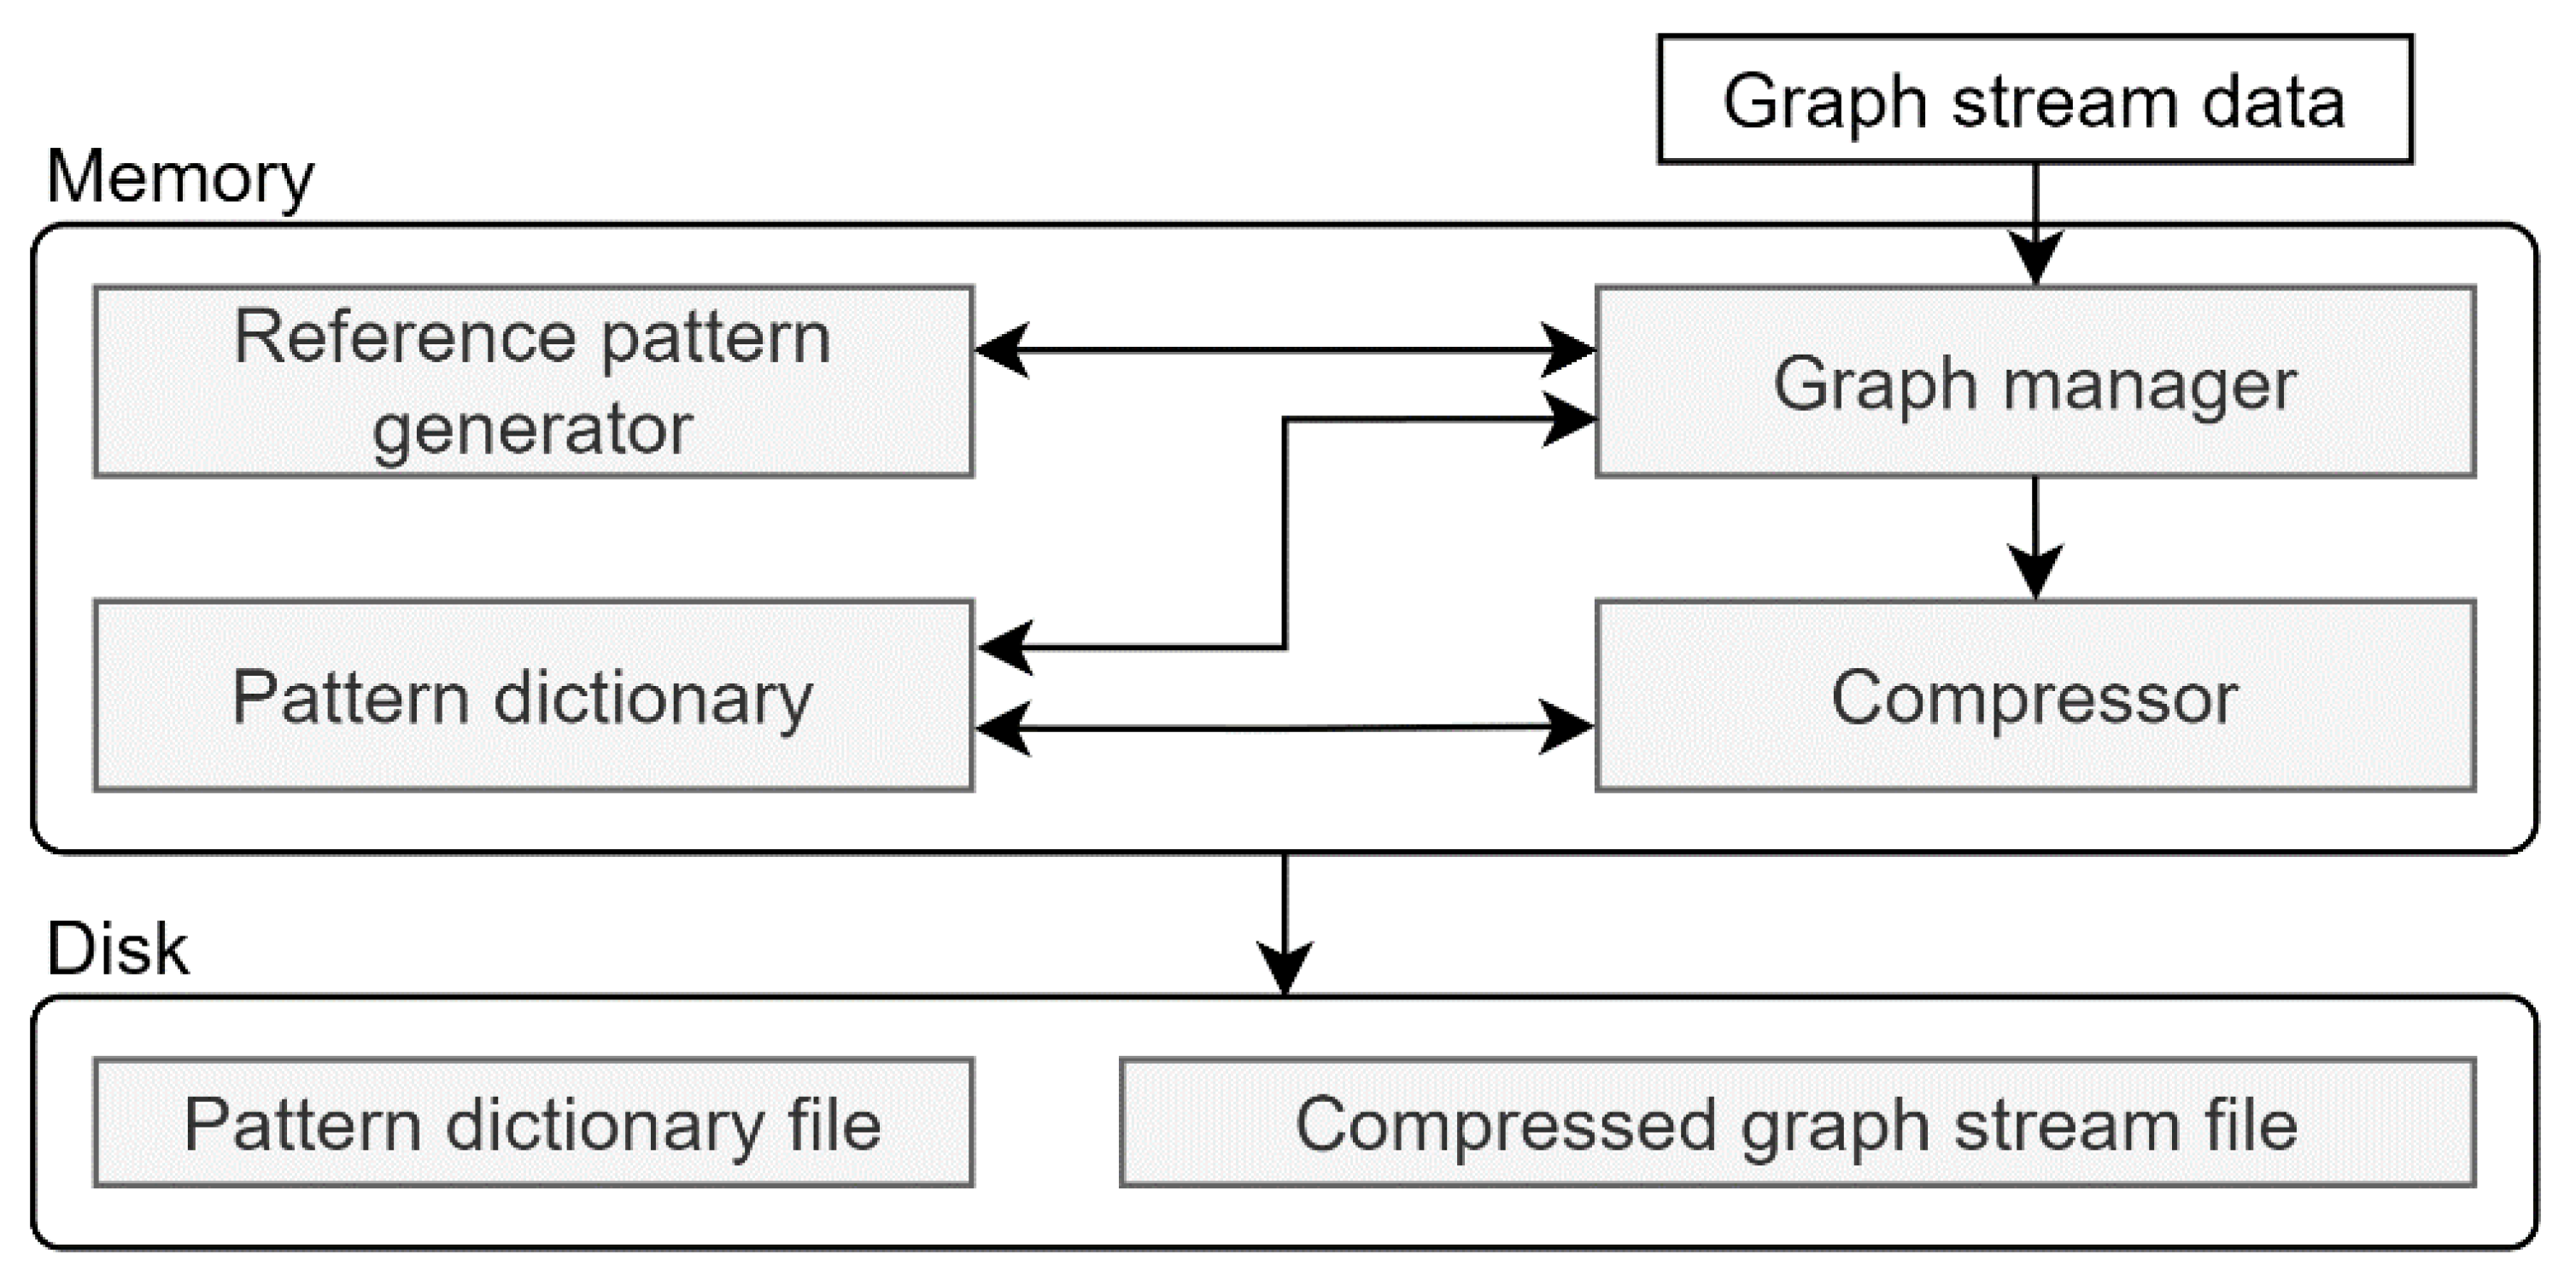
Figure 2 illustrates the overall structure of the proposed incremental frequent pattern compression scheme. The detailed modules are described in the following section. The main modules include the reference pattern generator, graph manager, pattern dictionary, and compressor. The graph manager organizes raw data into graph form and delivers it to the reference pattern generator. It also assigns scores to the reference pattern candidates generated by the reference pattern generator, which is responsible for the initial step of finding patterns in each graph. The patterns identified here become reference pattern candidates and are sent to the graph manager. The pattern dictionary stores information on each pattern. The compressor performs the compression process.
The main functions of the compressor are as follows: First, it manages the pattern dictionary while deleting unimportant patterns. During the deletion process, all patterns are recorded on disk to prevent issues with decoding patterns used in previous compressions. The compressor divides the graph stream into fixed batch units for file management, and each compressed file includes a header specifying the patterns used in that file.
This structure aims for efficient compression and management of graph stream data, enhancing the efficiency of real-time data processing within limited a memory and storage space. Additionally, the proposed method considers the continuous and dynamic nature of a graph stream, thus making it effective for data storage and processing.
3.2. Graph Manager and Reference Pattern Generator
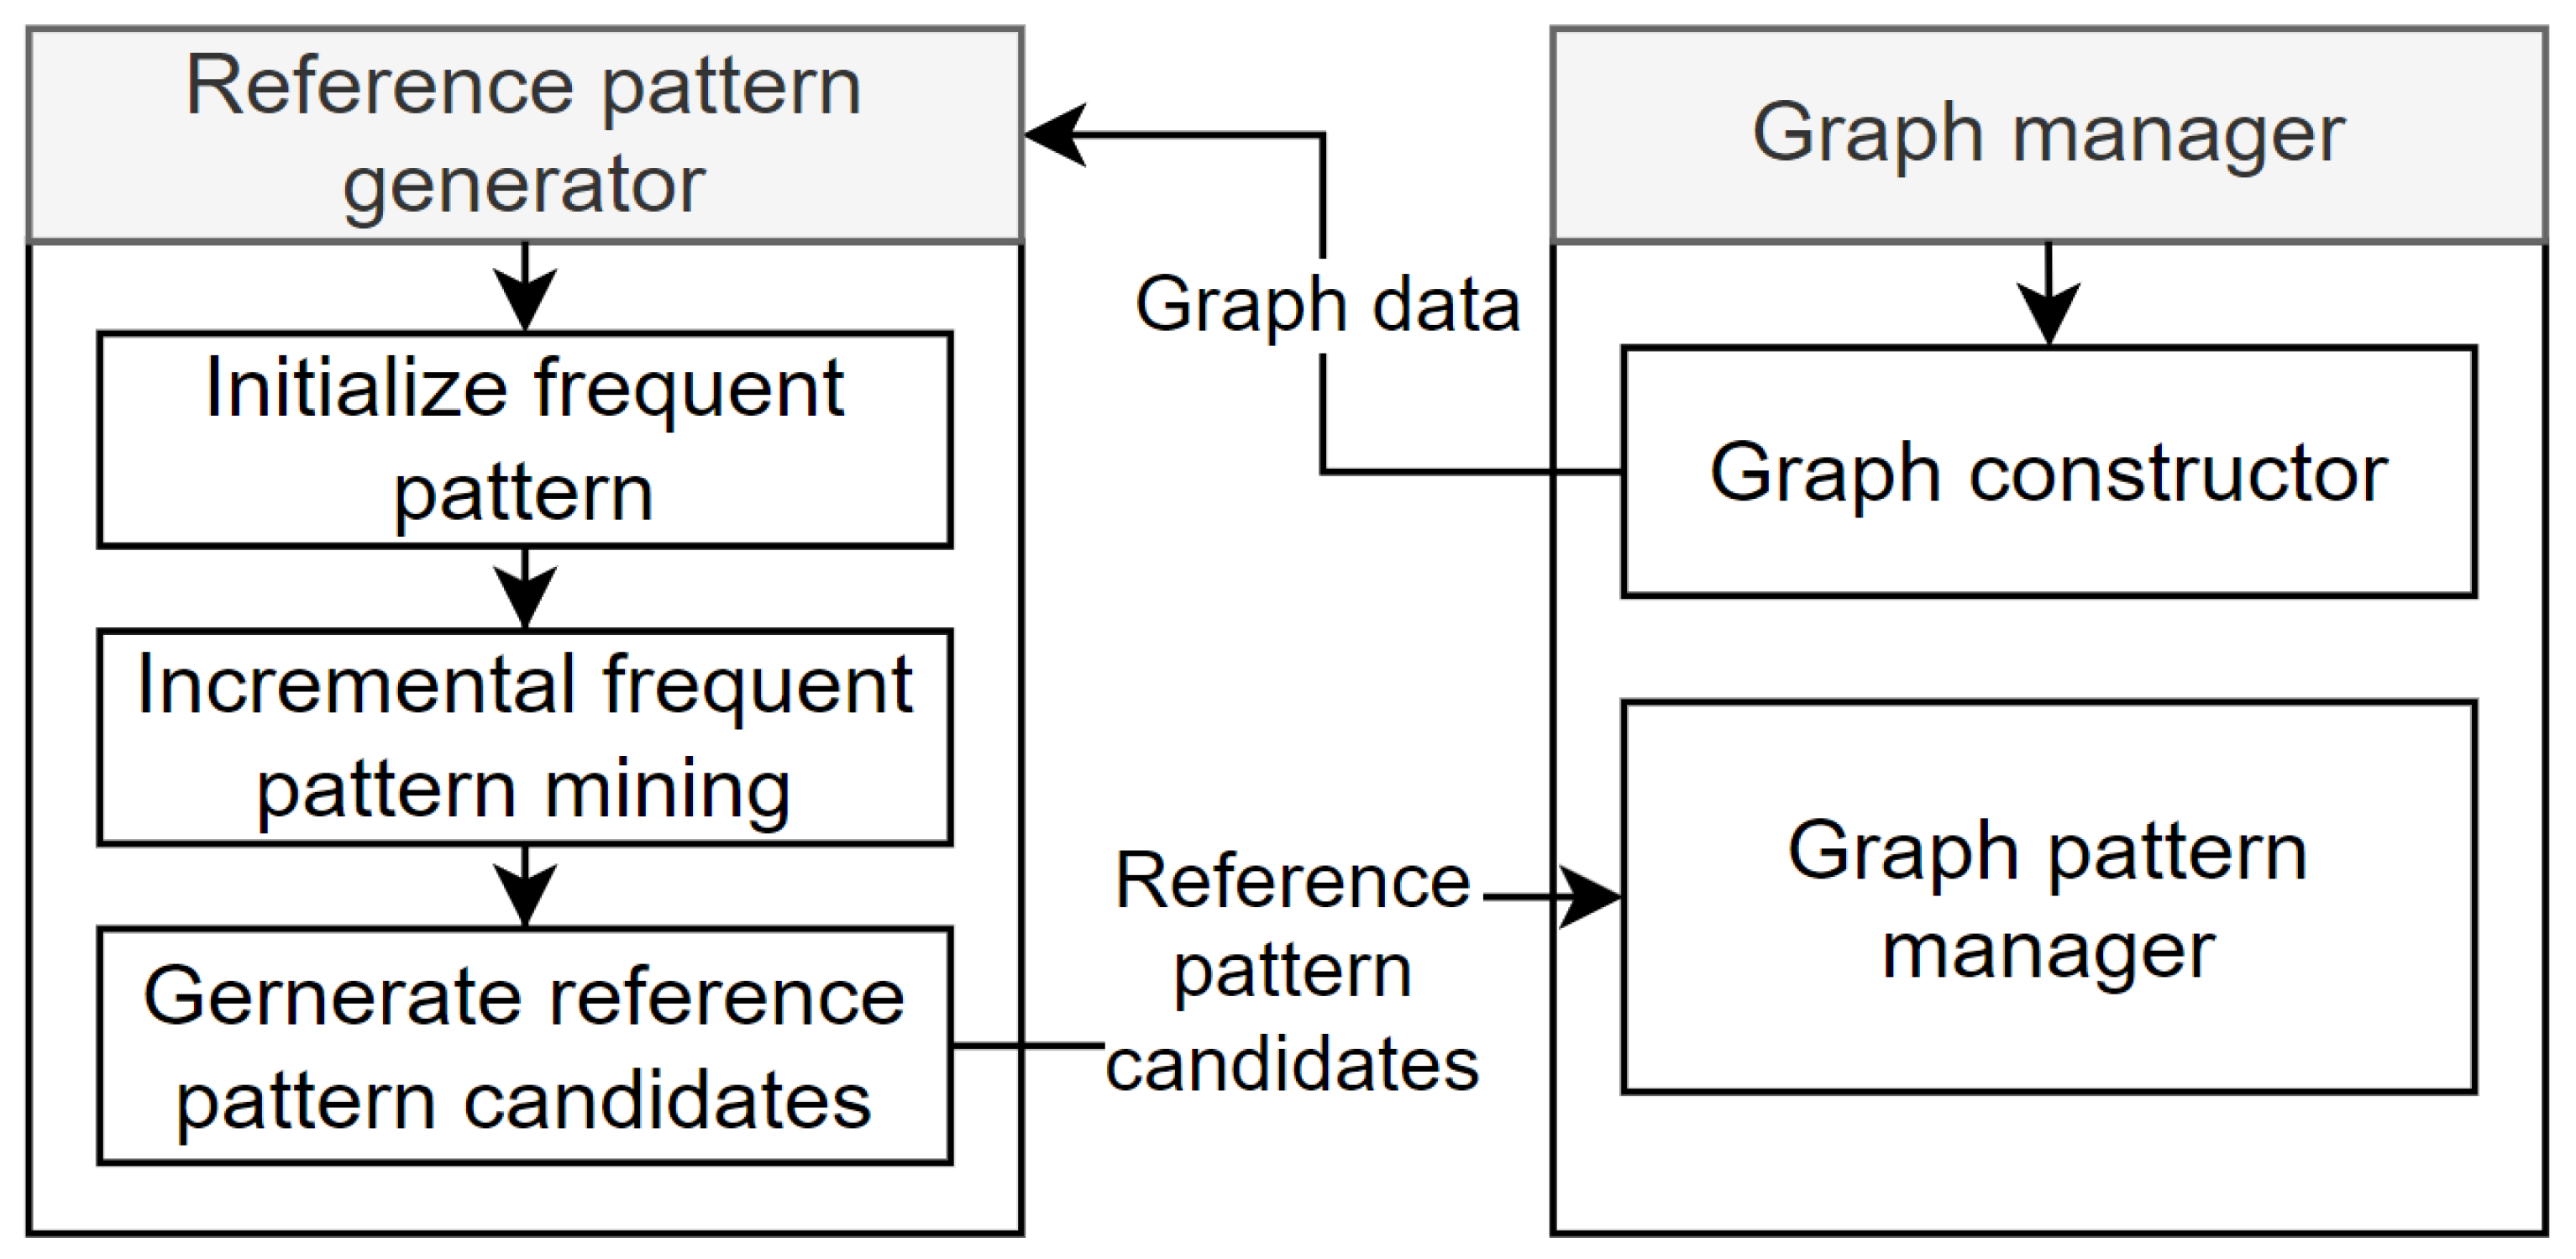
Figure 3 shows the structure and operation of the graph manager and reference pattern generator. The graph manager consists of two main modules. The first is the graph constructor. The graph constructor takes raw graph stream data as input and builds it into a graph. Raw graph stream data consists of edge data, for example,
{(v1, v2), (v2, v3), … }, which represents an edge stream. The graph constructed by the graph constructor is then passed to the reference pattern generator to find frequent patterns. The second component, the graph pattern manager, receives reference pattern candidates from the reference pattern generator, and stores and manages them in the pattern dictionary. Pattern management includes deciding reference patterns based on pattern frequency and size, and deleting less important patterns. This is explained in detail in
Section 3.3.
The reference pattern generator creates reference pattern candidates through a three-step process. First, in the frequent pattern initialization stage, the graph's frequent patterns are initialized. Second, in the incremental frequent pattern mining stage, frequent patterns are progressively searched and identified. Lastly, in the reference pattern candidate generation stage, reference pattern candidates are created based on the results of incremental frequent pattern mining. The graph manager uses these reference pattern candidates to check for isomorphism between previously explored graphs and the current graph, thus repeating the process of expanding pattern graphs. At the initial exploration of the graph, as there are no reference patterns stored in the pattern dictionary, single-edge patterns are created as the initial state of all graphs, and these edges are then expanded to generate various pattern graphs. This process identifies and creates efficient compression patterns considering the dynamic and continuous characteristics of graph stream data.
Algorithm 1 shows the process followed by the reference pattern generator. In a graph stream, when vertices enter in sequence as in
, the patterns
stored in the pattern dictionary are indexed in the order they arrive (line 3). For instance, if graph
is input, the input graph can be represented as pattern graph
. At this time, vertices already assigned an index use their existing index. Thus, if vertex 12 is input again, it is mapped as vertex 1. The next step is to check if two vertices are adjacent and proceed with the expansion (lines 4–5). Pattern expansion initializes new edges, if the starting vertex of edge
does not exist in the edge or if the arriving vertex does not exist, after which (lines 6–10), the expanded pattern is added (line 12). In this process, first, a new pattern is initialized; it checks if the edge's source vertex already exists in the pattern; and if not, adds that vertex to the new pattern and updates
. Last, the edges not processed in batch
B are added to the dictionary
P as single edge patterns (line 15).
| Algorithm 1. Incremental frequent pattern mining |
| Input: graph G, batch B, dictionary PwyxwyxOutput: Updated Pattern Dictionary P |
1
2
3
4
5
6
7
8
9
10
…
11
12
13
14
15
16 |
for each pattern p in P:
for each matched m of pattern p embedded in batch B:
vertex_dict = {g(v): p(v) for p(v), g(v) in m}
new_edges = edges in batch B incident on m but not in pattern p
for each edge e in new_edges:
g_src(v) = e.src
g_tgt(v) = e.tgt
p_src(v) = vertex_map[g_src(v)]
p_tgt(v) = vertex_map[g_tgt(v)]
extended_pattern = extend pattern p with edge e using p_src(v) and p_tgt(v)
if extended_pattern not in P:
add extended_pattern to P
for each untagged edge e in B:
if e not in P:
add e as a single-edge pattern to P
return P |
|
After executing Algorithm 1, each pattern is assigned a score. Subsequently, the results are sorted in descending order to determine the reference pattern candidates. For each pattern the reference pattern score (RPS) is calculated to update the pattern dictionary, if it is isomorphic to the subgraph
of graph
. Equation (1) calculates the pattern score. Here, α is a value between 0 and 1.
3.3. Managing Pattern Dictionary
All patterns are stored in an in-memory space called a dictionary; this process is performed using the graph pattern manager described in
Section 3.2. The creation and management of the pattern dictionary is one of the main roles of the graph manager, and it is accomplished through the pattern manager. The first step involves pruning using time stamps and FP-Tree. This process determines and manages the importance of patterns. The time stamp indicates the lifespan of each pattern, while the FP-Tree is used to assess the importance of patterns. It maintains the top-K most frequently used patterns to limit the size of the pattern dictionary. Each reference pattern consists of a Pattern ID, the pattern's time stamp, and scores assigned considering the pattern's size and frequency. Here, the RPS is used as an indicator of the pattern's importance. To effectively use provenance data, patterns extracted through graph pattern mining can use provenance information to track changes in the graph. Finally, the graph is transformed and stored through a dictionary encoding process.
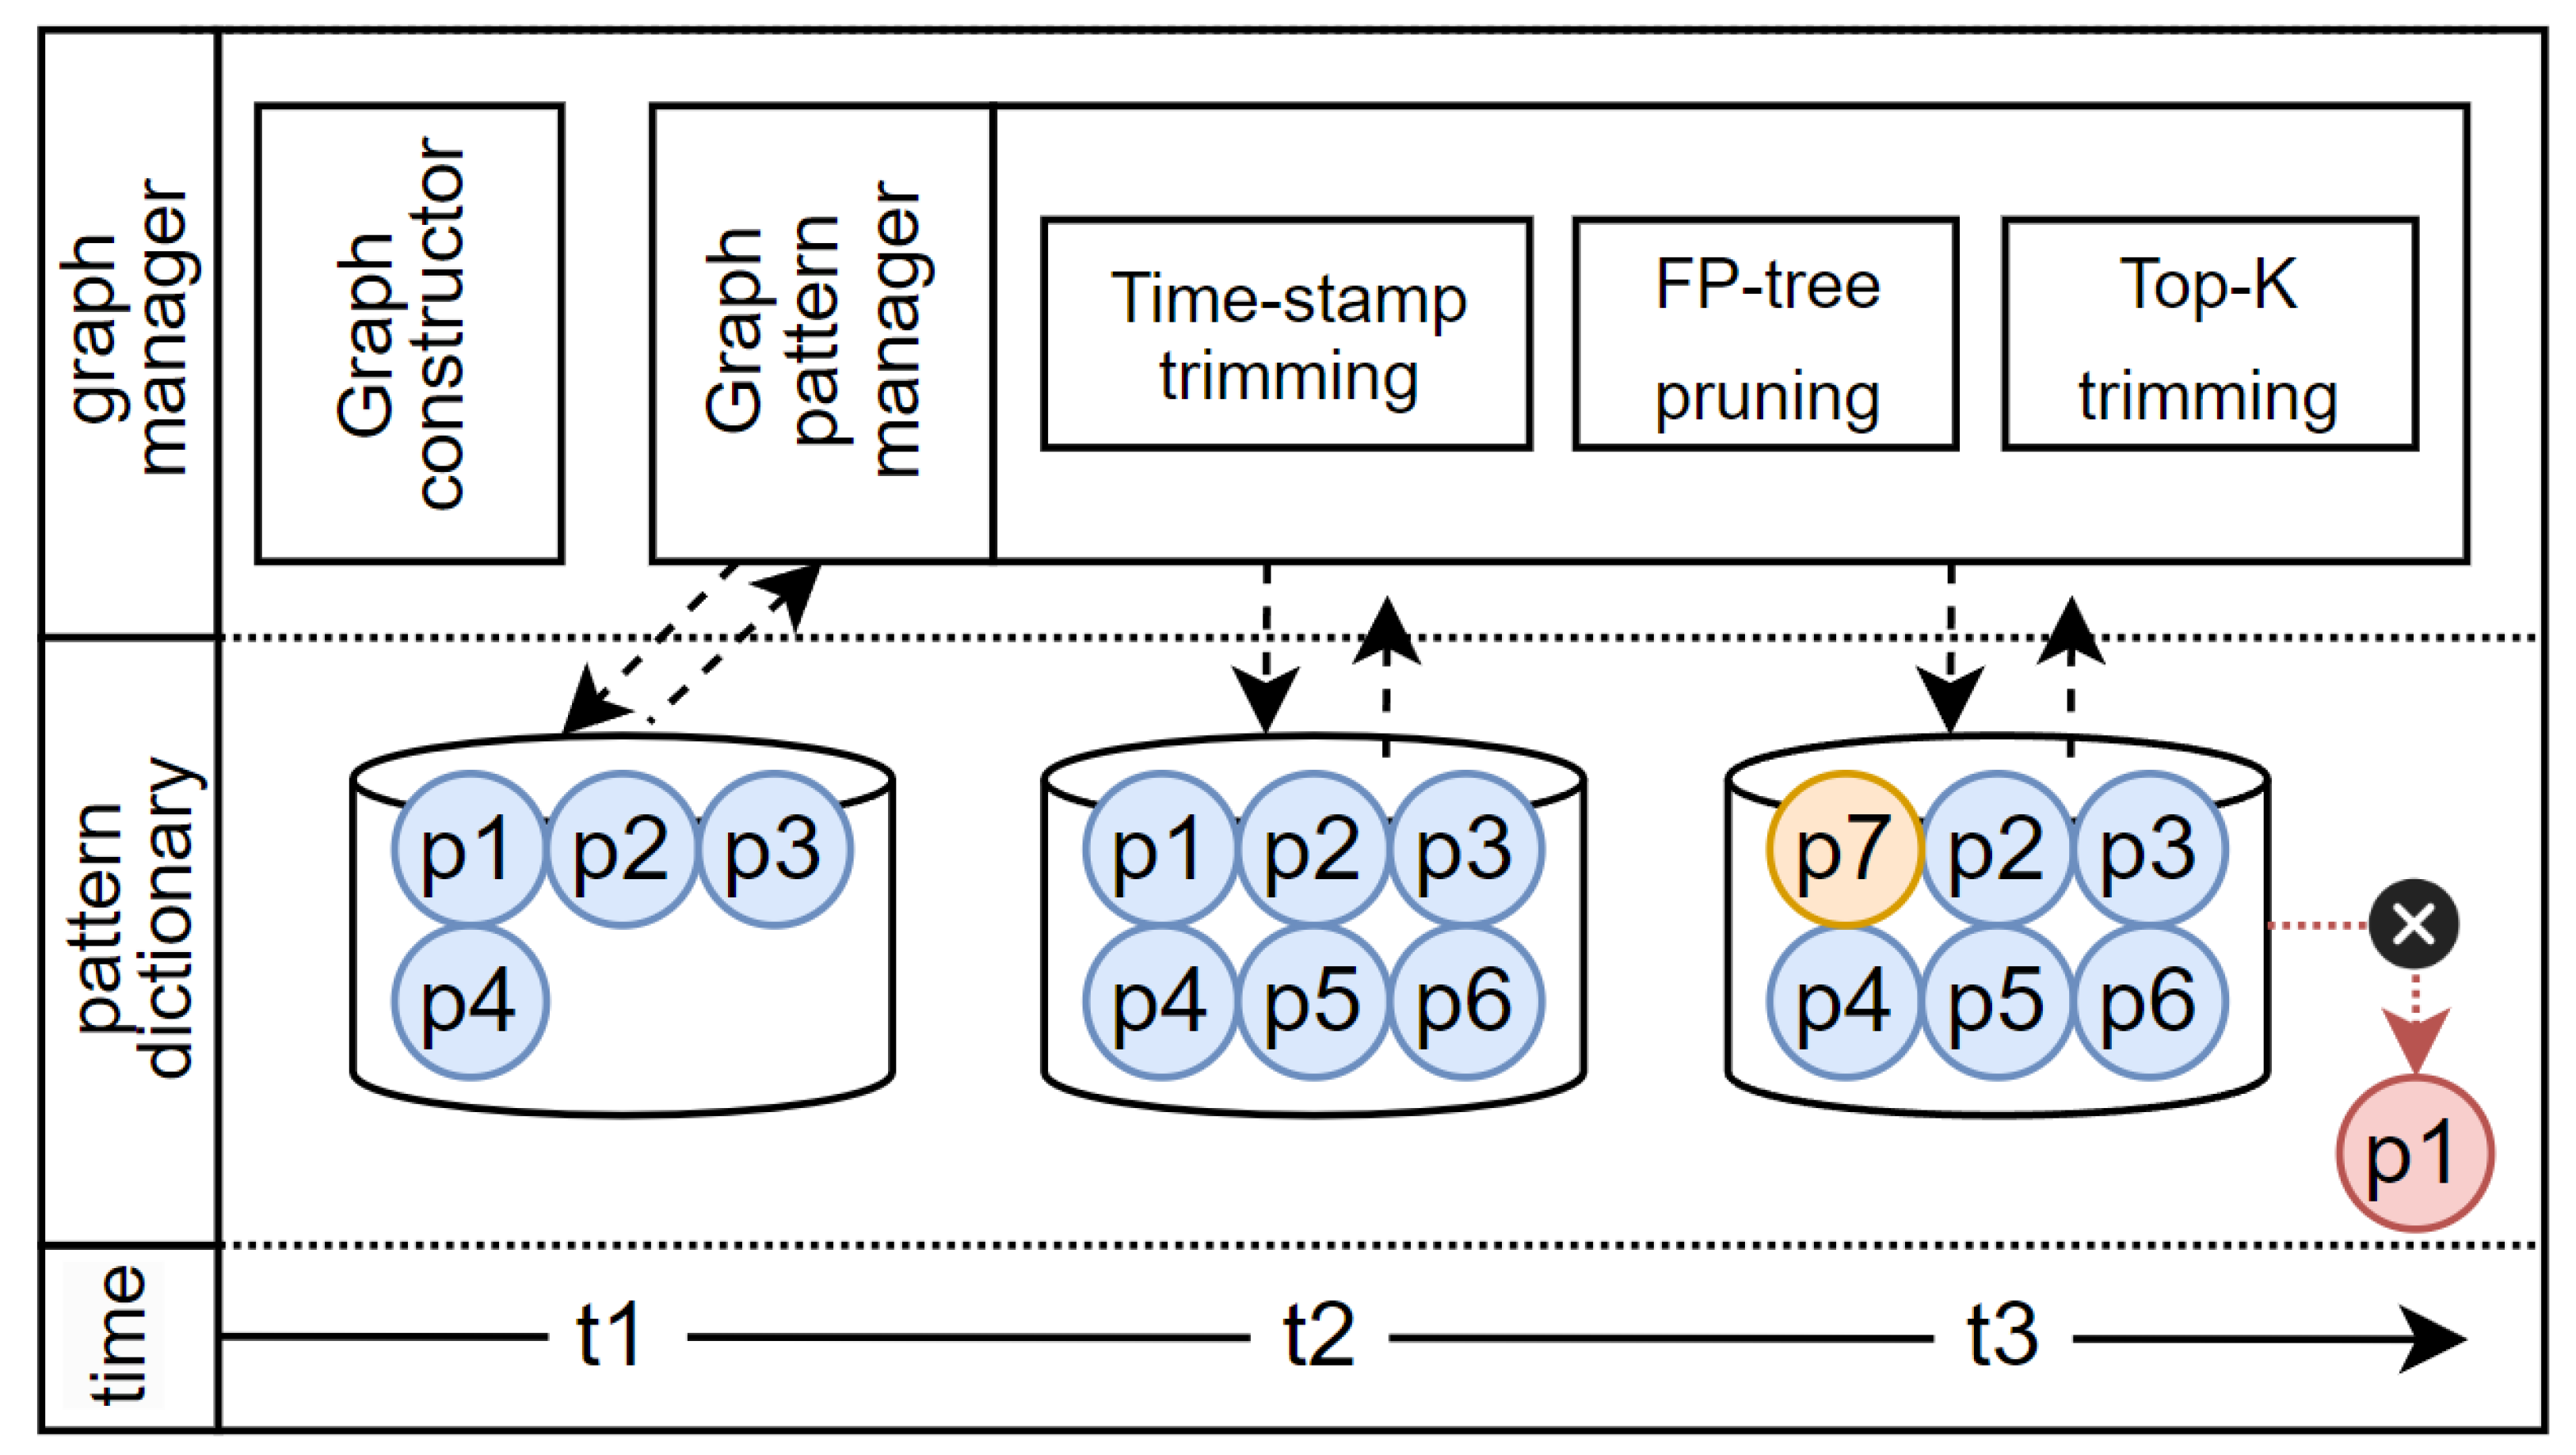
Figure 4 demonstrates how the graph pattern manager manages the pattern dictionary over time. Assuming a size of six for the pattern dictionary, during this process, patterns are stored in the pattern dictionary at each point in time, namely
t1,
t2, and
t3, and updated through the graph pattern manager whenever the pattern dictionary is refreshed. At
t1, t2, since the size of the pattern dictionary is larger than the number of existing patterns, new patterns can be added to the pattern dictionary. At
t3, no spare capacity exists in the pattern dictionary; therefore, patterns are deleted based on their scores. In
Figure 4, the pattern with the lowest score,
p1, is deleted, and a new pattern,
p7, is added. The graph explorer performs the role of discerning the similarity between existing reference and new patterns. This includes the process of calculating the similarity between the reference and new patterns through subgraph isomorphism tests for each graph. Most existing studies determine reference patterns as graphs where vertices and edges commonly appear, and use a method to describe changes from the reference pattern in the pattern itself. However, if only perfectly matching graph patterns are searched for compression, then too few patterns would be available for compression, thus making it difficult to apply compression. Therefore, this study only performs comparative operations with patterns that are determined through the RPS value by the reference pattern generator and have a similarity level above a certain threshold, thereby reducing the overall computational cost.
The graph pattern manager plays a crucial role in determining and managing the importance of patterns, using a pruning algorithm with time stamps and FP-Tree and limiting the size of the patterns stored in the pattern dictionary. These elements are combined to calculate the RPS, and patterns are kept in the dictionary in the order of their scores. Actual graph streams cannot always guarantee consistent patterns, which may change over time. Considering these dynamic characteristics, this study set a threshold ; if a specific pattern does not occur for a certain number of time windows matching this threshold, that pattern is deleted. This takes into account that the importance of patterns may change over time, removing older or less important patterns to enhance memory efficiency and focus more on the latest data. This process is defined as the time stamp trim process. Through this process, dynamic changes in graph stream data can be effectively reflected, and pattern dictionary management can be optimized to enhance the efficiency of real-time data processing.
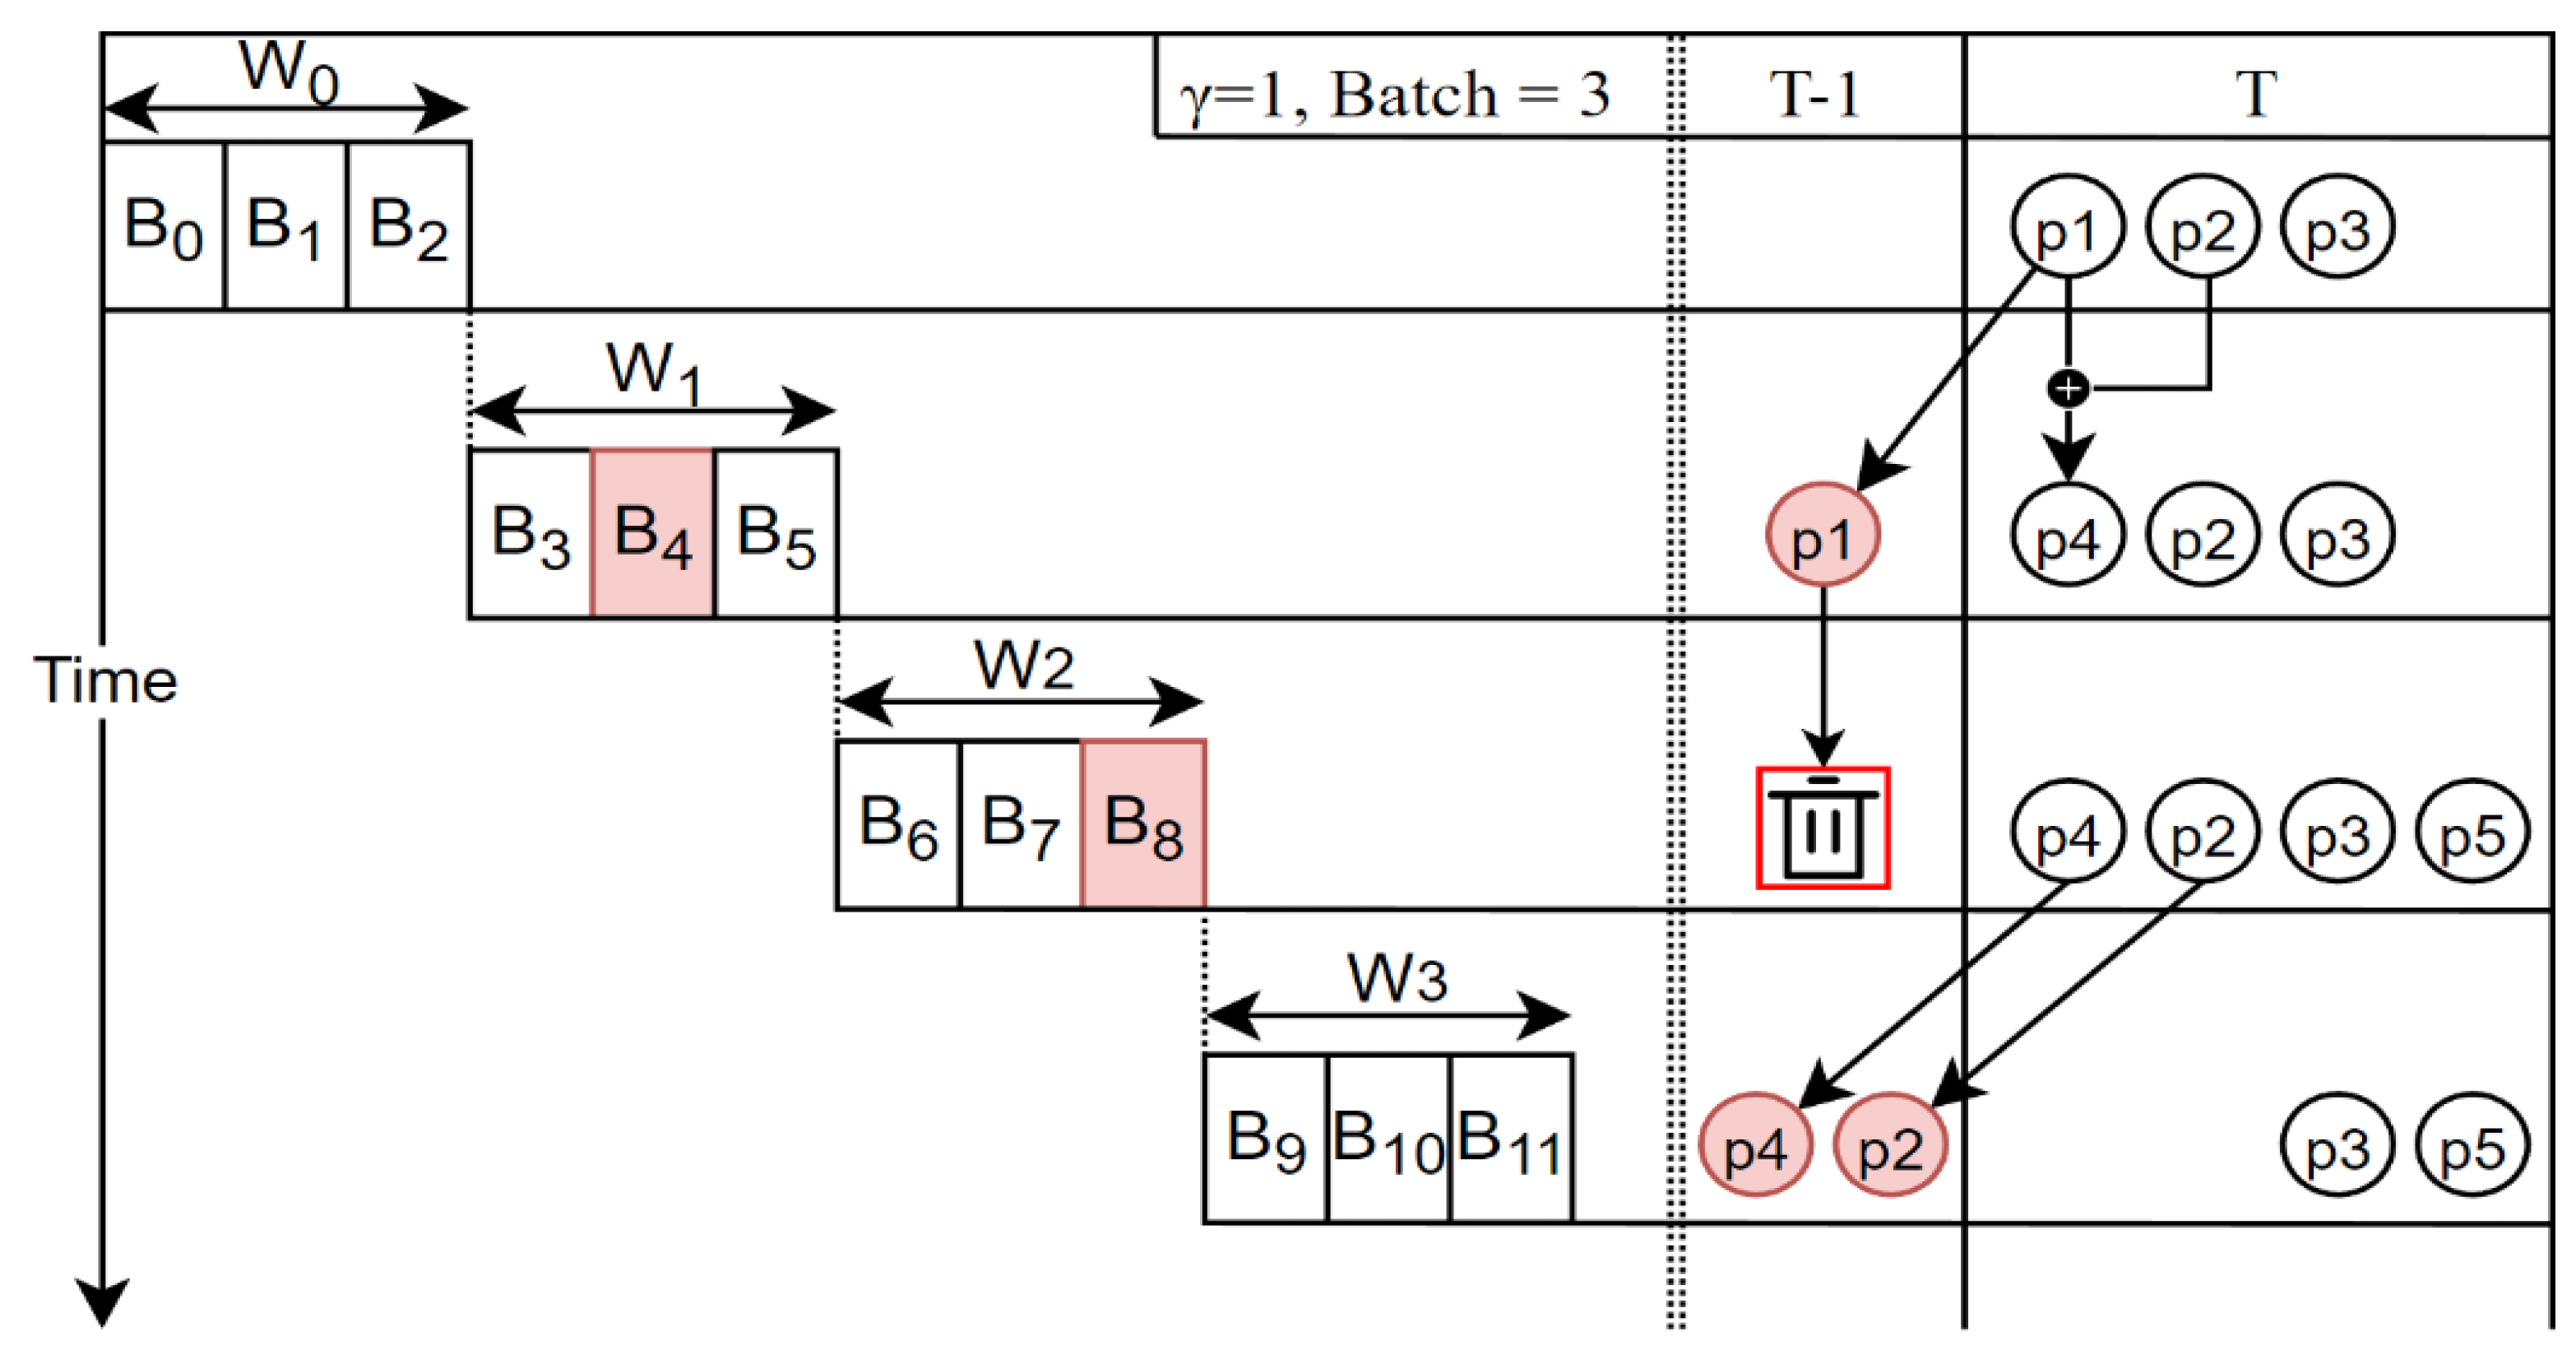
Graphs are composed through several batch (
) processes. Each batch contains edge information, and this is combined for the value of the window to form the graph. The size of the batch and window is specified by the user. An example of graph and pattern creation is as follows. As shown in
Figure 5, when
,
, the window
consists of three batches as follows:
. The pattern occurring at this point is as shown at the top of the figure as
, which represents the patterns of the graph entered up to that point. At the next point in time,
, the pattern of the input graph is
. As time progresses from
to
, pattern
is not input; therefore, the time stamp of that pattern is adjusted to
, that is,
. Here, when the value subtracted from T exceeds the threshold
, that pattern is removed. In the figure, because pattern
is not input at the next time point
, it is removed at time
. Similarly, because pattern
is not input at the next time point, the time stamp value of that pattern is adjusted to
.
.
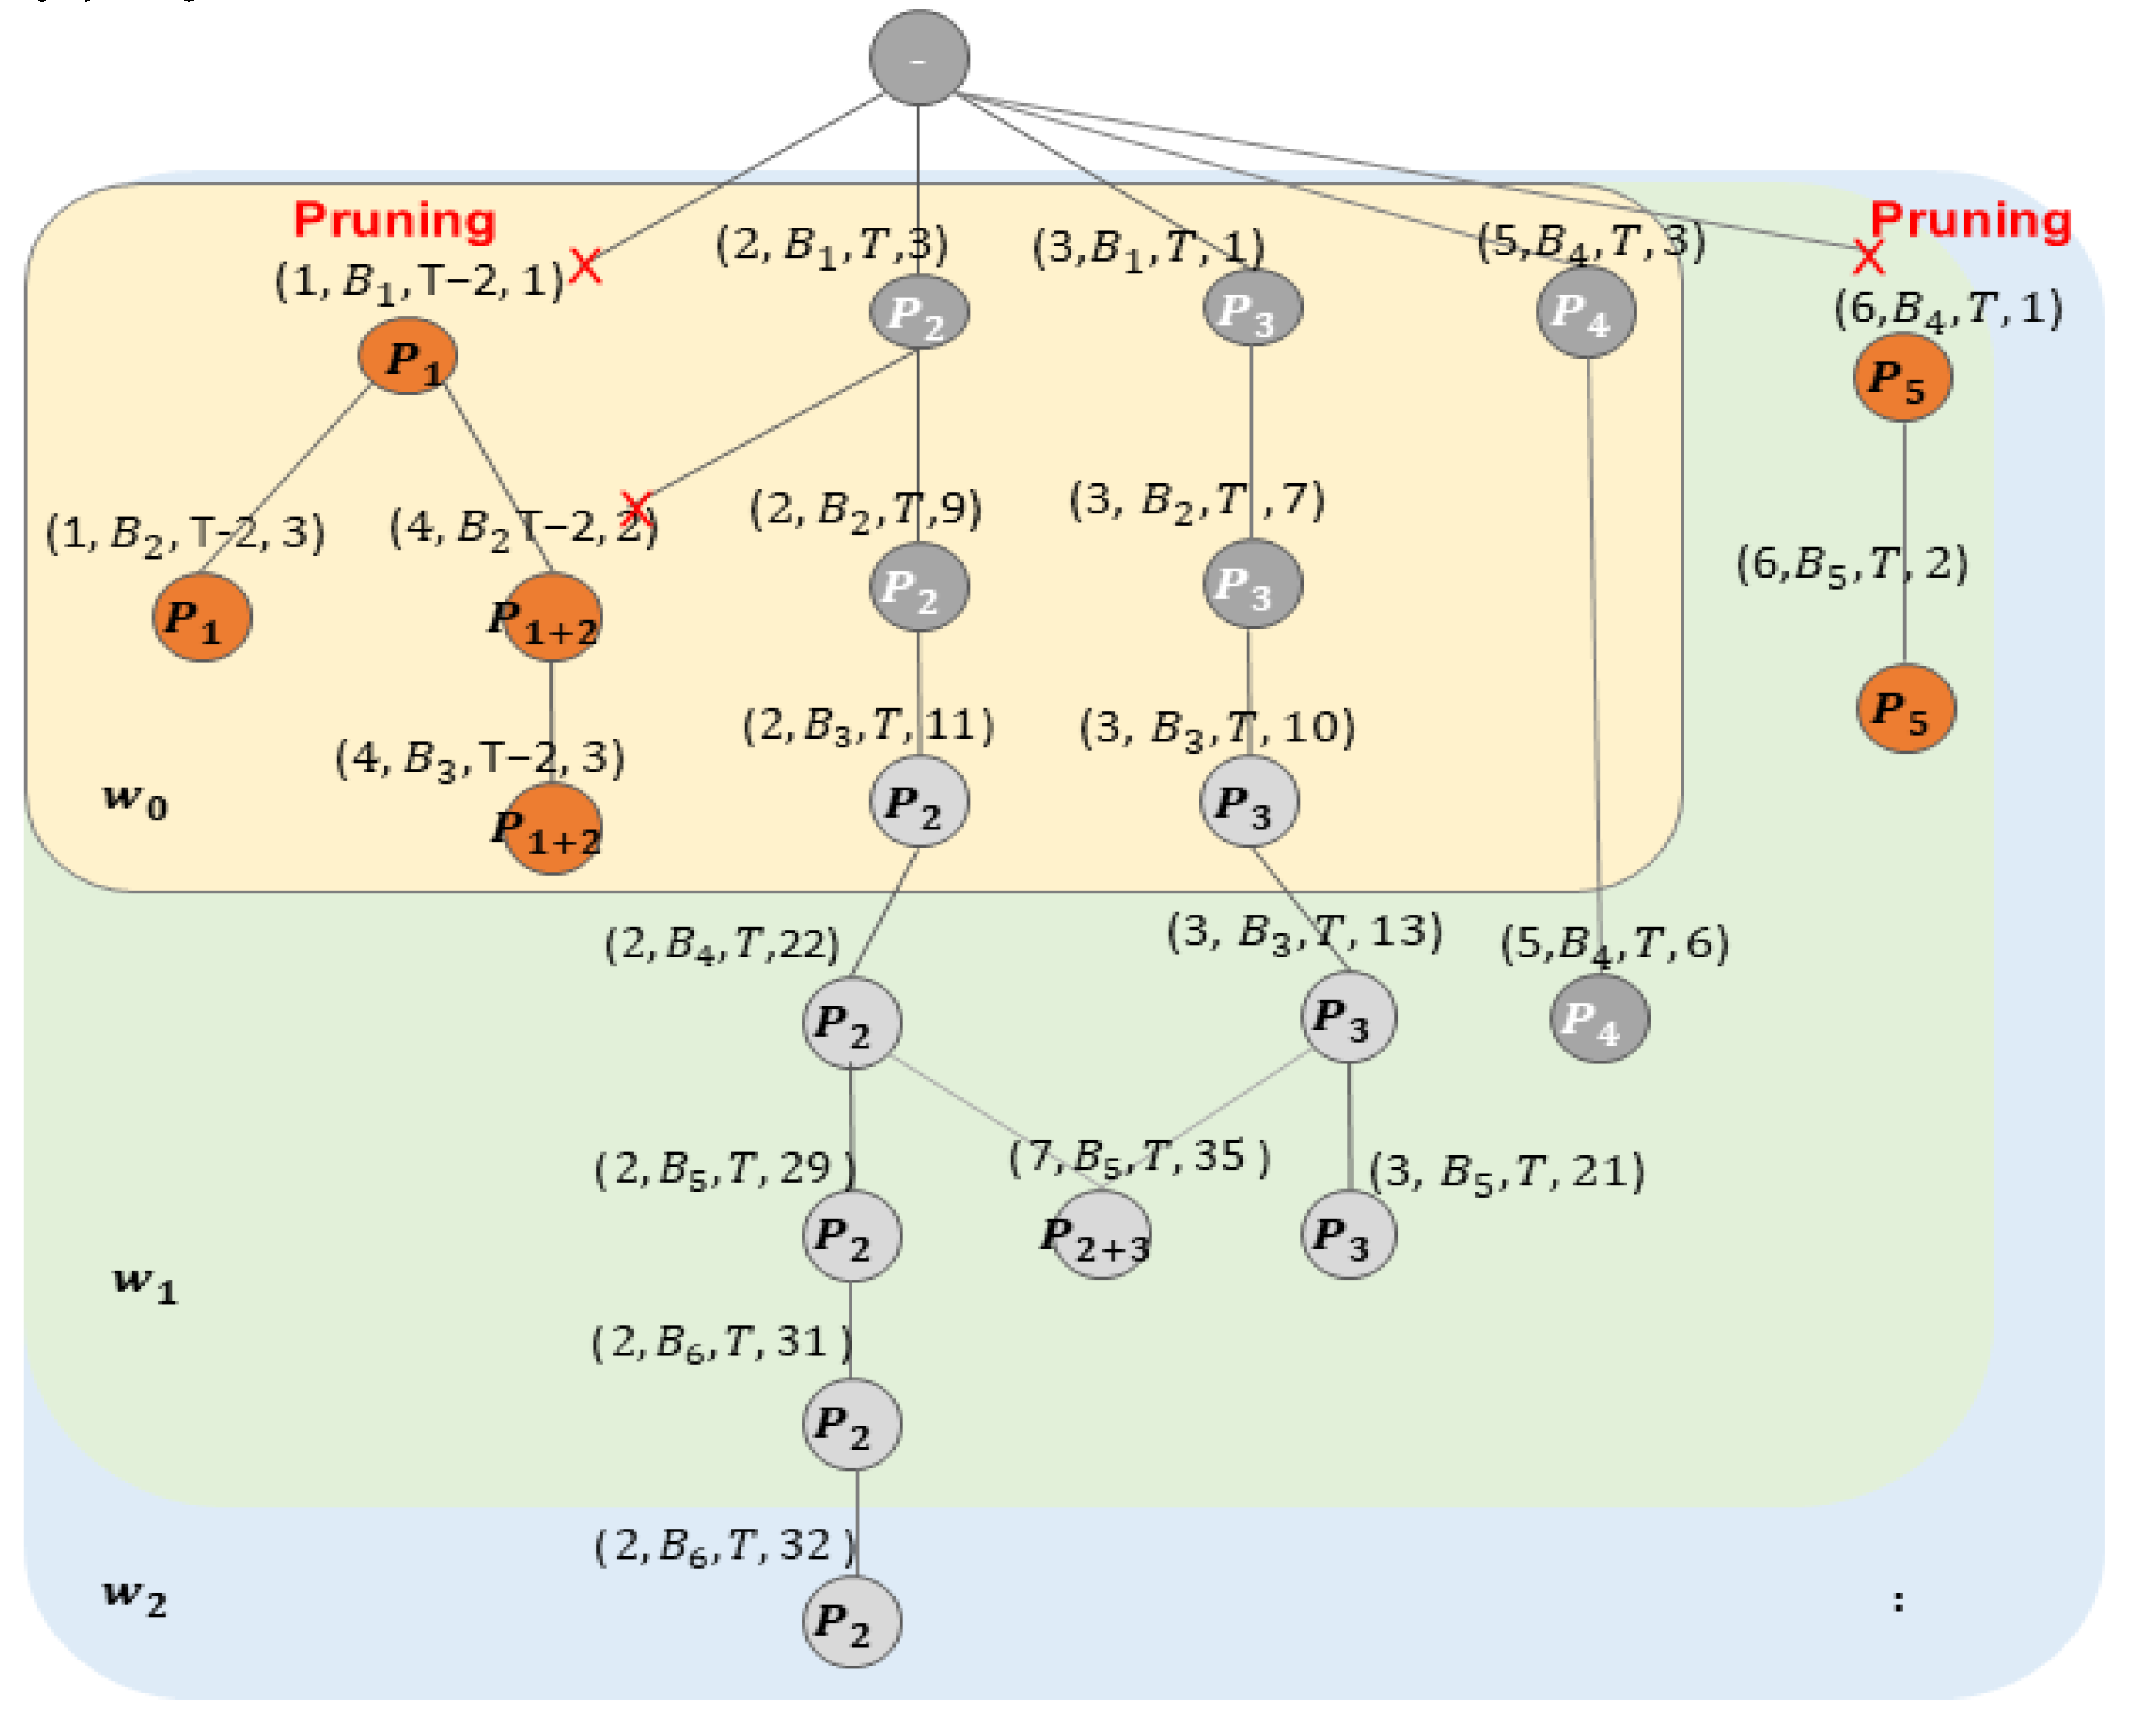
The proposed scheme applies the FP-Growth algorithm to the patterns stored in the dictionary to prune the infrequent patterns. This policy keeps the size of the pattern dictionary at a manageable level, maintaining only patterns appropriate for an in-memory environment. In other words, patterns with low usage are removed from the pattern dictionary, while those with high usage are updated to maintain the most current patterns; this enhances the compression efficiency in the dynamically changing graph stream environment.
Figure 6 shows an example of the pruning process applied with the FP-Growth algorithm. The proposed scheme structures the vertices of the FP-tree as follows.
.
When the frequent threshold value is 3 and the time threshold value is 2, vertices in the FP-tree with a frequent value below the threshold are deemed not frequent patterns and removed. Thus, pattern that does not meet the threshold in window is removed. Additionally, patterns that do not meet the threshold in window are also removed. This process reduces the storage cost of maintaining the patterns and secures space for new patterns to be added at the next point in time.
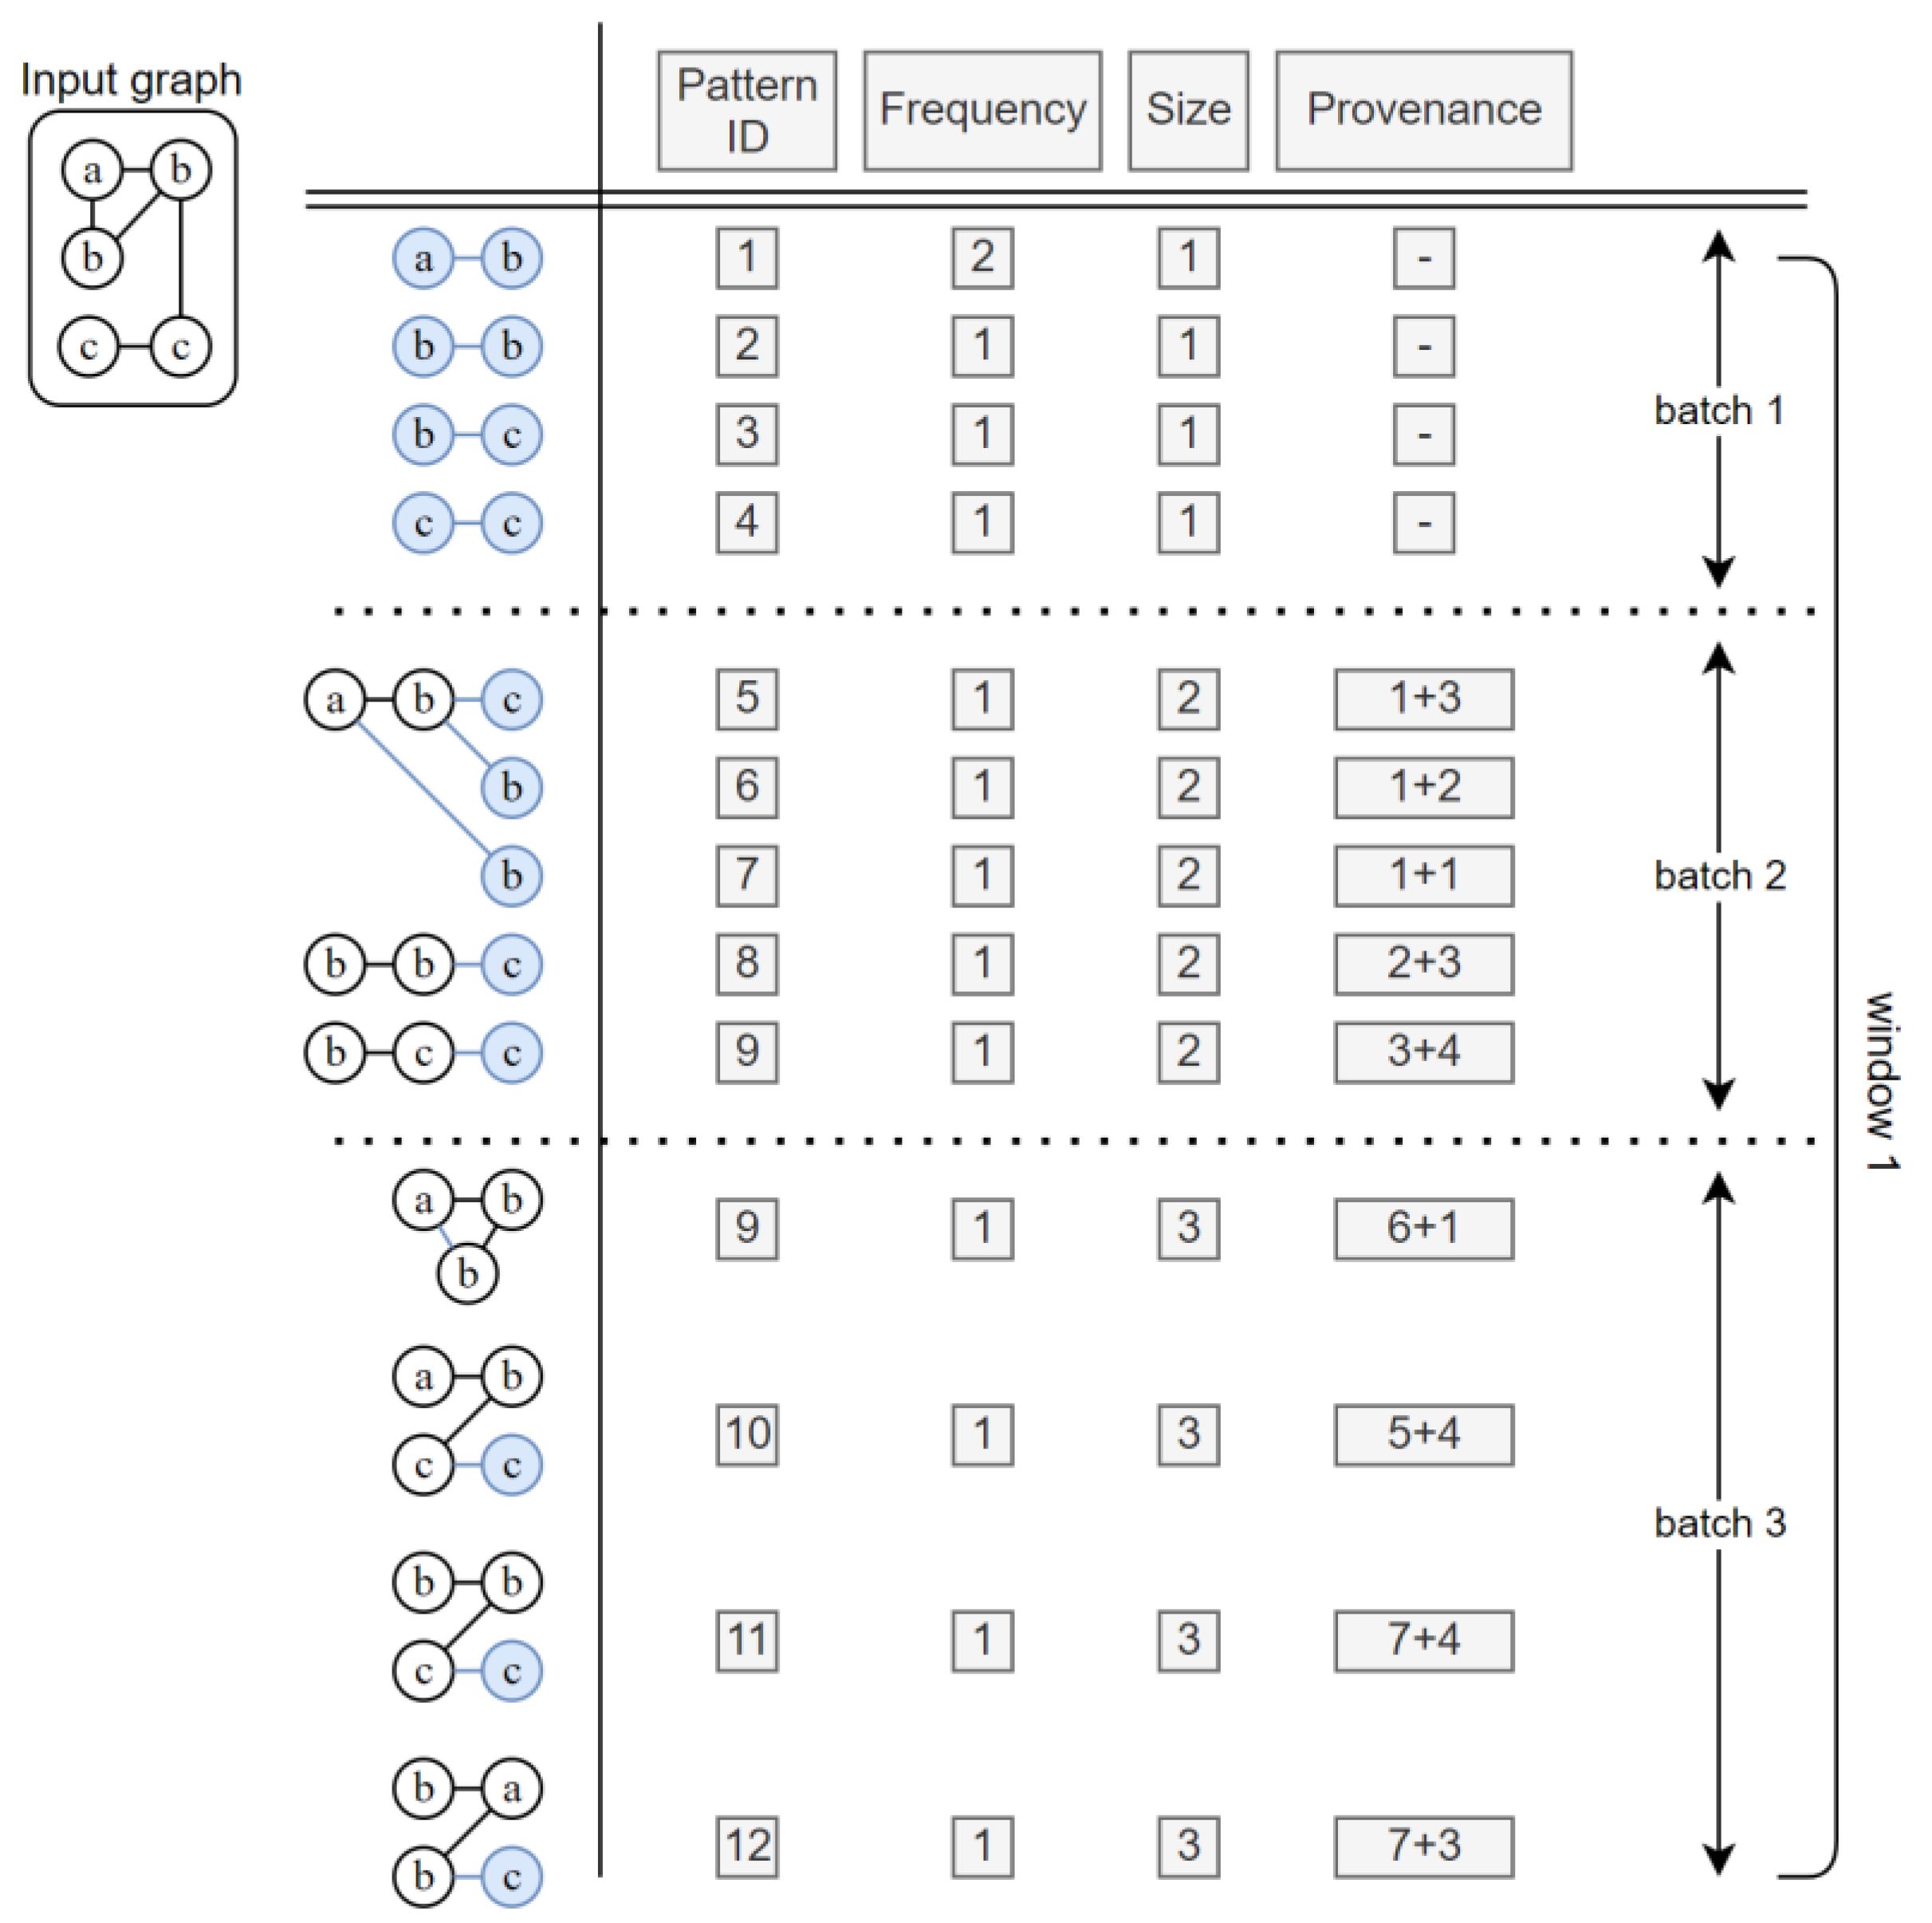
Figure 7 shows the process of input patterns being stored in the pattern dictionary and information on each pattern. The pattern dictionary stores various pieces of information on each pattern, such as pattern ID, frequency, size, provenance, batch, and window. The reference pattern generator and graph manager use the content stored in the pattern dictionary to determine the reference pattern and decide which patterns to consider as frequently occurring. A window consists of several batches.
Figure 7 shows an example where a window is composed of three batches. Each batch involves the process of expanding the patterns stored in the pattern dictionary. That is, when performing three batches, the graph is composed of a total of four edges, which is the maximum number of batches + 1.
When the input graph is as shown on the left side in
Figure 8, the initial form of the graph in the first batch is made up of single edges. These graphs are all of the same form, but are distinguished by the vertex labels. In the second batch, each pattern is expanded. Here, provenance allows knowing how each pattern has been expanded using the previously existing data in the pattern dictionary. The pattern dictionary records all the updated information on disk to maintain information related to all patterns. Utilizing this, the original data can be restored without any loss during graph compression and restoration.
3.4. Graph Compression Process
The compression process in this study, similar to the existing studies, involves (i) reading data up to the batch size and window size of the input original graph, (ii) constructing the graph, (iii) finding patterns, and (iv) then representing these patterns with pattern identifiers.
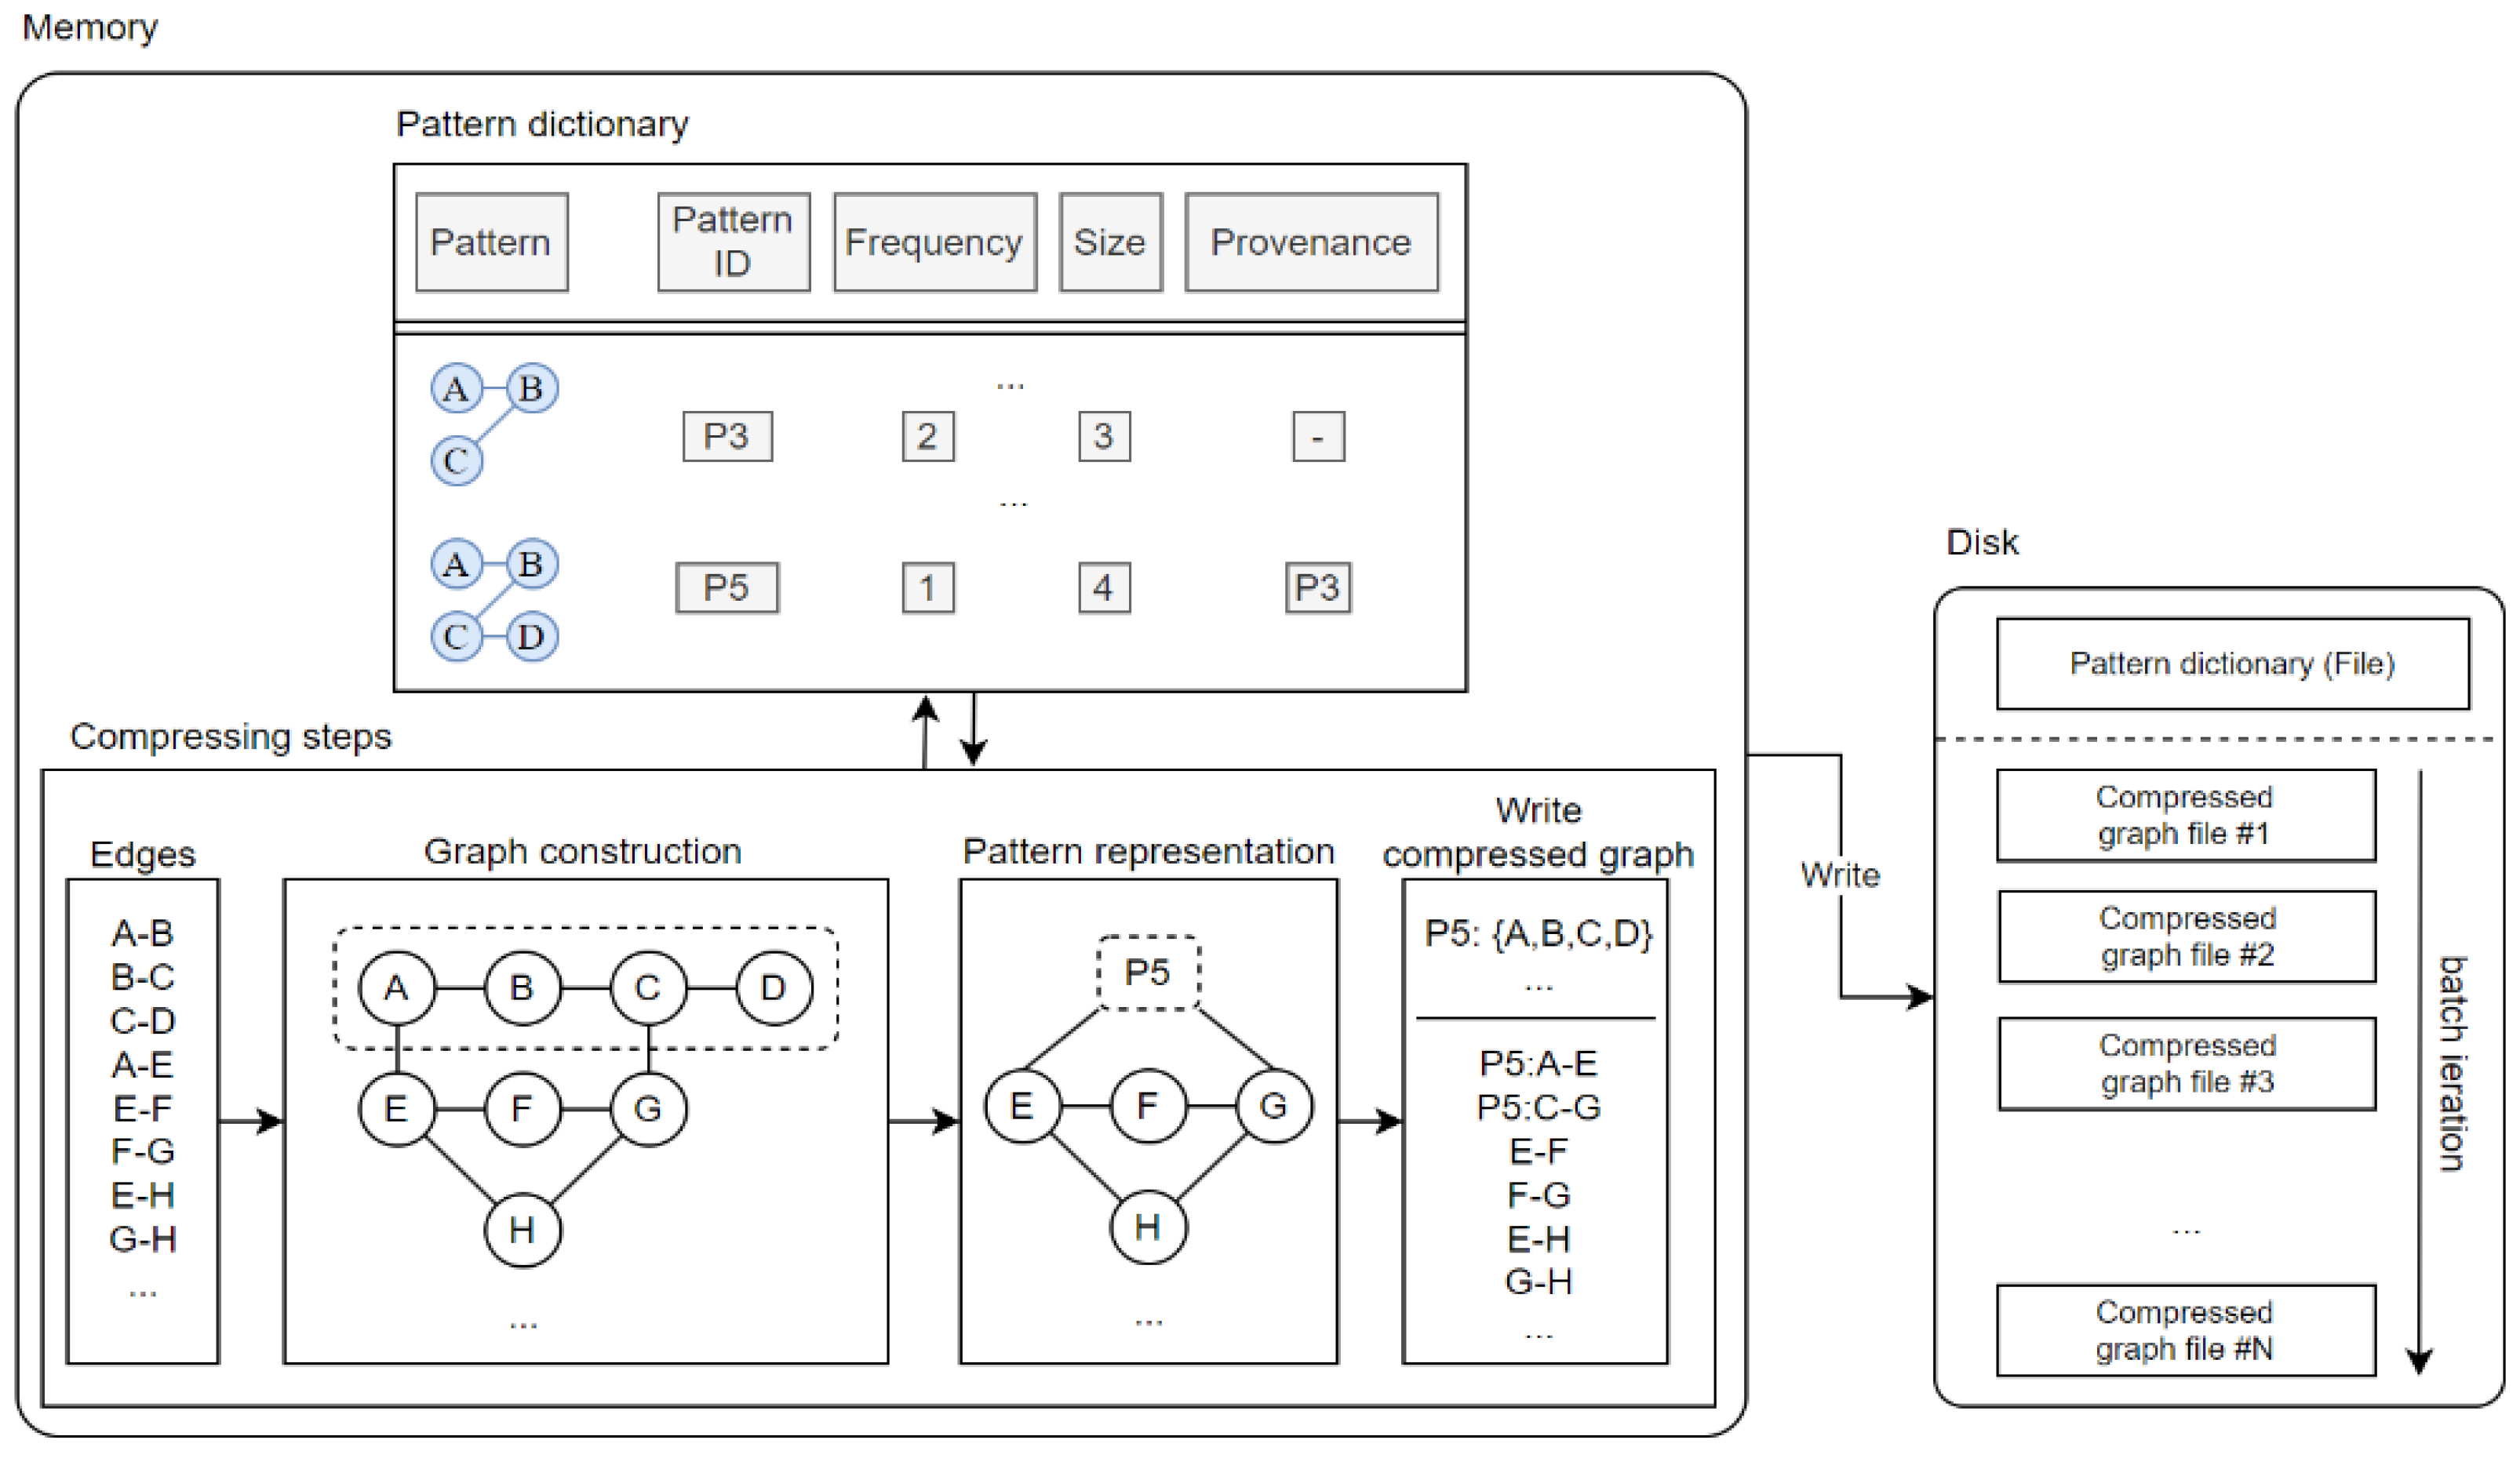
Figure 8 illustrates the proposed graph compression process and its structure. As described earlier, each component in the proposed scheme exists in memory, and the actual compression process itself is performed by the compressor. In
Figure 8, the compression steps represent the stages in compressing the graph. First, the graph is input as shown, which encompasses the entire process of representing this as a graph. In this stage, similar to the second stage of the compression process, when a graph is constructed and a certain pattern
is formed by
, that part corresponding to the pattern is replaced with
, and the details regarding that pattern are written together along with the pattern. This process is repeated for each batch to perform the actual compression process. This is represented on the right side of
Figure 8. That is, as many compressed graph files are created as there are repeated batches, and the pattern dictionary performs only the task of adding updated pattern information to one file.
Algorithm 2 presents the graph compression process. First, the graph for compression is initialized (line 1). Next, the set,
marked_matched_patterns, which indicates and tracks the compression patterns, is initialized (line 2). The
findMatchedPatternsOfPatternInGraph function finds the matched patterns, i.e., parts in the existing graph that match each pattern p, an element of the given pattern dictionary P (line 5). The matched pattern found in the original graph signifies the part to be expressed as a compressed graph pattern. Afterward, the process of adding elements connected to the original graph and patterns is performed (lines 7-14). Finally, all vertices and edges not included in the pattern are added to the compressed graph. This step is performed to preserve the structure and connectivity of the original graph. The written graph object is then returned and recorded on disk to conclude the compression process (lines 16-21).
| Algorithm 2. Graph compression |
| Input: graph G, pattern dictionary POutput: Compressed graph |
1
2
3
4
5
6
7
8
9
10
11
12
13
14
15
16
17
18
19
20
21
22
23 |
compressed_graph = new Graph()
marked_matched_patterns = set()
for pattern p in P:
matched_patterns = findMatchedPatternsOfPatternInGraph(p, G)
for matched_pattern in matched_patterns:
if matched_pattern not in marked_matched_patterns:
new_vertex = createVertexForPattern(p)
compressed_graph.addVertex(new_vertex)
marked_matched_patterns.add(matched_pattern)
connecting_vertices = getVerticesConnectedToMatchedPattern(matched_pattern, G)
for vertex in connecting_vertices:
compressed_graph.addEdge(new_vertex, vertex)
for vertex in G.vertices:
if vertex not in marked_matched_patterns:
compressed_graph.addVertex(vertex)
for edge in G.edges:
if edge not connected to marked_matched_patterns:
compressed_graph.addEdge(edge.source, edge.target)
return compressed_graph |
|
4. Performance Evaluation
The performance of the proposed technique was evaluated against some of the existing methods to demonstrate its excellence and validity. An experiment was conducted with two main focuses. First, a dataset with repeated patterns was created following [
27] to verify if the proposed technique could identify patterns necessary for compression. Second, the experiment was conducted on various real-world graph sets.
Table 1 presents the experimental environment.
Equation (2) calculates the size of the compressed graph compared to the original one. Using this equation, the extent of compression of the relative to the size of the original data can be determined. The performance evaluation assesses changes in compression time and rate depending on the pattern dictionary size in a graph stream environment. Additionally, the change in compression rate based on the size of the batch can be examined; thus, the performance of the proposed technique can be verified and validated under various conditions.
Finally, the experiments in this study were conducted with a window size
of 3, threshold
of 2, and an
of 0.5. First, an experiment was conducted to verify if the proposed technique could find the subgraphs it sought. The patterns of each dataset presented in
Table 2 include 3-clique, 4-clique, 4-star, 4-path, 5-path, and 8-tree, i.e., a total of six patterns. In this experiment, experimental datasets with a desired frequency were created following [
27]. The data used in the experiment consisted of 1,000 vertices and 10,000 edges. “Cov.” (coverage) in
Table 2 indicates the extent to which the pattern constituted the entire graph. The experimental results show that the proposed technique, while generally taking more time than GraphZip [
11], accurately found all the subgraph patterns. Furthermore, the proposed technique was able to find accurate subgraph patterns faster than SUBDUE [
27]. In this experiment, when the experiment time exceeded 10 min (600 s), it was deemed erroneous and marked as timed-over.
Table 3 presents some real-world datasets used in the experiment. These datasets are frequently used in applications, such as graph pattern mining. Additionally, the table includes the labels used for thee datasets in subsequent experiments, number of vertices and edges, description of the dataset contents, and their size on disk.
Table 4 presents the average number of patterns, average processing time, and average compression rate as a function of the batch size. Owing to the characteristics of stream-based pattern mining techniques, as the batch size increases, both the time taken to process it and amount of memory required increase. This feature means that depending on the graph compression application, it may be necessary to choose an appropriate batch size. In this study, the batch size was fixed at 300 to satisfy the size of the pattern dictionary. This allowed for a stable measurement of the performance of the proposed technique.
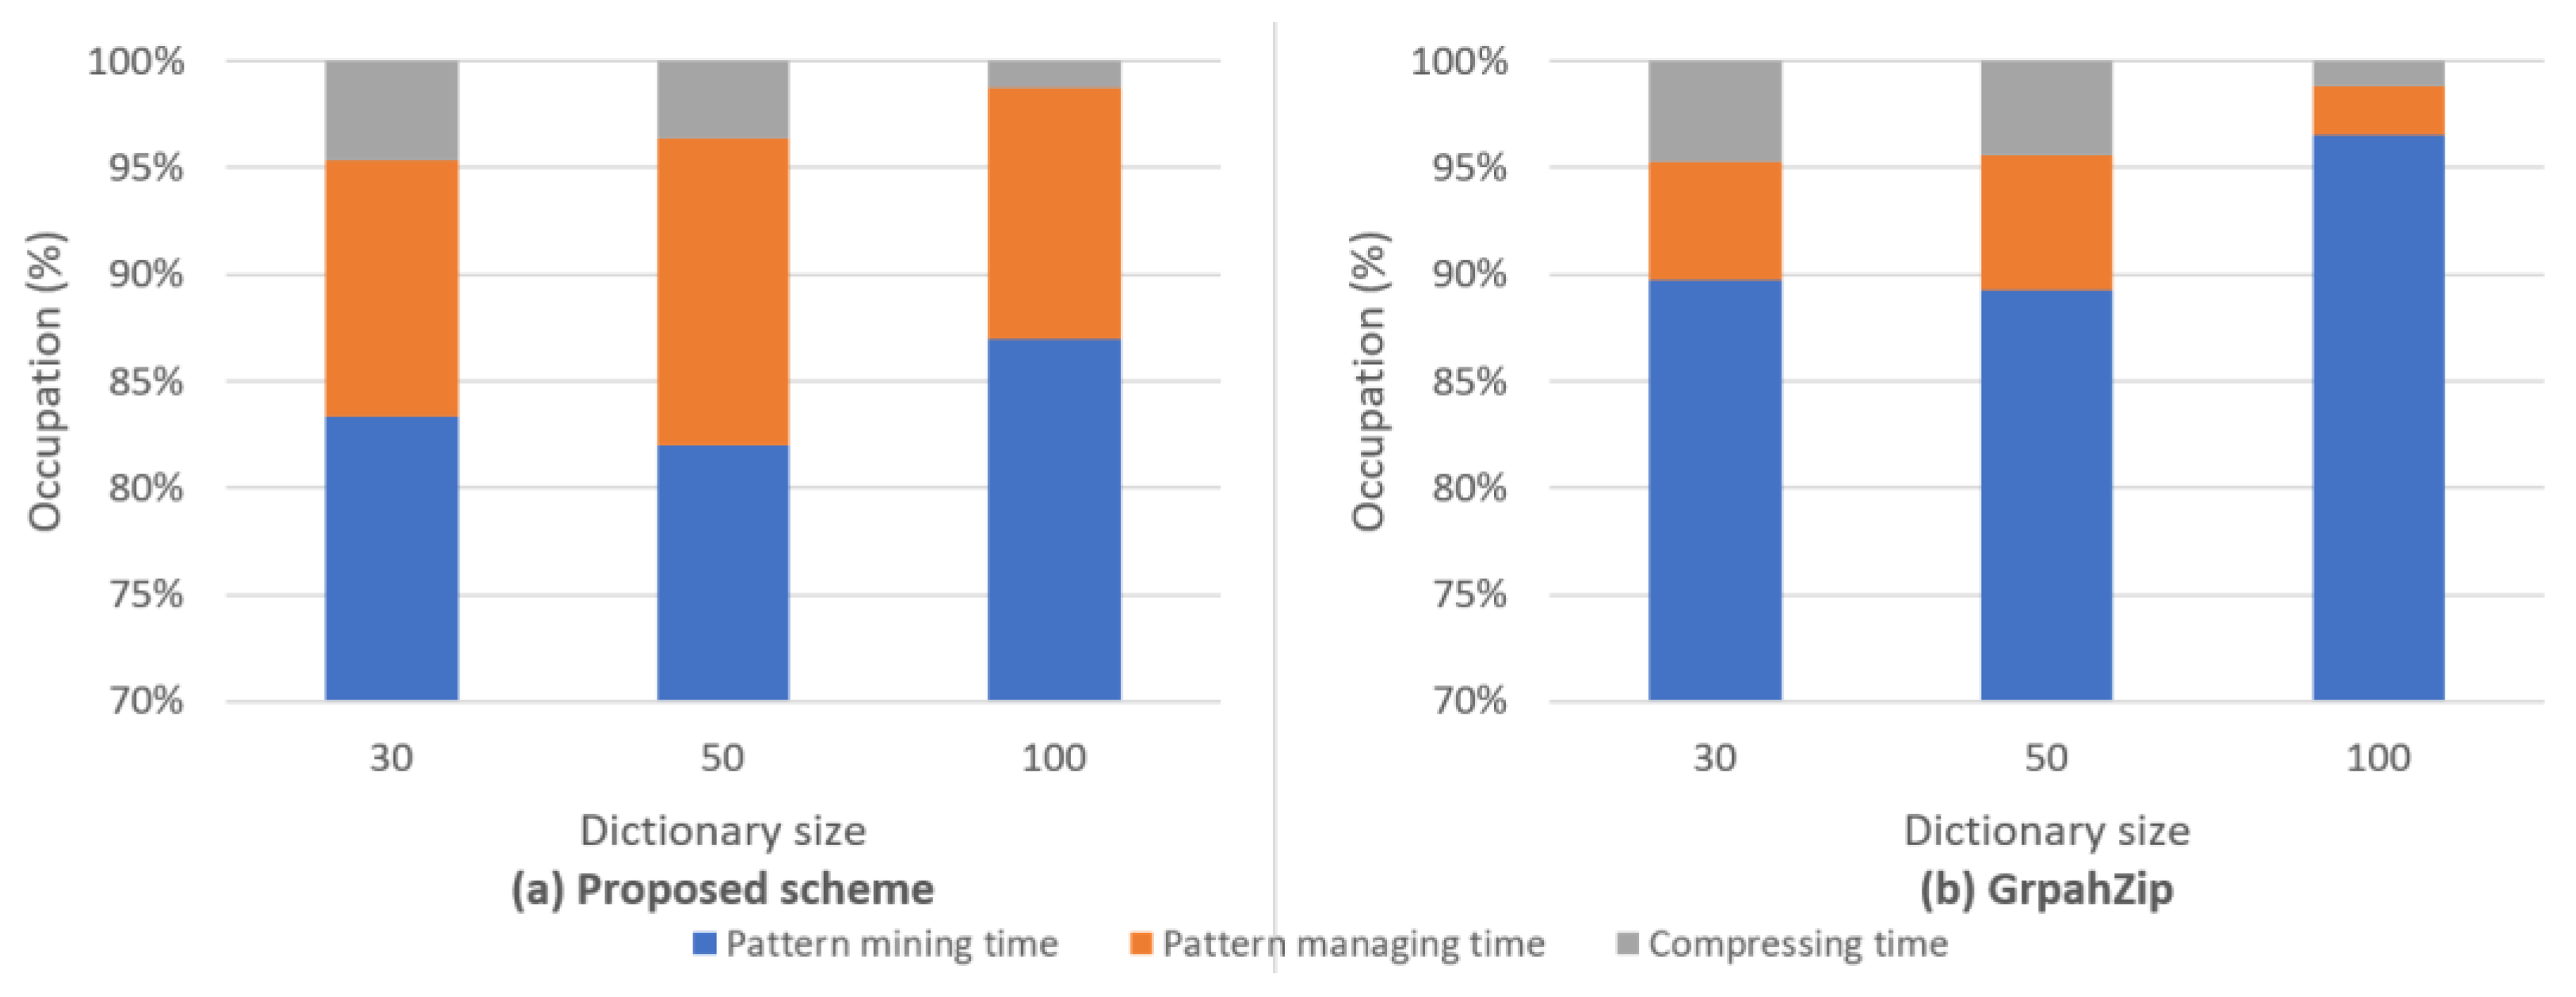
Figure 8 shows the time spent on each process in the overall graph compression process according as a function of the pattern dictionary size. Specifically,
Figure 8(a) and (b) show the performance evaluation results of the proposed scheme and one of the existing schemes, namely GraphZip, respectively. It was observed that the proposed technique takes longer in this process owing to its more complex policy for scoring complex graph patterns. In pattern-based compression methods, the process of finding patterns occupies most of the time; the proposed scheme generally spends more than 10% of the time managing patterns, while GraphZip spends less than 5%. In other words, the proposed scheme generally spends more time effectively managing and allocating more complex patterns than the existing methods, thereby demonstrating a higher level of graph pattern recognition and compression efficiency.
Figure 8.
Time requirement for each process step in the complete process: (a) proposed scheme; (b) GraphZip.
Figure 8.
Time requirement for each process step in the complete process: (a) proposed scheme; (b) GraphZip.
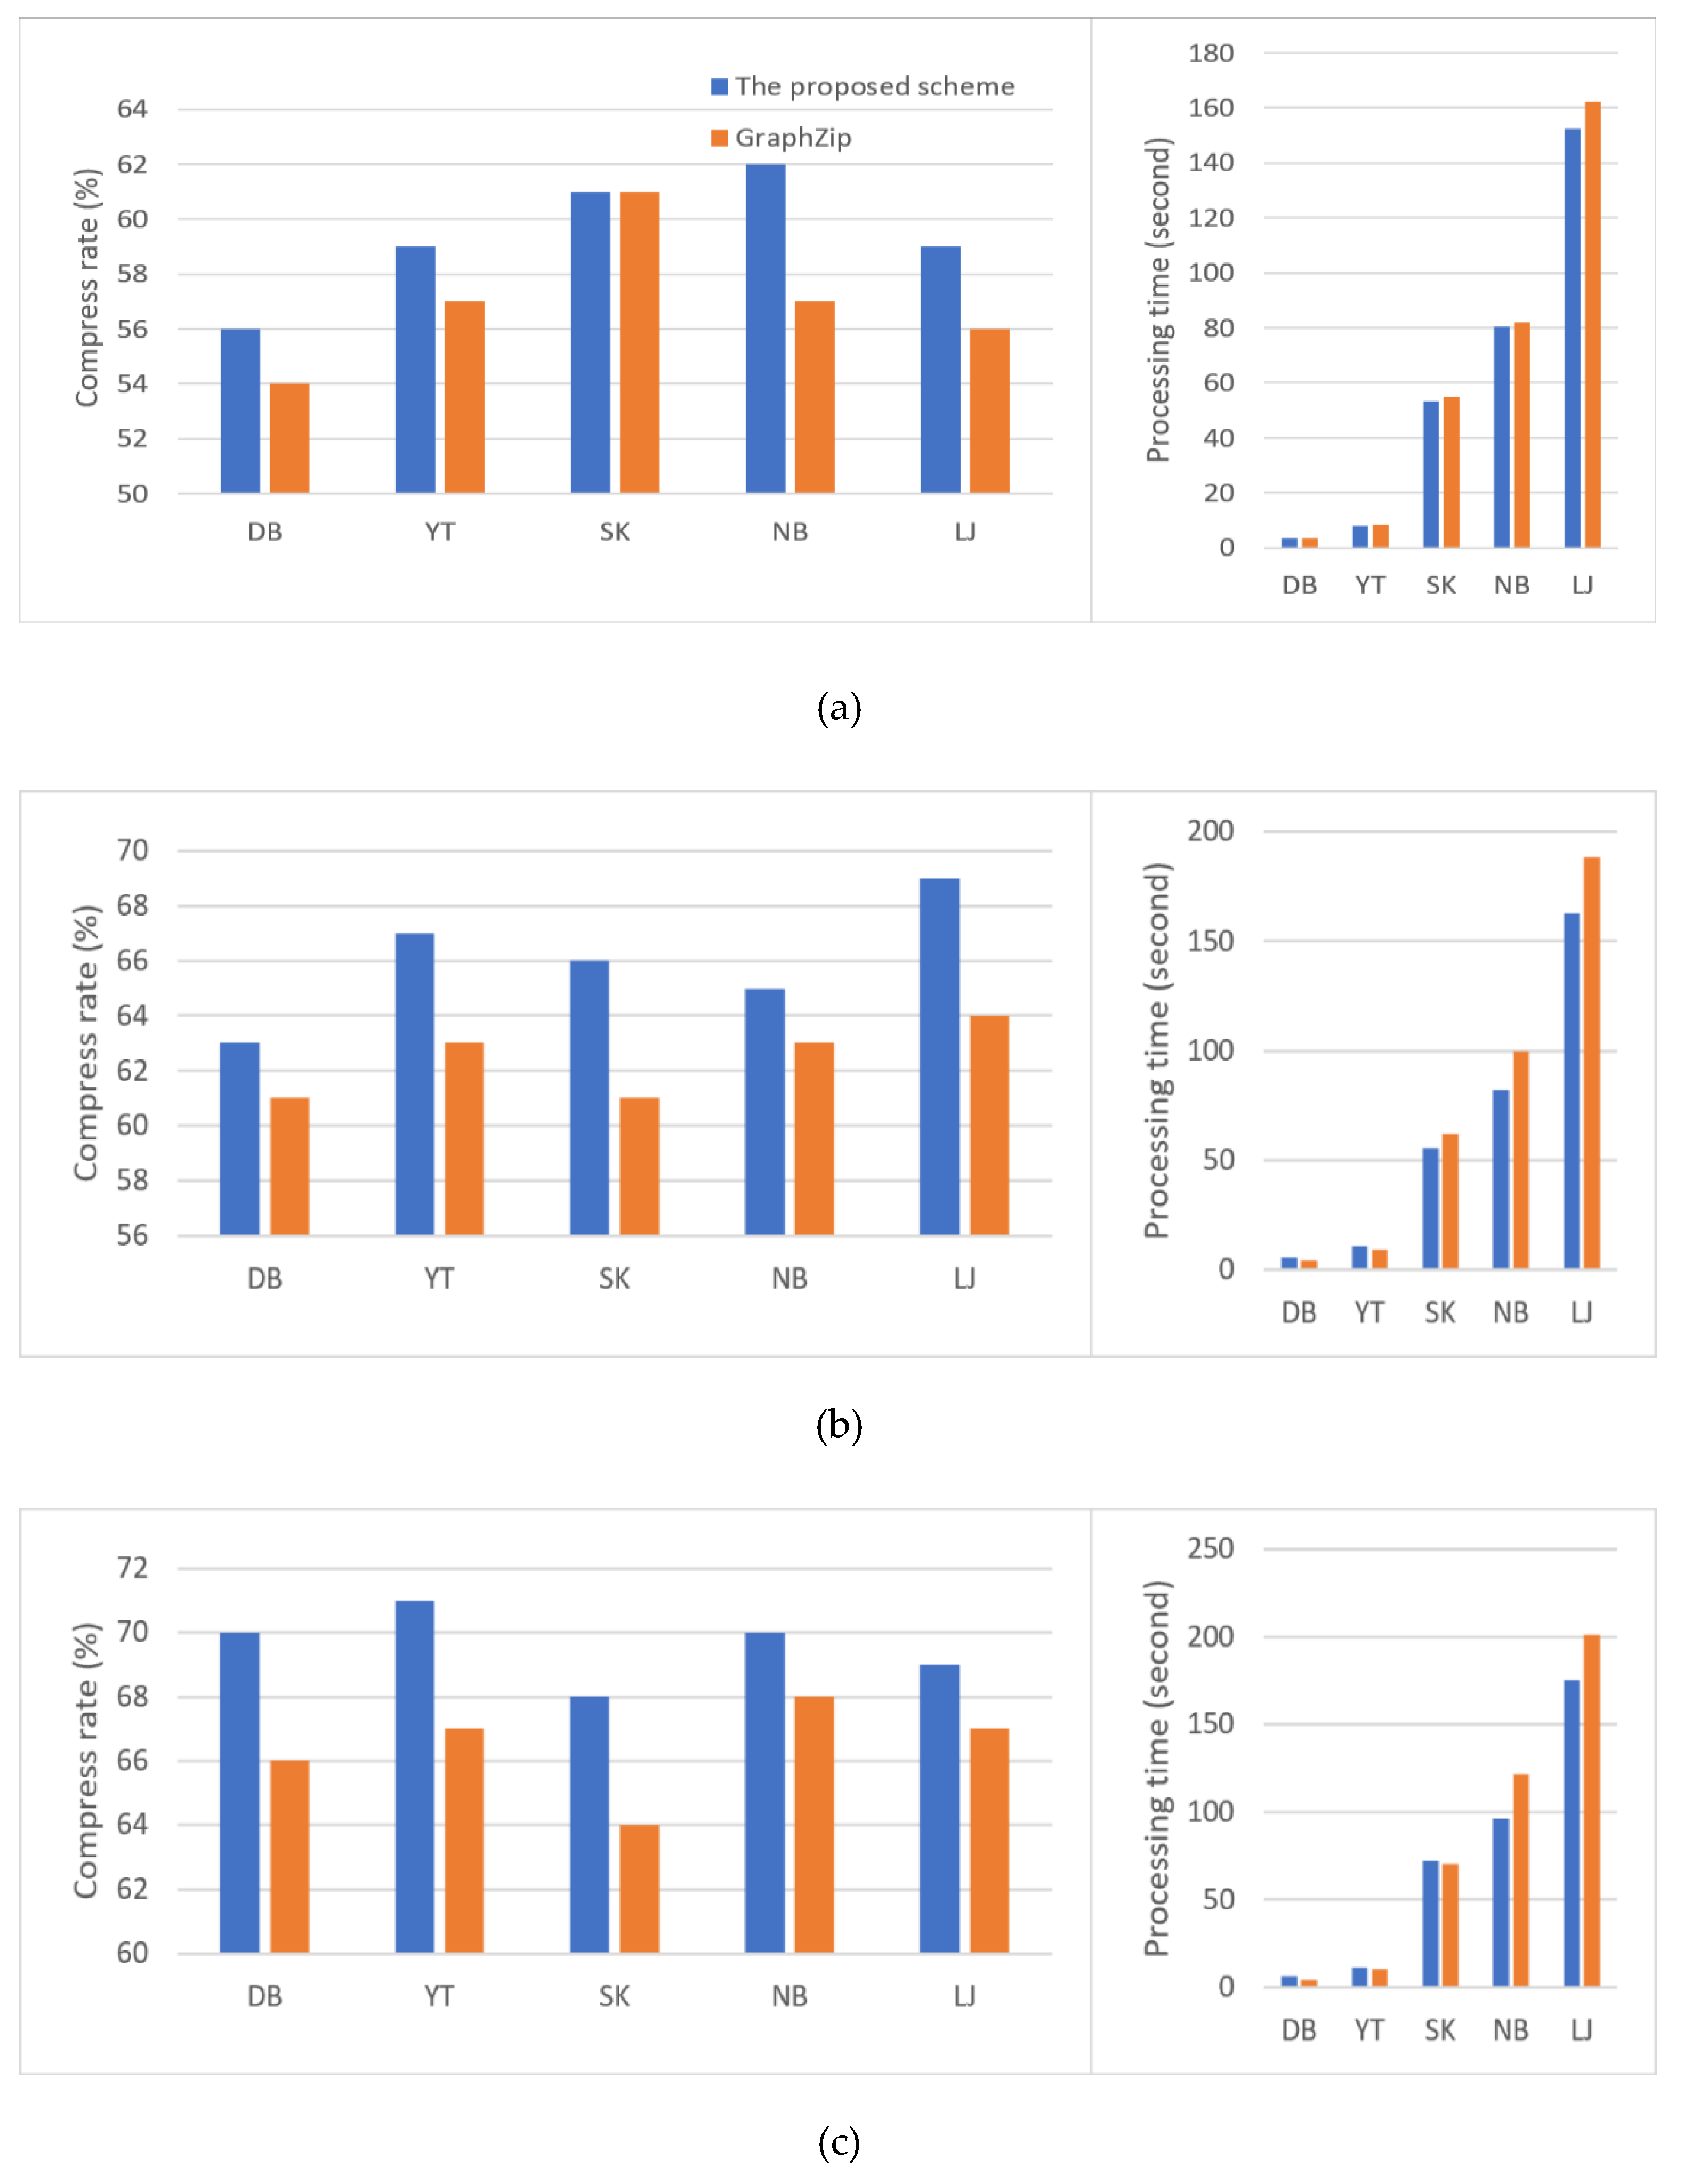
Additionally, experiments on some datasets confirmed that the proposed technique required less time than the existing methods. This implies that the proposed technique can achieve a balance between efficiency and performance depending on the situation.
Figure 9 shows the compression rate and time taken for compression as a function of the pattern dictionary size. The left side plots show the compression rate, while the right side ones show the compression execution time. Generally, the proposed technique demonstrated superior performance in most experiments, especially in larger datasets. One of the existing methods, GraphZip [
11] assigns value based on size and frequency for each pattern, which may lead to performance degradation if high-scored patterns do not reappear.
In contrast, the proposed scheme considers frequency, size, and time for each pattern. Although it takes more time owing to complex calculations required for each pattern, it maintains more important patterns and deletes less significant ones, thus managing the pattern dictionary more effectively.
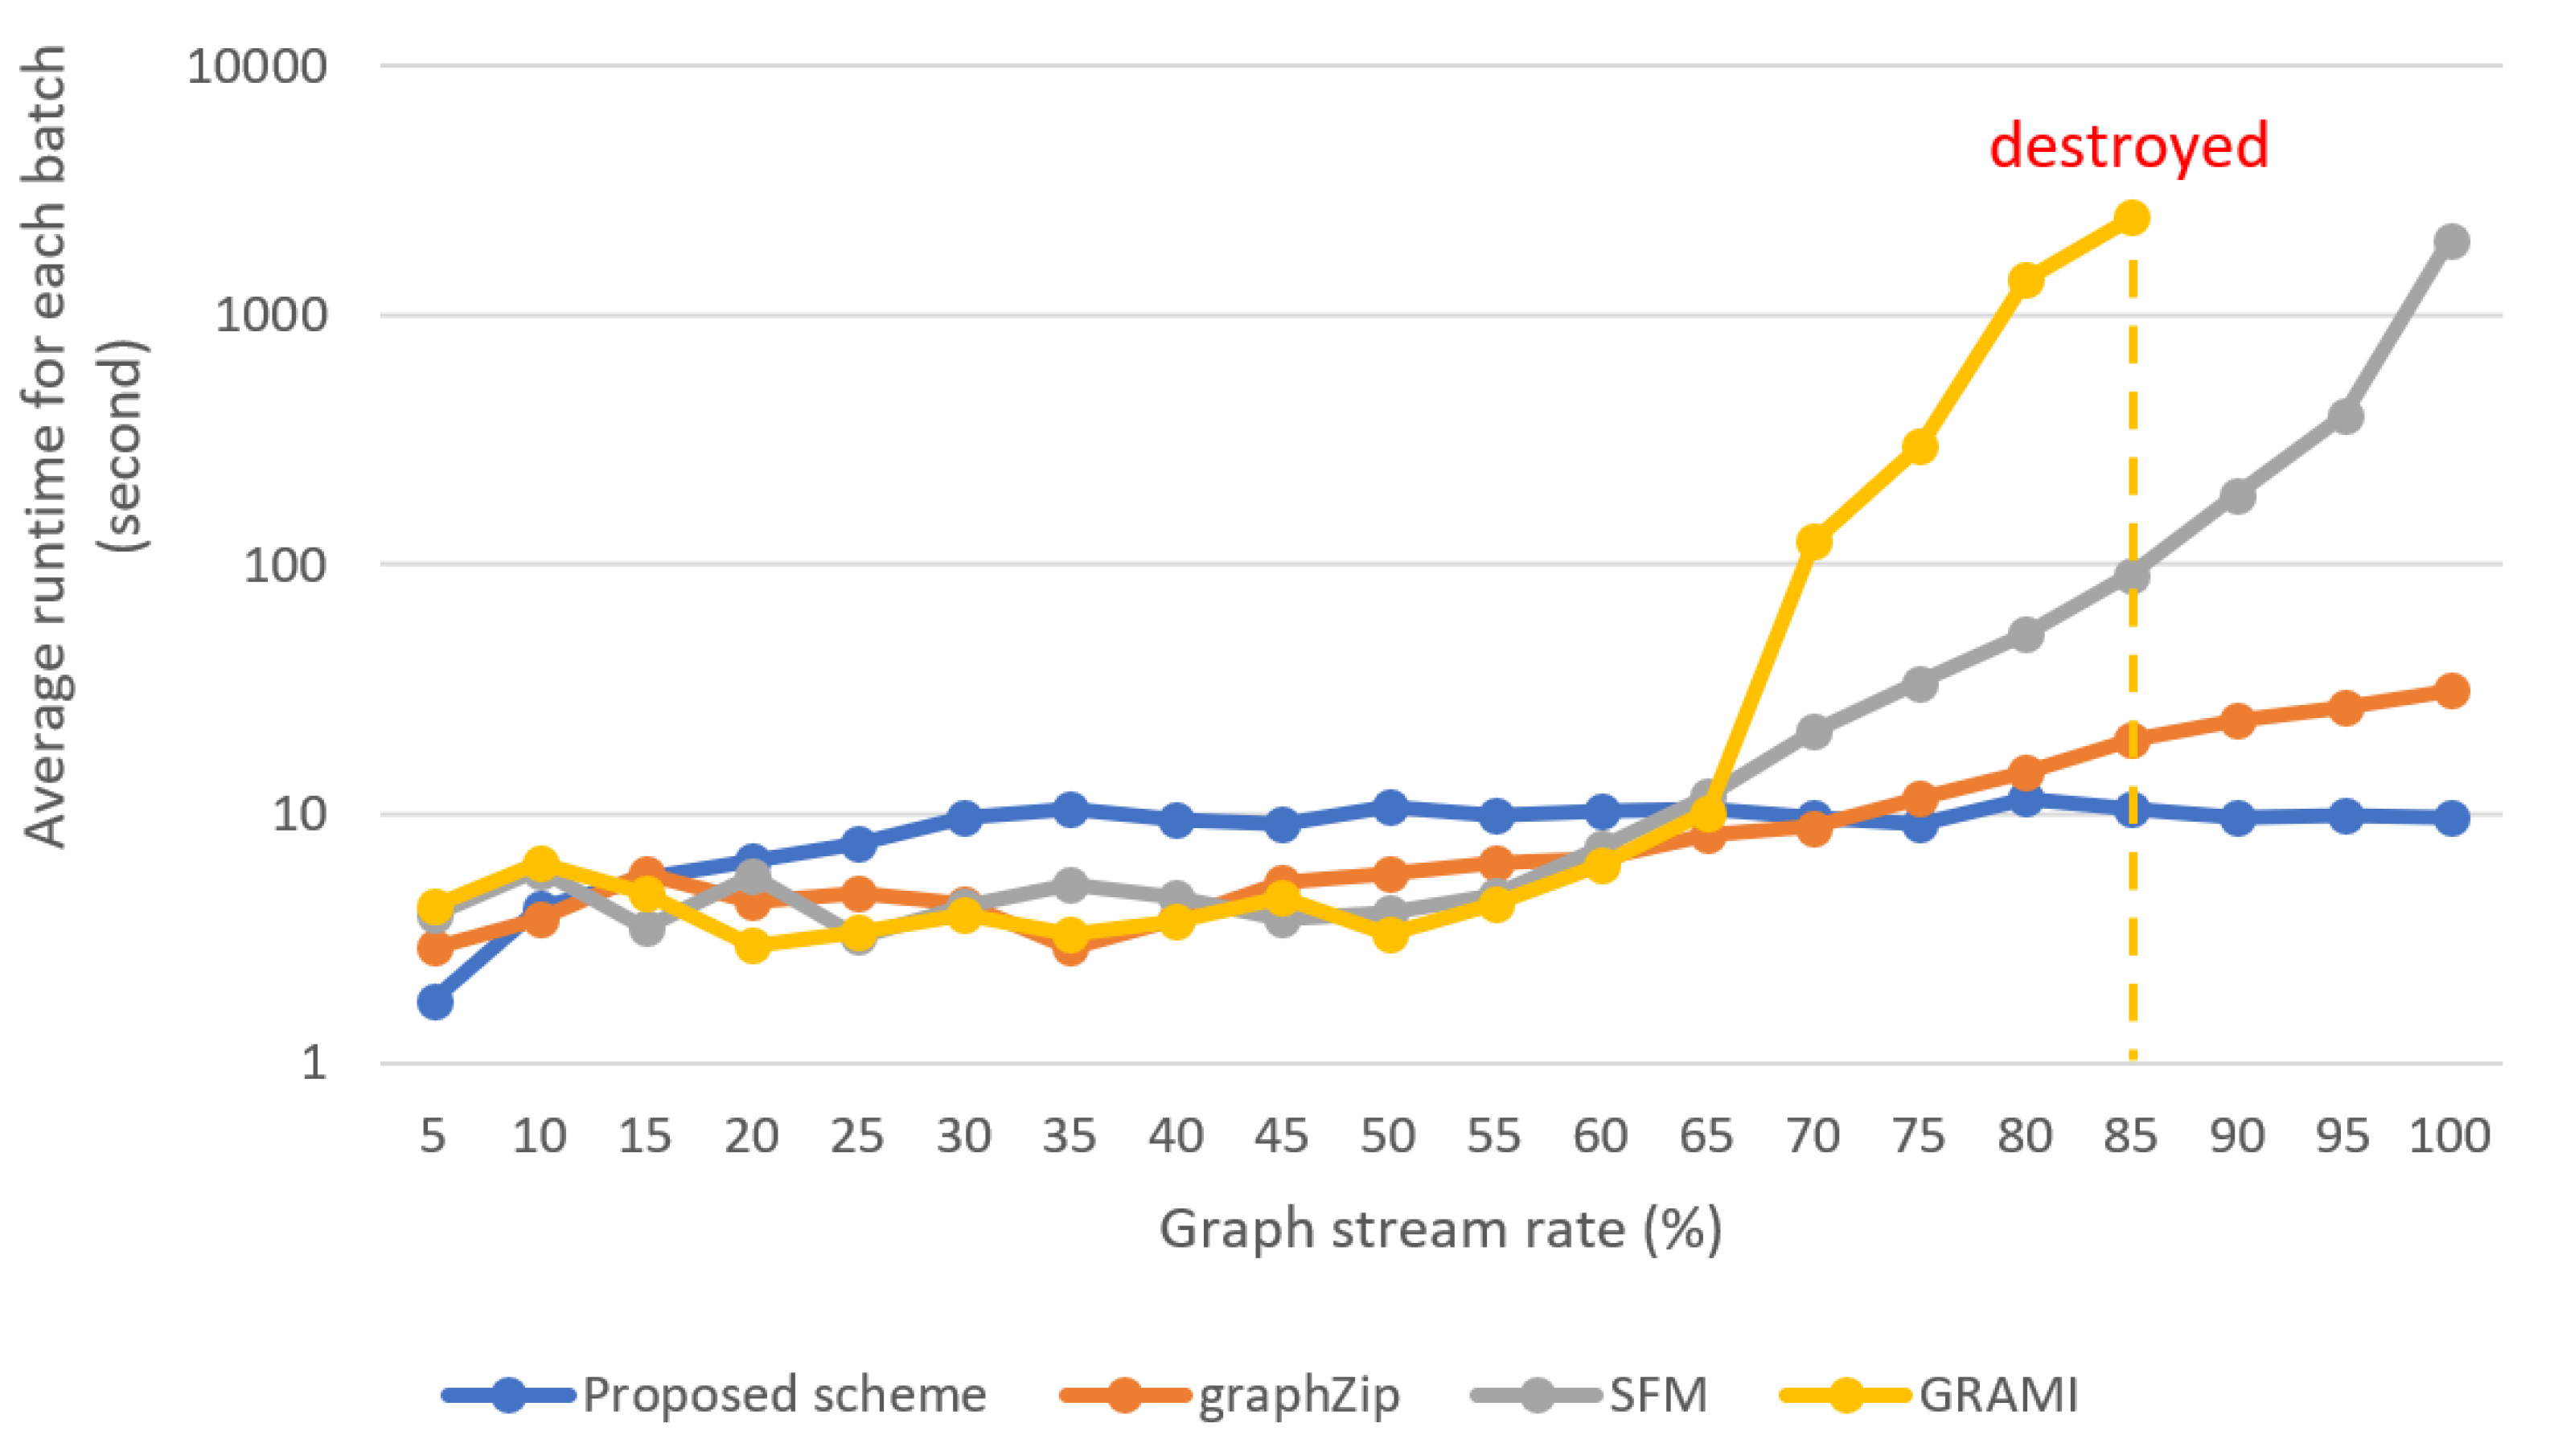
Figure 10 shows the results of a performance comparison between the proposed scheme and existing incremental graph pattern extraction methods, using the largest dataset, LiveJournal. GRAMI [
28] and FSM [
10], which are similar to GraphZip [
11] and find frequent patterns in graphs in a stream environment, were included in the experiment. The horizontal axis of the figure represents the percentage of batch processing progress in graph stream data. That is, at a value of 5 on the horizontal axis, approximately 5% of the total graph stream will have been processed. The horizontal axis is divided in intervals of 5%. The total execution time is as shown in
Figure 9(c). For this dataset, with a batch size of 300, approximately 115,000 iterations of processing were performed. The experimental results showed that for up to 70% of the entire process, GraphZip outperformed the proposed scheme in terms of processing time; however, later on, the latter outperformed the former. This indicates that the proposed technique performs faster computations by eliminating unnecessary patterns. On the other hand, the existing methods GRAMI and FSM saw an exponential increase in the computation time in the latter half as the number of patterns to compare increased.
5. Conclusions
In this paper, we proposed an incremental frequent pattern-based compression scheme for processing graph streams. It identifies frequent patterns through graph pattern mining, assigns scores to the patterns, and selects reference patterns from among them. Additionally, it utilizes pattern and provenance information to leverage the change history of graphs. The proposed method was observed to detect patterns and perform compression faster than the existing techniques. It can be applied to dynamically changing stream graphs, and improve space efficiency by storing only the most efficient patterns in memory. Furthermore, by maintaining the latest patterns, the proposed scheme improves the compression efficiency and processing speed of graph streams that change in real time. Performance evaluation results showed that in environments with repeated patterns, the proposed technique performed similar to the existing methods; however, for real-world data, it consistently yielded higher compression rates and faster processing times in most environments. Smaller pattern dictionary sizes used in this scheme facilitate a more effective compression, compared to other pattern mining schemes. Especially in real-time processing environments with limited latency, the proposed scheme outperformed other graph compression or graph pattern mining schemes in terms of processing time. However, some areas exist, where it does not significantly excel in compression rate, and guaranteeing performance for more complex patterns or scalability might be difficult. To address these issues, we plan to enhance its performance via techniques utilizing GPUs and conduct experiments with other various stream-based graph compression schemes.
Author Contributions
Conceptualization, H.L., B.S., D.C., J.L., K.B. and J.Y.; methodology, H.L., B.S., D.C., J.L., K.B. and J.Y.; validation, H.L., B.S., D.C., J.L. and K.B.; formal analysis, H.L., B.S., D.C., J.L. and K.B.; writing—original draft preparation, H.L., B.S., D.C., J.L. and K.B.; writing—review and editing, J.Y. All authors have read and agreed to the published version of the manuscript.
Funding
This work was supported by the National Research Foundation of Korea(NRF) grant funded by the Korea government(MSIT). (No. 2022R1A2B5B02002456, 33%), by the MSIT(Ministry of Science and ICT), Korea, under the Grand Information Technology Research Center support program(IITP-2024-2020-0-01462, 34%) supervised by the IITP(Institute for Information & communications Technology Planning & Evaluation)” and with the support of "Cooperative Research Program for Agriculture Science and Technology Development (Project No. RS-2021-RD010195, 33%)" Rural Development Administration, Republic of Korea.
Institutional Review Board Statement
Not applicable.
Informed Consent Statement
Not applicable.
Conflicts of Interest
The authors declare no conflicts of interest.
Appendix A. Datasets and Libraries
This study utilizes the following publicly available datasets:
These datasets are publicly available and can be downloaded from the provided URLs. The datasets were selected to demonstrate the performance of the proposed graph compression technique on various types of real-world graph data.
The following libraries were used to process the datasets and perform the experiments:
igraph (
https://igraph.org/): A library for creating and manipulating graphs, as well as analyzing networks.
NetworkX (
https://networkx.org/): A library for studying complex networks, providing tools for graph creation, manipulation, and analysis.
These libraries were used in Python to extract the necessary graph structures from the datasets and conduct the experiments.
References
- Song, J.; Yi, Q.; Gao, H.; Wang, B.; Kong, X. Exploring Prior Knowledge from Human Mobility Patterns for POI Recommendation. Applied Sciences 2023, 13. [Google Scholar] [CrossRef]
- Kouahla, Z.; Benrazek, A.-E.; Ferrag, M.A.; Farou, B.; Seridi, H.; Kurulay, M.; Anjum, A.; Asheralieva, A. A Survey on Big IoT Data Indexing: Potential Solutions, Recent Advancements, and Open Issues. Future Internet 2022, 14. [Google Scholar] [CrossRef]
- Cook, D.J.; Holder, L.B. Substructure Discovery Using Minimum Description Length and Background Knowledge 1994.
- Wang, G.; Ai, J.; Mo, L.; Yi, X.; Wu, P.; Wu, X.; Kong, L. Anomaly Detection for Data from Unmanned Systems via Improved Graph Neural Networks with Attention Mechanism. Drones 2023, 7. [Google Scholar] [CrossRef]
- Henecka, W.; Roughan, M. Lossy Compression of Dynamic, Weighted Graphs. In Proceedings of the 2015 3rd International Conference on Future Internet of Things and Cloud; 2015; pp. 427–434. [Google Scholar]
- Shah, N.; Koutra, D.; Zou, T.; Gallagher, B.; Faloutsos, C. TimeCrunch: Interpretable Dynamic Graph Summarization. In Proceedings of the Proceedings of the 21th ACM SIGKDD International Conference on Knowledge Discovery and Data Mining; Association for Computing Machinery: New York, NY, USA, 2015; pp. 1055–1064. [Google Scholar]
- Li, Y.; Ge, M.; Li, M.; Li, T.; Xiang, S. CLIP-Based Adaptive Graph Attention Network for Large-Scale Unsupervised Multi-Modal Hashing Retrieval. Sensors 2023, 23. [Google Scholar] [CrossRef]
- Zhao, H.; Zhang, W.; Huang, M.; Feng, S.; Wu, Y. A Multi-Granularity Heterogeneous Graph for Extractive Text Summarization. Electronics (Basel) 2023, 12. [Google Scholar] [CrossRef]
- Park, Y.-J.; Lee, M.; Yang, G.-J.; Park, S.J.; Sohn, C.-B. Web Interface of NER and RE with BERT for Biomedical Text Mining. Applied Sciences 2023, 13. [Google Scholar] [CrossRef]
- Ray, A.; Holder, L.; Choudhury, S. Frequent Subgraph Discovery in Large Attributed Streaming Graphs. In Proceedings of the Proceedings of the 3rd International Workshop on Big Data, Streams and Heterogeneous Source Mining: Algorithms, Systems, Programming Models and Applications; 36; Fan, W., Bifet, A., Yang, Q., Yu, P.S., Eds.; PMLR: New York, New York, USA, April ; Vol, 2014; pp. 166–181. [Google Scholar]
- Packer, C.A.; Holder, L.B. GraphZip: Dictionary-Based Compression for Mining Graph Streams 2017.
- Leung, C.K.; Khan, Q.I. DSTree: A Tree Structure for the Mining of Frequent Sets from Data Streams. In Proceedings of the Sixth International Conference on Data Mining (ICDM’06); 2006; pp. 928–932. [Google Scholar]
- Dolgorsuren, B.; Khan, K.U.; Rasel, M.K.; Lee, Y.-K. StarZIP: Streaming Graph Compression Technique for Data Archiving. IEEE Access 2019, 7, 38020–38034. [Google Scholar] [CrossRef]
- Giannella, C.; Han, J.; Pei, J.; Yan, X.; Yu, P. Mining Frequent Patterns in Data Streams at Multiple Time Granularities. 2003.
- Guo, J.; Zhang, P.; Tan, J.; Guo, L. Mining Frequent Patterns across Multiple Data Streams. In Proceedings of the Proceedings of the 20th ACM International Conference on Information and Knowledge Management; Association for Computing Machinery: New York, NY, USA, 2011; pp. 2325–2328. [Google Scholar]
- Zarrouk, M.; Gouider, M. Frequent Patterns Mining in Time-Sensitive Data Stream. International Journal of Computer Science Issues 2012, 9. [Google Scholar]
- Zhong, H.; Wang, M.; Zhang, X. Unsupervised Embedding Learning for Large-Scale Heterogeneous Networks Based on Metapath Graph Sampling. Entropy 2023, 25. [Google Scholar] [CrossRef]
- Maneth, S.; Peternek, F. Grammar-Based Graph Compression. Inf Syst 2018, 76, 19–45. [Google Scholar] [CrossRef]
- Dhulipala, L.; Kabiljo, I.; Karrer, B.; Ottaviano, G.; Pupyrev, S.; Shalita, A. Compressing Graphs and Indexes with Recursive Graph Bisection. In Proceedings of the Proceedings of the 22nd ACM SIGKDD International Conference on Knowledge Discovery and Data Mining; Association for Computing Machinery: New York, NY, USA, 2016; pp. 1535–1544. [Google Scholar]
- Lim, Y.; Kang, U.; Faloutsos, C. SlashBurn: Graph Compression and Mining beyond Caveman Communities. IEEE Trans Knowl Data Eng 2014, 26, 3077–3089. [Google Scholar] [CrossRef]
- Jalil, Z.; Nasir, M.; Alazab, M.; Nasir, J.; Amjad, T.; Alqammaz, A. Grapharizer: A Graph-Based Technique for Extractive Multi-Document Summarization. Electronics (Basel) 2023, 12. [Google Scholar] [CrossRef]
- Rossi, R.; Zhou, R. GraphZIP: A Clique-Based Sparse Graph Compression Method. J Big Data 2018, 5. [Google Scholar] [CrossRef]
- Cordella, L.P.; Foggia, P.; Sansone, C.; Vento, M. A (Sub)Graph Isomorphism Algorithm for Matching Large Graphs. IEEE Trans Pattern Anal Mach Intell 2004, 26, 1367–1372. [Google Scholar] [CrossRef]
- Fournier-Viger, P.; Gan, W.; Wu, Y.; Nouioua, M.; Song, W.; Truong, T.; Duong, H. Pattern Mining: Current Challenges and Opportunities. In Proceedings of the Database Systems for Advanced Applications. DASFAA 2022 International Workshops: BDMS, BDQM, GDMA, IWBT, MAQTDS, and PMBD, Virtual Event, 2022, Proceedings; Springer, 2022, April 11–14; pp. 34–49.
- Shabani, N.; Beheshti, A.; Farhood, H.; Bower, M.; Garrett, M.; Alinejad-Rokny, H. A Rule-Based Approach for Mining Creative Thinking Patterns from Big Educational Data. AppliedMath 2023, 3, 243–267. [Google Scholar] [CrossRef]
- Jamshidi, K.; Mahadasa, R.; Vora, K. Peregrine: A Pattern-Aware Graph Mining System. In Proceedings of the Proceedings of the Fifteenth European Conference on Computer Systems; Association for Computing Machinery: New York, NY, USA; 2020. [Google Scholar]
- Ketkar, N.S.; Holder, L.B.; Cook, D.J. Subdue: Compression-Based Frequent Pattern Discovery in Graph Data. In Proceedings of the Proceedings of the 1st International Workshop on Open Source Data Mining: Frequent Pattern Mining Implementations; Association for Computing Machinery: New York, NY, USA, 2005; pp. 71–76. [Google Scholar]
- Elseidy, M.; Abdelhamid, E.; Skiadopoulos, S.; Kalnis, P. GraMi: Frequent Subgraph and Pattern Mining in a Single Large Graph. Proc. VLDB Endow. 2014, 7, 517–528. [Google Scholar] [CrossRef]
- Bok, K.; Han, J.; Lim, J.; Yoo, J. Provenance Compression Scheme Based on Graph Patterns for Large RDF Documents. J Supercomput 2019, 76, 6376–6398. [Google Scholar] [CrossRef]
- Bok, K.; Jeong, J.; Choi, D.; Yoo, J. Detecting Incremental Frequent Subgraph Patterns in IoT Environments. Sensors 2018, 18. [Google Scholar] [CrossRef]
- Bok, K.; Kim, G.; Lim, J.; Yoo, J. Historical Graph Management in Dynamic Environments. Electronics (Basel) 2020, 9. [Google Scholar] [CrossRef]
- Han, J.; Pei, J.; Yin, Y. Mining Frequent Patterns without Candidate Generation. In Proceedings of the Proceedings of the 2000 ACM SIGMOD International Conference on Management of Data; Association for Computing Machinery: New York, NY, USA, 2000; pp. 1–12. [Google Scholar]
- Borgelt, C. An Implementation of the FP-Growth Algorithm. Proceedings of the 1st International Workshop on Open Source Data Mining: Frequent Pattern Mining Implementations 2010. [CrossRef]
|
Disclaimer/Publisher’s Note: The statements, opinions and data contained in all publications are solely those of the individual author(s) and contributor(s) and not of MDPI and/or the editor(s). MDPI and/or the editor(s) disclaim responsibility for any injury to people or property resulting from any ideas, methods, instructions or products referred to in the content. |
© 2024 by the authors. Licensee MDPI, Basel, Switzerland. This article is an open access article distributed under the terms and conditions of the Creative Commons Attribution (CC BY) license (http://creativecommons.org/licenses/by/4.0/).
