Preprint
Article

Surface Characteristics of Ti6Al7Nb Alloy after Sandblasting and Anodic Oxidation Process for Biomedical Applications

Altmetrics

Downloads

70

Views

41

Comments

0

Submitted:

19 April 2024

Posted:

22 April 2024

You are already at the latest version

Alerts
Abstract
Titanium alloys belong to the metal biomaterials that are one of the most widely used in medicine. In recent years, in order to reduce the use of vanadium, Ti6Al4V alloy is increasingly replaced by Ti6Al7Nb alloy. In addition, to ensure the best possible biocompatibility, its surface is subjected to appropriate modifications, for example, anodic oxidation. Despite the extensive use of anodic oxidation of titanium implants in orthopedics, there are few works focused on a detailed analysis of the chemical composition of the surface layers. In addition, the effect of treatments before anodic oxidation on the properties of the produced layer has not been analyzed. Thus, the purpose of this study was to analyze in detail the chemical composition of the passive layer of Ti6Al7Nb alloy obtained by anodic oxidation preceded by sandblasting. Moreover, the physicochemical properties of the analyzed surface affecting biocompatibility were determined. For this purpose, surface observation, wettability and roughness tests, microhardness tests, electrochemical tests and phase composition analysis were carried out. In addition, the preclinical suitability, of the surface modified in this way, was evaluated by cytotoxicity tests.
Keywords: 
Subject: Chemistry and Materials Science  -   Biomaterials

1. Introduction

The exceptional properties of titanium alloys, which include high corrosion resistance in the tissue environment, biocompatibility, high relative strength Rm/ρ, as well as a low value of Young's modulus, the closest of all metallic materials to Young’s modulus of bone, determine their usefulness in implant applications, particularly in orthopedics [1]. The most commonly used titanium alloys in medicine are Ti6Al4V and Ti6Al7Nb.
Titanium alloys have the ability to self-passivation, which is responsible for their high corrosion resistance. It results in the spontaneous formation of a passive oxide layer with a thickness of a few nanometers, which is characterized by low electronic conductivity and consists of amorphous titanium dioxide (TiO2), which forms its outer part, and non-stoichiometric TiO oxides2-x in the inner part [1-3]. In addition, it consists of a small volume of oxides of aluminum and vanadium or niobium, depending on the chemical composition of the alloy [4]. Their presence in the surface layer can cause adverse effects in the body, such as vanadium-induced cytotoxic reactions or bone softening, which is affected by aluminum [5-6]. To eliminate the adverse effects of vanadium, the vanadium-free Ti6Al7Nb alloy is increasingly being used.
The undesirable effects of the contribution of aluminum ions to the passive layer are one of the reasons for the widely developing field of surface modification of alloys to improve their biocompatibility, as well as their physicochemical properties. The surface treatment technologies used can be most broadly divided into mechanical, chemical and physical methods [7-9]. Depending on the surface modification method, the following can be improved: mechanical contact between the implant and bone tissue, abrasion resistance, corrosion resistance, biocompatibility and bioactivity [8]. Ultimately, this can contribute to the success of the treatment process. Considering the desired way in which the surface of the material interacts with the bone tissue, two distinct goals of the modifications can be distinguished: improving osteoconductivity or improving osteoinductivity [10-11].
The purpose of using the mechanical method of modification is to obtain a surface with the desired topography, which determines the adhesive properties of the layer to the substrate [8]. The required surface topography is determined primarily by the intended use of the product. For example, in the case of implants used in orthopedics, in order to allow bone tissue adhesion, it is necessary to ensure adequate surface roughness [12], conversely for implants for blood contact, where the surface should be as smooth as possible [13]. This goal can be achieved by grinding, polishing or sandblasting (abrasive blasting) [7,14]. One of the most popular methods used in biomedical engineering is sandblasting with silicon carbide or oxide particles, aluminum oxide, biphasic calcium phosphates (BCPs), and hydroxyapatite particles with calcium phosphates [8,15]. Sandblasting the surface of titanium alloys causes a change in the chemical composition of the surface layer, an increase in surface roughness and a strengthening of the surface, which affects a decrease in resistance to pitting corrosion and an increase in the amount of ions penetrating from the surface [16]. Chemical methods of surface modification are based on reactions occurring at the interface between titanium alloys and the solution [15]. They lead to improved biocompatibility, bioactivity and osteoconductivity, as well as corrosion resistance, and may remove contaminants on the surface. Depending on the medium used, treatment with acids, alkalis or hydrogen peroxide can be distinguished [8].
One of the most popular methods of surface modification is anodic oxidation. Such a process involves the formation of an oxide layer on the surface of the anode, which is either a metal or its alloy. The reactions occurring between the anode and cathode are initiated by the flow of current from an external power source [17]. Anodization can be carried out in three ways: under potentiostatic conditions, under galvanostatic conditions, and by a combined method [18].
Obtaining a passive layer with controlled properties is possible by controlling the process parameters, which include the chemical composition of the electrolyte, pH of the electrolyte, temperature, current voltage, current density, hydrodynamic conditions and process duration [18]. The chemical composition of the bath used determines the composition of the resulting passive layer, which allows the bioactivity to be improved, or vice versa, depending on the components selected [2]. Its thickness increases faster in acidic than in basic electrolytes [19]. After the anodic oxidation process, there is an improvement in pitting corrosion resistance. However, the fatigue strength of the material decreases [2]. The value of the voltage used during the process affects the thickness of the layer, as well as its morphology. To obtain a homogeneous layer that inherits the substrate topography, the process should be carried out at medium voltage values. In this voltage range, a color effect is observed, which depends on the thickness of the oxide layer obtained. The use of a voltage lower than 40 V leads to a layer of nanotubes, which is favorable for good adhesion of hydroxyapatite particles to the substrate. This results in a much more strongly bonded and stable layer, which can extend the life of the implant. Spark anodic oxidation and plasma electrolytic oxidation methods are also promising. When conducting the plasma process, it is possible to use a current of more than 150 V, while in the case of spark oxidation, a pulsed voltage in the range of 200 - 500 V is used. As a result of both processes, porous layers are obtained with pore sizes that vary depending on the conditions of the processes [2,8,20].
Despite the extensive use of anodic oxidation of titanium implants in orthopedics, there are few works focused on a detailed analysis of the chemical composition of the surface layers. In addition, the effect of treatments before anodic oxidation on the properties of the produced layer has not been analyzed. Thus, the purpose of this study was to analyze in detail the chemical composition of the passive layer of Ti6Al7Nb alloy obtained by anodic oxidation preceded by sandblasting. Moreover, the physicochemical properties of the analyzed surface affecting biocompatibility were determined. For this purpose, surface observation, wettability and roughness tests, microhardness tests, electrochemical tests and phase composition analysis were carried out. In addition, the preclinical suitability, of the surface modified in this way, was evaluated by cytotoxicity tests.

2. Materials and Methods

2.1. Material

Ti6Al7Nb alloy specimens taken from a 25 mm diameter rod with chemical composition, structure and mechanical properties in accordance with the recommendations of ISO 5832-11 were used for the test. The surface of the samples was subjected to the following modifications: grinding, sandblasting and anodic oxidation. Grinding was carried out using abrasive papers with gradations of 180, 300 and 500, respectively. Sandblasting was carried out using glass balls with diameters from 70 to 110 μm for 2 min. The final step involved anodic oxidation in a bath based on sulfuric and phosphoric acid at a voltage 97 V for 2 min.

2.2. Methods

2.2.1. Surface Observations

The morphology of the samples was analyzed using light microscopy and scanning electron microscopy. Respectively, a digital microscope Leica DVM6 with Leica LasX software and a scanning electron microscope Tescan Vega 4 were used. SEM observations were carried out under high vacuum conditions and electron beams of 10 and 15 keV energy.

2.2.2. Surface Roughness

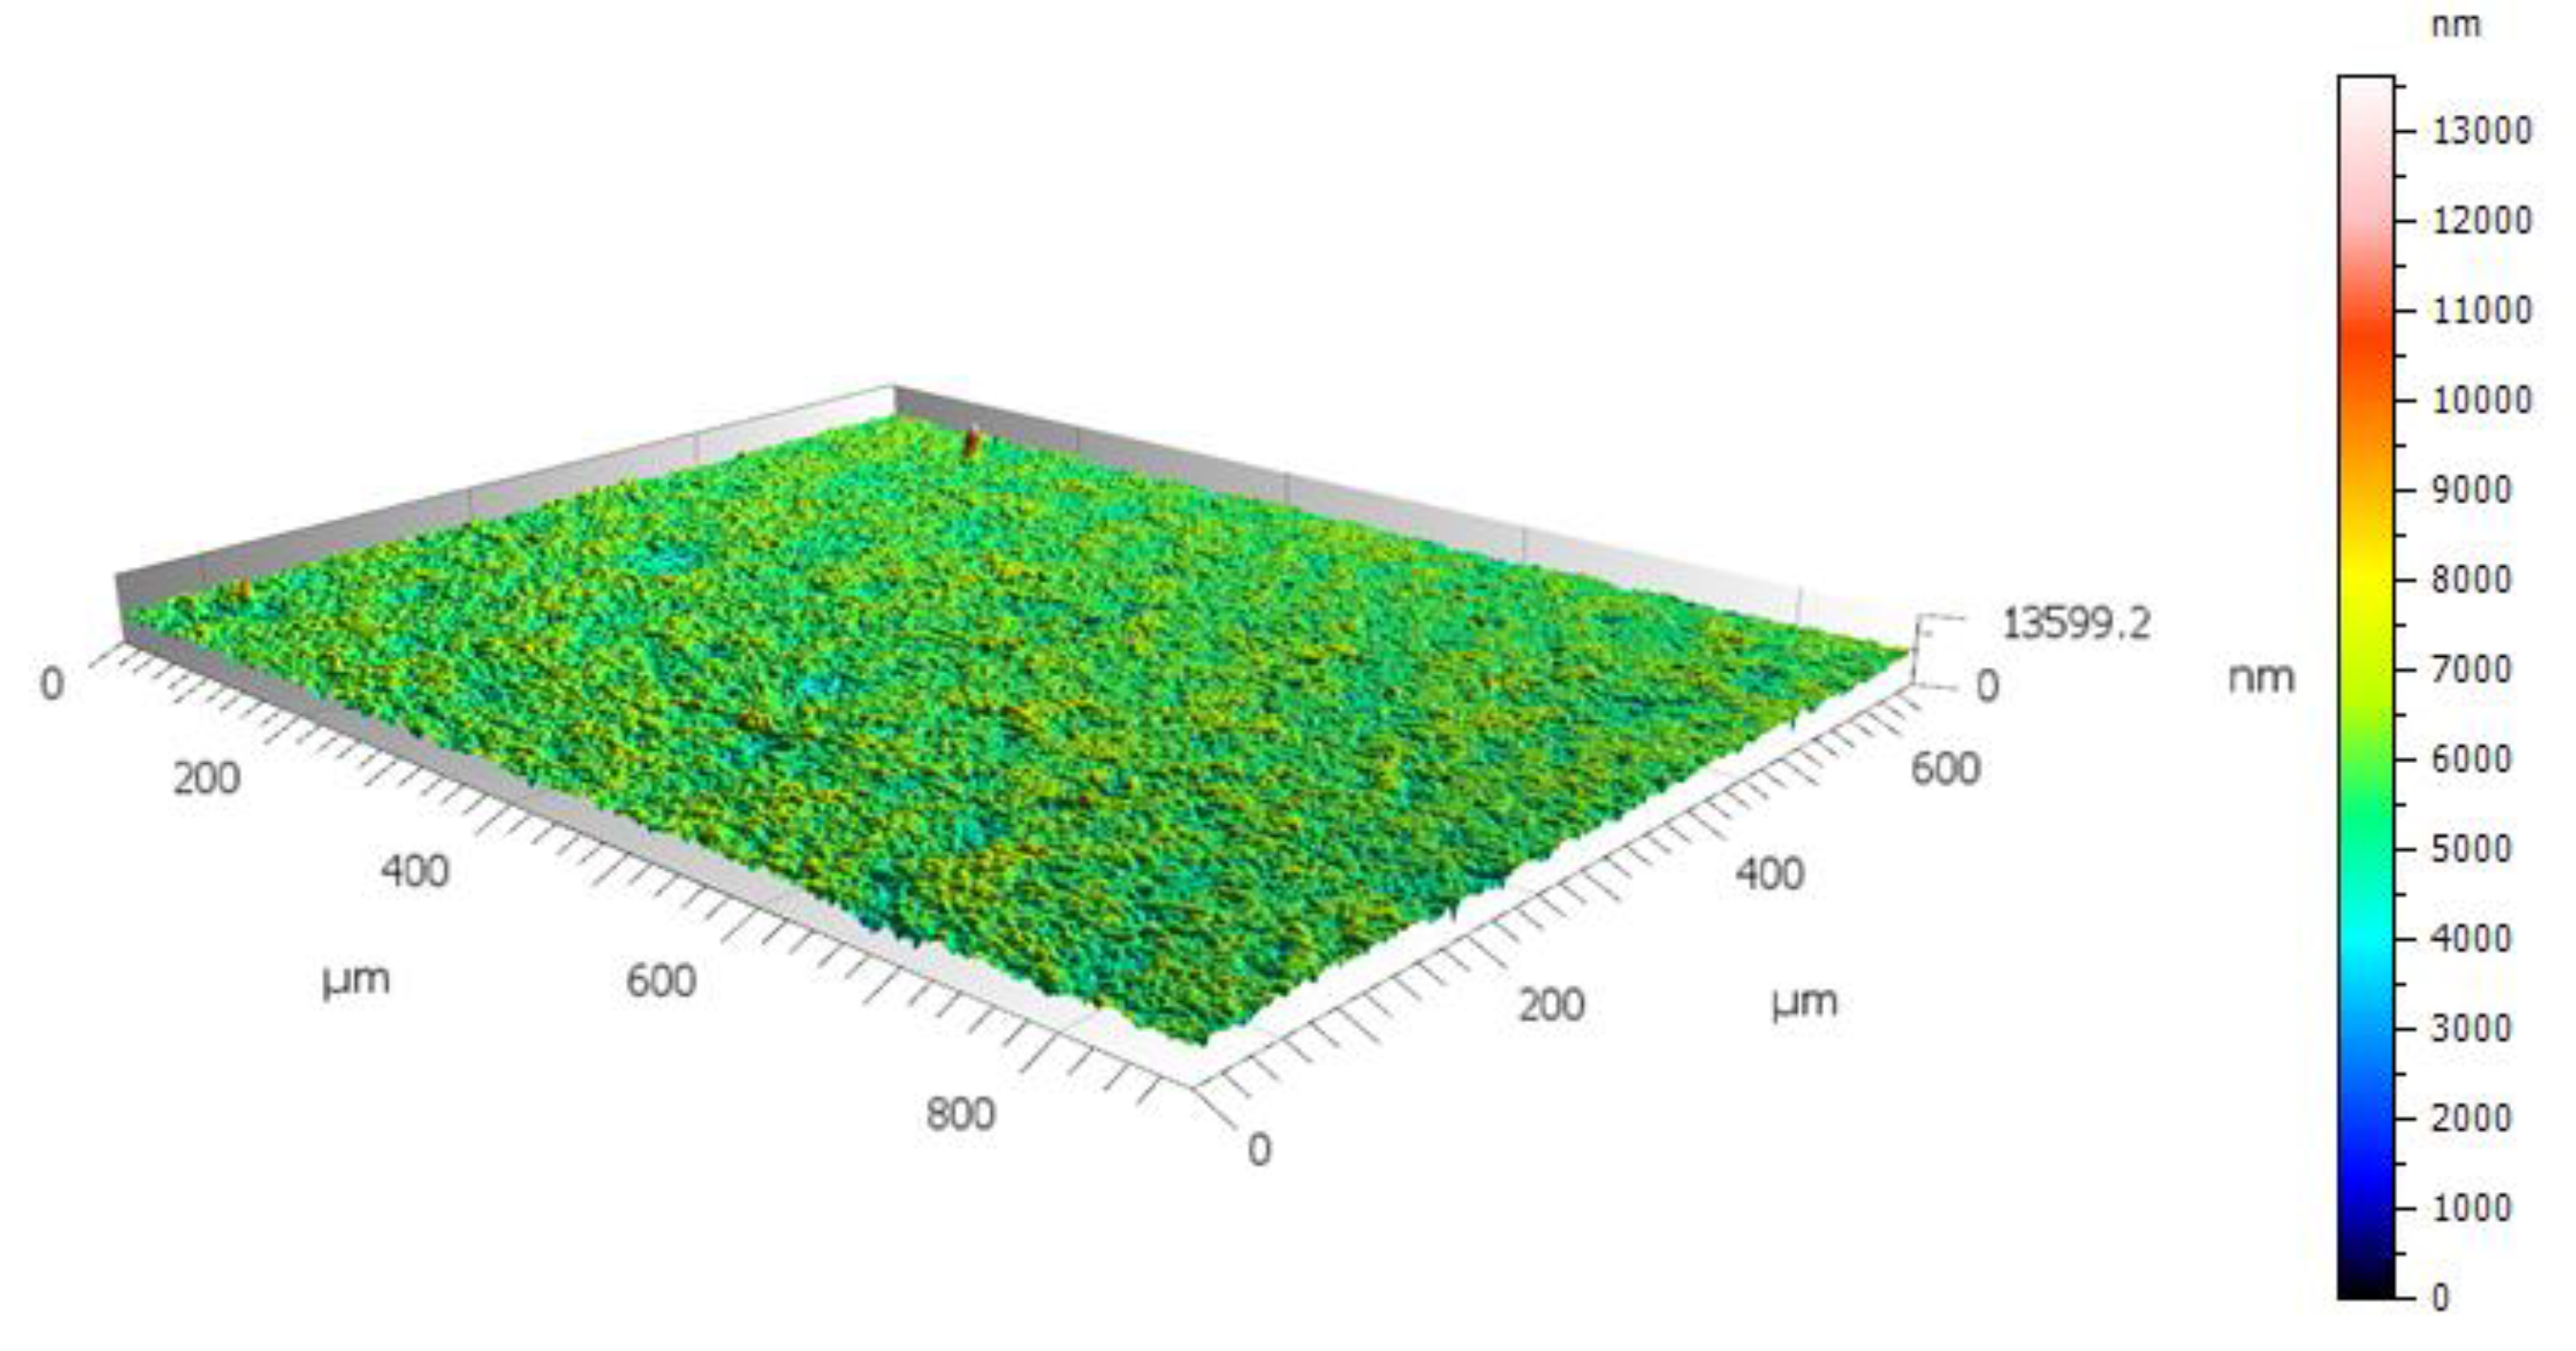
The surface topography studies were carried out with a 3D Surface Metrology Microscope Leica DCM8 using the confocal differentiation method. Green light and a 20x magnification were used. The analyzed area was 880 μm x 660 μm in each measurement. The obtained results were analyzed using Leica Map Premium software. The study was conducted for five samples.

2.2.3. Wettability Test

The wettability of the surface was determined based on the contact angle. Contact angle measurements were performed with Biolin Scientific Attension Theta Flex optical tensiometer and analyzed using OneAttension software. The tests were carried out using distilled water with a droplet size of 1.5 mm3. The measurement started 15 s after the drop deposition and lasted 60 s with a sampling rate of 1 Hz. Five samples were examined.

2.2.4. Microhardness Studies

To determine microhardness, the Oliver&Pharr method was applied with the use of a Vickers indenter. By conducting microhardness tests as a function of indenter penetration depth, the indentation profile was determined. Hardness was measured at penetration depths ranging from 500 to 7500 nm. The value of the loading force and penetration depth of the indenter blade were recorded continuously throughout the cycle (loading and unloading). The speed of load and unload build-up was 3000nm/min, and the time of holding the sample under maximum pressure was 15s. Five measurements were made for each penetration depth, which was carried out on an open platform equipped with a micro-combi tester from CSM. The population of samples used in the study was five.

2.2.5. X-ray Diffraction Studies

XRD studies were performed using the D8 Advance diffractometer (Bruker) with Cu-Kα cathode (λ=1.54 Å) operating at 40 kV voltage and 40 mA current. The scan rate was 0.60°/min with scanning step 0.02° in a range of 5° to 90° 2Θ. Identification of fitted phases was performed using DIFFRAC.EVA program with the use of Crystallography Open Database (COD) and International Centre for Diffraction Data database (ICDD PDF#2), while exact lattice parameters and atomic coordinates of fitted phase were calculated using Rietveld refinement in TOPAS 6 program, based on Williamson-Hall theory. The pseudo-Voigt function was used in the description of diffraction line profiles at the Rietveld refinement. The Rwp (weighted-pattern factor), Rexp (expected R factor) and GOF (goodness-of-fit) parameters were used as numerical criteria for the quality of the fit calculated to experimental diffraction data.

2.2.6. Electrochemical Investigation

Pitting corrosion resistance tests were carried out by potentiodynamic method in PBS solution (NaCl 0,14 M, KCl 0,0027 M, PO43- 0,01 M per 1 dm3), at 37⁰C. The tests were carried out using an Autolab PGSTAT 302N (Metrohm) potentiostat and Nova 2.1 software. The reference electrode was a silver chloride electrode (Ag|AgCl in 3M KCl) and the counter electrode was a platinum wire. In the first stage, the open circuit potential (Eocp) was measured for 1h. Potentiodynamic curves were recorded from the initial potential Einit = Eocp-100mV. The scan rate was 3 mV/s. The direction of polarization was changed when the anodic current density reached 1 mA/cm2 or a potential of 2 V. From the obtained curves, the value of the corrosion potential Ecorr and the polarization resistance Rp were determined using the Stern method. The population of samples was five.

2.2.7. X-ray Photoelectron Spectroscopy Studies

The XPS investigations were carried out using a Prevac spectrometer equipped with an Al Kα monochromatized X-ray source of 1486.6 eV excitation energy and a dual-beam charge neutralizer. For calibration of the analyzer binding energy (BE) scale, the C 1s major component was chosen and attributed to BE of 284.6 eV. Sample etching by Ar+ - ion beam with constant sputtering rate allowed to obtain chemical depth profile.
The XPS data were quantified utilizing CASA XPS software. Mostly, peak fitting was conducted using the curve of Gaussian (70%)-Lorentzian (30%) product (GL) after Shirley-type background subtraction. For metallic components, the asymmetry impact was included in the form of the LA function where the spread of the Lorentzian tail on component one side was adjusted. The uncertainty of the specified XPS component position was estimated at 0.07 eV.

2.2.8. Cytotoxicity Studies

The cytotoxicity test was performed in accordance with PN-EN ISO 10993-5 and PN-EN ISO 10993-12, using the SaOS-2 cell line model (Human Osteosarcoma cell line, CLS, Cat. No. 300331). An MTS test was performed to determine the amount of formazan in the cells, which only living cells have the ability to produce. Extraction from the samples was carried out for 72 hours in a culture medium containing bovine fetal serum. A ratio of 1 cm3 of culture medium per 3 cm2 of biomaterial was adopted. Sodium dodecyl sulfate was used as a positive control, the negative control was culture medium with bovine fetal serum. In addition, a test was performed using the Polymerase Chain Reaction (PCR) method to identify possible infection of the cell line with mycoplasma and to optimize the number of cells used in the study.
Cell survival in the test and control groups was determined by measuring the amount of formazan formed during a 72-hour incubation with titanium alloy extracts, sodium dodecyl sulfate, and fetal bovine serum, respectively. The amount of formazan was determined by absorbance studies at 490 nm using a microplate reader, Multi-Mode Microplate Reader (BioTek). In addition, a microscopic evaluation of the effect of anodically oxidized titanium extracts on the SaOS-2 cell line was carried out. Immunofluorescence staining was used to visualize the cytoskeleton. Hoechst staining was used to image the cell nucleus. The evaluation was performed using a Zeiss Axio Observer.D1 fluorescence microscope.

3. Results

3.1. Surface Observations

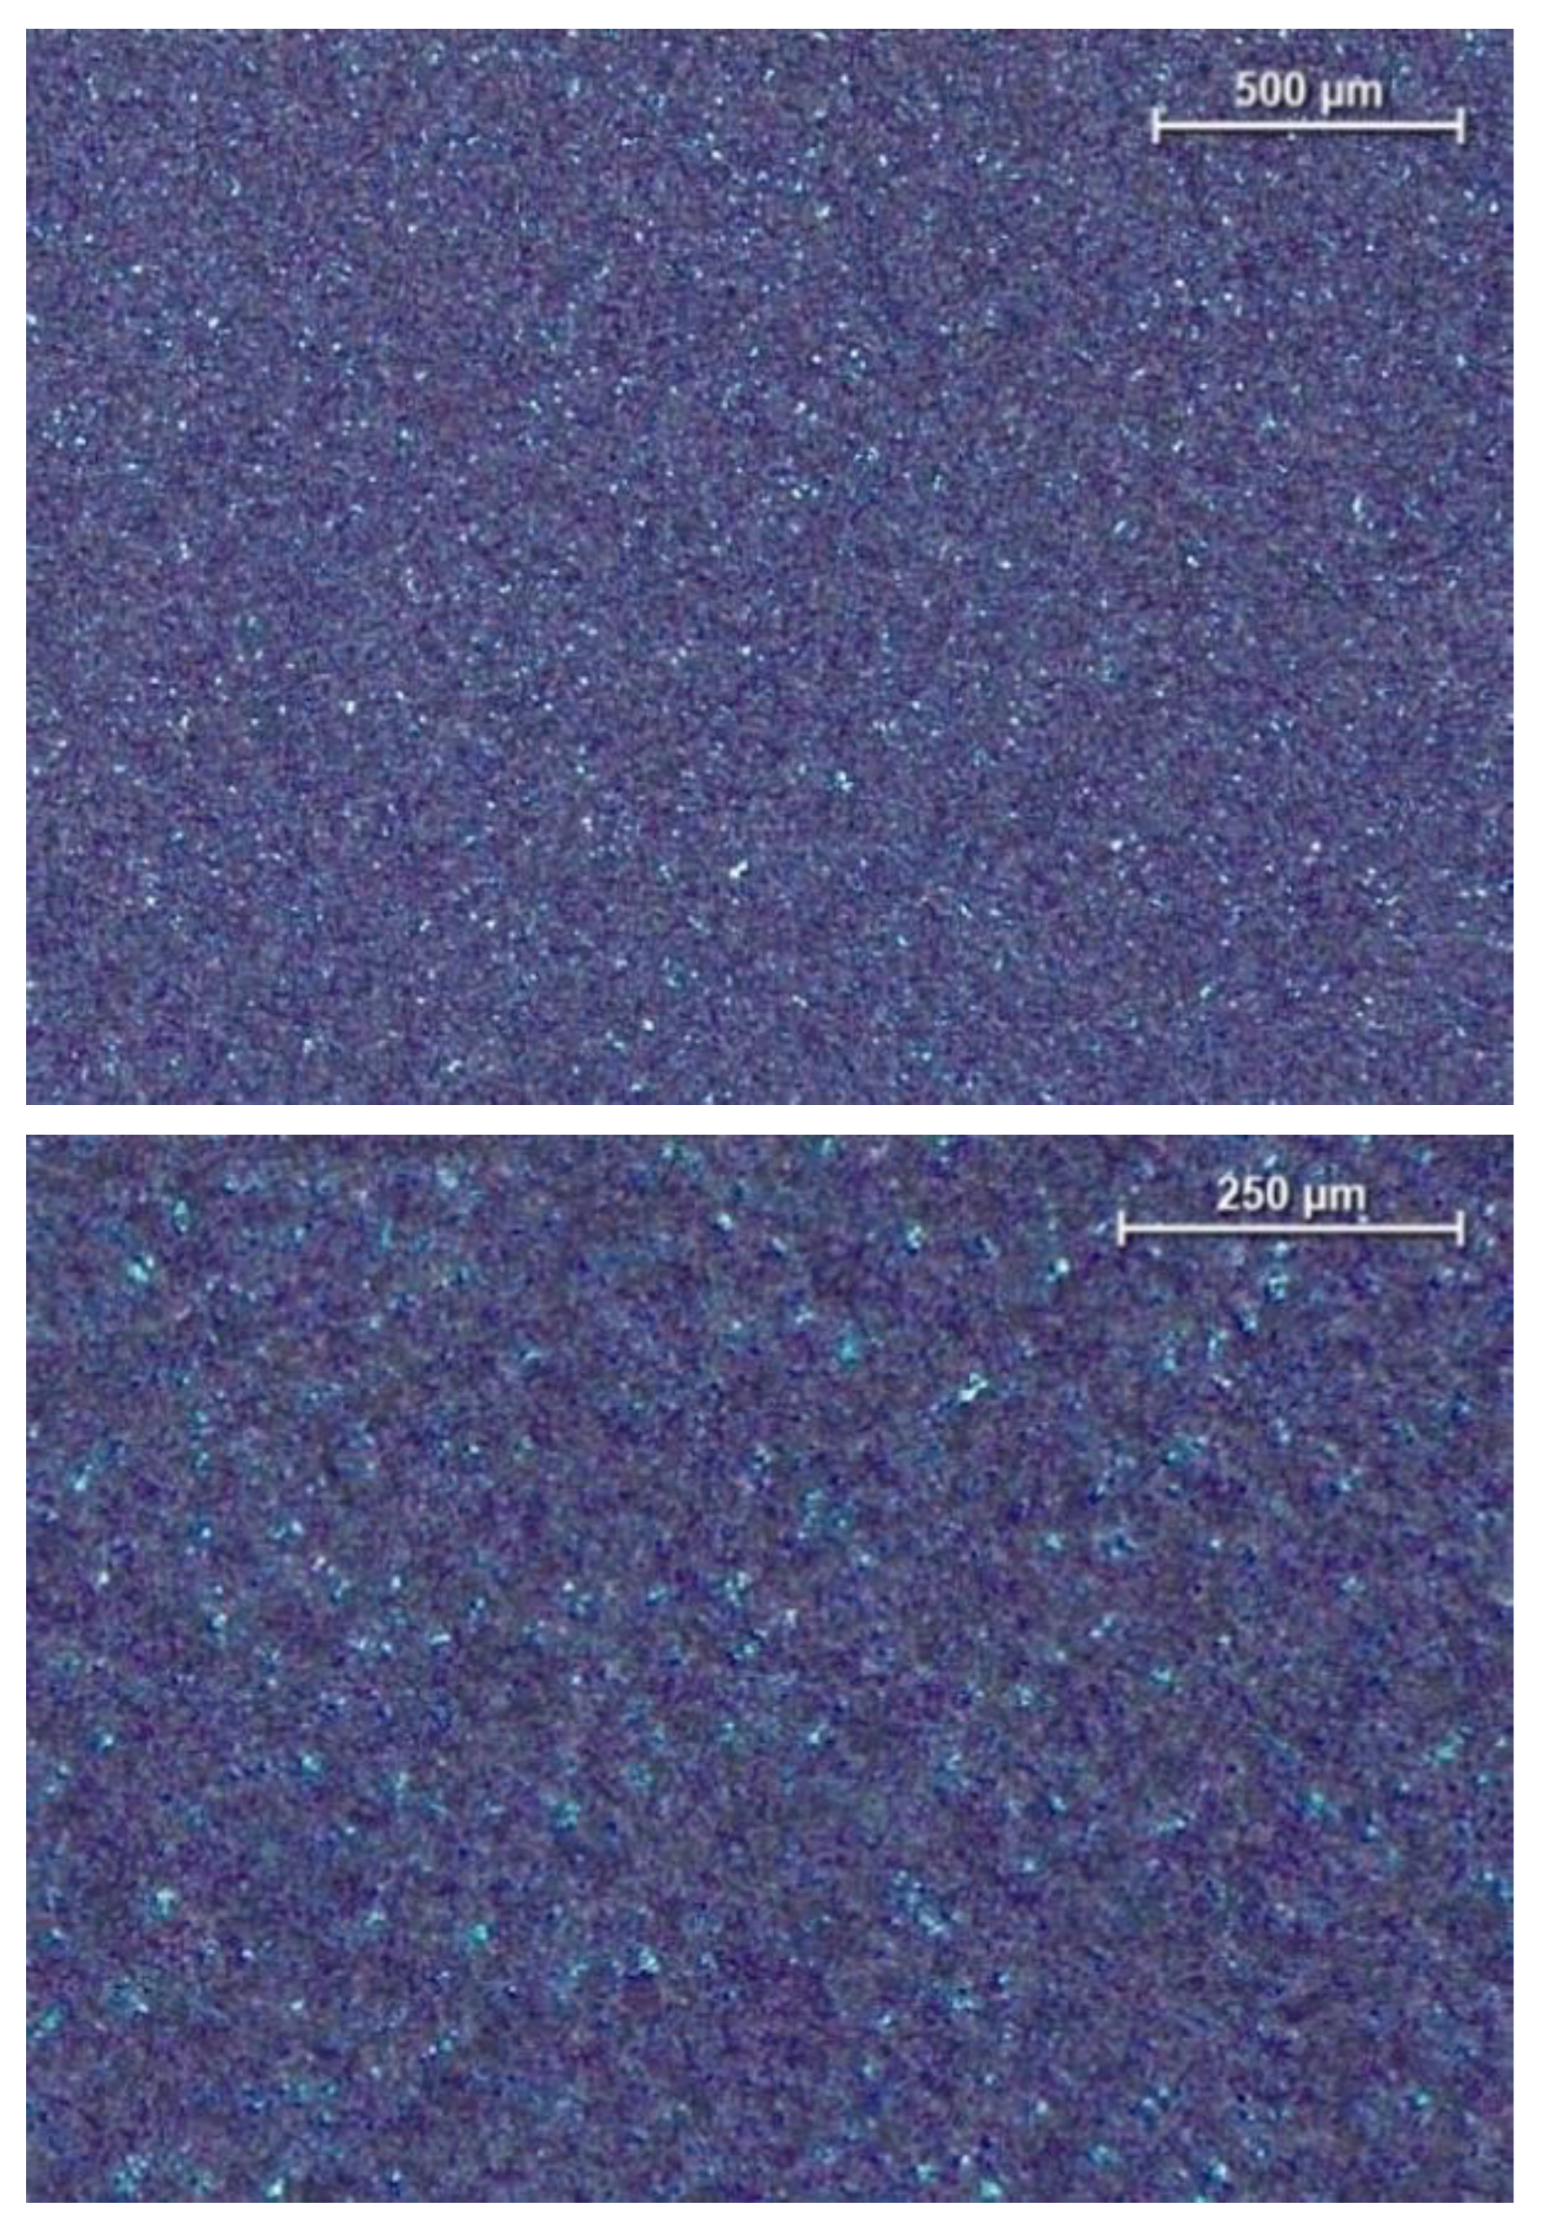
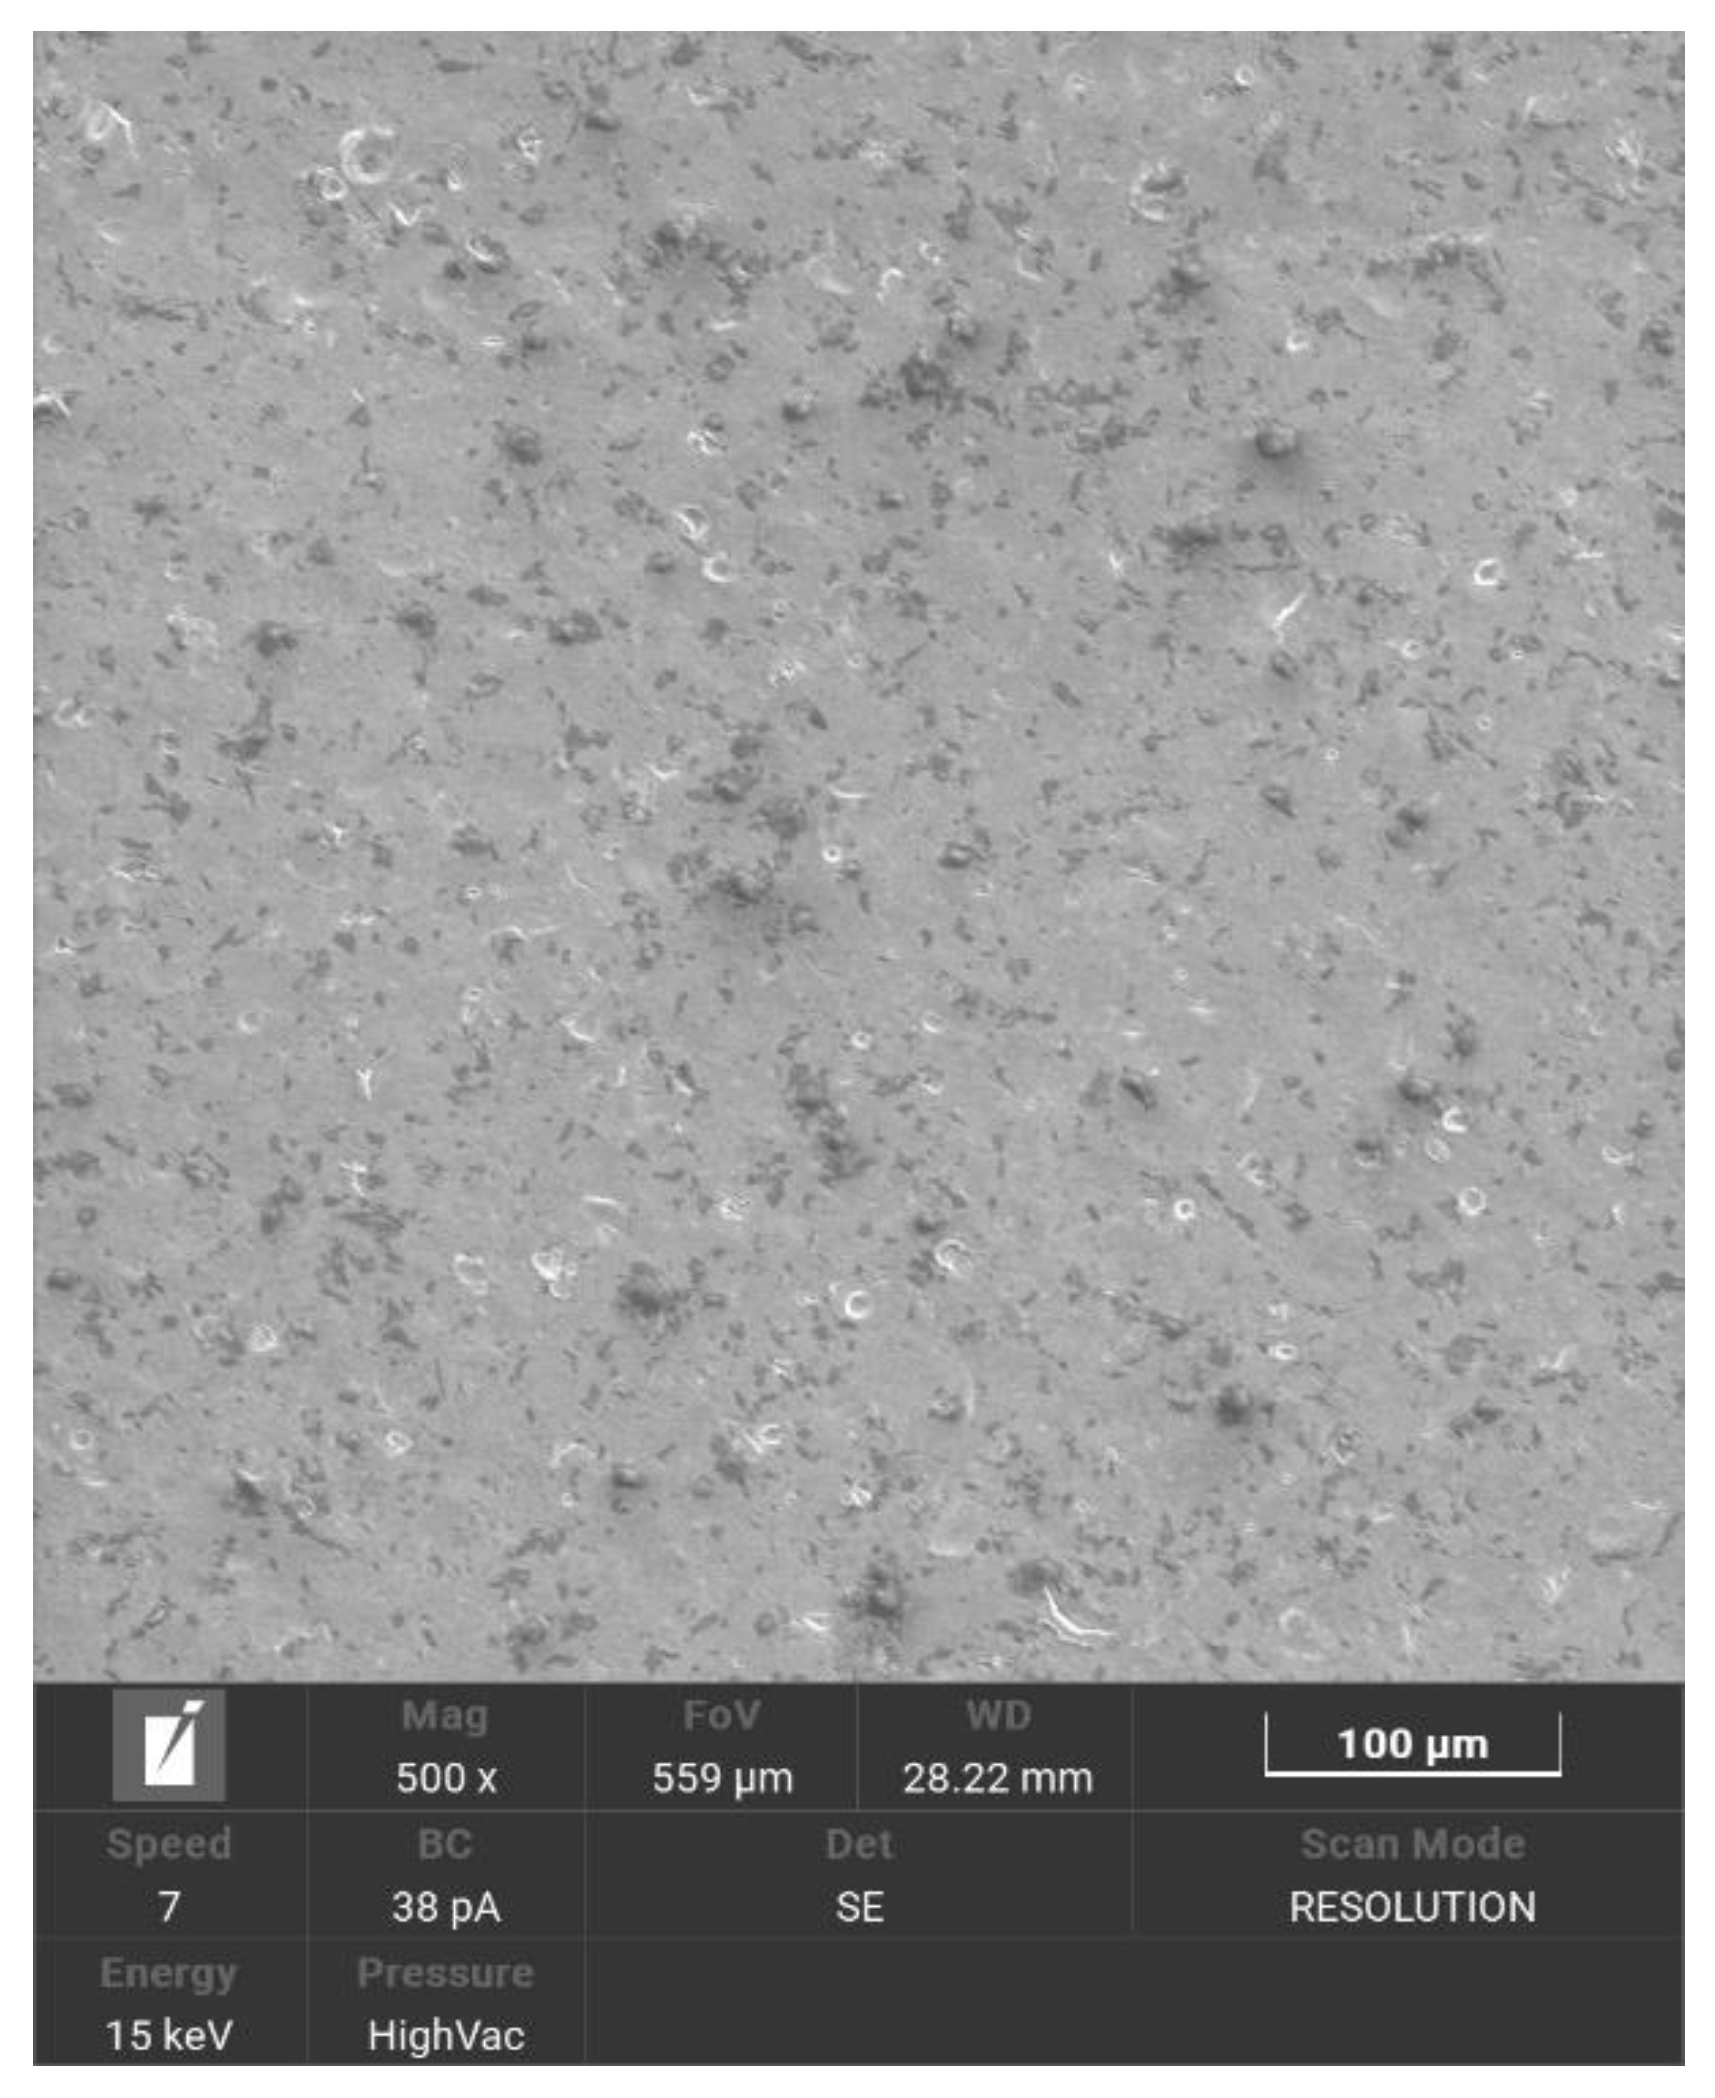
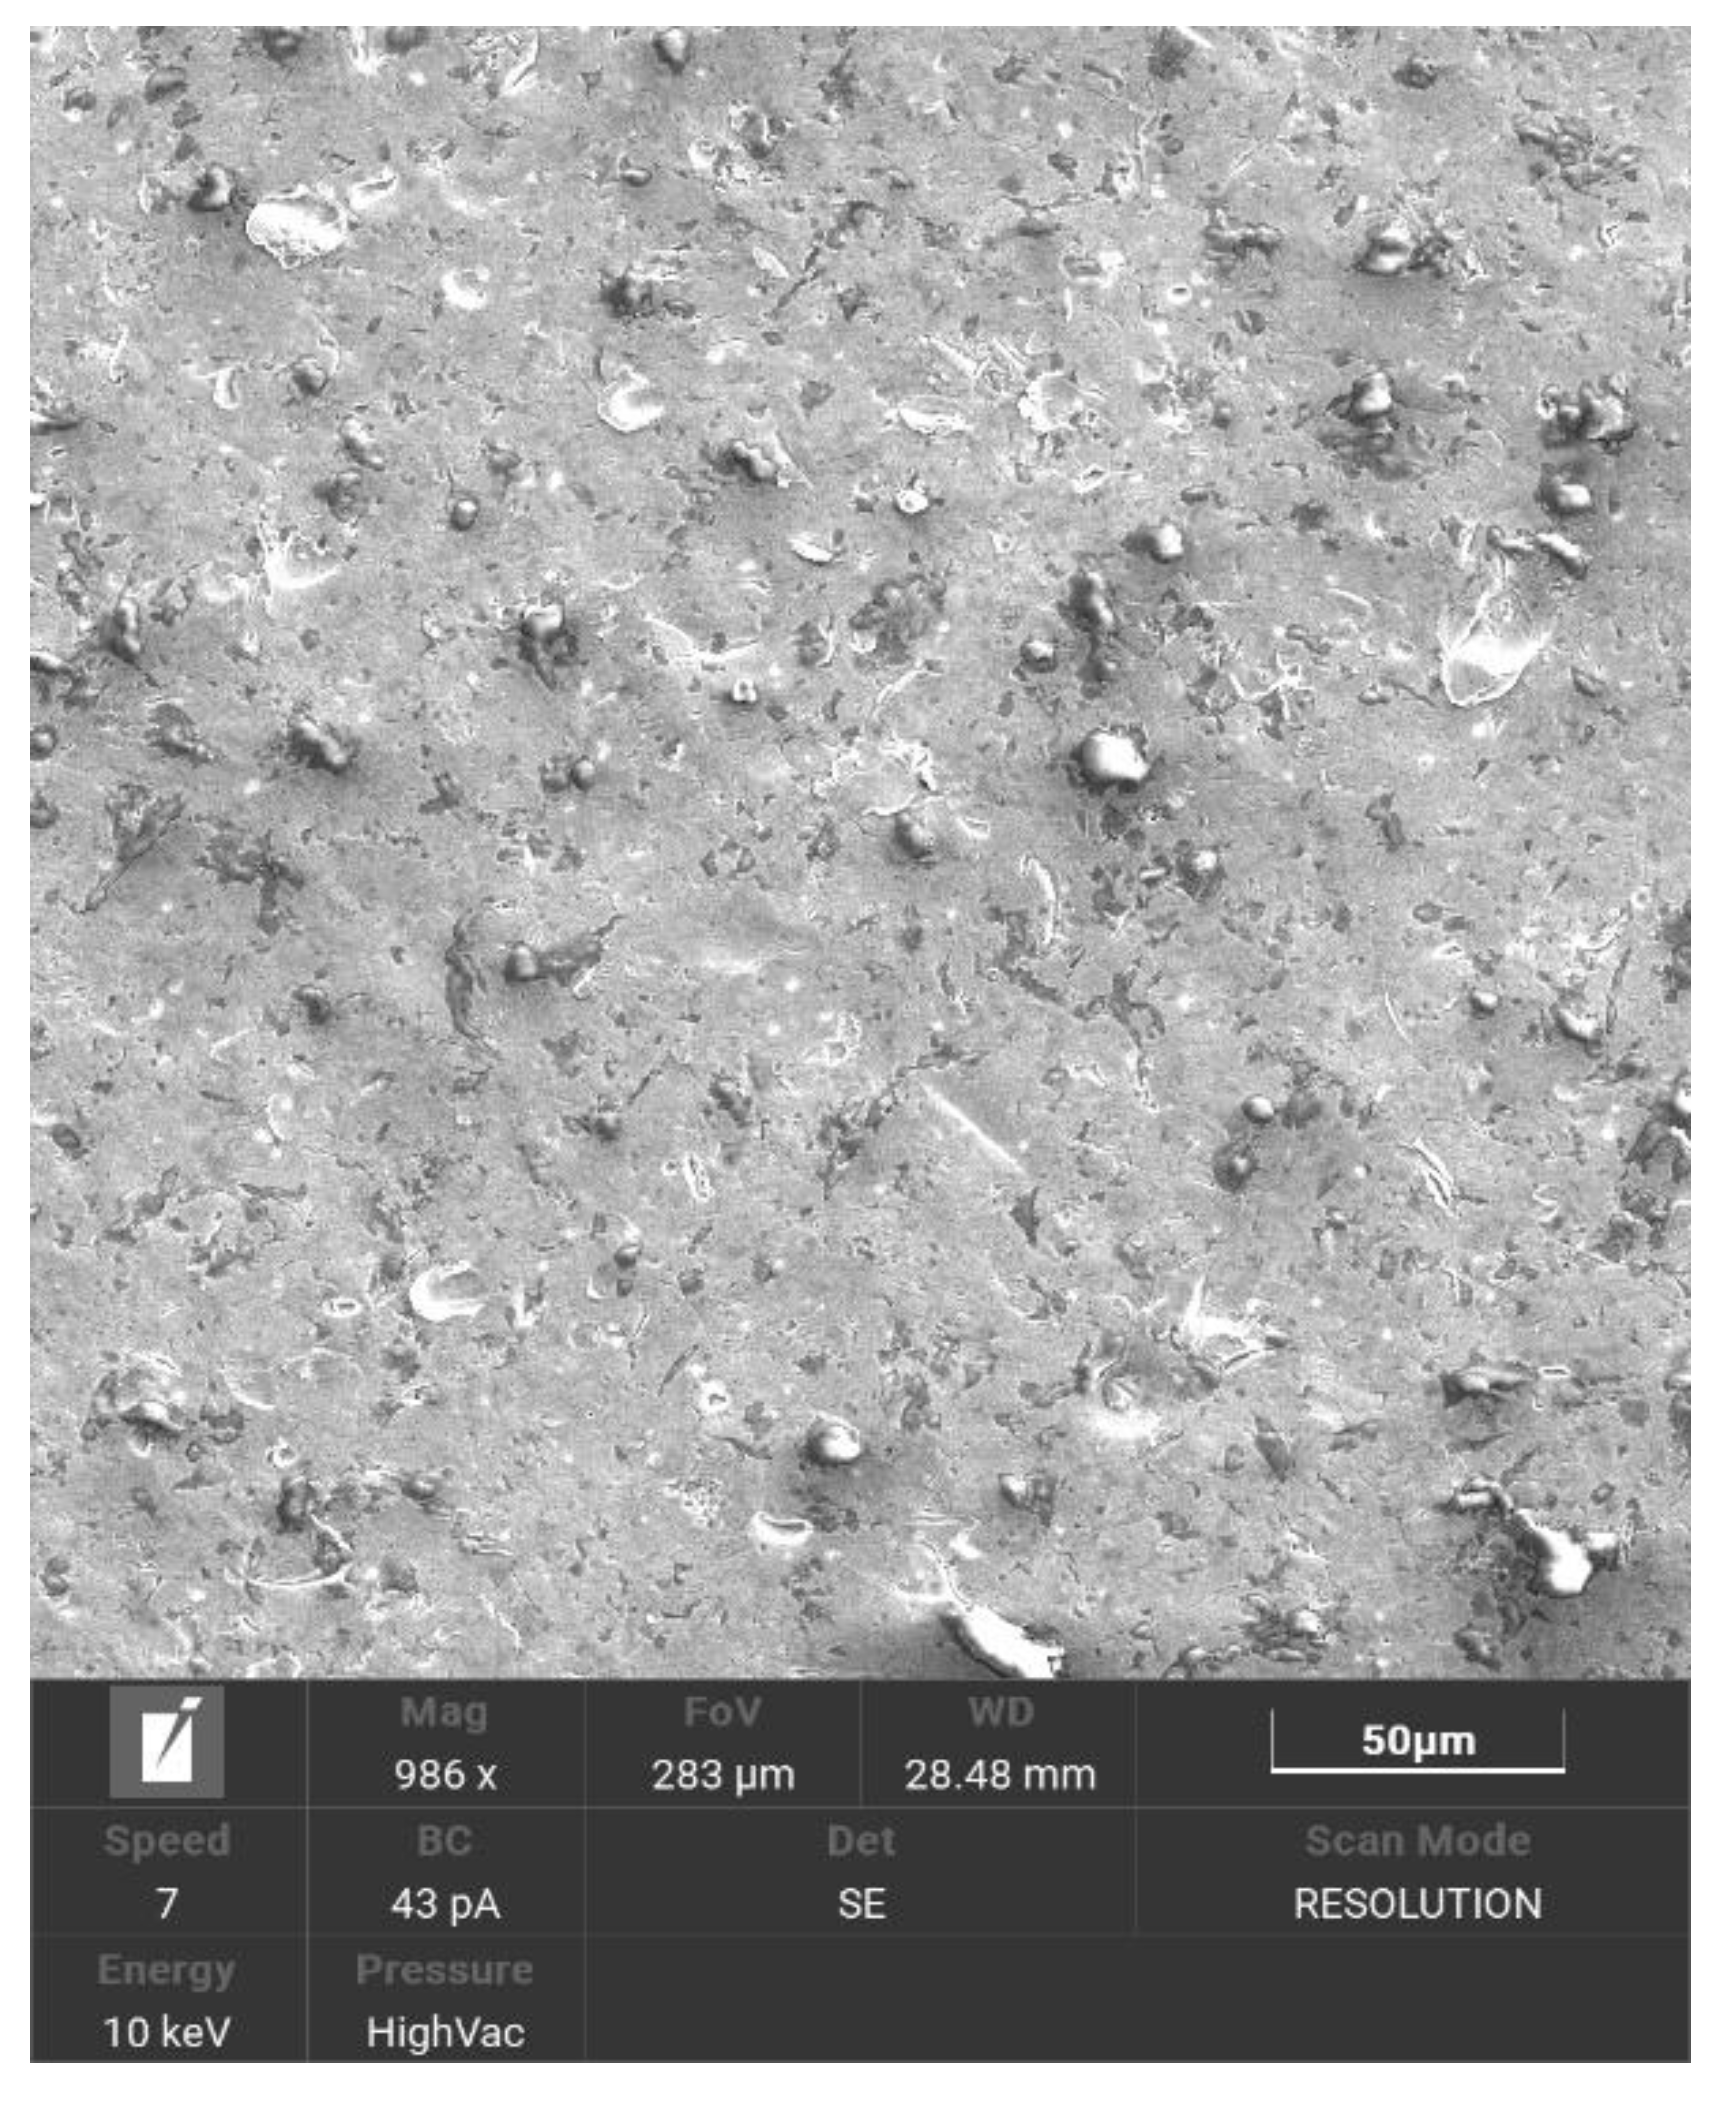
The observed surface was characterized by homogeneity resulting from the sandblasting process and a color effect after anodic oxidation (Figure 1 and Figure 2).

3.2. Surface roughness

The analysis of the obtained results made it possible to determine the surface roughness parameters as Sa = 0.396(84) μm and Ra = 0.343(97) μm. Examples of surface topography image and surface profile are shown in Figure 3 and Figure 4, respectively.

3.3. Wettability Test

The examined samples are characterized by a hydrophilic surface. The average value of the contact angle was determined as Θ = 54.7(19)⁰. An example of a drop on the surface of the sample is shown in Figure 5.

3.4. Microhardness Studies

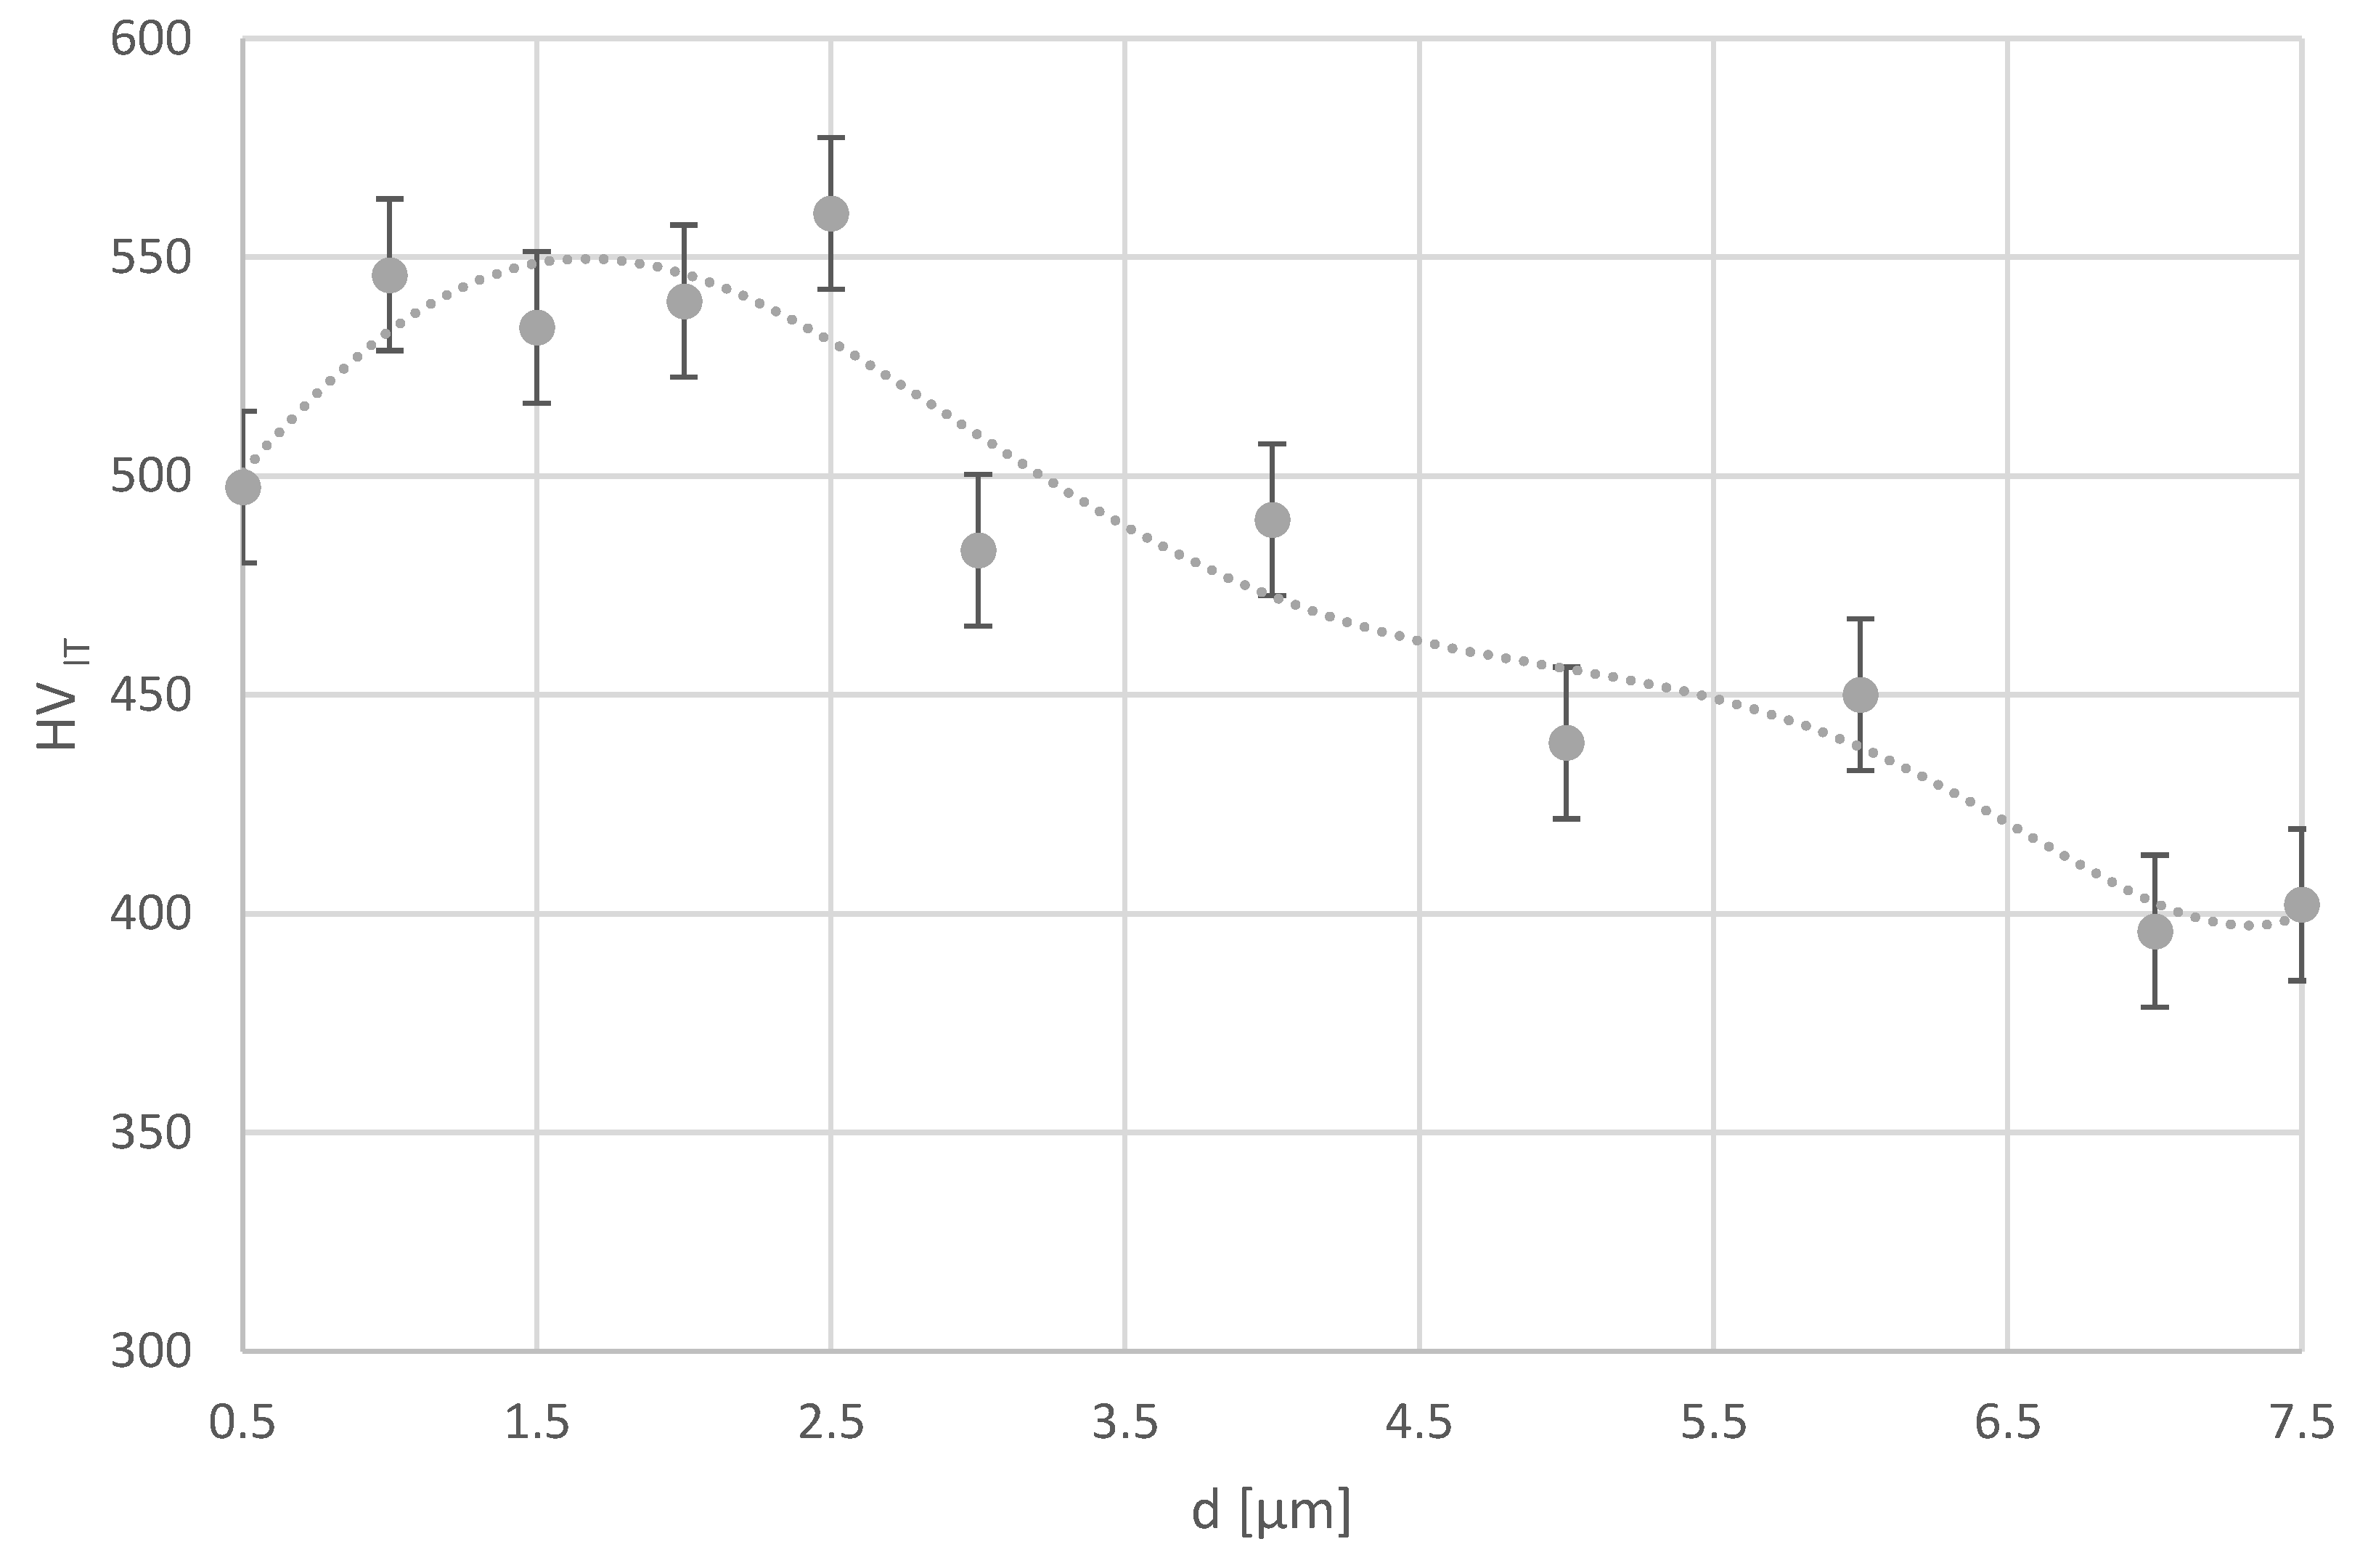
The instrumental hardness of the tested surface changes with the depth of penetration. At a penetration depth of 0.5 μm, the hardness is about 500 HV, then in the depth range of 1 - 2.5 µm, we observe an increase in hardness, and further beyond a depth of 2.5 µm the hardness decreases until it reaches 400 HV at a depth of 7.5 µm.
Figure 6. Microhardness distribution as a function of penetration depth.
Preprints 104396 g006

3.5. XRD Studies

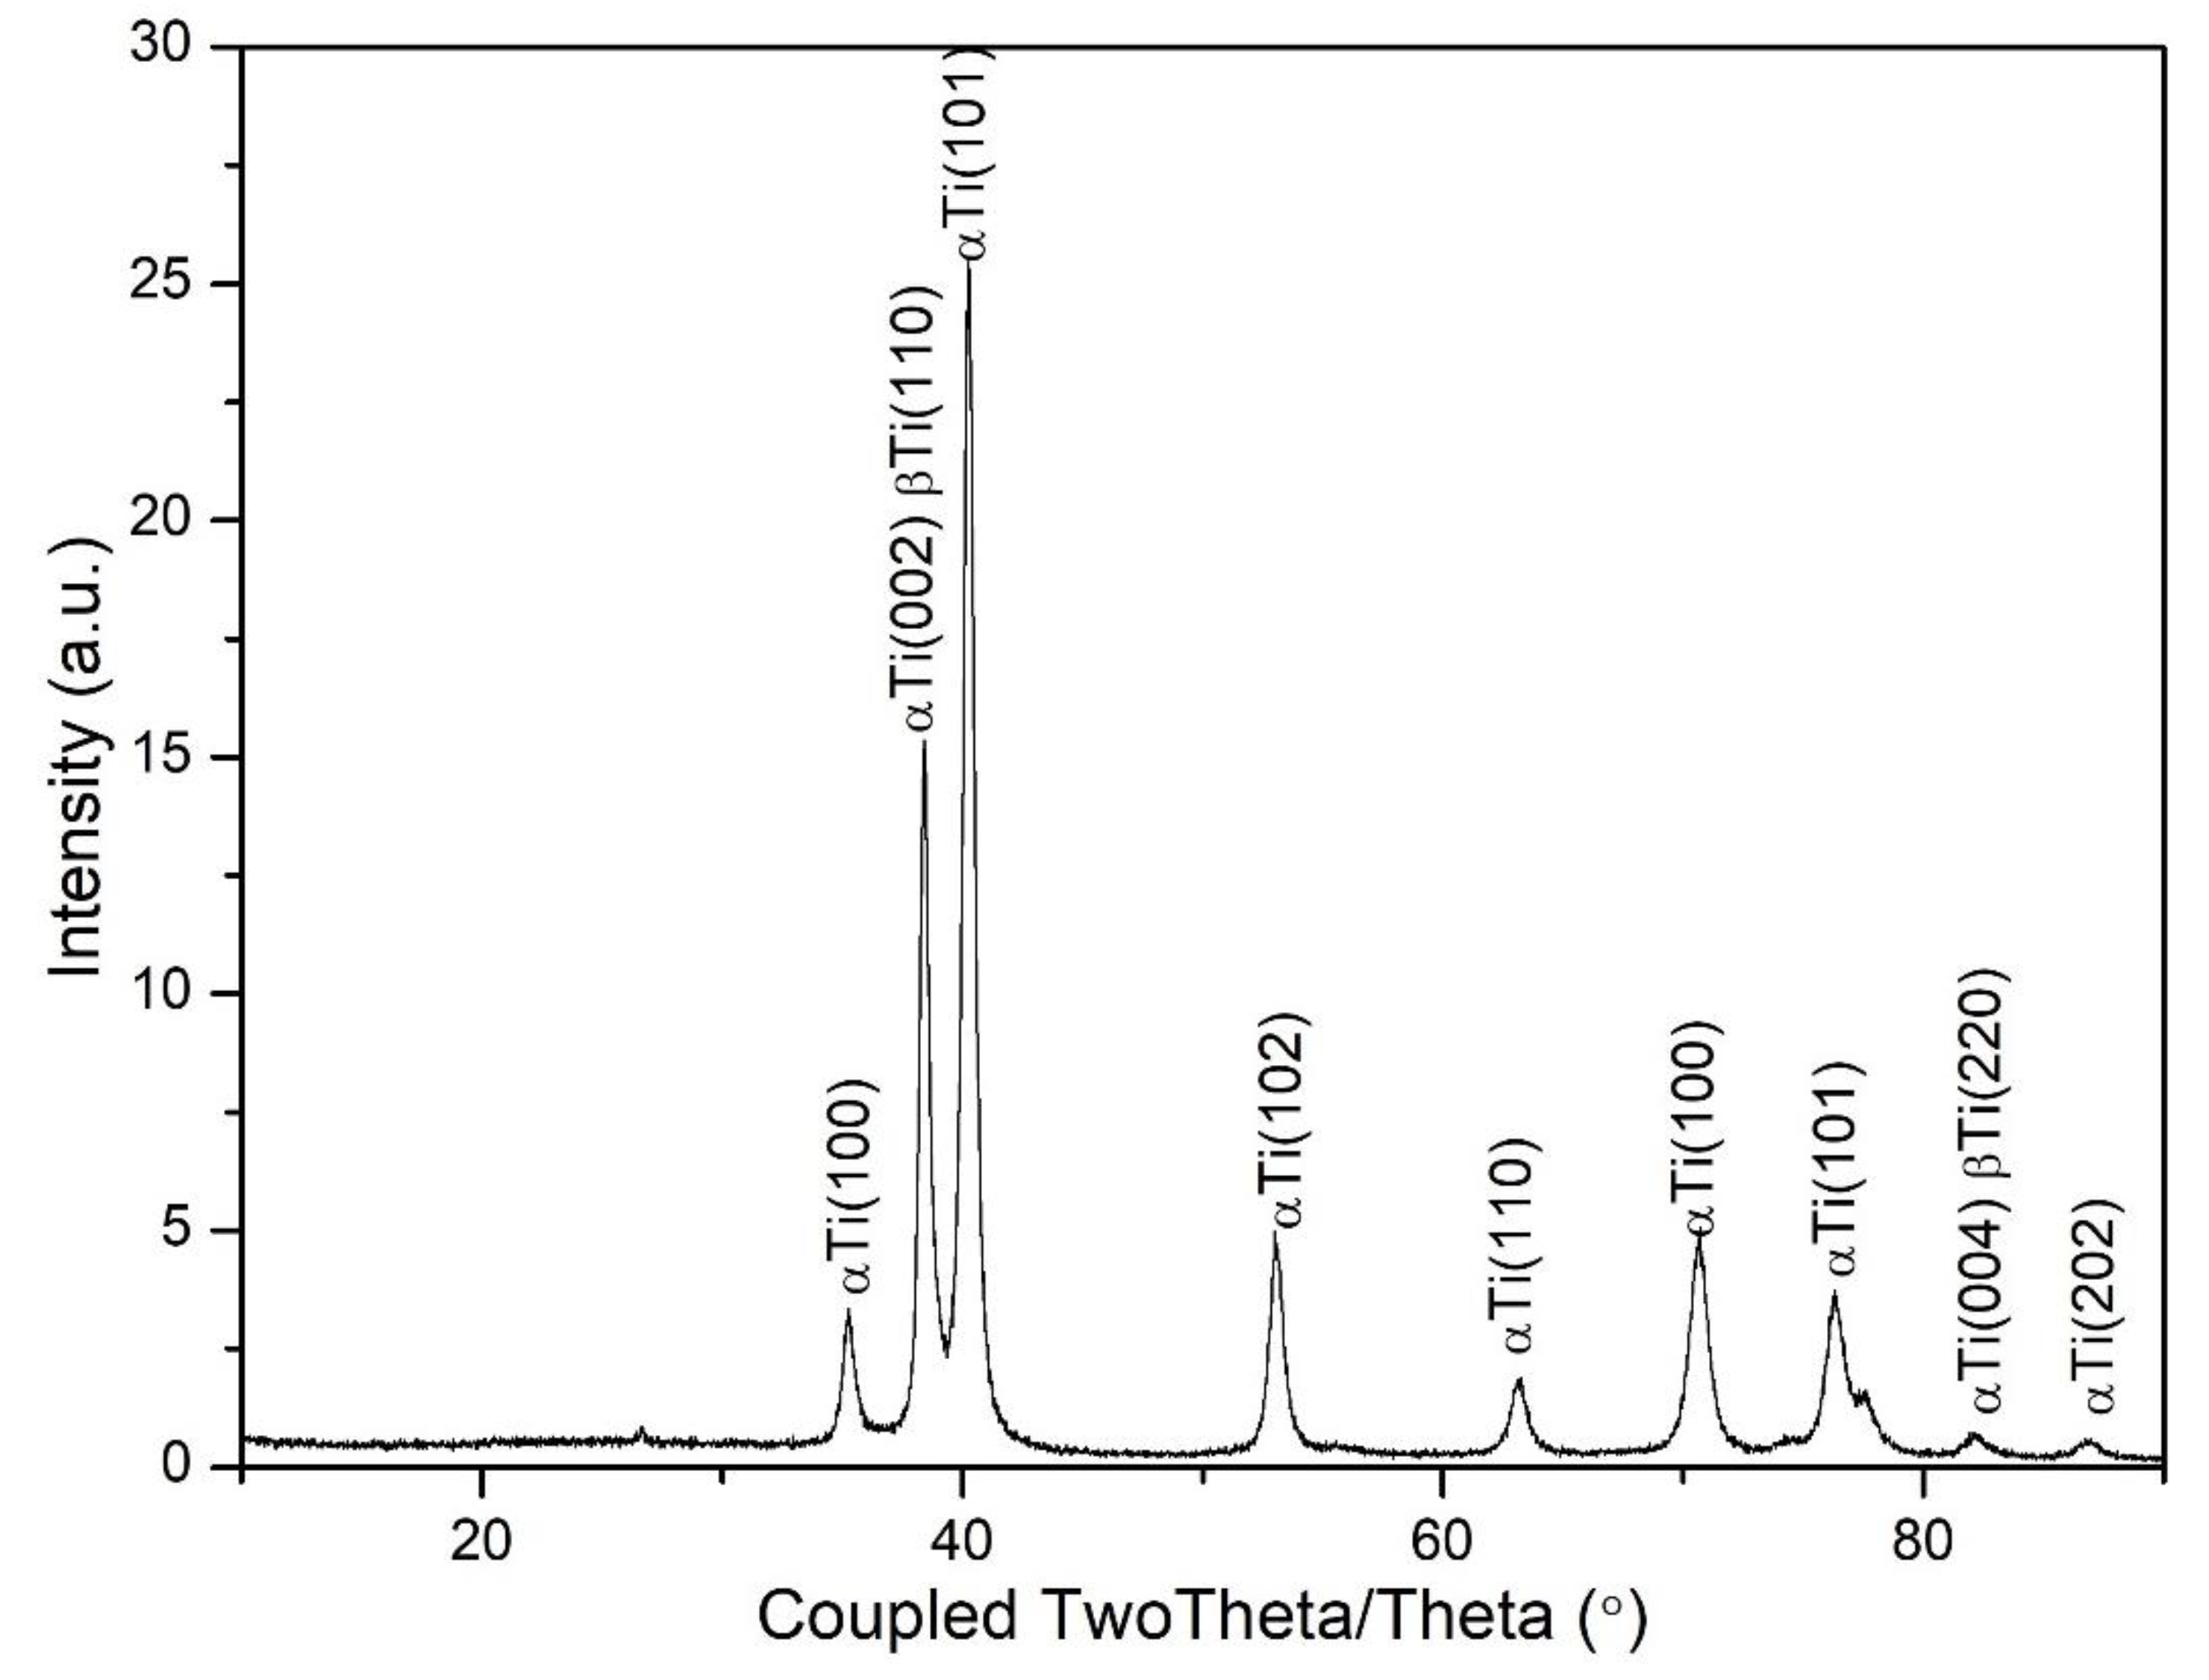
Based on the phase analysis of the tested materials, in the surface layer αTi and βTi phases were identified (Figure 7). Selected structural parameters determined using Rietveld refinement are presented in Table 1.

3.6. Electrochemical Investigation

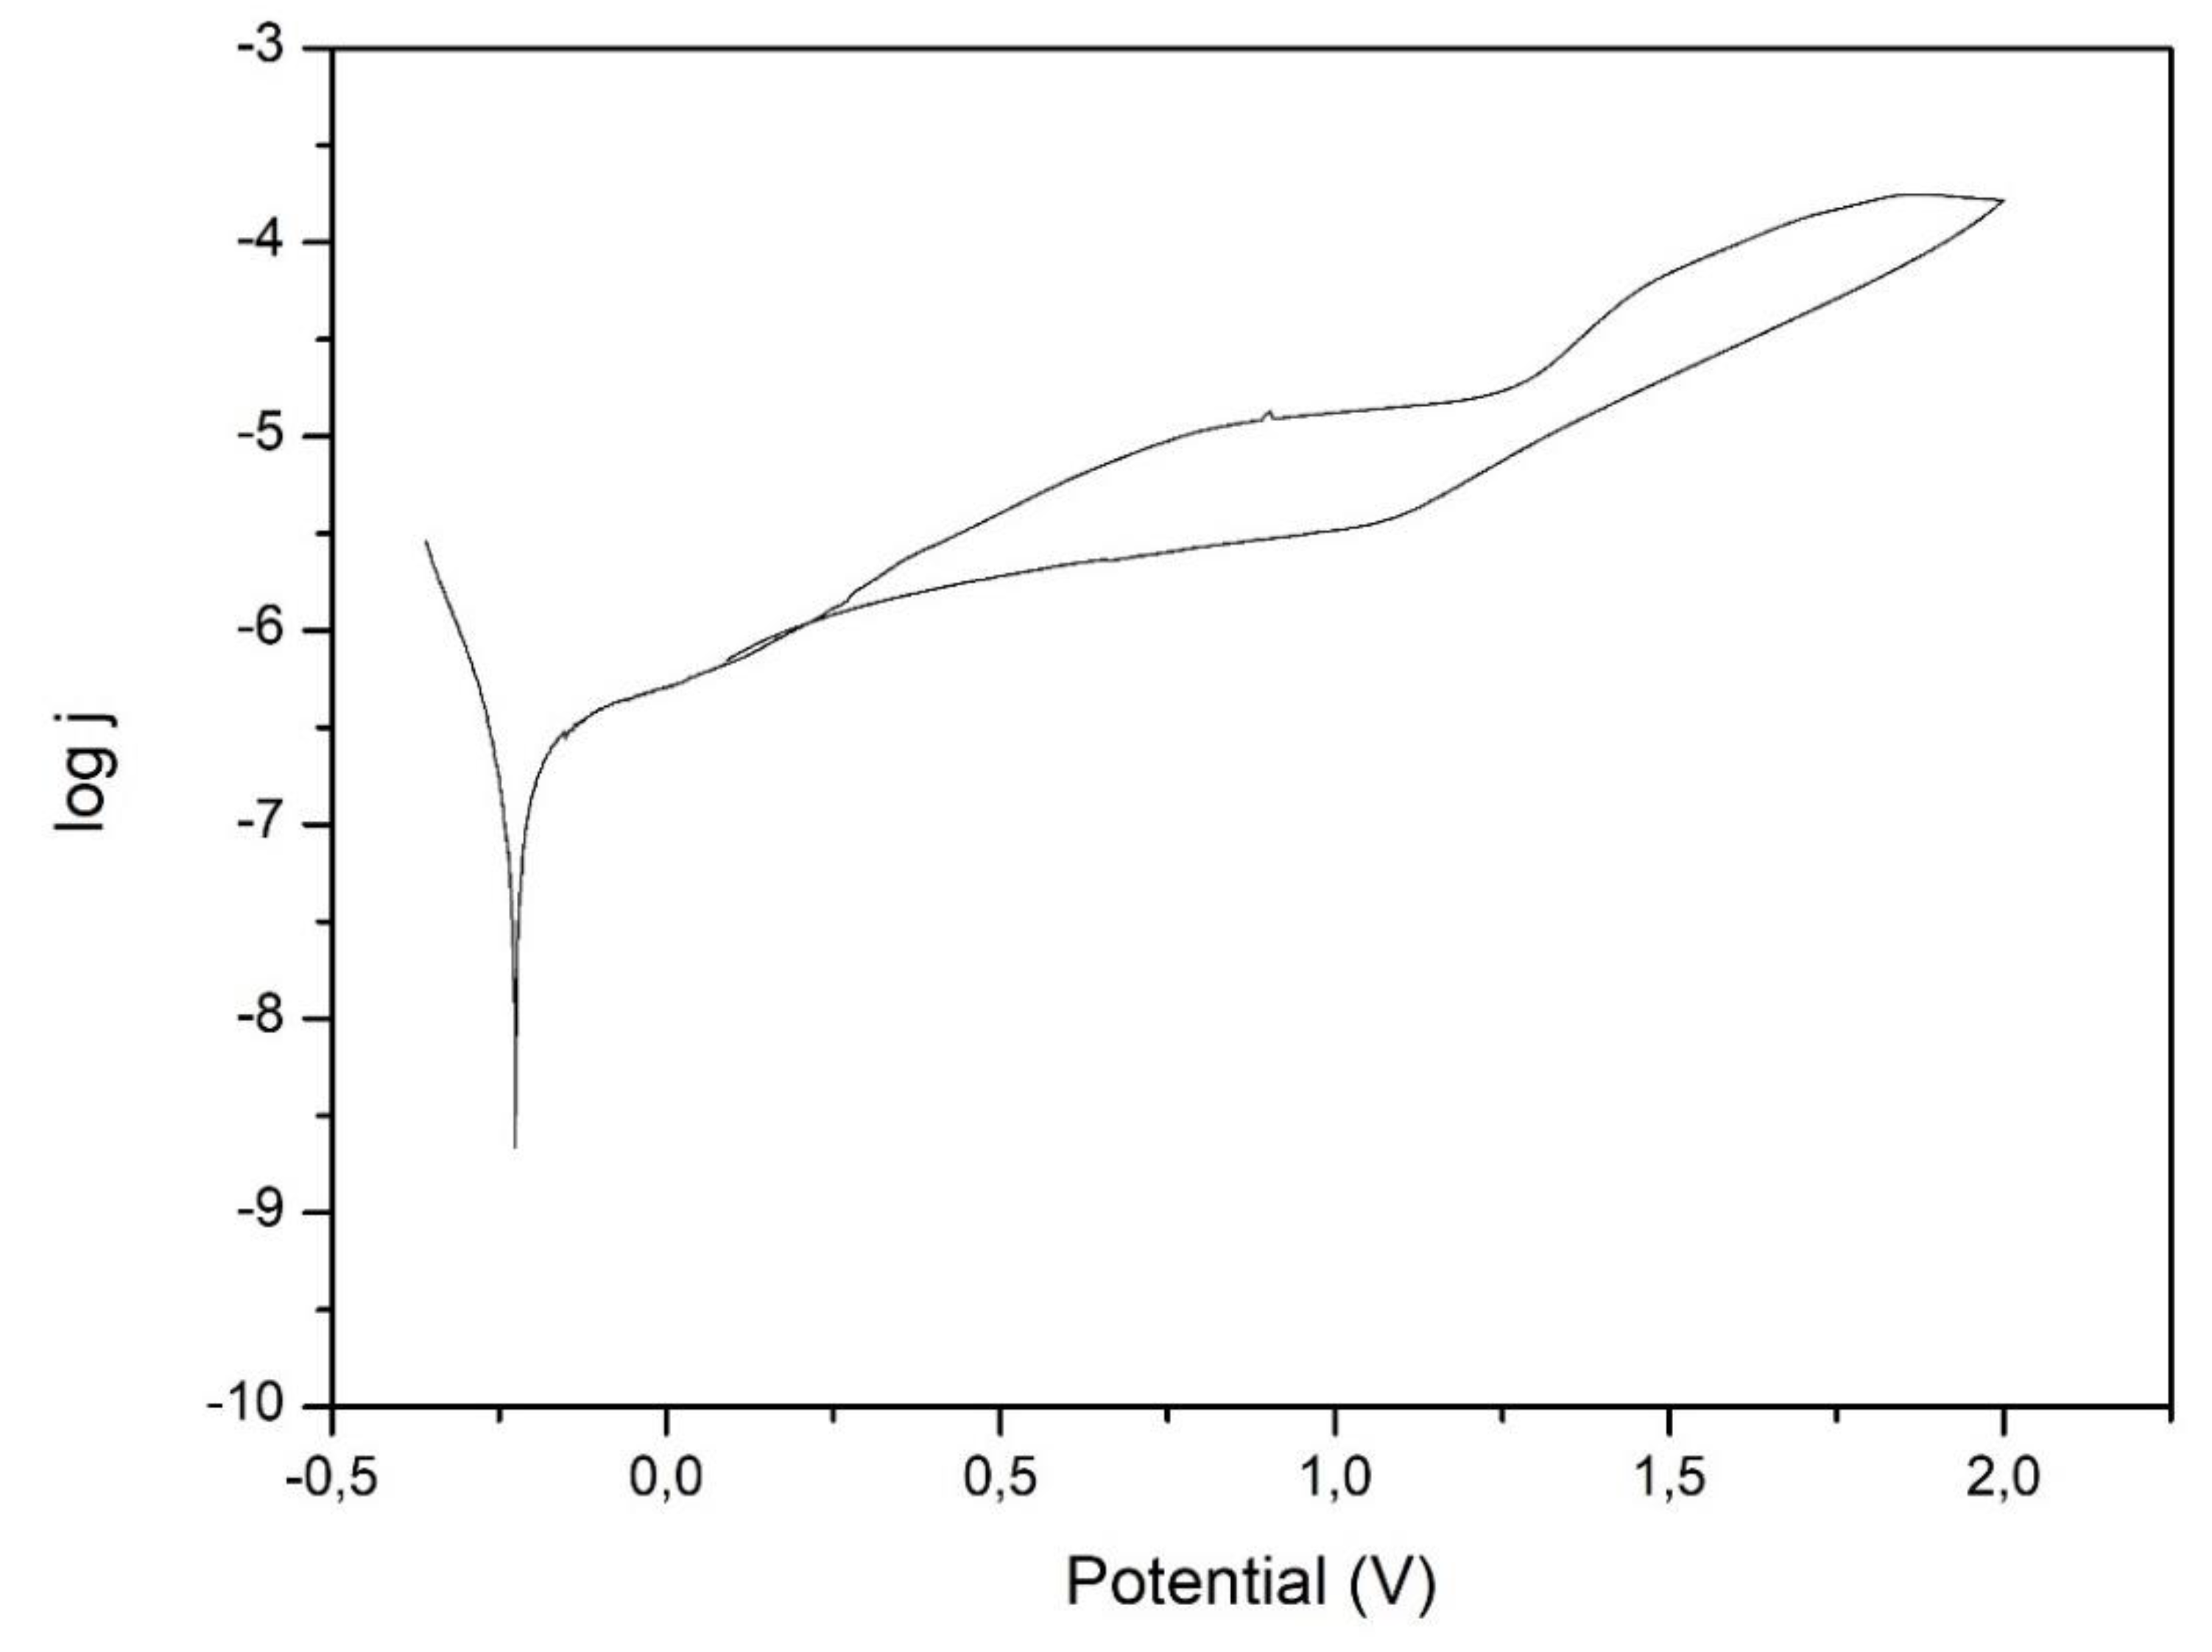
The Eocp of the samples was equal to -5(17) mV. For the recorded potentiodynamic curves no breakdown potential was observed (Figure 8). Based on the analysis of the recorded potentiodynamic curves, the following corrosion parameters were determined using the Stern method: corrosion potential Ecorr = -31.2(75) mV and polarization resistance Rp = 0.93(11) MΩcm2. The recorded return curve is characterized by a lower current density compared to the forward curve.

3.7. XPS Studies

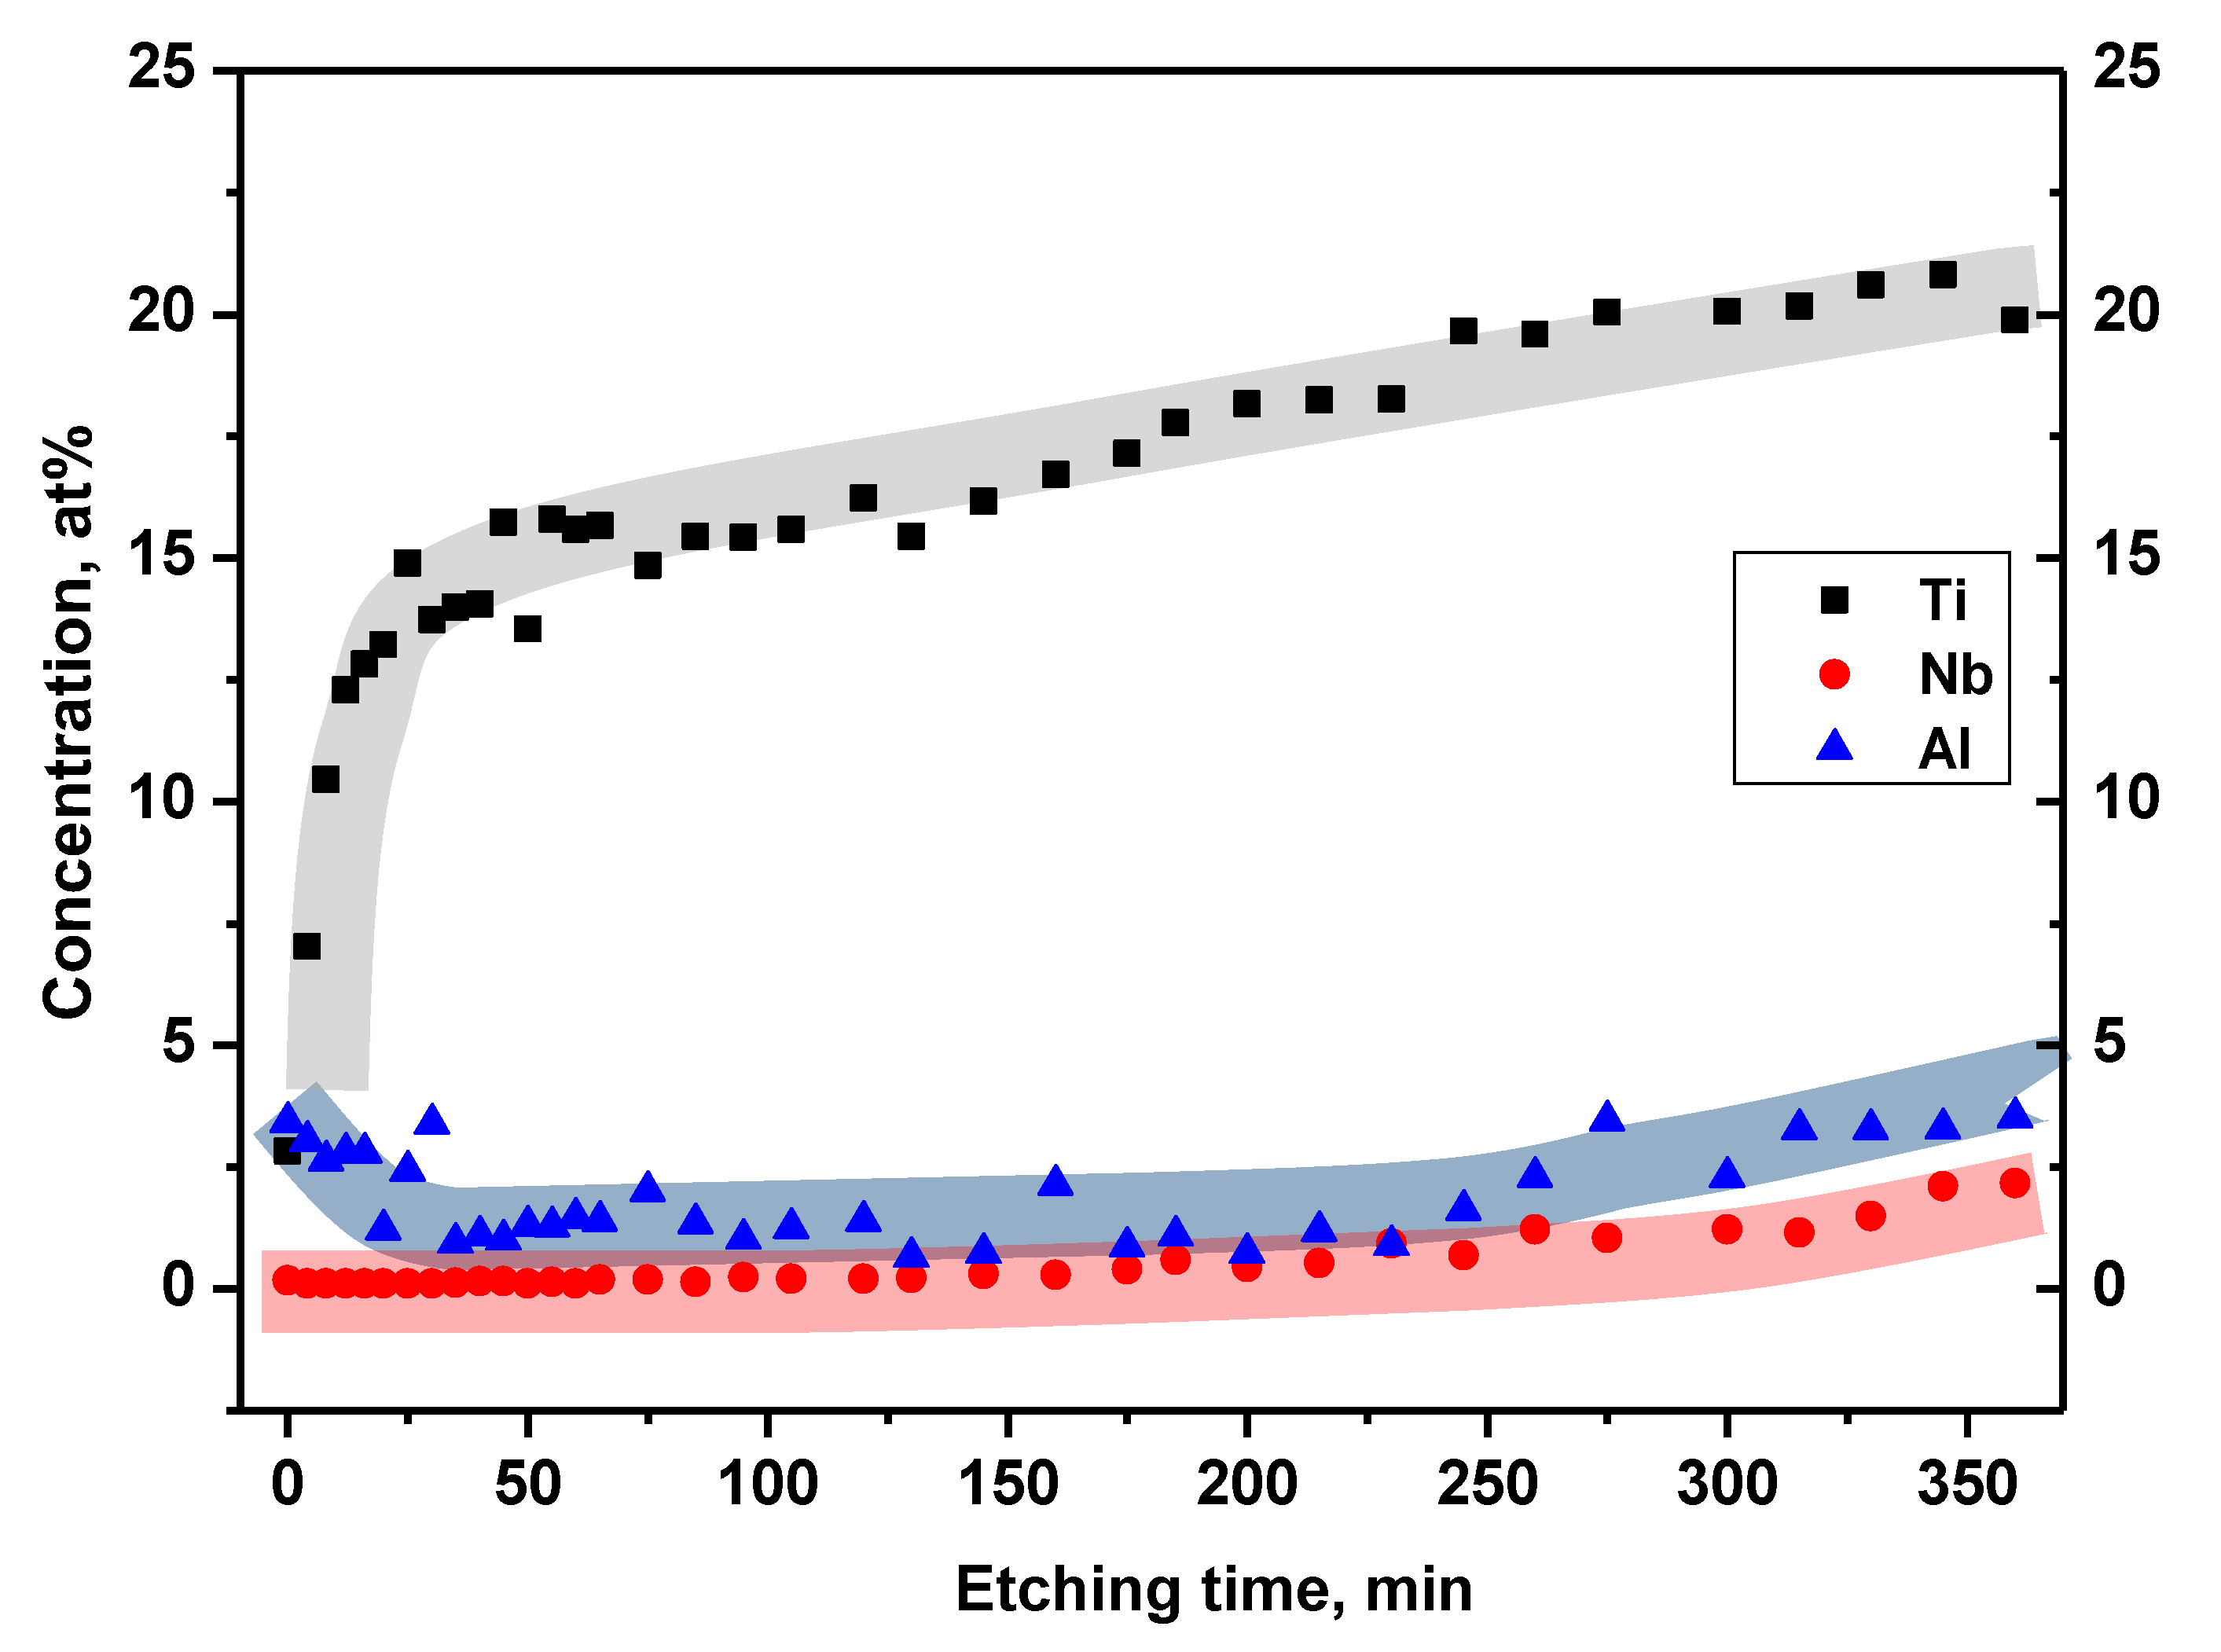
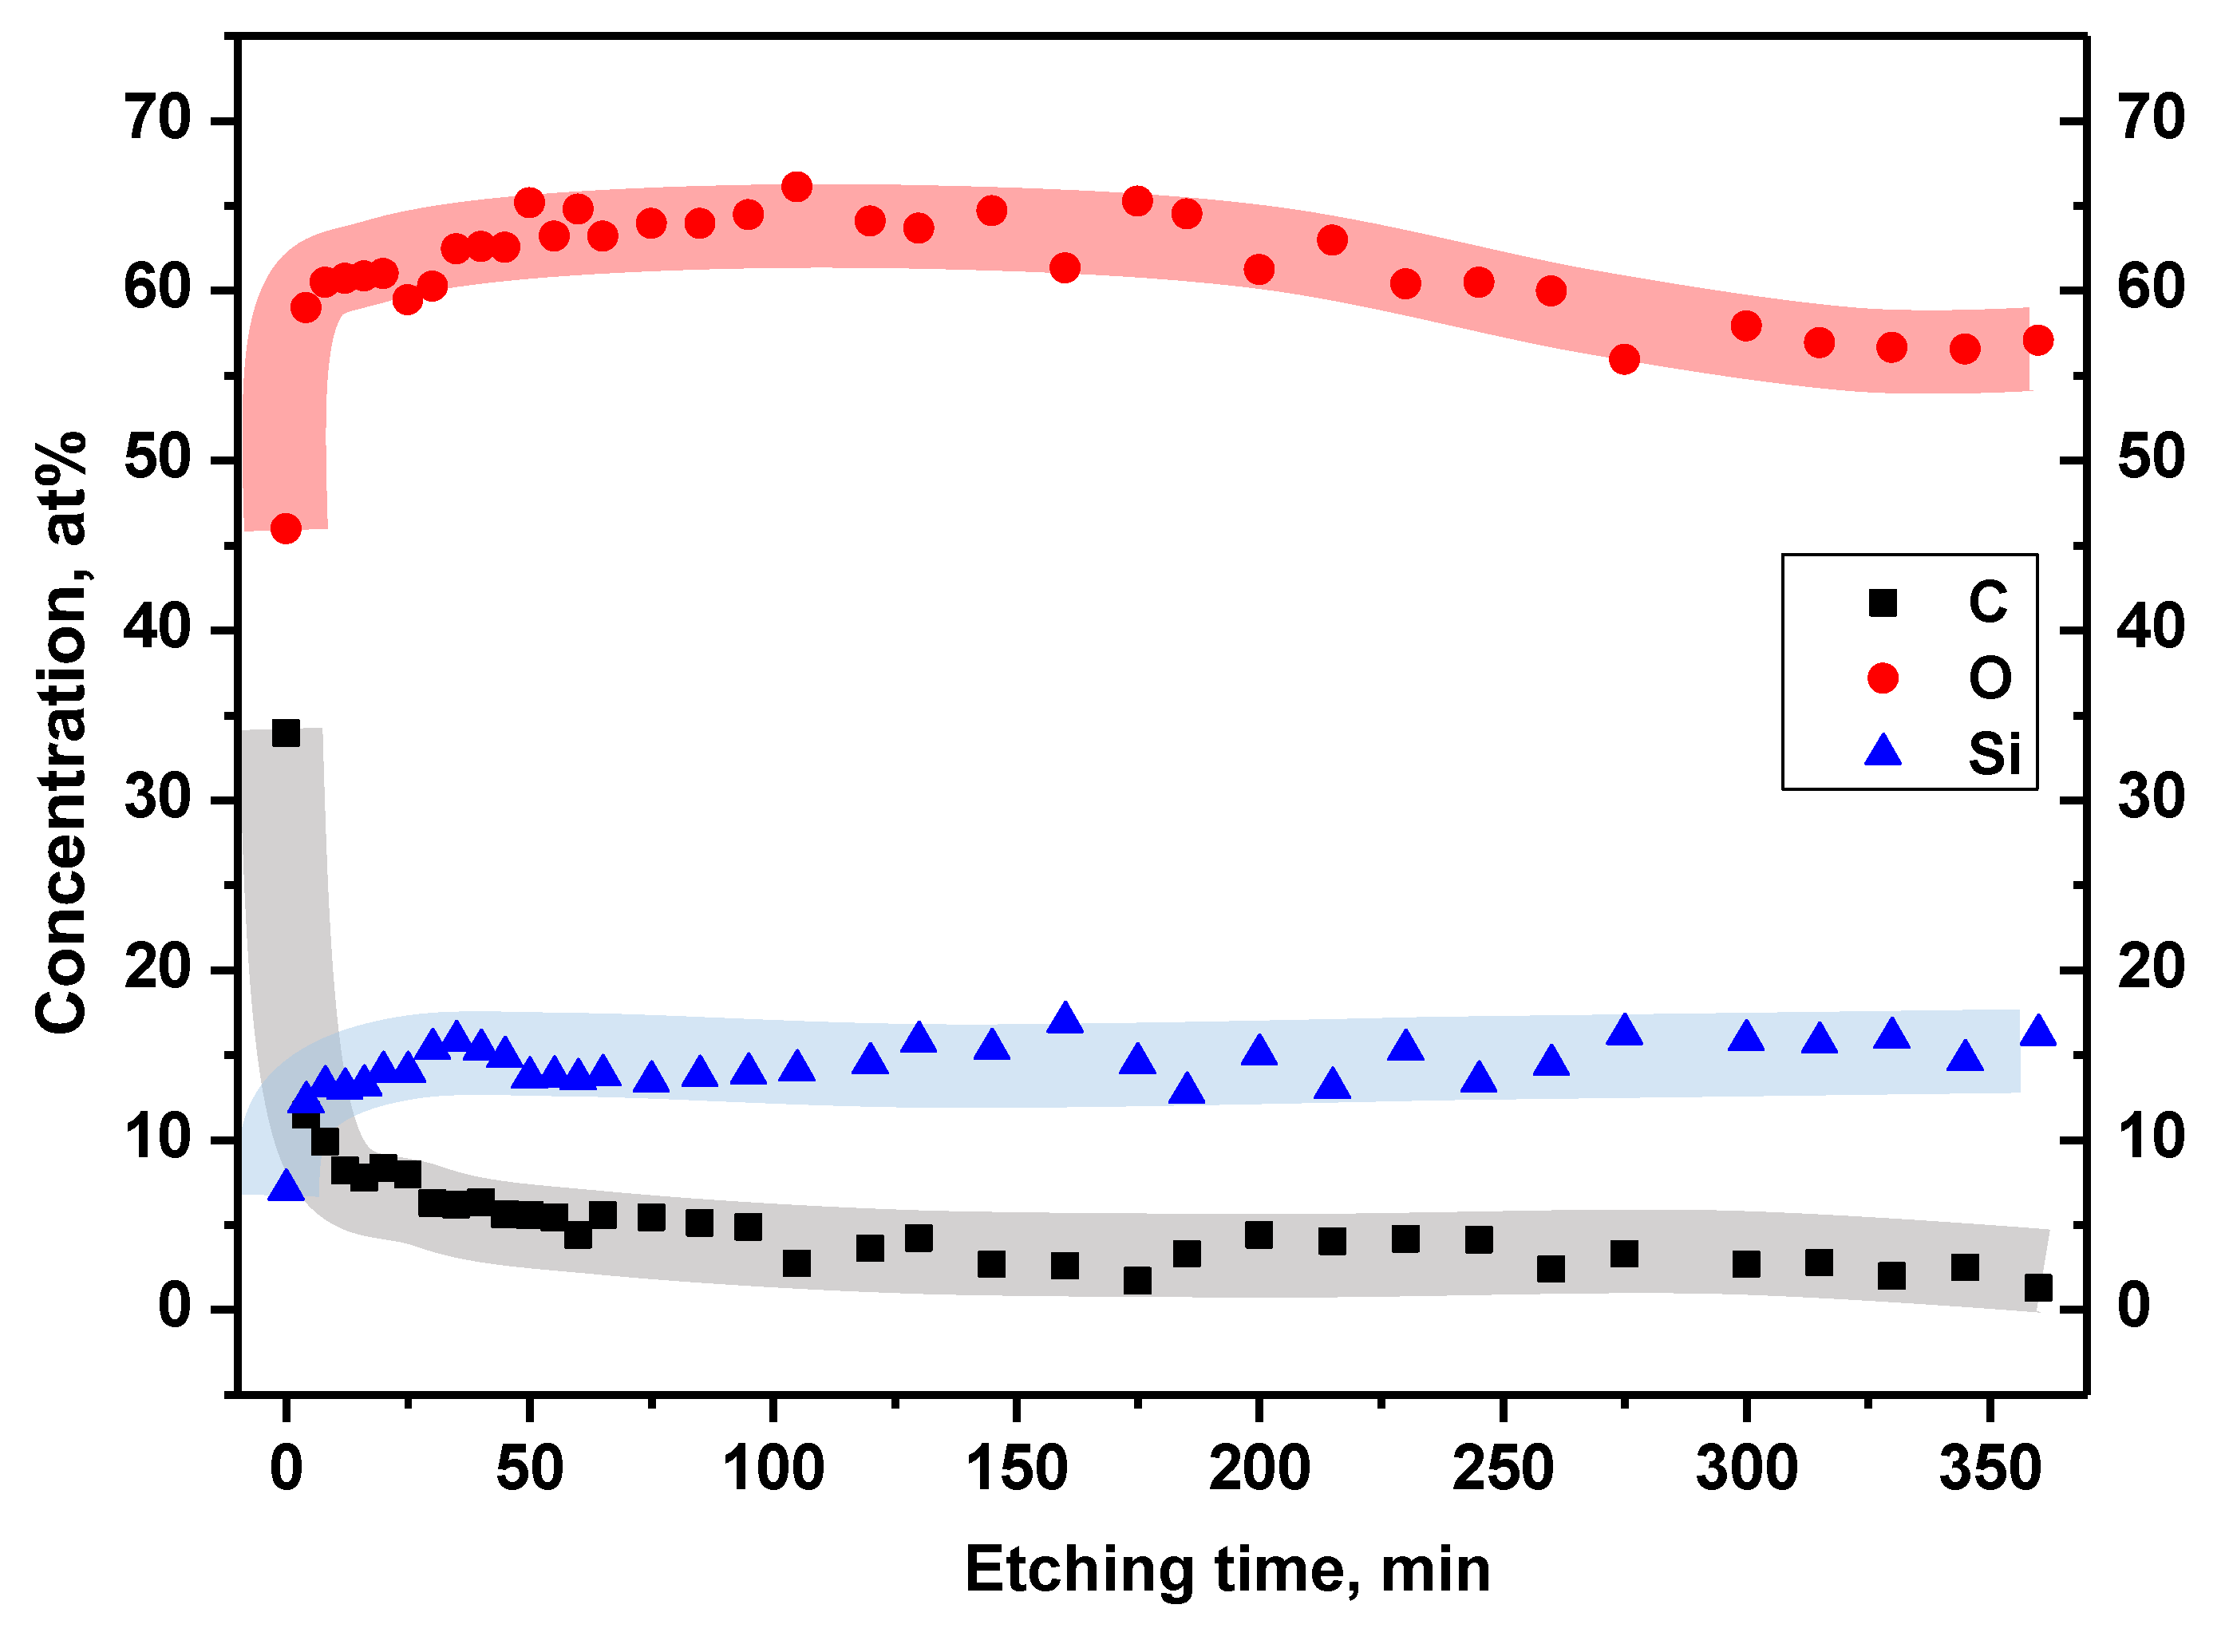
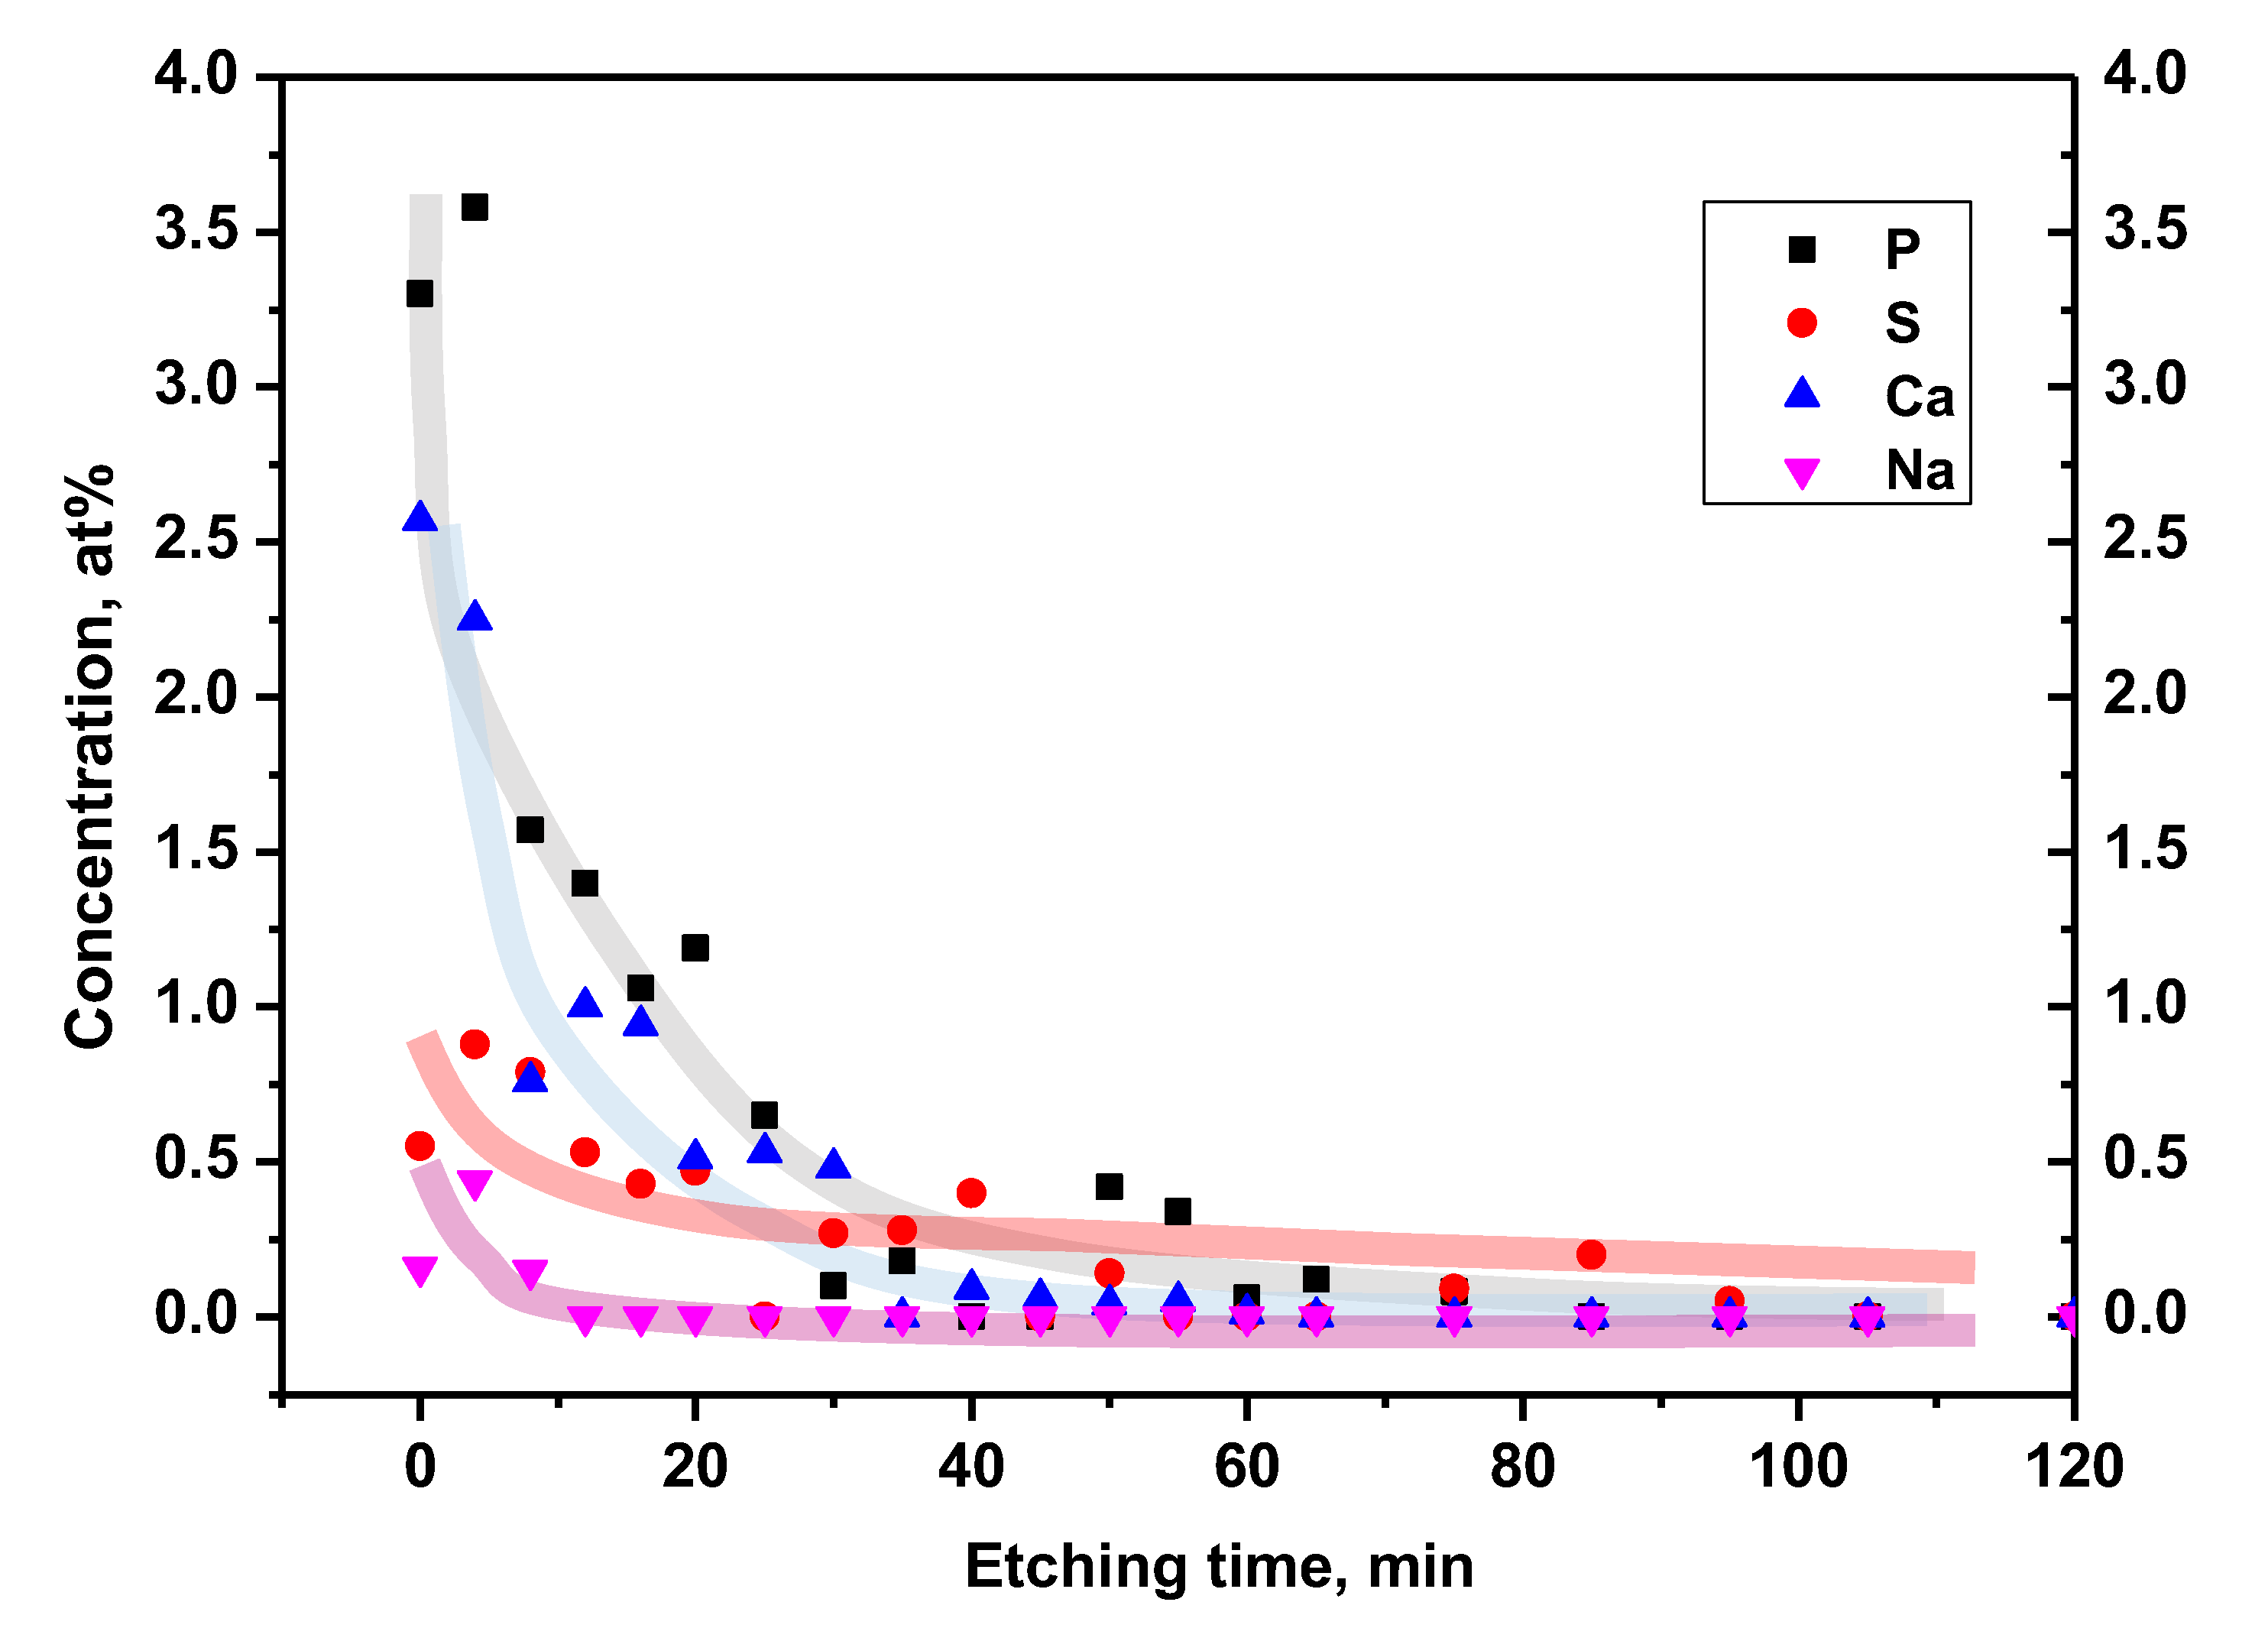
In the first step of the photoemission studies, the total concentrations of alloy constituents were investigated along the depth obtained by sequential ion etching. Figure 9 shows the percentage atomic concentration profile of the main components of the Ti6Al7Nb alloy: Ti, Al, Nb as a function of argon beam etching time. The relation was obtained based on the analysis of XPS survey spectra for individual etching times. Quantification of the spectra was based on Ti 2p, Al 2p and Nb 3d transitions taking into account the respective values of relative sensitivity factors. Figure 10 presents the percentage atomic concentration profile vs. etching time for the: O, C and Si elements that appeared in Ti6Al7Nb alloy as a result of conducted technological treatment. The dependences were obtained by quantifying XPS survey spectra for O 1s, C 1s and Si 2p transitions. Figure 11 presents the percentage atomic concentration profile vs. etching time for P, S, Ca, and Na components. They existed in Ti6Al7Nb as traces of chemical treatment on the alloy. For these sets of profile, the XPS survey spectra were quantified for P 2p, S 2p, Ca 2p and N 1s transitions.
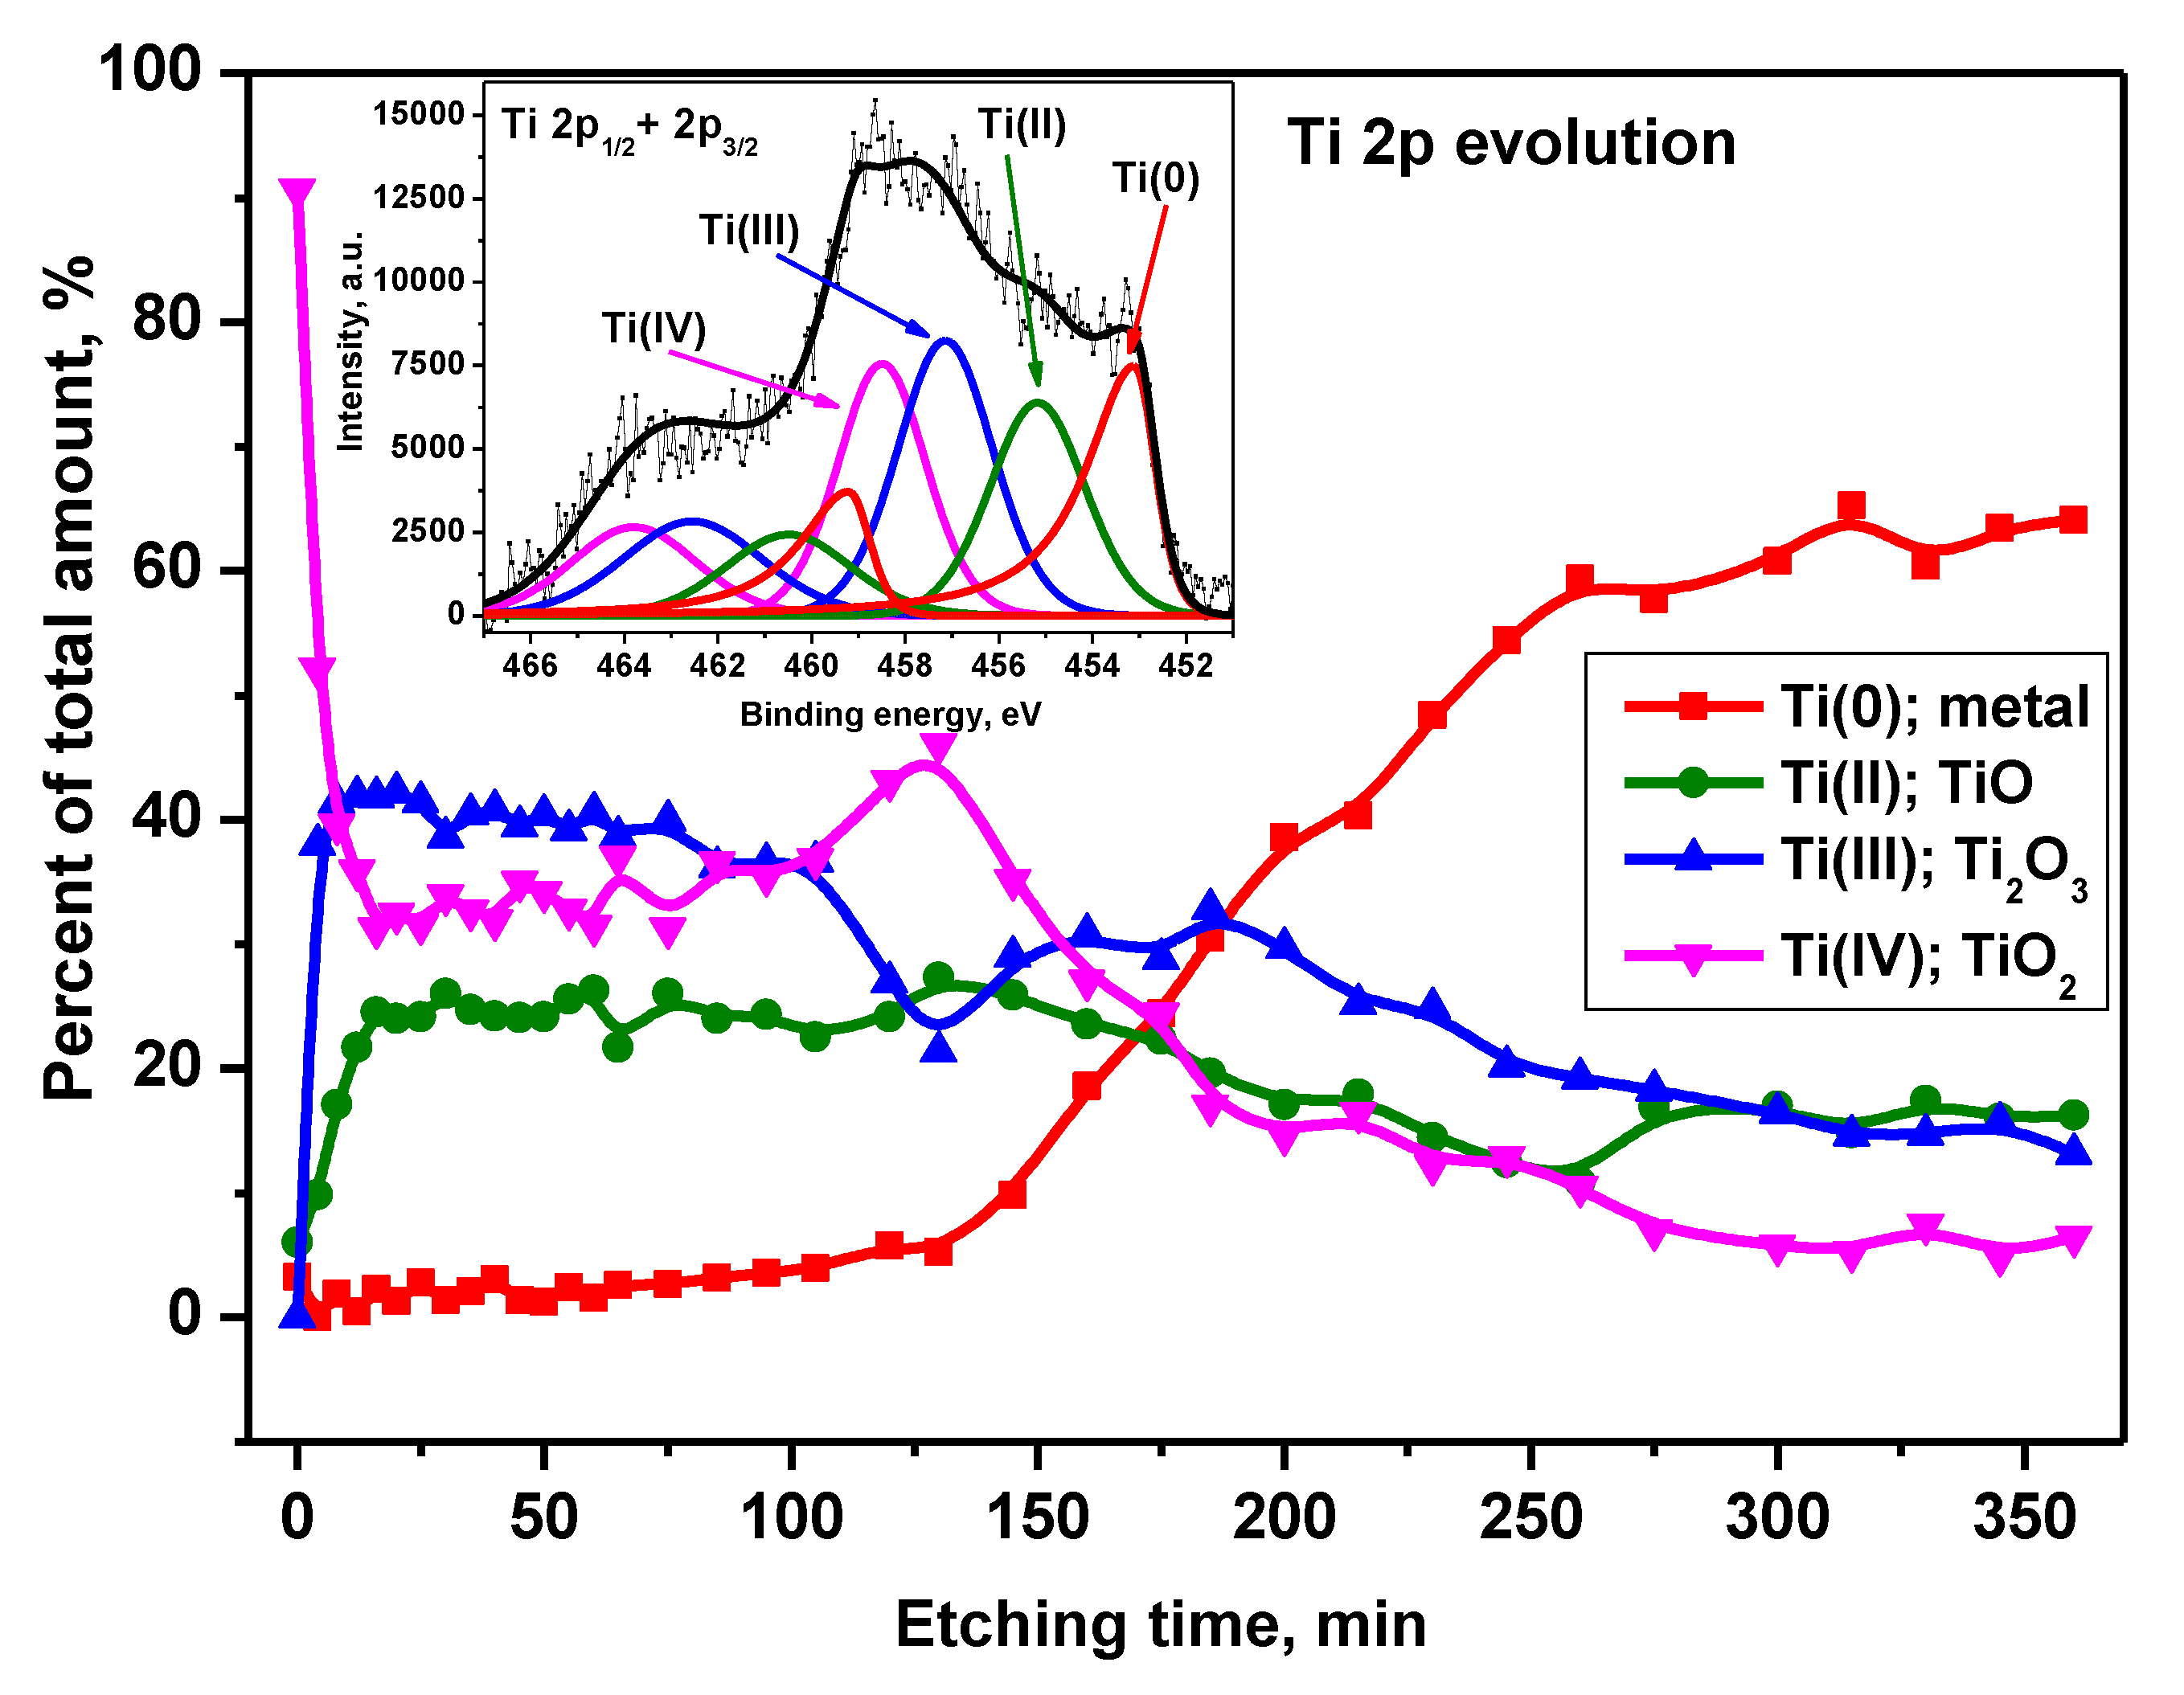
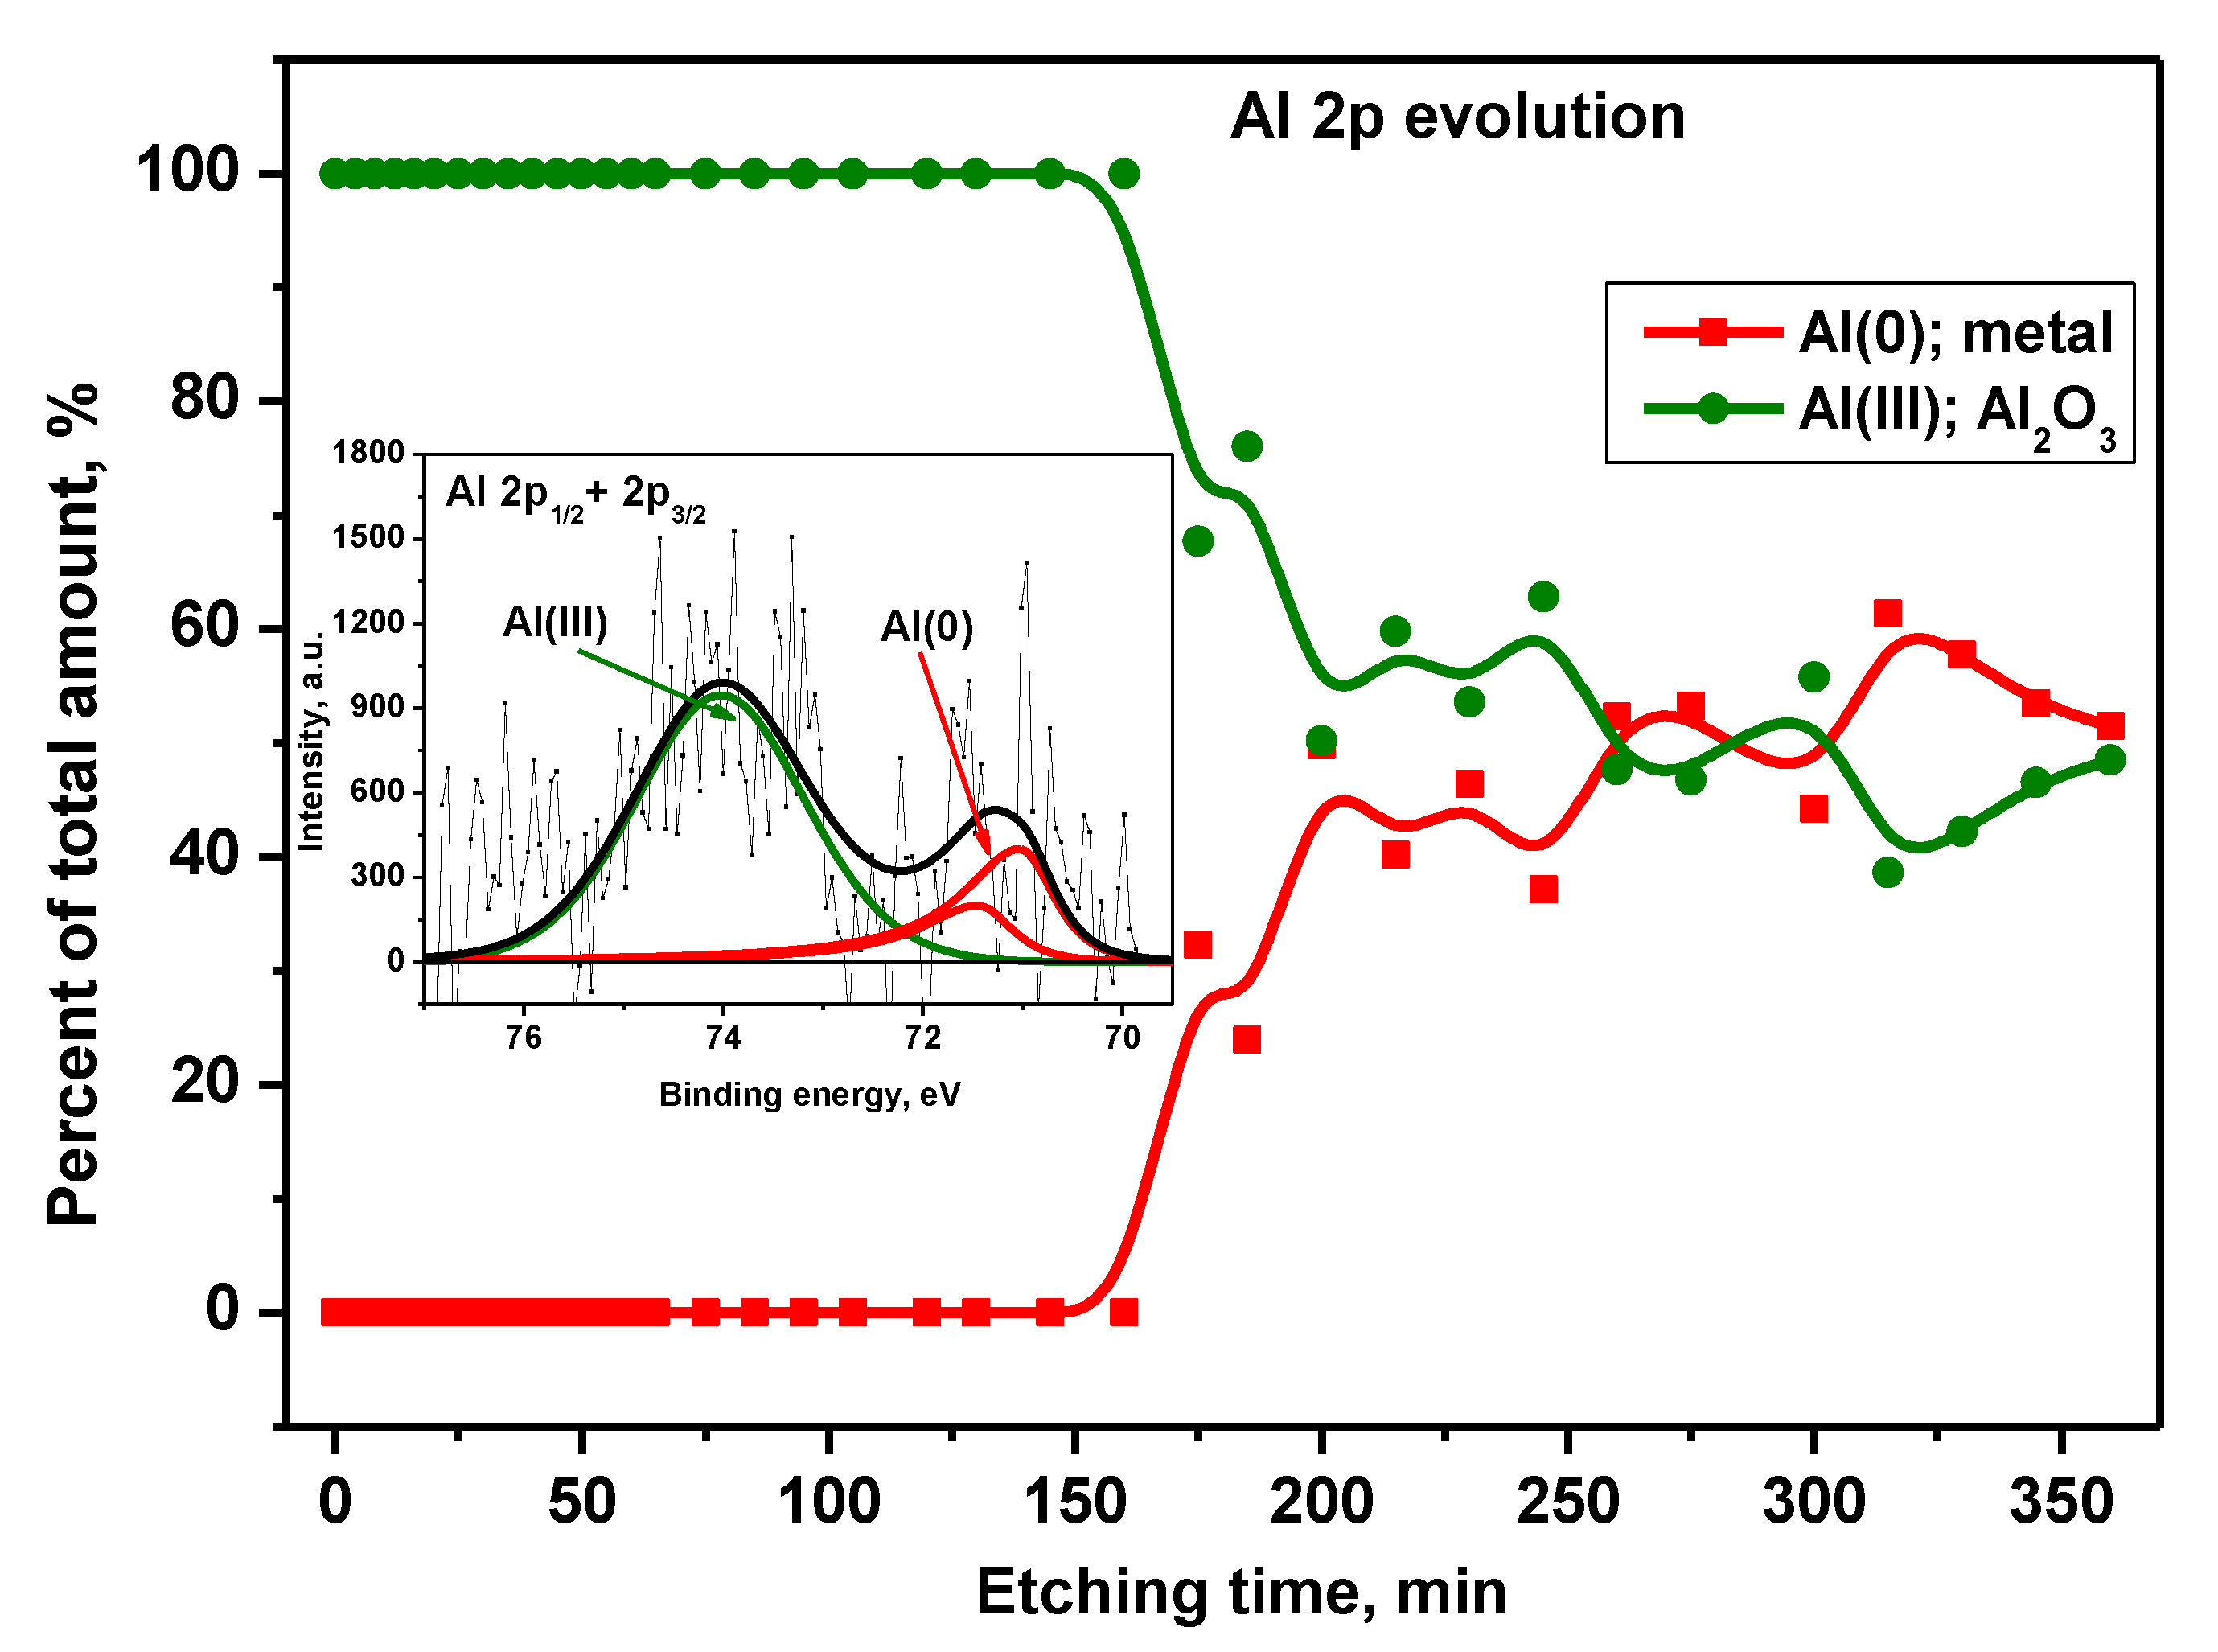
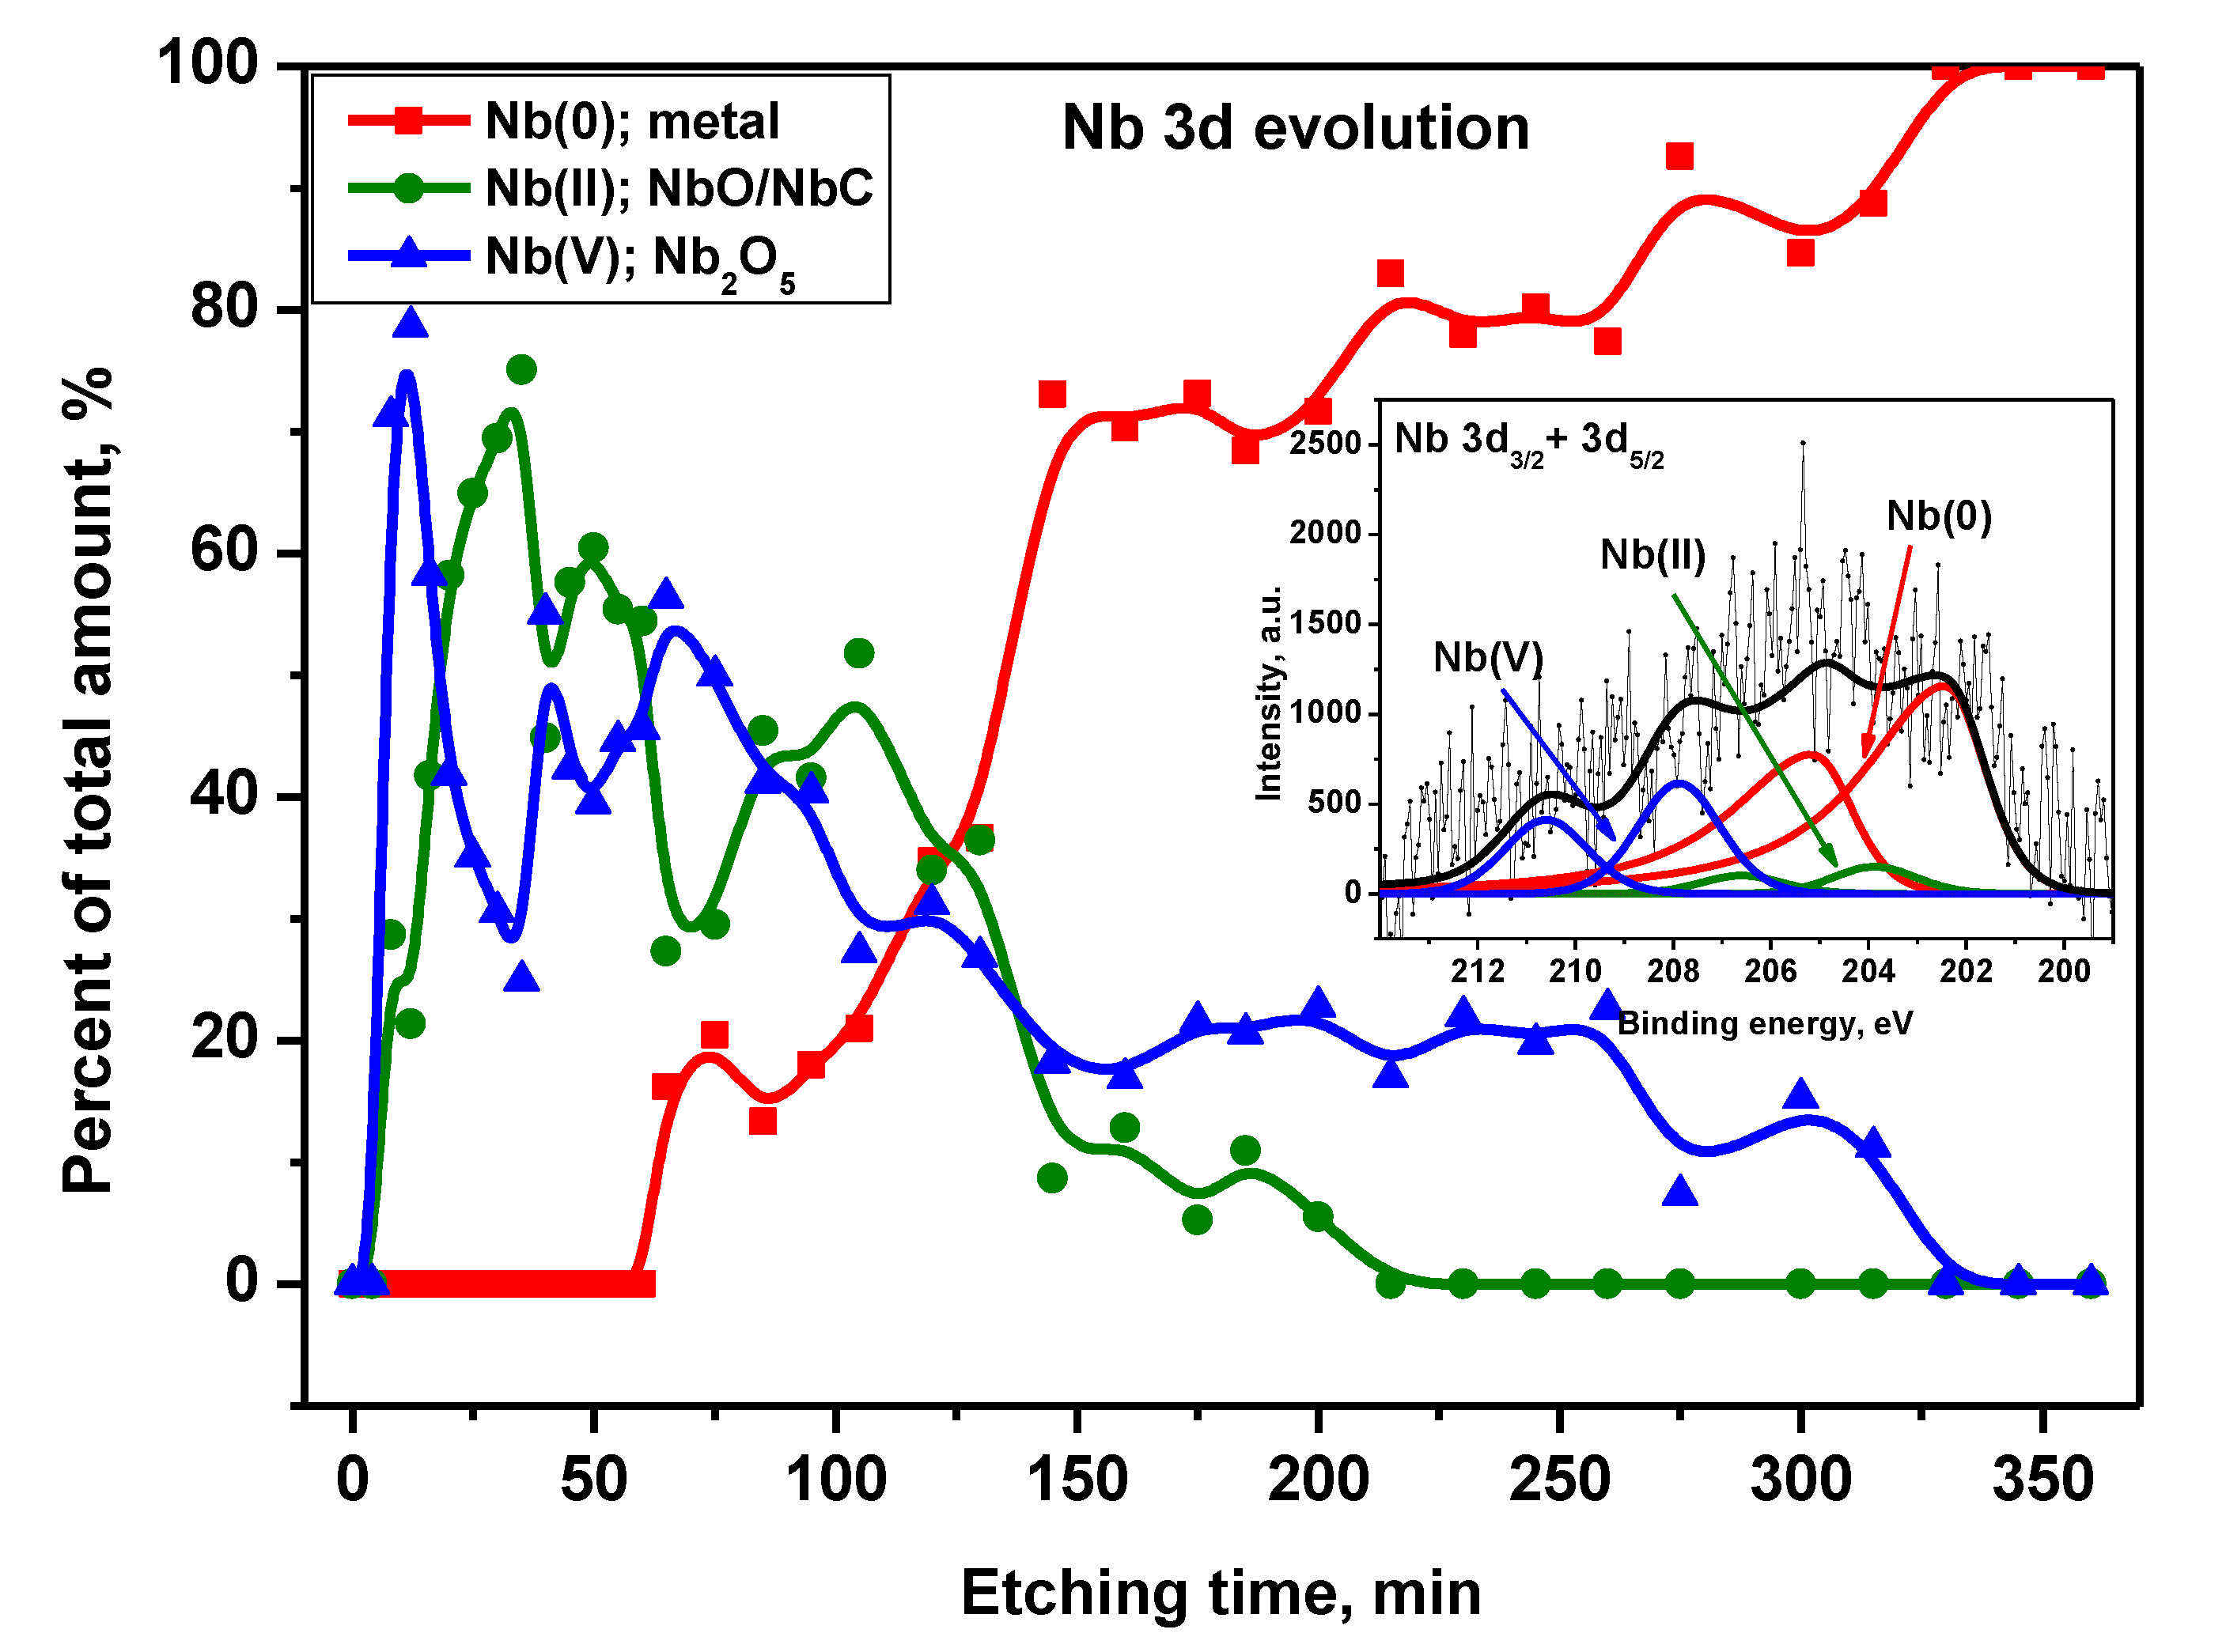
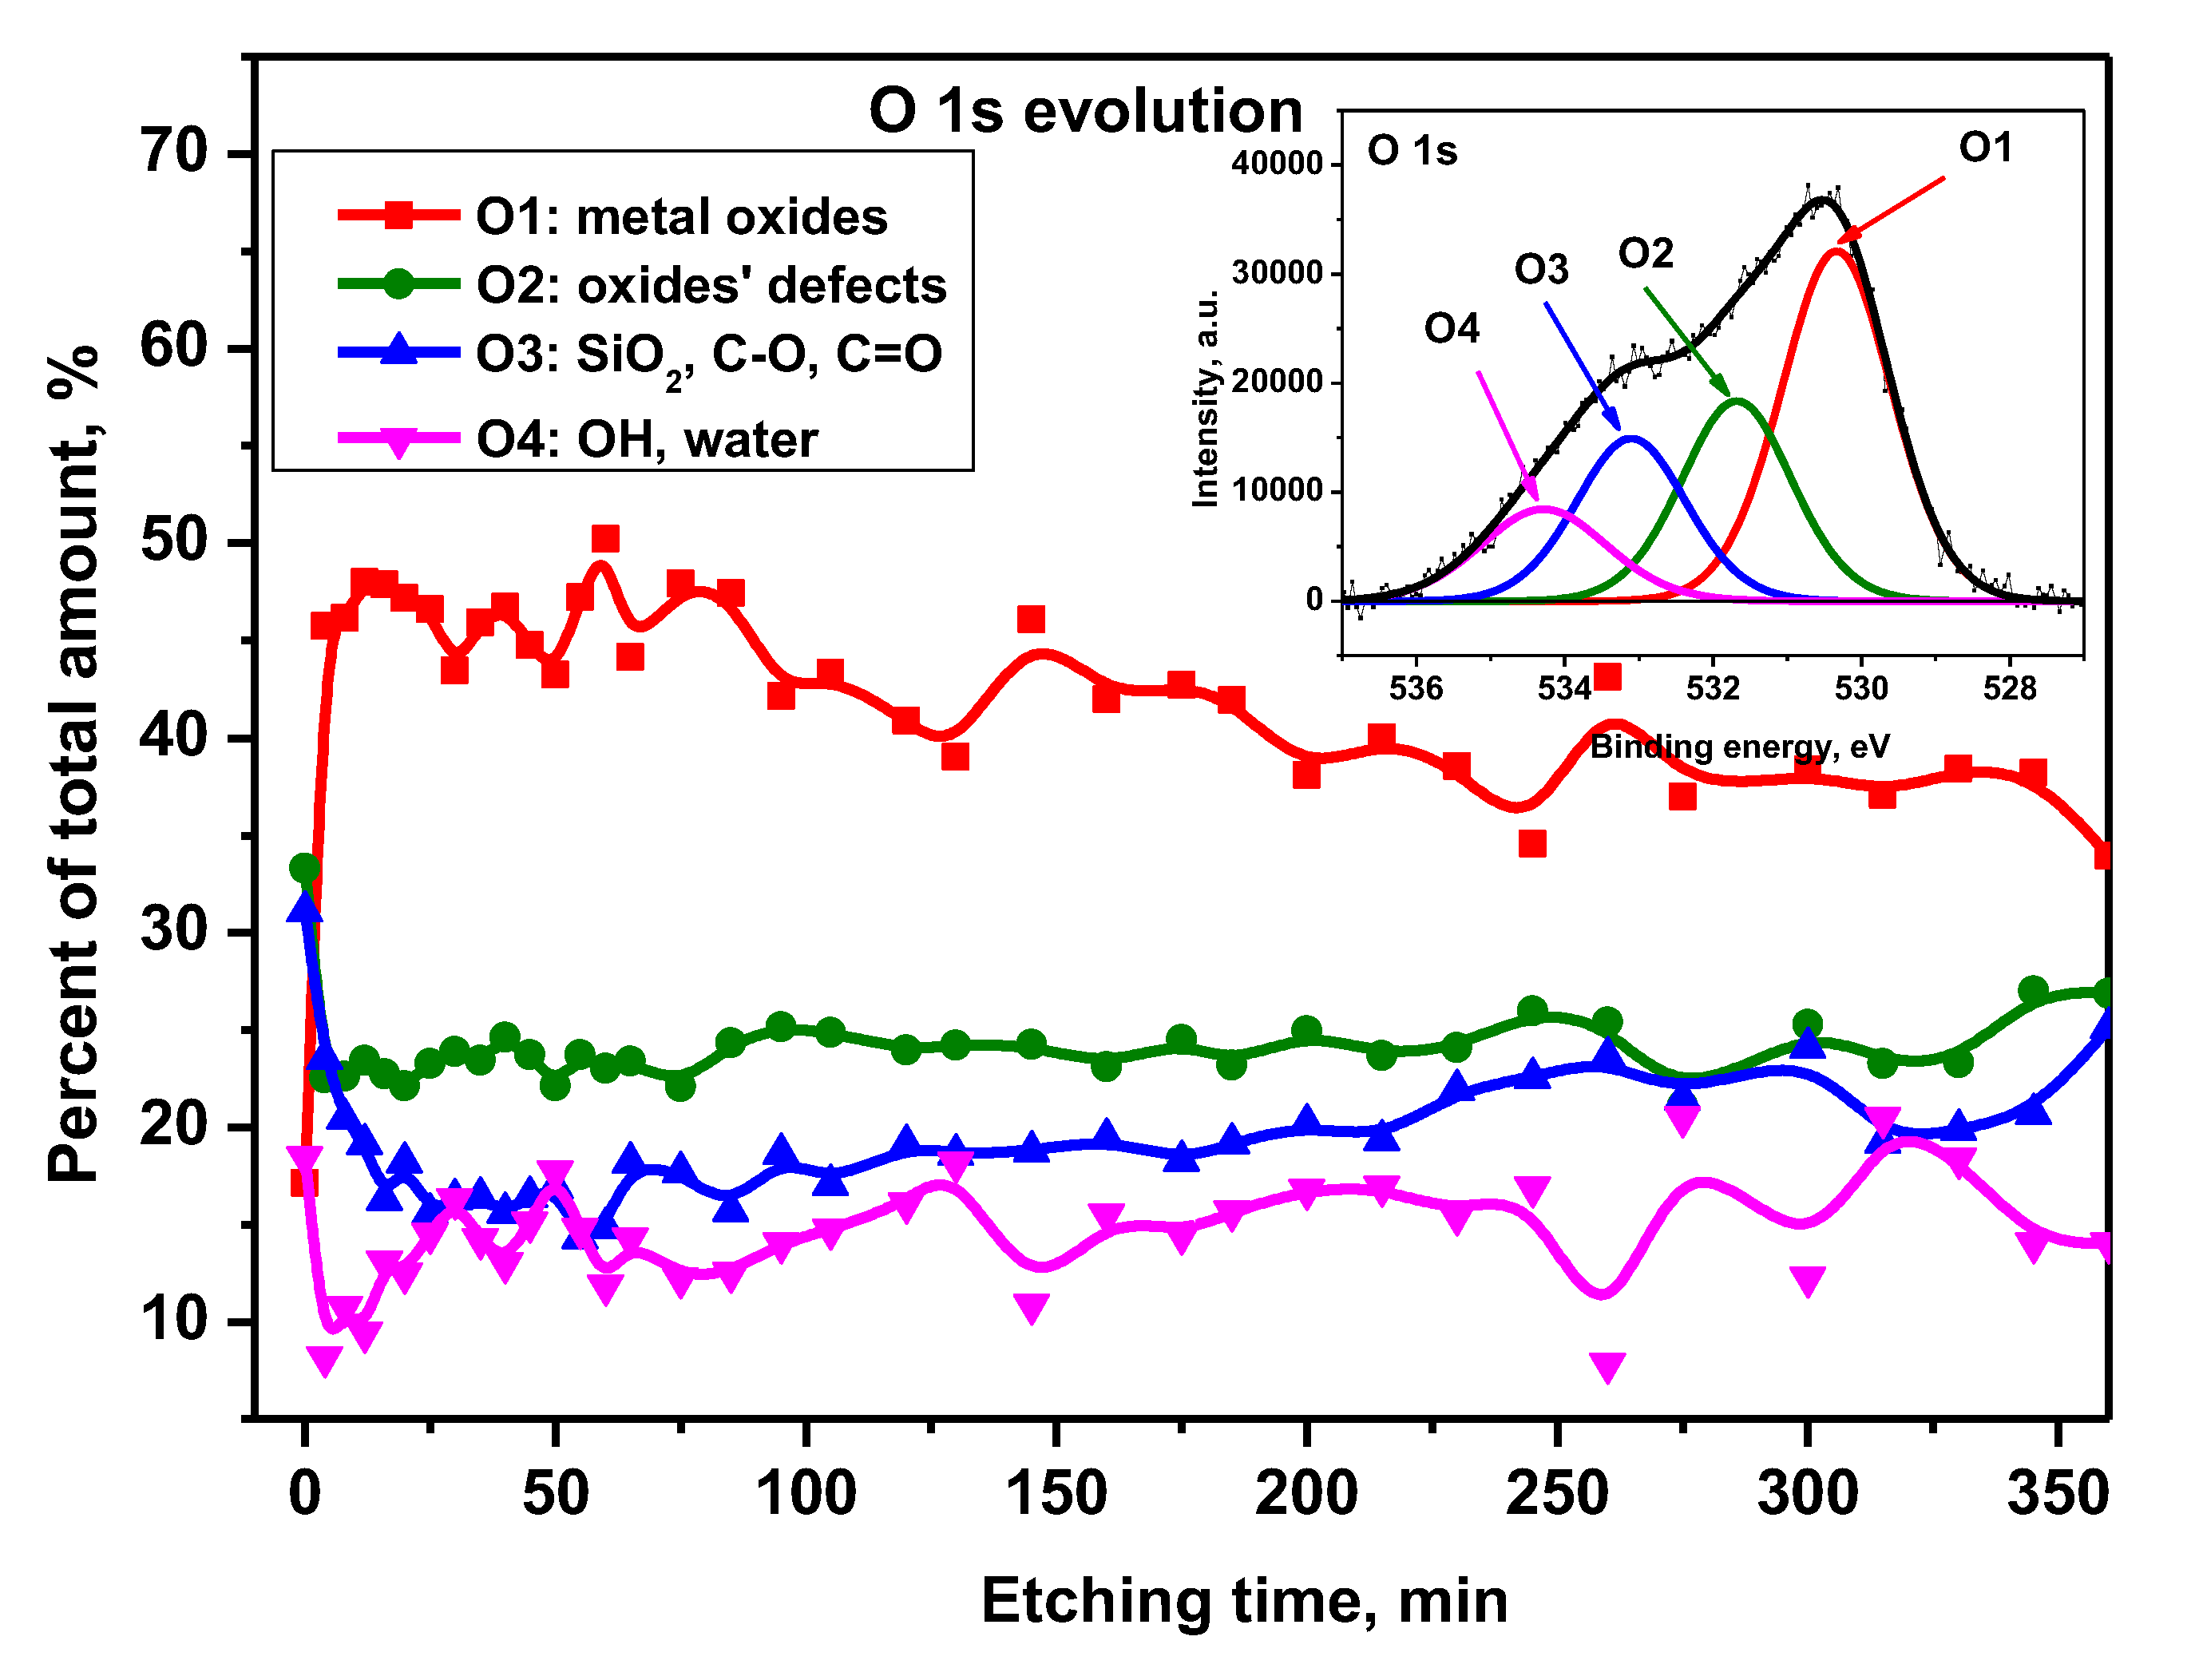
In the next step of the XPS examination, the chemical states of the main alloy components were analyzed. The evolution of titanium chemical states based on the Ti 2p peak components as a function of etching time is presented in Figure 12 (with exemplary window spectrum). Figure 13 presents a variation of aluminum chemical states with etching time. The analysis was conducted for the Al 2p XPS peak (exemplary window spectrum: inset to Figure 13). The evolution of niobium chemical states as a function of etching time is presented in Figure 14. The study was conducted for the Nb 3d XPS peak (exemplary window spectrum: inset to Figure 14). Figure 15 shows the evolution of oxygen chemical states based on the O 1s peak composition with etching time.

3.8. Cytotoxicity Studies

Taking into account the cell survival criterion, it was found that the surface of the Ti6Al7Nb alloy does not have a cytotoxic effect. The normalized survival of SaOS-2 cells after 72 hours of incubation with extracts from titanium alloy samples, calculated in relation to the survival of cells after incubation with the negative control, was 107.94%.
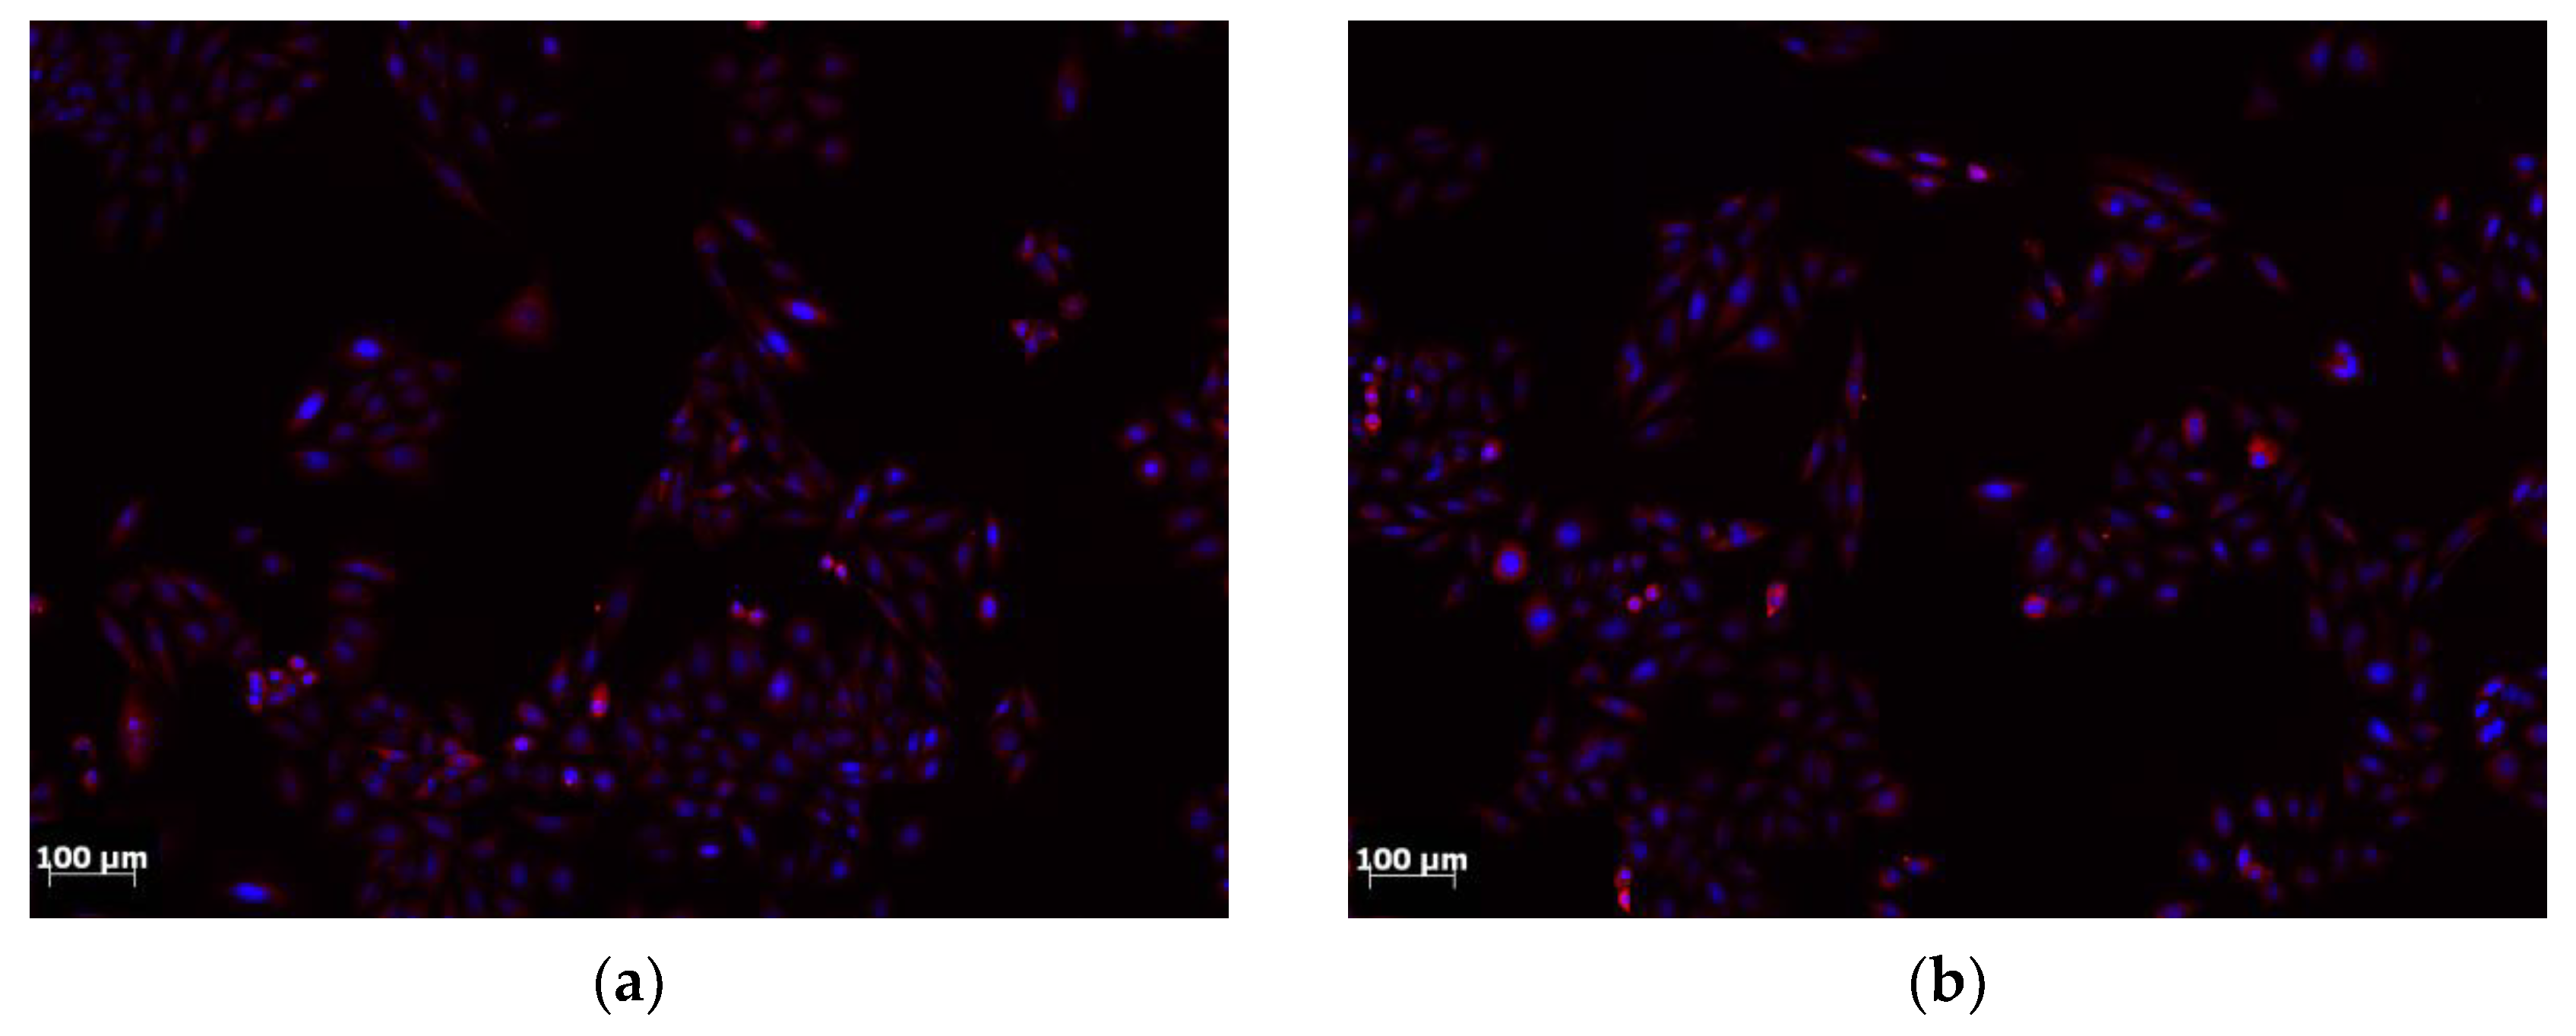
The microscopic analysis showed proper cellular morphology and organization of the cytoskeleton. Numerous proliferating cells and single cells undergoing cellular death (apoptosis or necrosis) were observed. Single cells containing micronuclei-like structures were observed (Figure 16).

4. Discussion

The surface of the samples was characterized by traces typical of sandblasting. The surface was characterized by high homogeneity, and its roughness was Sa = 0.396(84) μm and Ra = 0.343(97) μm. The uneven surface coloring is the result of differential light interference after the anodic oxidation process caused by its development (Figure 1-2). Previously conducted research [21] indicates that the topography of the surface of anodically oxidized samples depends on the modification procedures carried out before. Its thickness obtained at an oxidation voltage of 97V is about 200 nm. The obtained value of the wetting angle (Θ = 54⁰) indicates the hydrophilic properties of the surface. Based on the study of Yamamoto et al., it can be concluded that the analyzed surface of Ti6Al7Nb titanium alloy has wettability and surface roughness that should provide good osteoconductive properties [22].
Based on the diffractogram obtained by X-ray phase analysis of the examined Ti6Al7Nb alloy, αTi and βTi phases were identified in the surface layer. Moreover, it was found that there is stress in the layer, and the obtained hardness profile is correlated with the XRD results, indicating strengthening in the subsurface zone. This may confirm that the sandblasting process of the titanium alloy under study strengthens its surface.
The analysis of the potentiodynamic curves did not show any breakdown potential, and the return curve is below the original curve, which demonstrates the resistance of Ti6Al7Nb alloy after anodic oxidation preceded by grinding and sandblasting to pitting corrosion. Moreover, the anodizing of titanium forms an oxide coating that is rather resistant to the attack of chloride ions present in PBS solution [23]. The authors' extensive study [24] of the effect of treatment prior to anodic oxidation on the corrosion resistance of Ti6Al7Nb alloy showed that the layers obtained after sandblasting had the best resistance. The study analyzed the corrosion resistance of the alloy in the initial state as well as after 28-day exposure to Ringer's solution. Complementary tests were carried out on the penetration of metal ions into the corrosive environment.
Analysis of the Ti profile (Figure 8) showed that the main metallic component of the alloy is not dominant on the native surface of the sample (0 min. etching time). There, titanium reached a concentration of about 3% similar to the surface concentration of Al. However, with the penetration depth into the layer, the Ti contribution increased exponentially achieving a stable value of about 15% for the Ar+ etching time in the range 25-130 min. Further depth penetration showed only a gradual increase of titanium content up to a concentration of about 20%. On the other hand, during the robust increase of the Ti content, the aluminum concentration decreased. After 25 min of etching, the Al concentration oscillated around 1-2%. Then, again grew to about 3.5% in depth corresponding to etching of 260-360 min. The niobium concentration was found to be minor compared to the other main alloy components. It remained constant at a value of 0.2% from the native surface to the depth obtained after 160 min etching. For longer etching, Nb content started to gradually increase reaching ~2% for maximal etching time equaled 360 min.
Oxygen was revealed as the main component of the passive layer reaching a concentration of about 60-65% for a depth corresponding to the interval of 4-260 min (Figure 9) Ar+ etching. This value decreased slightly by a few percent in the next 100 min of ion interaction. Only the native surface was characterized by a lower oxygen content (about 45%) caused probably by the presence of excess carbon. The carbon content on the native surface reached almost 34%. This value drastically dropped after only a few minutes of ion etching (to ~10%) and then systematically decreased to about 2% for a maximum etching time of 360 min. The signal from silicon, like from oxygen, showed a lower concentration at the native surface (about 7%) than in the deeper layers of the alloy. It remains constant at around 15% for the entire etching time range.
Phosphorus and calcium showed relatively the highest concentration on the native surface, around 3.5% and 2.5%, respectively (Figure 10). The contribution of these elements gradually disappeared to a depth corresponding to 30 min. of etching. The sulfur profile behaved similarly. It reached a maximum value of about 1% on the native surface and gradually vanished after 35 min. of etching. Sodium was residual at a concentration of about 0.4% on the surface and disappeared after 12 min. of etching. Phosphorus, calcium, sulfur and sodium are residues of the anodic oxidation process (they are present in the electrolyte used). Their presence in the passive layer may promote surface bioactivation by stimulating the formation of hydroxyapatite on the alloy surface [25].
The decomposition of the Ti 2p XPS peak (exemplary window spectrum: inset to Figure 11) revealed the existence of Ti components in metallic form and the 2nd, 3rd, and 4th oxidation states including the spin-orbit splitting of 2p transition (2p3/2 and 2p1/2) equaled 6.1 eV (Figure 11). The asymmetric Ti 2p3/2 component at position 453.1 eV was assigned to Ti(0): metal. The subsequent symmetric Ti 2p3/2 components at BE of 455.2 eV, 457.1 eV, and 458, 5 eV were assigned to Ti(II) in the form of TiO, Ti(III) - Ti2O3 and Ti(IV) as TiO2, respectively [26]. Generally, on the alloy native surface, there was 90% titanium in the form of TiO2. This situation changed drastically within the first minutes of etching when the amount of TiO2 dropped to about 35% of the total titanium content. There, the Ti2O3 and TiO fractions also appeared in 40% and 25% of Ti, respectively. Above 150 min. of etching, an increase in the contribution of titanium in metallic form became noticeable. It reached a value of about 60% of the Ti signal in the 260-360 min. etching range. For this period TiO and Ti2O3 showed a signal of ~15% Ti, while TiO2 had a contribution of ~6%.
Peak Al 2p decomposition revealed the existence of Al components in metallic form (with spin-orbit splitting equaled 0,42 eV [27]) and in 3rd oxidation states (Figure 12). The asymmetric Al 2p3/2 component located at 71.0 eV was attributed to Al(0): metal, whereas the symmetric, wide one at 74.0 eV was assigned to Al(III): Al2O3 [28-29]. From the alloy's native surface to the depth corresponding to ~150 min. of etching, the aluminum exists only in the form of Al2O3. Then, an abrupt decrease of oxide content was observed reaching a level of ~50% of the total Al signal after 200 min. The next 50% was related to Al in the metallic form. The situation was stable up to 360 min of Ar+ sputtering.
Peak Nb 3d decomposition showed the existence of Nb components in metallic form and the 2nd and 5th oxidation states with the spin-orbit splitting of 3d transition (3d5/2 and 3d3/2) equaled 2.7 eV (Figure 13) [27]. The asymmetric Nb 3d5/2 component located at 202.4 eV was attributed to Nb(0): metal [30]. The next symmetric Nb 3d5/2 components at 203.8 eV and 207.9 eV were assigned to Nb(II) in the form of NbO and/or NbC, Nb(V) - Nb2O5, correspondingly [30]. On the alloy native surface and for the very first minute of argon sputtering the niobium signal was on noise level likely due to surface contaminations. For more than 8 min. of etching, the phases of NbO/NbC and Nb2O5 appeared and their amount oscillated around 50% of total Nb content. After 60 min. of Ar treatment, the metallic component appeared. It started to grow up gradually reaching ~70% after 145 min. At the same time, the niobium oxides components’ contribution continuously decreased. Finally, the NbO/NbC input to the Nb signal disappeared after 215 min, Nb2O5 – after 315 min of etching.
The decomposition of the O 1s XPS peak manifested the appearance of four oxygen components (Figure 15). The O1 positioned at 530.3 eV was attributed to metal oxides, and the O2 – at BE = 531.6 eV was assigned to metal oxides’ defects [31-32]. The next one (O3), located at 533.0 eV, originated from carbon-related species C-O, C=O and probably from SiO2 oxide [11,12 ]. The fourth component (O4) at 534.1 eV was related to OH/water bonds [33-34]. On alloy native surface dominates signals from O2 and O3 species (both ~32% of total oxygen content). It corroborated with a significant amount of carbon detected on the alloy surface. There, metal oxides, as well as water phases (O1 and O4, respectively), were evenly on the level of ~18%. But, after 4 min of etching, metal oxide contribution increased suddenly up to ~50% and stayed stable till 85 min of Ar+ sputtering. Then, O1 tended to fall slowly reaching a final value of ~40% for maximum etching time. A similar effect of oxide content decrease within the corresponding alloy depth was observed for titanium, aluminum and niobium (Figure 12-14). The other oxygen components, O2, O3 and O4, within the argon sputtering period of 85-360 min remained stable at the level of approximately 25%, 20% and 15%, respectively.
Tests of the samples showed that the passive layer consists mainly of oxides of alloying elements Ti, Al, Nb, the contribution of which decreases over time as the contribution of metallic elements increases.
Biocompatibility tests allowed to conclude that the analyzed titanium alloy surface does not cause any cytotoxic effect. Moreover, cells of the SaOS-2 line, both in the control group and after incubation with Ti6Al7Nb alloy extracts, did not show any changes in their morphology and organization (Figure 16).

5. Conclusions

The surface layer of the Ti6Al7Nb alloy after sandblasting and anodic oxidation consists mainly of TiO2 oxides, which provides sufficient protection against pitting corrosion. Furthermore, the hydrophilic nature of the surface and the presence of phosphorus and calcium in the layer can promote surface bioactivation and improve osteoconductivity. In addition, the tested surface does not exhibit cytotoxic effects. The presented results indicate the suitability of Ti6Al7Nb alloy modified by sandblasting and anodic oxidation in a sulfuric and phosphoric acid for implant applications in the skeletal system.

Author Contributions

Conceptualization, K.G. and J.S.; methodology,K.G., M.K., L.G., M.G., M.D.; investigation, K.G., M.K., L.G., M.G., A.O., M.B., W.K.; writing—original draft preparation, K.G., J.S.; writing—review and editing, A.T.; supervision, J.S. All authors have read and agreed to the published version of the manuscript.

Funding

This research received no external funding

Data Availability Statement

The data presented in this study are available at the request of the appropriate author. The research results are presented in article, and the data obtained during the test are private.

Conflicts of Interest

The authors declare no conflicts of interest.

References

  1. Geetha, M.; Singh, A.K.; Asokamani, R.; Gogia, A.K. Ti based biomaterials, the ultimate choice for orthopaedic implants – A review. Prog. Mater. Sci. 2009, 54, 397–425. [Google Scholar] [CrossRef]
  2. Yang, J.; Song, Y.; Dong, K.; Han, E.-H. Research progress on the corrosion behavior of titanium alloys. Corros. Rev. 2022, 41, 5–20. [Google Scholar] [CrossRef]
  3. Franco, F. Di, Zaffora A., Santamaria M., Quarto F. Di. Anodization and Anodic Oxides. In: Encyclopedia of Interfacial Chemistry. 2018, 26 – 40.
  4. Sittig, C.; Textor, M.; Spencer, N.D.; Wieland, M.; Vallotton, P.-. .-H. Surface characteristic of implant c.p. Ti Ti-6Al-7Nb and Ti-6Al-4V with different pretreatment. J. Mater. Sci. Mater. Med. 1999, 10, 35–46. [Google Scholar] [CrossRef] [PubMed]
  5. Gepreel, M.A.-H.; Niinomi, M. Biocompatibility of Ti-alloys for long-term implantation. J. Mech. Behav. Biomed. Mater. 2013, 20, 407–415. [Google Scholar] [CrossRef] [PubMed]
  6. Marciniak, J. , Szewczenko J.: Tytan i stopy tytanu. In: Biomateriały. Akademicka Oficyna Wydawnicza, 2013, 166 – 186.
  7. Liu, X.; Chu, P.K.; Ding, C. Surface modification of titanium, titanium alloys, and related materials for biomedical applications. Mater. Sci. Eng. R Rep. 2005, 47, 49–121. [Google Scholar] [CrossRef]
  8. Sobieszczyk, S. Surface modifications of ti and its alloys. Adv. Mater. Sci. 2010, 10. [Google Scholar] [CrossRef]
  9. Izman, S. , Abdul-Kadir M.R., Anwar M., Nazim E.M., Rosliza R., Shah A., Hassan M.A.: Surface Modification Techniques for Biomedical Grade of Titanium Alloys: Oxidation, Carburization and Ion Implantation Processes. In: Titanium Alloys - Towards Achieving Enhanced Properties for Diversified Applications, Dr. A.K.M. Nurul Amin (Ed.), InTech, Avail, 2012.
  10. Niedzielska, I.; Sitek-Ignac, N.; Bąk, M.; Niedzielski, D. Is Allergy to Titanium Bone Fixation Plates a Problem? Coatings 2022, 12, 214. [Google Scholar] [CrossRef]
  11. Lee, B.-H.; Lee, C.; Kim, D.-G.; Choi, K.; Lee, K.H.; Kim, Y.D. Effect of surface structure on biomechanical properties and osseointegration. Mater. Sci. Eng. C 2008, 28, 1448–1461. [Google Scholar] [CrossRef]
  12. Rønold, H.J.; Ellingsen, J.E. Effect of micro-roughness produced by TiO2 blasting—tensile testing of bone attachment by using coin-shaped implants. Biomaterials 2002, 23, 4211–4219. [Google Scholar] [CrossRef]
  13. Martini, D.; Fini, M.; Franchi, M.; Pasquale, V.; Bacchelli, B.; Gamberini, M.; Tinti, A.; Taddei, P.; Giavaresi, G.; Ottani, V.; et al. Detachment of titanium and fluorohydroxyapatite particles in unloaded endosseous implants. Biomaterials 2003, 24, 1309–1316. [Google Scholar] [CrossRef]
  14. Lausmaa, J. w: Brunette D.M., Tengvall P., Textor M., Thomsen P. (Eds. 2001. [Google Scholar]
  15. Citeau, A.; Guicheux, J.; Vinatier, C.; Layrolle, P.; Nguyen, T.P.; Pilet, P.; Daculsi, G. In vitro biological effects of titanium rough surface obtained by calcium phosphate grid blasting. Biomaterials 2005, 26, 157–165. [Google Scholar] [CrossRef]
  16. Barranco, V.; Onofre, E.; Escudero, M.; García-Alonso, M. Characterization of roughness and pitting corrosion of surfaces modified by blasting and thermal oxidation. Surf. Coatings Technol. 2010, 204, 3783–3793. [Google Scholar] [CrossRef]
  17. Diamanti, M.V. , Pedeferri MP.: The Anodic Oxidation of Titanium and Its Alloys. In: Encyclopedia of Interfacial Chemistry, 2018, 41 – 54. [CrossRef]
  18. Wierzchoń, T. , Czarnowska E., Krupa D.: Inżynieria powierzchni w wytwarzaniu biomateriałów tytanowych. Oficyna Wydawnicza Politechniki Warszawskiej, Warszawa, 2004.
  19. Sul, Y.-T.; Johansson, C.B.; Jeong, Y.; Albrektsson, T. The electrochemical oxide growth behaviour on titanium in acid and alkaline electrolytes. Med Eng. Phys. 2001, 23, 329–346. [Google Scholar] [CrossRef]
  20. Wei, D. , Zhou Y., Yang Ch.: Characteristic, cell response and apatite-induction ability of microarc oxidized TiO2-based coating containing P on Ti6Al4V before and after chemical-treatment and dehydration. Ceramics International, 35, 2009, 2545 – 2554.
  21. Szewczenko, J.; Basiaga, M.; Kiel-Jamrozik, M.; Kaczmarek, M.; Grygiel, M. Corrosion Resistance of Ti6Al7Nb Alloy after Various Surface Modifications. Solid State Phenom. 2015, 227, 483–486. [Google Scholar] [CrossRef]
  22. Yamamoto, D.; Kawai, I.; Kuroda, K.; Ichino, R.; Okido, M.; Seki, A. Osteoconductivity and Hydrophilicity of TiO2Coatings on Ti Substrates Prepared by Different Oxidizing Processes. Bioinorg. Chem. Appl. 2012, 2012, 1–7. [Google Scholar] [CrossRef]
  23. Valor, A.; Caleyo, F.; Alfonso, L.; Rivas, D.; Hallen, J. Stochastic modeling of pitting corrosion: A new model for initiation and growth of multiple corrosion pits. Corros. Sci. 2007, 49, 559–579. [Google Scholar] [CrossRef]
  24. Szewczenko, J. : Kształtowanie własności fizycznych i chemicznych warstwy wierzchniej implantów ze stopu tytanu dla traumatologii i ortopedii. Wydawnictwo Politechniki Śląskiej, Gliwice, 2014.
  25. Krasicka-Cydzik, E. : Anodic Layer Formation on Titanium and Its Alloys for Biomedical Application. In: Titanium Alloys: Towards Achieving Enhanced Properties for Diversified, Dr. A.K.M. Nurul Amin (Ed.), InTech, Avail, 2012.
  26. Biesinger, M.C.; Lau, L.W.M.; Gerson, A.R.; Smart, R.S.C. Resolving surface chemical states in XPS analysis of first row transition metals, oxides and hydroxides: Sc, Ti, V, Cu and Zn. Appl. Surf. Sci. 2010, 257, 887–898. [Google Scholar] [CrossRef]
  27. Wagner, C.D. , Naumkin A.V., Kraut-Vass A., Allison J.W., Powell C.J., Rumble J.R. Jr., NIST Standard Reference Database 20, 2003.
  28. Sherwood, P.M.A. Introduction to Studies of Aluminum and its Compounds by XPS. Surf. Sci. Spectra 1998, 5, 1–3. [Google Scholar] [CrossRef]
  29. Hierro-Oliva, M.; Gallardo-Moreno, A.M.; González-Martín, M.L. XPS Analysis of Ti6Al4V Oxidation Under UHV Conditions. Met. Mater. Trans. A 2014, 45, 6285–6290. [Google Scholar] [CrossRef]
  30. Marques, M.; Ferraria, A.; Correia, J.; Rego, A.B.D.; Vilar, R. XRD, XPS and SEM characterisation of Cu–NbC nanocomposite produced by mechanical alloying. Mater. Chem. Phys. 2008, 109, 174–180. [Google Scholar] [CrossRef]
  31. Dupin, J.-C.; Gonbeau, D.; Vinatier, P.; Levasseur, A. Systematic XPS studies of metal oxides, hydroxides and peroxides. Phys. Chem. Chem. Phys. 2000, 2, 1319–1324. [Google Scholar] [CrossRef]
  32. Khan, F.; Baek, S.-H.; Kim, J.H. Influence of oxygen vacancies on surface charge potential and transportation properties of Al-doped ZnO nanostructures produced via atomic layer deposition. J. Alloy. Compd. 2017, 709, 819–828. [Google Scholar] [CrossRef]
  33. Boudou, J.; Paredes, J.; Cuesta, A.; Martı́nez-AlonsoA. ; Tascón, J.M.D. Oxygen plasma modification of pitch-based isotropic carbon fibres. Carbon 2003, 41, 41–56. [Google Scholar] [CrossRef]
  34. Grządziel, L.; Krzywiecki, M. Ambience-related adsorbates on CuPc surface—Photoemission and thermal desorption spectroscopy studies for control of organic electronics degradation processes. Synth. Met. 2015, 210, 141–147. [Google Scholar] [CrossRef]
Figure 1. Surface of Ti6Al7Nb alloy after grinding, sandblasting and anodic oxidation, light microscope.
Preprints 104396 g001
Figure 2. The surface of Ti6Al7Nb alloy after grinding, sandblasting and anodic oxidation, SEM.
Preprints 104396 g002aPreprints 104396 g002b
Figure 3. Topography of sandblasted and anodic oxidized Ti6Al7Nb alloy surface.
Preprints 104396 g003
Figure 4. Ti6Al7Nb alloy surface roughness profile.
Preprints 104396 g004
Figure 5. A drop of water on the surface of the Ti6Al7Nb alloy
Preprints 104396 g005
Figure 7. XRD pattern obtained for Ti6Al7Nb alloy.
Preprints 104396 g007
Figure 8. Example of potentiodynamic curves obtained for Ti6Al7Nb alloy.
Preprints 104396 g008
Figure 9. Concentration profile of Ti6Al7Nb surface as a function of Ar+ etching time for titanium, aluminum and niobium.
Preprints 104396 g009
Figure 10. Concentration profile of Ti6Al7Nb surface as a function of Ar+ etching time for carbon, oxygen and silicon.
Preprints 104396 g010
Figure 11. Concentration profile of Ti6Al7Nb surface as a function of Ar+ etching time for potassium, sulfur, calcium and sodium.
Preprints 104396 g011
Figure 12. Concentration profile of Ti6Al7Nb surface as a function of Ar+ etching time for potassium, sulfur, calcium and sodium.
Preprints 104396 g012
Figure 13. Al 2p signal components’ evolution as a function of Ar+ etching time. Inset: XPS representative Al 2p spectrum with peak fitting for Ti6Al7Nb surface after 175 min. of etching.
Preprints 104396 g013
Figure 14. Nb 3d signal components’ evolution as a function of Ar+ etching time. Inset: XPS representative Nb 3d spectrum with peak fitting for Ti6Al7Nb surface after 175 min. of etching.
Preprints 104396 g014
Figure 15. O 1s signal components’ evolution as a function of Ar+ etching time. Inset: XPS representative O 1s spectrum with peak fitting for Ti6Al7Nb surface after 175 min. of etching.
Preprints 104396 g015
Figure 16. Image of cells: (a) control group; (b) cells subjected to incubation with extracts from Ti6Al7Nb alloy.
Preprints 104396 g016
Table 1. Selected structural parameters determined using Rietveld refinement.
Lattice parameters, ICDD, Å Lattice parameters, calculated, Å Crystallite size, nm Lattice strain, % Compressive stress, MPa
a = 2.951,
c= 4.683
a=2.950
c=4.695
30 0.89 -544(21)
Disclaimer/Publisher’s Note: The statements, opinions and data contained in all publications are solely those of the individual author(s) and contributor(s) and not of MDPI and/or the editor(s). MDPI and/or the editor(s) disclaim responsibility for any injury to people or property resulting from any ideas, methods, instructions or products referred to in the content.
Copyright: This open access article is published under a Creative Commons CC BY 4.0 license, which permit the free download, distribution, and reuse, provided that the author and preprint are cited in any reuse.
Prerpints.org logo

Preprints.org is a free preprint server supported by MDPI in Basel, Switzerland.

Subscribe

© 2024 MDPI (Basel, Switzerland) unless otherwise stated