Submitted:
20 April 2024
Posted:
22 April 2024
You are already at the latest version
Abstract
BACKGROUND AND OBJECTIVE: The use of biomass for cooking carries significant health implications and can lead to adverse environmental issues such as deforestation, greenhouse gas emissions, and erosion. Despite these concerns, there is a lack of information about the nature and extent of cooking emissions in many developing countries. To address this gap, a study was conducted to assess cooking emission levels and their associated health effects among households in Dodoma City, Tanzania.
METHODS: A descriptive cross-sectional design was conducted, involving 285 households in the peri-urban area of Dodoma City, Tanzania. A combination of questionnaires, observational checklists, and sampling devices (Aeroqual series 500 for Carbon Monoxide and Temptop PMD 351 for Particulate Matters) were employed for data collection, adhering to established protocols. Additionally, lung function tests were conducted with consent from the primary household cooks. Collected data were entered into an Excel spreadsheet and analyzed using STATA 17 software.
FINDINGS: Out of 285 participants, 74.7% predominantly use charcoal for cooking, with 68.4% having outdoor kitchen setups. Significant differences in pollutant concentrations were observed across various fuel types (P=0.0001), with firewood emitting higher levels of particulate matter and carbon monoxide. Carbon monoxide concentrations during cooking were 6 times higher for firewood, 5 times higher for charcoal-gas, and 3 times higher for charcoal compared to WHO daily average limits. Additionally, a positive correlation between pollutant concentrations was noted (P-value = 0.0000). Lung problems 17.8% followed by eye irritation 15.7% were mentioned by those who claimed to know the health effects associated with cooking emissions. In addition, the spirometry test indicated that the majority of the participants had % predicted >80 while only 19% had % predicted below 50.
CONCLUSION: Charcoal and firewood remain the primary cooking fuels in the study area despite their significant negative impacts. Our findings highlight a lack of awareness among community members regarding the health effects of biomass cooking emissions and insufficient guidance on constructing healthy kitchens. To address this, enforcing building standards, raising health awareness, and ensuring affordable access to modern fuels are crucial steps. These measures are essential for promoting healthier cooking practices and mitigating the adverse effects on households.
Keywords:
Carbon monoxide
; Cooking energy
; Health effects
; Household air pollution
; and Particulate matter
1. Introduction
Approximately 99% of the global population breathes polluted air that surpasses the air quality standards set by the World Health Organization (World Health Organization, 2024). Global estimations indicate that each year, more than 7 million premature deaths occur as a direct result of air pollution, highlighting the urgent need for comprehensive action to address this pressing public health concern (Lelieveld et al., 2015; Shaddick et al., 2020). Statistical data indicates that in Africa, deaths resulting from household air pollution surpass those from outdoor air pollution by nearly a 2:1 ratio, whereas in developed regions, mortality rates associated with outdoor air pollution exceed those related to indoor air pollution (Ritchie and Roser, 2017; Roy, 2016).
Air pollutants originate from various sources, arising from both natural processes and human activities. These pollutants are categorized based on their emission sources, including gaseous pollutants (such as gases and vapours), suspended particulate matter (PM) (comprising mists, fumes, and smoke), and polycyclic aromatic hydrocarbons (Manisalidis et al., 2020). However, pollutants of major public health concern include particulate matter, Carbon monoxide, Sulfur dioxide, Nitrogen dioxide, and ground-level Ozone (World Health Organization, 2021). About half of the world’s population and around 95% of the population in developing countries still depend on biomass and coal as a source of energy for cooking and heating, also there has been an increase in biomass use for energy particularly in the low-income households (Khoshnevis Yazdi and Khanalizadeh, 2017). The use of firewood and charcoal as a source of energy for cooking is common in the United Republic of Tanzania (Hafner et al., 2020). According to(The United Republic of Tanzania, 2017), reports show that 71% of households use firewood as the source of energy for cooking, followed by charcoal 37.0%, liquefied petroleum gas 7.2 % and kerosene 5.0 %. However, firewood is the most common fuel in rural while charcoal and other fuels are commonly used by the majority of households in urban and peri-urban. Efforts have been undertaken globally to address the existing air pollution problem, including the adoption of stove interventions such as modern stoves equipped with chimneys and enhancing building ventilation. Furthermore, progress has been made towards transitioning away from polluting fuels such as firewood, charcoal, and coal to cleaner alternatives like Liquified Petroleum Gas (LPG), natural gas, and electricity. These initiatives align with the objectives of the United Nations Sustainable Goal 7, which seeks to ensure access to clean energy by 2030.
Apart from the adverse environmental problems attributed to air pollution like greenhouse gas emissions, deforestation, and erosion that result from biomass use, the emissions released during cooking sessions has also health implications (Woolley et al., 2022). When inhaled, the pollutants are known to cause various diseases including lower respiratory infections (LRI) such as pneumonia, chronic obstructive pulmonary disease (COPD); cardiovascular disease, and cancers (Manisalidis et al., 2020; Puzzolo et al., 2024; Qiu et al., 2023; Simkovich et al., 2019). Moreover, it is estimated that 2.9 million premature deaths occur annually worldwide as a result of pollutants released while using biomass for cooking (Carter et al., 2017). Furthermore, according to the Global Burden of Disease Survey, there was a significant increase in premature deaths due to household air pollution from 22,729 in 2013 to 33,070 in 2019 (Roy, 2016; The United Republic of Tanzania, 2019). Despite this burden, in Tanzania like other developing countries information is scarce about the nature and levels of household air pollutants and associated health risks.
Therefore, this study aimed to assess cooking emissions levels and associated health effects among households in Dodoma City, Tanzania. Findings from this study improve the evidence base for implementing public health initiatives regarding energy use for cooking among households.
2. Materials and Methods
2.1. Study Population and Design
This study was conducted in Dodoma City, the city covers 2,769 km2 with a population of 765,179 (The United Republic of Tanzania, 2022). It is located at latitude 6°10'19.96"S and longitude 35°44'22.09" E. Administratively, the city has four divisions which are Kikombo, Hombolo, Dodoma and Zuzu which are further subdivided into forty-one wards. (Figure 1) shows a map of the study area.
A descriptive cross-sectional design with multistage clusters random sampling was employed for this study. About 285 households were randomly selected from five Streets (Mtaa) (the lower administrative unit in the town setting) in the wards located in peri-urban. The selection of peri-urban areas relies on the fact that households in peri-urban use different kinds of sources of cooking energy of interest in this study (The United Republic of Tanzania, 2017). Within this sample, 15 households were monitored for levels of PM (Particulate Matter) and CO (Carbon Monoxide). Among these households, four exclusively used firewood, six utilized charcoals, and three relied on gas as their primary fuel source. Additionally, two households employed a combination of charcoal and gas for their cooking needs.
A detailed questionnaire and observational checklists were used to collect information about perceived health effects and other parameters potentially relevant to indoor air pollution. The administered questionnaire was translated into the Swahili language to enhance the understanding of the respondents. In addition, the main household cook was asked for consent to perform the lung function test. The test was performed under the standard procedures given by the American Thoracic Society (Culver et al., 2017) using the Easyone spirometer on which Forced Expiratory Volume, Forced Vital Capacity and Peak Expiratory Flow rate were measured. The height, weight, blood pressure and age of the participants were also determined before spirometry.
The cooking places were classified as indoor kitchens with/without partitions, outdoor enclosed kitchens, outdoor semi-enclosed kitchens, and open-air kitchens. As it’s illustrated in supplemental materials Figure S2, an indoor kitchen with no partition was a type of kitchen whereby cooking practices took place in one of the living rooms. The indoor kitchen with partition was the type of kitchen in which the stove/ cooking activities took place in a specially allocated room within the main house. The outdoor enclosed kitchen was the one where the kitchen room was located outside the main house and with an enclosed structure. The outdoor semi-enclosed kitchen was the type of kitchen located outdoors with semi-enclosed structure for instance one/two sides wall with/without roof materials.
We used Temptop PMD351(Temptop, 2021) and Aeroqual series 500 devices (Handheld portable and real-time air quality monitors) for monitoring of PM and CO respectively. These devices have been used in previous studies (Kumar et al., 2022; Mohammed, 2023; Remington et al., 2022). Aeroqual series 500 can measure up to 30 pollutants (AEROQUAL, 2022) by using different sensors but as per our objectives, only the CO sensor head was employed. Moreover, temperature and relative humidity were also monitored using this device (Wang et al., 2021). All devices were calibrated and other user calibrations were carried out as per the device’s manual of operation. The monitoring activity took place between August 12, 2023, and October 16, 2023. A total of 15 households were monitored, each being observed for four days. Measurements were done during the preparation of lunch and dinner of which the devices were allowed to run 15 minutes before and after preparations of the food. During sampling, instruments were placed 3 inches apart at the average adult breathing height of 150 cm and 150cm away from the cook/stove (Chowdhury et al., 2012; Kumar et al., 2022). The logging of data in both devices was at a rate of one minute. Consent to monitor was usually obtained from a head of household the previous day and the cooking times were determined at the beginning of the day to facilitate scheduling of the monitoring. Also, sampling records were taken about the type of fuel that was used at the time, cooking style, type of food that was prepared, number of kitchen occupants, total time spent in the kitchen, observed health symptoms, and management of smoke. Figure 2 shows the positioning of air quality samplers in a study field.
Ethical clearance with IRB no. UI/EC/23/0255 was obtained before study from the University of Ibadan. This study was also ethically certified by the Tanzanian National Institute of Medical Research (NIMR). Moreover, before data collection, the local government authorities of the study area were well informed.
2.2. Statistical Analysis
Each household involved in the study received a unique identification number. Questionnaire responses were recorded and entered into an Excel spreadsheet. Air quality monitor and spirometer data were retrieved via USB connections and manufacturer software. Analysis was performed using STATA version 17. Descriptive statistics and graphical representations were used to summarize data, with continuous variables presented as both mean and standard deviation or median and interquartile range (IQR). Inferential statistics included the Kruskal-Wallis test, Wilcoxon signed-rank test, and Spearman rank correlation were used to test for the association.
3. Results
3.1. Demographic Characteristics
The majority of the household heads were in the age group of 15-62 years old while the least group represented by those with 94 years old and above was only 0.35%. Also, more than half of all heads of households were male and married. Around half of selected households had at least one under-five-year-old child with a mean age of 2.4 years ±1.199. It was found that around half of all respondents had attained primary education level while only 14.9% had attained secondary school and above. 82.1% of respondents were self-employed and the average household’s monthly income for the majority was below 300,000 Tanzanian shillings.
3.2. Fuel Use Patterns
Regarding fuel use, as shown in Table 1, the majority of respondents were using charcoal for cooking but none of the respondents depended on kerosene/animal waste. Also, most of the respondents had an energy mix with charcoal playing a big role. Only less than one per cent of respondents accessed the cooking energy through charity (being brought by relatives) but the majority of them used to access it through either buying from vendors or fetching directly from the nearby forests and the fetching time ranged between 40 minutes to 8 hours. Supplemental materials Figure S1 shows the storage of fetched firewood in the household. The monthly household’s income influenced primary cooking energy (P-value=0.0001), respondents spent per meal on average 560, 600, and 400 Tanzania shillings for buying charcoal, firewood and gas respectively. About 60.98% of respondents had electricity as the source of energy for lighting while the least group 2.787% used kerosene. Other sources were solar, flashlights on their mobile phones and normal flush light torches.
3.3. Cooking Practices
In our study, the kitchens for the large group about 68.4% were located outdoors in either an enclosed room, semi-enclosed structures, or open air. About 55.3% of kitchens had their walls constructed using mud while few were made up of grass/leaves/cloths. Also, about 97.8% of kitchens had their roof materials made of metal sheets. All the kitchens in this study were using natural ventilation. Also, 88.3% of enclosed kitchens had at least one window while the remaining had none. Table 2 stipulates the kitchen’s dimensions. Figure 3 shows the field pictures of kitchen and stove designs. The traditional three-stone stoves were common among firewood users. Charcoal stoves were commonly made of either round metal barriers or metal casing with inner ceramic liners. Gas users had either two plate stoves or one plate stove commonly placed on a table or the floor.
The cooking activities in about 98.25% of the households were conducted by females. Also, as stipulated in Figure 4, the number of kitchen occupants during cooking was reported to reach up to 4 people. The majority were frequently using the steaming method and the remaining were using the frying method. Ugali (stiff porridge) and rice were the common foods prepared. Cooking of ugali for instance involves boiling water, adding maize/millet flour, and mashing the solid mix until it is well cooked. Moreover, the preparation of stew involved both frying for a few minutes and steaming. The number of meals prepared per day ranged between 1 to 3 also, the meal preparation time ranged between 15 minutes to 180 minutes. The cooking activity started with lighting of the stove of which the use of small pieces of wood, grasses/leaves and plastics to help the process was common among firewood and charcoal users. After the cooking session was done the heating of water for bathing was common among households, particularly during the preparation of dinner.
3.4. Pollutant Concentration and Their Variability
Results show that the median temperature was 28.6⁰C (P-value < 0.05) while the average relative humidity was 40.6% (P-value > 0.05). There was a statistically significant difference in the concentration of pollutants among different types of fuel (Kruskal-Wallis rank test P-value=0.0001). Moreover, as stipulated in Figure 5, the concentrations were significantly higher (Wilcoxon sign rank test P-Values <0.05) during the cooking session and dropped after the session. When the cooking session was going on, firewood had the highest average concentration of CO about 36.04527ppm while gas had the lowest average concentration of 2.666853ppm. Moreover, firewood had the highest median concentration of TSP, PM10, PM4, PM2.5, and PM1 about 115.3 µg/m3 (379.9), 192.5 µg/m3 (496.8), 159.8 µg/m3 (265.8), 113.2 µg/m3 (133.4), and 65.4 µg/m3(65.8) respectively.
Furthermore, the peak concentrations of PM across all types of fuels and kitchens were found to be in the order of PM1<PM2.5<PM4<PM4<PM10<TSP. The maximum levels of pollutants were relatively low in the outdoor open-air kitchen. Moreover, there was a positive correlation between concentrations among pollutants, and temperature but a negative correlation between particulate matter and relative humidity as shown in Supplemental materials (Figure S3) and (Table S1).
Other potential sources of exposure to air pollutants were also determined. It was found that about 12.98% of all respondents reported having at least one member of the family who is a cigarette smoker. Also, 37.89% of all respondents reported the burning of coils/tabs for repelling mosquitoes. Additionally, about 30.18% of all respondents had open-fire trash burning near the house.
3.5. Health Effects of Exposure to Household Air Pollutants
In this study, participants were asked if they thought that the cooking fuel emissions had any health effects. The majority 71.93% knew that there were health effects, 18.95% didn’t know and 9.12% said there was no health effect. Health effects mentioned by those who knew included Chest pain 7.7%, eye irritation 15.7%, lung problems 17.8%, Chest tightness 0.7%, coughing 11.5%, headache 2.8%, shortness of breath 2.1%, watery eyes 0.7%, Sneezing 0.3%, Suffocation 1.4%, TB 0.7%, Nose Irritation 0.35%, Blood and body water loss 0.35%, and Liver problems 0.35%.
As it’s shown in Figure 6 Watery eyes, coughing and headache were signs commonly experienced by users of both firewood and charcoal. On the other hand, gas users reported no health symptoms during cooking sessions. As stipulated in Table 3 below firewood users reported more health symptoms than users of other fuels in the last 12 months. 68% of all wheezing cases experienced wheezing/whistling when they did not have a cold/flu, also the majority had shortness of breath when the wheezing noise was present. Moreover, the majority of those who had ever experienced an attack of shortness of breath, the attack came on during the daytime when at rest. The coughing cases were commonly reported among the main household’s cooks and children while in few were other members of the family. Among all coughing cases, only around 30% had coughing accompanied by rapid breathing. Apart from, the main household cook other family members particularly children were reported to have this health.
3.6. Lung Function Status of Study Participants
About 97 participants consented to Spirometry among those 60 participants were excluded after screening due to some contraindications. The mean age of participants who took part in the lung function testing was 49±18.6 years. The mean weight was 61.1±15.5 kg while the mean height was 152±13.7cm. The mean FEV1 (L) value among subjects was 1.619 ± 0.711 and ranged from 0.29 to 2.83. The majority of participants had observed values below the predicted (expected) values. Moreover, the majority of participants had % predicted >80 while only 19% had % predicted below 50 as shown in Table 4.
4. Discussion
In this cross-sectional study, we observed significant differences in pollutant concentrations across various fuel types, with firewood emitting higher levels of particulate matter and carbon monoxide. Carbon monoxide concentrations during cooking were higher for firewood, compared to WHO daily average limits. Health effects mentioned by those who knew included lung problems followed by eye irritation. In addition, the spirometry test indicated that the majority of the participants had a percentage predicted greater than eight.
4.1. Fuels Use Patterns
The study findings revealed diverse fuel usage patterns, aligning with prior reports. Urban households primarily consumed charcoal (79%), followed by firewood (28%) and LPG (20%) (Ishengoma and Igangula, 2021). Similar trends were observed in Rwanda (Woolley et al., 2022) where 75% of participants favoured charcoal. Notably, no respondents in this study relied on kerosene or animal waste, diverging from Nigerian findings (Mbanya and Sridhar, 2017) where kerosene ranked second after firewood. National policies favouring cleaner fuels have led to a decline in kerosene usage (Doggart et al., 2020) from 42% in 2001 to 3% in 2018. Despite abundant firewood access initially, urban expansion has led to scarcity, prompting the use of less preferred, smokier species like Mapululu. This parallels findings in Nepal (Dahal and Parajuli, 2020) and Kenya (Jung and Huxham, 2018) where various tree species were utilized for firewood.Escalating biomass scarcity forces low-income households to resort to high-polluting alternatives like plastics, exacerbating health risks. Significant time investments in firewood collection, up to 8 hours per trip, pose economic and social burdens, particularly for women and children. Some households supplement income by selling firewood, complicating efforts to transition to alternative fuels. Cooking energy selection hinges on financial capacity, accessibility, and food type, with concerns about LPG safety and refill costs inhibiting its widespread adoption. Respondents favoured firewood due to its accessibility, affordability, quick cooking, and flavour enhancement, consistent with findings in Nepal. Despite increased electricity access (64.8%), electric stove usage remains negligible (<1%) due to high operational costs, reinforcing the persistence of fuel stacking patterns.
4.2. Cooking Practices
Cooking practices and kitchen conditions were also investigated altogether have a significant contribution to emission levels. Similarly to what was observed in Rwanda (Woolley et al., 2022), the majority had outdoor kitchens. The use of outdoor open-air or semi-enclosed kitchens poses a risk of shifting the cooking activity from outside to inside, particularly during unfavourable weather conditions. Altogether the habit of cooking indoors in a living room increases the chance of other family members apart from the main cook getting exposed to the emissions. A study conducted in China (Zhang and Smith, 2007) pointed out that room layout/house structure can significantly affect temporal and spatial distributions of pollutant concentrations within a household. Moreover, the decision to cook inside the main house made by the majority of charcoal and gas users in this study is casually influenced by the relatively low smoke level produced by these kinds of fuels compared to firewood. However, the absence of smoke doesn’t mean that there are no other invisible emissions emitted from the fuel hence it is important to keep on maintaining the ventilation of the room. The use of natural ventilation as the only option in this study differs from the observation (Kumar et al., 2022) made in twelve global cities in which mechanical ventilation was found in some home kitchens. The absence of modern firewood stoves in this study might be influenced by the low coverage of Improved cooking stove projects in a region implemented by several development partners within the country. The great variation in dimensions of the kitchen among households observed among participants of this study is evidence of lacking of proper guidelines on designing of kitchen and its location.
In this study females either mother/wife, elder daughter, or household maid were highly engaged in the cooking activities. This is because traditionally in developing countries cooking is exclusively done by women and it occupies up to 50% of women’s daily duties compared to other family members (Bwenge, 2011). Also, apart from the main household’s cooks, others may accompany him/her during cooking sessions. The reasons for the occupancy of non-cook were waiting for food, nursing, visitation, and helping with cooking activities. This implies that non-cooks get exposed to the emissions, hence promoting clean cooking in the household not only saves the main cook but also other members of the family.
4.3. Pollutant Concentration and Their Variability
Supported by (Balakrishnan et al., 2013) in India, pollutant levels in our study varied across types of cooking fuel. The concentration of CO emitted by firewood is similar to what was observed in Nepal (Sapkota et al., 2010) and Kenya (Jung and Huxham, 2018). According to (World Health Organization, 2021) the CO daily permissible limit is 7 mg/m3. In our study, the average concentration of carbon monoxide among firewood, Charcoal-gas, and Charcoal during cooking sessions was above the WHO daily average by 6, 5, and 3 folds respectively. However, the concentration of gas was below the WHO limits.
As already shown, in the study, it was found that firewood emitted a relatively high concentration of PM10 which is similar to (N. Mbanya and K. C. Sridhar, 2017) in Ibadan whereby Wood users were exposed to significantly higher levels of PM10 during the cooking time (1640 µg/m3) than charcoal users (1159µg/m3) and users of modern fuels (LPG and electricity) (300µg/m3). (Kilabuko et al., 2007) in Bagamoyo showed that firewood had experienced the episodic peak concentration of PM10 which varied from 3200 to 10000µg/m3. These levels were very high compared to the findings of this study because the measurement was taken in rural settings and the dimensions of the kitchens and fuel use practices might differ from the peri-urban settings of this study. The peak concentration of PM2.5 emitted by firewood was not similar to what was reported by (Sapkota et al., 2010) in Nepal whereby the concentration of PM2.5 among firewood users was up to 850 µg/ m3. These differences in concentrations might be attributed to differences in the wood species that were used in these studies. In another study (Kumar et al., 2022) which involved global cities the peak concentration of PM2.5 was high among charcoal (200 µg/m3 ) followed by gas users (150 µg/m3) which is similar to the findings of this study.
(World Health Organization, 2021) recommends permissible level of 25 µg/m3 and 50 µg/m3 as a daily average for PM2.5 and PM10 respectively. While Gas and charcoal emitted the concentrations of PM10 and PM2.5 which were below WHO daily exposure average limit, the firewood emitted the concentration which was almost 4 and 5 times higher respectively. However, during frying/ when there was pollution from the outdoor environment the peak concentrations in households using LPG and charcoal were above the standards. This is also supported by (Kumar et al., 2022) which showed that the cooking method and type of food prepared influence the amount of particulates released in the air. For instance, grilling, deep or shallow frying, stir-frying, roasting, and charbroiling vary in levels of emission of particulate matter (Apte and Salvi, 2016). Additionally, the type of food prepared for instance the meat, the type of oil used for cooking, and the amount of fat in the meat also influence the levels of the emissions.
Having gas as a second leading after firewood with higher peak concentrations of TSP and PM1 in the study is not similar to (Tiwari et al., 2013), the tests revealed the order of poor air quality being high in firewood and least in the LPG. This is because compared to experimental studies performed under controlled conditions, other conditions like the contribution of outdoor air conditions to indoor air quality in field studies might lead to poor air quality even when relatively cleaner fuels are used. Additionally, the fact that other sources of exposure to pollutants were mentioned apart from household cooking fuel use, means that any intervention which focuses on clean cooking could reduce the burden of exposure to pollutants.
4.4. Health Effects of Exposure to Household Air Pollutants
Results show that most of the mentioned effects are short-term, which means that respondents had low knowledge of other effects like heart diseases, stroke, stillbirth etc. as suggested in other studies (Kumar et al., 2022). Those who said no health effects had a concern that they had been using biomass for their whole life and thought that not being hospitalized/ having serious symptoms during cooking sessions meant that biomass use was safe. This establishes a need for community health awareness of the long-term effects of biomass emissions as other studies suggest the significant role of cumulative exposure on associated health impacts (Kumar et al., 2022). The symptoms experienced by participants of this study are supported by similar symptoms reported in Nigeria (N. Mbanya and K. C. Sridhar, 2017) and Bagamoyo (Kilabuko et al., 2007).
4.5. Lung Function Status of Study Participants
This is similar to what was reported in the study (Ana et al., 2013) conducted in Ibadan which assessed exposure to emissions from firewood cooking stoves and the pulmonary health of women. Moreover, the majority of participants had % predicted >80 while only 19% had % predicted below 50. This means that the last group of participants had severe obstruction while the majority had normal respiratory passage (Moore, 2012).
The findings from this study provide a baseline and reveal opportunities to reduce exposure to in-kitchen air pollution. The study area has given an important mixture of data which might be applicable in both urban and rural areas.
In this study, the small sample size for in-kitchen air quality monitoring is the main limitation and this was because of limited available resources in terms of time and devices to capture a large number of households. However, to make sure that the objectives of this study were met, households were purposively selected by critical considerations of factors that affect the levels of pollutants to be monitored to get findings from households with varying characteristics.
5. Conclusions
The results of this study reveal that firewood (utilized in three-stone fires) and charcoal remain the predominant sources of cooking energy in the study area, despite their significant adverse environmental, social, and health consequences. Moreover, the study highlights a concerning lack of awareness regarding the detrimental effects of biomass cooking emissions, coupled with a dearth of guidance on constructing safe and healthy kitchen environments. Therefore, responsible authorities prioritize the enforcement of building standards, devise strategies to enhance access to modern fuel alternatives, and intensify community health education efforts regarding the short- and long-term impacts of cooking emissions. These measures are essential for promoting healthier cooking practices, mitigating environmental degradation, and safeguarding public well-being in the study area and beyond.
Supplementary Materials
The following supporting information can be downloaded at the website of this paper posted on Preprints.org.
Authors Contribution
M.Y. Mkunda helped in the design of the study, collection and analysis of data, creation of study reports and writing of manuscript. G. Anna, and A.V. Ngowi research advisors, reviewing and editing the manuscript. J. Bachwenkizi participated in the data collection process, reviewing and editing the manuscript.
Conflicts of Interest
The authors declare that they have no known competing financial interests or personal relationships that could have appeared to influence the work reported in this paper.
Acknowledgments
The authors wish to thank Dr Honest Emanuel Anicetus from the Tanzania Ministry of Health, Ms. Kunda Sichele Sikazwe from the Tanzania Industrial Development Organization (TIRDO), and the Local government authority of the study area for the support and cooperation which was given leading to the accomplishment of this work. Funding for this research was provided by the African Union Commission through the Pan African University Life and Earth Sciences Institute (Including Health and Agriculture), Ibadan, Nigeria.
Abbreviations
| CO | Carbon monoxide |
| PM1 | Particulate matter of less than 1 µm in mean aerodynamic diameter |
| PM2.5 | Particulate matter of less than 2.5 µm in mean aerodynamic diameter |
| PM4 | Particulate matter of less than 4 µm in mean aerodynamic diameter |
| PM10 | Particulate matter of less than 10 µm in mean aerodynamic diameter |
| TSP | Total Suspended Particles |
| WHO | World Health Organization |
| < | Less than |
| % | Per cent |
References
- AEROQUAL. (2022). Series 500. Aeroqual Support Center. https://support.aeroqual.com/c/Series_500_handheld (accessed 3.11.2023).
- Ana, G., Adeniji, B., Ige, O., Oluwole, O., & Olopade, C. (2013). Exposure to emissions from firewood cooking stove and the pulmonary health of women in Olorunda community, Ibadan, Nigeria. Air Quality, Atmosphere & Health, 6(2), 465–471. [CrossRef]
- Balakrishnan, K., Ghosh, S., Ganguli, B., Sambandam, S., Bruce, N., Barnes, D. F., & Smith, K. R. (2013). State and national household concentrations of PM2.5 from solid cook fuel use: Results from measurements and modelling in India for estimation of the global burden of disease. Environmental Health, 12(1), 77. [CrossRef]
- Bwenge, N. (2011). The Effects of Adopting Improved Wood Stoves on the Welfare of Rural Women: A Case of Kibaha District in Tanzania. Van Hall Larenstein University of Applied Sciences, Netherlands.
- Carter, E., Norris, C., Dionisio, K. L., Balakrishnan, K., Checkley, W., Clark, M. L., Ghosh, S., Jack, D. W., Kinney, P. L., Marshall, J. D., Naeher, L. P., Peel, J. L., Sambandam, S., Schauer, J. J., Smith, K. R., Wylie, B. J., & Baumgartner, J. (2017). Assessing Exposure to Household Air Pollution: A Systematic Review and Pooled Analysis of Carbon Monoxide as a Surrogate Measure of Particulate Matter. Environmental Health Perspectives, 125(7), 076002. [CrossRef]
- Chowdhury, Z., Le, L. T., Masud, A. A., Chang, K. C., Alauddin, M., Hossain, M., Zakaria, A. B. M., & Hopke, P. K. (2012). Quantification of Indoor Air Pollution from Using Cookstoves and Estimation of Its Health Effects on Adult Women in Northwest Bangladesh. Aerosol and Air Quality Research, 12(4), 463–475. https://doi.org/10.4209/aaqr.2011.10.0161. [CrossRef]
- Culver, B. H., Graham, B. L., Coates, A. L., Wanger, J., Berry, C. E., Clarke, P. K., Hallstrand, T. S., Hankinson, J. L., Kaminsky, D. A., MacIntyre, N. R., McCormack, M. C., Rosenfeld, M., Stanojevic, S., & Weiner, D. J. (2017). Recommendations for a Standardized Pulmonary Function Report. An Official American Thoracic Society Technical Statement. American Journal of Respiratory and Critical Care Medicine, 196(11), 1463–1472. [CrossRef]
- Dahal, A., & Parajuli, I. (2020). Comparative Study On Indoor Air Quality Variation While Burning Different Firewood Species In Gatlang, Rasuwa, Nepal [Preprint]. In Review. [CrossRef]
- Hafner, J. M., Uckert, G., Hoffmann, H. K., Rosenstock, T. S., Sieber, S., & Kimaro, A. A. (2020). Efficiency of Three-Stone Fire and Improved Cooking Stoves using on-farm and off-farm fuels in semi-arid Tanzania. Energy for Sustainable Development, 59, 199–207. [CrossRef]
- Ishengoma, E. K., & Igangula, N. H. (2021). Determinants of household choice of cooking energy-mix in a peri-urban setting in Tanzania. Energy for Sustainable Development, 65, 25–35. [CrossRef]
- Jung, J., & Huxham, M. (2018a). Firewood usage and indoor air pollution from traditional cooking fires in Gazi Bay, Kenya. Bioscience Horizons: The International Journal of Student Research, 11. [CrossRef]
- Jung, J., & Huxham, M. (2018b). Firewood usage and indoor air pollution from traditional cooking fires in Gazi Bay, Kenya. Bioscience Horizons: The International Journal of Student Research, 11. [CrossRef]
- Khoshnevis Yazdi, S., & Khanalizadeh, B. (2017). Air pollution, economic growth and health care expenditure. Economic Research-Ekonomska Istraživanja, 30(1), 1181–1190. [CrossRef]
- Kilabuko, J., Matsuki, H., & Nakai, S. (2007). Air Quality and Acute Respiratory Illness in Biomass Fuel using homes in Bagamoyo, Tanzania. International Journal of Environmental Research and Public Health, 4(1), 39–44. [CrossRef]
- Kumar, P., Hama, S., Abbass, R. A., Nogueira, T., Brand, V. S., Wu, H.-W., Abulude, F. O., Adelodun, A. A., Anand, P., Andrade, M. de F., Apondo, W., Asfaw, A., Aziz, K. H., Cao, S.-J., El-Gendy, A., Indu, G., Kehbila, A. G., Ketzel, M., Khare, M., … Shiva Nagendra, S. M. (2022a). In-kitchen aerosol exposure in twelve cities across the globe. Environment International, 162, 107155. [CrossRef]
- Kumar, P., Hama, S., Abbass, R. A., Nogueira, T., Brand, V. S., Wu, H.-W., Abulude, F. O., Adelodun, A. A., Anand, P., Andrade, M. de F., Apondo, W., Asfaw, A., Aziz, K. H., Cao, S.-J., El-Gendy, A., Indu, G., Kehbila, A. G., Ketzel, M., Khare, M., … Shiva Nagendra, S. M. (2022b). In-kitchen aerosol exposure in twelve cities across the globe. Environment International, 162, 107155. [CrossRef]
- Lelieveld, J., Evans, J. S., Fnais, M., Giannadaki, D., & Pozzer, A. (2015). The contribution of outdoor air pollution sources to premature mortality on a global scale. Nature, 525(7569), Article 7569. [CrossRef]
- Manisalidis, I., Stavropoulou, E., Stavropoulos, A., & Bezirtzoglou, E. (2020). Environmental and Health Impacts of Air Pollution: A Review. Frontiers in Public Health, 8, 14. [CrossRef]
- Mbanya, V. N., & Sridhar, M. K. C. (2017). PM10 Emissions from Cooking Fuels in Nigerian Households and Their Impact on Women and Children. Health, 9(13), Article 13. [CrossRef]
- Mohammed, M. O. A. (2023). Surface Microbial Contamination and Air Quality before and after Regular Cleaning Procedures. Atmosphere, 14(2), Article 2. [CrossRef]
- Moore, V. C. (2012). Spirometry: Step by step. Breathe, 8(3), 232–240. [CrossRef]
- N. Mbanya, V., & K. C. Sridhar, M. (2017). Emissions from Cooking Fuels in Nigerian Households and Their Impact on Women and Children. Health, 09(13), 1721–1733. [CrossRef]
- Puzzolo, E., Fleeman, N., Lorenzetti, F., Rubinstein, F., Li, Y., Xing, R., Shen, G., Nix, E., Maden, M., Bresnahan, R., Duarte, R., Abebe, L., Lewis, J., Williams, K. N., Adahir-Rohani, H., & Pope, D. (2024). Estimated health effects from domestic use of gaseous fuels for cooking and heating in high-income, middle-income, and low-income countries: A systematic review and meta-analyses. The Lancet Respiratory Medicine, 0(0). [CrossRef]
- Qiu, X., Jin, J., He, R., & Zhang, C. (2023). Do solid fuels for cooking lead to an increased prevalence of respiratory disease? Empirical evidence from rural China. Energy for Sustainable Development, 74, 297–308. [CrossRef]
- Remington, W. D., Ott, B. C., & Hartka, T. R. (2022). Effectiveness of barrier devices, high-volume evacuators, and extraoral suction devices on reducing dental aerosols for the dental operator: A pilot study. Journal of the American Dental Association (1939), 153(4), 309-318.e1. [CrossRef]
- Ritchie, H., & Roser, M. (2017). Air Pollution. Our World in Data. https://ourworldindata.org/air-pollution.
- Roy, R. (2016). The cost of air pollution in Africa. OECD. [CrossRef]
- Sapkota, A., Shrestha, S., Khanal, S. N., & Cogo, A. (2010). Indoor Air Quality and its Health Impacts in Thame, Sagarmath National Park, Nepal. Linnaeus Eco-Tech, 1073–1081. [CrossRef]
- Shaddick, G., Thomas, M. L., Mudu, P., Ruggeri, G., & Gumy, S. (2020). Half the world’s population are exposed to increasing air pollution. npj Climate and Atmospheric Science, 3(1), Article 1. [CrossRef]
- Simkovich, S. M., Goodman, D., Roa, C., Crocker, M. E., Gianella, G. E., Kirenga, B. J., Wise, R. A., & Checkley, W. (2019). The health and social implications of household air pollution and respiratory diseases. NPJ Primary Care Respiratory Medicine, 29(1), 12. [CrossRef]
- Temptop. (2021). Temtop PMD 351 Aerosol Monitor Handheld Particle Counter, PM1.0, PM2.5, PM4.0, PM10, TSP Monitor, With USB or RS-232 Communication Type. Temtop. https://www.temtop.co.uk/products/pmd-351.
- The United Republic of Tanzania. (2017). Energy Access Situation Report (Tanzania mainland).
- The United Republic of Tanzania. (2019). Health and Pollution Action Plan.
- The United Republic of Tanzania. (2022). Administrative Units Population Distribution Report.
- Tiwari, M., Sahu, S. K., Bhangare, R. C., Ajmal, P. Y., & Pandit, G. G. (2013). Estimation of polycyclic aromatic hydrocarbons associated with size-segregated combustion aerosols generated from household fuels. Microchemical Journal, 106, 79–86. [CrossRef]
- Wang, P., Xu, F., Gui, H., Wang, H., & Chen, D.-R. (2021). Effect of relative humidity on the performance of five cost-effective PM sensors. Aerosol Science and Technology, 55(8), 957–974. [CrossRef]
- Woolley, K. E., Bartington, S. E., Thomas, G. N., Pope, F. D., Muhizi, A., Mugabe, C., Ahishakiye, O., Kabera, T., & Greenfield, S. M. (2022). Women’s Perceptions and Attitudes to Household Air Pollution Exposure and Capability to Change Cooking Behaviours in Urban Rwanda. Sustainability, 14(3), 1608. [CrossRef]
- World Health Organization. (2021). WHO global air quality guidelines: Particulate matter (PM2. 5 and PM10), ozone, nitrogen dioxide, sulfur dioxide and carbon monoxide. World Health Organization.
- World Health Organization. (2024). Ambient (outdoor) air pollution. https://www.who.int/news-room/fact-sheets/detail/ambient-(outdoor)-air-quality-and-health.
- Zhang, J. (Jim), & Smith, K. R. (2007). Household Air Pollution from Coal and Biomass Fuels in China: Measurements, Health Impacts, and Interventions. Environmental Health Perspectives, 115(6), 848–855. [CrossRef]
Figure 1.
A map showing a study area2.2 Exposure assessment.
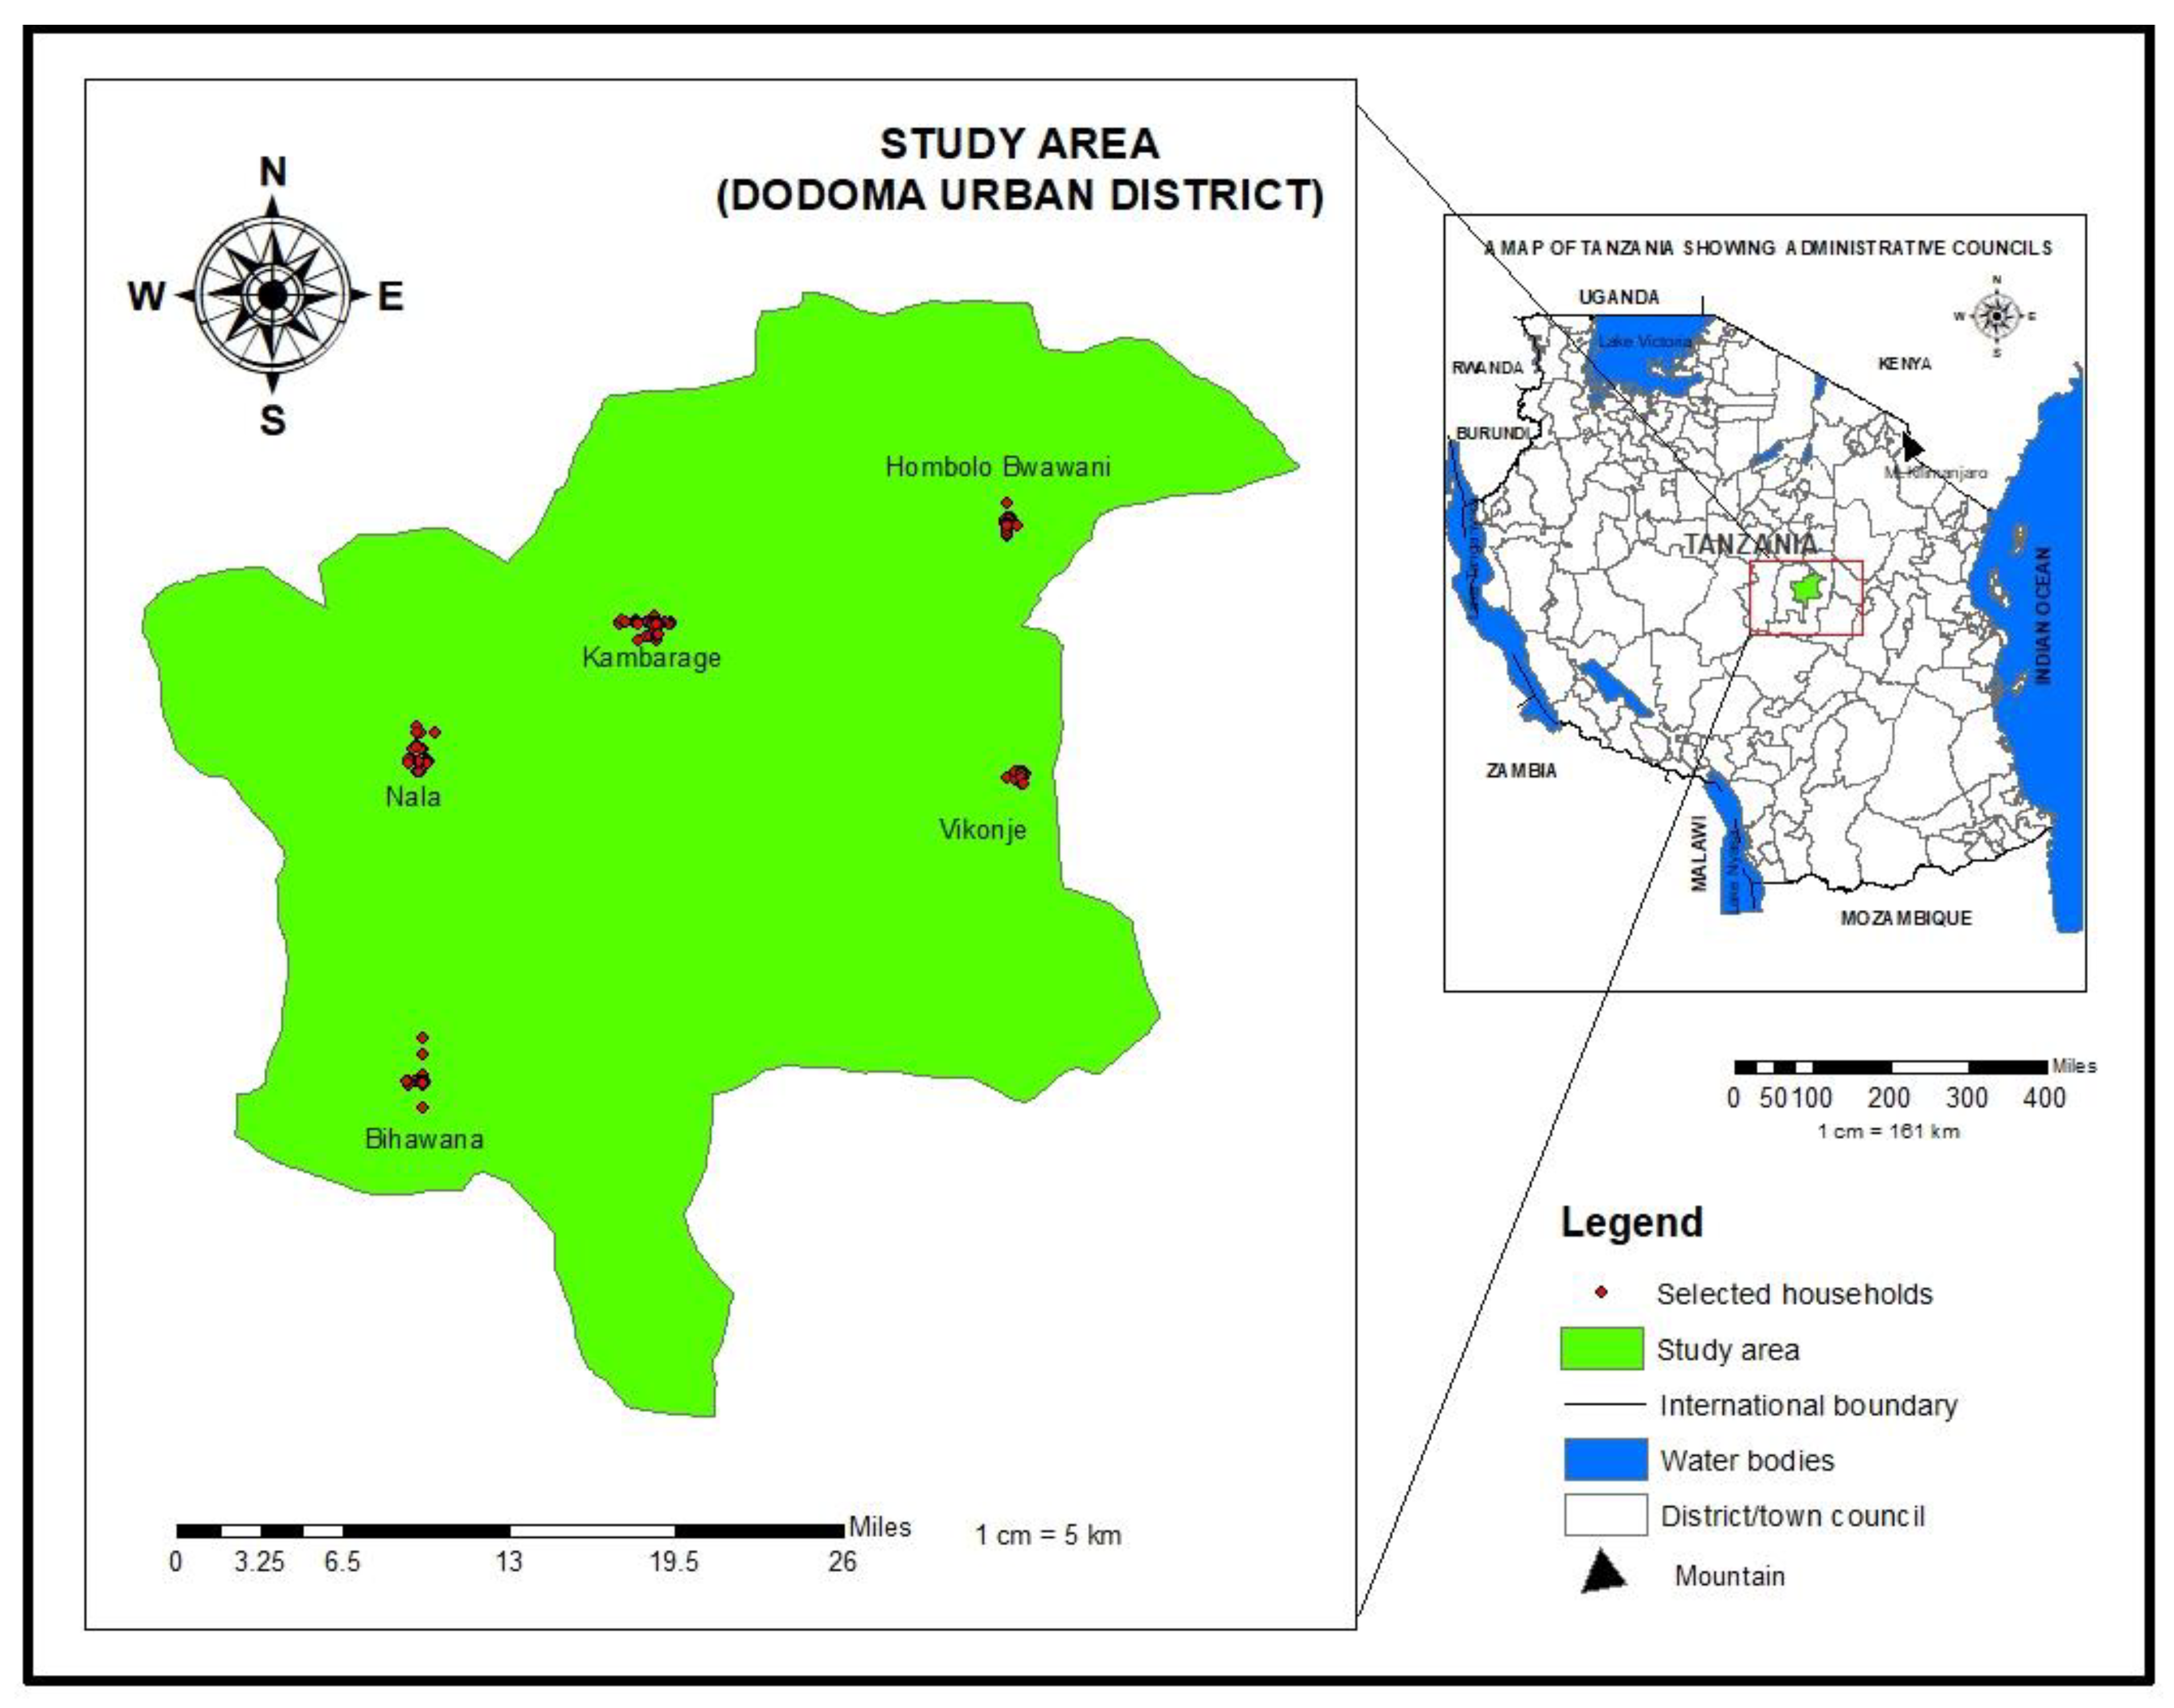
Figure 2.
Positioning of air quality sampler.
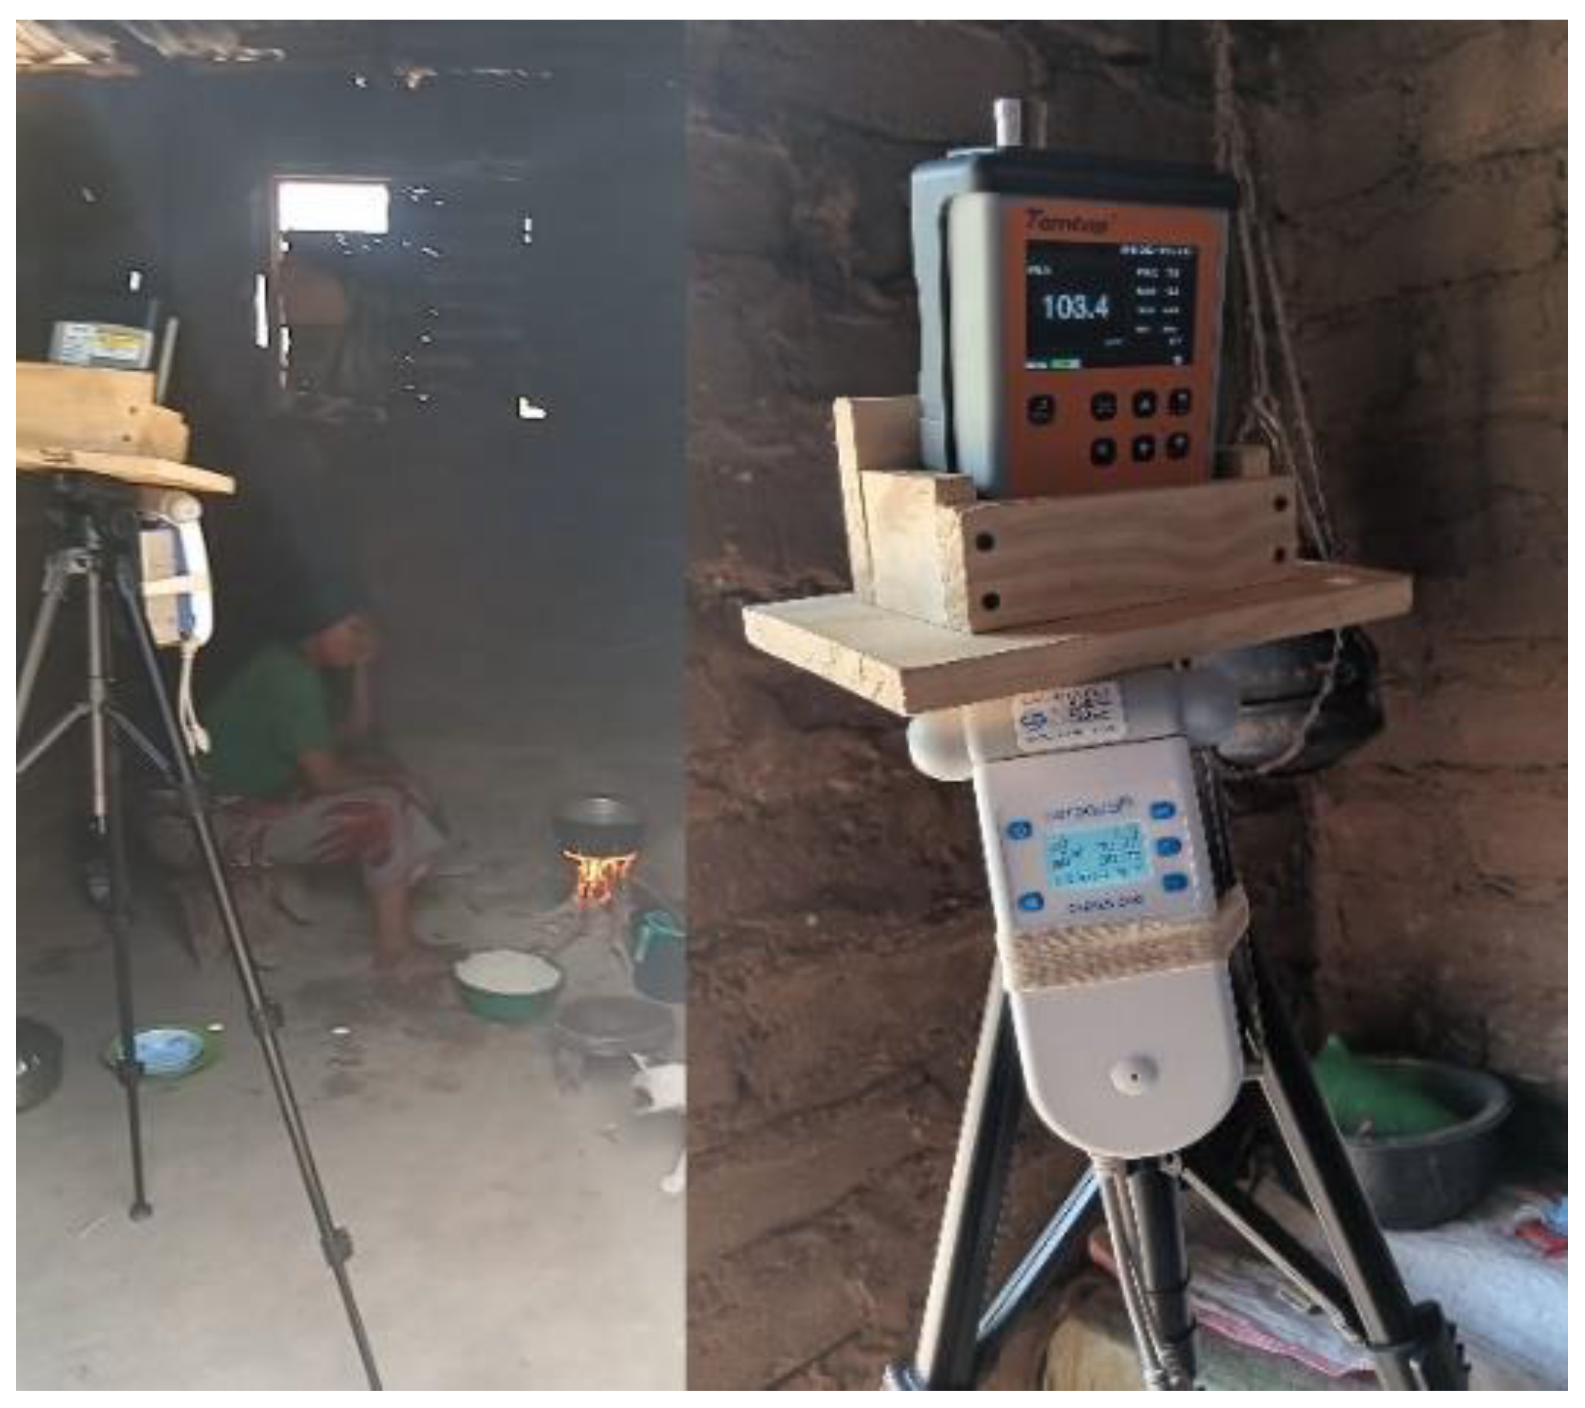
Figure 3.
Field picture showing Kitchen’s and stove’s designs.
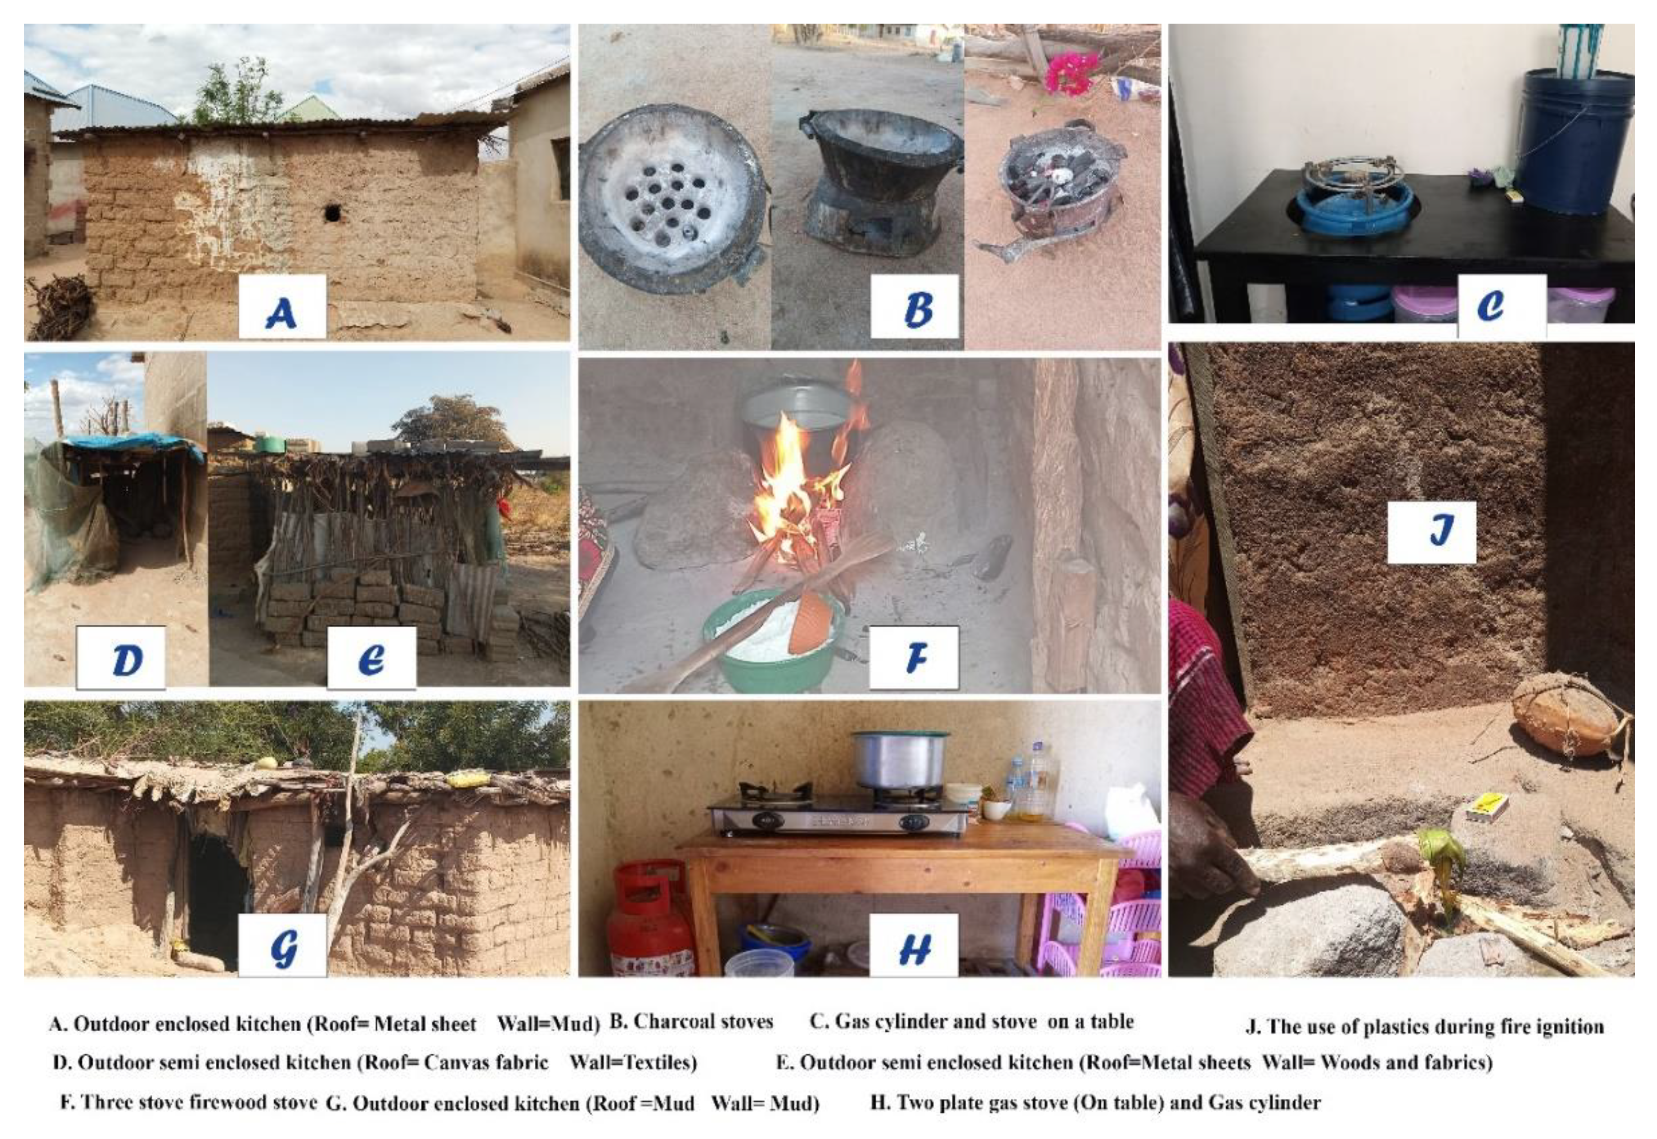
Figure 4.
Family size and kitchen occupants during cooking session.
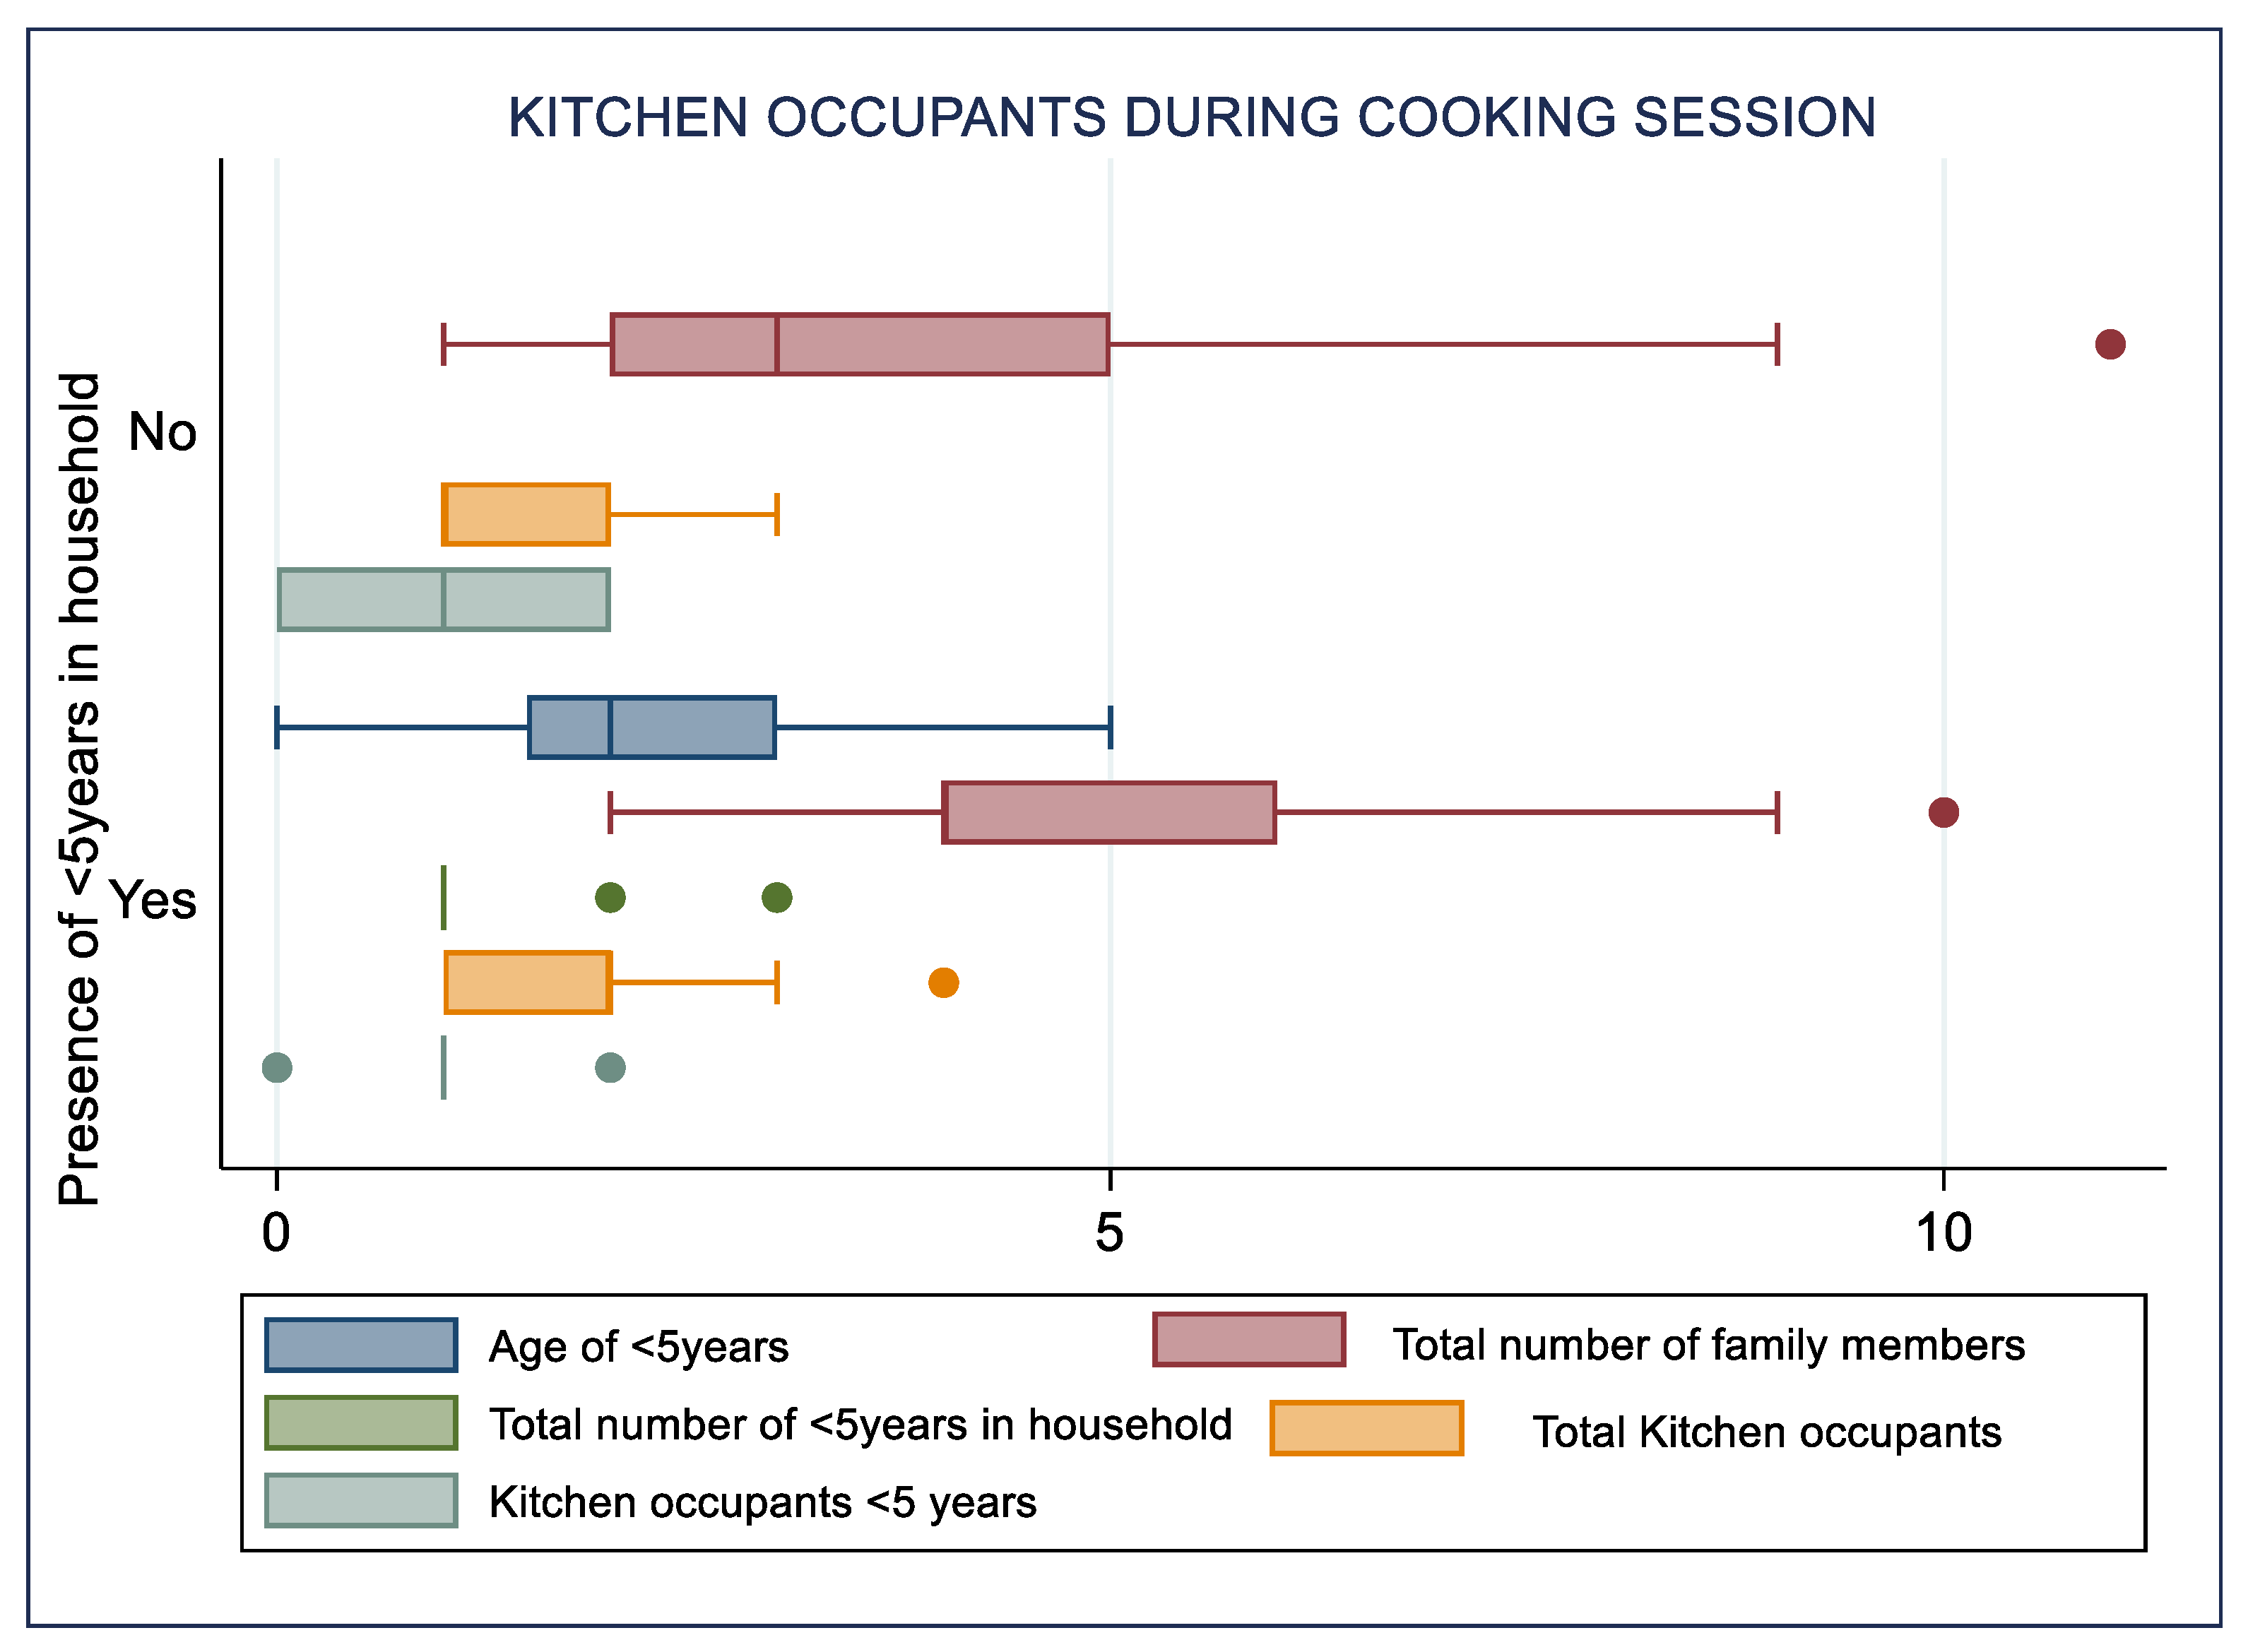
Figure 5.
Pollutant levels (A) before (B) during and (C) after the cooking session.
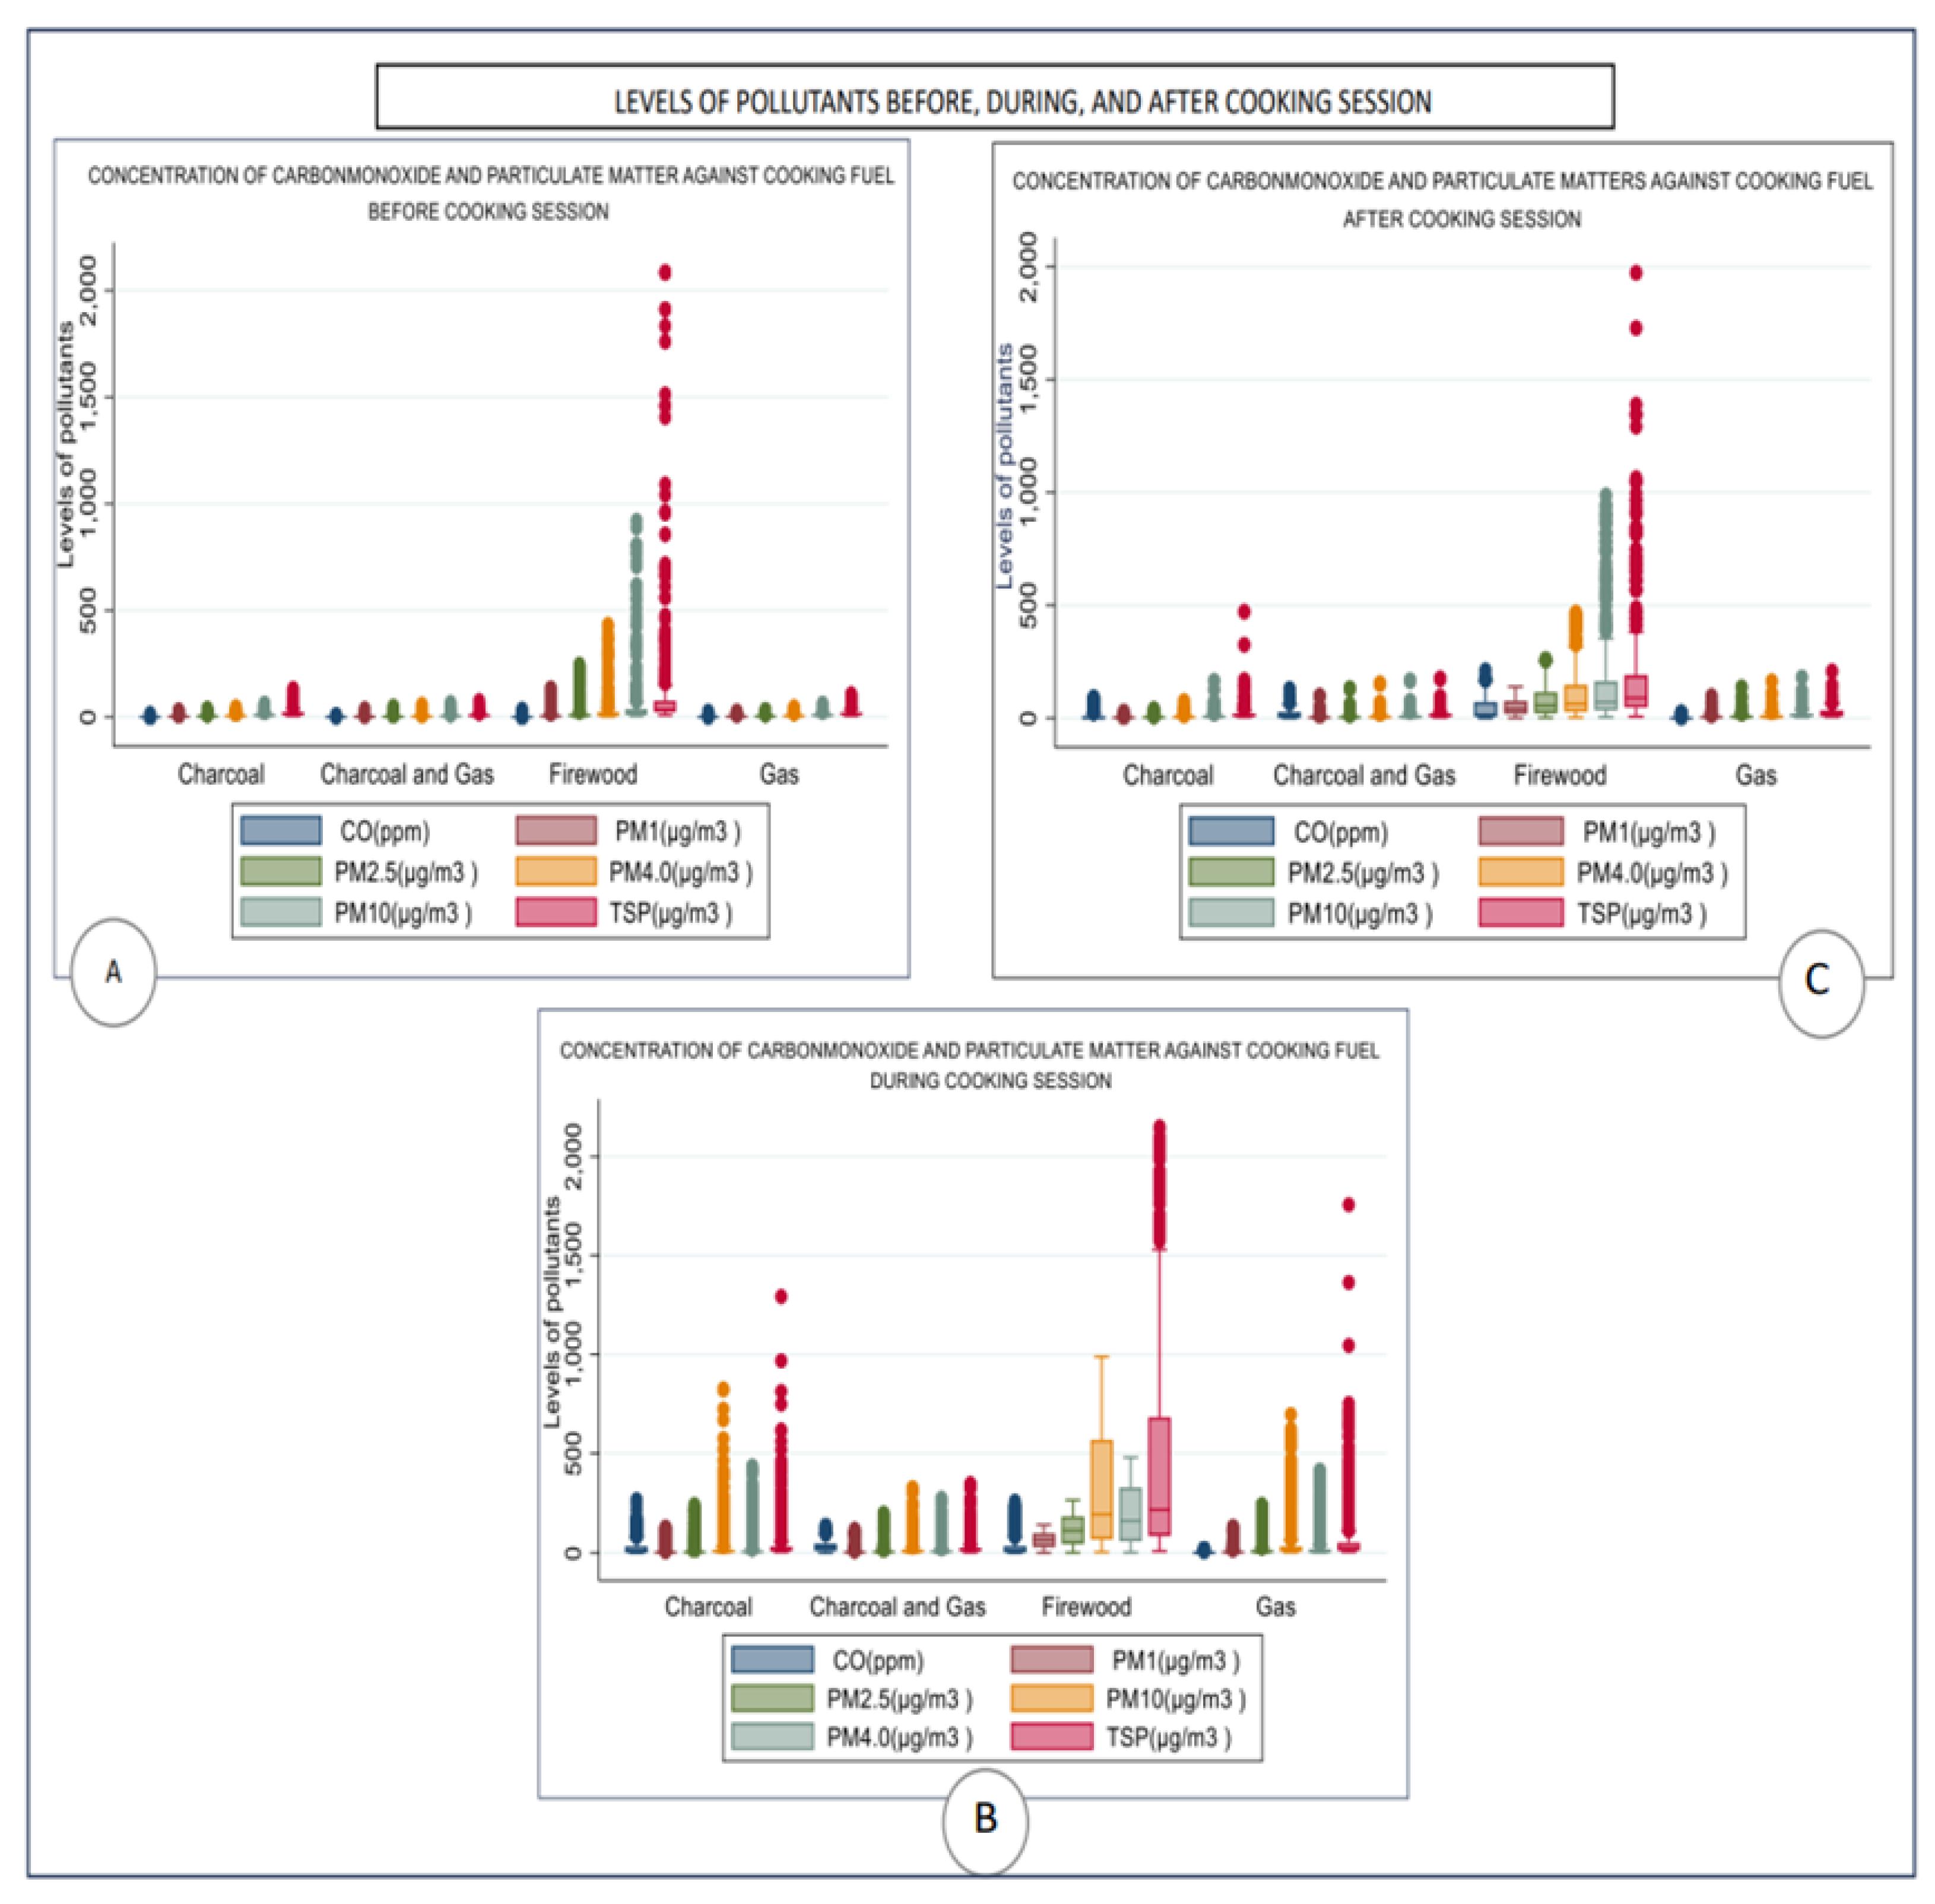
Figure 6.
Perceived health symptoms during cooking sessions among (A) firewood users and (B) Charcoal users.
Figure 6.
Perceived health symptoms during cooking sessions among (A) firewood users and (B) Charcoal users.
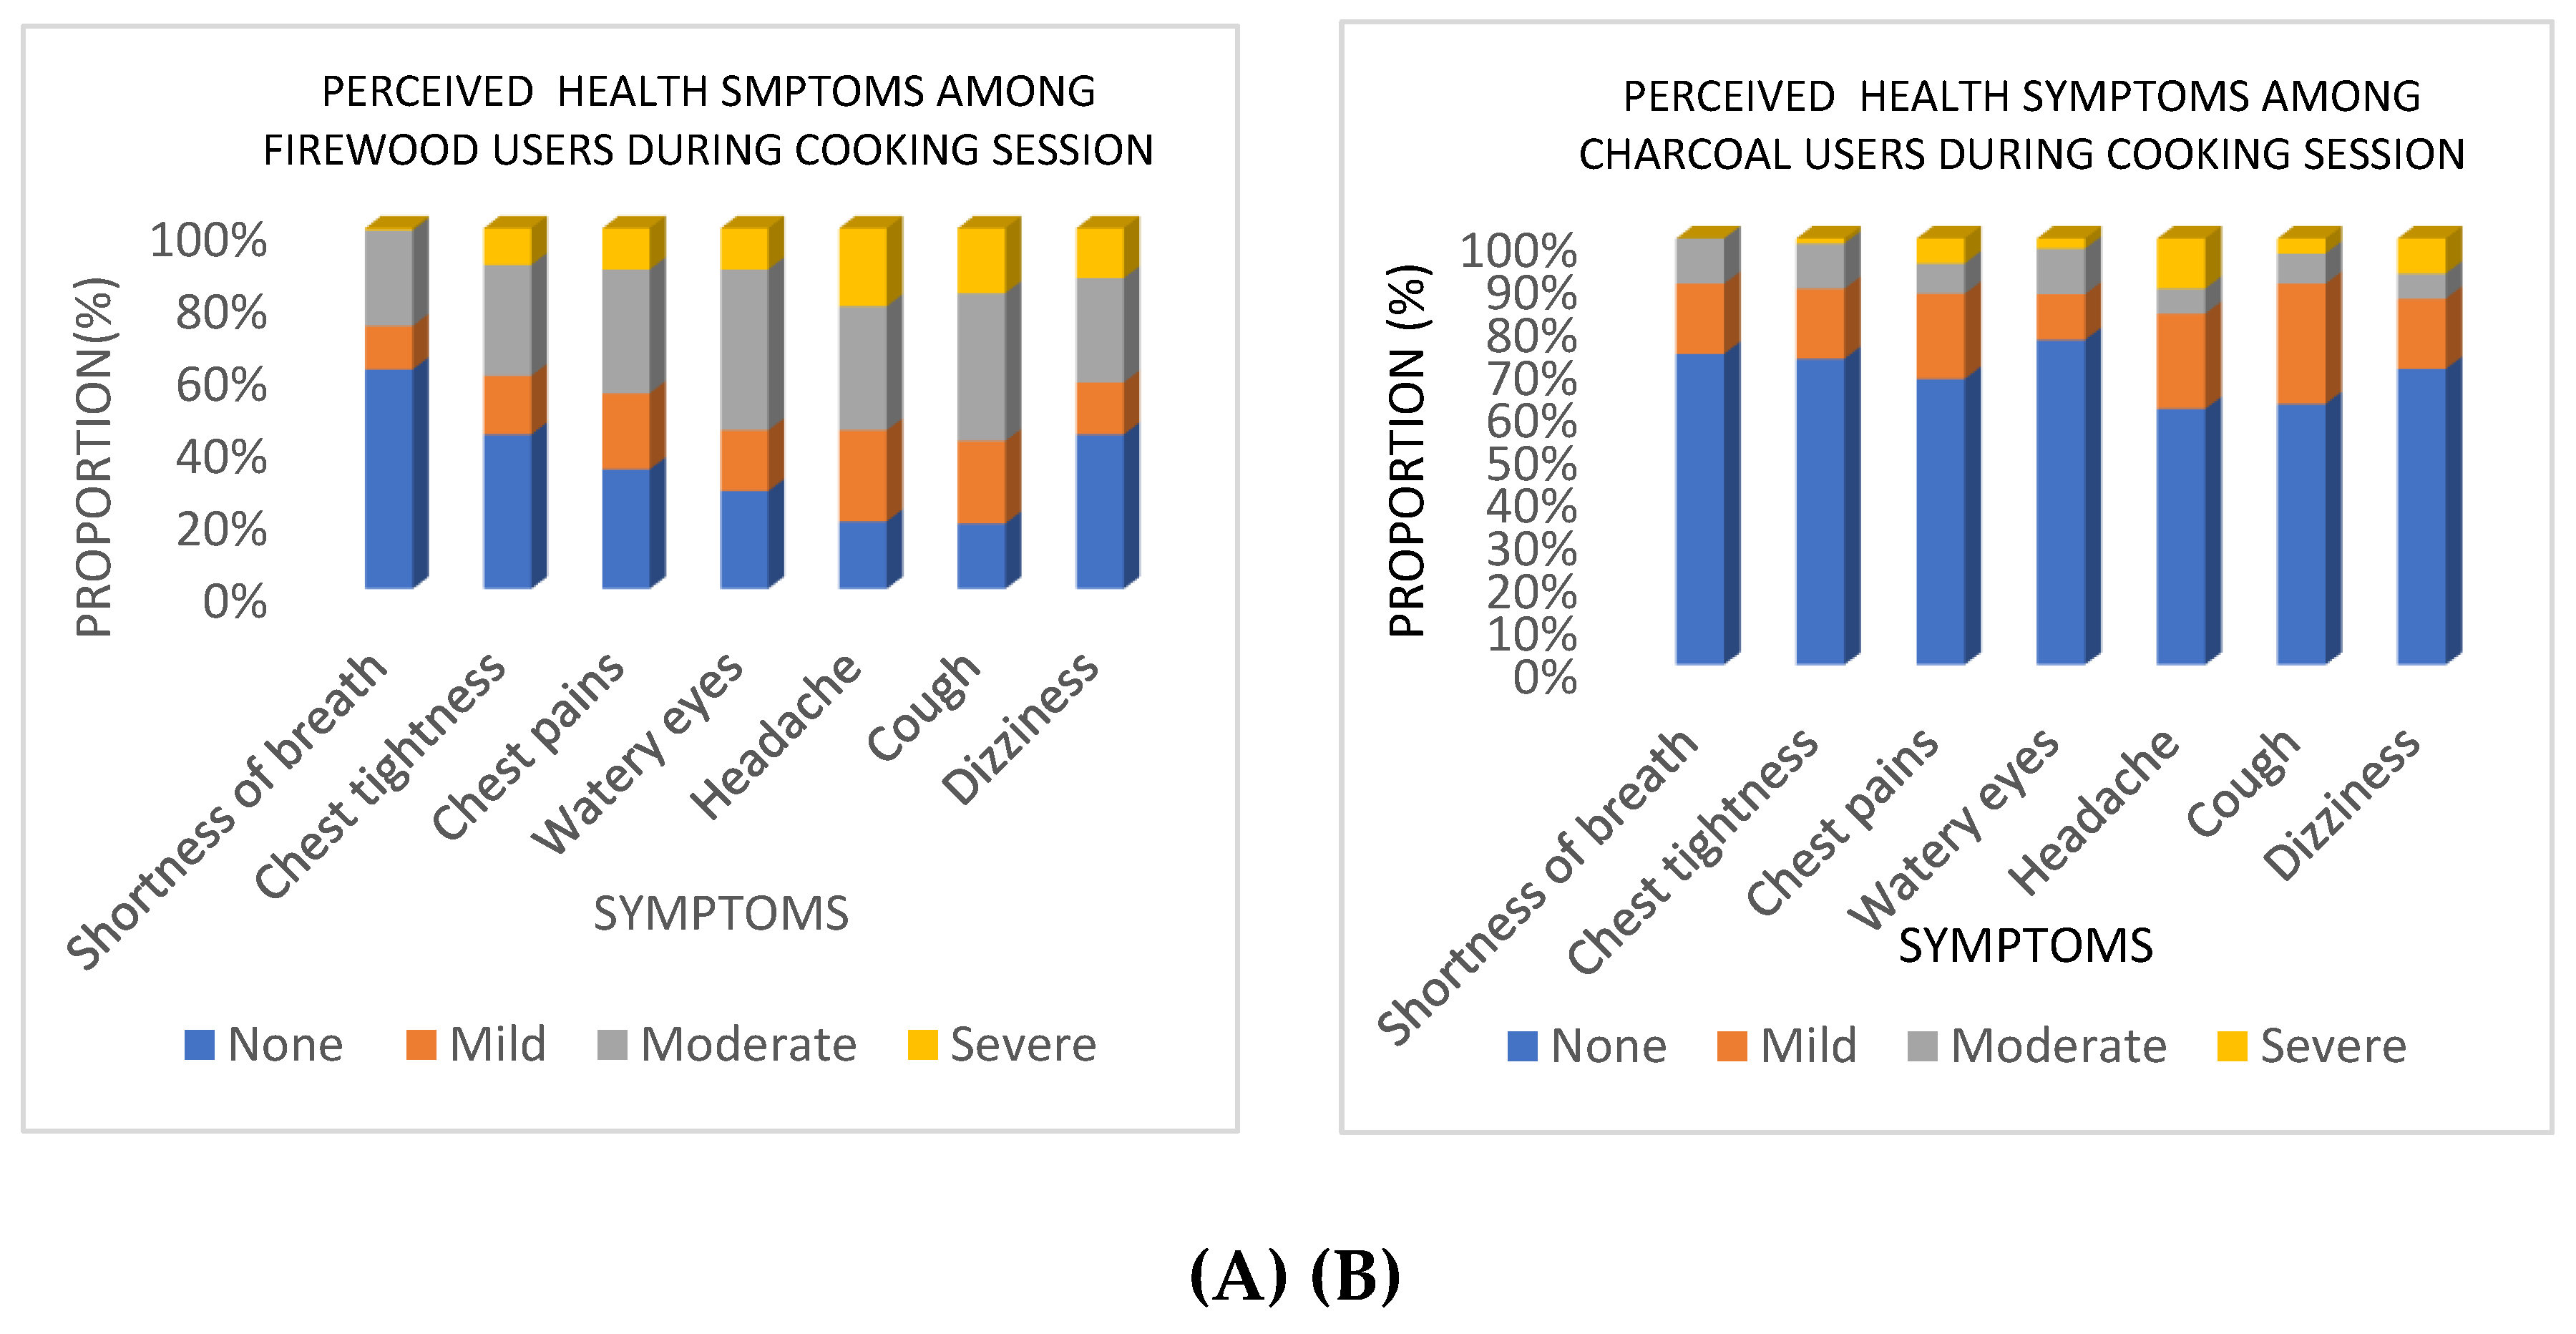

Table 1.
Household’s Sources of Cooking Energy.
| Sources of cooking energy | Frequency | Per cent | C.Percent | |
|---|---|---|---|---|
| Primary cooking energy |
Charcoal | 85 | 29.83 | 29.83 |
| Firewood | 164 | 57.54 | 87.37 | |
| Gas | 36 | 12.63 | 100 | |
| Total | 285 | 100 | ||
| Secondary Cooking energy |
Charcoal | 128 | 44.9 | 44.9 |
| Crops residue (Maize corn) | 7 | 2.5 | 47.4 | |
| Electricity | 2 | 0.7 | 48.1 | |
| Firewood | 31 | 10.9 | 59 | |
| Gas | 56 | 19.6 | 78.6 | |
| None | 61 | 21.4 | 100 | |
| Total | 285 | 100 | ||
Table 2.
Household’s Kitchen dimensions.
| Variable | Door’s area(m2) | Window’s area(m2) | Volume(m3) |
|---|---|---|---|
| Median | 1.394 | 0.404 | 19.55 |
| IQR | 0.479 | 1.05 | 21.80 |
| Minimum | 0.509 | 0 | 2.7 |
| Maximum | 3.57 | 2.88 | 175.5 |
Table 3.
Perceived health symptoms in the last 12 months.
| Variables | Primary cooking energy | Total |
|||
|---|---|---|---|---|---|
| Charcoal | Firewood | Gas | |||
| Wheezing or whistling in the chest | No | 70 | 118 | 32 | 219 |
| Yes | 15 | 46 | 4 | 66 | |
| Total | 85 | 164 | 36 | 285 | |
| Ever woken up with a feeling of tightness in your chest | No | 64 | 111 | 33 | 209 |
| Yes | 21 | 53 | 3 | 77 | |
| Total | 85 | 164 | 36 | 285 | |
| Attack of shortness of breath | No | 60 | 91 | 30 | 181 |
| Yes | 25 | 73 | 6 | 104 | |
| Total | 85 | 164 | 36 | 285 | |
| At least one family member had coughing problems | No | 27 | 46 | 25 | 98 |
| Yes | 58 | 118 | 11 | 187 | |
| Total | 85 | 164 | 36 | 285 | |
| Usually bring up any phlegm from your chest first thing in the morning |
No | 60 | 96 | 31 | 187 |
| Yes | 25 | 68 | 5 | 98 | |
| Total | 85 | 164 | 36 | 285 | |
Table 4.
Participants details and lung function results.
| Mean and Standard deviations | ||
|---|---|---|
| Type of fuel | FEV1 | %Predicted |
| Charcoal | 1.766 ± 0.81 | 81.12 ± 28.6 |
| Firewood | 1.48 ± 0.68 | 79.20 ± 31.50 |
| Gas | 2.16 ± 0.38 | 101.75 ± 19.70 |
| Total | 1.61 ± 0.71 | 82.05 ± 30.04 |
Note: FEV1 : Forced Expiratory Volume in one second, % FEV1: Proportion of observed and expected FEV1.
Disclaimer/Publisher’s Note: The statements, opinions and data contained in all publications are solely those of the individual author(s) and contributor(s) and not of MDPI and/or the editor(s). MDPI and/or the editor(s) disclaim responsibility for any injury to people or property resulting from any ideas, methods, instructions or products referred to in the content. |
© 2024 by the authors. Licensee MDPI, Basel, Switzerland. This article is an open access article distributed under the terms and conditions of the Creative Commons Attribution (CC BY) license (http://creativecommons.org/licenses/by/4.0/).
Copyright: This open access article is published under a Creative Commons CC BY 4.0 license, which permit the free download, distribution, and reuse, provided that the author and preprint are cited in any reuse.


