Preprint
Article

Application of Synephrine to Grape Increases Anthocyanin via Production of Hydrogen Peroxide, Not Phytohormones

Altmetrics

Downloads

85

Views

38

Comments

0

A peer-reviewed article of this preprint also exists.

This version is not peer-reviewed

Submitted:

22 April 2024

Posted:

22 April 2024

You are already at the latest version

Alerts
Abstract
The global warming has caused poor grape skin coloration and reduced the production of high-quality berries. To overcome these problems, the effect of synephrine (Syn) on anthocyanin accumulation was investigated. Syn treatment above 1 mM increased anthocyanin content in cultured grape cells in a molecular-structure-specific and concentration-dependent manner, and increased only the anthocyanin without affecting the sugar/acid ratio in grape bunches. It increased the expression of genes linked to anthocyanin synthesis after 24 h of treatment, without affecting phytohormone levels. Syn treatment induced the expression of SOD3, elevating hydrogen peroxide (H2O2) production from 3 to 24 h after treatment in cultured cells. Subsequent increases in CAT and APX6 expression occurred, which encode H2O2-eliminating enzymes. In cultured grape cells, Syn and H2O2 treatments upregulated the H2O2-responsive gene Chit4 and the anthocyanin-biosynthesis-related genes mybA1 and UFGT 4 days after the treatments and promoted anthocyanin accumulation 7 days after the treatments. In berries, both treatments enhanced anthocyanin accumulation after 9 days. These results suggest that Syn promotes anthocyanin accumulation through the production of H2O2 without the upregulation of phytohormone biosynthesis. Syn treatment is expected to improve poor grape coloration and contribute to higher-quality fruit production.
Keywords: 
Subject: Biology and Life Sciences  -   Agricultural Science and Agronomy

1. Introduction

It is a fact that global warming will have an extremely negative impact on plant growth. Grapevine (Vitis spp.) is an economically important berry-bearing plant that is widely grown throughout the world for wine production and as table grapes. The ripening of grape berries is controlled by a variety of environmental factors including sunlight [1], water [2], and temperature [3]. Fruit coloration is mainly regulated by phytohormones such as abscisic acid (ABA) and ethylene (ET), which promote berry ripening [4,5,6,7], and jasmonic acid (JA), which promotes anthocyanin biosynthesis and enhances disease resistance in plants [8]. In grape berries, anthocyanin accumulation during ripening is mainly promoted by ABA [9]. Increases in average temperature due to global warming reduce the ABA content of grapes and inhibit anthocyanin accumulation [10,11], resulting in poor grape coloration, which, in turn, degrades the quality of grapes and red wine. Further increases in average temperature are predicted to cause significant economic damage to not only grape growers but also the winemaking industry [12].
Although methods such as girdling [13], leaf removal [14,15], and cluster thinning [16] have been found to solve the problem of poor grape coloration, these methods require skill and labor for application. The direct spraying of ABA [5,17,18,19] is unpopular because of high cost and side effects such as grapevine defoliation [20]. On the other hand, simple methods to promote grape coloration have been reported, including stimulation with sound [7] and fragrance [21]. In recent years, bioactive natural products with high specificity of effect have been focused on as an alternative to synthetic chemicals such as ABA. The direct spraying of bioactive natural products such as allantoin [6], amino acids [22], and vanillyl acetone [4] has been shown to improve grape coloration. The application of bioactive natural products is expected to have advantages over the other techniques, including ease of application, less stress on vines and the environment, and lower cost.
We conducted a screening for bioactive natural products and found that synephrine (Syn) has a color-improving effect on grapes (Enoki, personal communication). Syn is an alkaloid with a phenethylamine skeleton, and its IUPAC nomenclature is 4-[1-hydroxy-2-(methylamino)ethyl]phenol. Syn is found in some orange species [23,24]. It has a lipolytic effect in the human body and is used as a dietary supplement [25,26]. However, there are no reports on the effects of Syn on agricultural plants. Therefore, in this study, we aimed to examine the effect of Syn on anthocyanin biosynthesis in grape berries and to elucidate the mechanism underlying its effect in grape cells, with the goal of improving grape quality by enhancing grape coloration with Syn. Our findings show that Syn induces anthocyanin accumulation via the production of hydrogen peroxide (H2O2), not phytohormones.

2. Results

2.1. Syn induces Anthocyanin Accumulation in VR Cells

To investigate the effect of Syn on anthocyanin accumulation, VR (Vitis Red) cells were used (Figure 1). Anthocyanin content was significantly higher in VR cells treated with Syn at concentrations of 1 mM or higher than in Control, and no significant difference was found among VR cells treated with Syn at concentrations of 1 mM or higher (Tukey, P < 0.01 or 0.05; Figure 1a). Syn is biosynthesized in the phenylalanine and tyrosine pathways via L-(-)-tyrosine (L-Tyro), tyramine (Tyra), and octopamine hydrochloride (Oct) using phenylalanine (Phe) as the substrate [27]. The effect of Syn and the aforementioned compounds on anthocyanin accumulation in the Syn biosynthetic pathway tended to decrease in the order of Phe, Syn, Oct, Tyra, and L-Tyro. Anthocyanin contents in Syn- and Phe-treated VR cells were significantly higher than that in Control (Dunnett, P < 0.05 or 0.01; Figure 1b). These results suggest that Syn induces anthocyanin accumulation in VR cells in a concentration-independent and molecular-structure-specific manner.

2.2. Syn Promotes Anthocyanin Accumulation in Grape Skin in Field Trials

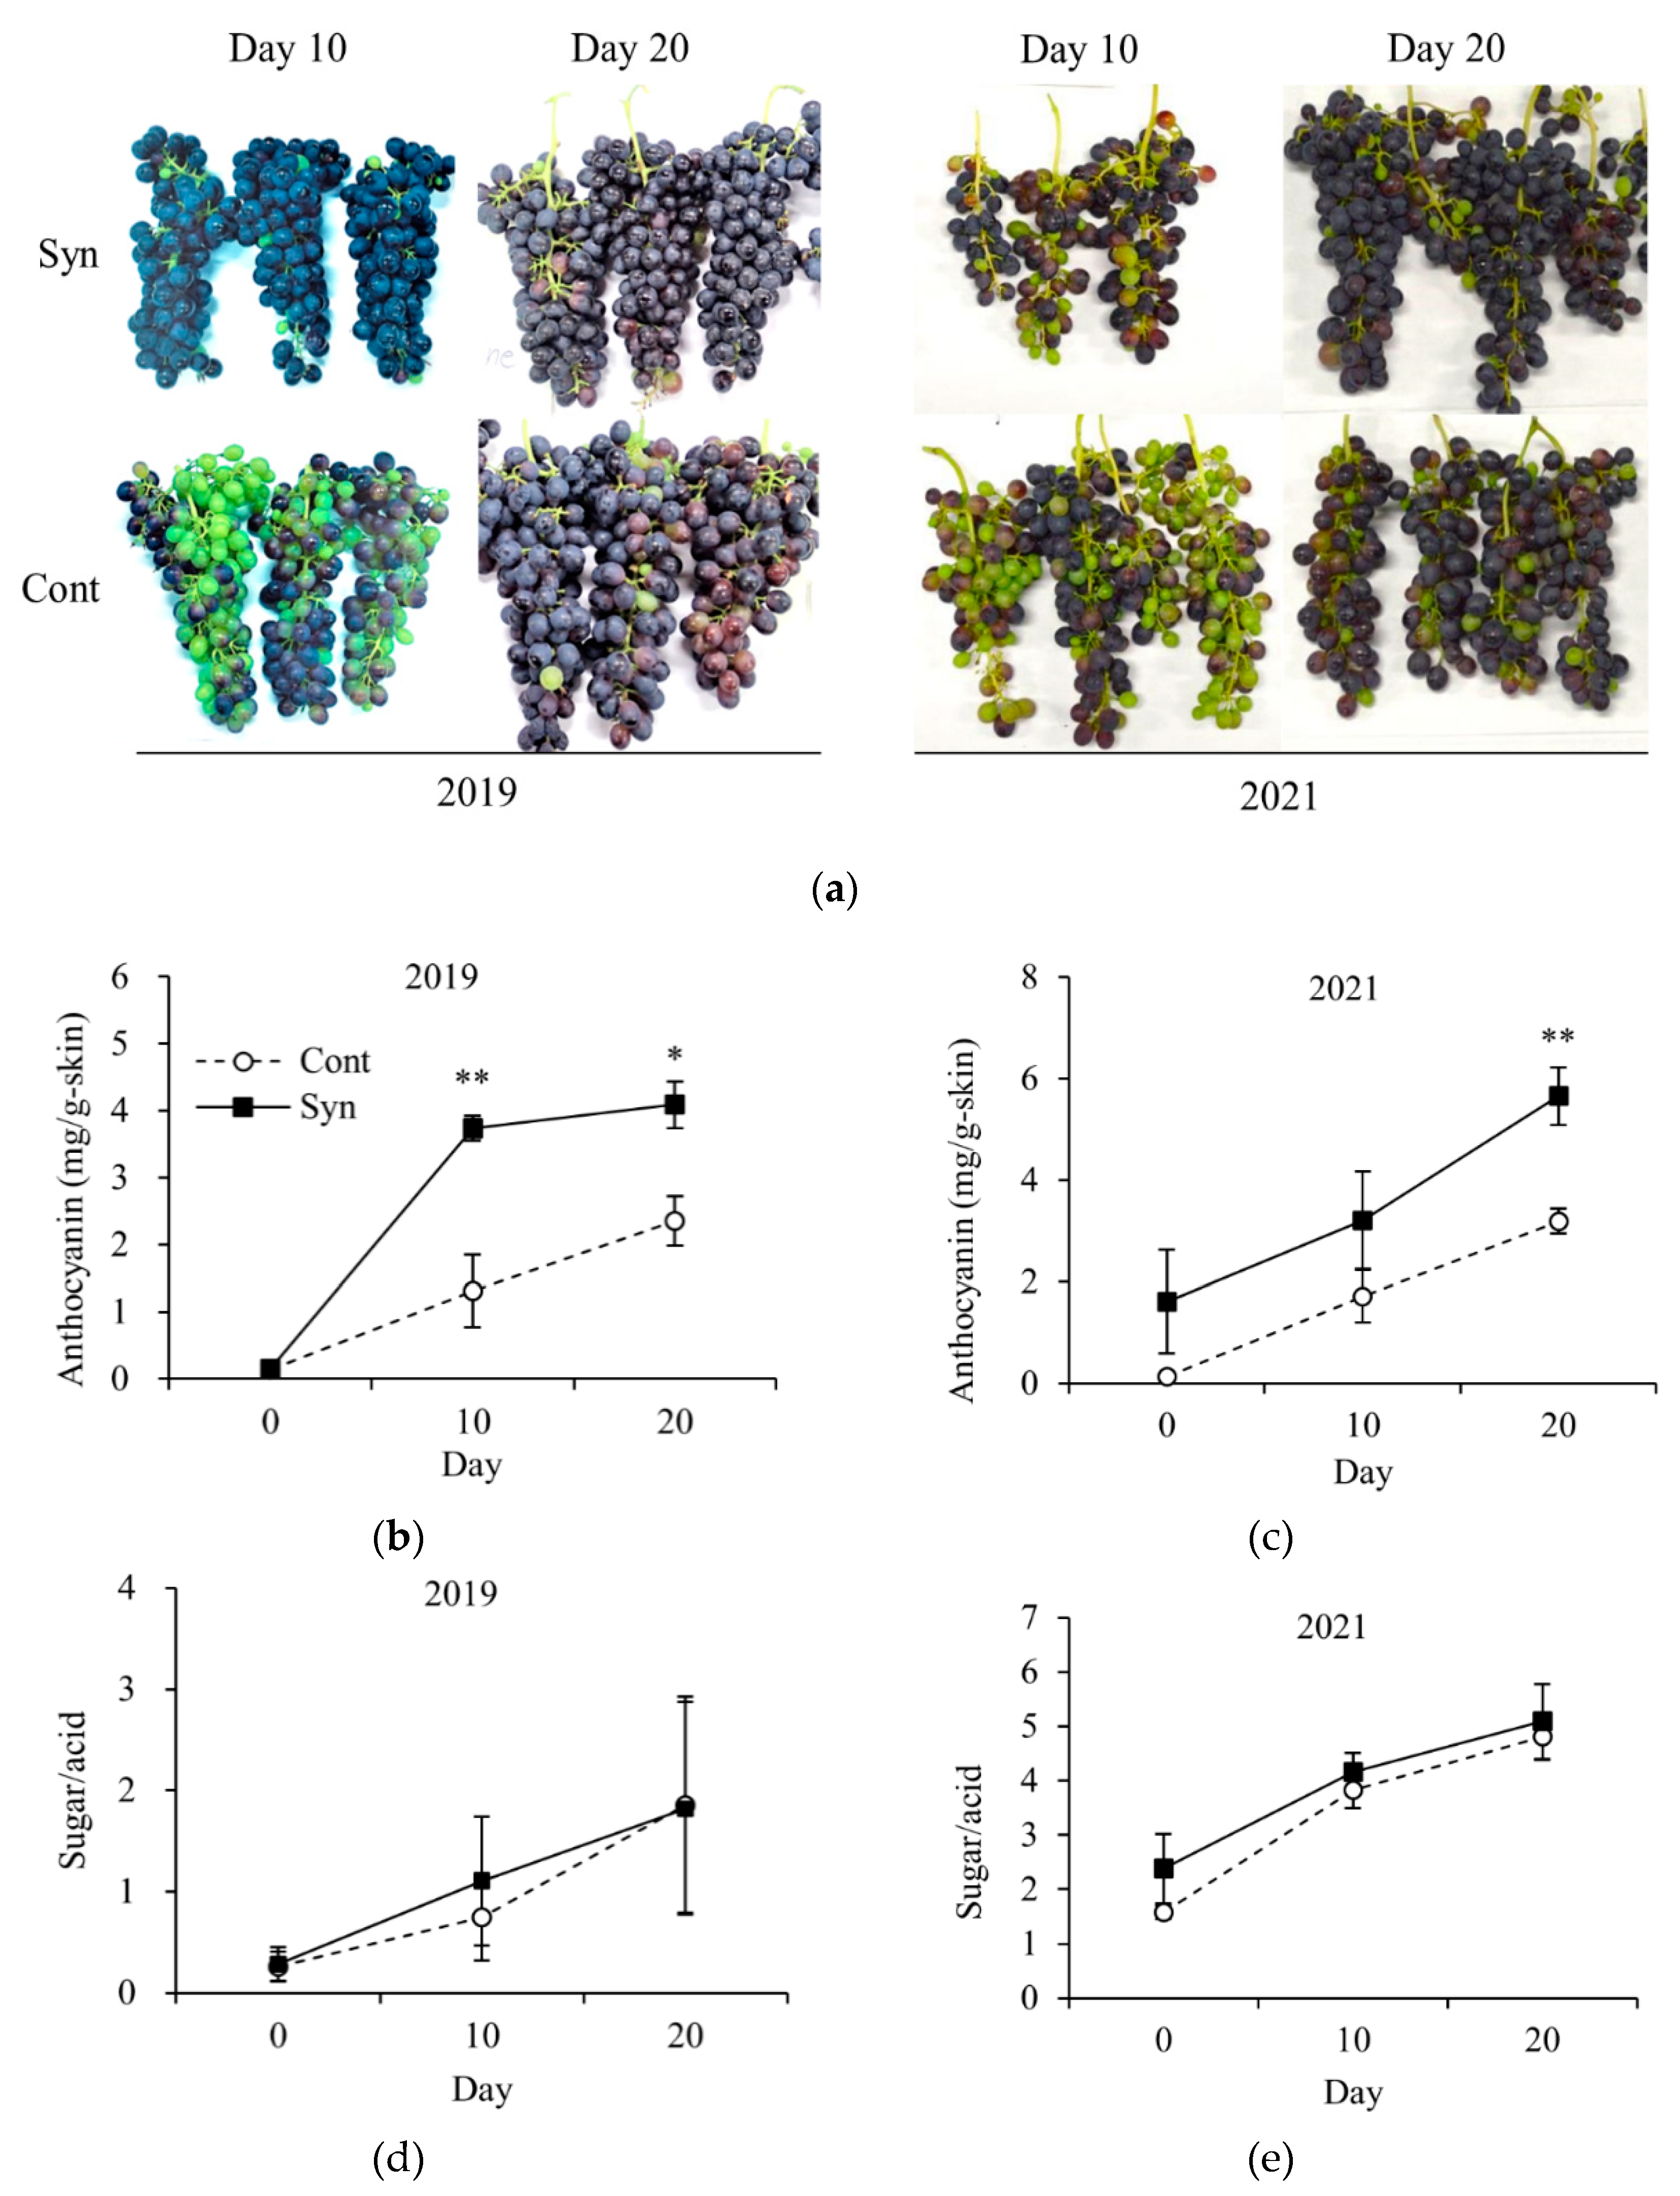
We investigated whether Syn affects the ripening of grape bunches in the field (Figure 2). Field trials were conducted in 2019 and 2021 (Figure 2a). In 2019, anthocyanin content was significantly higher in Syn-treated berries than in Control on days 10 and 20 after treatment (P < 0.01 or 0.05; Figure 2b). Similarly, in 2021, anthocyanin content was significantly higher in Syn-treated berries than in Control on day 20 after treatment (P < 0.01; Figure 2c). However, in both years, the sugar/acid ratio, a ripeness index, was not significantly different between Syn-treated berries and Control (Figure 2d,e). Therefore, these results suggest that Syn promotes only anthocyanin accumulation in grape skin and not fruit ripening.

2.3. Syn Increases Expression Levels of Anthocyanin-Biosynthesis-Related Genes

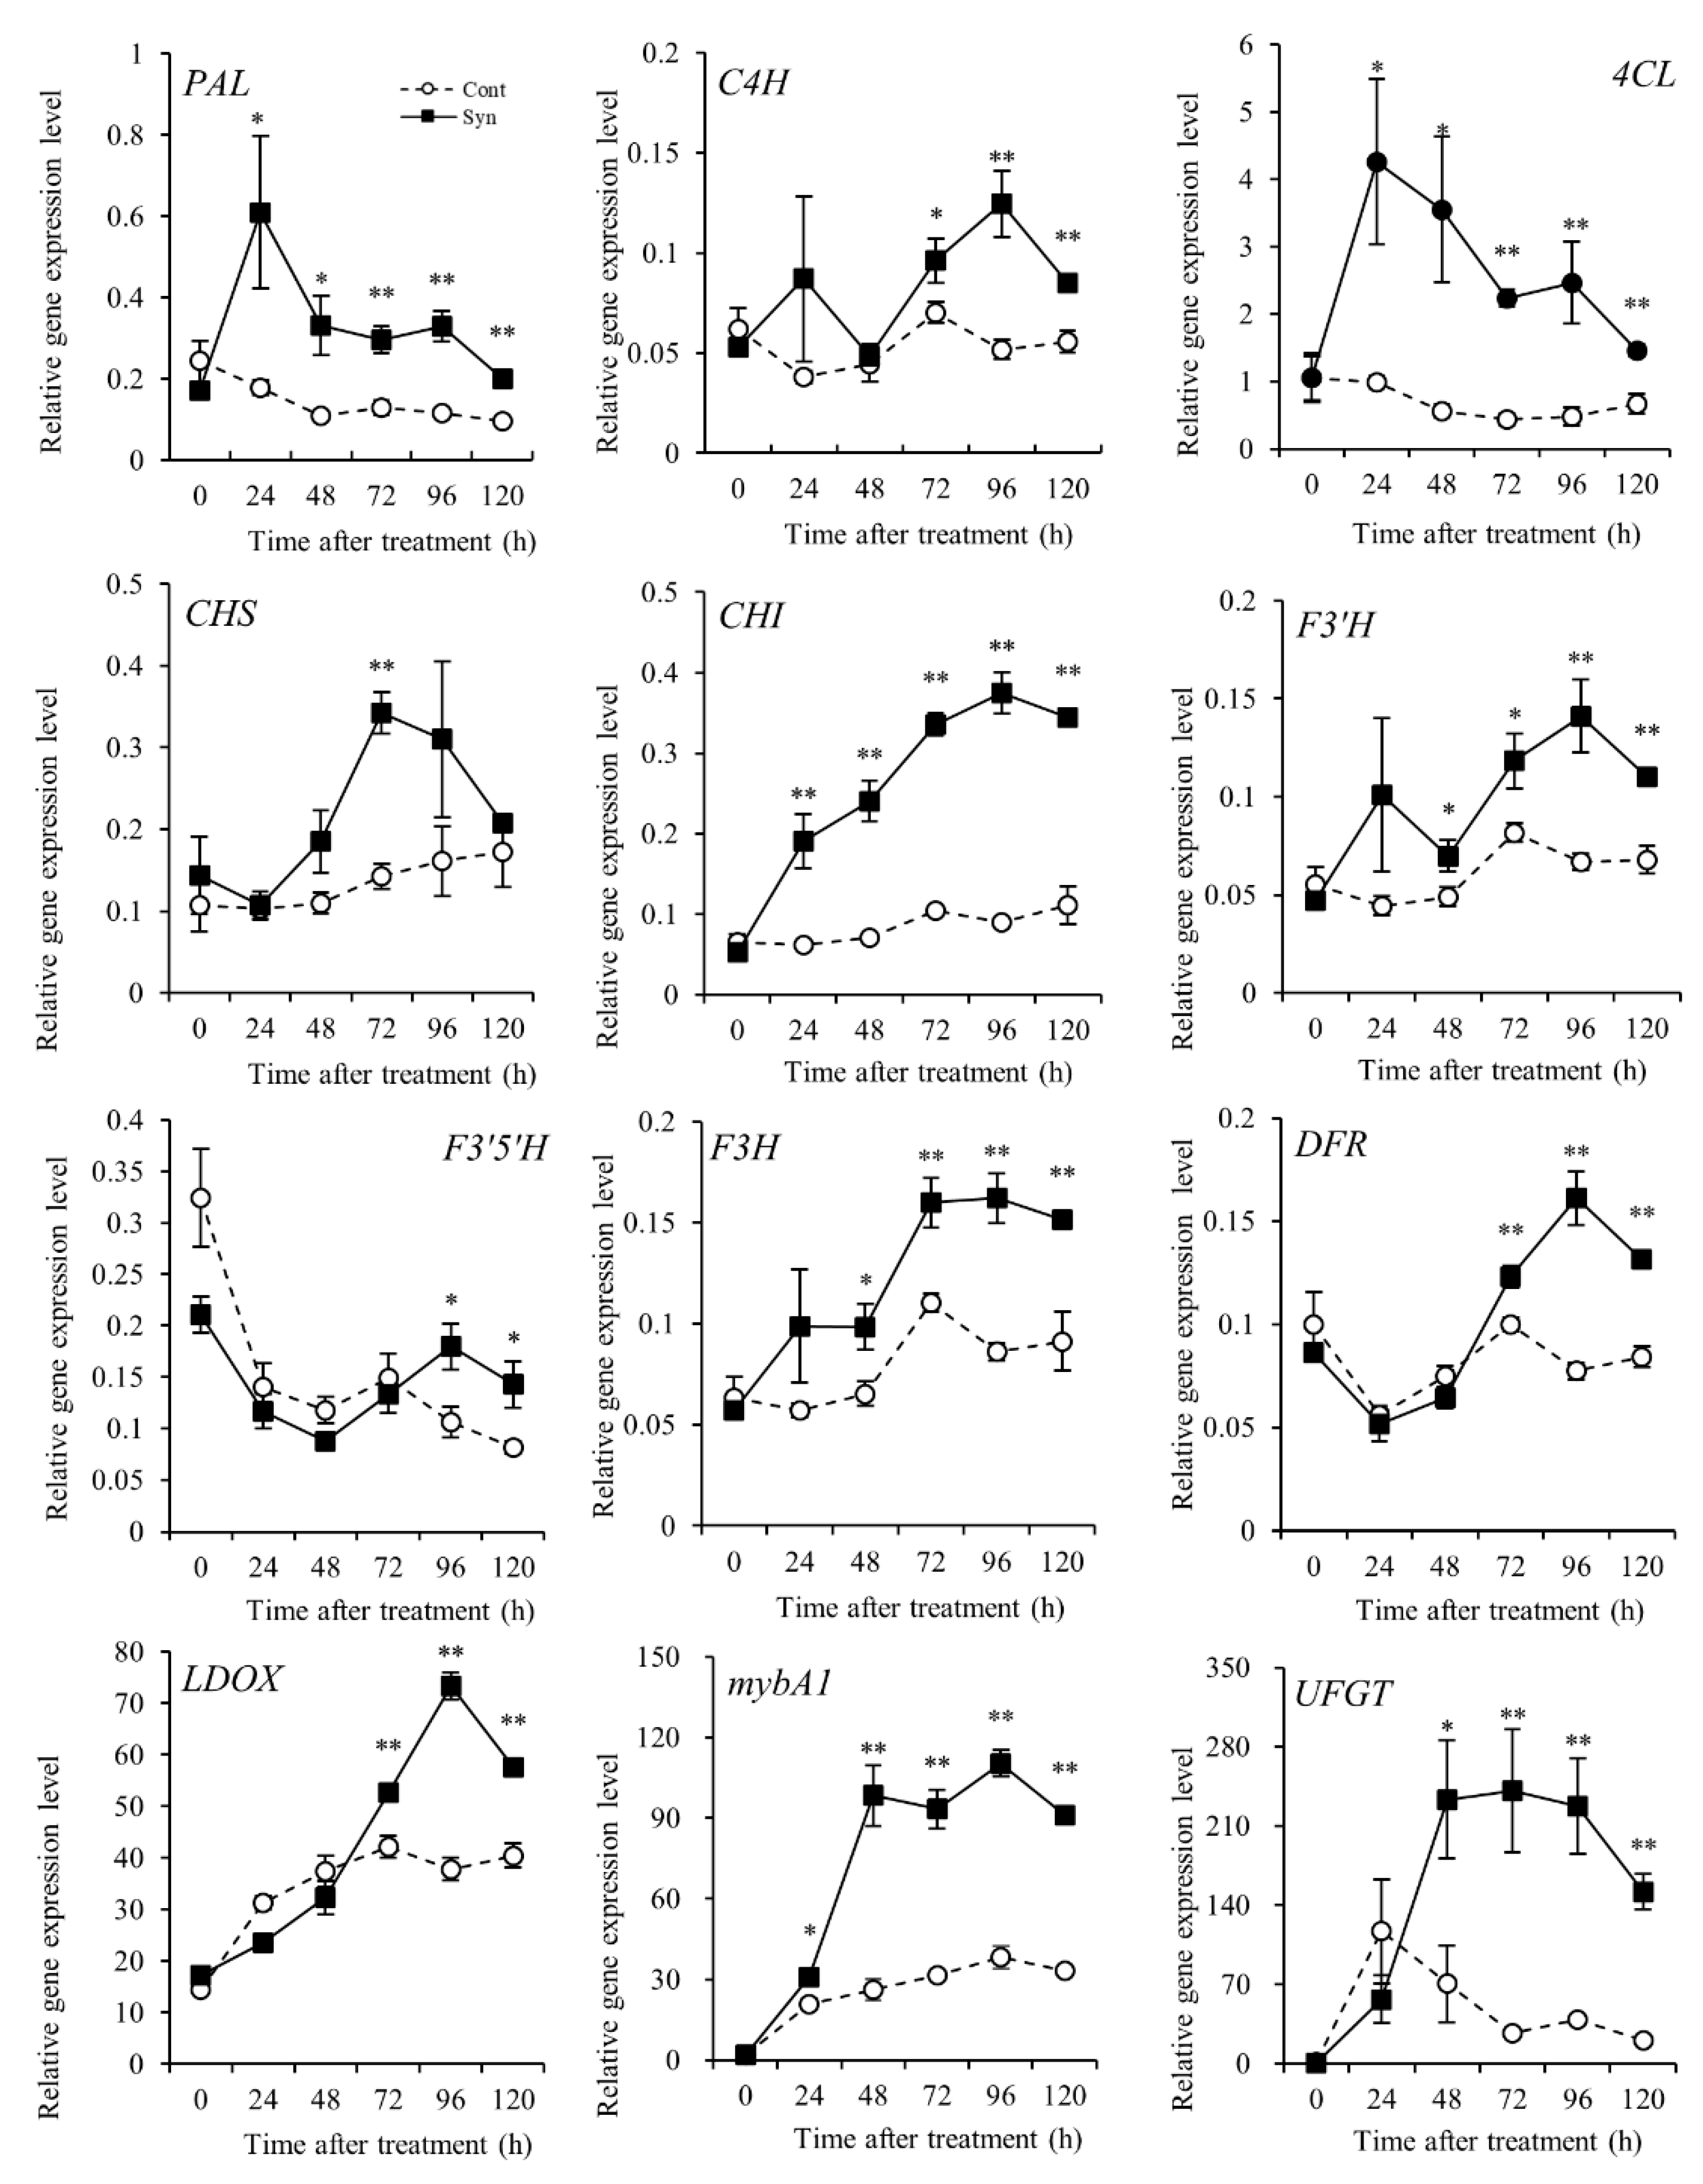
As regards genes involved in the anthocyanin-biosynthesis-related pathways, their expression levels relative to actin were measured by real-time RT-PCR (Figure 3). In the phenylpropanoid biosynthetic pathway, the relative expression levels of PAL encoding phenylalanine ammonia-lyase [EC 4.3.1.24] and 4CL encoding 4-coumarate-CoA ligase [EC 6.2.1.12] were significantly higher (P < 0.01 or 0.05) in Syn-treated VR cells than in Control at 24 h after treatment or later. In contrast, the relative expression level of C4H encoding cinnamate-4-hydroxylase [EC 1.14.14.91] was significantly higher in Syn-treated VR cells than in Control at 72 h after treatment or later (P < 0.01 or 0.05).
Upstream of the flavonoid biosynthetic pathway, the relative expression level of CHS encoding chalcone synthase [EC 2.3.1.74] in Syn-treated VR cells was significantly different from that in Control only at 72 h after treatment, whereas the relative expression level of CHI encoding chalcone isomerase [EC 5.5.1.6] showed a significant difference as early as 24 h after treatment (P < 0.01). Midstream of the flavonoid biosynthetic pathway, the relative expression levels of F3'H encoding flavonoid 3'-monooxygenase [EC 1.14.14.82] and F3'5'H encoding flavonoid 3',5'-hydroxylase [EC 1.14.14.81], which are related to red and blue anthocyanin pigment biosynthesis, in Syn-treated VR cells were significantly different at 48 h and 96 h after treatment or later, respectively, compared with Control (P < 0.01 or 0.05). The relative expression level of F3H encoding flavanone 3-hydroxylase [EC 1.14.11.9] in Syn-treated VR cells was significantly different from that in Control at 48 h after treatment or later (P < 0.01 or 0.05). Downstream, the relative expression levels of DFR encoding dihydroflavonol 4-reductase [EC 1.1.1.219] and LDOX encoding leucoanthocyanidin dioxygenase [EC 1.14.20.4] in Syn-treated cells were significantly different from those in Control at 72 h after treatment or later (P < 0.01). In the flavonoid biosynthetic pathway, significant differences in the relative expression levels of these genes were observed in the early stages of the pathway.
The relative expression levels of UFGT encoding UDP-glucose:anthocyanidin/flavonol 3-O-glucosyltransferase [EC 2.4.1.115], a key enzyme in the anthocyanin biosynthetic pathway [28], and its transcription factor mybA1 encoding Myb-related transcription factor A1 [29], were analyzed. The relative expression level of mybA1 in Syn-treated VR cells was significantly higher than that in Control from 24 h after treatment, and that of UFGT, from 48 h after treatment (P < 0.01 or 0.05). These results suggest that Syn increases the expression levels of genes involved in the anthocyanin-biosynthesis-related pathways as early as 24 h after treatment.

2.4. Syn Does Not Affect the Increase in the Production of Phytohormones, Which Promote Anthocyanin Accumulation

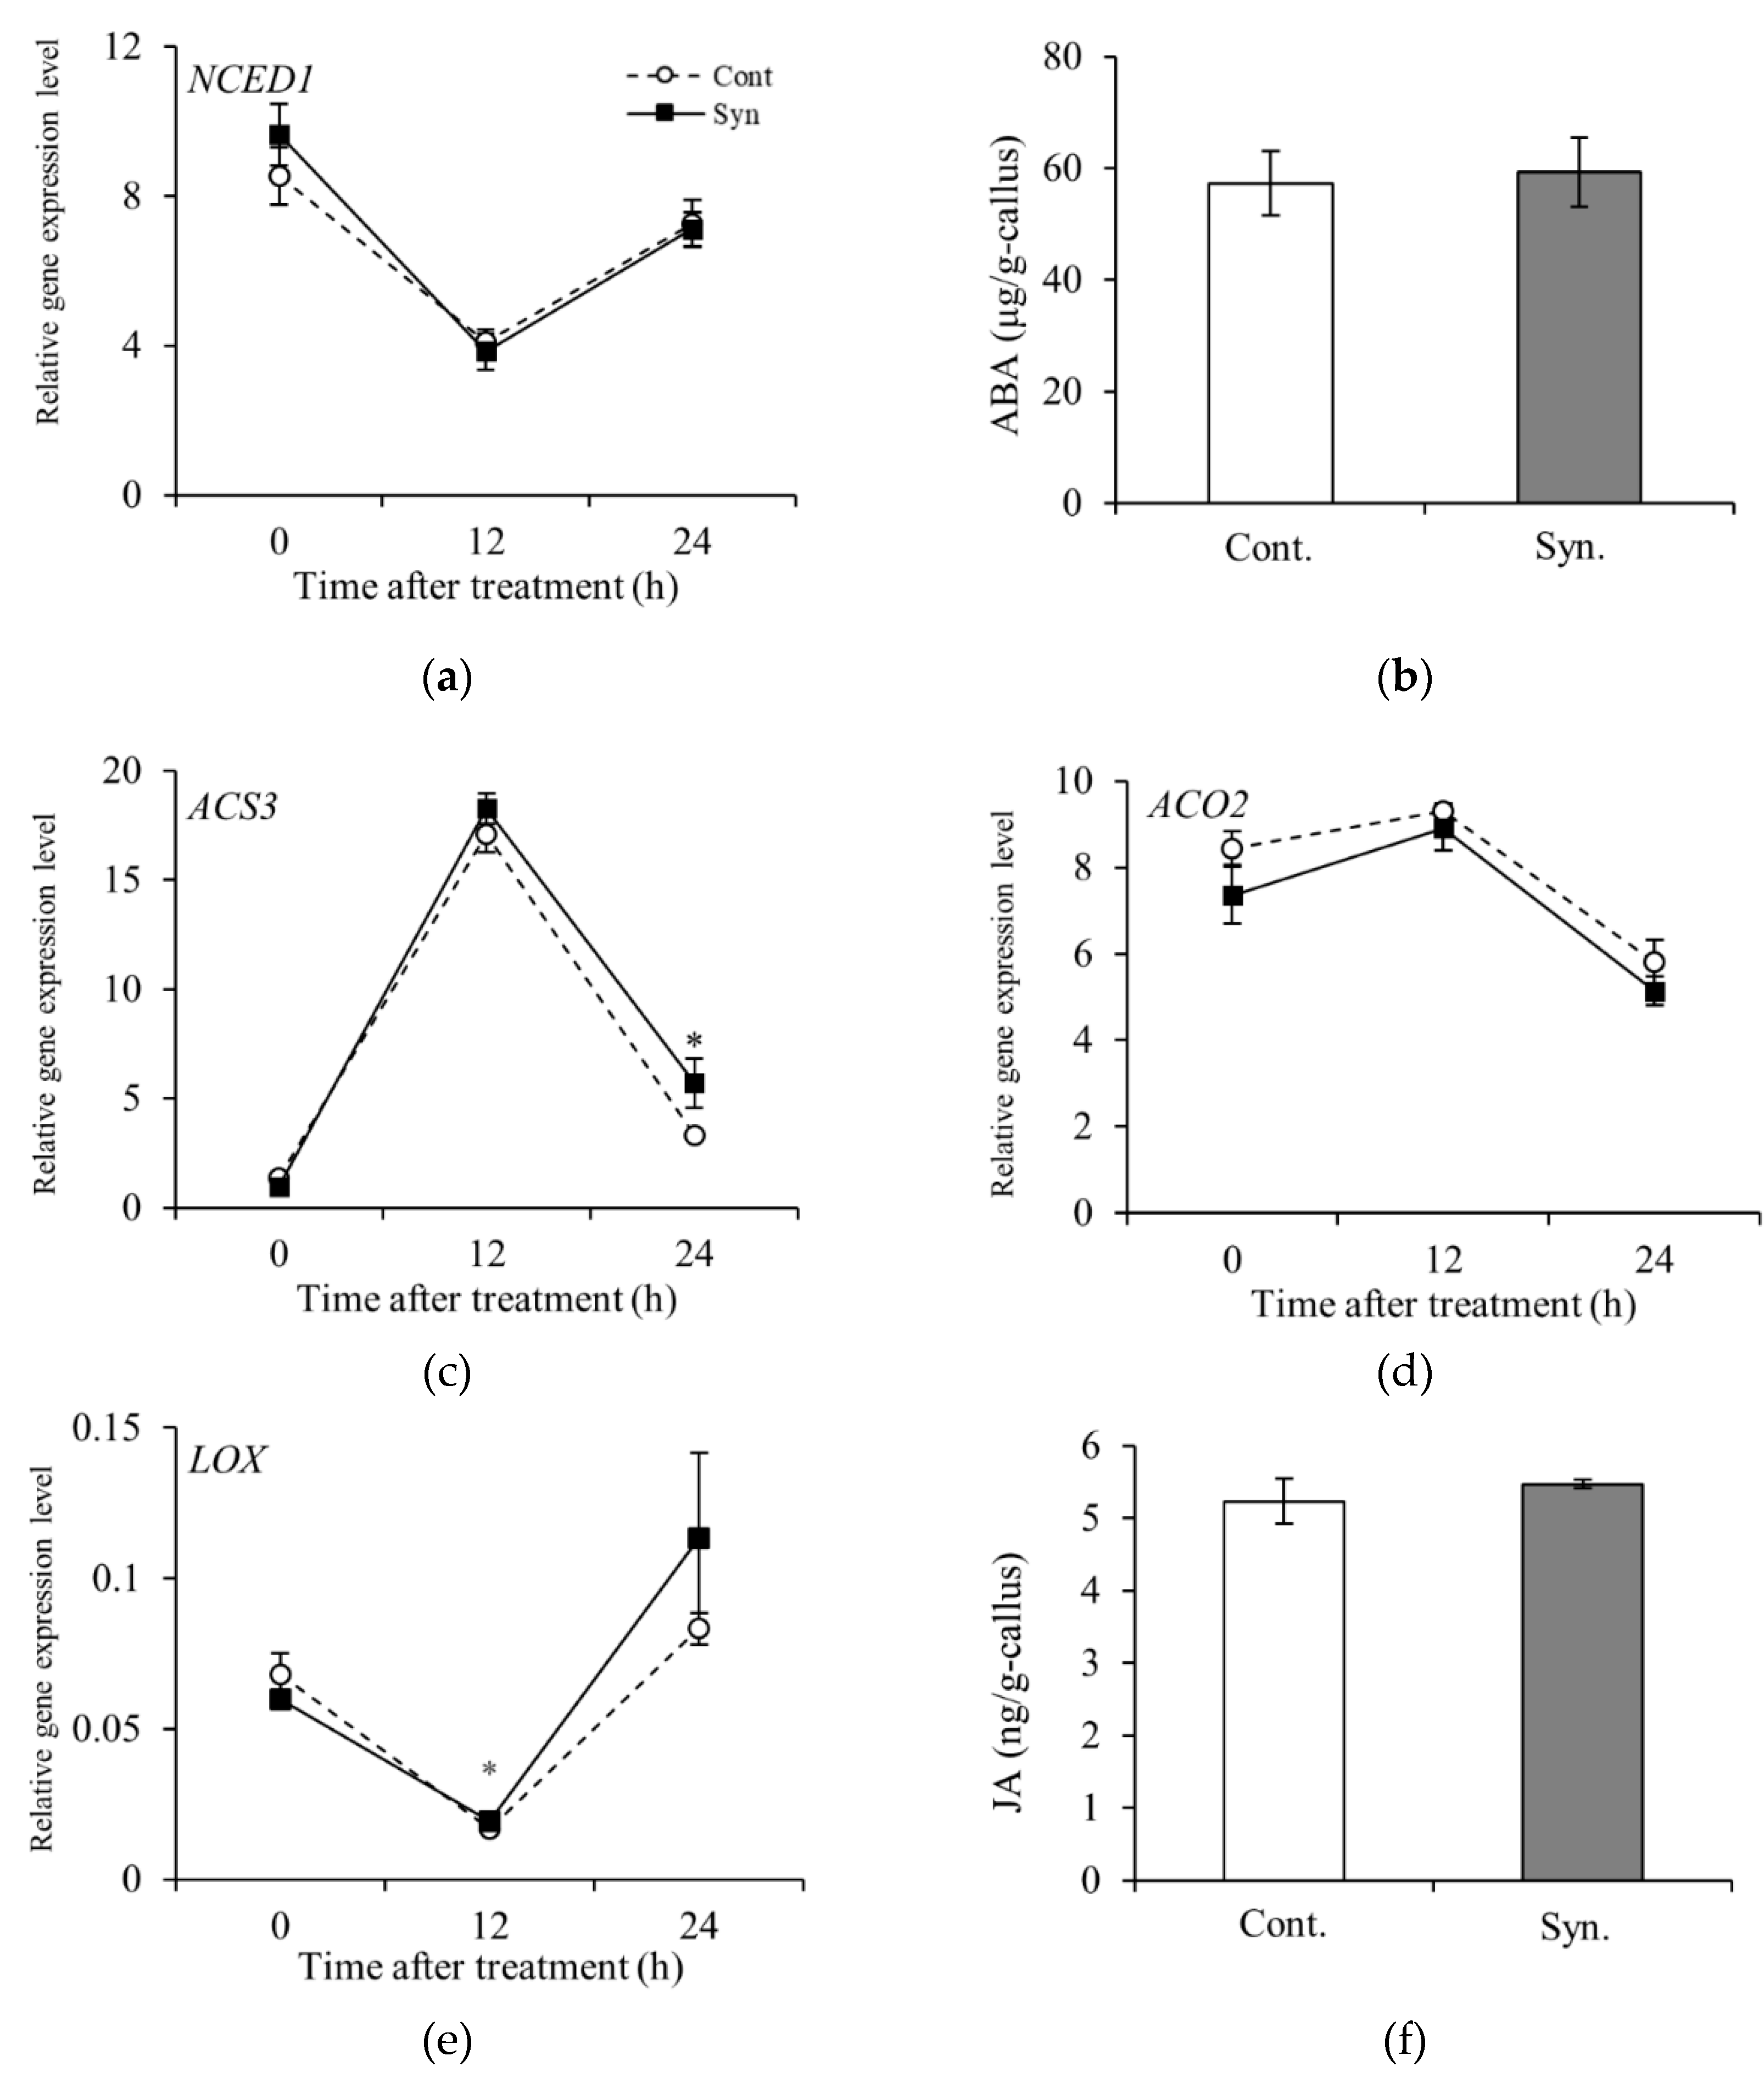
As regards the rate-limiting enzymes of ABA and ethylene, which are phytohormones that have an impact on berry ripening, the relative expression levels of NCED1 encoding 9-cis-epoxycarotenoid dioxygenase [EC 1.13.11.51] and ACS3 encoding 1-aminocyclopropane-1 carboxylate synthase [EC 4.4.1.14] in VR cells were measured. Syn neither upregulated NECD1 expression nor increased ABA content at 24 h after treatment (Figure 4a,b). The relative expression level of ACS3 was not significantly different between Syn-treated VR cells and Control at 0 and 12 h after treatment. On the other hand, the relative expression level of ACS3 showed a significant difference at 24 h after treatment (P < 0.05) (Figure 4c). Because it was not technically possible to measure ethylene gas, we measured the relative expression level of ACO2 encoding aminocyclopropanecarboxylate oxidase [EC 1.14.17.4], which encodes the key enzyme that catalyzes the biosynthesis of ethylene, and found that the expression level was not significantly different between Syn-treated VR cells and Control from 0 to 24 h after treatment (Figure 4d). The effect of Syn on the biosynthesis of JA, a phytohormone involved in fruit coloration and disease resistance, was also investigated. The relative expression level of LOX encoding linoleate 13S-lipoxygenase [EC 1.13.11.12], the rate-limiting enzyme in the JA biosynthetic pathway, was significantly different between Syn-treated VR cells and Control at 12 h after treatment (Figure 4e, P < 0.05). The endogenous JA content in Syn-treated VR cells was not significantly different from that in Control at 24 h after treatment (Figure 4f). These results suggest that Syn is not involved in the biosynthesis of phytohormones that promote coloration.

2.4. Syn Increases Anthocyanin Content via H2O2

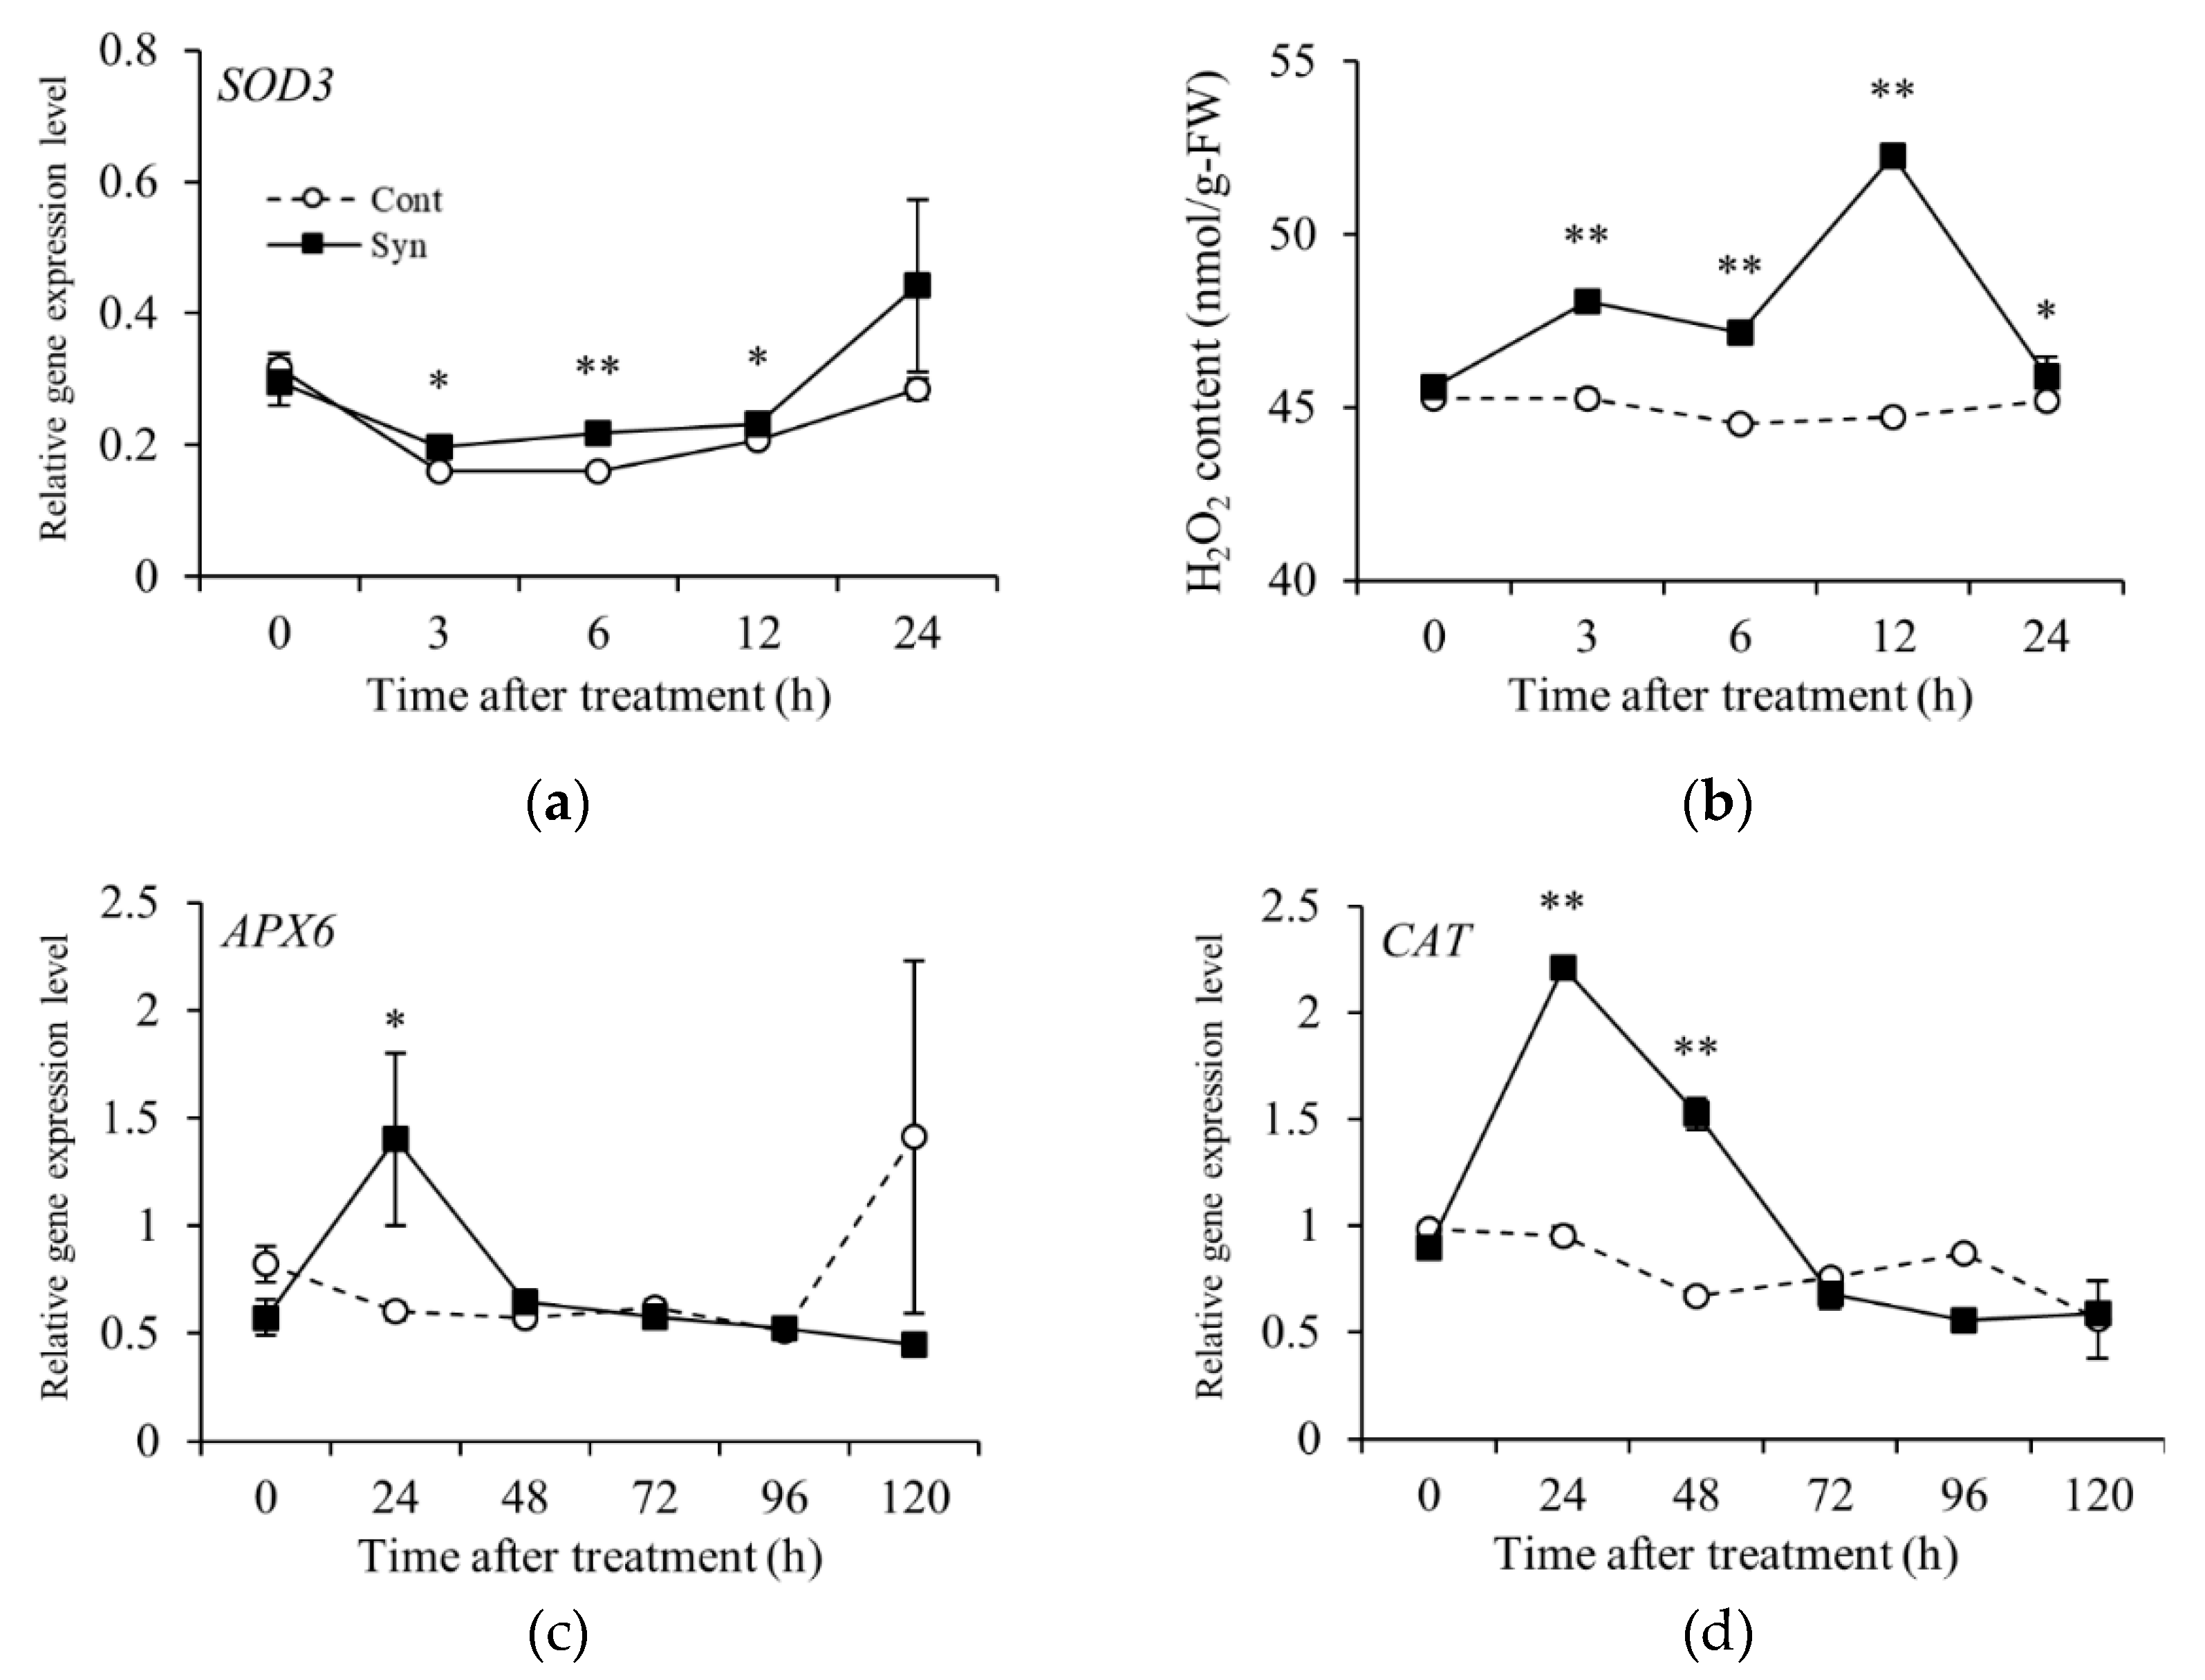
The relative expression level of SOD3 encoding the H2O2-generating enzyme superoxide dismutase [EC 1.15.1.1] was significantly higher in Syn-treated VR cells than in Control as early as 3 h to 12 h after treatment. In fact, H2O2 content was significantly higher from 3 h to 24 h (P < 0.01 or 0.05; Figure 5a,b). The relative expression levels of APX6 and CAT encoding the H2O2 scavenging enzymes ascorbate peroxidase [EC 1.11.1.11] and catalase [EC 1.11.1.6], respectively, were measured as H2O2-responsive genes. The relative expression level of APX6 was significantly higher (P < 0.01 or 0.05) at 24 h and that of CAT, at 24 h and 48 h after Syn treatment compared with Control (Figure 5c,d).
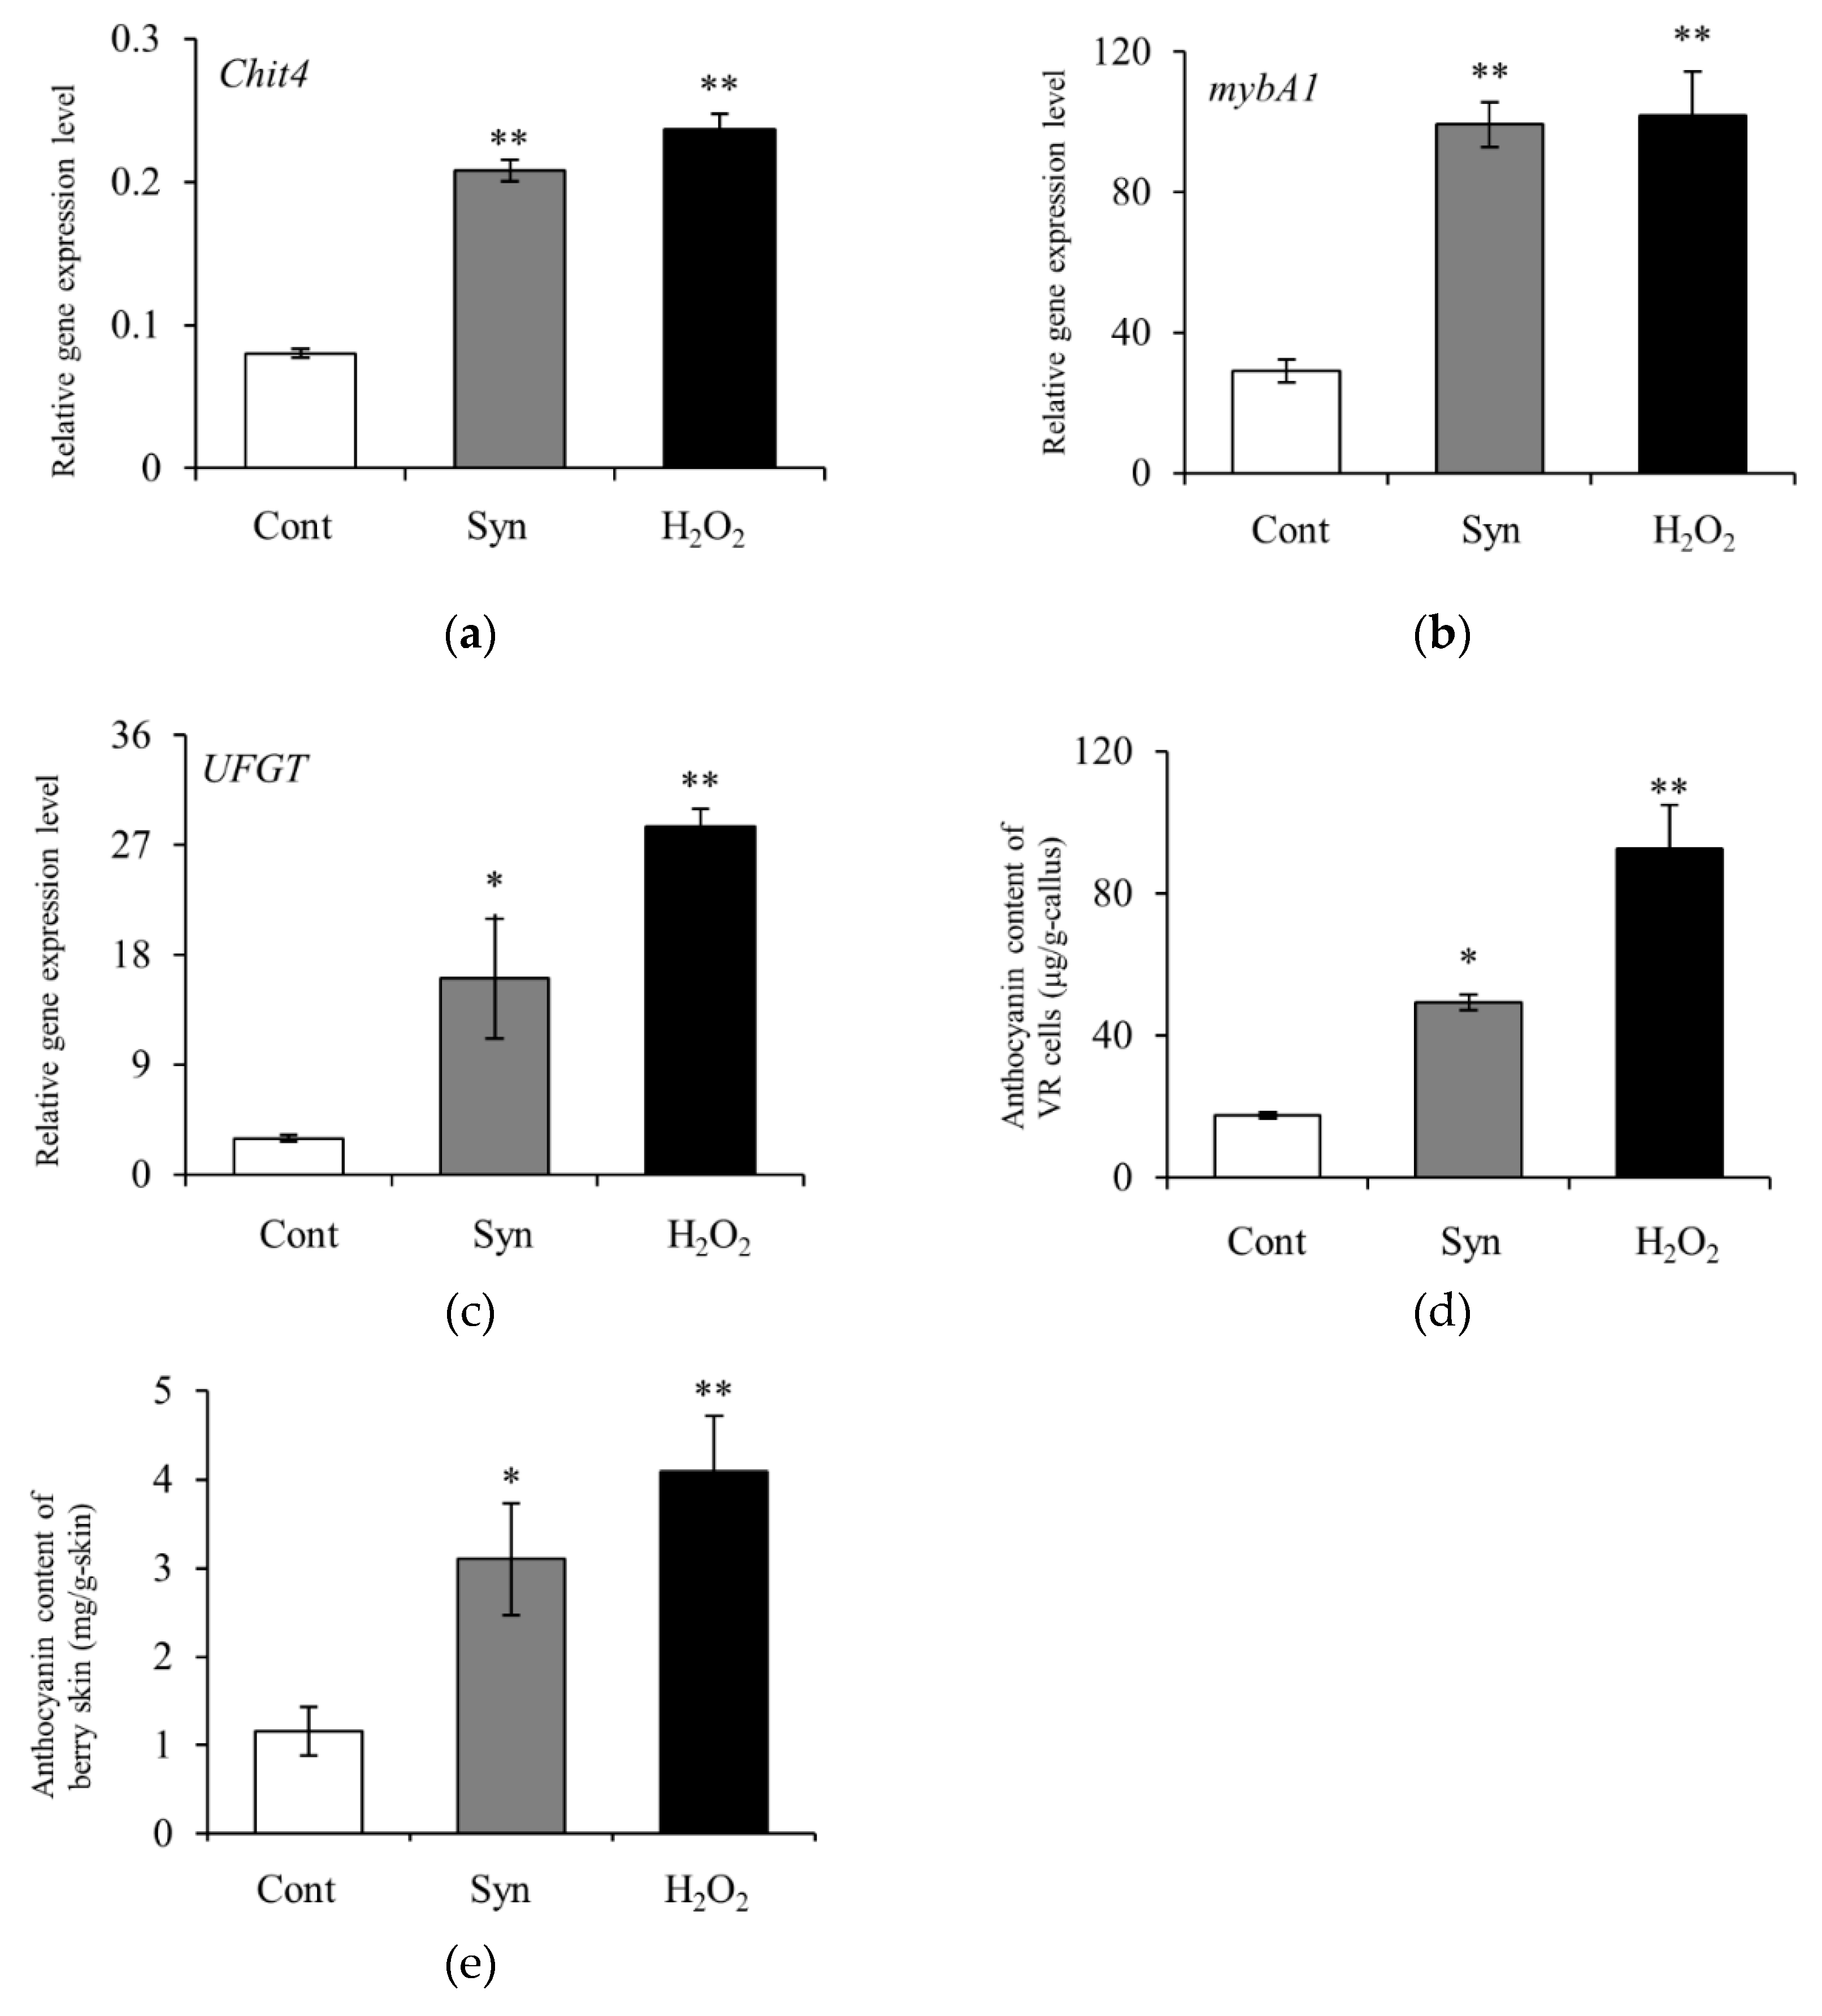
Chit4 encoding a class 4 chitinase [EC 3.2.1.14] was measured as an H2O2-responsive gene. The relative expression level of Chit4 was significantly higher (Dunnett, P < 0.01) in VR cells 4 days after treatment with Syn or H2O2 than in Control (Figure 6a). Syn and H2O2 treatments also significantly increased the relative expression levels of mybA1 and UFGT 4 days after the treatments and the anthocyanin content 7 days after (Dunnett, P < 0.01 or 0.05) compared with Control (Figure 6b–d). In berries, these treatments also promoted anthocyanin accumulation 9 days after treatment (Dunnett, P < 0.01 or 0.05) (Figure 6e). These results suggest that Syn induces anthocyanin accumulation via H2O2.

3. Discussion

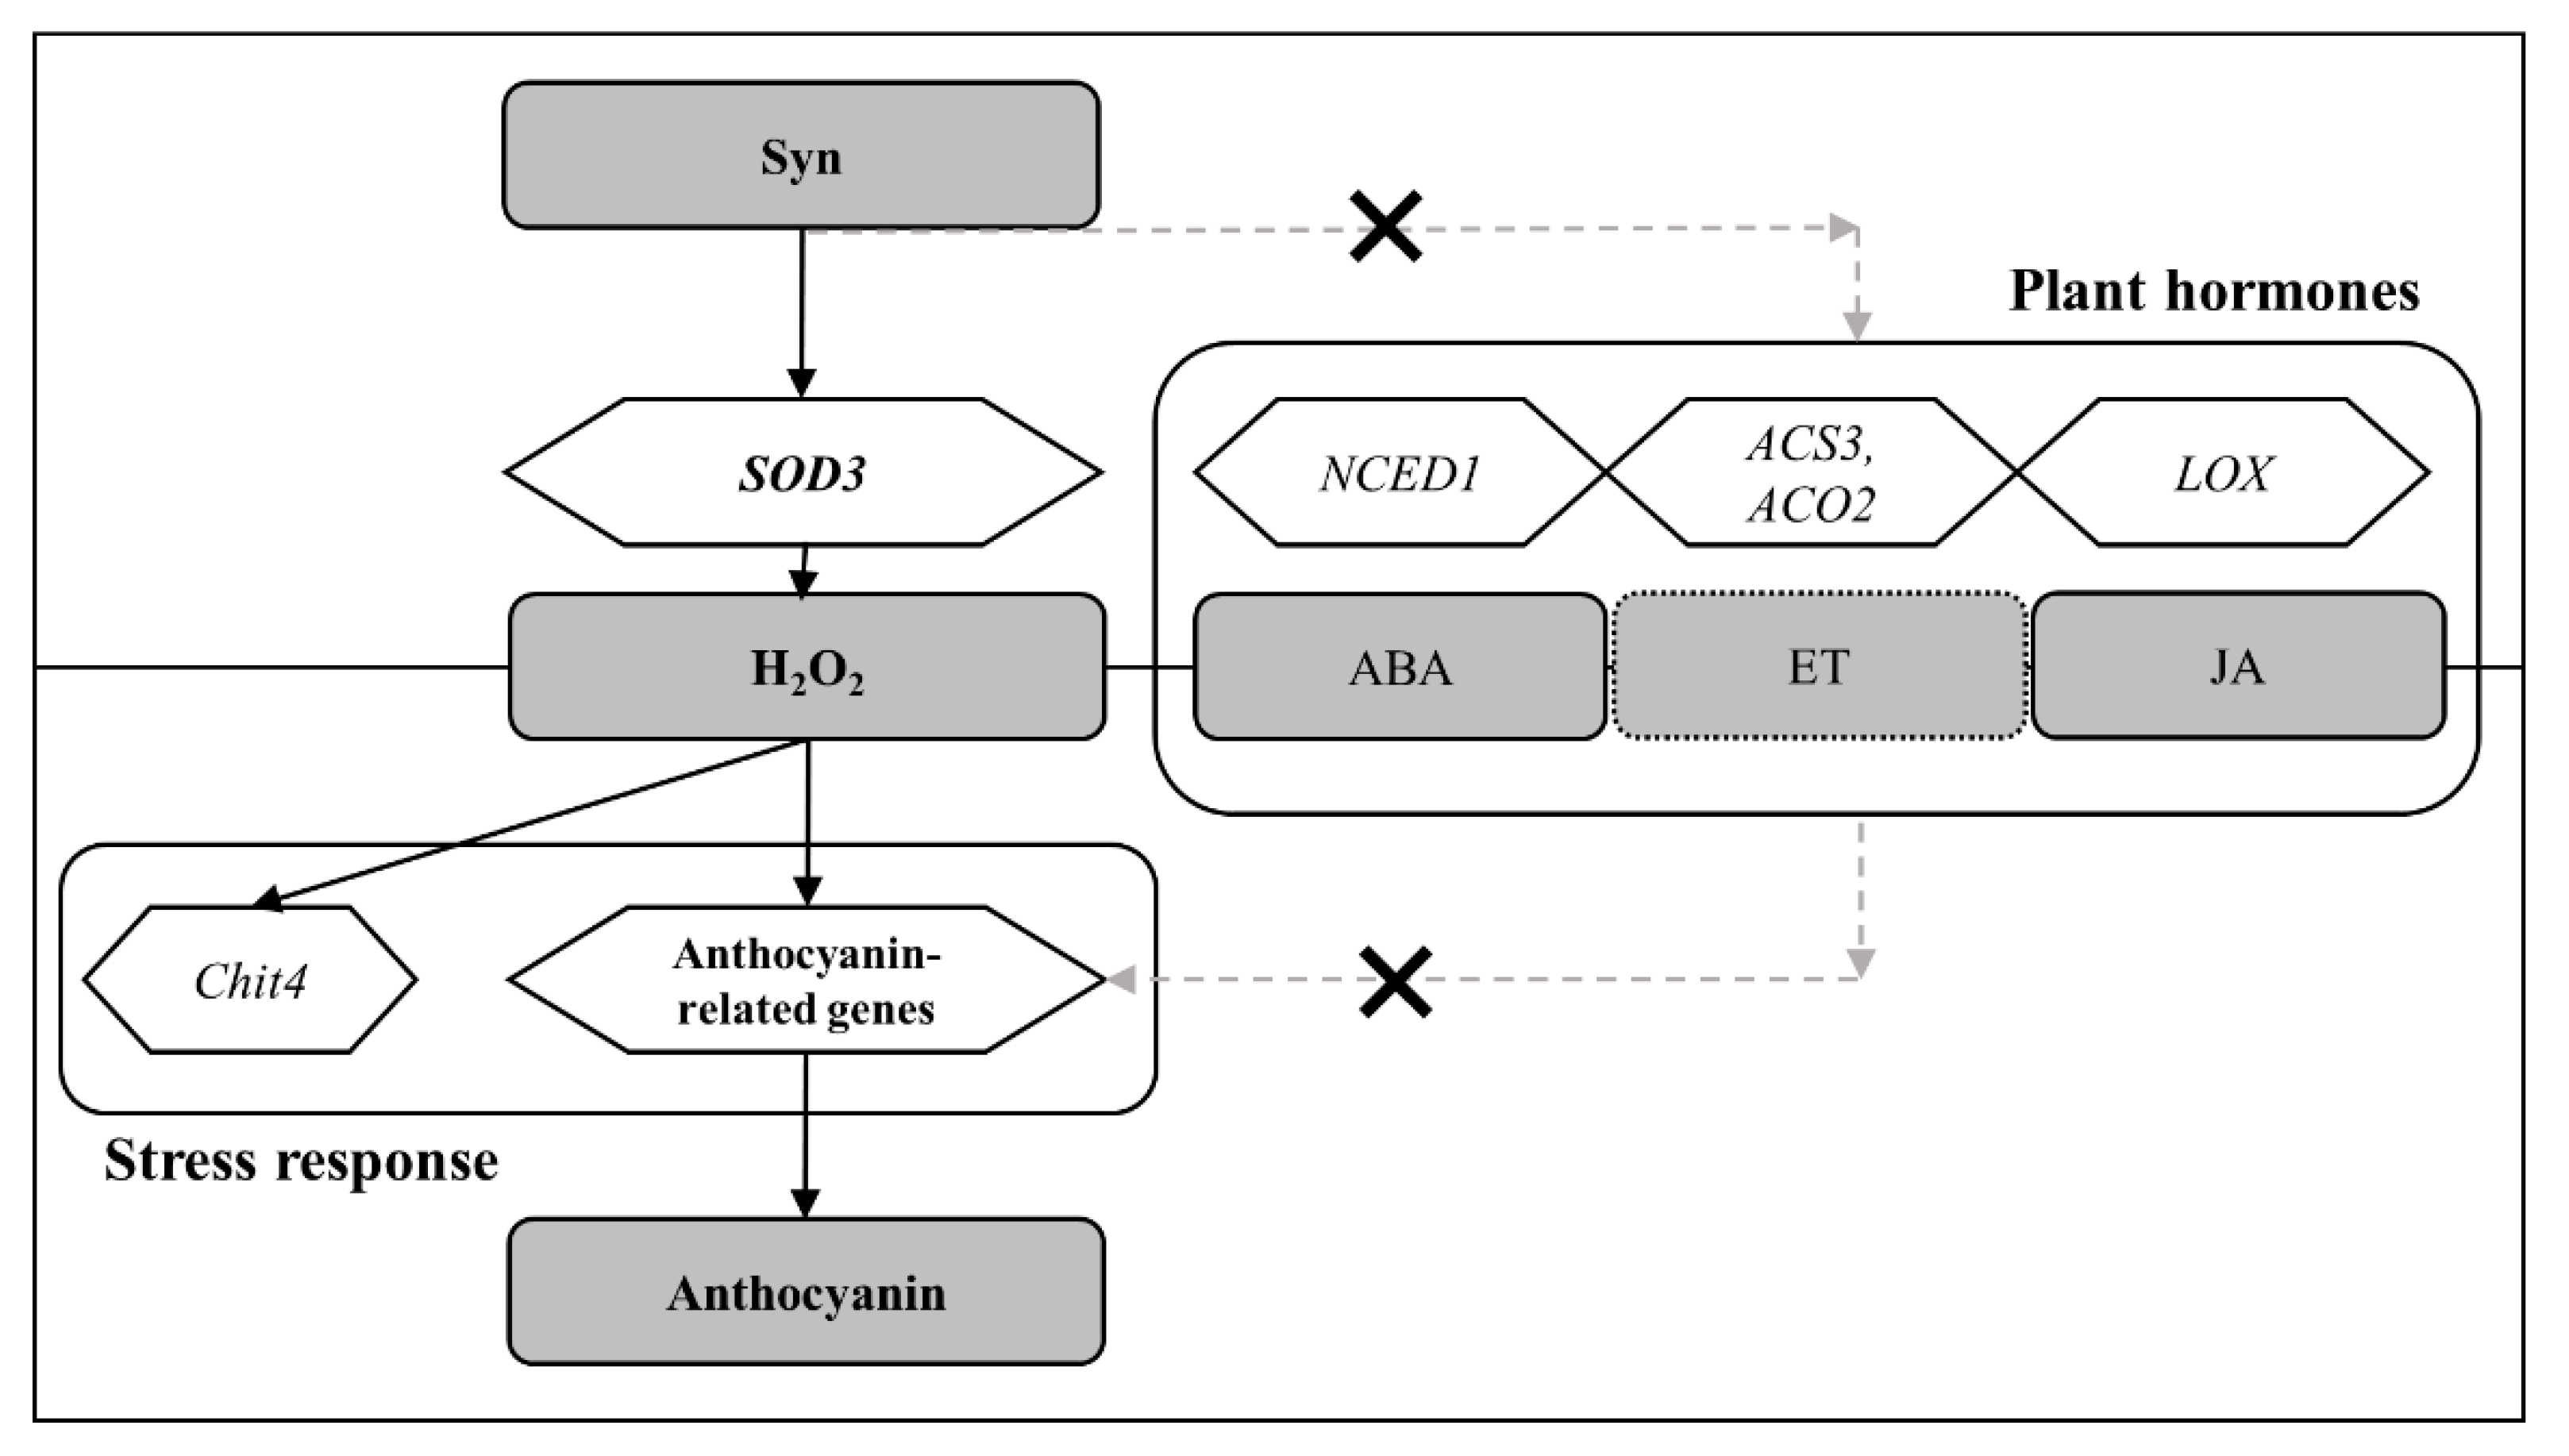
The proposed mechanism by which Syn promotes anthocyanin accumulation found in this study is shown in Figure 7. Syn has a phenethylamine skeleton and is biosynthesized from Phe, which is also the substrate for anthocyanin biosynthesis [30] and promotes coloration in grapes [22]. The lack of color in VR cells treated with Syn at intermediate concentrations suggests that the effects of Syn are different from those of Phe (Figure 1). Then, what is the mechanism by which Syn confers coloration? Syn activates SOD3 and induces H2O2 accumulation, as shown in Figure 5. H2O2 induces anthocyanin accumulation in many plant species including Arabidopsis [31,32] and Begonia [33]. On the basis of these findings, we consider that Syn induces anthocyanin biosynthesis in grape cells and berries by activating anthocyanin-biosynthesis-related genes in VR cells, similarly to H2O2 treatment (Figure 6). The effects of Syn have been well investigated in the human body, including the lipolytic effect [25,26]. However, the effects of Syn on plant coloration have not been reported. This is the first study to demonstrate that Syn promotes anthocyanin biosynthesis by increasing H2O2 in grape cells.
Syn upregulated SOD3 at a very early stage, from 3 h to 12 h after treatment, and promoted H2O2 generation from 3 h to 24 h after treatment (Figure 5). Syn is classified as a phenethylamine derivative. In yeast and tobacco, the Syn analog β-phenylethylethylamine promotes H2O2 generation [34,35]. These findings suggest that Syn, similar to substances with a phenethylamine skeleton, is an early inducer of H2O2 in cells. On the other hand, H2O2 also crosstalks with phytohormones and is a signaling molecule that regulates physiological processes such as plant growth and stress response [36,37,38]. Syn did not markedly alter the expression of genes encoding the biosynthesis rate-limiting enzymes of each phytohormone at 12 h after treatment, and it did not significantly increase ABA and JA contents or the expression level of ACO2, which catalyzes ET biosynthesis, at 24 h after treatment (Figure 4). Syn also did not increase the sugar/acid ratio, a ripeness index related to ABA and ET, in grape berries (Figure 2). Therefore, these findings suggest that the H2O2 content increased by Syn does not affect the biosynthesis of each phytohormone evaluated in this study at 24 h after treatment, although more detailed evaluation of the crosstalk between H2O2 and each phytohormone is needed in the future.
This study revealed that Syn induces anthocyanin accumulation in VR cells by a mechanism similar to that of H2O2 production. H2O2, a type of reactive oxygen species (ROS), alters the redox state of its surroundings and functions as a signaling molecule in vivo, but the balance between ROS production and removal is strictly regulated in cells because excess amounts of ROS cause oxidative injury to cell components [37,39]. In Arabidopsis, the accumulation of anthocyanins with antioxidant properties plays an important role in conferring tolerance to ROS-induced oxidative stress [40]. H2O2 produced by UV irradiation increased anthocyanin accumulation in radish sprouts [41]. Indeed, H2O2 application also increases anthocyanin accumulation in "Kyoho" grapes [42]. On the other hand, oxidative stress due to ROS production induces the expression of chitinase [43,44]. H2O2 induced by methionine increases the expression level of class IV chitinase in grapes [45]. Thus, the expression level of class IV chitinase can be used as a marker of H2O2-induced oxidative stress response. Although gene expression level analysis and H2O2 quantification were not performed on berries, both Syn and H2O2 were found to induce the expression of Chit4 at high levels in VR cells, which in turn induced the accumulation of anthocyanins (Figure 6), indicating that both substances induce oxidative stress in grape cells. Together, these findings suggest that Syn induces the accumulation of the antioxidant anthocyanin by inducing oxidative stress in plant cells similarly to H2O2.
How can Syn be used in viticulture? Syn promotes anthocyanin biosynthesis by increasing H2O2 production without phytohormones such as ABA, suggesting that Syn can improve grape coloration without undesirable side effects such as defoliation when ABA is used. On the other hand, the safety of Syn for use in the agricultural and food industry needs to be considered. Syn can be safely used as a dietary supplement [46,47], although there have been concerns about the health hazards of Syn because of its structural similarity to the doping agent ephedrine. On the other hand, H2O2 is a highly reactive deleterious substance; thus, many countries have set criteria for its content in foods. H2O2 in small amounts functions as a signaling molecule in cells, but H2O2 in excess amounts is toxic; thus, organisms have mechanisms to remove excess H2O2 through catalase and other enzymes. [37]. The findings that Syn rapidly increased the transcription levels of APX6 and CAT and reduced H2O2 content in Syn-treated VR cells to the same levels as those in Control at 24 h (Figure 5) suggest that Syn can be used as a transient and safe H2O2 inducer. Further evaluation of its possible undesirable effects such as defoliation and analysis of H2O2 residues in Syn-treated grapevines in field trials are required to confirm the usefulness of Syn as a safe grape color quality enhancing agent, thereby contributing to viticulture and the wine industry.

4. Materials and Methods

4.1. In Vitro Trials

Cultured grapevine cells (VR cells) were used in this study. VR cells (PRC00003) were provided by the RIKEN BioResource Center Research (RIKEN BRC) through the National BioResource Project of MEXT/AMED, Japan. The cell line was derived from Vitis hybrid cv. Bailey Alicante A, which has high anthocyanin-biosynthesizing ability [48]. Modified Linsmaier and Skoog (LS) medium (pH 6.1) containing 3% (w/v) sucrose, 0.05 mg/L 2,4,-dichlorophenoxyacetic acid (2,4-D), and 0.2 g/L kinetin was used. The medium was autoclaved (1.06 kg cm-2) at 121°C for 15 min, gelled with 1.2% (w/v) agar, and poured into disposable sterile plastic petri dishes. Only white VR cells without red coloration were subcultured every week under sterile conditions and grown in a dark incubator at 27°C.
In the coloration experiments, because phytohormones 2,4-D and kinetin inhibit anthocyanin accumulation during maturation, 10 mL of modified LS medium without phytohormones was autoclaved and dispensed into 70×16.5-mm-diameter petri dishes. One dish was inoculated with 3–4 VR cells (each approximately 5 mm in diameter) under sterile conditions and incubated for up to 7 days in an incubator at 27°C, 54.2 μmol m-2 s-1/16 h/day. The final concentrations of the test solutions in the medium were as follows: Syn concentrations of 0.01, 0.1, 1, 5, and 10 mM; molecular structure specificity, 5 mM each of phenylalanine (Phe), L-(-)-tyrosine (L-Tyro), tyramine (Tyra), octopamine hydrochloride (Oct), Syn, and control (Cont) (Tokyo Chemical Industry, Japan); H2O2 test, 10 mM H2O2 (30% H2O2, Fujifilm Wako, Japan). Stock solutions of reagents were prepared and sterilized by filtration using a sterile syringe (2.5 mL SS-02SZ, Terumo, Japan) and a sterile filter (Minisart® 0.45 µm syringe filter, Sartorius, Germany). Each sterile solution was added into the autoclaved medium and adjusted to the above concentrations.

4.2. Field Trials

Vitis vinifera cv. Syrah grapevines in the experimental vineyard (2019, 2021) of The Institute of Enology and Viticulture and an affiliated farm (2022) of the University of Yamanashi (Yamanashi, Japan) were used. The grapevines were approximately 30 years old and grown using the double-cordon-style training method.
A solution of 1 mM Syn with 0.01% (v/v) Approach BI (Kao, Japan) was prepared. The grapevines were defoliated in the fruit zone before veraison and were sprayed with 500 mL of water (as control) or Syn solution per grapevine at veraison (July 30, 2019; July 18, 2021). Thereafter, grape bunches were sampled every 10 days. The berries were photographed and stored at -80°C until analyses.
Solutions of 1 mM Syn and 300 mM H2O2 with 0.01% (v/v) Approach BI (Kao, Japan) were prepared (August 10, 2022). Nine grape bunches were randomly selected from one grapevine. Three bunches each were sprayed with water (Control), Syn, and H2O2. On days 0 and 9 after spraying, bunches were harvested and 10 berries per bunch were randomly collected to determine anthocyanin content.

4.3. Total RNA Isolation

VR cells, 300 μL of Fruit-mateTM for RNA Purification (TaKaRa, Japan), and 300 μL of Buffer RLT for use with an RNA extraction kit (RNeasy Plant Mini kit, QIAGEN, Germany) were added to a 2.0 mL tube. The mixture was homogenized (30.0 Hz, 3 min) using TissueLyser II (QIAGEN) and centrifuged at 120 rpm for 3 min at 4℃. Total RNA was then extracted from 450 μL of supernatant using QIAcube (QIAGEN) with the RNeasy Plant Mini Kit and accessories in accordance with the product manual.

4.4. Real-Time RT-PCR Analysis

Single-stranded cDNA was synthesized from total RNA using a PrimeScriptTM RT Reagent Kit with gDNA Eraser (TaKaRa) and TaKaRa Cycler DiceTM mini (TaKaRa) in accordance with the manufacturer's manual. Real-time RT-PCR was performed using TB Green Premix Ex Taq II (Tli RNaseH Plus) (TaKaRa) with Thermal Cycler Dice Real Time System III (TaKaRa) in accordance with the manufacturer's manual. Data were analyzed using Thermal Cycler Dice® Real Time System Single Software ver. 5.11. Actin was used for normalization because it is recommended as a reference gene for grapes, and expression levels are shown as relative values [49]. The real-time RT-PCR conditions were as follows: 37 ºC for 15 min for RT reaction and 85 ºC for 5 s for cDNA synthesis, and then 40 cycles at 95 ºC for 5 s and at 60 ºC for 30 s for PCR amplification. The nucleotide sequences of the primers were as follows: Vvactin (5’-CAAGAGCTGGAAACTGCAAAGA-3’ and 5’-AATGAGAGATGGCTGGAAGAGG-3’, GenBank accession no. AF369524), PAL (5’-AAACAAGGTGGTGCCCTTCA-3’ and 5’- GGTGTTGATCCTCACGAGCA-3’, NM_001397918), C4H (5’-AAAGGGTGGGCAGTTCAGTT-3’ and 5’-GGGGGGTGAAAGGAAGATAT-3’, XM_002266202), 4CL (5’-AGATGGGGATCAAGCAAGGC-3’ and 5’-ATCTCGGCCGGCATGTAAAA-3’, XM_002272746), CHS (5’-TCTGAGCGAGTATGGGAACATG-3’ and 5’-CTGTGCTGGCTTTCCCTTCT-3’, NM_001280950), CHI (5’-GACGGGTCGCCAGTATTCAG-3’ and 5’-GCTTTGGCTTCTGCGTCAGT-3’, NM_001281104), F3'H (5’-TATGGGCTGACCCTACAACGA-3’ and 5’-CCTGGGCAAACAACCTCATT-3’, NM_001280987), F3'5'H (5’-AGGGTCGGAGTCAAATGAGTTC-3’ and 5’-CGCTGGATCCCTTGGATGT-3’, NM_001281235), F3H (5’-CCAATCATAGCAGACTGTCC-3’ and 5’-TCAGAGGATACACGGTTGCC-3’, NM_001281105), DFR (5’-AACTGCTCTTTCCCCGA-3’ and 5’-AACGTCCCTCTGCCTTAGGATTC-3’, NM_001281215), LDOX (5’-GCGATATGACCATCTGGCCTAA-3’ and 5’-ATCCCAACCCAAGCGATAGC-3’, NM_001281218.1), mybA1 (5’-GCAAGCCTCAGGACAGAAGAA-3’ and 5’-ATCCCAGAAGCCCACATCAA-3’, AB111101), UFGT (5’-CTTCTTCAGCACCAGCCAATC-3’ and 5’-AGGCACACCGTCGGAGATAT-3’, NM_001397857.1), NCED1 (5’-GAGACCCCAACTCTGGCAGG-3’ and 5’-AAGGTGCCGTGGAATCCATAG-3’, NM_001281270.1), ACS3 (5’-CCACCCCATACTACCCAGGA-3’ and 5’-TTGAGGCTGCGTTTTTGAGC-3’, XM_003635528.3), ACO2 (5’-CAAATGGACGCTGTGGAAAA-3’ and 5’-ATGGCGGAGGAAGAAGGTACT-3’, NM_001280942.1), LOX (5’-TGGGCTGAAGCTTTTGATAG-3’ and 5’-CTTGGGCTTGGGTAGTAGT-3’, FJ858257)[50], SOD3 (5’-GGCGATTCATCTACGGTTGTC-3’ and 5’-CCTCCGCCGTTGAACTTG-3’, NM_001281206)[51], APX6 (5’-GCCCACTCTCCCCATTCTC-3’ and 5’-TGGAGTTTTGGCGGGAAAT-3’, XM_002282641)[51], CAT (5’-GGAGGATGAAGCCATAAGAG-3’ and 5’-GGCTGCAAGGGCAAGATA-3’, XM_003631877)[52], and chit4 (5’- CAATCGGGTCCTTGTGATTC-3’ and 5’- CAAGGCACTGAGAAACGCT-3’, U97522, respectively).

4.5. Total Anthocyanin Content

Anthocyanins in berry skins or VR cells were extracted using the procedure of Yokotsuka et al. (1999) [53] with modifications. Briefly, 10 randomly selected berries per bunch were peeled and crushed with liquid nitrogen using a mortar and pestle. One gram of crushed skin or weighed VR cells was immersed in an appropriate amount of 1% HCl–methanol overnight in the dark. The mixture was centrifuged at 10,000 rpm for 5 min, and the supernatant was diluted with 1% HCl–methanol. After mixing, absorbance was measured at 520 nm using a spectrophotometer (ASV11D-S, AS ONE, Japan). Total anthocyanin content (malvidin-3-O-glucoside equivalent) in skin and VR cells was calculated according to a published formula [51].

4.6. Sugar/Acid Ratio

Ten berries per bunch were pressed to obtain grape juice. The juice was centrifuged at 10,000 rpm for 5 min. The sugar (Brix)/acid ratio of the supernatant was measured using a pocket refractometer (PAL-BX|ACID2, ATAGO, Japan) in accordance with the manufacturer's instructions.

4.7. Phytohormone Contents

Each phytohormone was quantified by ELISA. JA content in VR cells was measured in accordance with the manual for plant JA using an ELISA kit (MyBioSource, USA), as reported by Tsai et al. (2019) [55]. Briefly, VR cells cultured for 24 h and PBS (100 μL of PBS/10 mg of tissue) were added to a 2 mL Eppendorf tube and homogenized (30.0 Hz, 3 min) using TissueLyser II (QIAGEN). Then, 50 μL of the supernatant was centrifuged in a tabletop centrifuge and dispensed into a 96-well plate. Within 15 min after the addition of Stop Solution in the kit, absorbance t was measured at 450 nm using an absorbance microplate reader, and JA content was calculated by the calibration curve method. Similarly, ABA content in VR cells cultured for 24 h was measured using a plant hormone ABA ELISA kit (CUSABIO, USA) as reported by Enoki et al. (2017) [4].

4.8. H2O2 Content

H2O2 content was determined using a Cell MeterTM Intracellular Fluorimetric Hydrogen Peroxide Assay Kit *Green Fluorescence* (AAT Bioquest, USA) on the basis of the method of Nie et al. (2020) [56] with modifications. Briefly, VR cells and Component C assay buffer (200 mg/mL) were added to a 2 mL Eppendorf tube and homogenized (30.0 Hz, 3 min) using a TissueLyser II (QIAGEN). The homogenate was separated using a tabletop centrifuge, and 50 μL of the supernatant was used as a test sample. After the reaction solution was added in accordance with the manufacturer's instructions, the mixtures were incubated at room temperature for 20 min, and fluorescence intensity was measured at Ex/Em=485/538 nm using a fluorescence microplate reader. H2O2 content was calculated using the calibration curve method.

4.9. Statistical Analysis

Data are presented as means ± standard error (SE). Statistical analysis was performed using BellCurve for Excel software (Social Survey Research Information, Japan) with the Student's t-test, Tukey test, or Dunnett test.

5. Conclusions

This study demonstrated the molecular mechanism of the effect of synephrine (Syn) on anthocyanin accumulation. The anthocyanin accumulation was increased by induction of hydrogen peroxide, but not phytohormones, and the upregulation of a group of anthocyanin biosynthesis-related genes in Syn-treated cells. The results of upregulated chitinase gene, a stress response marker, by Syn treatment suggest that Syn increases the accumulation of the antioxidant anthocyanin by inducing oxidative stress due to hydrogen peroxide. In the future, the new approach of promoting coloration by synephrine (Syn) application to grape berries may serve as an alternative to the conventional use of phytohormone-related agents for improving grape quality.

Author Contributions

Conceptualization, M.S., S.S. and S.E.; methodology, M.S., S.S and S.E.; validation, M.S. and A.K.; formal analysis, M.S. and A.K.; investigation, M.S., A.K. and S.E.; resources, S.S.; data curation, S.S.; writing—original draft preparation, M.S. and S.E.; writing—review and editing, S.S. and S.E.; visualization, M.S, S.S. and S.E.; supervision, S.S. and S.E.; project administration, S.S. and S.E. All authors have read and agreed to the published version of the manuscript.

Funding

This research received no external funding.

Institutional Review Board Statement

Not applicable.

Informed Consent Statement

Not applicable.

Data Availability Statement

The raw data supporting the conclusions of this article will be made available by the authors on request.

Acknowledgments

VR cells (rpc00003) were provided by RIKEN BRC, which is participating in the National BioResource Project of MEXT/AMED, Japan. We thank Misa Otoguro, Masashi Hisamoto, Keisuke Sugiyama, and Mika Watanabe of the University of Yamanashi for advice on experiments.

Conflicts of Interest

The authors declare no conflicts of interest.

References

  1. Chorti, E.; Guidoni, S.; Ferrandino, A.; Novello, V. Effect of different cluster sunlight exposure levels on ripening and anthocyanin accumulation in Nebbiolo grapes. Am. J. Enol. Vitic. 2010, 61, 23–30. [Google Scholar] [CrossRef]
  2. Castellarin, S. D.; Matthews, M. A.; Di Gaspero, G.; Gambetta, G. A. Water deficits accelerate ripening and induce changes in gene expression regulating flavonoid biosynthesis in grape berries. Planta 2007, 227, 101–112. [Google Scholar] [CrossRef] [PubMed]
  3. Mori, K.; Goto-Yamamoto, N.; Kitayama, M.; Hashizume, K. Effect of high temperature on anthocyanin composition and transcription of flavonoid hydroxylase genes in ‘Pinot noir’ grapes (Vitis vinifera). J. Hortic. Sci. Biotechnol. 2007, 82, 199–206. [Google Scholar] [CrossRef]
  4. Enoki, S.; Hattori, T.; Ishiai, S.; Tanaka, S.; Mikami, M.; Arita, K.; Nagasaka, S; Suzuki S. Vanillylacetone up-regulates anthocyanin accumulation and expression of anthocyanin biosynthetic genes by inducing endogenous abscisic acid in grapevine tissues. J. Plant Physiol. 2017, 219, 22–27. [Google Scholar] [CrossRef] [PubMed]
  5. Koyama, R.; Roberto, S. R.; De Souza, R. T.; Borges, W. F.; Anderson, M.; Waterhouse, A. L.; Cantu, D; Fidelibus, M. W; Balanco-Ulate, B. Exogenous abscisic acid promotes anthocyanin biosynthesis and increased expression of flavonoid synthesis genes in Vitis vinifera × Vitis labrusca table grapes in a subtropical region. Front. Plant Sci. 2018, 9, 323. [Google Scholar] [CrossRef] [PubMed]
  6. Moriyama, A.; Nojiri, M.; Watanabe, G.; Eoki, S.; Suzuki, S. Exogenous allantoin improves anthocyanin accumulation in grape berry skin at early stage of ripening. J. Plant Physiol. 2020, 253, 153253. [Google Scholar] [CrossRef]
  7. Yamazaki, M.; Ishida, A.; Suzuki, Y.; Aoki, Y.; Suzuki, S.; Enoki, S. Ethylene Induced by Sound Stimulation Enhances Anthocyanin Accumulation in Grape Berry Skin through Direct Upregulation of UDP-Glucose: Flavonoid 3-O-Glucosyltransferase. Cells 2021, 10, 2799. [Google Scholar] [CrossRef] [PubMed]
  8. Concha, C. M.; Figueroa, N. E.; Poblete, L. A.; Oñate, F. A.; Schwab, W.; Figueroa, C. R. Methyl jasmonate treatment induces changes in fruit ripening by modifying the expression of several ripening genes in Fragaria chiloensis fruit. Plant Physiol. Biochem. 2013, 70, 433–444. [Google Scholar] [CrossRef] [PubMed]
  9. Pilati, S.; Bagagli, G.; Sonego, P.; Moretto, M.; Brazzale, D.; Castorina, G.; Simoni, L.; Tonelli, C.; Guella, G.; Engelen, K.; et al. Abscisic acid is a major regulator of grape berry ripening onset: New insights into ABA signaling network. Front. Plant Sci. 2017, 8, 1093. [Google Scholar] [CrossRef]
  10. Yamane, T.; Jeong, S. T.; Goto-Yamamoto, N.; Koshita, Y.; Kobayashi, S. Effects of temperature on anthocyanin biosynthesis in grape berry skins. Am. J. Enol. Vitic. 2006, 57, 54–59. [Google Scholar] [CrossRef]
  11. Fernandes de Oliveira, A.; Mercenaro, L.; Del Caro, A.; Pretti, L.; Nieddu, G. Distinctive anthocyanin accumulation responses to temperature and natural UV radiation of two field-grown Vitis vinifera L. cultivars. Molecules 2015, 20, 2061–2080. [Google Scholar] [CrossRef] [PubMed]
  12. Jones, G. V.; White, M. A.; Cooper, O. R.; Storchmann, K. Climate change and global wine quality. Clim. Change 2005, 73, 319–343. [Google Scholar] [CrossRef]
  13. Koshita, Y.; Yamane, T.; Yakushiji, H.; Azuma, A.; Mitani, N. Regulation of skin color in ‘Aki Queen’grapes: Interactive effects of temperature, girdling, and leaf shading treatments on coloration and total soluble solids. Sci. Hortic. 2011, 129, 98–101. [Google Scholar] [CrossRef]
  14. Tardaguila, J.; de Toda, F. M.; Poni, S.; Diago, M. P. Impact of early leaf removal on yield and fruit and wine composition of Vitis vinifera L. Graciano and Carignan. Am. J. Enol. Vitic. 2010, 61, 372–381. [Google Scholar] [CrossRef]
  15. Matsuyama, S.; Tanzawa, F.; Kobayashi, H.; Suzuki, S.; Takata, R.; Saito, H. Leaf removal accelerated accumulation of delphinidin-based anthocyanins in ‘Muscat Bailey A’ [Vitis× labruscana (Bailey) and Vitis vinifera (Muscat Hamburg)] grape skin. J. Jpn. Soc. Hortic. Sci. 2013, CH-062. [Google Scholar] [CrossRef]
  16. Guidoni, S.; Allara, P.; Schubert, A. Effect of cluster thinning on berry skin anthocyanin composition of Vitis vinifera cv. Nebbiolo. Am. J. Enol. Vitic. 2002, 53, 224–226. [Google Scholar] [CrossRef]
  17. Mori, K.; Saito, H.; Goto-Yamamoto, N.; Kitayama, M.; Kobayashi, S.; Sugaya, S.; Gemma, H; Hashizume, K. Effects of abscisic acid treatment and night temperatures on anthocyanin composition in Pinot noir grapes. Vitis 2005, 44, 161. [Google Scholar]
  18. Peppi, M. C.; Walker, M. A.; Fidelibus, M. W. Application of abscisic acid rapidly upregulated UFGT gene expression and improved color of grape berries. Vitis 2008, 47, 11. [Google Scholar]
  19. Sandhu, A. K.; Gray, D. J.; Lu, J.; Gu, L. Effects of exogenous abscisic acid on antioxidant capacities, anthocyanins, and flavonol contents of muscadine grape (Vitis rotundifolia) skins. Food Chem. 2011, 126, 982–988. [Google Scholar] [CrossRef]
  20. Kataoka, I. Effect of abscisic acid and defoliation on anthocyanin accumulation in' Kyoho'grapes (Vitis vinifera L.× V. labruscana Bailey). Vitis 1982, 21, 325–332. [Google Scholar]
  21. Mikami, N.; Konya, M.; Enoki, S.; Suzuki, S. Geraniol as a Potential Stimulant for Improving Anthocyanin Accumulation in Grape Berry Skin through ABA Membrane Transport. Plants 2022, 11, 1694. [Google Scholar] [CrossRef] [PubMed]
  22. Hattori, T.; Chen, Y.; Enoki, S.; Igarashi, D.; Suzuki, S. Exogenous isoleucine and phenylalanine interact with abscisic acid-mediated anthocyanin accumulation in grape. Folia Hortic. 2019, 31, 147–157. [Google Scholar] [CrossRef]
  23. Pellati, F.; Benvenuti, S. Fast high-performance liquid chromatography analysis of phenethylamine alkaloids in Citrus natural products on a pentafluorophenylpropyl stationary phase. J. Chromatogr. A. 2007, 1165, 58–66. [Google Scholar] [CrossRef] [PubMed]
  24. Dragull, K.; Breksa III, A. P.; Cain, B. Synephrine content of juice from Satsuma mandarins (Citrus unshiu Marcovitch). J. Agric. Food Chem. 2008, 56, 8874–8878. [Google Scholar] [CrossRef] [PubMed]
  25. Colker, C. M.; Kaiman, D. S.; Torina, G. C.; Perlis, T.; Street, C. Effects of Citrus aurantium extract, caffeine, and St. John's wort on body fat loss, lipid levels, and mood states in overweight healthy adults. Curr Ther Res. 1999, 60, 145–153. [Google Scholar] [CrossRef]
  26. Gutiérrez-Hellín, J.; Del Coso, J. Acute p-synephrine ingestion increases fat oxidation rate during exercise. Br. J. Clin. Pharmacol. 2016, 82, 362–368. [Google Scholar] [CrossRef]
  27. D’Andrea, G.; Pizzolato, G.; Gucciardi, A.; Stocchero, M.; Giordano, G.; Baraldi, E.; Leon, A. Different circulating trace amine profiles in de novo and treated Parkinson’s disease patients. Sci. Rep. 2019, 9, 1–11. [Google Scholar] [CrossRef]
  28. Ford, C. M.; Boss, P. K.; Høj, P. B. Cloning and characterization of Vitis vinifera UDP-Glucose: Flavonoid 3-O-glucosyltransferase, a homologue of the enzyme encoded by the maize bronze-1Locus that may primarily serve to glucosylate anthocyanidins in vivo. JBC. 1998, 273, 9224–9233. [Google Scholar] [CrossRef] [PubMed]
  29. Kobayashi, S.; Goto-Yamamoto, N.; Hirochika, H. Association of VvmybA1 gene expression with anthocyanin production in grape (Vitis vinifera) skin-color mutants. J. Jpn. Soc. Hortic. Sci. 2005, 74, 196–203. [Google Scholar] [CrossRef]
  30. Cheng, G. W.; Breen, P. J. Activity of phenylalanine ammonia-lyase (PAL) and concentrations of anthocyanins and phenolics in developing strawberry fruit. J. Am. Soc. Hortic. Sci. 1991, 116, 865–869. [Google Scholar] [CrossRef]
  31. Xu, Z.; Mahmood, K.; Rothstein, S. J. ROS induces anthocyanin production via late biosynthetic genes and anthocyanin deficiency confers the hypersensitivity to ROS-generating stresses in Arabidopsis. Plant Cell Physiol. 2017, 58, 1364–1377. [Google Scholar] [CrossRef]
  32. Shi, H.; Liu, G.; Wei, Y.; Chan, Z. The zinc-finger transcription factor ZAT6 is essential for hydrogen peroxide induction of anthocyanin synthesis in Arabidopsis. Plant Mol. Biol. 2018, 97, 165–176. [Google Scholar] [CrossRef]
  33. Qu, Y.; Bai, X.; Zhu, Y.; Qi, R.; Tian, G.; Wang, Y.; Li, Y.; Zhang, K. Reactive oxygen species acts as an important inducer in low-temperature-induced anthocyanin biosynthesis in Begonia semperflorens. J. Am. Soc. Hortic. Sci. 2018, 143, 486–493. [Google Scholar] [CrossRef]
  34. Kawano, T.; Pinontoan, R.; Uozumi, N.; Miyake, C.; Asada, K.; Kolattukudy, P. E.; Muto, S. Aromatic monoamine-induced immediate oxidative burst leading to an increase in cytosolic Ca2+ concentration in tobacco suspension culture. Plant Cell Physiol. 2000, 41, 1251–1258. [Google Scholar] [CrossRef] [PubMed]
  35. Pinontoan, R.; Krystofova, S.; Kawano, T.; Mori, I. C.; Tsuji, F. I.; Iida, H.; Muto, S. Phenylethylamine induces an increase in cytosolic Ca2+ in yeast. BBB. 2002, 66, 1069–1074. [Google Scholar] [CrossRef]
  36. Bartoli, C. G.; Casalongué, C. A.; Simontacchi, M.; Marquez-Garcia, B.; Foyer, C. H. Interactions between hormone and redox signaling pathways in the control of growth and cross tolerance to stress. ENVIRON EXP BOT. 2013, 94, 73–88. [Google Scholar] [CrossRef]
  37. Hossain, M. A.; Bhattacharjee, S.; Armin, S. M.; Qian, P.; Xin, W.; Li, H. Y.; Burritt, D. J.; Fujita, M.; Tran, L. S. P. Hydrogen peroxide priming modulates abiotic oxidative stress tolerance: Insights from ROS detoxification and scavenging. Front. Plant Sci. 2015, 6, 420. [Google Scholar] [CrossRef]
  38. Saxena, I.; Srikanth, S.; Chen, Z. Cross talk between H2O2 and interacting signal molecules under plant stress response. Front. Plant Sci. 2016, 7, 570. [Google Scholar] [CrossRef]
  39. Ozden, M.; Demirel, U.; Kahraman, A. Effects of proline on antioxidant system in leaves of grapevine (Vitis vinifera L.) exposed to oxidative stress by H2O2. Sci. Hortic. 2009, 119, 163–168. [Google Scholar] [CrossRef]
  40. Nakabayashi, R.; Yonekura-Sakakibara, K.; Urano, K.; Suzuki, M.; Yamada, Y.; Nishizawa, T.; Matsuda, F.; Kojima, M.; Sakakibara, H.; Shinozaki, K.; et al. Enhancement of oxidative and drought tolerance in Arabidopsis by overaccumulation of antioxidant flavonoids. Plant J. 2014, 77, 367–379. [Google Scholar] [CrossRef]
  41. Wu, Q.; Su, N.; Zhang, X.; Liu, Y.; Cui, J.; Liang, Y. Hydrogen peroxide, nitric oxide and UV RESISTANCE LOCUS8 interact to mediate UV-B-induced anthocyanin biosynthesis in radish sprouts. Sci. Rep. 2016, 6, 1–12. [Google Scholar] [CrossRef] [PubMed]
  42. Guo, D.L.; Wang, Z.G.; Li, Q.; Gu, S.C.; Zhang, G.H.; Yu, Y.H. Hydrogen peroxide treatment promotes early ripening of Kyoho grape. Aust. J. Grape Wine Res. 2019, 25, 357–362. [Google Scholar] [CrossRef]
  43. Trouvelot, S.; Varnier, A. L.; Allegre, M.; Mercier, L.; Baillieul, F.; Arnould, C.; Gianinazzi-Pearson, V.; Klarzynski, O.; Joubert, J. M.; Pugin, A.; Daire, X. A β-1, 3 glucan sulfate induces resistance in grapevine against Plasmopara viticola through priming of defense responses, including HR-like cell death. MPMI. 2008, 21, 232–243. [Google Scholar] [CrossRef]
  44. Boubakri, H.; Wahab, M. A.; Chong, J.; Bertsch, C.; Mliki, A.; Soustre-Gacougnolle, I. Thiamine induced resistance to Plasmopara viticola in grapevine and elicited host–defense responses, including HR like-cell death. Plant Physiol. Biochem. 2012, 57, 120–133. [Google Scholar] [CrossRef]
  45. Boubakri, H.; Wahab, M. A.; Chong, J.; Gertz, C.; Gandoura, S.; Mliki, A.; Bertsch, C.; Soustre-Gacougnolle, I. Methionine elicits H2O2 generation and defense gene expression in grapevine and reduces Plasmopara viticola infection. J. Plant Physiol. 2013, 170, 1561–1568. [Google Scholar] [CrossRef] [PubMed]
  46. Stohs, S. J. Safety, efficacy, and mechanistic studies regarding Citrus aurantium (bitter orange) extract and p-synephrine. Phytother Res. 2017, 31, 1463–1474. [Google Scholar] [CrossRef] [PubMed]
  47. Ruiz-Moreno, C.; Del Coso, J.; Giráldez-Costas, V.; González-García, J.; Gutiérrez-Hellín, J. Effects of p-synephrine during exercise: A brief narrative review. Nutrients 2021, 13, 233. [Google Scholar] [CrossRef] [PubMed]
  48. Yamakawa, T.; Kato, S.; Ishida, K.; Kodama, T.; Minoda, Y. Production of anthocyanins by Vitis cells in suspension culture. Agric. Biol. Chem. 1983, 47, 2185–2191. [Google Scholar] [CrossRef]
  49. Reid, K. E.; Olsson, N.; Schlosser, J.; Peng, F.; Lund, S. T. An optimized grapevine RNA isolation procedure and statistical determination of reference genes for real-time RT-PCR during berry development. BMC Plant Biol. 2006, 6, 1–11. [Google Scholar] [CrossRef]
  50. Figueiredo, A.; Monteiro, F.; Sebastiana, M. First clues on a jasmonic acid role in grapevine resistance against the biotrophic fungus Plasmopara viticola. Eur. J. Plant Pathol. 2015, 142, 645–652. [Google Scholar] [CrossRef]
  51. Gambino, G.; Boccacci, P.; Margaria, P.; Palmano, S.; Gribaudo, I. Hydrogen peroxide accumulation and transcriptional changes in grapevines recovered from flavescence dorée disease. Phytopathol. 2013, 103, 776–784. [Google Scholar] [CrossRef] [PubMed]
  52. Zhang, J.; Ma, H.; Chen, S.; Ji, M.; Perl, A.; Kovacs, L.; Chen, S. Stress response proteins’ differential expression in embryogenic and non-embryogenic callus of Vitis vinifera L. cv. Cabernet Sauvignon—A proteomic approach. Plant Sci. 2009, 177, 103–113. [Google Scholar] [CrossRef]
  53. Yokotsuka, K.; Nagao, A.; Nakazawa, K.; Sato, M. Changes in anthocyanins in berry skins of Merlot and Cabernet Sauvignon grapes grown in two soils modified with limestone or oyster shell versus a native soil over two years. Am. J. Enol. Vitic. 1999, 50, 1–12. [Google Scholar] [CrossRef]
  54. Bakker, J.; Preston, N. W.; Timberlake, C. F. The determination of anthocyanins in aging red wines: Comparison of HPLC and spectral methods. Am. J. Enol. Vitic. 1986, 37, 121–126. [Google Scholar] [CrossRef]
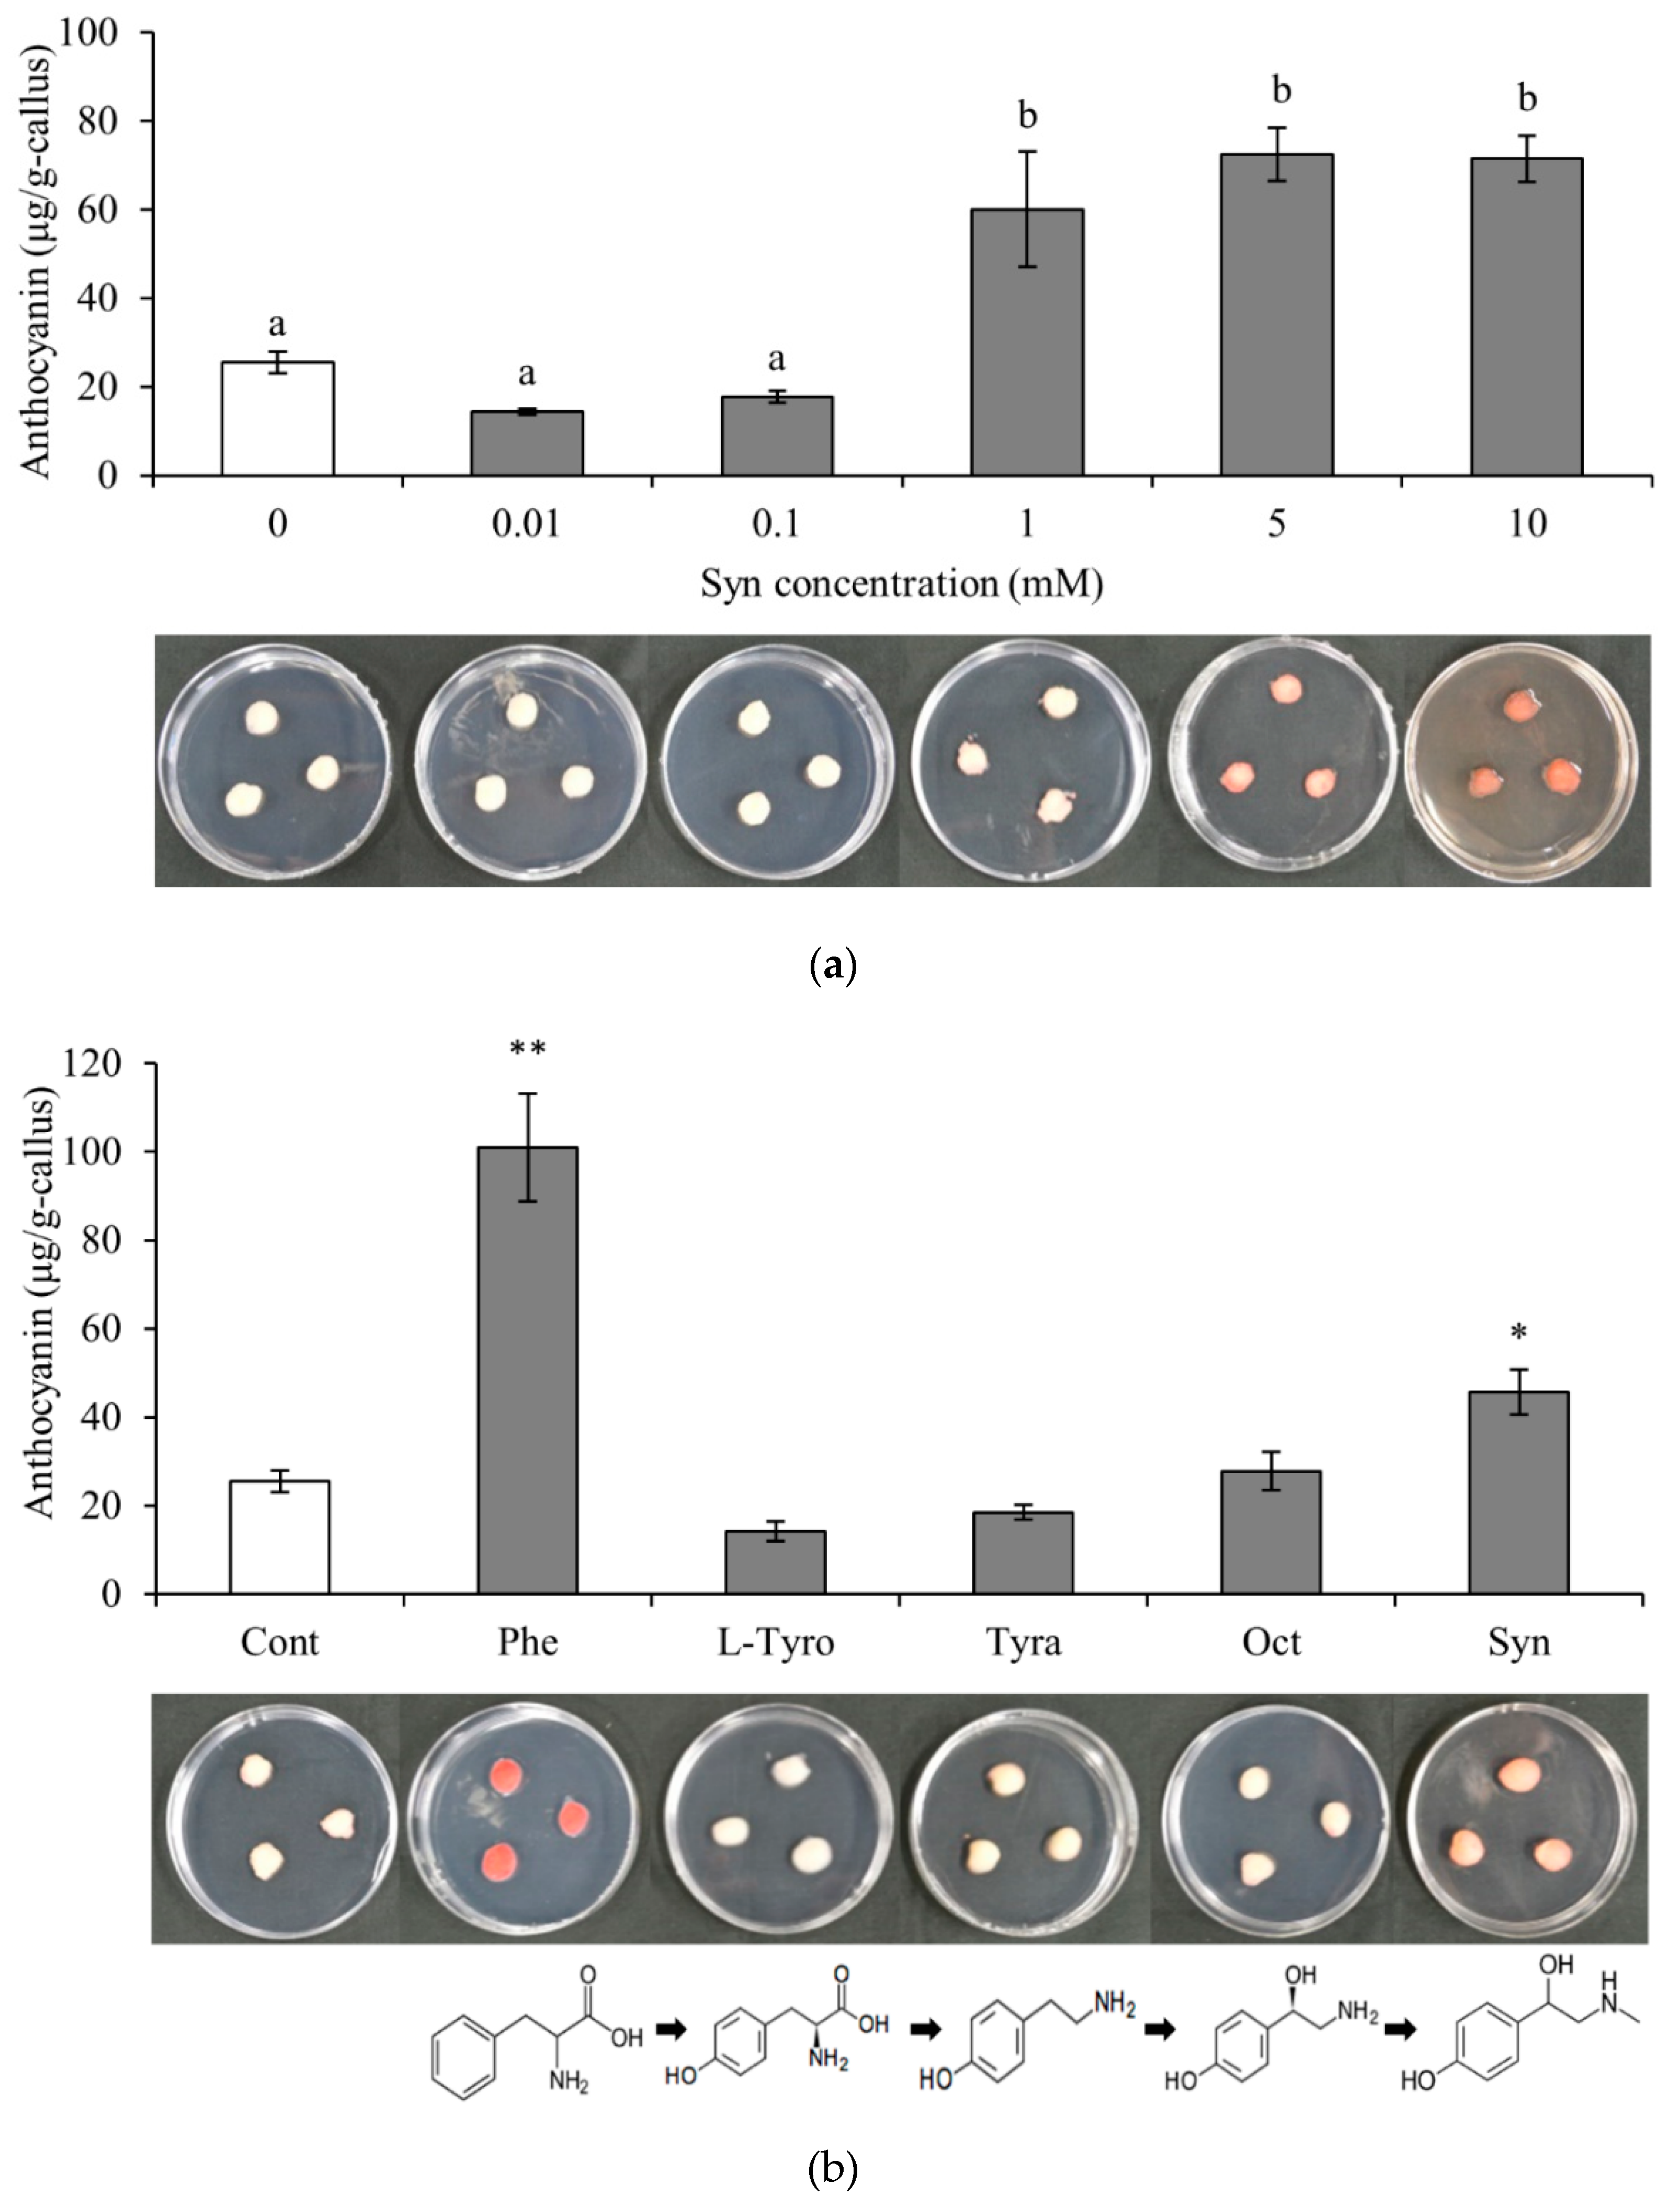
Figure 1. Effects of Syn on anthocyanin accumulation in VR cells. (a) Effects of Syn at concentrations of 0, 0.01, 0.1, 1, 5, and 10 mM on anthocyanin accumulation. Different letters (a, b) above the bar graphs indicate statistically significant differences (Tukey, P < 0.01 or 0.05). (b) Molecular structure specificity of Syn. Effects of Phe, L-Tyro, Tyra, Oct, and Syn (each 5 mM) on anthocyanin accumulation. * and ** indicate significant difference at P < 0.05 and 0.01, respectively, relative to Control (Dunnett). VR cells were cultured at 27°C, 54.2 μmol m-2 s-1/16 h/day for 7 days. Data are means ± S.E. (n = 3).
Preprints 104497 g001
Figure 2. Effect of Syn on fruit quality. Photographs of fruit bunches 10 and 20 days after (1 mM Syn treatment in 2019 and 2021 (a). Anthocyanin content in berry skin (b, c). Sugar/acid ratio of juice (d, e). Data represent means ± SE (n = 3). * indicates significant difference at P < 0.05 and **, at 0.01 (t-test).
Preprints 104497 g002
Figure 3. Transcription profiles of genes in anthocyanin-biosynthesis-related pathways in VR cells treated with Syn: PAL, C4H, and 4CL in the phenylpropanoid biosynthetic pathway; CHS, CHI, F3'H, F3'5'H, F3H, DFR, and LDOX in the flavonoid biosynthetic pathway; and mybA1 and UFGT in the anthocyanin biosynthetic pathway. VR cells were cultured in medium containing 5 mM Syn for 120 h (27°C, 54.2 μmol m-2 s-1/16 h/day). The transcription level of each gene was estimated by real-time RT-PCR. Data are relative expression levels to actin. Data are means ± S.E. (n = 4). * and ** indicate significant differences at P < 0.05 and 0.01, respectively (t-test).
Preprints 104497 g003
Figure 4. Transcription profiles of various phytohormone biosynthesis genes and their individual phytohormone contents in VR cells treated with Syn. Relative expression level of NECD1 encoding ABA biosynthesis rate-limiting enzyme (a) and ABA content 24 h after treatment (b). Relative expression levels of ACS3 (c) and ACO2 (d), which encode the rate-limiting enzyme of the ET biosynthetic pathway and the enzyme that biosynthesizes ET, respectively. Relative expression level of LOX encoding JA biosynthesis rate-limiting enzyme (e) and JA content 24 h after treatment (f). VR cells were cultured up to 24 h (27°C, 54.2 μmol m-2 s-1/16 h/day) in medium containing 5 mM Syn. The transcription levels of the genes were estimated by real-time RT-PCR. Data are expression levels relative to actin. Each phytohormone content was determined by ELISA. Data are means ± S.E. (n = 4). * and ** indicate significant differences at P < 0.05 and 0.01, respectively (t-test).
Preprints 104497 g004
Figure 5. Relative expression levels of H2O2-related genes and H2O2 contents in Syn-treated cells. SOD3 encoding H2O2-generating enzymes (a) and H2O2 content (b). Transcriptional profiles of APX6 (c) and CAT (d) encoding H2O2-removing enzymes. VR cells were grown in medium containing 5 mM Syn up to 24 or 120 h (27°C, 54.2 μmol m-2 s-1/16 h/day). H2O2 content was measured with a fluorescence analysis kit. Transcription levels of the genes were estimated by real-time RT-PCR. Data are expression levels relative to actin. Data are means ± S.E. (n = 4). * and ** indicate significant differences at P < 0.05 and 0.01, respectively (t-test).
Preprints 104497 g005
Figure 6. Effects of Syn and H2O2 treatments on VR cells and berries. Transcriptional profiles of H2O2-responsive gene Chit4 (a), anthocyanin-biosynthesis-related genes mybA1 (b) and UFGT (c), and anthocyanin content (d) in VR cells. Anthocyanin content (e) in Syn- and H2O2-treated grape berries. VR cells were cultured in medium containing 5 mM Syn and 10 mM H2O2 for 4 days (for transcriptional profiles) or 7 days (for anthocyanin content) at 27°C, 54.2 μmol m-2 s-1/16 h/day. Berries were harvested 9 days after 1 mM Syn and 300 mM H2O2 treatments. Transcript levels of the genes were estimated by real-time RT-PCR. Data are expression levels relative to actin. Data are means ± S.E. (n = 4). * and ** indicate significant differences at P < 0.05 and 0.01, respectively (Dunnett test).
Preprints 104497 g006
Figure 7. Predicted pathway of anthocyanin accumulation promoted by Syn.
Preprints 104497 g007
Disclaimer/Publisher’s Note: The statements, opinions and data contained in all publications are solely those of the individual author(s) and contributor(s) and not of MDPI and/or the editor(s). MDPI and/or the editor(s) disclaim responsibility for any injury to people or property resulting from any ideas, methods, instructions or products referred to in the content.
Copyright: This open access article is published under a Creative Commons CC BY 4.0 license, which permit the free download, distribution, and reuse, provided that the author and preprint are cited in any reuse.
Prerpints.org logo

Preprints.org is a free preprint server supported by MDPI in Basel, Switzerland.

Subscribe

© 2024 MDPI (Basel, Switzerland) unless otherwise stated