
Submitted:
20 April 2024
Posted:
22 April 2024
You are already at the latest version
Abstract
Heat transfer enhancement and hydrodynamic characteristics of nanofluid use in a micro heat exchanger is investigated for cooling electronic components working in hot climatic conditions. The cooling fluid employed was water and TiO2 nanoparticles at concentrations of 1% and 5%, Reynolds numbers ranged from 400 to 2000, and inlet temperatures ranged between 35ºC and 65ºC.
At a nanofluid inlet temperature of 55ºC and a nanoparticle concentration of 1%, the Nusselt number increased by 23% up to 54% as the Reynolds number varied between 400 and 2000. At a nanoparticle concentration of 5%, the percentages which correspondingly enhanced the Nusselt number were 32% and 63%. The temperature of the electronic heating component decreased by 4.6-5.2ºC when the nanofluid concentration was increased from 0 to 5% at a Reynolds number of 400 and a nanofluid inlet temperature of 35ºC. Small increments in pressure drop of about 6% and 13% were observed at nanofluid concentrations of 1% and 5%, respectively. With nanoparticle concentrations of 1% and 5%, a Reynolds number of 2000 and a nanofluid inlet temperature of 35ºC, performance evaluation criterion (PEC) values of 1.36 and 1.45 were obtained. When the nanofluid inlet temperature was increased to 65ºC, the PEC parameter decreased to 1.02-1.10 for both concentrations.
Keywords:
micro heat exchanger
; nanofluids
; cooling of electronic heating components
; CFD simulation
1. Introduction
The microelectronics sector, which manufactures electronic circuits, has grown quickly and has also manufactured more powerful, more compact, and more advantageous components for portable and fixed applications. These include data centers, electronic boxes, and cars. However, overheating of these electronic components could affect their performance and reduce their life cycles, particularly when they are used in regions suffering hot weather conditions [1]. To enhance thermal conduction in electronic devices operating in these conditions it is essential to apply cooling systems that can appropriately dissipate the high heat flux released. The selection and design of a specific cooling system depends mainly on the heat flux dissipated by the heating component, the climatic conditions of the site, and the energy parameter for the cooling capacity required from the system installed. Among these methods, forced convection air cooling has been the one most commonly employed to maintain the working temperature of electronic components at a safe level. This is because of its simplicity and inherent cost-effectiveness. However, this cooling system remains limited for implementation in high-performance microelectronic equipment, and as a consequence, there is a rising interest in designing other methods of high-performance liquid cooling systems [2,3].
Single-phase microchannel heat sinks, consisting of a stream of water passing through a micro heat exchanger, are an efficient means of dissipating heat fluxes. These fluxes, usually in the order of hundreds of W/cm2, exceed the rates that air-cooled systems are able to reach [4]. In terms of cooling efficiency, micro heat exchangers are particularly promising components for usage in small-scale and advanced applications. They are compact, light, have low energy requirements, and have a relatively low cost. Therefore, they provide vast windows of opportunity for integration into microelectronic components. The functional features of micro heat exchangers were originally explored by Tuckerman and Pease in the early 1980s [4]. This concept led to the investigation of heat transfer and fluid flow in rectangular microchannels. Microscopic channels 50 µm wide and 300 µm deep were etched in silicon, and deionized water was pushed through as the coolant. This design permitted the dissipation of 790 W/cm2 with a temperature increase of 71°C for a single chip. Gao et al. [5] studied the influence of channel height on the thermo-hydraulic characteristics of microchannels and minichannels. Friction factors agreed with those estimated by the conventional laminar theory, regardless of channel height. However, the authors noticed a heat transfer enhancement when the size of the channels was decreased. Mala and Li [6] performed an experimental study into how microchannel diameter variation affected the pressure drop. The authors reported significant deviations between the flow characteristics and the theoretical predictions for microchannels with a reduced diameter.
Several numerical investigations evaluated the impact of the microchannel geometrical design on heat transfer mechanisms and flow patterns [7,8,9,10,11,12,13]. One of the most relevant results found that corrugated microchannels demonstrated a high potential for dissipating high heat fluxes. Other recent studies [14,15,16,17,18,19] are based on the tree design reported by Bejan [20]. This design is useful for selecting the best geometric layout for heat sinks to allow for maximum heat transfer between the cooling fluid and the wall of the microchannels.
Investigations are currently being carried out into the improvement of the thermophysical properties of coolants, and have attracted the interest of various researchers over the last few decades [21]. The most promising technique to improve heat transfer is to employ nanofluids with metal nanoparticles in the base fluid. This mixture is more effective than conventional working fluids, such as water, ethylene glycol, or oil [22,23,24]. Several computational and experimental studies, available in the literature, are focused on the heat transfer and fluid flow of nanofluids on macro and micro-scales [25,26,27,28,29,30,31,32,33,34,35,36,37,38,39,40,41,42,43,44,45,46]. Kalteh et al. [47] investigated numerically and experimentally alumina-water nanofluid (0-5%) flow inside a wide heat sink microchannel. The two-phase Eulerian method was utilized to model the nanofluid flow. In addition, homogeneous modeling was carried out to compare the experimental results with those of the two-phase simulation approach. The authors' numerical results demonstrated that the two-phase technique was more appropriate than the homogeneous model for modeling nanofluid flow. The maximum deviations with experimental results were 12.6% and 7.4% for homogeneous and two-phase methods, respectively. Mohammed et al. [48] analysed the performance of microchannel heat sinks employing Al2O3/water nanofluids at concentrations of 1–5%. They employed the finite volume approach, based on a hybrid discretization methodology and the SIMPLE algorithm to solve the velocity fields. The results revealed that the use of nanofluids could enhance heat transfer in heat sink microchannels, and that it was dependent on the volumetric fraction of nanoparticles dispersed in the base fluid. The authors also observed that the thermal resistance was lower for heat sink microchannels with nanofluids at a 5% nanoparticle volume fraction. TiO2 nanoparticles have good heat transfer characteristics, are highly stable, easily available, ecologically safe, and have a low cost. Experimental research exploring the influence of high nanoparticle concentrations (= 2%) on convective heat transfer in microchannels is very scarce. Manay and Sahin [49] studied how microchannel height and five different TiO2 nanoparticle volume fractions of nanofluids (0.25%, 0.5%, 1.0%, 1.5% and 2.0%) in pure water impacted heat transfer and flow characteristics. The study indicated that a reduction in microchannel height significantly decreased heat duties and increased pressure drop. By increasing the nanosized TiO2 particles concentration in the base fluid, heat transfer rates increased but there was no excessive increase in pressure drop when compared to using pure water. Furthermore, various studies are available in the literature on the use of high concentrations of TiO2/water nanofluids in micro-heat exchangers. Martínez et al. [50] investigated numerically the effect of microchannel height on the thermal performance of a heat sink subjected to a continuous heat flow of 50 W/cm2 at the bottom surface. The dimensions of the microchannel were 283 μm width, 50 mm length, and three different heights (800 µm, 600 µm, and 400 µm). A laminar three-dimensional flow study was carried out using water and TiO2/water nanofluids at weight concentrations of 1 wt% and 3 wt% and with Reynolds numbers ranging from 200 to 1200. The authors concluded that both the use of nanoparticles and the reduction of the microchannel height improved heat transfer at low Reynolds numbers of 200. The maximum increase obtained was 19.7% with a nanoparticle concentration of 3%.
To determine the heat transfer rate and friction factor, Nitiapiruk et al. [51] investigated the effects of TiO2/water nanofluids, at volume fractions of 0.5%, 1%, and 2%, in a microchannel heat sink with 40 flowing channels. The length, width, and height of each channel were 40 mm, 500 μm and 800 μm, respectively. The authors reported that the use of nanoparticles at a volume fraction of 2% with minimum amounts of heat flux and Reynolds number was more suitable than other volume fractions. Heydari et al. [52] investigated the effect of a rib design on heat transfer characteristics and laminar flow for the nanofluid TiO2/water in a three-dimensional rectangular microchannel at volume fractions of 0%, 2%, and 4%. Results indicated that the ribs significantly affected the pattern of fluid flow; however, it also varied depending on the Reynolds number of the flow.
The present study involved the use of titanium dioxide (TiO2) nanoparticles in a micro heat exchanger to investigate how this could enhance heat transfer for cooling of electronic components. There is scarce information in the open literature on the impact of using both micro heat exchangers and nanofluids for cooling of electronic components at high coolant inlet temperatures. Experiments and numerical simulations were conducted to explore how different parameters, such as the inlet temperature of the hot nanofluids, Reynolds number, and concentration of nanoparticles, affect heat transfer enhancement in the cooling of an electronic heating component. The results of this study could be very useful for the design of efficient cooling systems for electronic devices that operate at high temperatures. The use of nanofluids in micro heat exchangers can improve heat transfer performance and reduce energy consumption, which is essential in many industrial electronics applications.
2. Geometry of the Experimental Setup and Measurement Procedure
2.1. Geometry
The micro heat exchanger consisted of two collectors and a micro heat sink, as illustrated in Figure 1 (a). A cross section of the heat sink is shown in Figure 1 (b). It was made up of 17 aluminium microchannels, each measuring 40 mm in length and having a rectangular cross section that is 1 mm in height and 0.7 mm in width.
Table 1 summarizes the main geometrical characteristics of the micro heat exchanger. Aluminum was used as the manufacturing material because of its resistance to corrosion and its high durability. The fluid circulating in the microchannels was distributed using two aluminum circular distributors each of 5 mm diameter, the first at the inflow and the second at the outflow.
2.2. Experimental Apparatus
This section presents the setup and methodology employed to perform the experiments. Figure 3 depicts the test section, consisting of a heating element 40 mm long, 25 mm wide, and 4 mm thick. Polyurethane insulation was employed to reduce heat losses. A thin layer of thermal paste (Arctic MX-4) with a thermal conductivity of 8.5 W/m.K was also applied between the micro heat exchanger and the heating element. Heat was generated by transmitting an electric current through the heating element (Joule effect). Heat generated () was determined using Eq. (1):
Where () is the voltage across the heating component and (I) is the electric current.
The experiments were carried out using the maximum voltages, which corresponded to the power supply of 100 W. This made it possible to generate a maximum temperature of 160°C. The temperature on the heating component side was uniform.
The assembled device was fixed in the center of a 18x13x10 cm rectangular box as illustrated in Figure 3. The heating element and the micro heat exchanger are both placed horizontally inside the box. The setup, which included the experimental section and the auxiliary devices, is shown in Figure 4. It consisted of a thermostatic bath to supply the test section with pure water in the first step at an inlet temperature (Tin) ranging from 25°C to 65°C and TiO2/water nanofluids at the same temperature range in the second step. The Nanofluid was circulated through the micro heat exchanger using a variable speed prostate pump. A data acquisition system was used for the display and storage of all parameters measured.
Temperatures were recorded using thermocouples placed in eight different positions on the experimental device, as depicted in Figure 5. Three thermocouples were installed in the micro heat exchanger at the inlet (T1), at the outlet (T2), and in the middle of the outer surface (T3). Two thermocouples were installed in the ambient air, namely T7 and the thermostatic bath T8. Three additional thermocouples were installed at 20 mm intervals throughout the length of the microchannel. A data acquisition system and a computer were used to monitor temperature sensors, and to register data at 10-second intervals. The distribution of these temperature sensors in the experimental setup is shown in Figure 5. The total pressure drop in the micro heat exchanger was measured employing a 0-2 bar pressure meter. The voltage regulator was fixed at its maximum value of 220 V at the start of the experiment, yielding a power supply of 100 W. The experiment was run for 30 minutes at a pure water flow rate of 0.1 L/min. The experiment was then repeated at water flow rates ranging from 0.1 to 0.5 L/min, corresponding to Reynolds numbers in the range of 400-2000. The inlet water temperature was varied between 35ºC and 65ºC. The room temperature throughout the experimental phase varied from 24ºC to 26°C as several heat generating equipment supplies were active.
The same experimental procedure was carried out again under the same conditions for the nanofluids. The heat component was cooled before starting the next experiment. It was necessary to pretreat and clean the inner surfaces of the microchannels with pure water to remove nanoparticles before each experiment.
2.3. Nanofluid Preparation and Calculation of Thermophysical Properties
Pure water and TiO2 were selected as base fluid and nanomaterial, respectively. The thermophysical properties of TiO2 nanoparticles are presented in Table 2. The TiO2/water nanofluids consisted of TiO2 nanoparticles at 0%, 1% and 5% mass concentrations dispersed and stirred in water (see Figure 6). The stirred nanofluids were subject to ultra-sonication using a 200 W, 45 kHz digital sonicator for about 5 h in order to disperse them well.
The volume concentration of nanofluids from the given weight fraction of nanoparticles is calculated by the following equation [56]:
The thermo physical properties of the nanofluids such as density (ρ), heat capacity (Cp), dynamic viscosity (μf), and thermal conductivity (k) were evaluated using the correlations proposed and defined as follows [57,58,59,60]:
- -
- Density of nanofluids
- -
- Heat capacity of nanofluids
- -
- Viscosity of nanofluids
- -
- Thermal conductivity of nanofluidsWhere, n = 3 for spherical shaped nanoparticles.
3. Data Reduction of the Experimental Data
3.1. Heat Transfer
Heat transfer and the overall heat transfer coefficient of the convection test section are expressed as follows:
The log-mean temperature difference (LMTD) through the micro heat exchanger is calculated by Eq. (9):
Aeff is the wetted channel area, which is expressed as follows:
The Nusselt number is calculated by Eq. (11):
The thermal resistance is defined as the ratio from the temperature difference between the heating element and the water at the entrance to the heating element power supplied (Eq. (12)):
where Ts,max is the maximum surface temperature of the heat sink.
3.2. Fluid Flow
The Reynolds number is defined by Equation (13), using the hydraulic diameter and the inlet velocity through the micro channel:
Hydraulic diameter is expressed by Equation (14):
The velocity Vmc, can be calculated by the following equation:
While n and Amc represent, respectively, the number and the cross-sectional area of each flow channel, given by:
Pressure drops in the microchannel, ΔP, can be calculated from the pressure drop measured between the inlet and outlet, using the following equation:
The total minor losses were calculated based on the losses resulting from expansion and contraction in the different sections, as follows [61]:
Amc and Ac represent the total cross-sectional area of the microchannels and the collector, respectively. K90 is the loss coefficient for the 90-degree bends that occur between the collector inlet on the entrance side of the microchannels and the bend formed by the collector outlet on the exit side of the microchannels. A value of 1.2 was recommended for this coefficient [61]. Ke and Kc represent contraction and expansion loss coefficients caused by area changes [61], and their values can be estimated from graphical data for a square channel [61]. These coefficients are determined based on the ratio of between the channel area and the collector flow area, where Atube and Vtube represent, respectively, the area () and velocity () of the male run tee union tube. The friction factor ftube can be analytically calculated using the Poiseuille equation as: ftube = 64/Re
The loss coefficients for the sudden expansion (Ke_int) and the sudden contraction (Kc_out) represent the pressure losses that occur, respectively, as a result of the sudden expansion between the tube outlet and collector inlet (Kc_out), and the sudden contraction between the collector outlet and tube inlet (Ke_int). These coefficients can be determined from the correlations reported by Idelchik [62]:
As regards the value of fapp for the development of laminar flow regimes, it was calculated using data reported in reference [61].
Constant pumping power:
3.3. Performance Evaluation Criterion (PEC)
A performance evaluation criterion (PEC) was used [63] to evaluate heat transfer enhancement using nanofluids in a micro heat exchanger. This parameter represents the ratio between the increase in heat transfer and the increase in pumping power required for the system (Equation (24)). A system with a PEC≤1 is not recommended as it requires more energy for pumping power than the improvement in the heat transfer process. However, if PEC>1, the gain in heat transfer is more significant than the increase in energy required for pumping power so the system could be feasible for heat transfer enhancement in practical applications.
3.4. Uncertainty of the Experimental Data
The two types of uncertainty, Type A and Type B, correspond to the different sources of error encountered in the experiment. Type A uncertainty, , is associated with the statistical method used in data analysis and includes random errors or fluctuations in the data. This type of uncertainty can be estimated using statistical methods such as the standard deviation or standard error of the mean. Type B uncertainty, , is associated with the accuracy of the experimental instruments and includes systematic errors or biases in the data. The total uncertainty (U) of experimental data is calculated using the following formula [64]:
where x̄ is the average of the values measured, xi is the actual value measured and n the times at which the value was measured. δ is half the width of the possible interval of the value measured, and λ is the coverage factor.
Considering that a result R is calculated from a set of quantities measured xi ,; then the uncertainty of the value calculated is as follows [64]:
Table 3 summarizes the uncertainty of the various sensors used in the experiments, and the parameters are calculated with a confidence level of 95%.
4. Numerical Approach
This section presents the physical model used in the simulation analysis of the monophasic flow in the micro heat exchanger [65]. The governing equations, boundary conditions, and meshing required for the numerical simulation are provided. Figure 7 (A) depicts the configuration of the micro heat exchanger evaluated in the present study. The calculation model considered an elementary volume, shown in Figure 7 (B). Computational Fluid Dynamics (CFD) ANSYS/FLUENT 14.0, employing the finite volume approach [66] was used to simulate the conjugate heat transport within the microchannels.
4.1. Assumptions and Boundary Conditions
Cooling performance of the micro heat exchanger was investigated employing a three-dimensional fluid-solid model. The following assumptions were made in the model: (i) incompressible, laminar, and steady state flow; (ii) constant properties of solids and fluids; (iii) neglected effects of gravity in the momentum equation and viscous dissipation in the energy equation; (iv) adiabatic external surface boundaries, except on the bottom of the micro heat exchanger.
Numerical simulations were run using water at temperatures (Tin) between 25ºC and 65ºC at the collector entrance and water Reynolds numbers ranging from 400 to 2000. The heating power applied to the bottom of the micro heat exchanger was 100 W. A second-order upwind approach was employed to solve the energy and momentum equations, and the SIMPLE algorithm was applied to manage the coupling of pressure force fields and velocity. Walls between solid and liquid regions were designated interfaces, and the inlet and outlet walls of the microchannels were taken as inner walls. The remaining walls were considered adiabatic walls. The iterative procedure was regarded as successful when the residuals of the continuity and momentum equations were below 10-4 and those of the energy equations were lower than 10-7.
4.2. Governing Equations
The governing equations employed in the model are the standard continuity equations for mass conservation, the Navier-Stokes equation for momentum conservation, and the energy equation to predict the conjugate heat transfer. The assumptions mentioned above were established in order to construct the following governing differential equations for fluid flow and heat transfer:
- -
- Continuity equation:
- -
- Momentum conservation equation:
- -
- Energy conservation equation:
4.3. Effect of Grid Refinement
The mesh density was analyzed before carrying out the final simulations to determine how it influenced the numerical solution for the entire micro heat exchanger. Accordingly, different numerical trials were performed for several numbers of mesh elements between 6x10⁵ and 2x10⁶, to ensure independency of the mesh size. The heating element temperature and the total pressure were used to assess how the mesh number affected the accuracy of the results. Figure 8 illustrates the mesh sensitivity analysis performed at a Reynolds number of 400, an input heat power of 100 W and an inlet cooling nanofluid temperature of 25ºC. It can be observed that the results are not affected when the number of mesh elements is above 14x105.
5. Results and Discussion
This section reports the results of how heat transfer in cooling electronic components is enhanced when a micro heat exchanger and warm nanofluids are employed. Both experimental and numerical results are presented with nanoparticle concentrations ranging from 1% to 5% in weight. The effects of the inlet temperature and the nanoparticle concentrations of hot nanofluids on the cooling of electronic components are discussed. First, both the experimental setup and the numerical simulation tool were validated. Pure water was used, and the validation considered correlations and experimental data of heat transfer and pressure drop for laminar flows in rectangular microchannels reported in the literature [67,68,69,70,71,72,73,74].
5.1. Validation of Experimental Results
To validate the experimental set-up and procedure, initial test runs were carried out on the micro heat exchanger at an inlet temperature of 25°C, five Reynolds numbers, and a power input of 100 W. The Nusselt number and friction factor were used as validation parameters. The experimental results of the present study into heat transfer were compared with the experimental data reported by Lee et al. [67] and the values predicted by the Peng and Peterson correlation [68], shown in Eq. (30).
Where,
H and W are the height and width of the microchannel, respectively.
Wc is the center-to-center distance between microchannels
Figure 9 shows the comparison commented above in terms of the Nusselt number versus the Reynolds number when using pure water. The deviations between the experimental data carried out for the present work and those reported by Lee et al. [67] are 14% at Re = 400. This discrepancy decreases progressively to 2% as the Reynolds number increases at Re = 2000. Regarding the comparison between the experimental data of the current study and the values predicted by the Peng and Peterson correlation [68], deviation is less than 2% for Reynolds numbers 400 and increases continuously as the Reynolds number increases, until it reaches 5% at Re = 2000.
The authors compared the experimental results of the present study for rectangular microchannels, as shown in Figure 10. The friction factor was compared with the values predicted by the correlation of Shah and London [69] and with the experimental data reported by Harms et al. [70]. Shah and London [69] proposed the correlation, presented in Eq. (31), to predict pressure drop for developed laminar flows inside rectangular channels.
Where is the channel aspect ratio.
Figure 10 shows the comparison commented above at a cooling water inlet temperature of 25ºC. All sets of data present a similar trend, with a sharp decrease for Reynolds numbers ranging from 400 to 800, and after a less pronounced variation at higher values of the Reynolds number. The mean absolute deviation between the experimental data of the present work and the values predicted by the correlation of Shah and London [69] is around 10%. The minimum and maximum deviations between the experimental data of Harms et al. [70] and those of the present work are 3% and 25%, respectively.
5.2. Validation of the Simulation Code
To validate the simulation code developed, values of thermal resistance obtained in the present work were compared with the experimental data reported by Kawano et al. [71] and the numerical results of Qu and Mudawar [72] and Al-Neama et al. [73], shown in Figure 11. This comparison was carried out for Reynolds numbers ranging from 80 to 400 and at inlet cooling water temperature of 20ºC. A constant heat flux of 100 W/cm2 was applied to the bottom wall of the micro heat exchanger. The maximum deviation between the numerical values of the present work and the numerical data of Al-Neama et al. [73] is about 6%. With respect to the experimental and numerical data reported by Kawano et al. [71] and Qu and Mudawar [72], the maximum deviations are 10% and 11%, respectively.
Based on the analysis presented above, it may be concluded that the experimental and numerical results obtained with the micro heat exchanger used in the present work are well in agreement with the results reported in the literature. This validates both the experimental and numerical approaches developed by the authors.
5.3. Heat Transfer Characteristics
Figure 12 shows the Nusselt number achieved in the micro heat exchanger versus the Reynolds number at a hot nanofluid inlet temperature ranging from 35ºC to 65ºC, and at three nanoparticle concentrations, namely: 0%, 1%, and 5%. The Reynolds number is varied between 400 and 2000, while the power dissipated by the electronic heating component is kept constant at Ṗ = 100 W. The Nusselt number increases, and the heat transfer process improves, at higher values of the Reynolds number. Additionally, due to an increase in thermal conductivity, the heat transfer process is enhanced by the addition of TiO2 nanoparticles to the pure water (base fluid). Table 4 presents the heat transfer enhancement with the addition of nanoparticles to pure water at Reynolds numbers of 400, 800, 1200, and 2000 and a nanofluid inlet temperature ranging from 35ºC to 65ºC at intervals of 10ºC.
With the lower Reynolds number (Re=400), heat transfer enhancement is around 21-25% at a nanoparticle concentration of 1% for all the values considered for the nanofluid inlet temperature. This enhancement goes up to 32-36% at a nanoparticle concentration of 5%. There is a continuous improvement in heat transfer as the Reynolds number increases. The highest value reached for heat transfer enhancement is 70%. This is achieved at a Reynolds number of 2000, a nanoparticle concentration of 5%, and a nanofluid inlet temperature of 35ºC. The results also show how significantly the nanofluid inlet temperature affects heat transfer. This may be attributed to the fact that the boundary layer becomes thinner due to the decrease in viscosity as the nanofluid temperature increases [74]. Therefore, a heat transfer enhancement value of 4-8% is observed when the nanofluid inlet temperature decreases from 65°C to 55°C. Heat transfer enhancement is around 8-10% and 10-17% when the nanofluid inlet temperature decreases from 65°C to 45°C, and from 65ºC to 35ºC, respectively.
As commented above, to operate safely, the target is for the cooling system to maintain the temperature of the electronic heating components below the limit of 80ºC. For safety, the temperature (Tcs) is then set at 70ºC [72].
Figure 13 illustrates the temperature profile of the heating components versus the Reynolds number and the nanoparticle concentration, at nanofluid inlet temperatures ranging from 35ºC to 65ºC at intervals of 10ºC. As observed in this figure, the increase in both the Reynolds number and the nanoparticle concentration, lowers the temperature of the heating components. This facet widens the safety margin for temperature, at a critical limit of 80ºC. The maximum temperature difference between the electronic heating component and the critical limit of 80°C is around 37.4ºC for pure water, 38.6°C at ∅ = 1% and 39.5°C at ∅ = 5%. At nanofluid inlet temperatures of 45ºC and 55ºC, the temperature of the electronic heating components remains below the safety limit. As the nanoparticle concentration increases, the temperature of the electronic heating components is reduced as shown in Figure 13(b) and Figure 13(c). Heat transfer enhancement is substantiated by adding nanoparticles to pure water. However, at an inlet temperature of 65ºC, the operating temperature of the electronic equipment is above the safety temperature limit established, i.e., 70ºC, even with the addition of nanoparticles or an increase in the Reynolds number, as shown in Figure 13(d).
Figure 14 illustrates the nanofluid temperature distribution through a contour inside the micro heat exchanger at mass nanoparticle concentrations of 0, 1 and 5% in weight, a Reynolds number Re=1200, and an inlet temperature of 45ºC. This figure shows the impact of the nanoparticle concentration on nanofluid temperature profiles inside the micro heat exchanger. For pure water (Figure 14(a)), the fluid temperature reaches 51ºC in the middle of the heat sink and 54ºC near the outlet of the microchannel. At a 1% nanoparticle concentration (Figure 14(b)), these two temperatures are 49ºC and 52ºC, respectively. As regards the case of a 5% nanoparticle concentration (Figure 14(c)), the corresponding temperatures are 47ºC and 50ºC, respectively. The results indicate that there is a difference in performance between employing pure water or nanofluids, with the difference becoming more significant as the concentration of TiO2 nanoparticles is increased.
5.4. Pressure Drop Characteristics
Figure 15 shows the pressure drop in the micro heat exchanger as a function of the Reynolds number at three mass fractions of TiO2 nanoparticles, namely ϕ = 0% (pure water), ϕ = 1%, ϕ = 5%. Both experimental and numerical results are presented in this figure. The pressure drop is significantly higher as the Reynolds number increases. The use of nanoparticles moderately increases pressure drop at a given Reynolds number. This is because nanofluids have a higher viscosity than pure water. It is worthy of note that the maximum deviations between the experimental data and the numerical predictions are in the range 6.2-6.7% for the three mass fractions used. The maximum value of pressure drop is obtained with nanofluids at a 5% nanoparticle concentration and a Reynolds number of 2000. A pressure drop increase of about 20% is observed for the use of TiO2/water nanofluids when compared to that of base fluid (pure water).
Figure 16 shows the pumping power required in the micro heat exchanger for pure water and for nanofluids at 1% and 5% of nanoparticle concentrations. The pumping power increases almost linearly with the Reynolds number. The effect of nanoparticle concentrations on pumping power is more significant at high Reynolds numbers because nanofluids have a higher density and viscosity than pure water.
5.5. Performance Evaluation Analysis
Figure 17 shows the performance evaluation criterion (PEC) parameter versus the Reynolds number and the nanofluid inlet temperature at nanoparticle concentrations of 1% and 5%. The PEC parameter is always greater than the unity for both nanoparticle concentrations. This demonstrates that adding nanoparticles to cooling water circulating in a micro heat exchanger improves heat transfer process. A better heat transfer performance is obtained with a 5% nanoparticle concentration at a Re = 2000 and a Tin = 35°C (PEC=1.45). At nanofluid inlet temperatures of 45ºC and 55ºC, the PEC parameter decreases to 1.41 and 1.38, respectively.
At a nanoparticle concentration of 1%, the PEC parameter is equal to 1.36 when the Reynolds number and the inlet temperature are set at 2000 and 35ºC, respectively. When the nanofluid inlet temperature and the Reynolds number are set at 65ºC and 2000, respectively, the PEC parameter decreases to 1.02-1.10 for both nanoparticle concentrations considered. This reveals that heat transfer enhancement due to the addition of nanoparticles is more pronounced than the resulting increase in pumping power required.
6. Conclusions
Heat transfer enhancement, in a micro heat exchanger, using titanium dioxide (TiO2) for cooling electronic components at high coolant inlet temperatures, was investigated both experimentally and numerically. A micro heat exchanger was built and tested in cooling mode employing TiO2/Water nanofluids at mass fractions of 1% and 5%, Reynolds numbers ranging from 400 to 2000, and inlet temperatures ranging between 35ºC and 65ºC at 10ºC intervals. A constant and uniform heat load of 100 W was supplied to the channel from the bottom of the exchanger. The maximum operating temperature allowed for electronic components is 80 ºC. The effect of nanoparticle concentrations, Reynolds numbers, and inlet temperatures of the nanofluids on the cooling of the electronic components was analyzed using 3 parameters, namely Nusselt number, friction factor, and performance evaluation criterion (PEC). The main results are summarized below:
- Both the experimental setup and the numerical simulation tool were validated using pure water, correlations, experimental data of heat transfer and pressure drop reported in the literature for laminar flows in rectangular microchannels. The deviations between the Nusselt number and the friction factor from the present work and those from the literature were between 2% and 25%.
- An enhancement in the heat transfer process was obtained with the addition of TiO2 nanoparticles to pure water (base fluid), on account of the increase in thermal conductivity. At a nanofluid inlet temperature of 55ºC and a nanoparticle concentration of 1%, the Nusselt number increased by 23% to 54% as the Reynolds number was varied between 400 and 2000. At a nanoparticle concentration of 5%, the corresponding percentages for Nusselt enhancement were 32% and 63%. The highest value of heat transfer enhancement achieved was 70%, which occurred at a Reynolds number of 2000, a nanoparticle concentration of 5%, and an inlet nanofluid temperature of 35ºC.
- It was observed that the nanofluid inlet temperature significantly affected heat transfer. A heat transfer enhancement of about 10% was obtained when the nanofluid inlet temperature was decreased from 65°C to 45°C.
- The increase of both the Reynolds number and the nanoparticle concentration lowered the temperature of the heating components. This widened the safety margin for the critical temperature limit of 80ºC. However, at an inlet temperature of 65ºC, the operating temperature of the electronic equipment was above the safety temperature limit set at 70ºC, even with the addition of nanoparticles and applying high Reynolds numbers.
- The maximum value of pressure drop was obtained with nanofluids at a 5% nanoparticle concentration and a Reynolds number of 2000. A pressure drop increase of about 20% was observed when using (TiO2/water) nanofluids instead of base fluid (pure water).
- PEC values are always greater than the unity for both nanoparticle concentrations. This indicates that adding nanoparticles to cooling water circulating in a micro heat exchanger improves the heat transfer process. At a Reynolds number of 2000 and a nanofluid inlet temperature of 35ºC, PEC values of 1.36 and 1.45 are obtained for nanoparticle concentrations of 1% and 5%, respectively. When the nanofluid inlet temperature is increased to 65ºC, the PEC parameter goes down to 1.02-1.10 for both concentrations.
Author Contributions
Mehdi Mokrane: Conceptualization, Methodology, Software, Validation, Formal analysis, Investigation, Writing - Original Draft. Mahmoud Bourouis: Conceptualization, Methodology, Formal analysis, Writing - Review & Editing, Supervision, Project administration.
Acknowledgments
Mahdi Mokrane gratefully acknowledges the EPST/Renewable Energy Development Center (CDER) of Algeria for funding his internships at Rovira i Virgili University of Tarragona (Spain).
Nomenclature
|
Aeff Ac Amc Atube Cp dp Dc Dh e es f app h H Hmc k Kc Ke K90 I Lc L m N Nu P Ṗ Q̇ Re Pr t T u, v, w W Ẇ |
Effective heat transfer area (m2) Collector area (m2) Cross-sectional area of each flow channel (m2) Tube area (m2) Specific heat (J/kg.K) Particle diameter (nm) Collector diameter (mm) Hydraulic diameter (mm) Thickness of pin fin (mm) Thickness of the upper face of heat sink (mm) Apparent friction factor Convective heat transfer coefficient (W/m2.K) Heat sink depth (mm) Micro channel depth (mm) Thermal conductivity (W/m.K) Contraction loss coefficient Expansion loss coefficient Bend loss coefficient, (=1.2) Electrical intensity (A) Collector tube length (mm) Heat sink length (mm) Mass (kg) Number of channels Nusselt number Pressure (Pa) Electric power (W) Heat transfer rate (W) Reynolds Number Prandtl number Time (s) Temperature (°C) Velocity in the directions x, y and z (m/s) Voltage (V) Volume flow (m3/s) Heat sink width (mm) Power pumping (W) |
| Symbols | |
|
ρ µ γ ϕ α LMTD PEC |
Density (kg/m3) Dynamic viscosity (kg/m.s) Convergence criterion Particle mass fraction (%) Coverage factor Channel aspect ratio Log-Mean Temperature Difference (°C) Performance Evaluation Criterion |
| Subscripts | |
|
avg bf c in f mc min max nf np out s |
Average Base fluid Collector Inlet Fluid Micro channel Minimum Maximum Nanofluid Nanoparticle Outlet Surface |
References
- S. Zimmermann, M.K. Tiwari, I. Meijer, S. Paredes, B. Michel, D. Poulikakos. Hot water cooled electronics: Exergy analysis and waste heat reuse feasibility. International Journal of Heat and Mass Transfer, vol. 55(23-24), pp. 6391–6399, 2012. [CrossRef]
- H.Y. Zhang, D. Pinjala, T.N. Wong, K.C. Toh, Y.K. Joshi. Single-phase liquid cooled microchannel heat sink for electronic packages. Applied Thermal Engineering, vol. 25(10), pp. 1472–1487, 2005. [CrossRef]
- P. Naphon, S. Wiriyasart. Liquid cooling in the mini-rectangular fin heat sink with and without thermoelectric for CPU. International Communications in Heat and Mass Transfer, vol. 36(2), pp. 166-171, 2009. [CrossRef]
- D.B. Tuckerman, R.F.W. Pease. High-Performance Heat Sinking for VLSI. IEEE Electron Device Letters, vol. EDL-2(5), pp. 126–129, 1981; https://ieeexplore.ieee.org/document/1481851. [CrossRef]
- P. Gao, S. Le Person, M. Favre-Marinet. Scale effects on hydrodynamics and heat transfer in two-dimensional mini and microchannels. International Journal of Thermal Sciences, vol. 41(11), pp. 1017–1027, 2002. [CrossRef]
- G.M. Mala, D. Li. Flow characteristics of water in microtubes. International Journal of Heat and Fluid Flow, vol. 20(2), pp. 142–148, 1999. [CrossRef]
- A.G. Fedorov, R. Viskanta. Three-dimensional conjugate heat transfer in the microchannel heat sink for electronic packaging. International Journal of Heat and Mass Transfer, vol. 43(3), pp. 399–415, 2000. [CrossRef]
- H.Y. Wu, P. Cheng. Friction factors in smooth trapezoidal silicon microchannels with different aspect ratios. International Journal of Heat and Mass Transfer, vol. 46(14), pp. 2519–2525, 2003. [CrossRef]
- E.G. Colgan, B. Furman, A. Gaynes, W. Graham, N. LaBianca, J.H. Magerlein, R.J. Polastre, M.B. Rothwell, R.J. Bezama. A practical implementation of silicon microchannel coolers for high power chips. IEEE Transactions on Components and Packaging Technologies, vol. 30(2), pp. 218–225, 2007; https://ieeexplore.ieee.org/document/4214931.
- F. Hong, P. Cheng. Three dimensional numerical analyses and optimization of offset strip-fin microchannel heat sinks. International Communications in Heat and Mass Transfer, vol. 36(7), pp. 651–656, 2009. [CrossRef]
- A.J.L. Foong, N. Ramesh, T.T. Chandratilleke. Laminar convective heat transfer in a microchannel with internal longitudinal fins. International Journal of Thermal Sciences, vol. 48(10), pp. 1908–1913, 2009. [CrossRef]
- Y. Xie, Z. Shen, D. Zhang, J. Lan. Thermal performance of a water-cooled microchannel heat sink with grooves and obstacles. Journal of Electronic Packaging, Transactions of the ASME, vol. 136(2), 021001, 2014. [CrossRef]
- H. Gholami, M. Banaei, A. Eskandari. Investigation of effect of triangular rib in heat transfer of finned rectangular microchannel with extended surfaces. Life Science Journal, vol. 10(8s), pp. 206–211, 2013; http://www.Lifesciencesite.com.
- Y.S. Muzychka. Constructal design of forced convection cooled microchannel heat sinks and heat exchangers. International Journal of Heat and Mass Transfer, vol. 48(15), pp. 3119–3127, 2005. [CrossRef]
- T. Bello-Ochende, L. Liebenberg, J.P. Meyer. Constructal cooling channels for micro-channel heat sinks. International Journal of Heat and Mass Transfer, vol. 50(21–22), pp. 4141–4150, 2007. [CrossRef]
- M.R. Salimpour, M. Sharifhasan, E. Shirani. Constructal optimization of the geometry of an array of micro-channels. International Communications in Heat and Mass Transfer, vol. 38(1), pp. 93–99, 2011. [CrossRef]
- T. Bello-Ochende, J.P. Meyer, F.U. Ighalo. Combined numerical optimization and constructal theory for the design of microchannel heat sinks. Numerical Heat Transfer, Part A: Applications, vol. 58(11), pp. 882–899, 2010. [CrossRef]
- Olakoyejo, T. Bello-Ochende, J.P. Meyer. Mathematical optimisation of laminar forced convection heat transfer through a vascularized solid with square channels. International Journal of Heat and Mass Transfer, vol. 55(9–10), pp. 2402–2411, 2012. [CrossRef]
- Olakoyejo, T. Bello-Ochende, J.P. Meyer. Constructal conjugate cooling channels with internal heat generation. International Journal of Heat and Mass Transfer, vol. 55(15–16), pp. 4385–4396, 2012. [CrossRef]
- A. Bejan. Constructal-theory network of conducting paths for cooling a heat generating volume. International Journal of Heat and Mass Transfer, vol. 40(4), pp. 799–811, 1997. [CrossRef]
- S. Kumar, A. Kumar, A.D. Kothiyal, M.S. Bisht. A review of flow and heat transfer behaviour of nanofluids in micro channel heat sinks. Thermal Science and Engineering Progress, vol. 8, pp. 477–493, 2018. [CrossRef]
- S. Zimmermann, I. Meijer, M.K. Tiwari, S. Paredes, B. Michel, D. Poulikakos. Aquasar: A hot water-cooled data center with direct energy reuse. Energy, vol. 43(1), pp. 237-245, 2012. [CrossRef]
- M.M. Sarafraz, F. Hormozi. Experimental study on the thermal performance and efficiency of a copper made thermosyphon heat pipe charged with alumina-glycol based nanofluids. Powder Technology, vol. 266, pp. 378–387, 2014. [CrossRef]
- M. Nojoomizadeh, A. Karimipour. The effects of porosity and permeability on fluid flow and heat transfer of multi walled carbon nano-tubes suspended in oil (MWCNT/Oil nano-fluid) in a microchannel filled with a porous medium. Physica E: Low-Dimensional Systems and Nanostructures, vol. 84, pp. 423–433, 2016. [CrossRef]
- X.Q. Wang, A.S. Mujumdar. Heat transfer characteristics of nanofluids: a review. International Journal of Thermal Sciences, vol. 46(1), pp. 1–19, 2007. [CrossRef]
- D. Wen, G. Lin, S. Vafaei, K. Zhang. Review of nanofluids for heat transfer applications. Particuology, vol. 7(2), pp. 141–150, 2009. [CrossRef]
- L. Godson, B. Raja, D.M. Lal, S. Wongwises. Enhancement of heat transfer using nanofluids-An overview. Renewable and Sustainable Energy Reviews, vol. 14(2), pp. 629–641, 2010. [CrossRef]
- S.M.S. Murshed, C.A. Nieto de Castro, M.J.V. Lourenço, M.L.M. Lopes, F.J.V. Santos. A review of boiling and convective heat transfer with nanofluids. Renewable and Sustainable Energy Reviews, vol. 15(5), pp. 2342–2354, 2011. [CrossRef]
- J. Barber, D. Brutin, L. Tadrist. A review on boiling heat transfer enhancement with nanofluids. Nanoscale Research Letters, vol. 6, 280, 2011. [CrossRef]
- T.I. Kim, Y.H. Jeong, S.H. Chang. An experimental study on CHF enhancement in flow boiling using Al2O3 nano-fluid. International Journal of Heat and Mass Transfer, vol. 53(5-6), pp. 1015–1022, 2010. [CrossRef]
- J.M. Wu, J. Zhao. A review of nanofluid heat transfer and critical heat flux enhancement - Research gap to engineering application. Progress in Nuclear Energy, vol. 66, pp. 13–24, 2013. [CrossRef]
- L. Cheng, L. Liu. Boiling and two-phase flow phenomena of refrigerant-based nanofluids: Fundamentals, applications and challenges. International Journal of Refrigeration, vol. 36(2), pp. 421–446, 2013. [CrossRef]
- M. Bahiraei, M. Hangi. Flow and heat transfer characteristics of magnetic nanofluids: A review. Journal of Magnetism and Magnetic Materials, vol. 374, pp. 125–138, 2015. [CrossRef]
- X. Fang, Y. Chen, H. Zhang, W. Chen, A. Dong, R. Wang. Heat transfer and critical heat flux of nanofluid boiling: A comprehensive review. Renewable and Sustainable Energy Reviews, vol. 62, pp. 924–940, 2016. [CrossRef]
- B.H. Salman, H.A. Mohammed, K.M. Munisamy, A.S. Kherbeet. Characteristics of heat transfer and fluid flow in microtube and microchannel using conventional fluids and nanofluids: A review. Renewable and Sustainable Energy Reviews, vol. 28, pp. 848–880, 2013. [CrossRef]
- W. Daungthongsuk, S. Wongwises. A critical review of convective heat transfers of nanofluids. Renewable and Sustainable Energy Reviews, vol. 11(5), pp. 797–817, 2007. [CrossRef]
- O. Mahian, A. Kianifar, C. Kleinstreuer, M.A. Al-Nimr, I. Pop, A.Z. Sahin, S. Wongwises. A review of entropy generation in nanofluid flow. International Journal of Heat and Mass Transfer, vol. 65, pp. 514–532, 2013. [CrossRef]
- A.M. Hussein, K.V. Sharma, R.A. Bakar, K. Kadirgama. A review of forced convection heat transfer enhancement and hydrodynamic characteristics of a nanofluid. Renewable and Sustainable Energy Reviews, vol. 29, pp. 734–743, 2014. [CrossRef]
- A.A. Hussien, M.Z. Abdullah, M.A. Al-Nimr. Single-phase heat transfer enhancement in micro/minichannels using nanofluids: Theory and applications. Applied Energy, vol. 164, pp. 733–755, 2016. [CrossRef]
- S. Kakaç, A. Pramuanjaroenkij. Review of convective heat transfer enhancement with nanofluids. International Journal of Heat and Mass Transfer, vol. 52(13–14), pp. 3187–3196, 2009. [CrossRef]
- W. Yu, D.M. France, E.V. Timofeeva, D. Singh, J.L. Routbort. Comparative review of turbulent heat transfer of nanofluids. International Journal of Heat and Mass Transfer, vol. 55(21–22), pp. 5380–5396, 2012. [CrossRef]
- L.S. Sundar, M.K. Singh. Convective heat transfer and friction factor correlations of nanofluid in a tube and with inserts: A review. Renewable and Sustainable Energy Reviews, vol. 20, pp. 23–35, 2013. [CrossRef]
- H.A. Mohammed, G. Bhaskaran, N.H. Shuaib, R. Saidur. Heat transfer and fluid flow characteristics in microchannels heat exchanger using nanofluids: A review. Renewable and Sustainable Energy Reviews, vol. 15(3), pp. 1502–1512, 2011. [CrossRef]
- S.M. Vanaki, P. Ganesan, H.A. Mohammed. Numerical study of convective heat transfer of nanofluids: A review. Renewable and Sustainable Energy Reviews, vol. 54, pp. 1212–1239, 2016. [CrossRef]
- A. Sabaghan, M. Edalatpour, M.C. Moghadam, E. Roohi, H. Niazmand. Nanofluid flow and heat transfer in a microchannel with longitudinal vortex generators: Two-phase numerical simulation. Applied Thermal Engineering, vol. 100, pp. 179–189, 2016. [CrossRef]
- J. Lee, I. Mudawar. Assessment of the effectiveness of nanofluids for single-phase and two-phase heat transfer in micro-channels. International Journal of Heat and Mass Transfer, vol. 50(3–4), pp. 452–463, 2007. [CrossRef]
- M. Kalteh, A. Abbassi, M. Saffar-Avval, A. Frijns, A. Darhuber, J. Harting. Experimental and numerical investigation of nanofluid forced convection inside a wide microchannel heat sink. Applied Thermal Engineering, vol. 36, pp. 260–268, 2012. [CrossRef]
- H.A. Mohammed, P. Gunnasegaran, N.H. Shuaib. Heat transfer in rectangular microchannels heat sink using nanofluids. International Communications in Heat and Mass Transfer, vol. 37(10), pp. 1496–1503, 2010. [CrossRef]
- E. Manay, B. Sahin. The effect of microchannel height on performance of nanofluids. International Journal of Heat and Mass Transfer, vol. 95, pp. 307–320, 2016. [CrossRef]
- V.A. Martínez, D.A. Vasco, C.M. García-Herrera, R. Ortega-Aguilera. Numerical study of TiO2-based nanofluids flow in microchannel heat sinks: Effect of the Reynolds number and the microchannel height. Applied Thermal Engineering, vol. 161, 114130, 2019. [CrossRef]
- P. Nitiapiruk, O. Mahian, A.S. Dalkilic, S. Wongwises. Performance characteristics of a microchannel heat sink using TiO2/water nanofluid and different thermophysical models. International Communications in Heat and Mass Transfer, vol. 47, pp. 98–104, 2013. [CrossRef]
- M. Heydari, D. Toghraie, O.A. Akbari. The effect of semi-attached and offset mid-truncated ribs and Water/TiO2 nanofluid on flow and heat transfer properties in a triangular microchannel. Thermal Science and Engineering Progress, vol. 2, pp. 140–150, 2017. [CrossRef]
- N. Bouanimba, N. Laid, R. Zouaghi, T. Sehili. A Comparative Study of the Activity of TiO2 Degussa P25 and Millennium PCs in the Photocatalytic Degradation of Bromothymol Blue. International Journal of Chemical Reactor Engineering, 20170014, 2017. [CrossRef]
- N. Laid, N. Bouanimba, A. Ben Ahmede, A. Toureche, T. Sehili. Characterization of ZnO and TiO2 Nanopowders and their Application for Photocatalytic Water Treatment. ACTA PHYSICA POLONICA A, vol. 137(2), 2020. [CrossRef]
- E. Ebrahimnia-Bajestan, M. Charjouei Moghadam, H. Niazmand, W. Daungthongsuk, S. Wongwises. Experimental and numerical investigation of nanofluids heat transfer characteristics for application in solar heat exchangers. International Journal of Heat and Mass Transfer, vol. 92, pp. 1041–1052, 2016. [CrossRef]
- W. Arshad, H.M. Ali. Experimental investigation of heat transfer and pressure drop in a straight minichannel heat sink using TiO2 nanofluid. International Journal of Heat and Mass Transfer, vol. 110, pp. 248–256, 2017. [CrossRef]
- B.C. Pak, Y.I. Cho. Hydrodynamic and heat transfer study of dispersed fluids with submicron metallic oxide particles. Experimental Heat Transfer, vol. 11(2), pp. 151–170, 1998. [CrossRef]
- Y. Xuan, W. Roetzel. Conceptions for heat transfer correlation of nanofluids. International Journal of Heat and Mass Transfer, vol. 43(19), pp. 3701–3707, 2000. [CrossRef]
- U. Rea, T. McKrell, L.W. Hu, J. Buongiorno. Laminar convective heat transfers and viscous pressure loss of alumina-water and zirconia-water nanofluids. International Journal of Heat and Mass Transfer, vol. 52(7–8), pp. 2042–2048, 2009. [CrossRef]
- M. Corcione. Rayleigh-Bénard convection heat transfer in nanoparticle suspensions. International Journal of Heat and Fluid Flow, vol. 32(1), pp. 65–77, 2011. [CrossRef]
- Kandlikar, S. G. Single-phase liquid flow in minichannels and microchannels. Heat Transfer and Fluid Flow in Minichannels and Microchannels, pp.87–136, 2006. [CrossRef]
- I.E. Idelchik, Handbook of Hydraulic Resistance, Hemisphere Publishing, New York, NY; 1986.
- J. Zhang, Y. Diao, Y. Zhao, Y. Zhang. An experimental investigation of heat transfer enhancement in minichannel: Combination of nanofluid and micro fin structure techniques. Experimental Thermal and Fluid Science, vol. 81, pp. 21–32, 2017. [CrossRef]
- R.J. Moffat. Describing the uncertainties in experimental results. Experimental Thermal and Fluid Science, vol. 1(1), pp. 3–17, 1988. [CrossRef]
- M. Mokrane, M. Lounis, M. Announ, M. Ouali, M.A. Djebiret, M. Bourouis. Performance analysis of a micro heat exchanger in electronic cooling applications. Journal of Thermal Engineering, vol. 7(4), pp. 773-790, 2021; https://jten.yildiz.edu.tr/article/34.
- S.V. Patankar. Numerical heat transfer and fluid flow. CRC Press, 1980. [CrossRef]
- P.S. Lee, S.V. Garimella, D. Liu. Investigation of heat transfer in rectangular microchannels. International Journal of Heat and Mass Transfer, vol. 48(9), pp. 1688–1704, 2005. [CrossRef]
- X.F. Peng, G.P. Peterson. Convective heat transfer and flow friction for water flow in microchannel structures. International Journal of Heat and Mass Transfer, vol. 39(12), pp. 2599–2608, 1996. [CrossRef]
- R.K. Shah, A.L. London. Laminar flow forced convection in ducts: a source book for compact heat exchanger analytical data. Academic Press, New York, USA, 1978. [CrossRef]
- T.M. Harms, M.J. Kazmierczak, F.M. Gerner. Developing convective heat transfer in deep rectangular microchannels. International Journal of Heat and Fluid Flow, vol. 20(2), pp. 149-157, 1999. [CrossRef]
- K. Kawano, M. Sekimura, K. Minakami, H. Iwasaki, M. Ishizuka. Development of micro channel heat exchanging. JSME International Journal, Series B: Fluids and Thermal Engineering, vol. 44(4), pp. 592-598, 2001. [CrossRef]
- W. Qu, I. Mudawar. Experimental and numerical study of pressure drop and heat transfer in a single-phase micro-channel heat sink. International Journal of Heat and Mass Transfer, vol. 45(12), pp. 2549–2565, 2002. [CrossRef]
- A.F. Al-Neama, N. Kapur, J. Summers, H.M. Thompson. An experimental and numerical investigation of the use of liquid flow in serpentine microchannels for microelectronics cooling. Applied Thermal Engineering, vol. 116, pp. 709–723, 2017. [CrossRef]
- V. Kumar, J. Sarkar. Experimental hydrothermal behavior of hybrid nanofluid for various particle ratios and comparison with other fluids in minichannel heat sink. International Communications in Heat and Mass Transfer, vol. 110, 104397, 2020. [CrossRef]
Figure 1.
Test module: (a) Micro heat exchanger, (b) Microchannels.
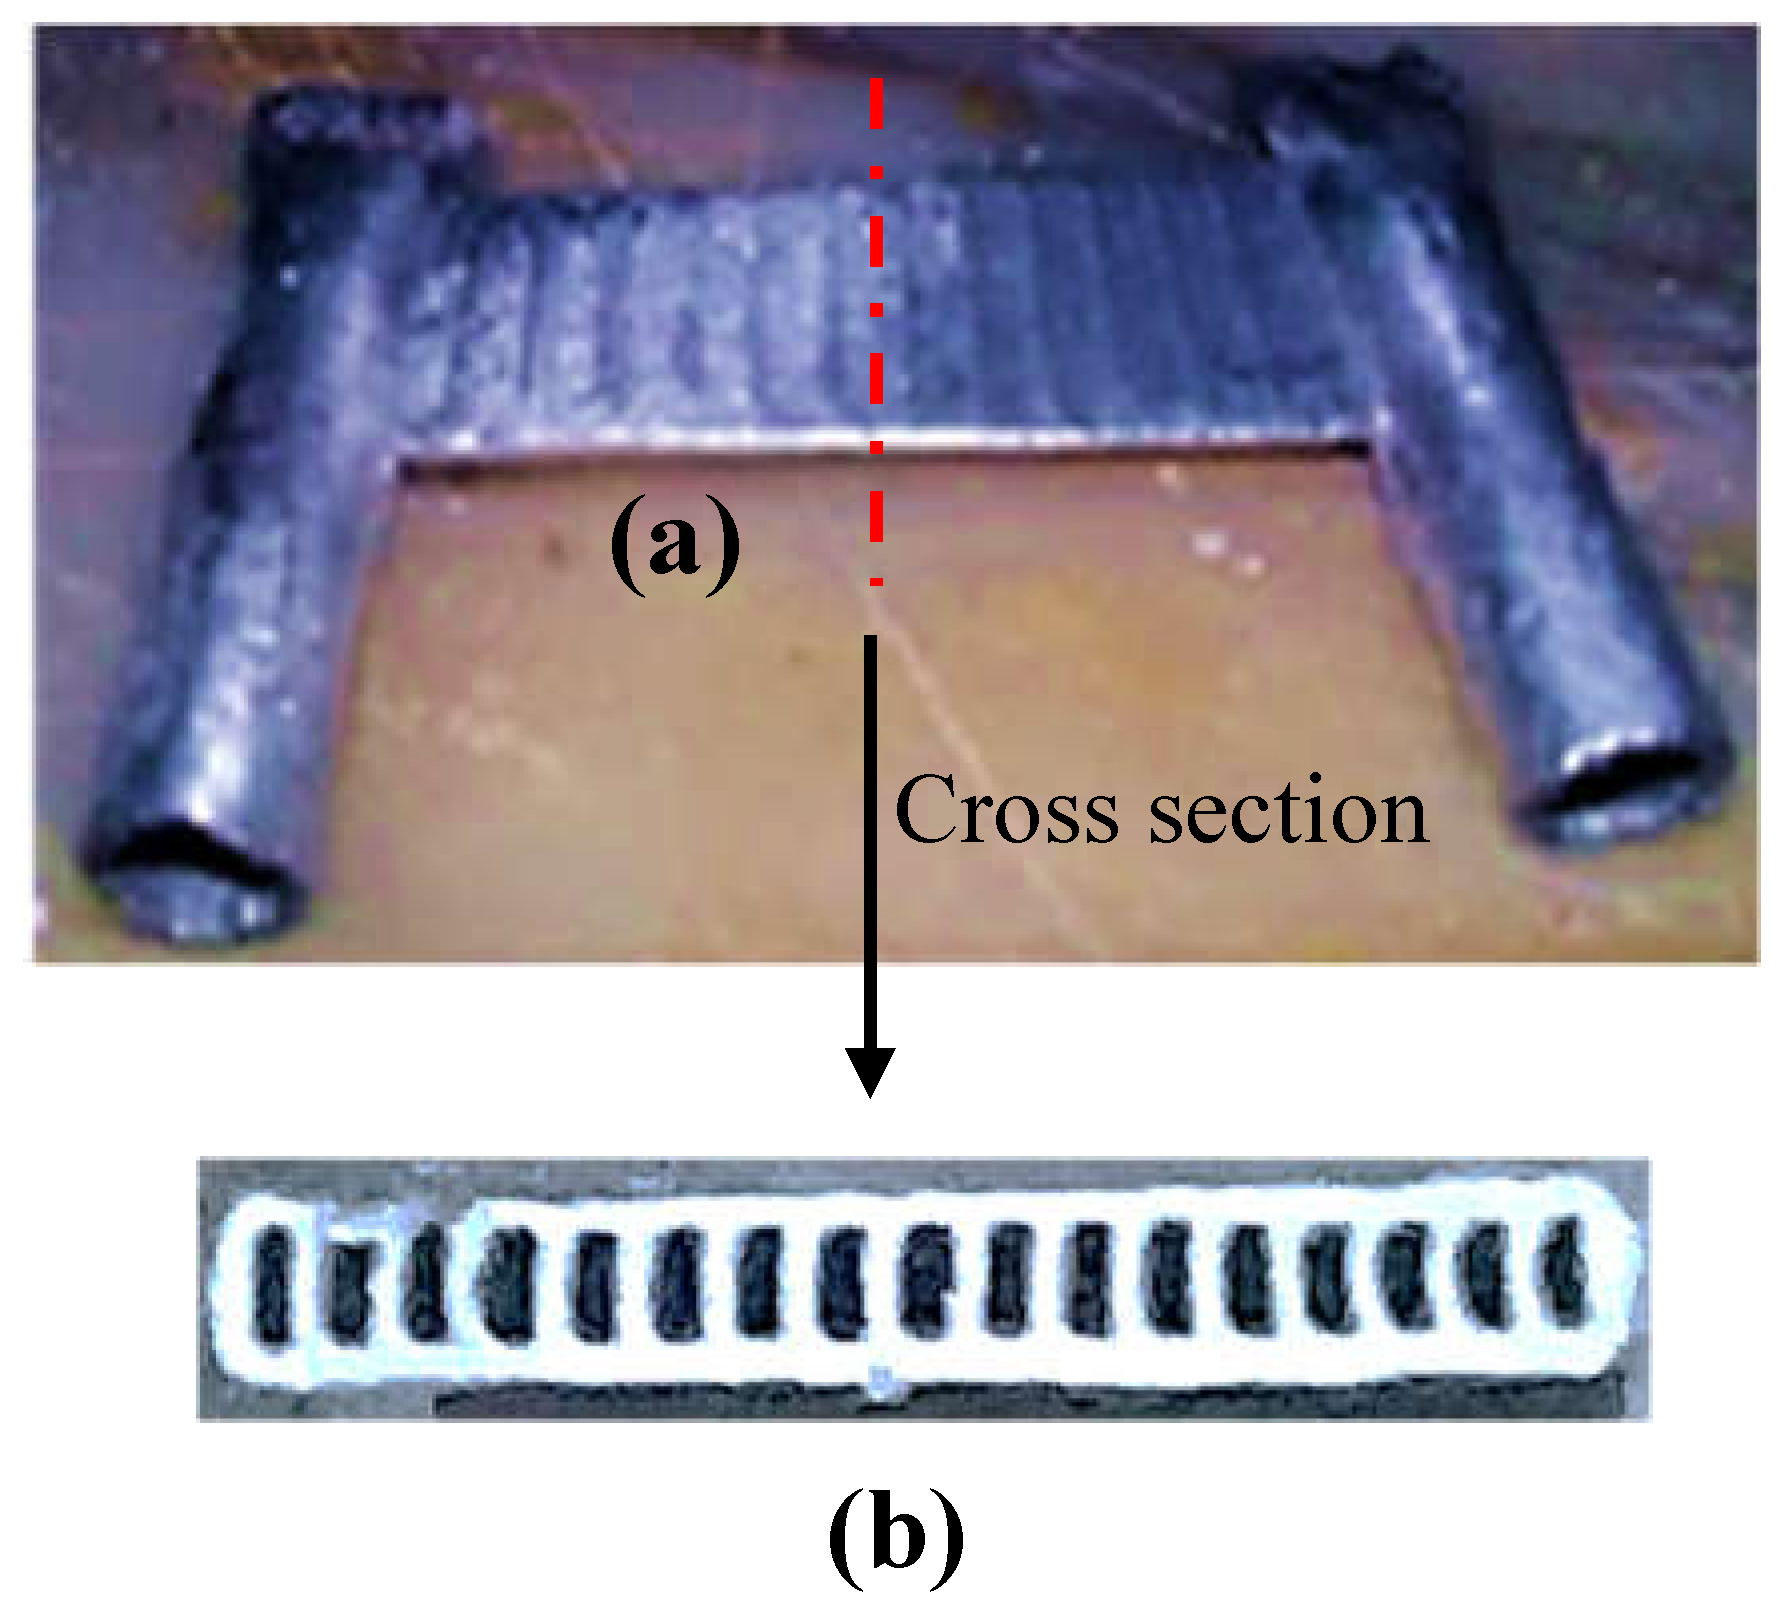
Figure 2.
Schematic diagram of the micro channel heat exchanger assembly.
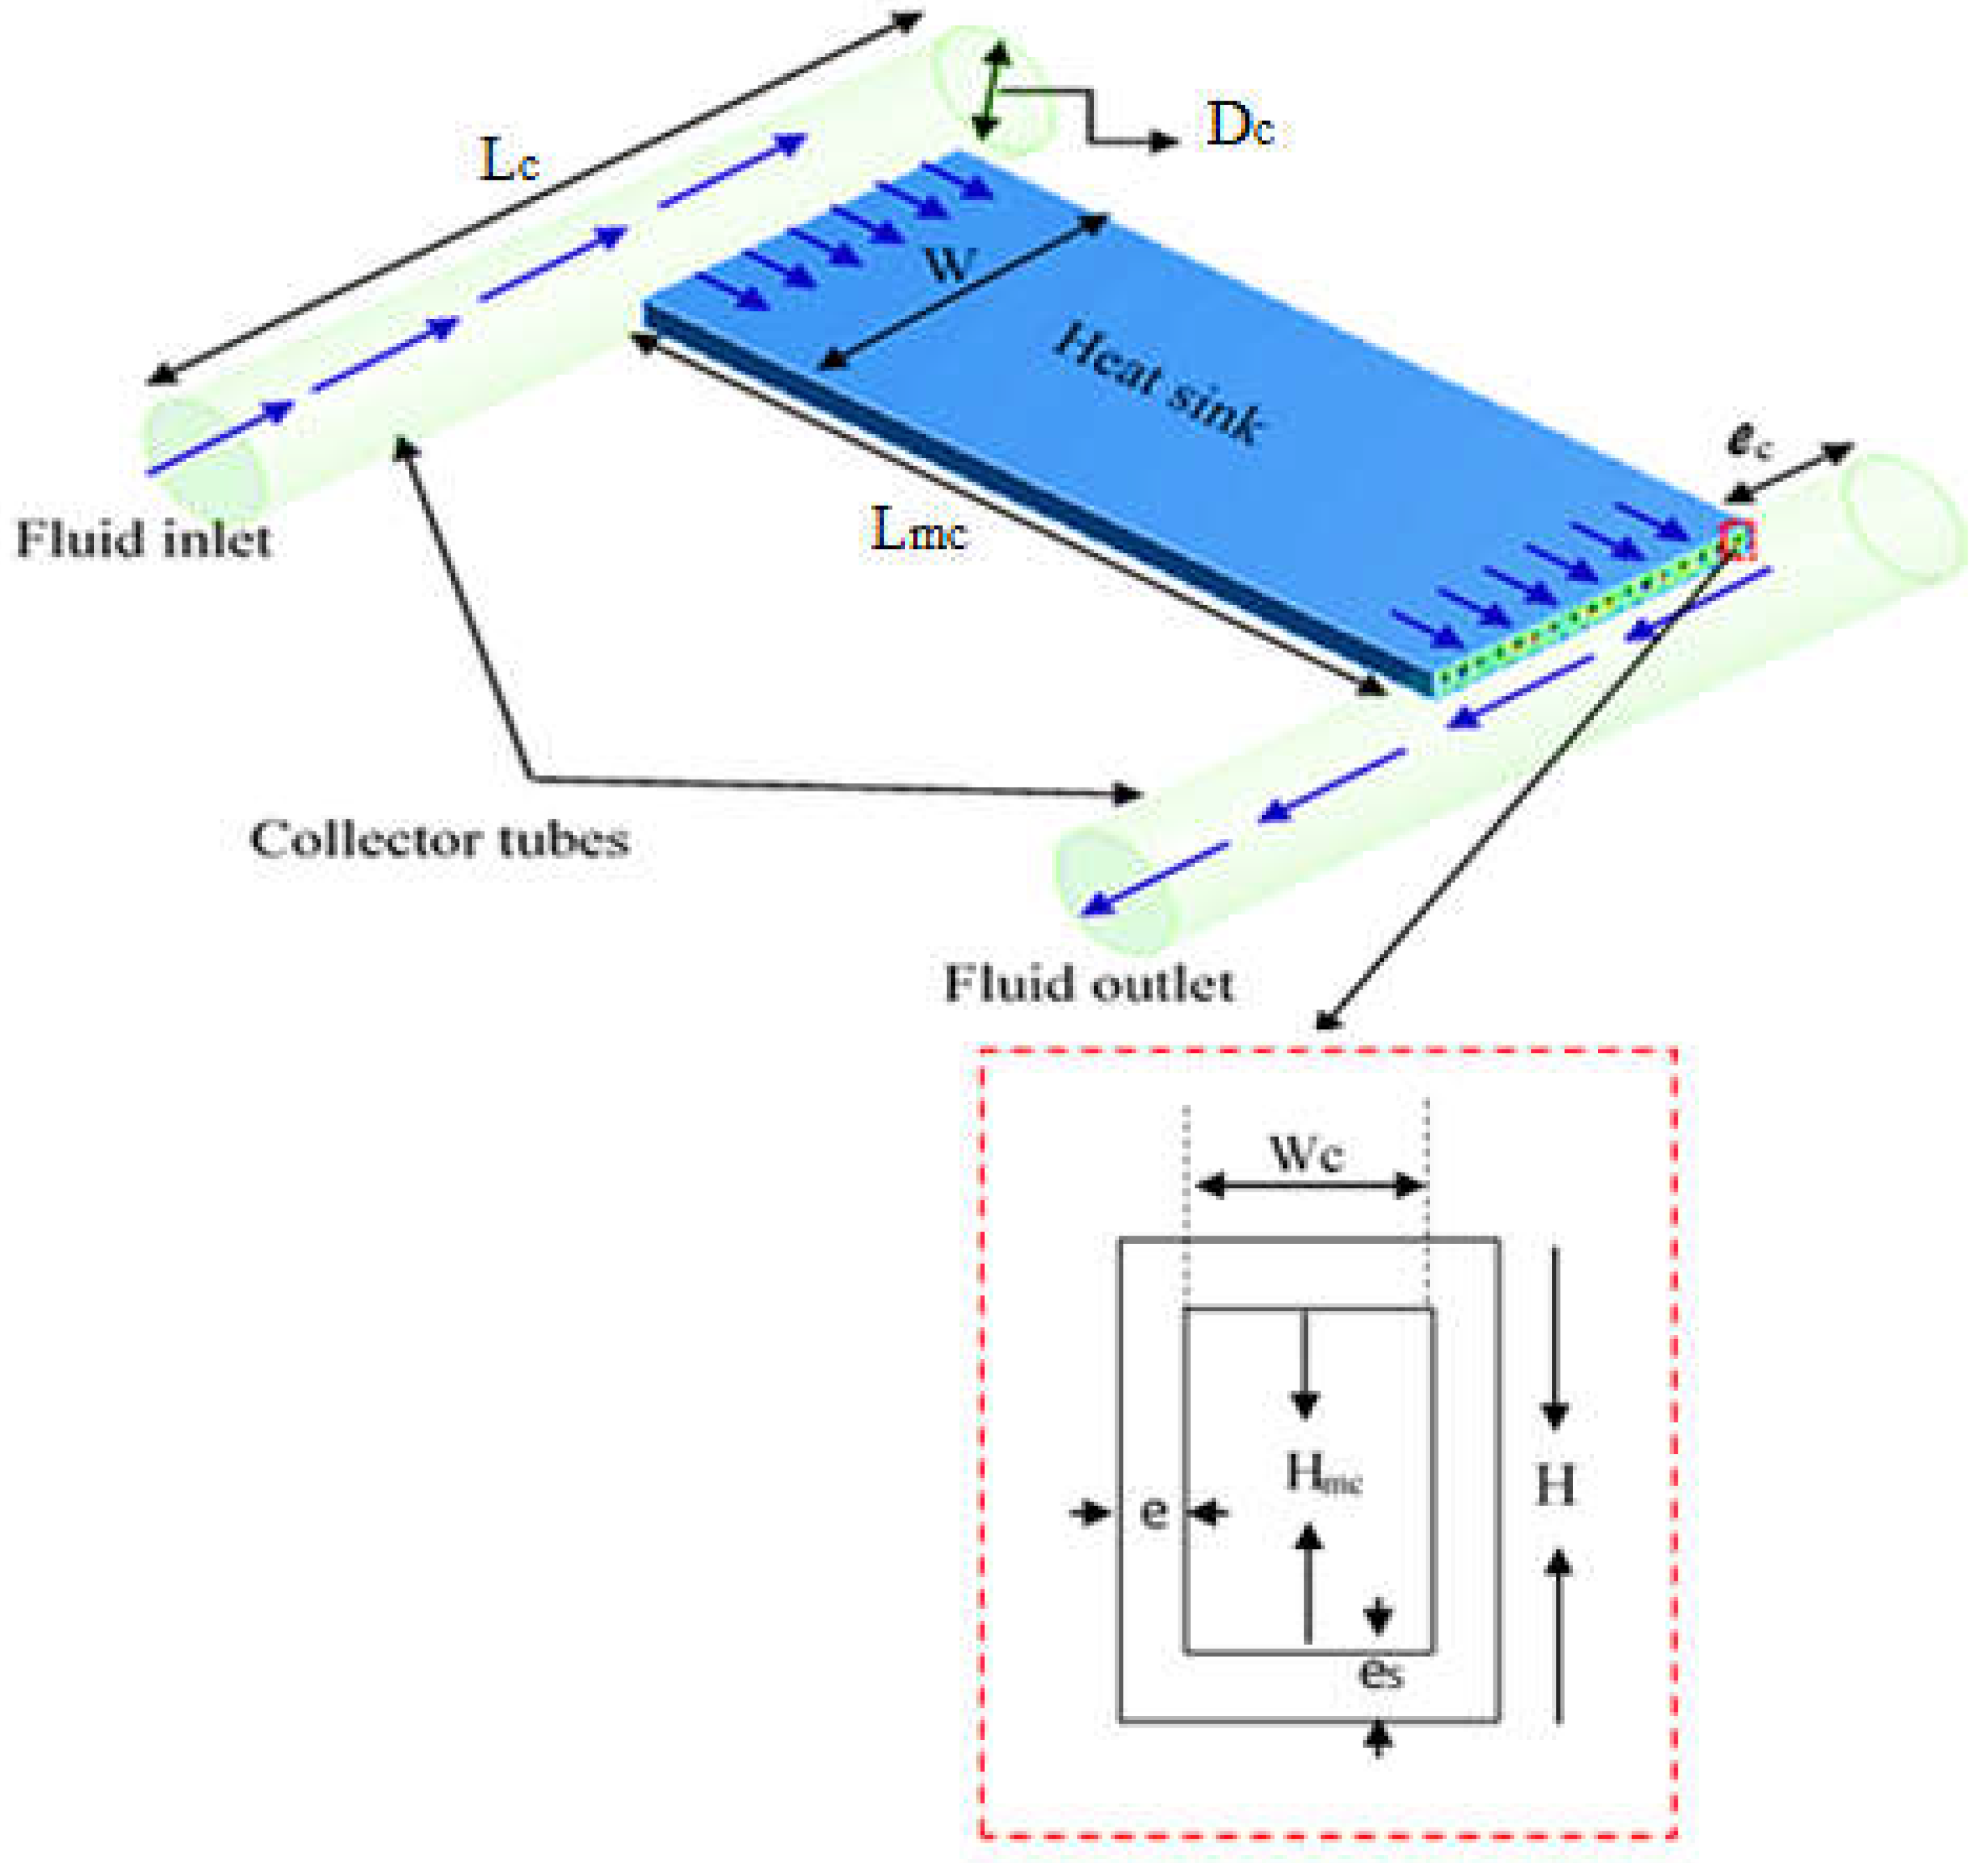
Figure 3.
Experimental rig.
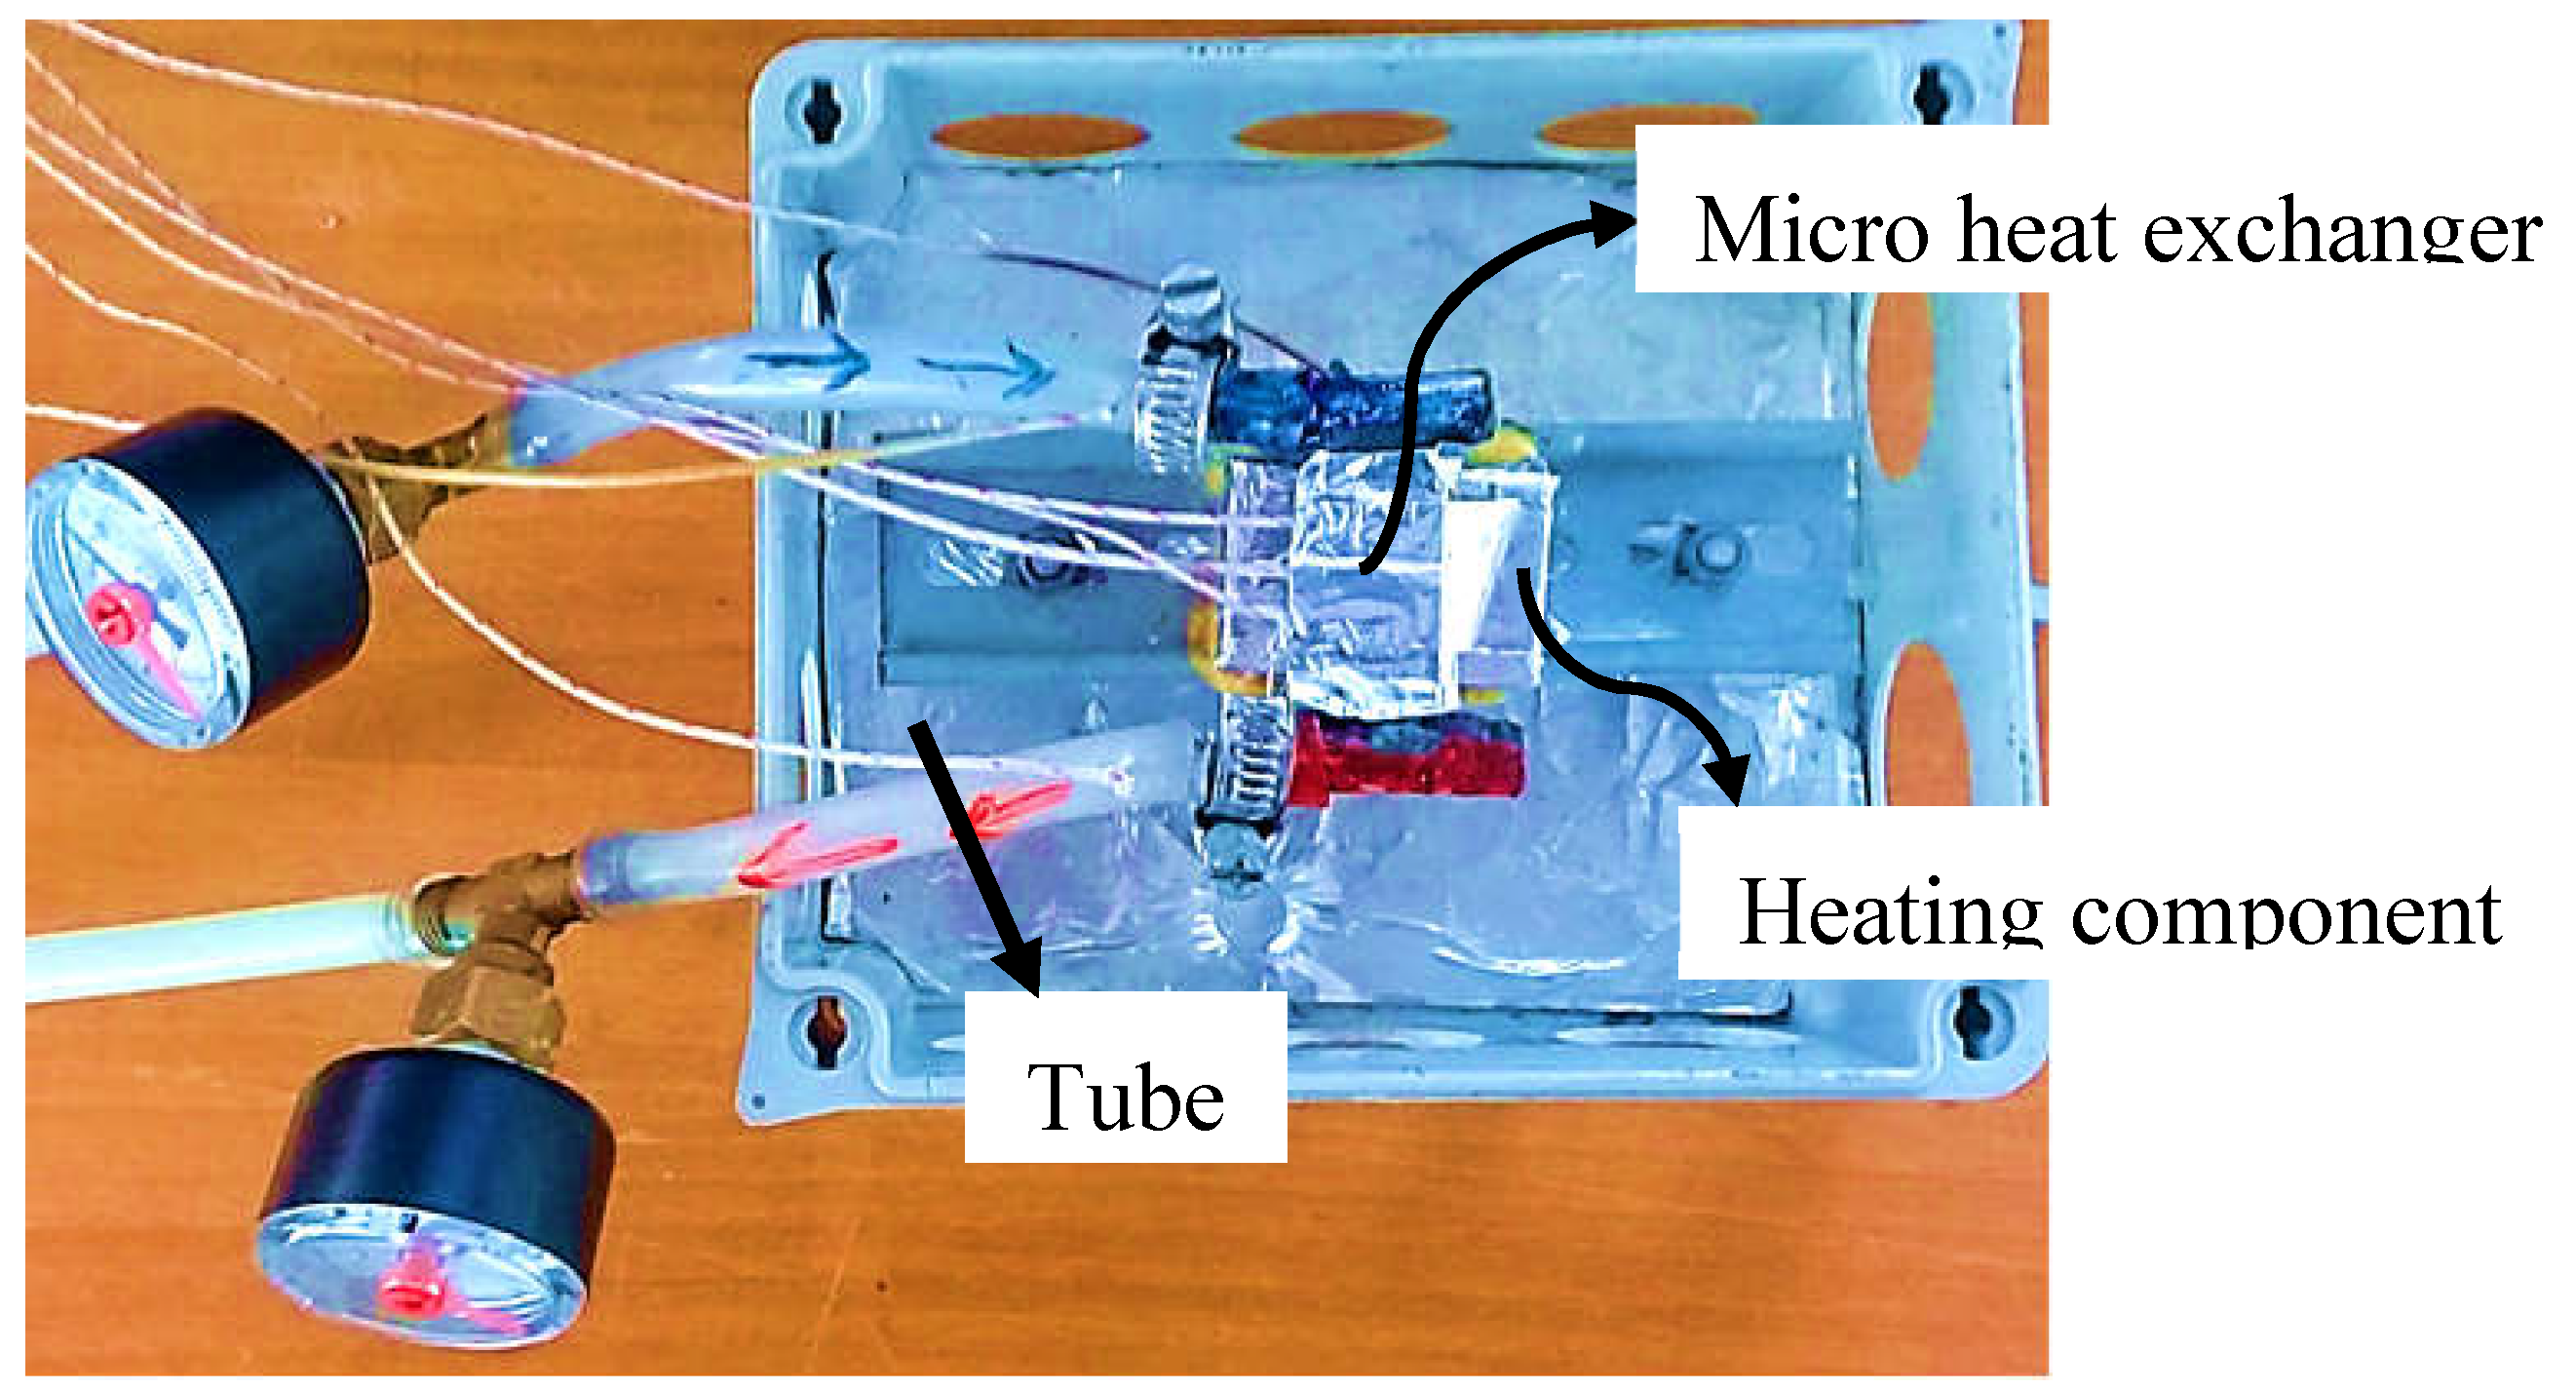
Figure 4.
Embedded device in parallelepiped box.
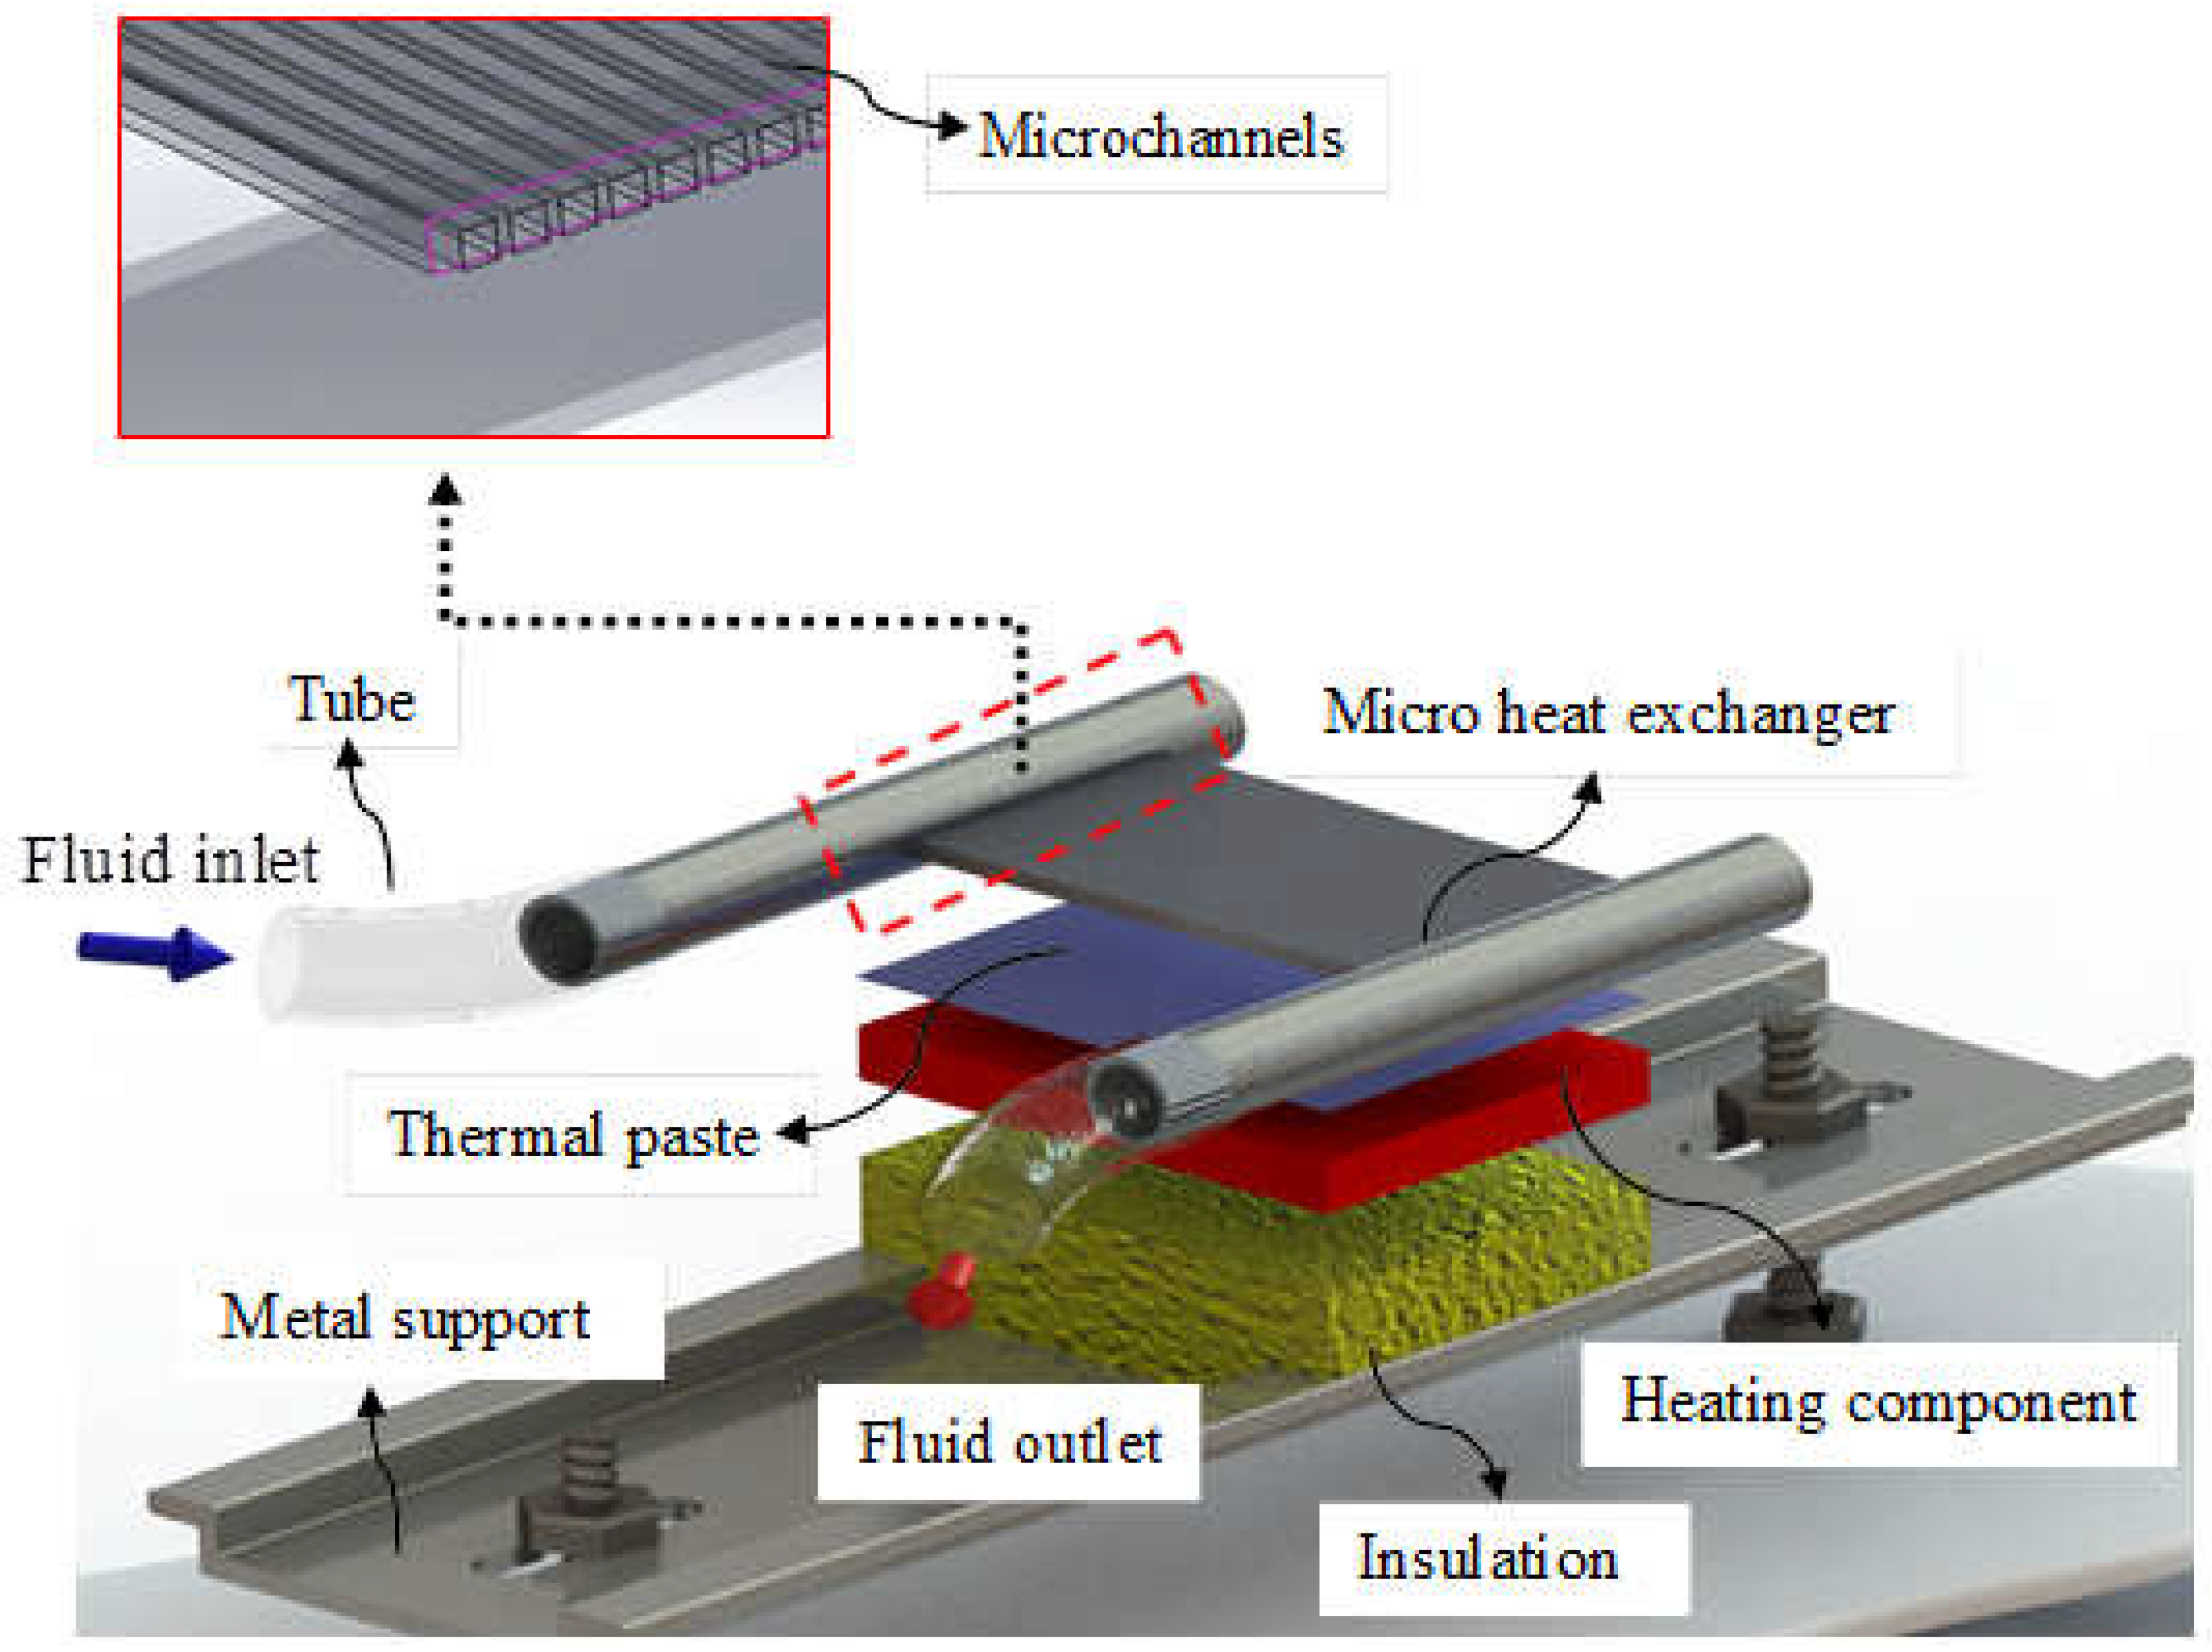
Figure 5.
Codification of the thermocouples installed in the experimental setup.
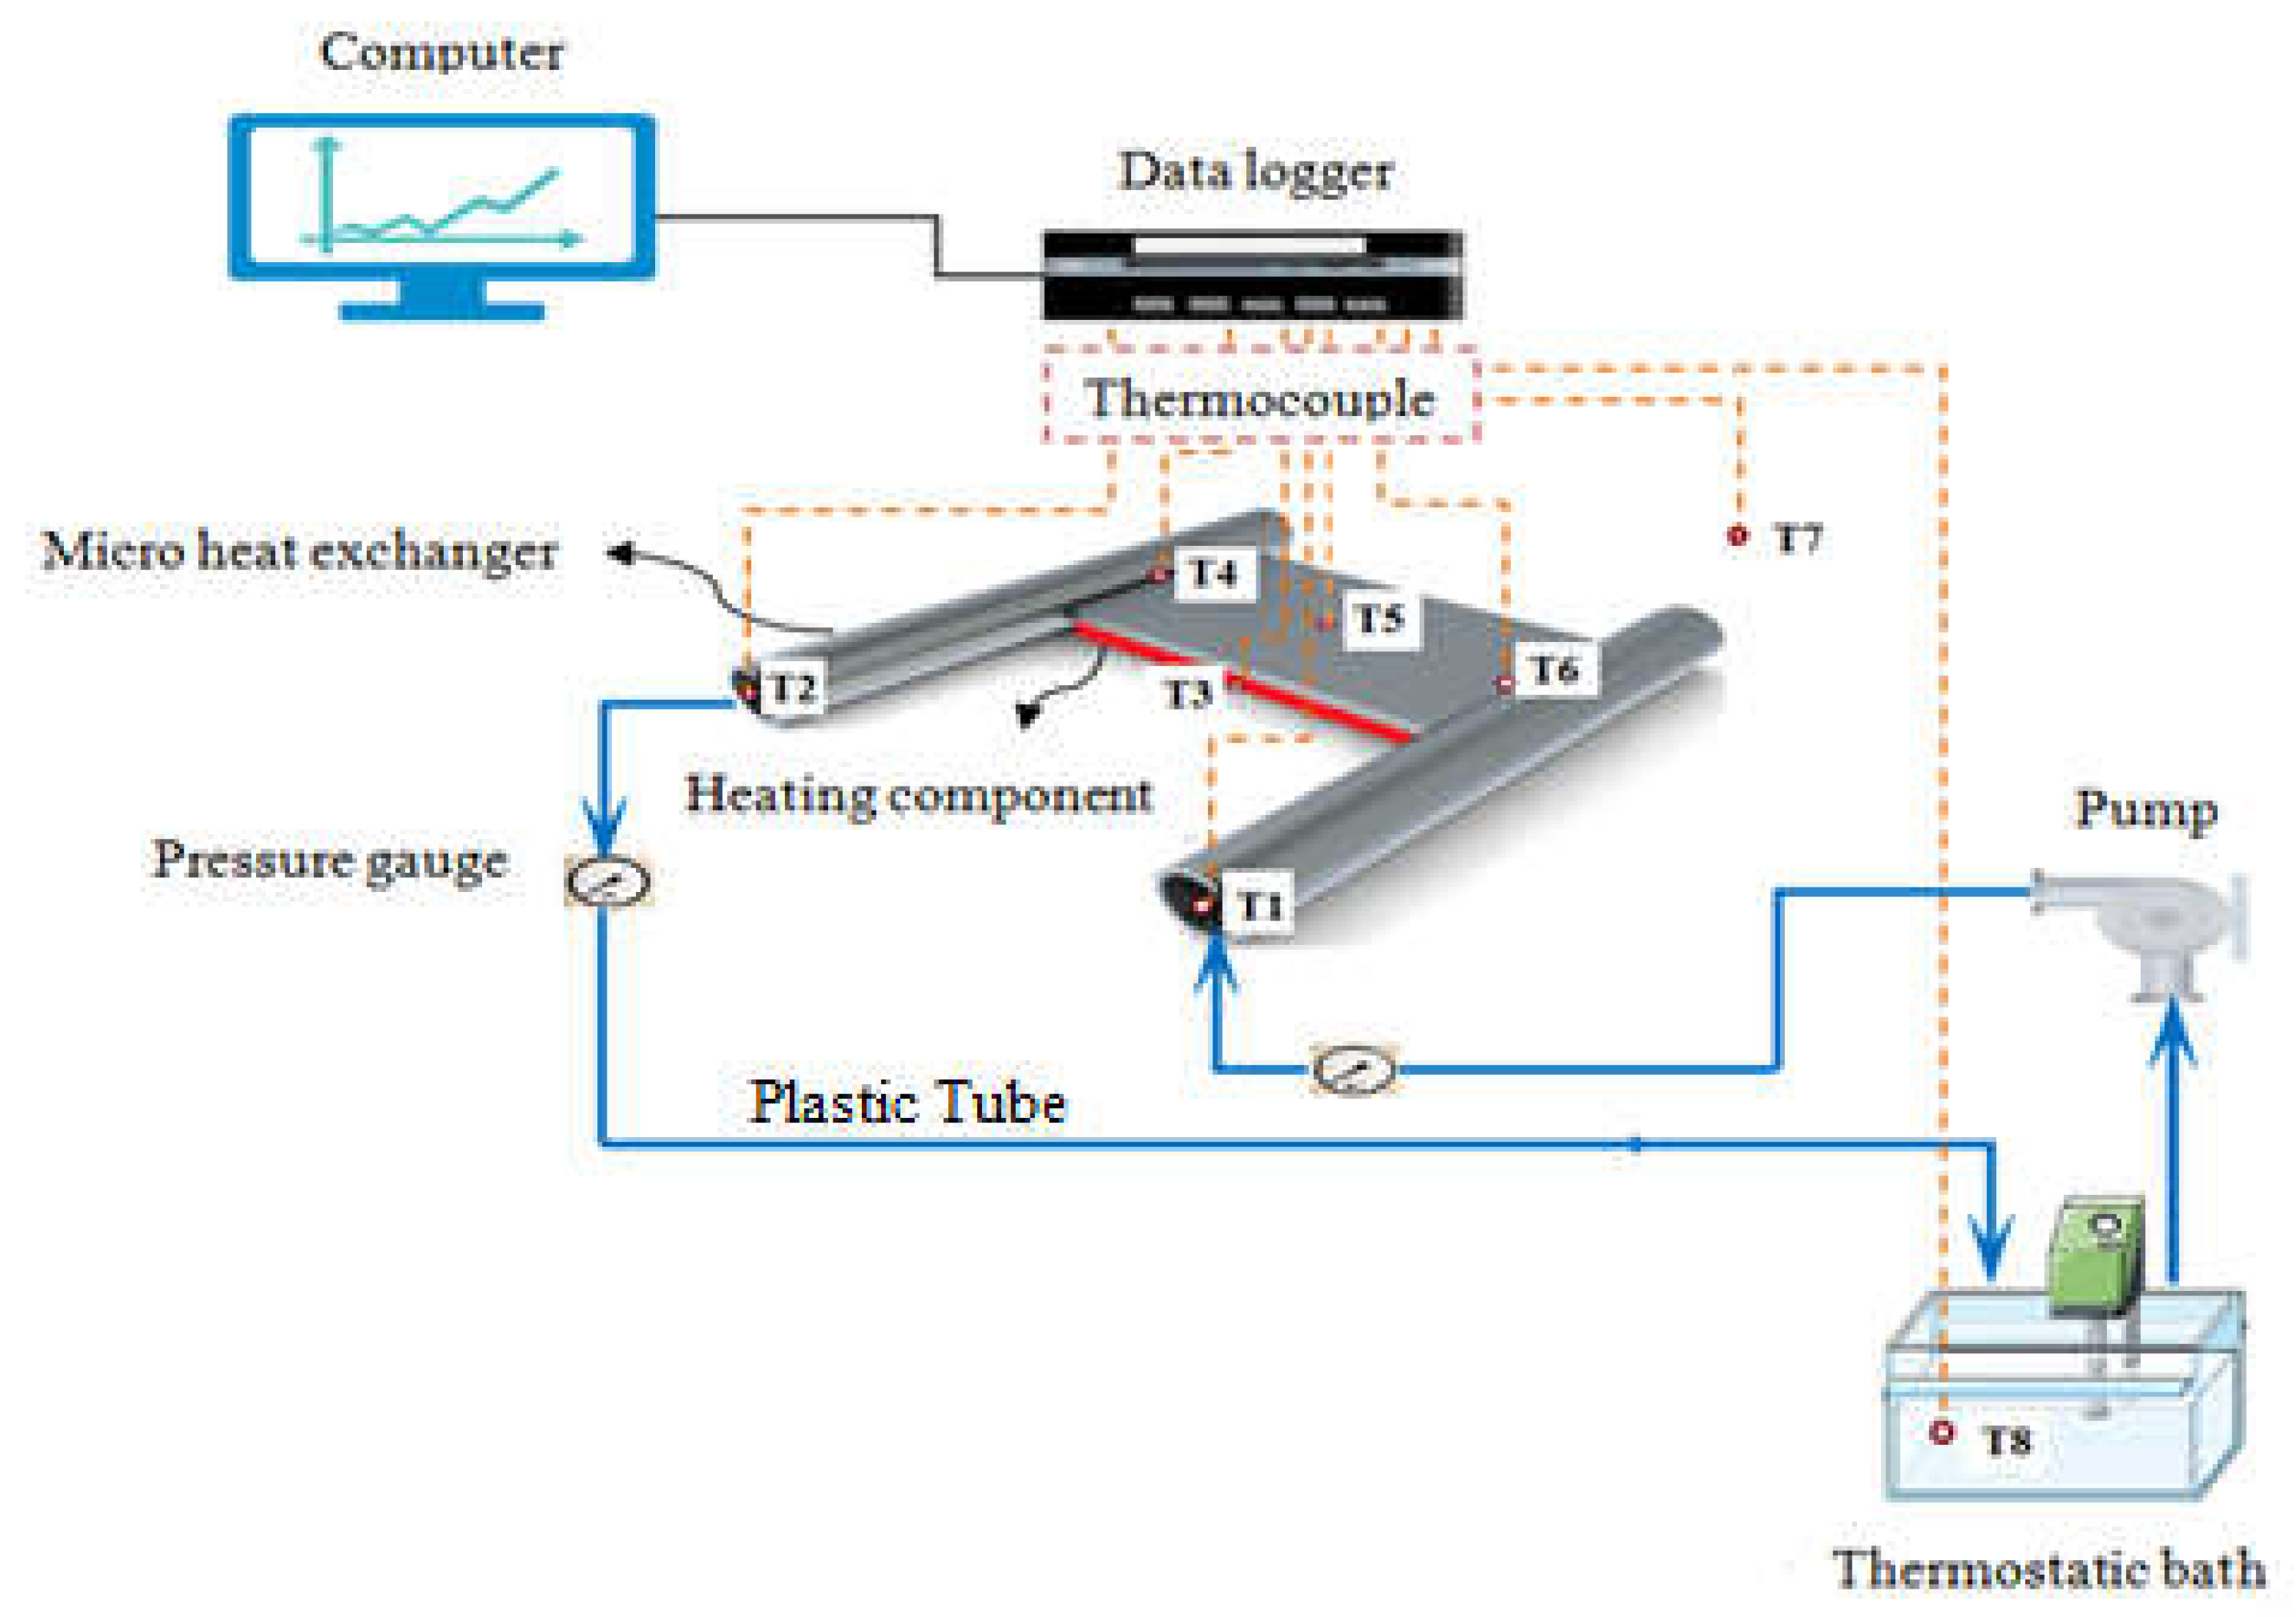
Figure 6.
Photos of the TiO2/water nanofluids prepared at different concentrations.
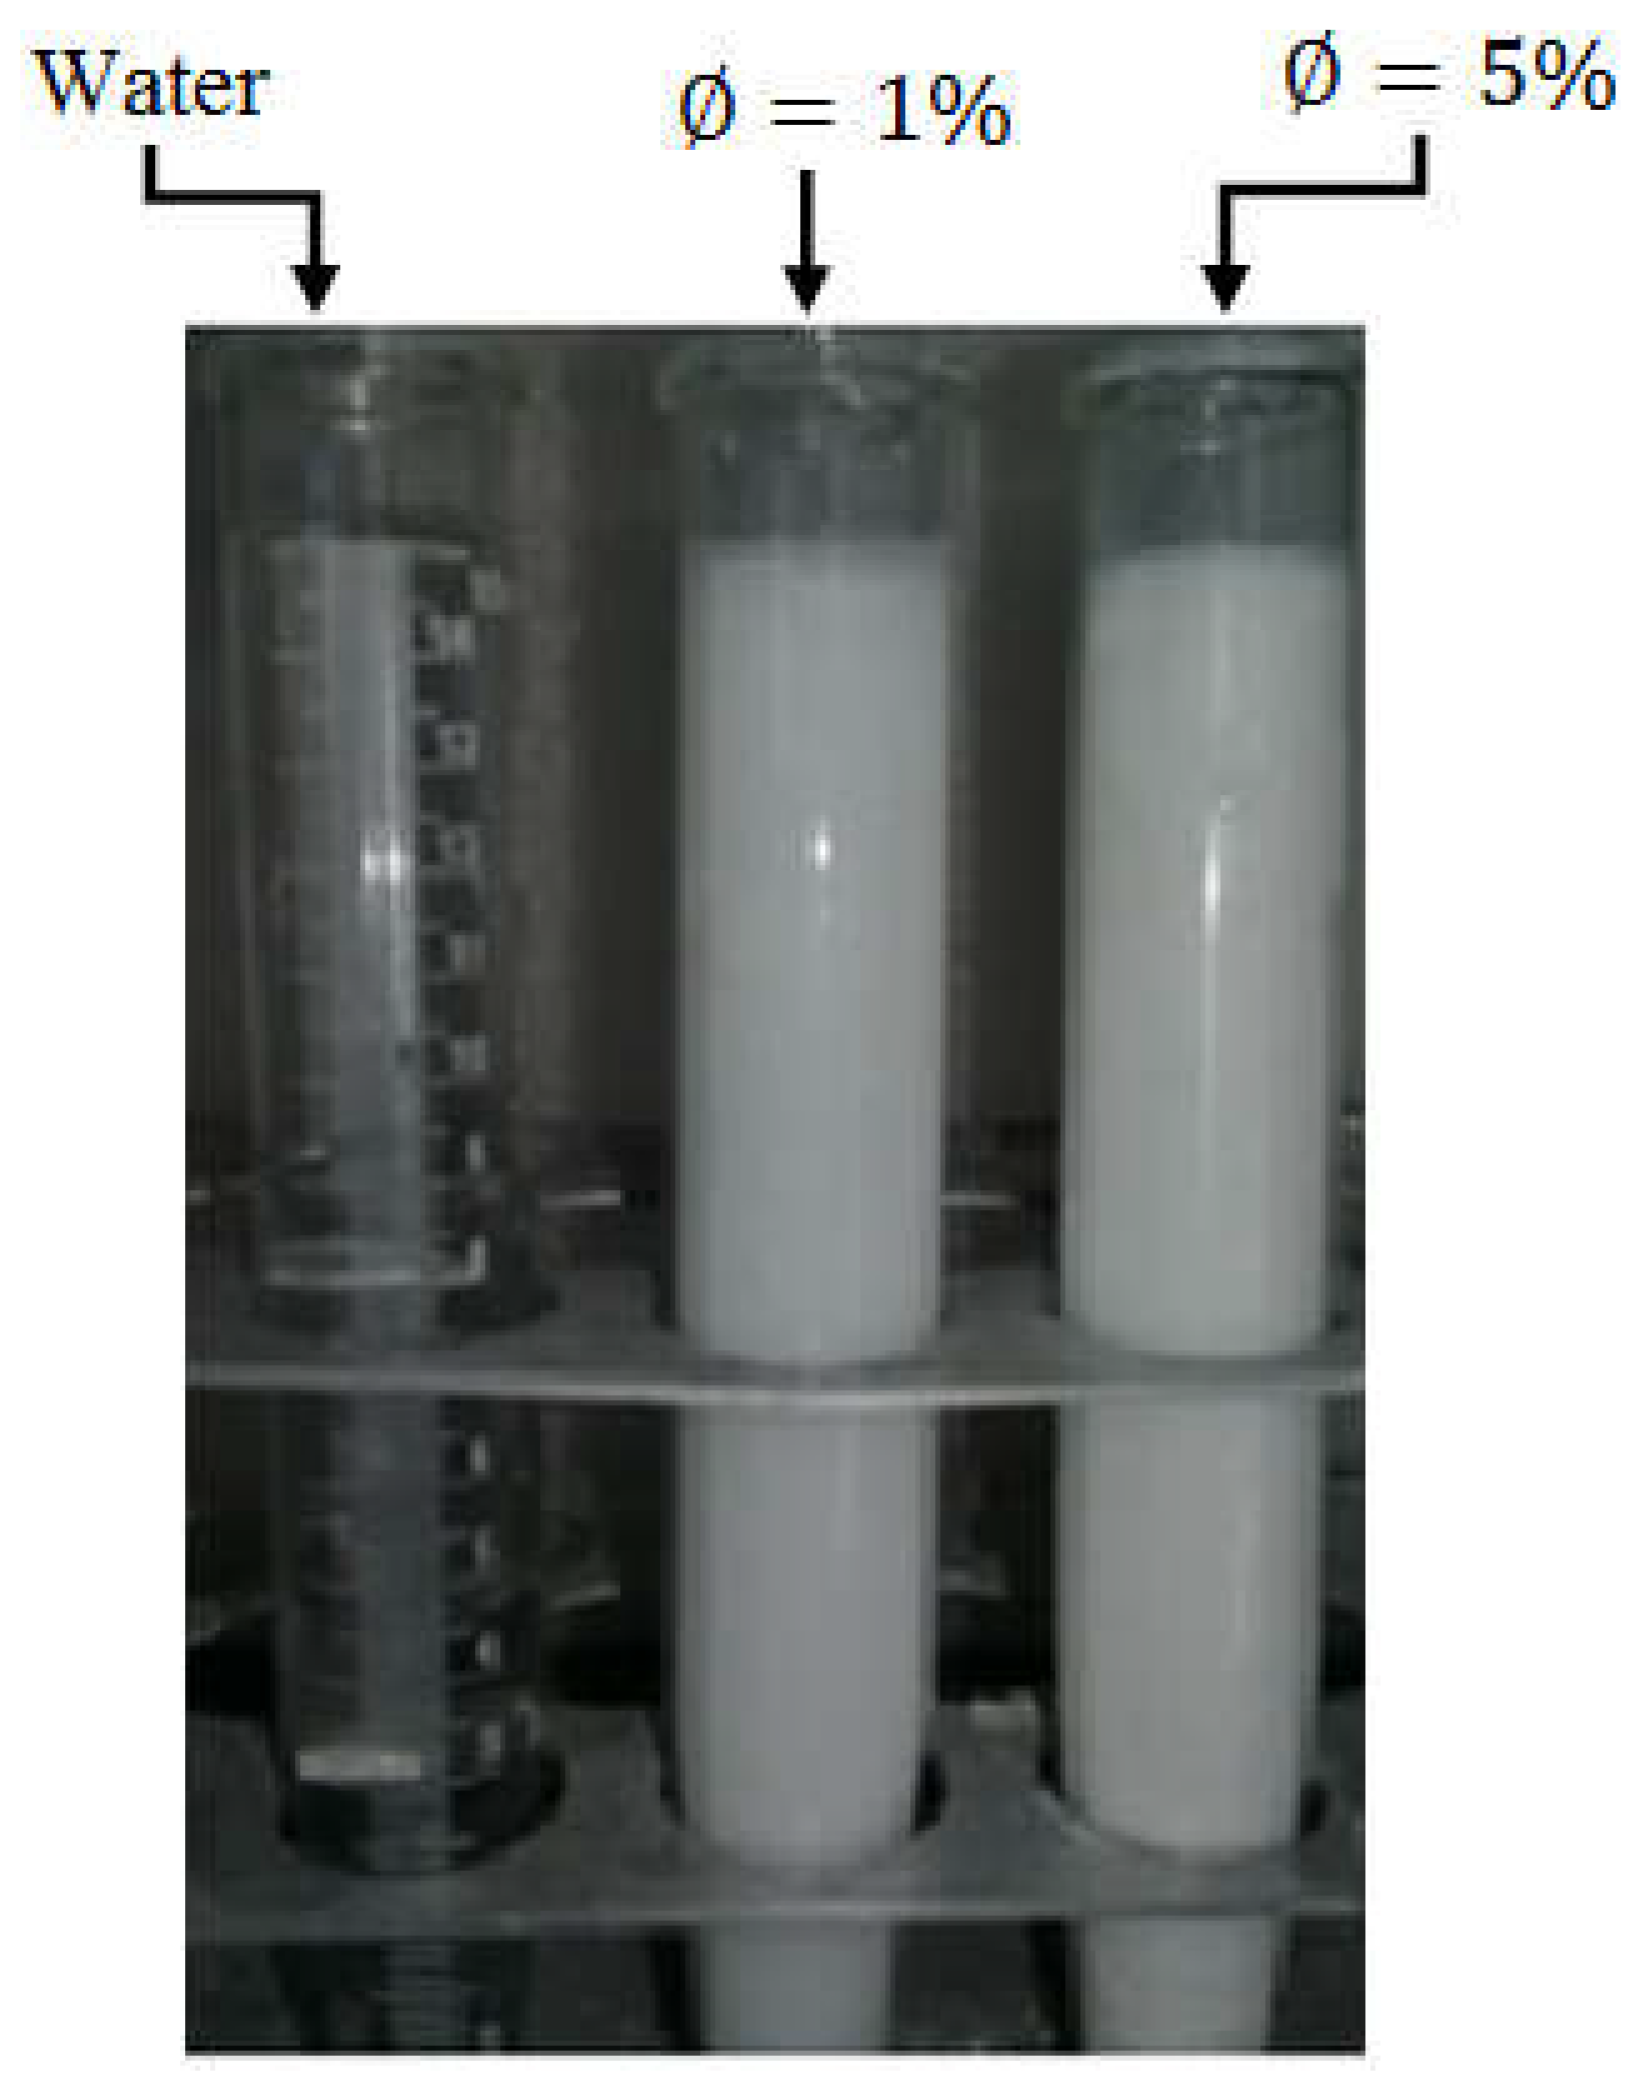
Figure 7.
Micro heat exchanger: (a) Layout, (b) Calculation volume.
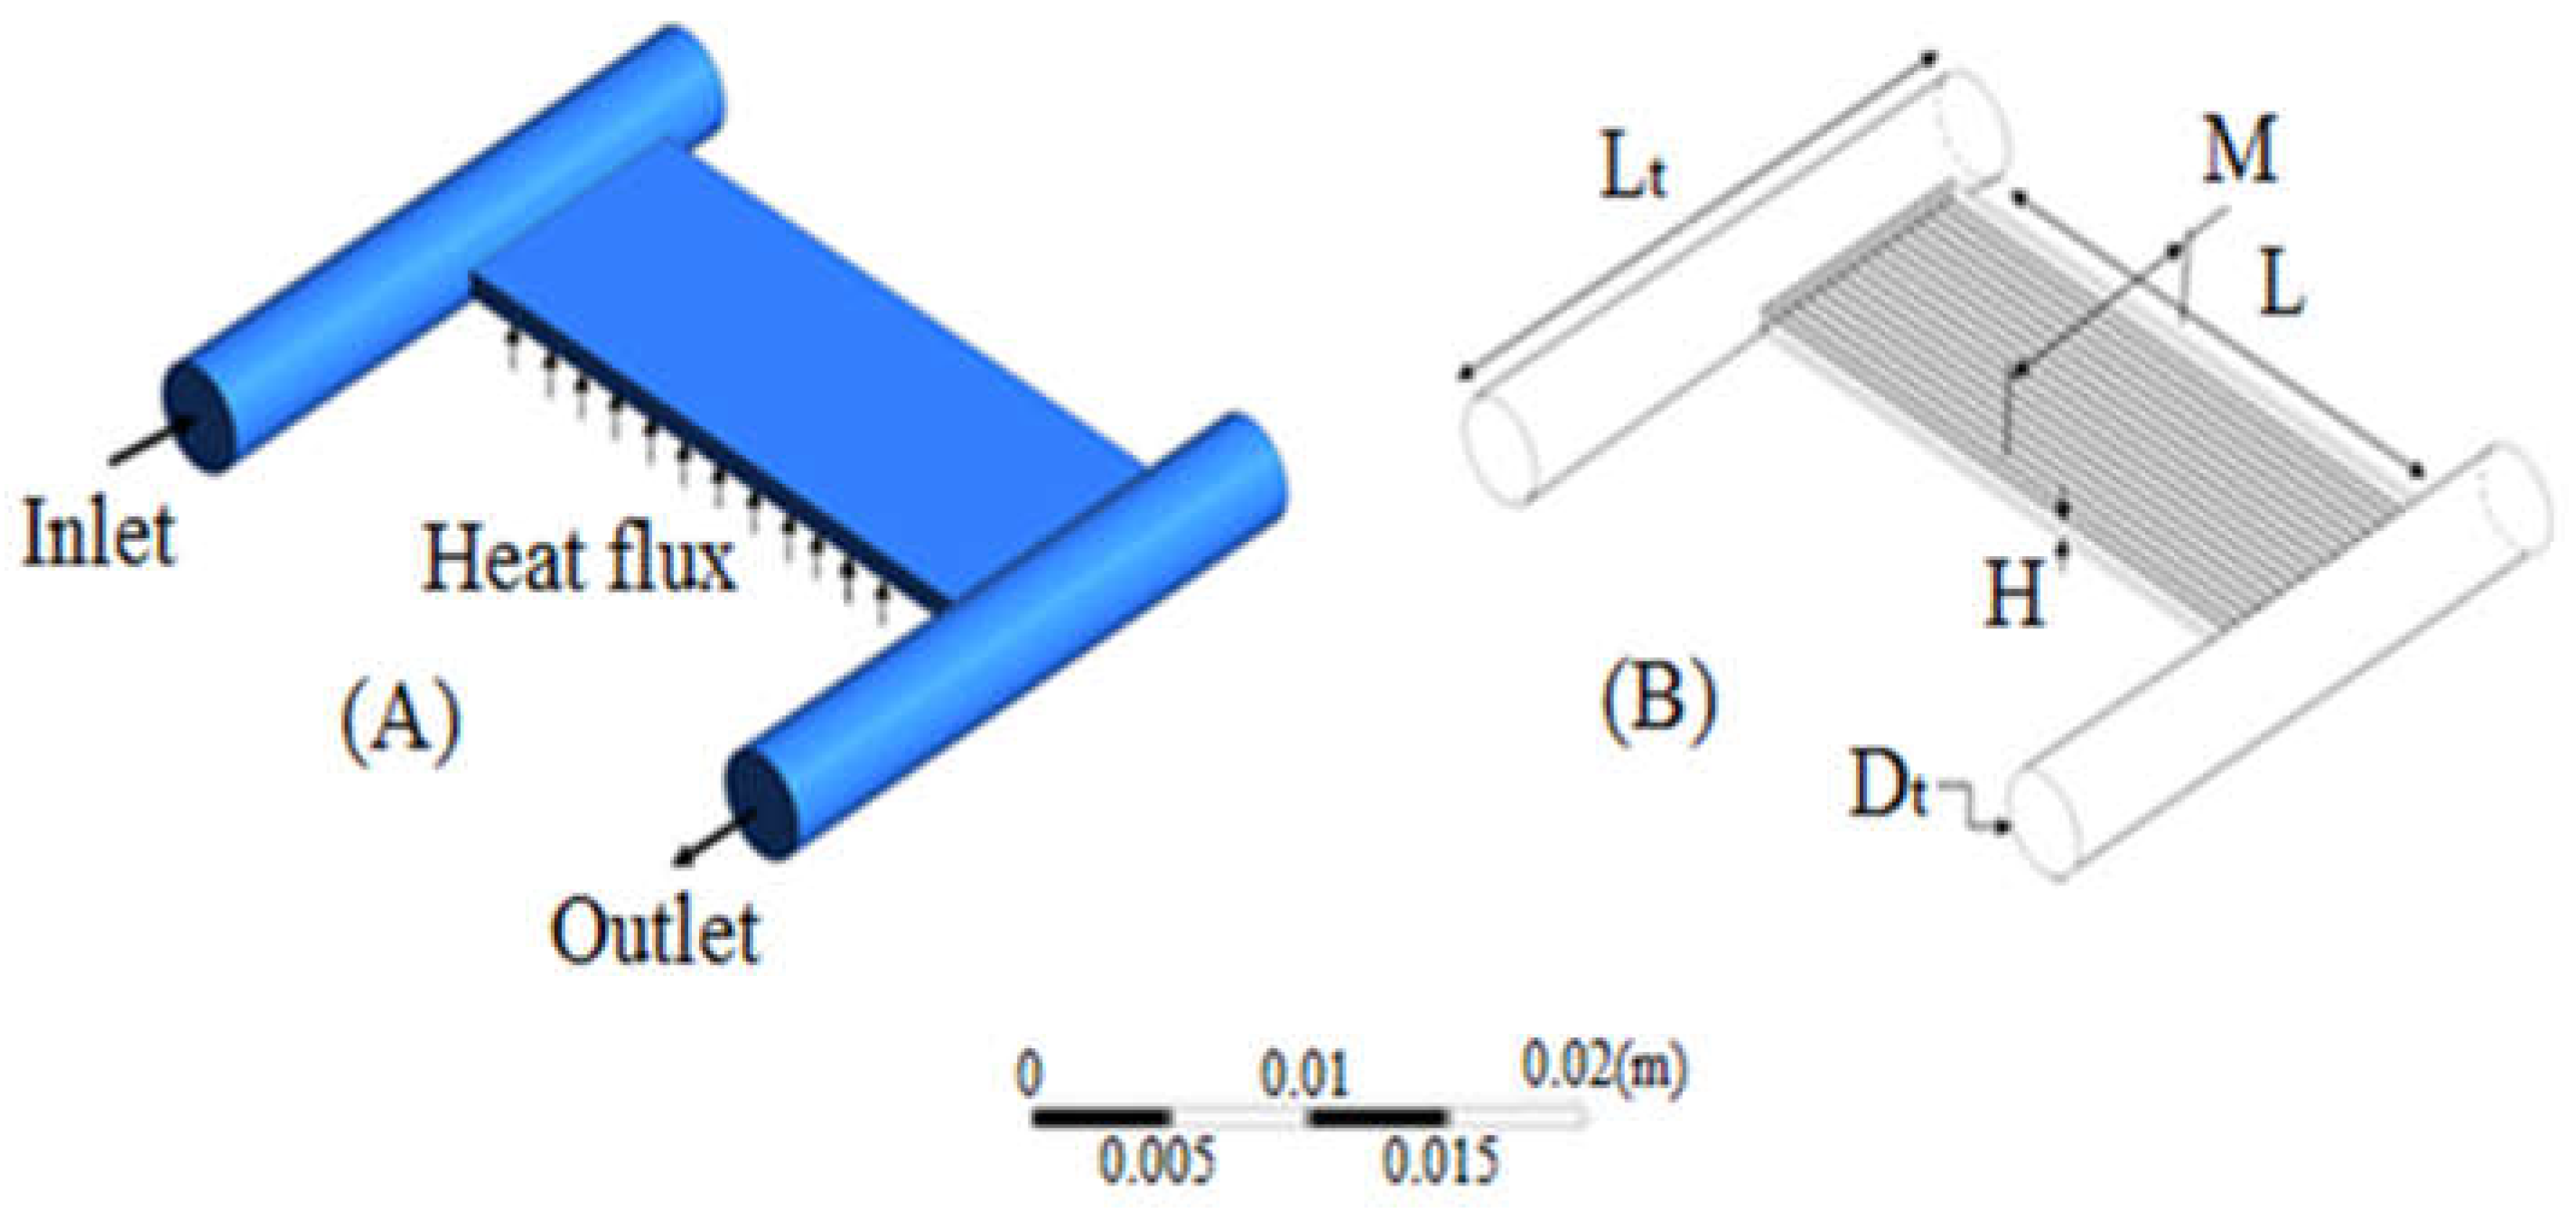
Figure 8.
Influence of the grid size on the temperature variation along the microchannels centerline.
Figure 8.
Influence of the grid size on the temperature variation along the microchannels centerline.
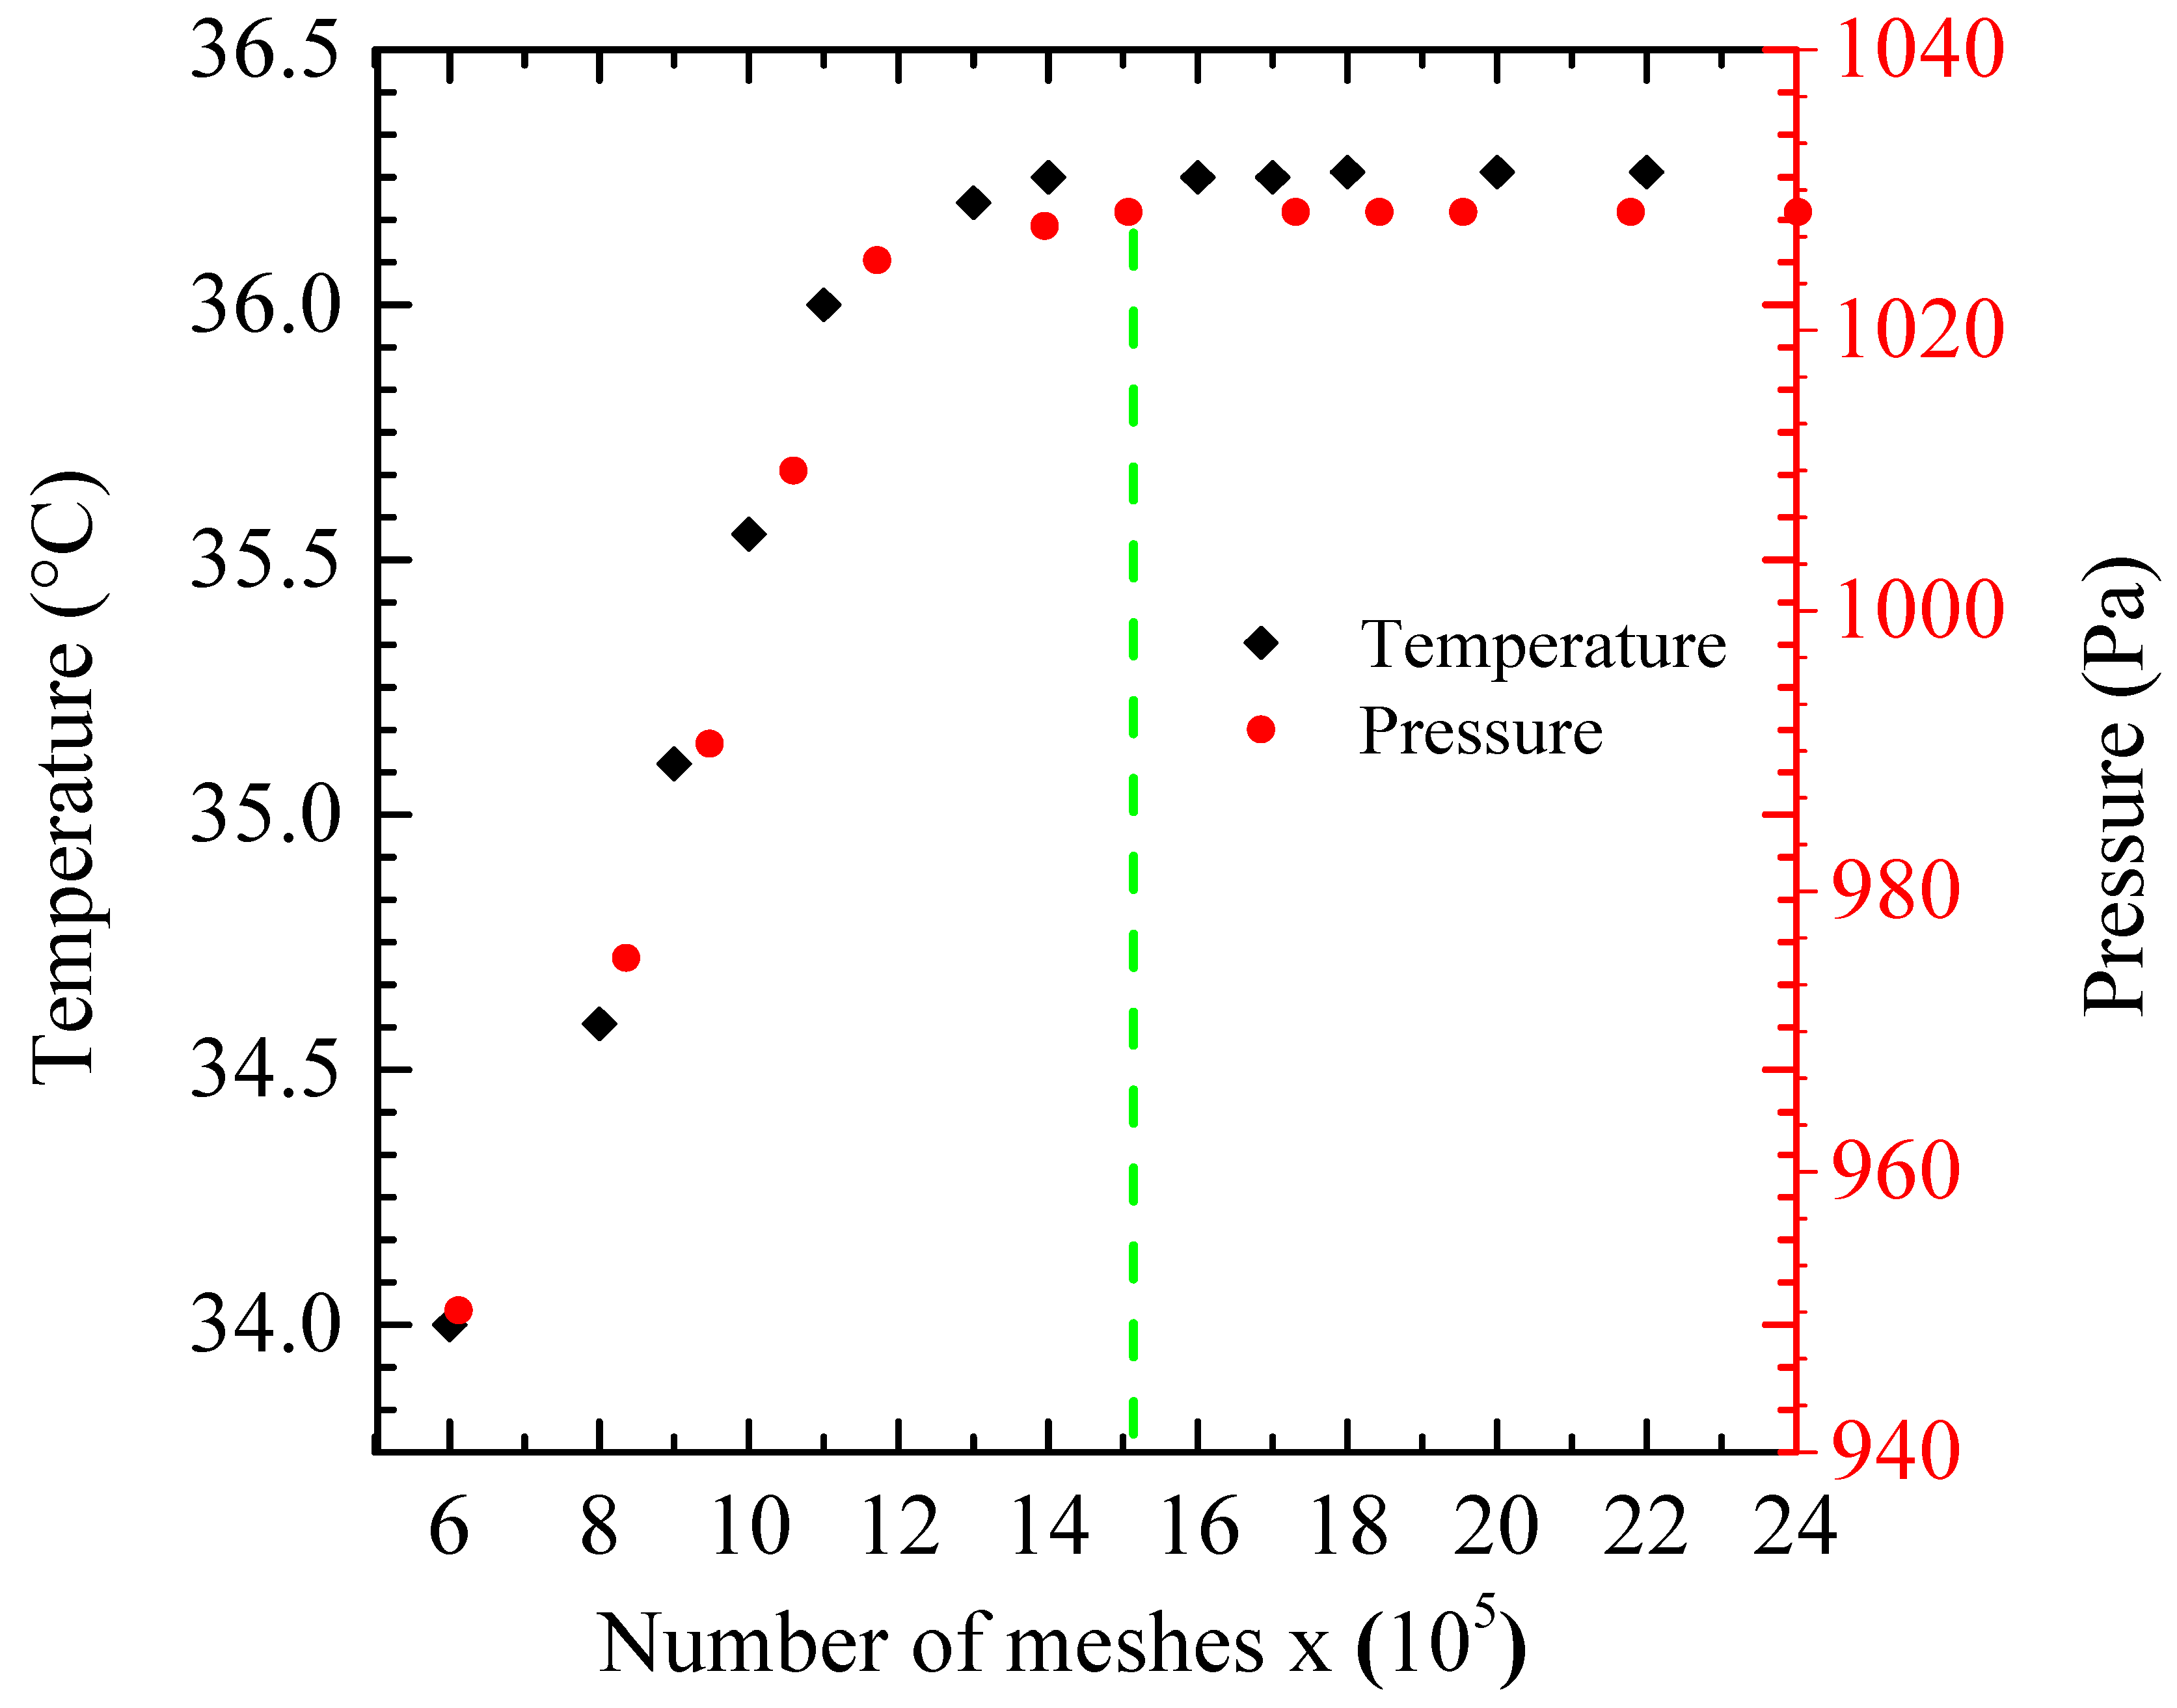
Figure 9.
Comparison of the average Nusselt number with the experimental data of Lee et al. [67], and of the values calculated by the Peng and Peterson correlation, using pure water [68].
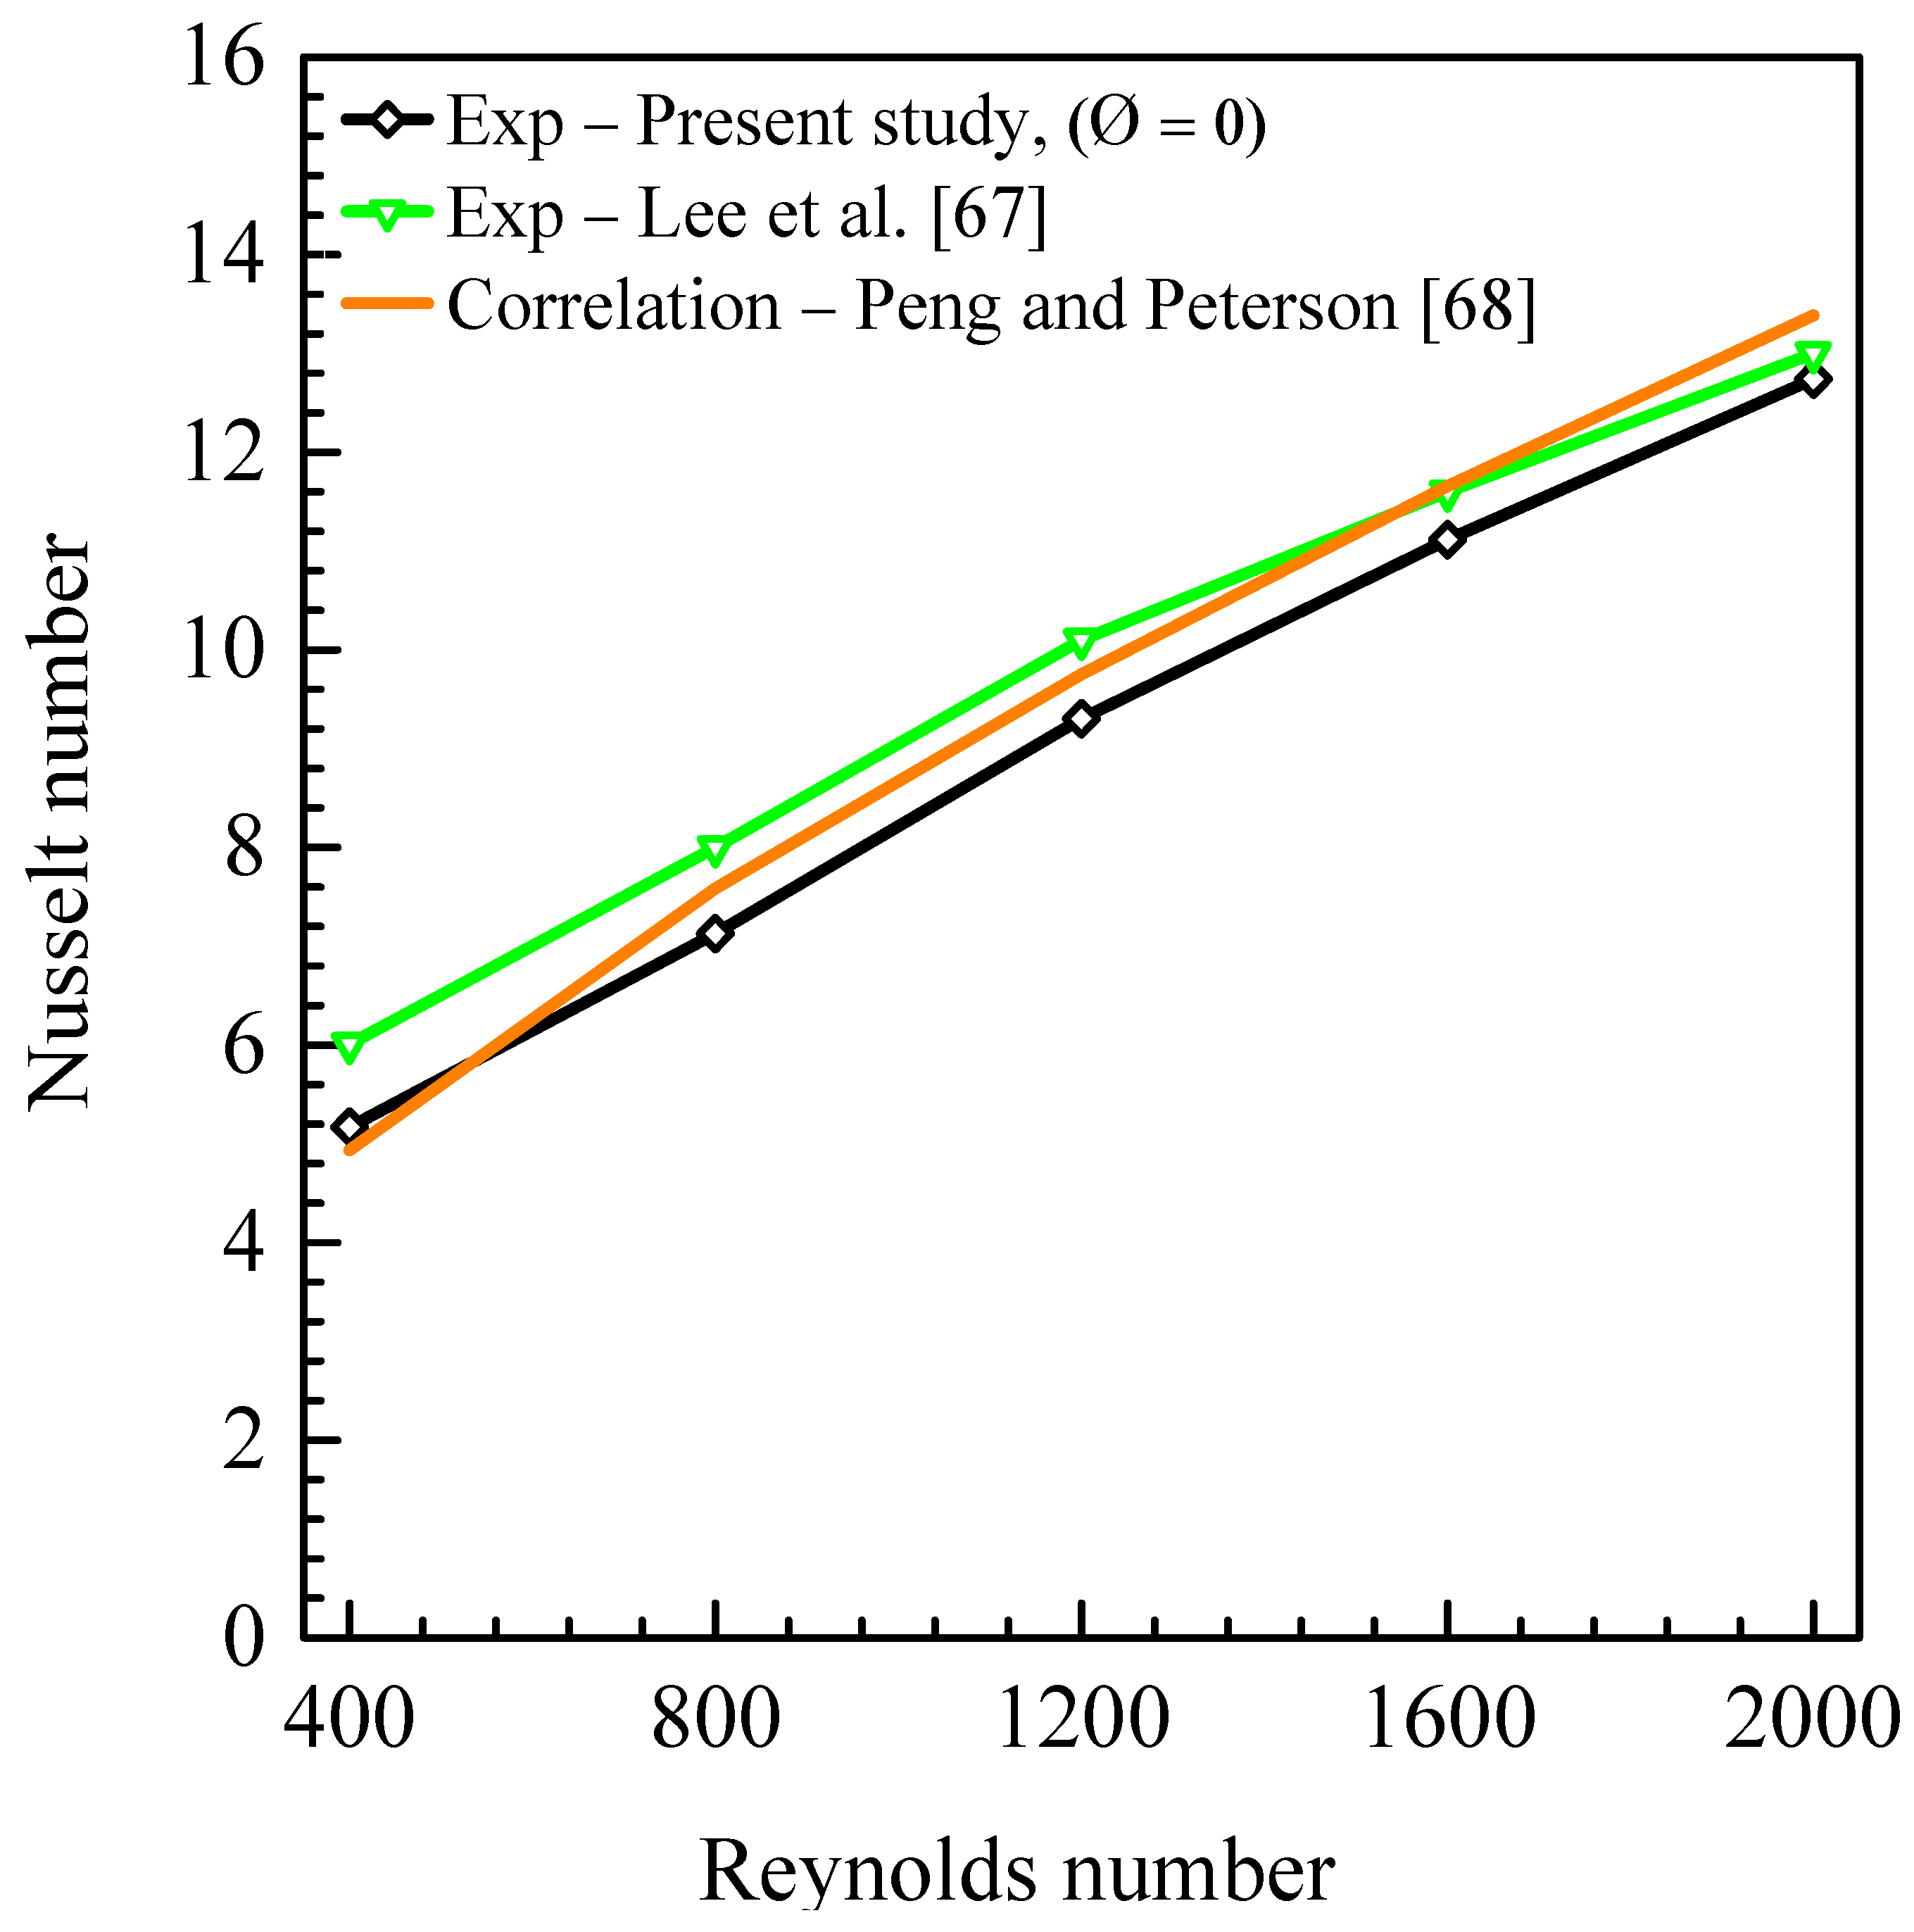
Figure 10.
Comparison of the friction factor with the experimental data of Harms et al. [70], and the values calculated by the Shah and London correlation [69].
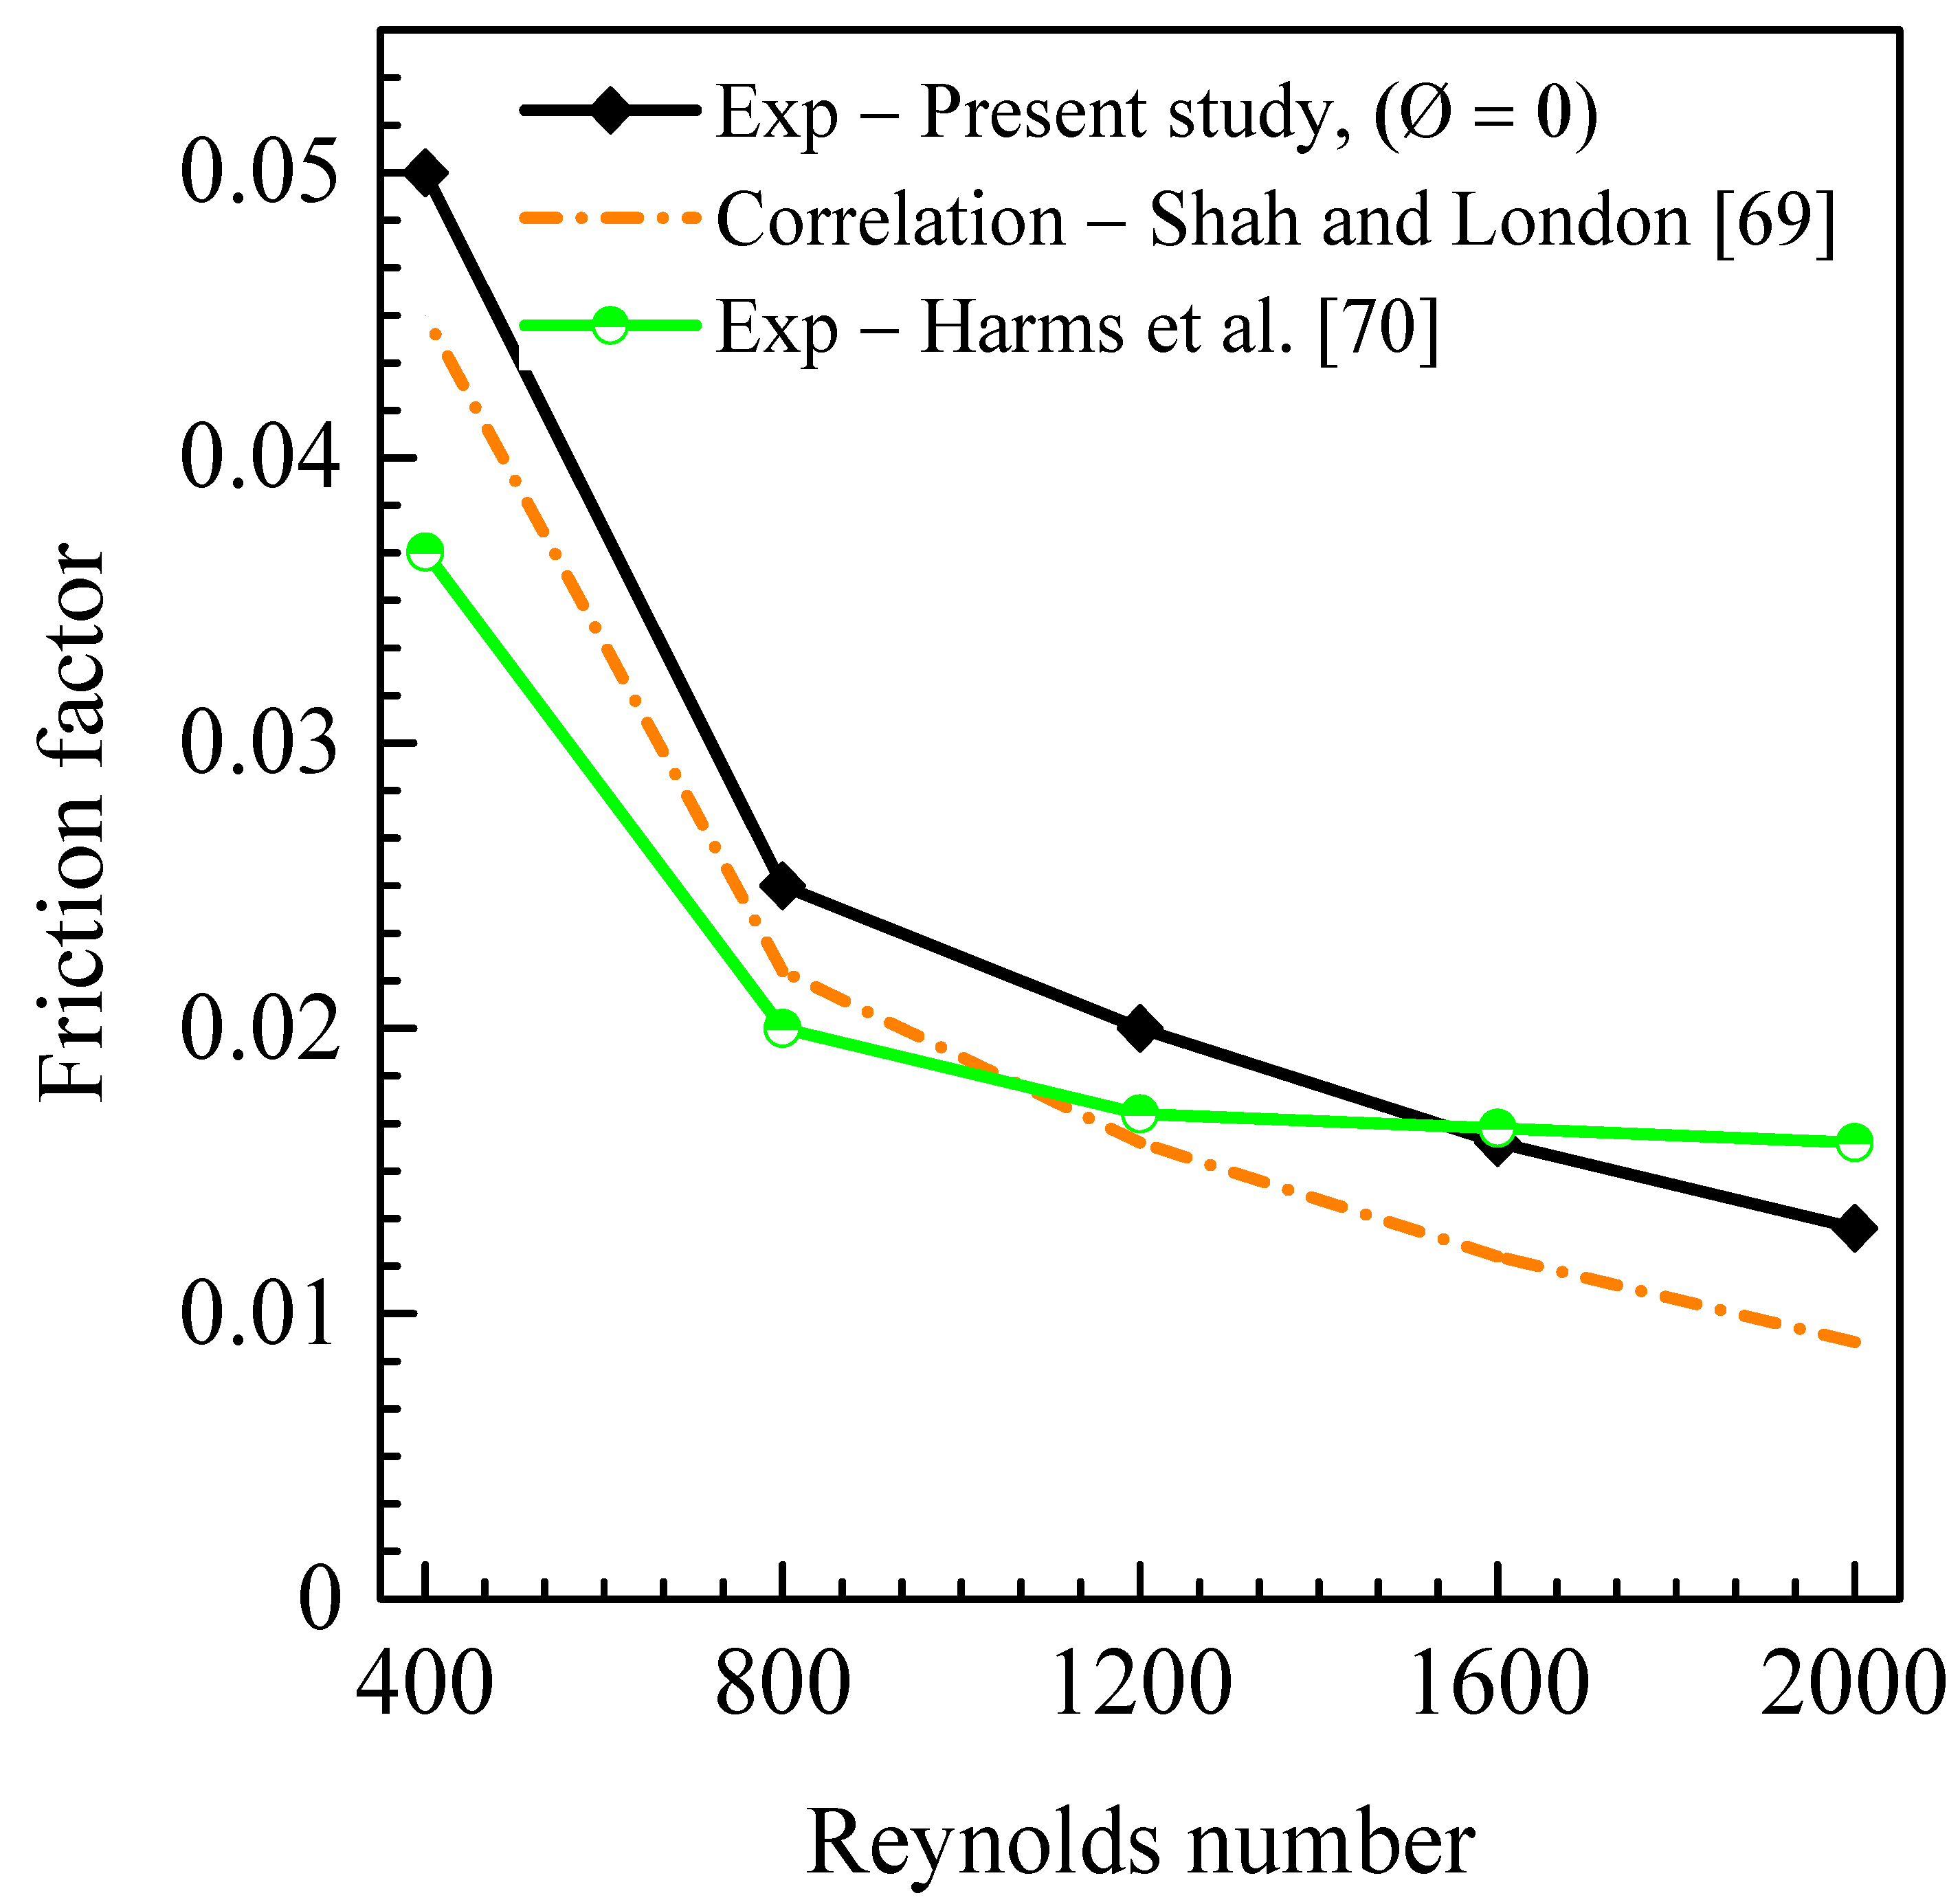
Figure 11.
Comparison of numerical results with data reported by Kawano et al. [71], Qu and Mudawar [72], and Al-Neama et al. [73].
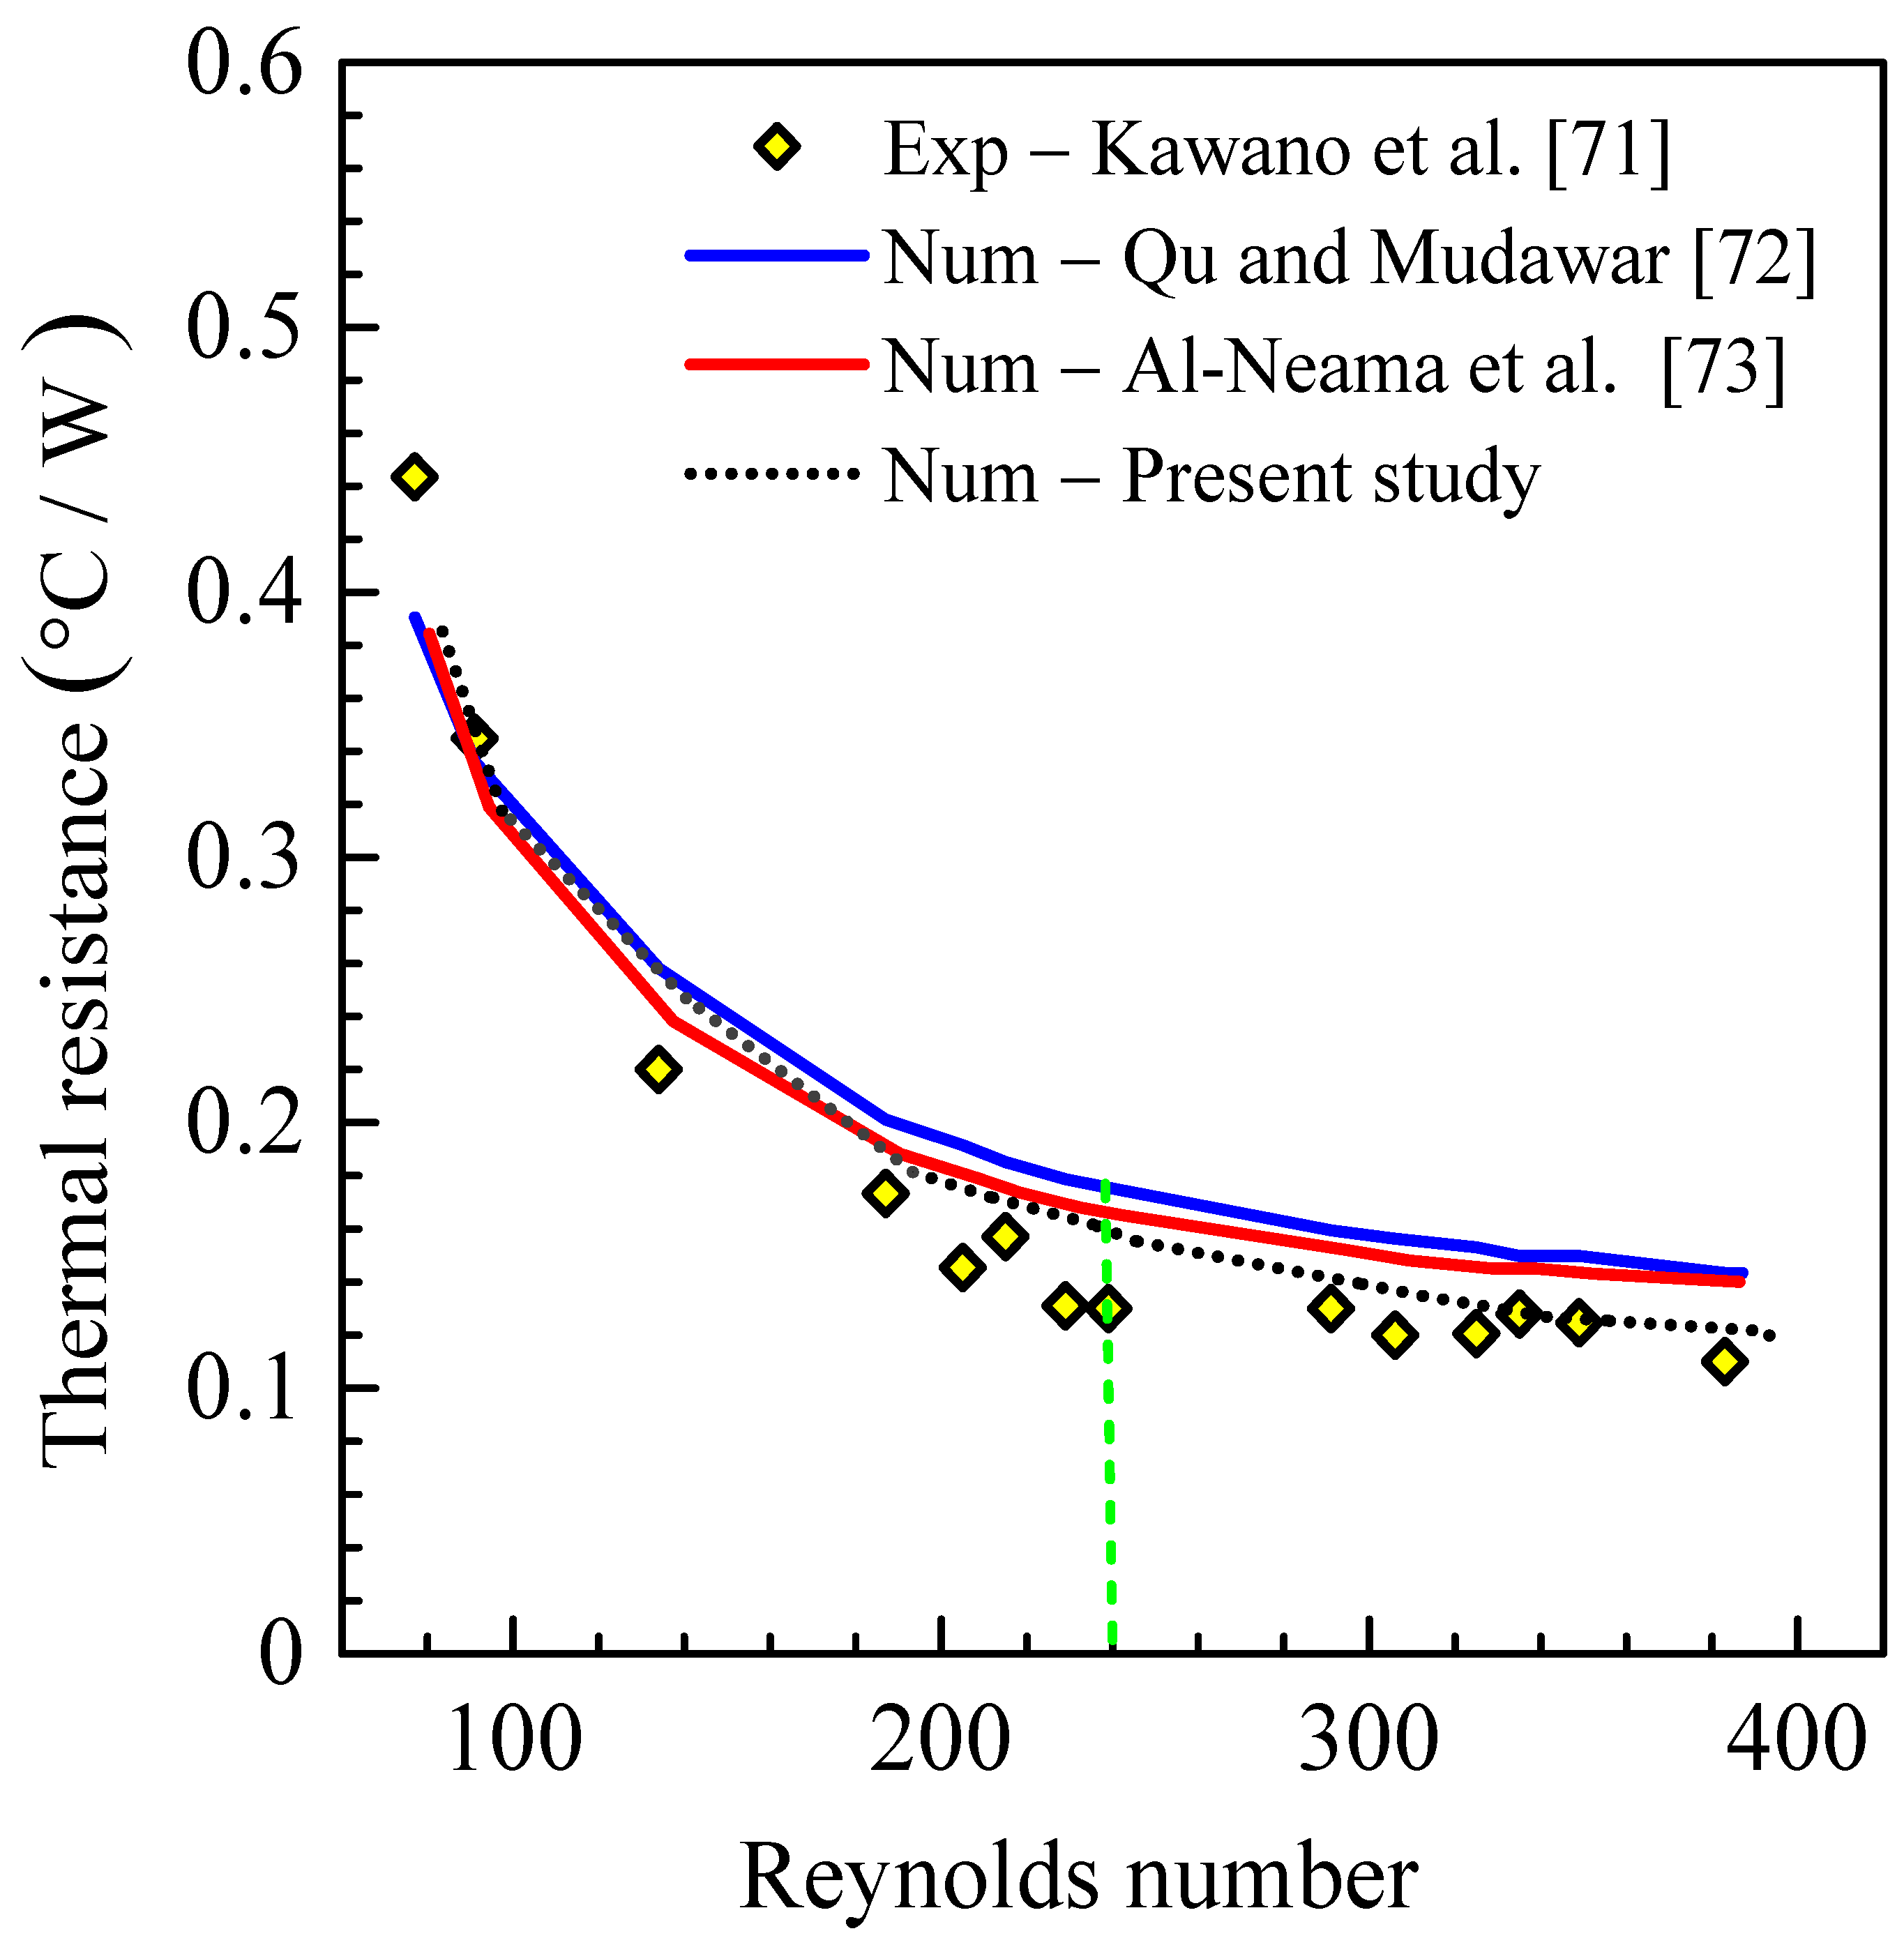
Figure 12.
Average Nusselt number versus nanofluid concentration and inlet temperature at Reynolds numbers: (a) Re=400, (b) Re=800, (c) Re=1200, (d) Re=1600.
Figure 12.
Average Nusselt number versus nanofluid concentration and inlet temperature at Reynolds numbers: (a) Re=400, (b) Re=800, (c) Re=1200, (d) Re=1600.
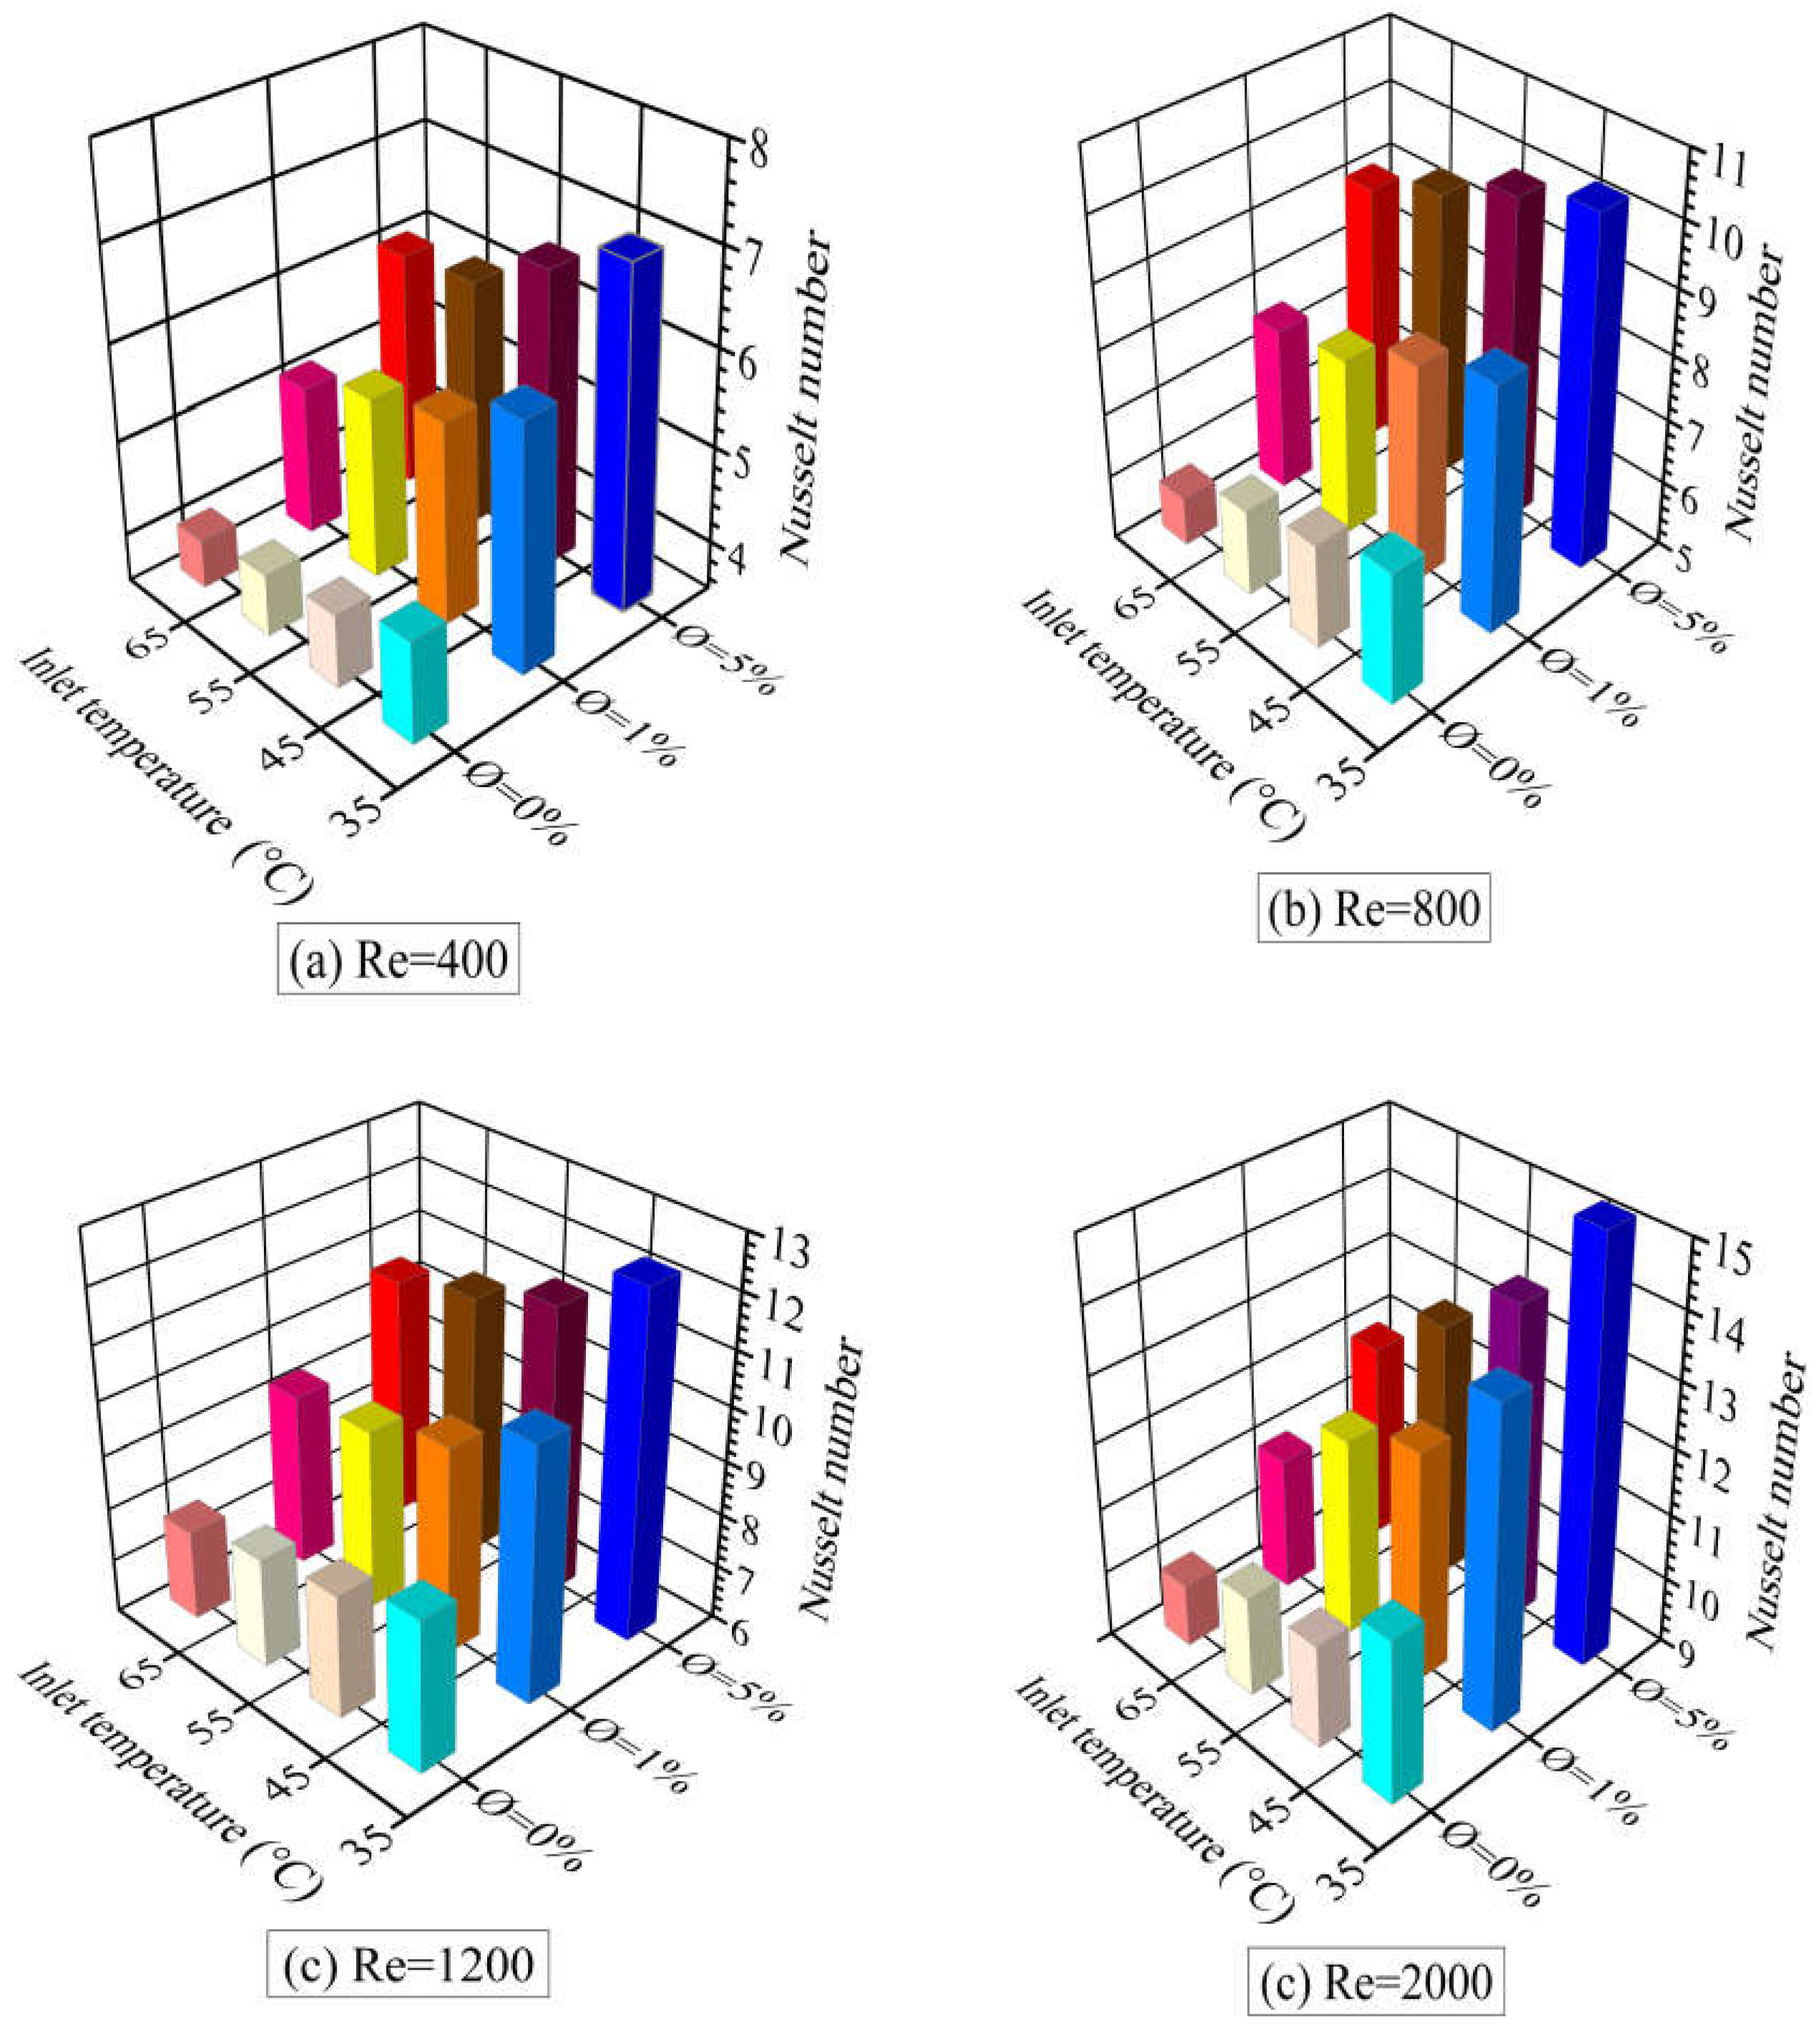
Figure 13.
Temperature profile of the heating component versus the Reynolds number and the nanoparticle concentration at nanofluid inlet temperatures: (a) Tin = 35°C, (b) Tin = 45°C, (c) Tin = 55°C, (d) Tin = 65°C.
Figure 13.
Temperature profile of the heating component versus the Reynolds number and the nanoparticle concentration at nanofluid inlet temperatures: (a) Tin = 35°C, (b) Tin = 45°C, (c) Tin = 55°C, (d) Tin = 65°C.
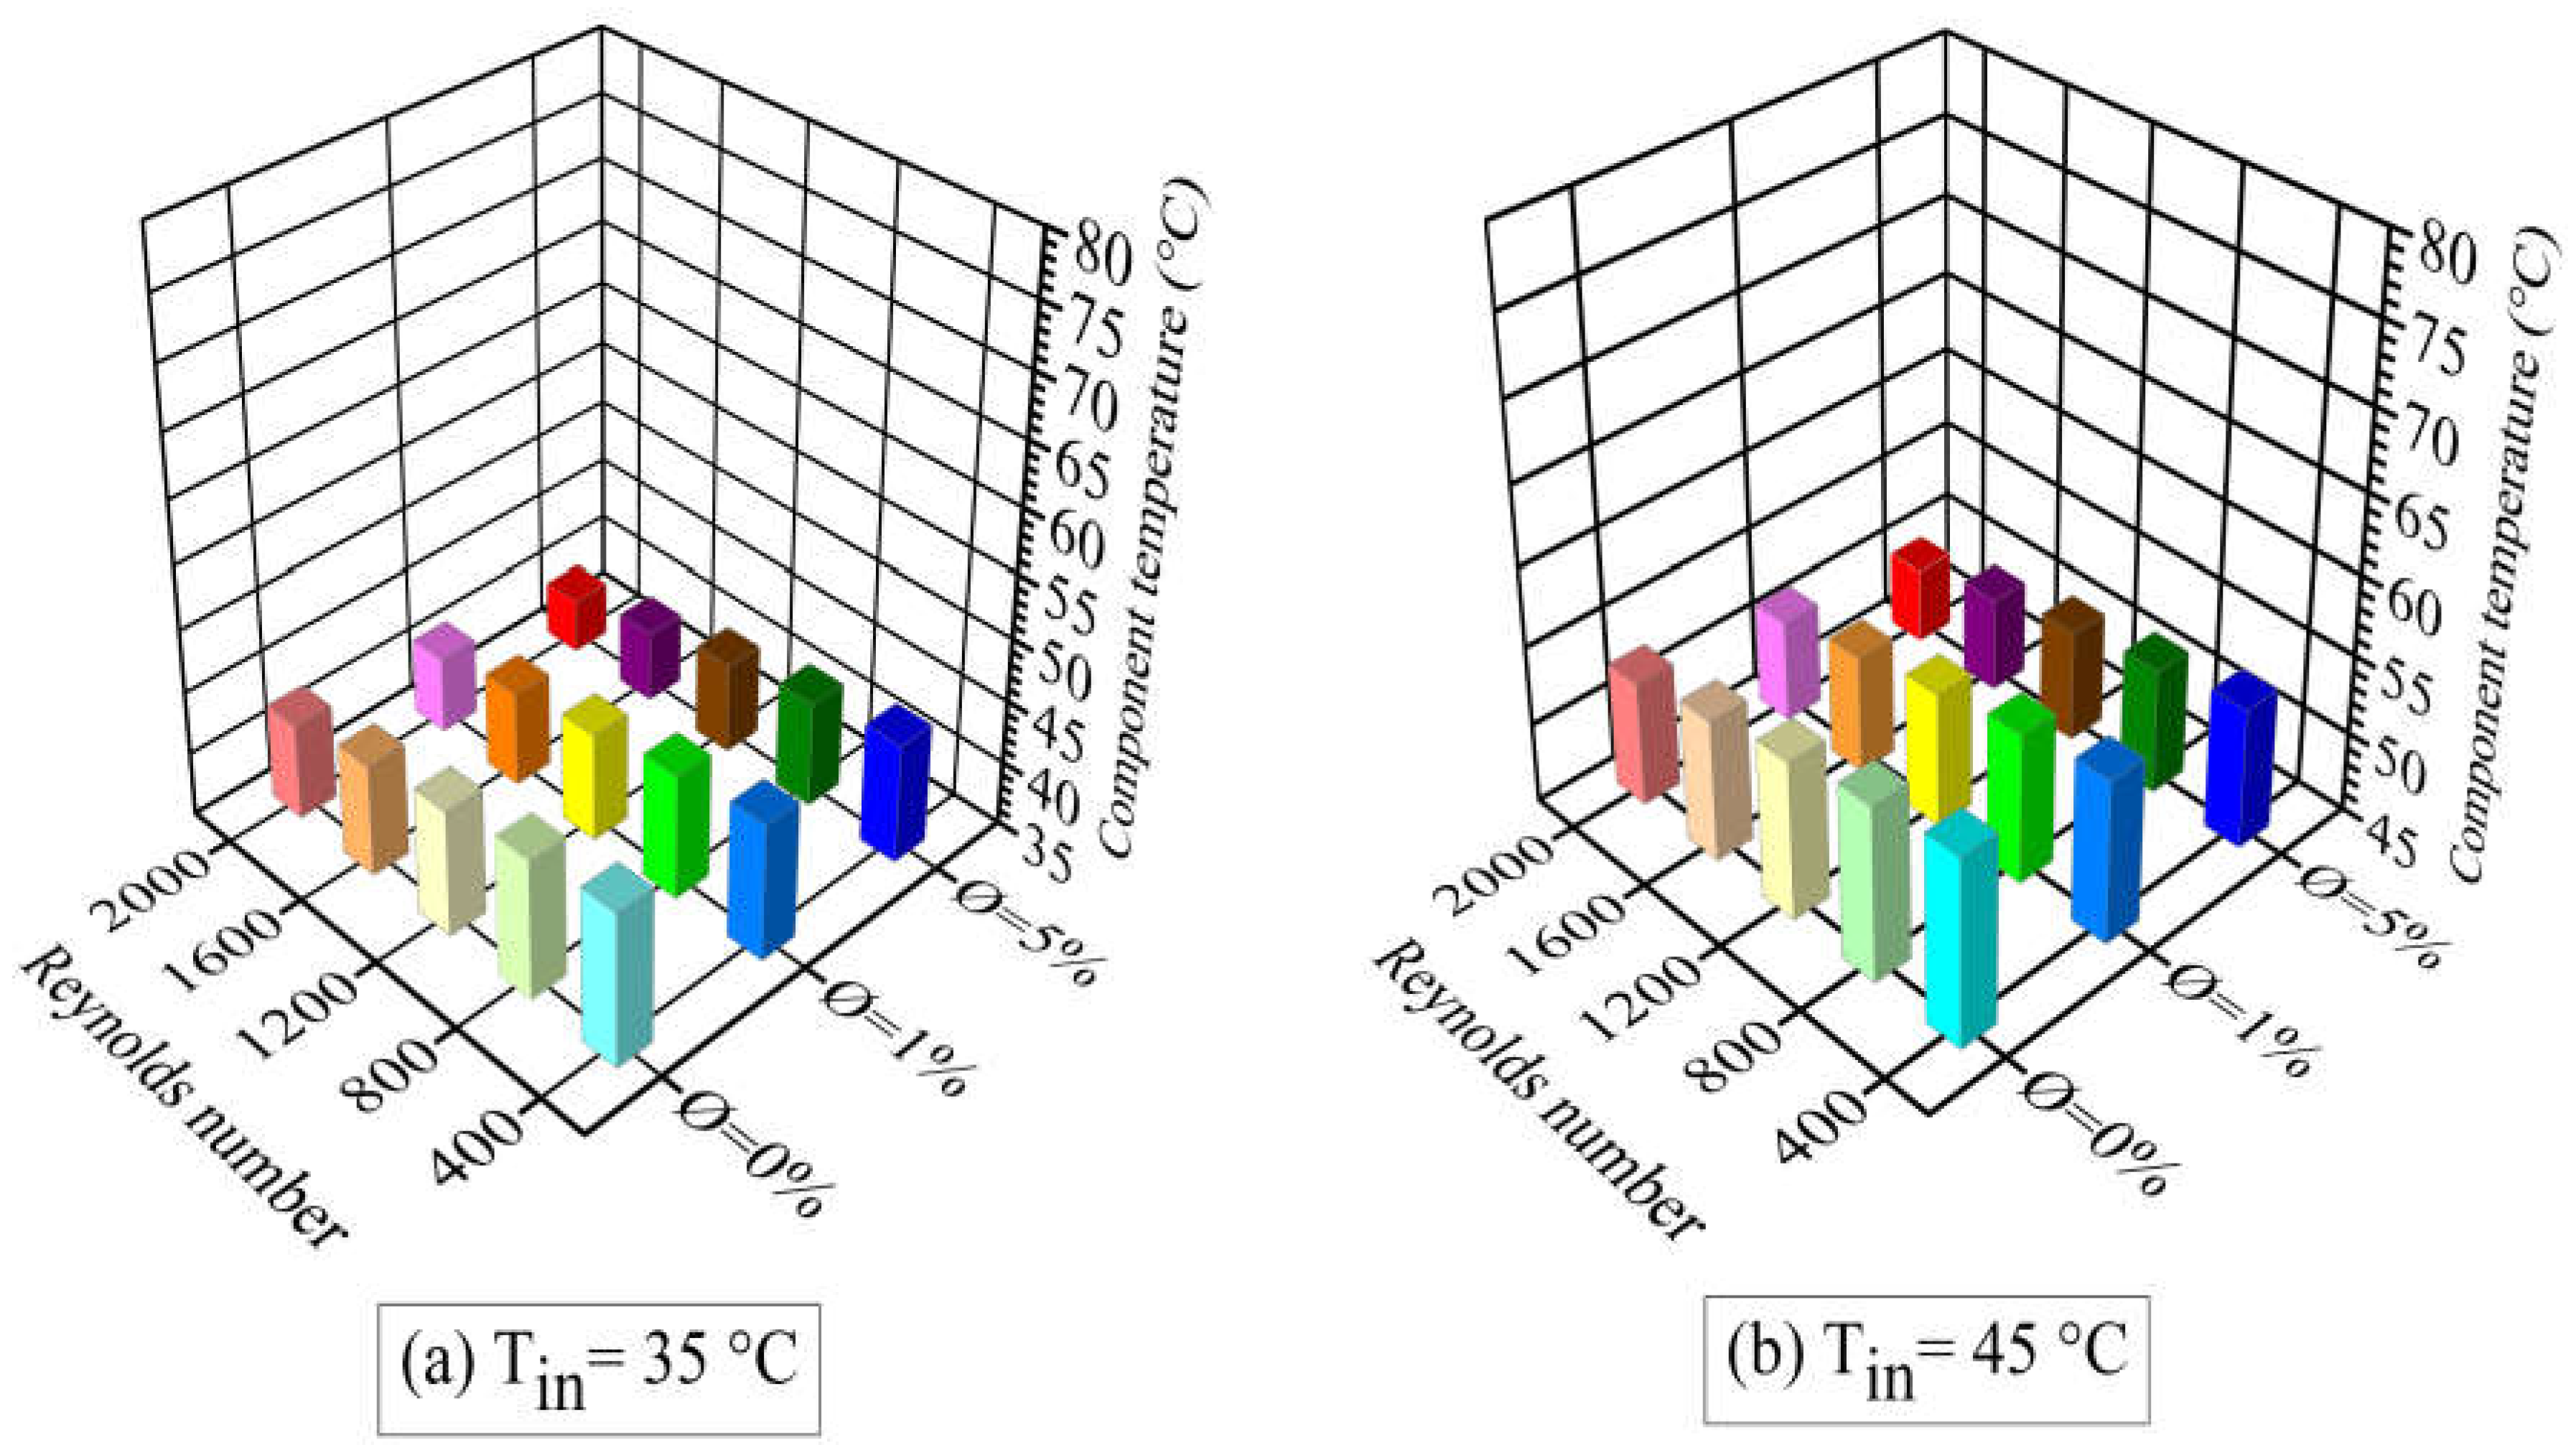
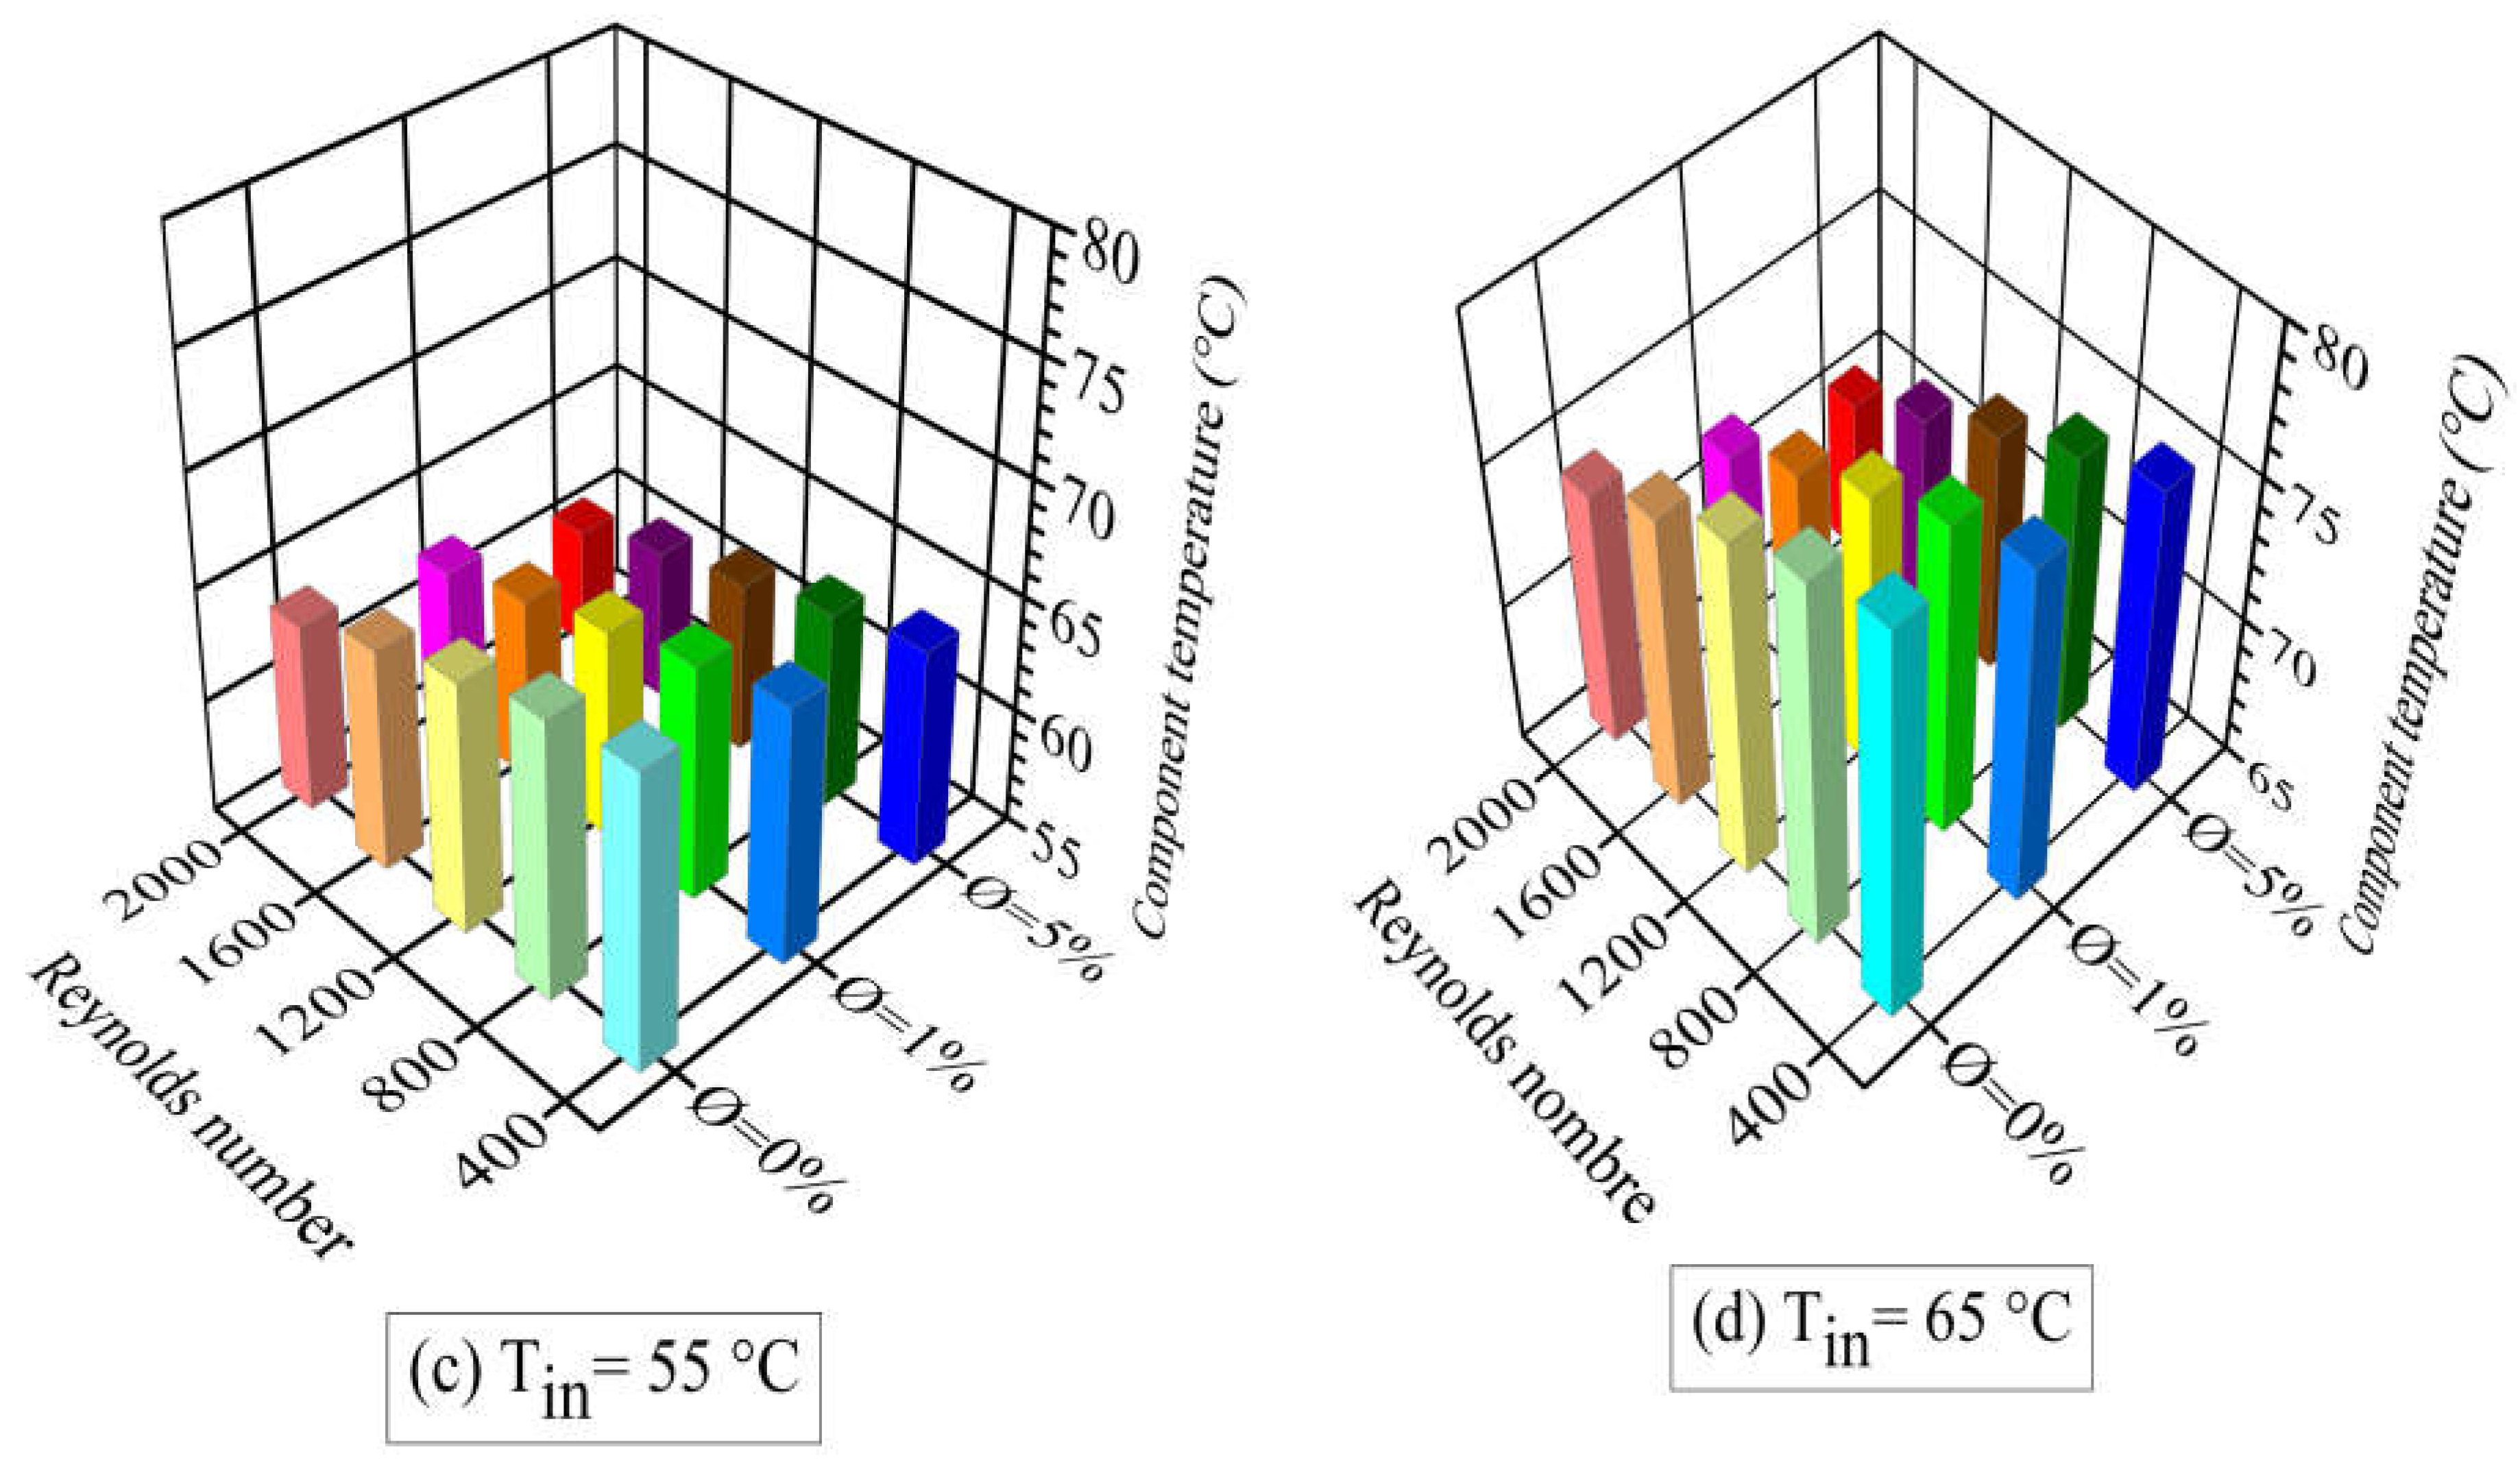
Figure 14.
Temperature contours (°C) at Re=1200, inlet temperature of 45ºC, and nanoparticle concentration: (a) pure water, (b) Ø=1%, and (c) Ø=5%.
Figure 14.
Temperature contours (°C) at Re=1200, inlet temperature of 45ºC, and nanoparticle concentration: (a) pure water, (b) Ø=1%, and (c) Ø=5%.
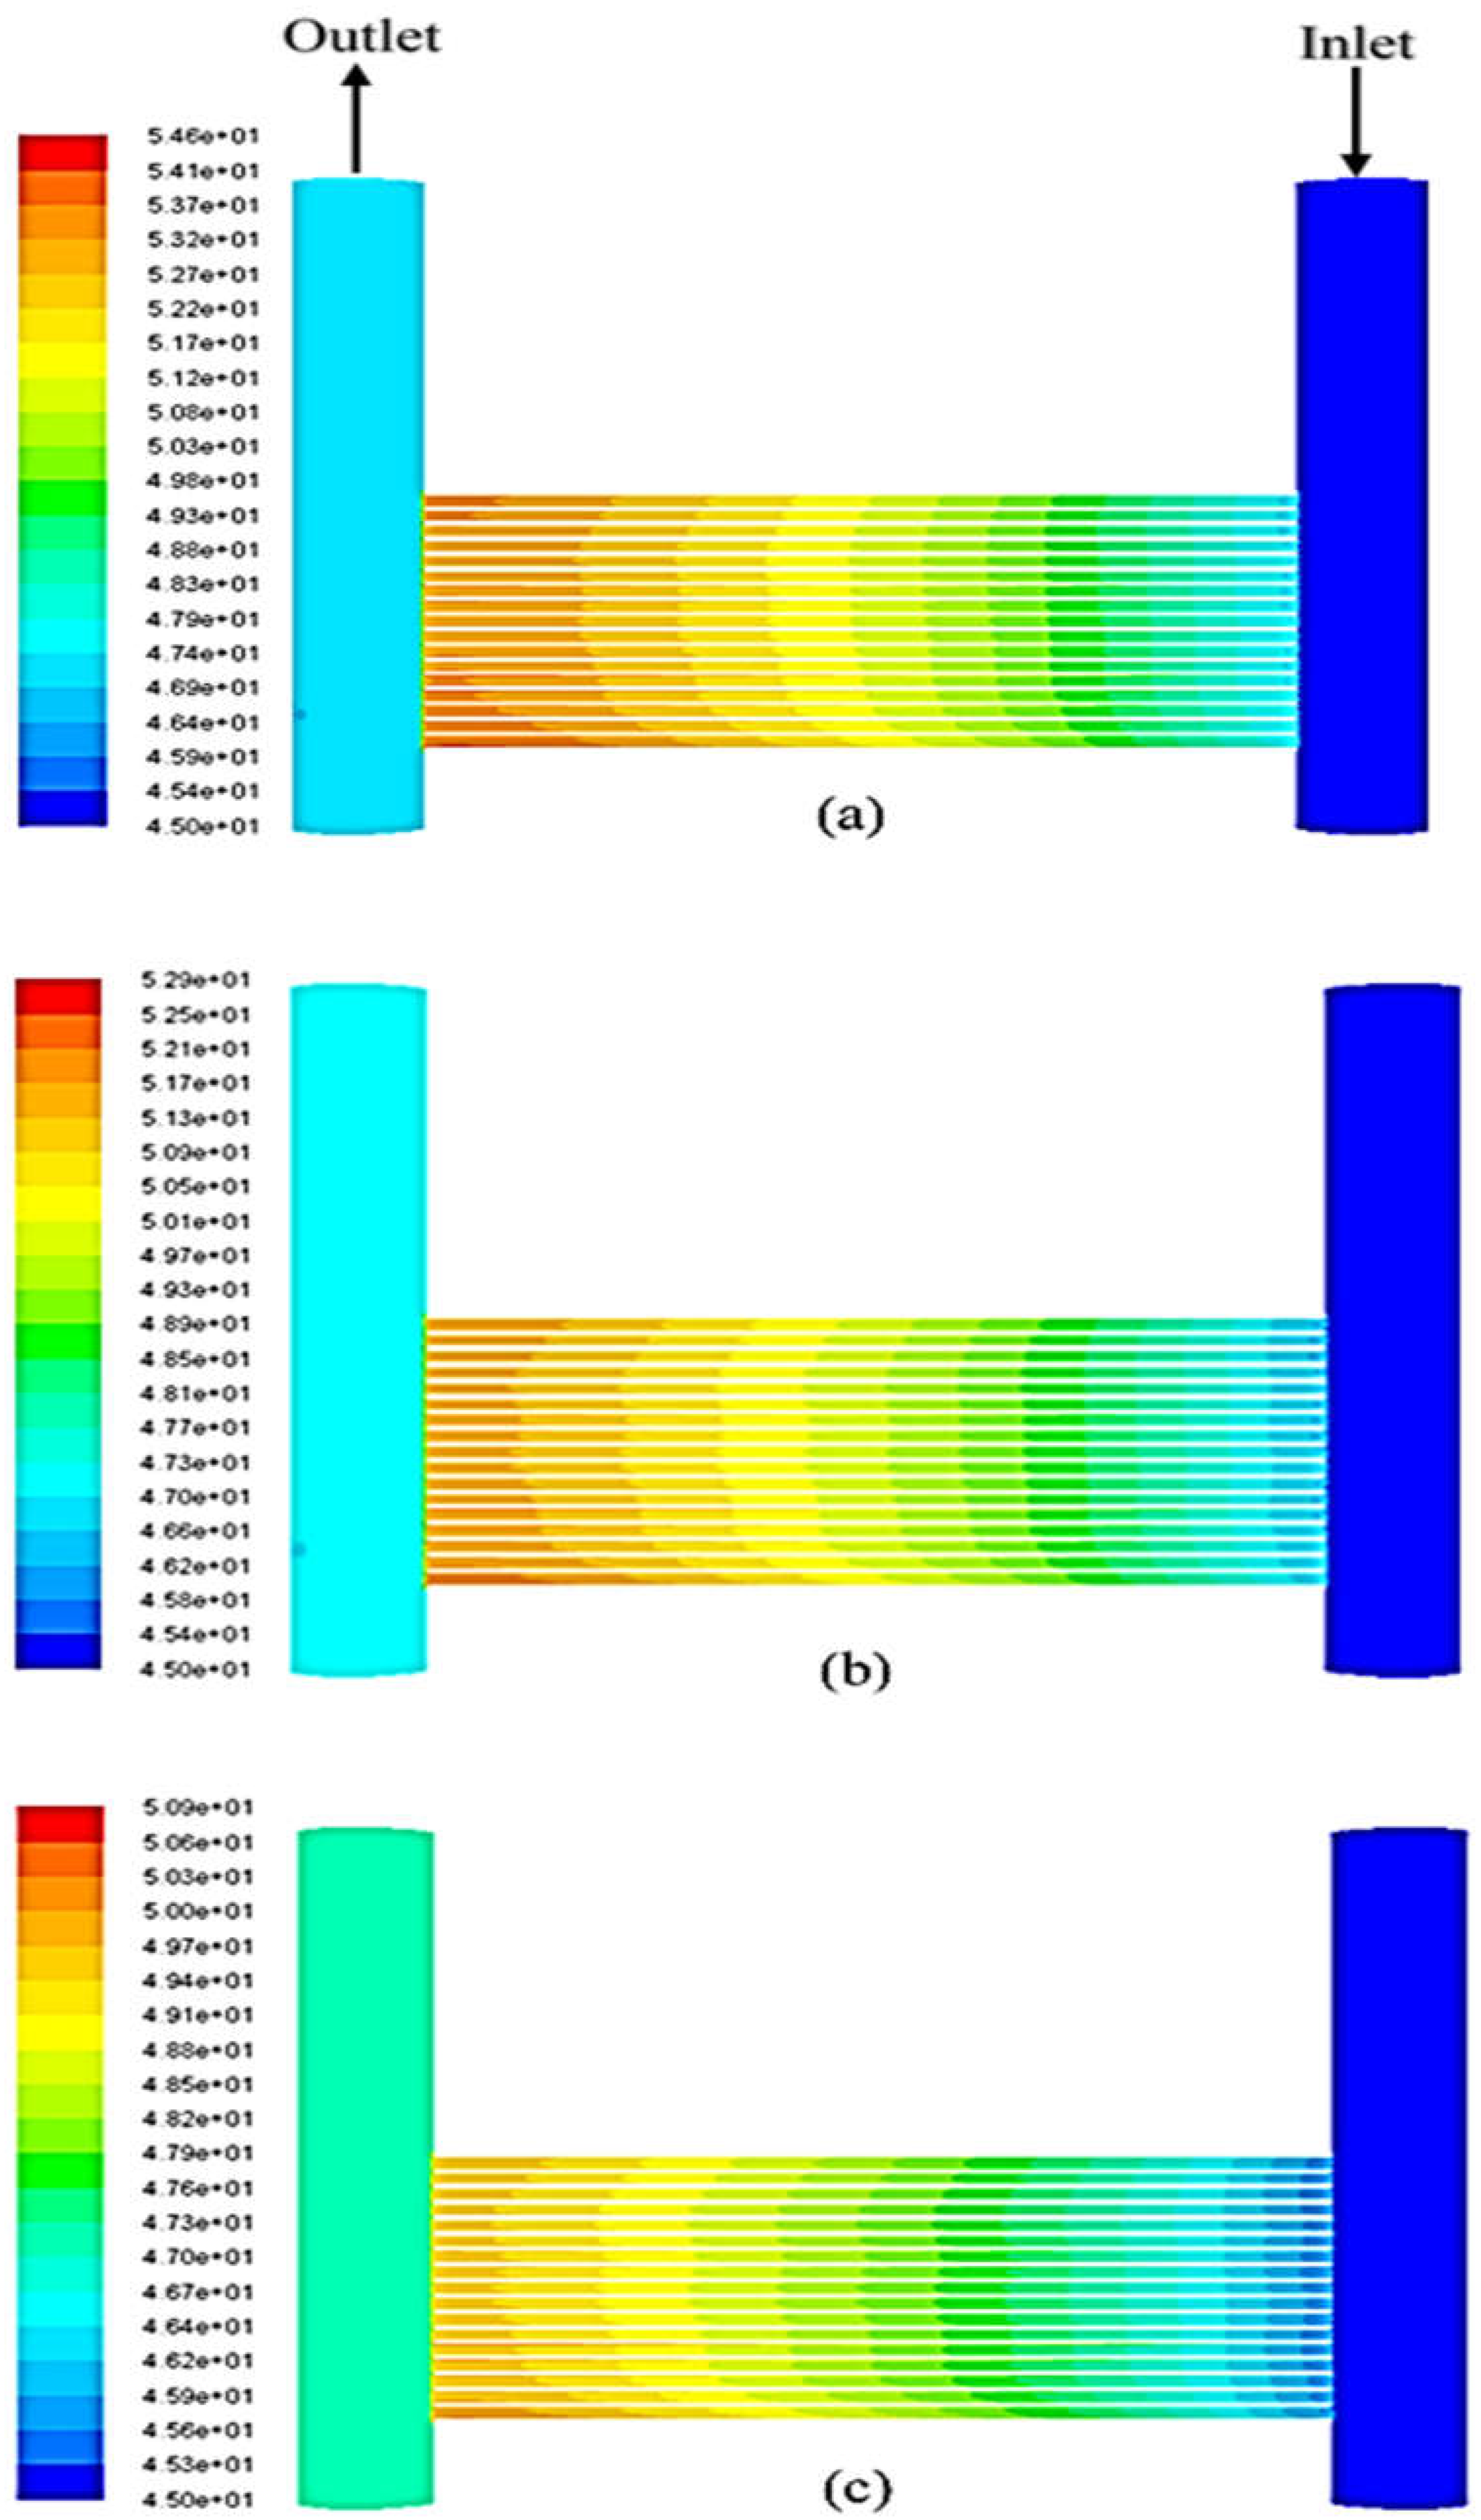
Figure 15.
Pressure drop versus the Reynolds number for both TiO2 nanofluids and pure water.
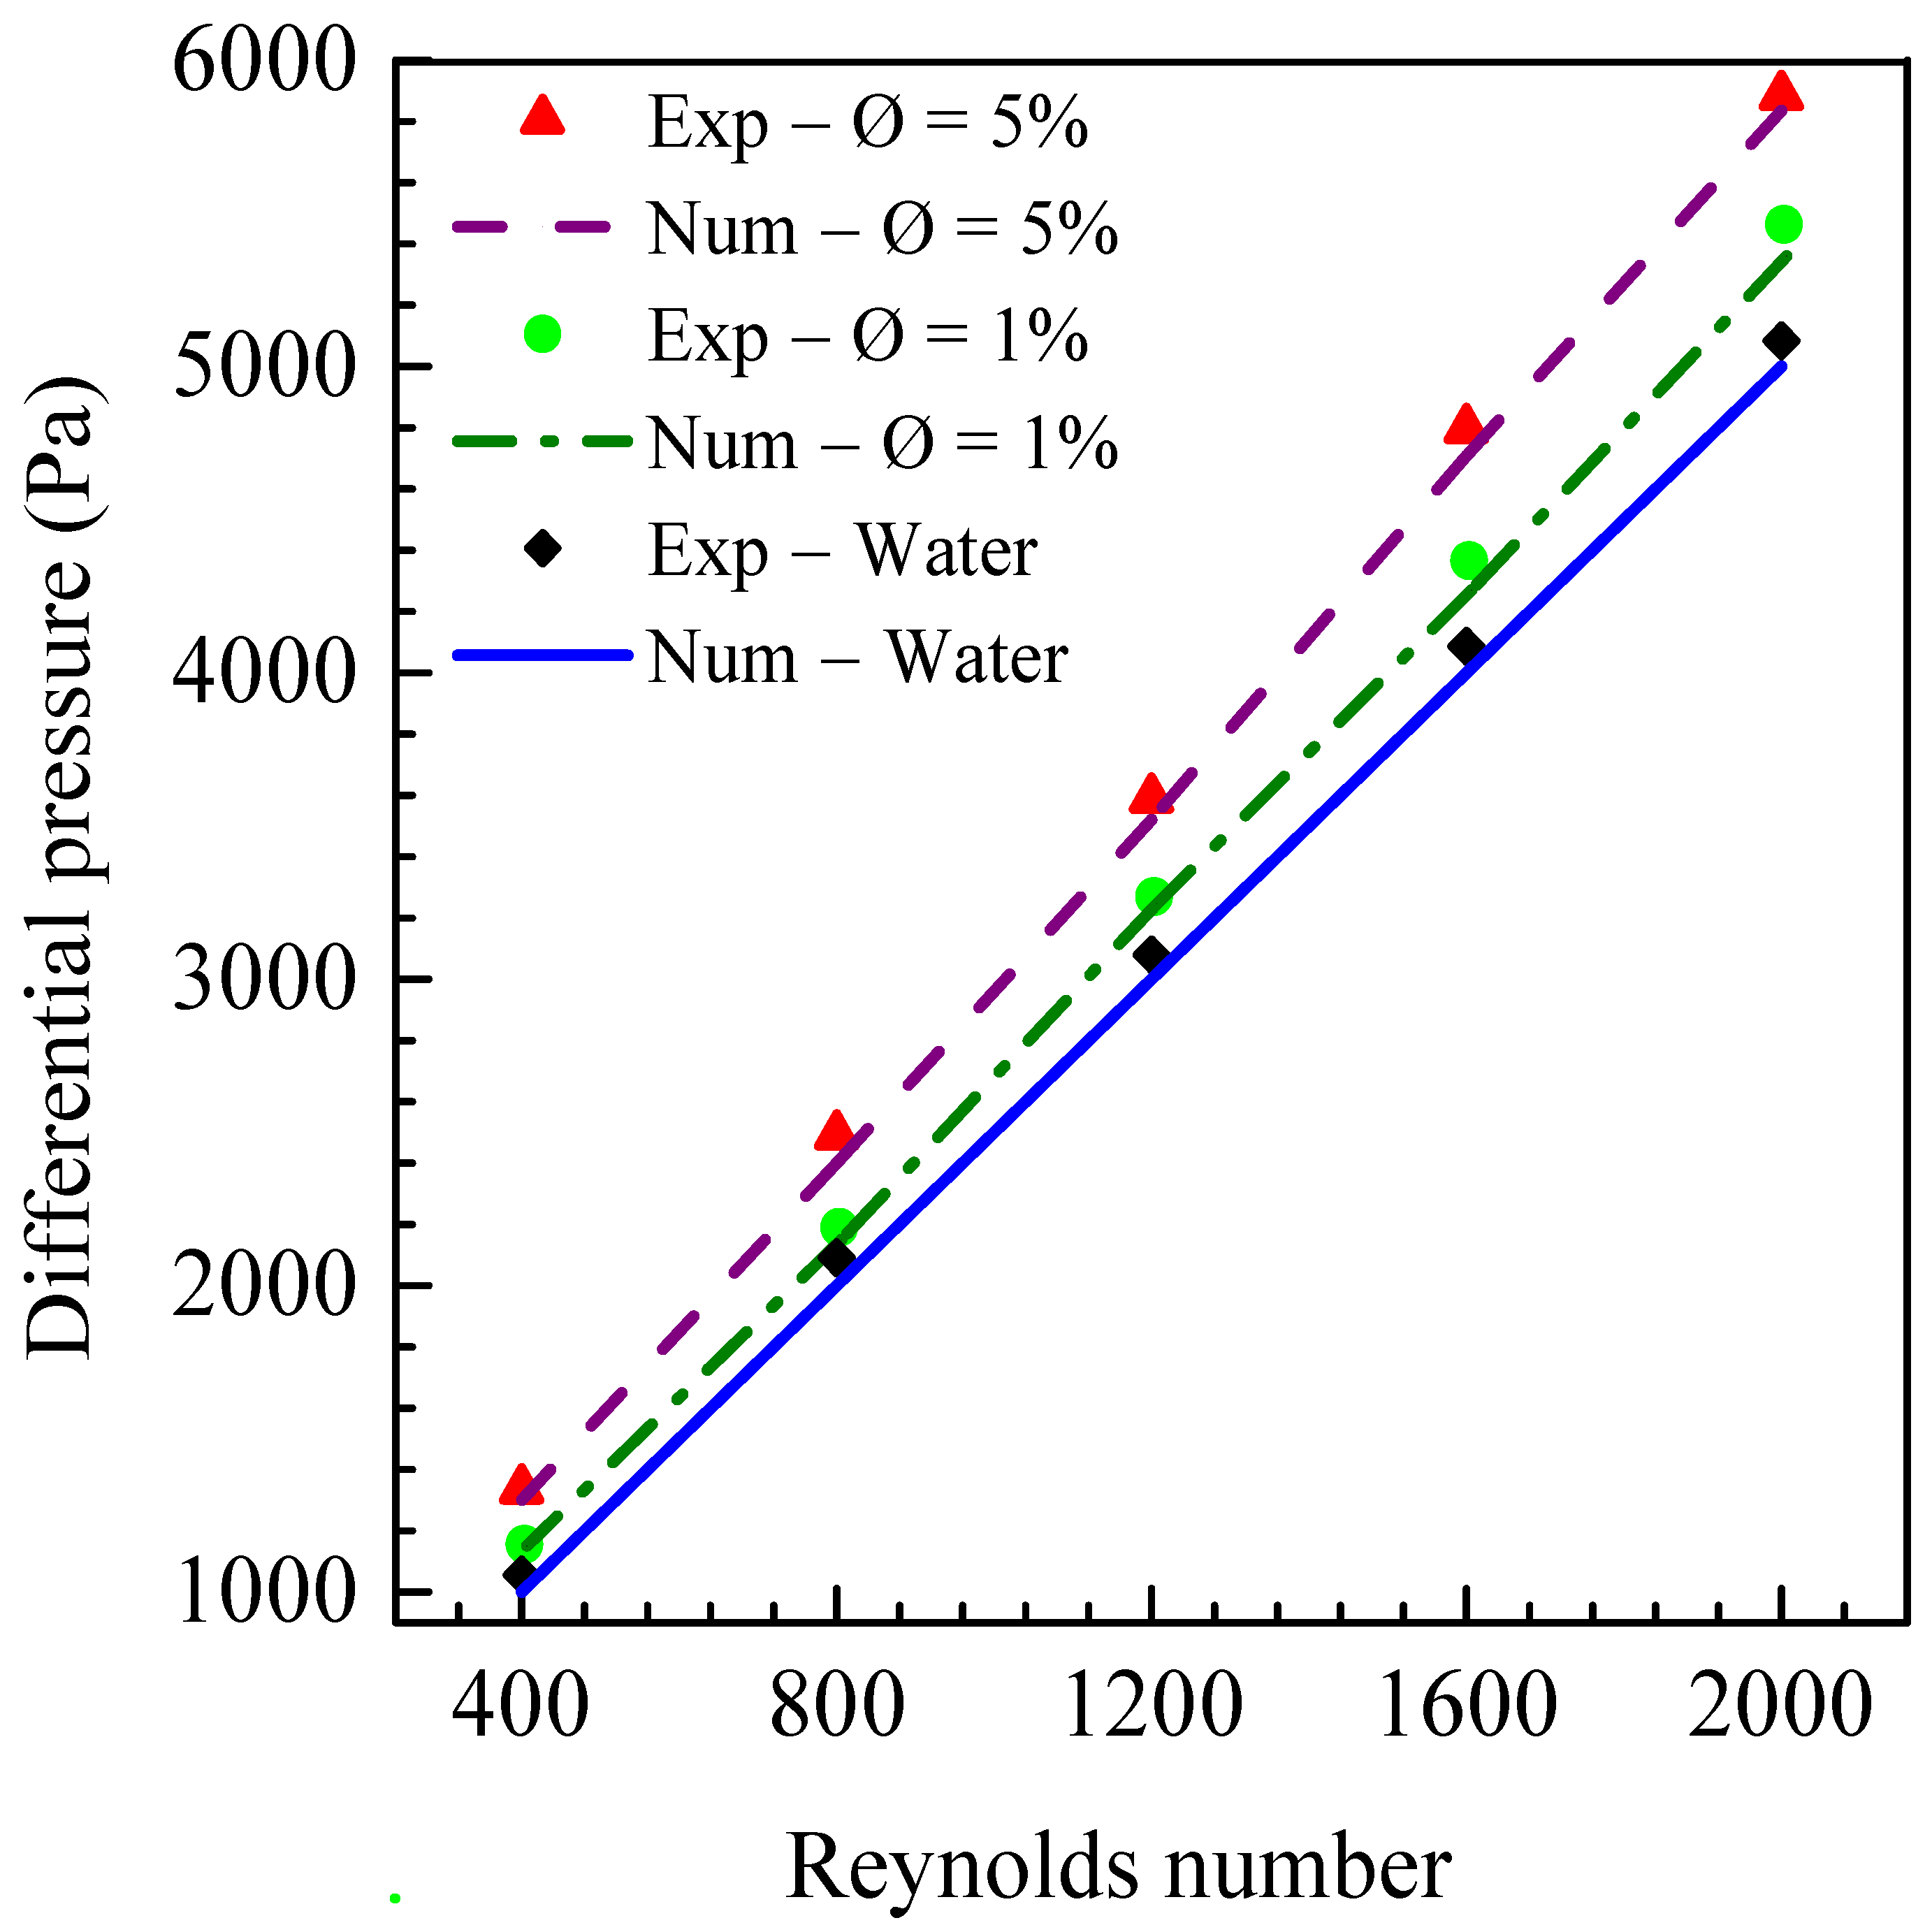
Figure 16.
Pumping power versus the Reynolds number for both TiO2 nanofluids and pure water.
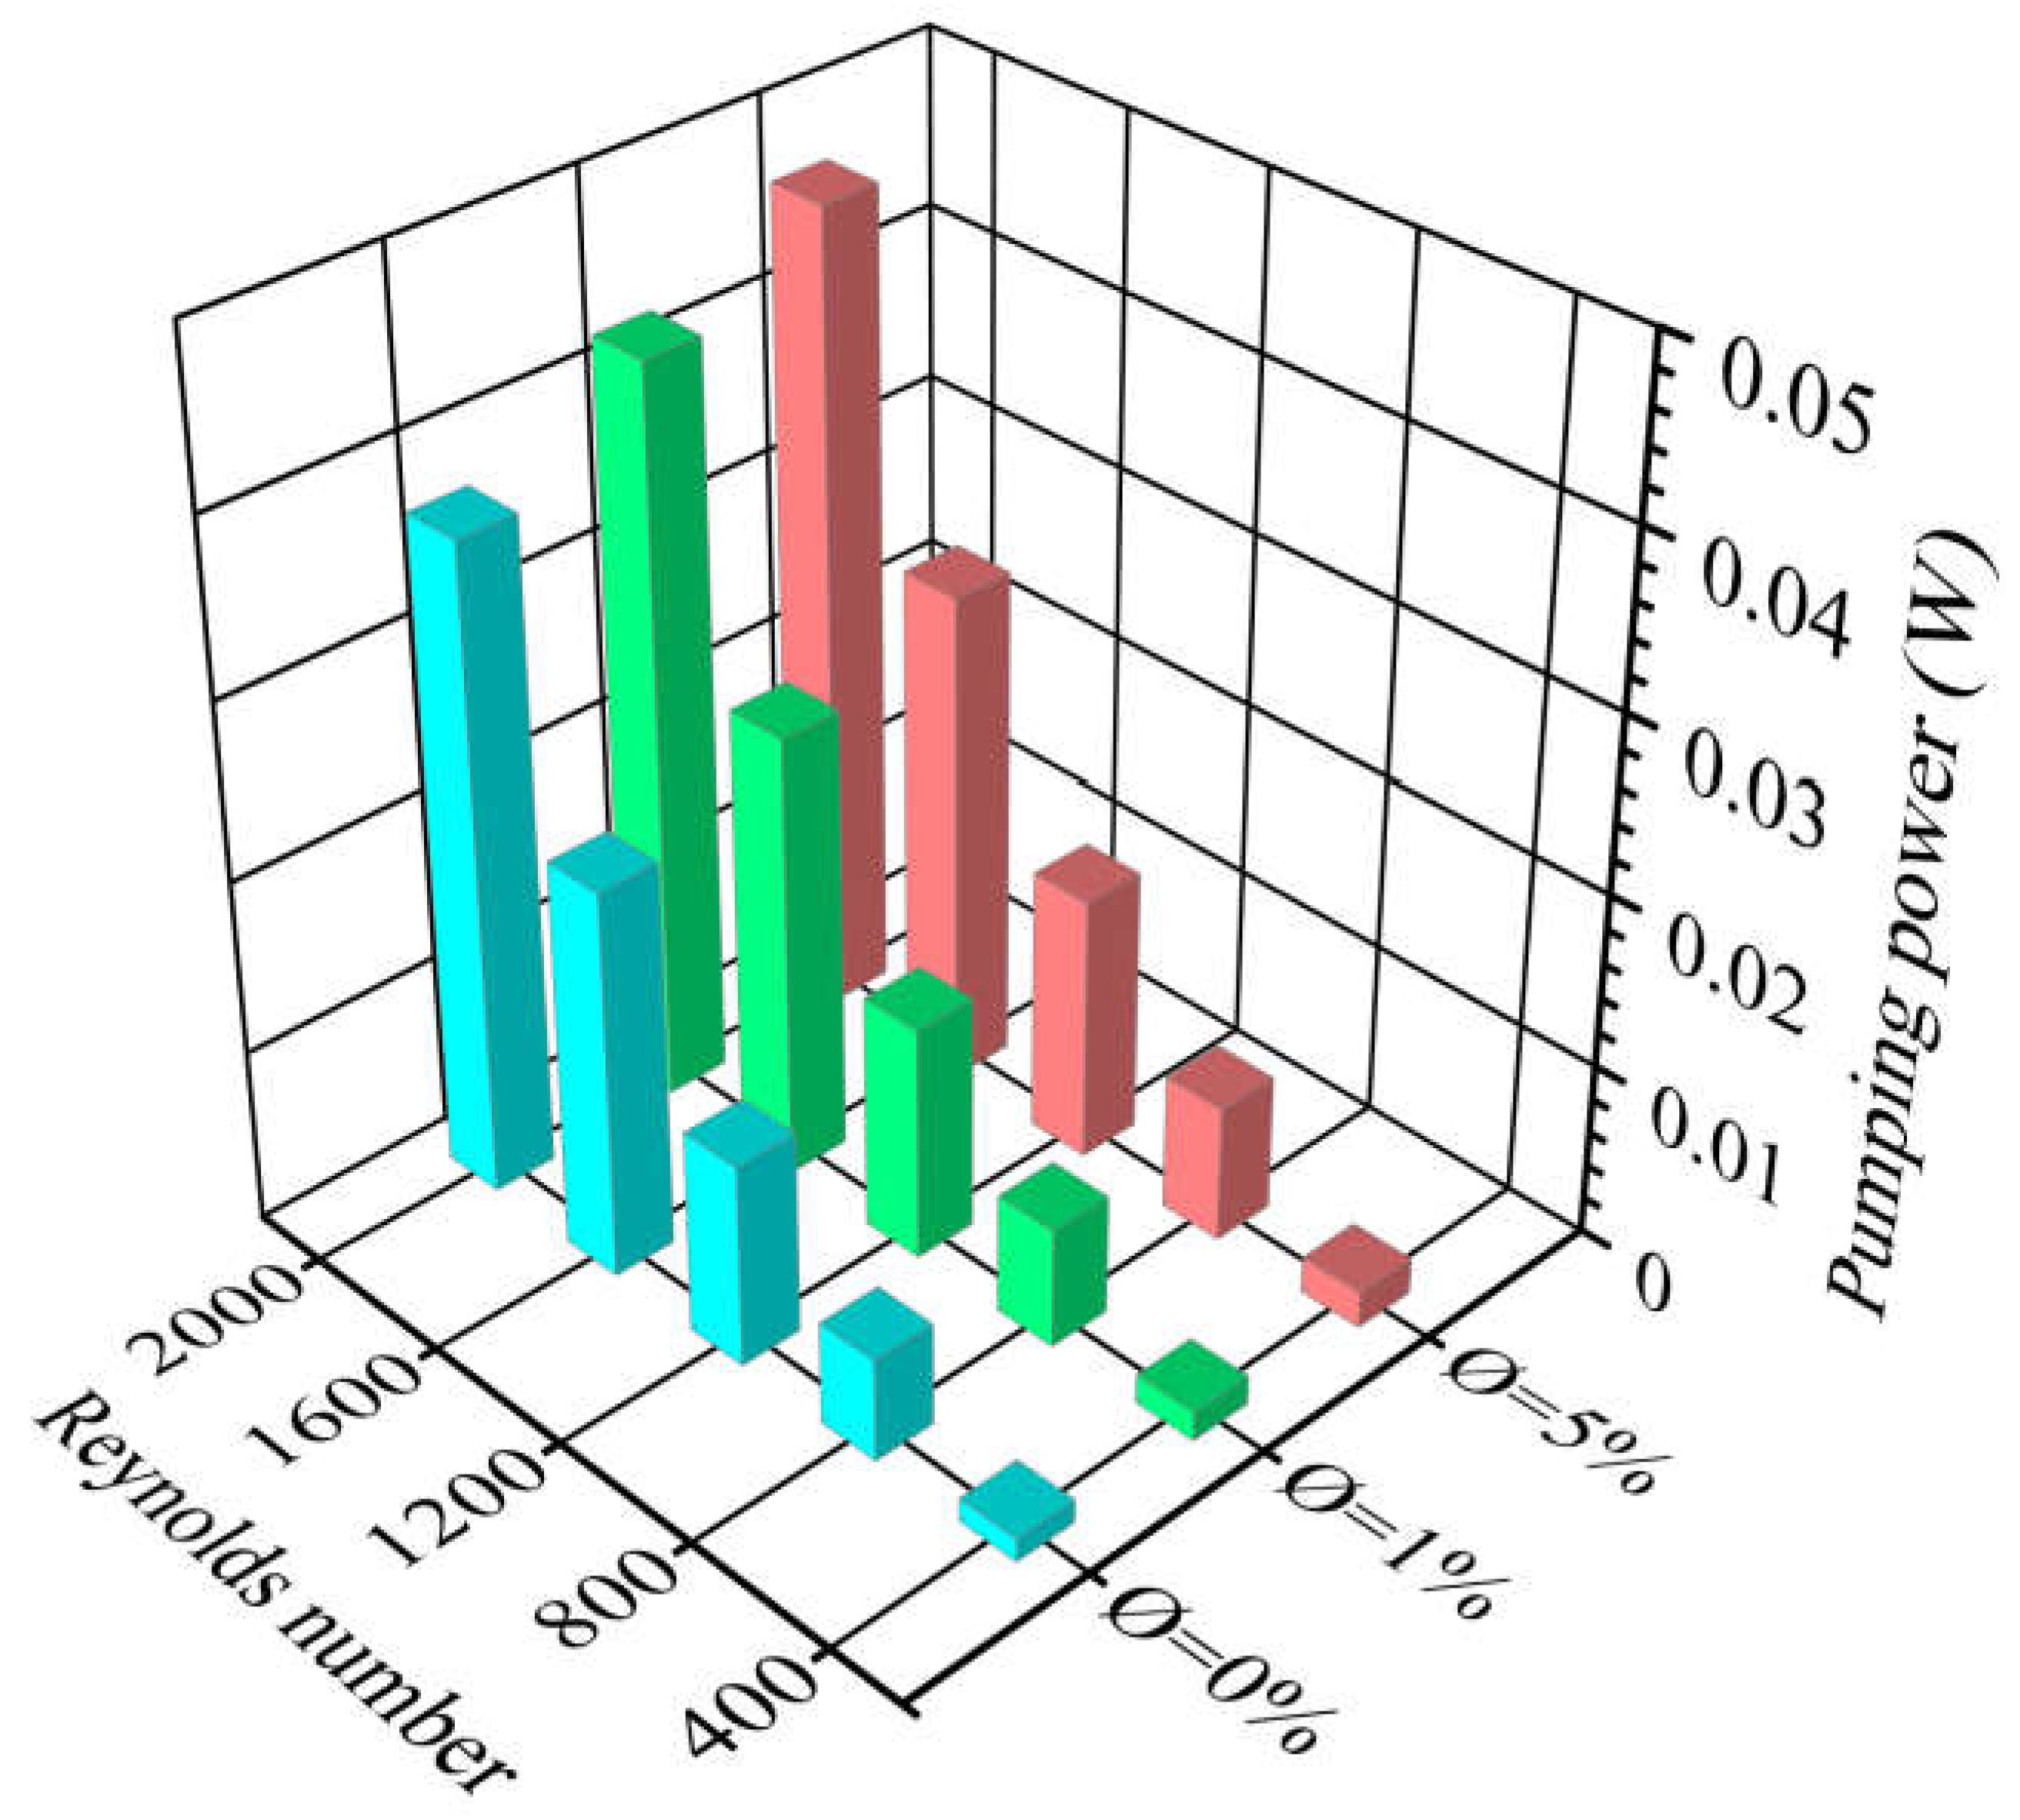
Figure 17.
Performance evaluation criterion (PEC) versus the Reynolds number and nanofluid inlet temperature at two TiO2 concentrations: (a) Ø= 1%, (b) Ø= 5%.
Figure 17.
Performance evaluation criterion (PEC) versus the Reynolds number and nanofluid inlet temperature at two TiO2 concentrations: (a) Ø= 1%, (b) Ø= 5%.
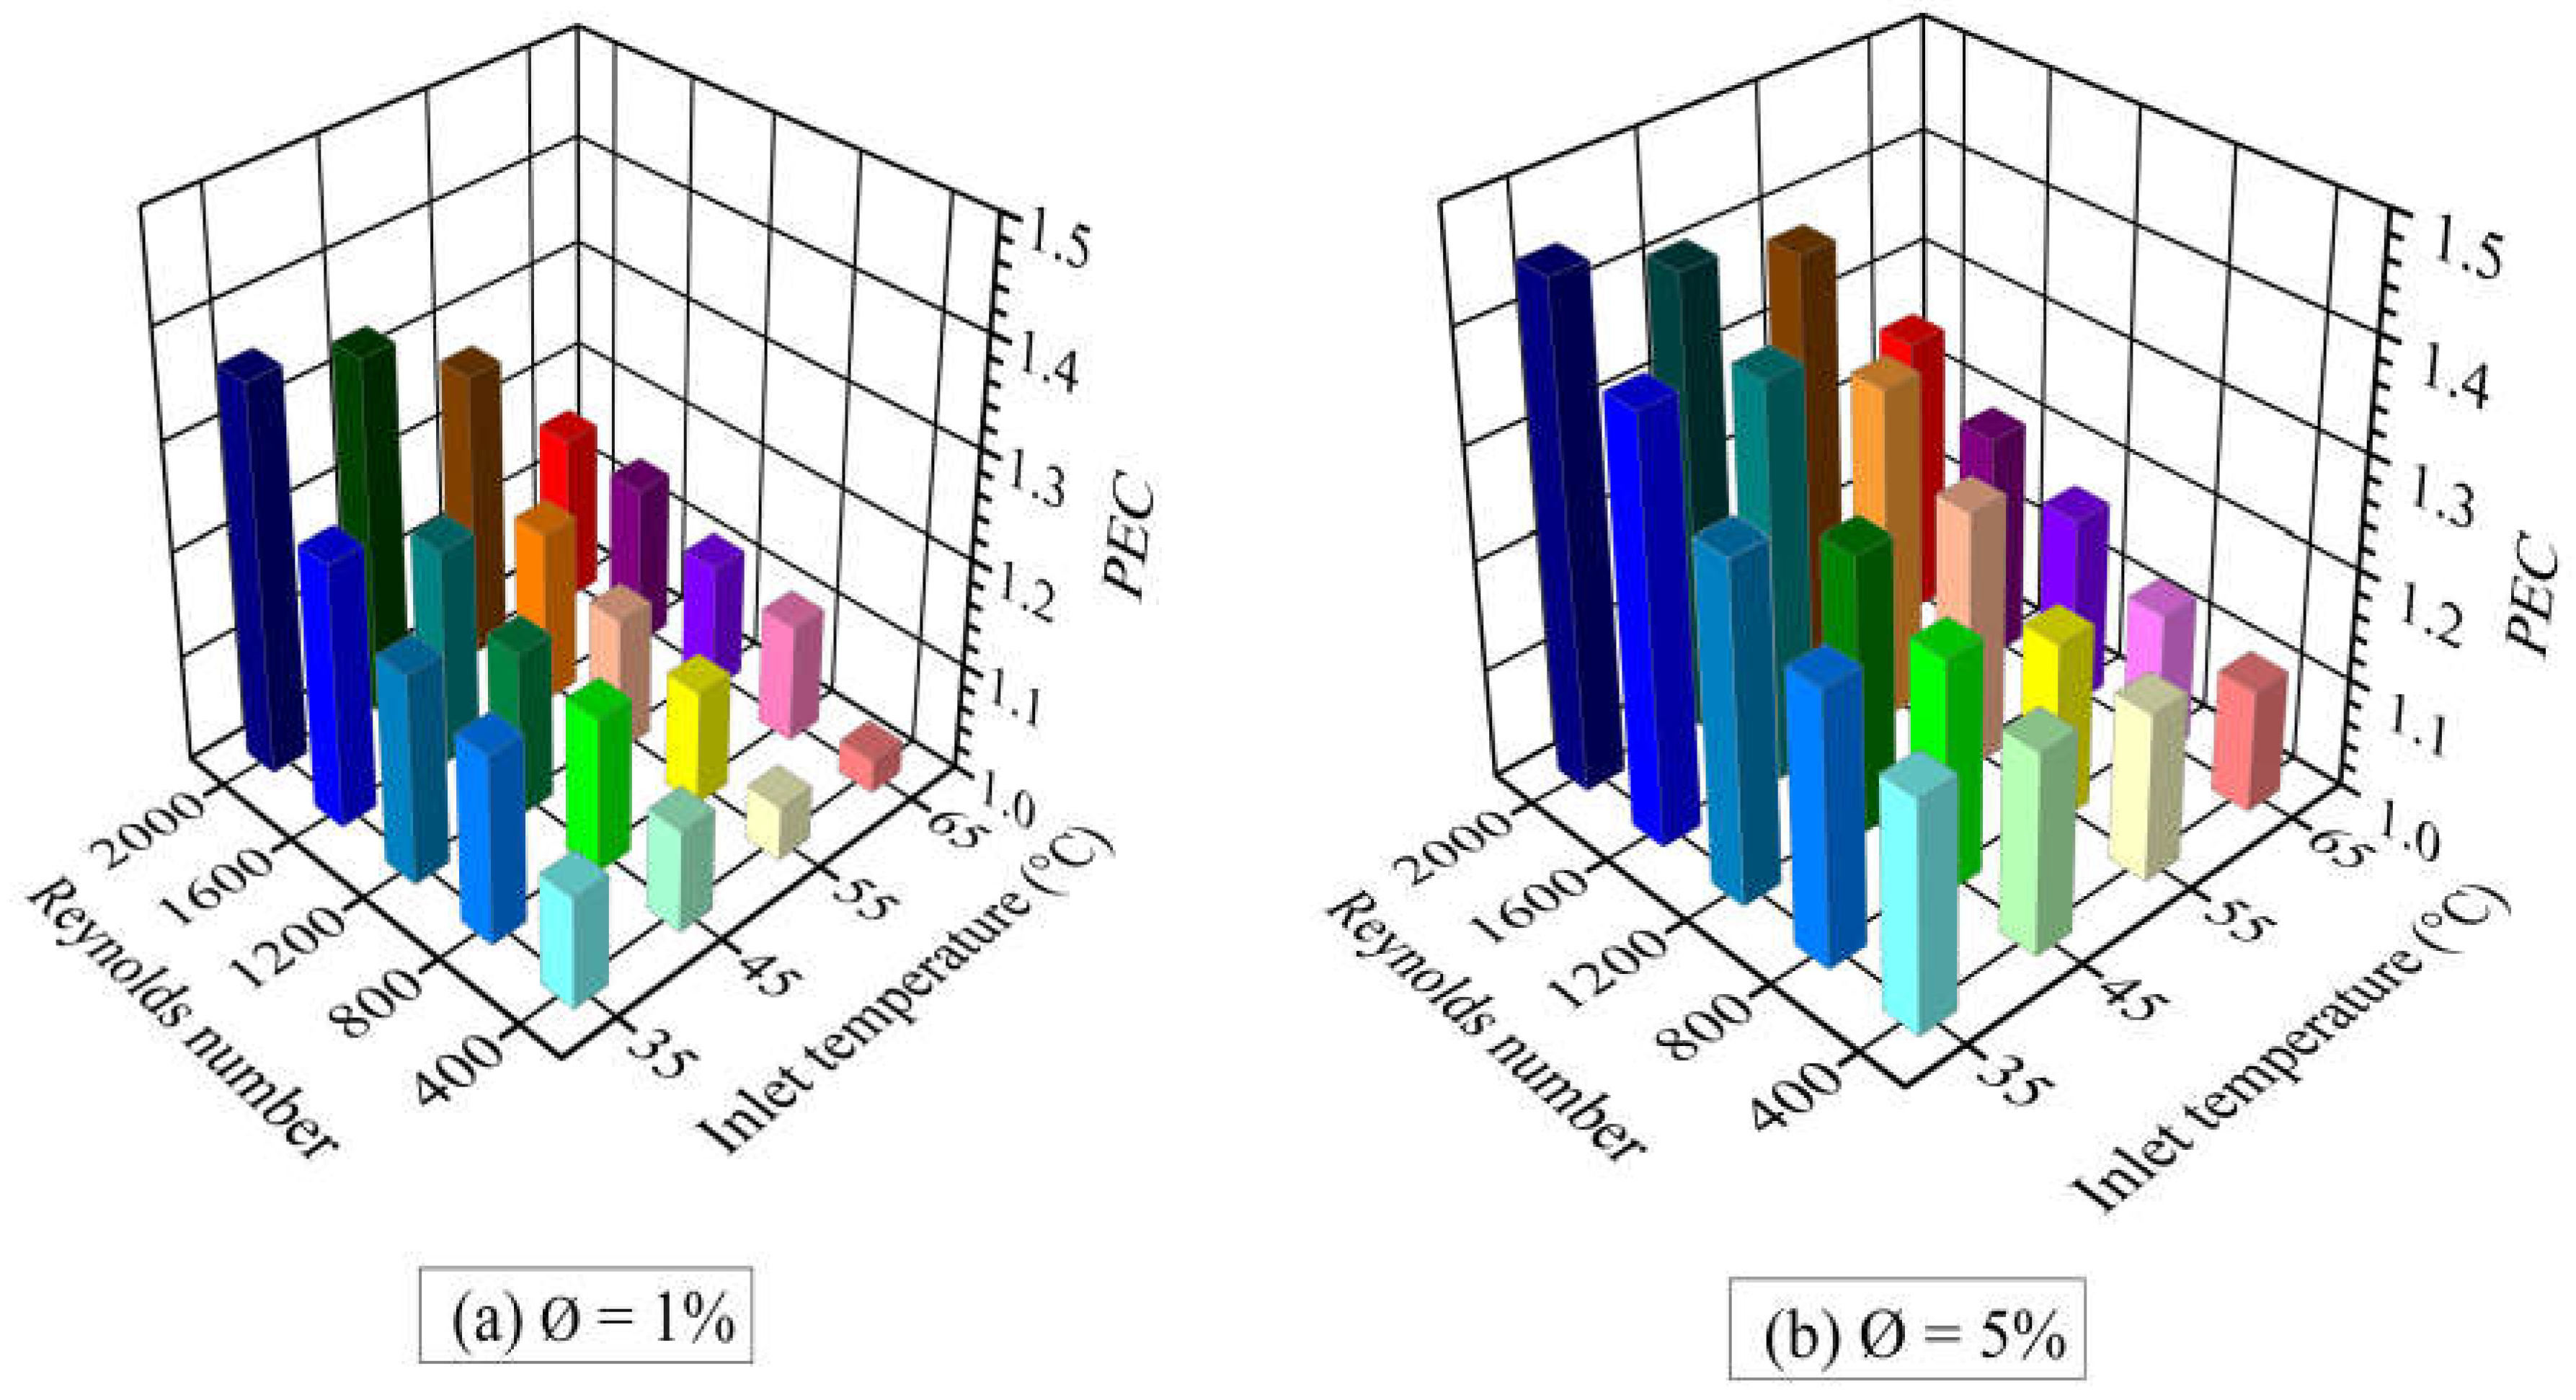

Table 1.
Geometric parameters of the micro heat exchanger shown in Figure 2.
Table 1.
Geometric parameters of the micro heat exchanger shown in Figure 2.
| Geometric parameter | Dimension (mm) / Number (-) |
|---|---|
| Heat sink width (W) | 16 |
| Heat sink height (H) | 1.63 |
| Heat sink length (Lmc) | 40 |
| Microchannel width (Wmc) | 0.7 |
| Microchannel height (Hmc) | 1 |
| Half thickness of the solid (es) | 0.35 |
| Thickness of fins (e) | 0.25 |
| Collector tube length (Lc) | 40 |
| Hydraulic diameter (Dh) | 0.8 |
| Collector tube diameter (Dc) | 5 |
| Number of channels (N) | 17 |
| Properties | TiO2 nanoparticles |
|---|---|
| Mean diameter, dp | 20 nm |
| Thermal conductivity, k | 8.4 W/m.K |
| Specific heat, Cp | 710 J/kg.K |
| Density, | 4157 kg/m3 |
Table 3.
Uncertainties of the various sensors used in the experiments, as well as the parameters calculated.
Table 3.
Uncertainties of the various sensors used in the experiments, as well as the parameters calculated.
| Sensor | Uncertainty |
|---|---|
| K-type thermocouple | ± 0.1°C |
| Pressure sensors | ±2.5 % FS |
| Peristaltic pump | ±1% |
| Heater power supply voltage and current | 0.01% and 0.1% |
| L (mm) | 2.5 |
| W (mm) | 1.25 |
| Parameter | Uncertainty (%) |
| Re | 1.54 |
| ∆P (Pa) | 0.5 |
| h (W/m2.°C) | 2 |
| Nu | 3 |
Table 4.
Heat transfer enhancement in the micro heat exchanger due to the addition of nanoparticles to pure water.
Table 4.
Heat transfer enhancement in the micro heat exchanger due to the addition of nanoparticles to pure water.
| Φ (%) | 1 | 5 | |||||||
|---|---|---|---|---|---|---|---|---|---|
| Tin (°C) | 35 | 45 | 55 | 65 | 35 | 45 | 55 | 65 | |
| Re | |||||||||
| 400 | 26% | 24% | 23% | 21% | 37% | 35% | 32% | 30% | |
| 800 | 35% | 32% | 30% | 28% | 52% | 49% | 47% | 45% | |
| 1200 | 44% | 42% | 40% | 39% | 60% | 57% | 55% | 53% | |
| 2000 | 57% | 56% | 54% | 49% | 70% | 65% | 63% | 59% | |
Disclaimer/Publisher’s Note: The statements, opinions and data contained in all publications are solely those of the individual author(s) and contributor(s) and not of MDPI and/or the editor(s). MDPI and/or the editor(s) disclaim responsibility for any injury to people or property resulting from any ideas, methods, instructions or products referred to in the content. |
© 2024 by the authors. Licensee MDPI, Basel, Switzerland. This article is an open access article distributed under the terms and conditions of the Creative Commons Attribution (CC BY) license (http://creativecommons.org/licenses/by/4.0/).
Copyright: This open access article is published under a Creative Commons CC BY 4.0 license, which permit the free download, distribution, and reuse, provided that the author and preprint are cited in any reuse.


