Preprint
Article

A Nature-Inspired Approach to Energy-Efficient Relay Selection in LPWAN

Altmetrics

Downloads

60

Views

28

Comments

0

A peer-reviewed article of this preprint also exists.

This version is not peer-reviewed

Submitted:

18 April 2024

Posted:

24 April 2024

You are already at the latest version

Alerts
Abstract
Despite Low Power Wide Area Networks’ ability to offer an extended range, it might still encounter challenges with coverage blind spots in the network. This article proposes an innovative energy-efficient nature-inspired relay selection algorithm for LoRa-based LPWAN networks, serving as a solution for challenges related to poor signal range in areas with limited coverage. A behavior swarm-inspired approach has been utilized to select the relays’ localization in the network, providing network energy efficiency and radio signal extension. These relays help bridge communication gaps, significantly reducing the impact of coverage blind spots by forwarding signals from devices with poor direct connectivity with the gateway. The proposed algorithm considers critical factors for the LoRa standard, such as the Spreading Factor or device energy budget analysis. The simulation experiments validate the proposed scheme’s effectiveness in terms of energy efficiency under diverse multi-gateway topology scenarios involving thousands of devices. Specifically, it has been verified that the proposed approach outperforms the reference method in preventing the battery depletion of relays, which is vital for battery-powered IoT devices. Furthermore, for some large-scale problems, the proposed heuristic method achieves over twice the speed of the exact method with a negligible accuracy loss of less than 2%.
Keywords: 
Subject: Computer Science and Mathematics  -   Computer Science

1. Introduction

Low Power Wide Area Network (LPWAN) is a type of wireless telecommunication wide area network characterized by long-range, low cost, low throughput, and low power consumption. The LPWAN technologies, such as LoRa, NB-IoT, or Sigfox, facilitate a vast range of IoT applications, from agricultural sensors and smart meters to asset tracking and Smart City infrastructure, by providing cost-effective, efficient, and reliable connectivity solutions [1,2]. LoRa [3], developed by Semtech, is a prominent LPWAN technology that provides a higher data rate than SigFox and longer-range connectivity than the NB-IoT. Furthermore, LoRa operates on unlicensed frequencies (e.g., 868 MHz in the European Union, 902-928 MHz in the USA). LoRa utilizes Chirp Spread Spectrum (CSS) [4] modulation, a spread spectrum wideband technique that uses modulated linear frequency chirp pulses to encode information. This technology optimizes data transmission by adjusting spreading factor parameter SF (e.g. form 7 to 12), balancing transmission speed, power usage, and operational range, making it well-suited for Internet of Things (IoT) and Smart City applications, particularly for telemetry and remote monitoring tasks.
Most LPWAN networks are based on a star topology, where direct communication occurs between end devices and LoRa gateways. However, end devices in LoRa networks may have limited range, potentially leading to connection loss between nodes and gateways, especially in densely built or challenging terrain. In LoRaWAN, these issues are typically solved by adding more gateways, complicating the system. Maintaining LPWAN gateways incurs significant costs due to their continuous connection to the central network server via the Internet and their requirement to listen to all channels simultaneously, elevating energy usage. Another approach involves enhancing the receiver sensitivity, which, although it improves signal detection, results in a decreased data rate.
Utilizing relay devices provides another, more effective, and sustainable strategy to cover blind spots in the LoRa network. This solution extends signal range while minimizing network infrastructure deployment costs. Relay devices are battery-powered, and their hardware architecture closely resembles that of end devices, as detailed in [5]. Installing relay devices, which can serve as intermediaries by providing an additional communication hop between end devices and gateways, emerges as a solution to enhance signal coverage within blind spots, improving the QoS. The significance of the relay selection problem gains importance as the role of the relay device in LoRa has been discussed in scientific literature [6,7] and also in practice among standardization organizations. Since late 2022, the LoRa Alliance has published an extension to the LoRaWAN link layer specification introducing the relay functionality [5]. However, while this specification introduces relay functionality, it does not address the placement of relay devices within the network to ensure operational efficiency, cover coverage gaps, and minimize the costs associated with network infrastructure development.
This paper proposes, an energy-efficient relay device selection algorithm for LoRa networks. The paper is organized as follows: Section 3 details the heuristic relay selection algorithm. Section 4 provides some parameters analysis for the proposed heuristic approach. Section 5 describes performance evaluation in simulation environment, and the final discussion is in Section 6.

2. Literature Review

The concept of a relay node for the LoRa network is presented in [8]. This publication defined an extension of the LoRaWAN protocol, enabling end devices to detect and establish connections with a node that qualifies for the relay role. The described solution utilizes the Time-Division Multiple Access (TDMA) technique, constituting an extension of the standard LoRaWAN protocol specification. The performance of the proposed solution was compared with the standard single-hop LoRaWAN communication scheme. The authors demonstrate that using a battery-powered relay device in a LoRa network is feasible. The results of the experiments prove an increase in communication reliability and an extension of the network’s range while maintaining the energy efficiency properties of LoRaWAN for relay-assisted communication. In the [9,10,11], multi-hop communication schemes are considered using relay devices and an e-node to extend the range, aiming to enhance the reliability of transmitting data from LoRa devices to the gateway in IoT LoRa networks. In this context, Class C devices served as relay devices, intercepting data transmissions from LoRa devices by eavesdropping and relaying them to the gateway. Additionally, each relay device alternately listened to transmissions from end devices in a receiving window and regularly forwarded the content of intercepted packets to the gateway. However, these studies focused solely on increasing the probability of extending the range, overlooking the fairness principle of the transmission success probability for different network areas. In the paper [12], the authors demonstrate the concept of a communication system considering the functionality of a relay node using available commercial components. Some earlier research works explore the relay selection problem in LPWANs and cellular networks.
Within the studies [13,14], the authors present a relay node selection approach as a part of the system encompassing the optimization of resource allocation for the spreading factor aiming to ensure maximum performance in terms of throughput, BER, and network coverage probability. Simulation and numerical results demonstrate that the system improves BER and coverage probability for a given geographic area but reduces throughput compared to the traditional LoRa system. Furthermore, the presented relay node selection technique does not consider the analysis of the energy budge,t which is crucial for battery-powered devices.
In the paper [15], the authors propose an FSRC (Forwarding Signal with Relay Control) scheme for relay node management in IoT services within LPWAN networks based on LoRa technology. The scheme promotes the operation of relays with the involvement of end devices with a low spreading factor, aiming to maximize coverage and increase the transmission success probability for remote end devices. The proposed scheme considers a relay selection strategy based on the RSSI, theoretical values SNR, and Signal-to-Interference Ratio (SIR). Despite significantly increasing the packet delivery probability (by approximately 30%), the proposed approach does not account for the impact of relay functionality on the device’s battery life.
The presented approach serves as a benchmark for the SFPCR algorithm, introduced in [16], demonstrating an improvement in the transmission success probability. The authors propose a mechanism addressing the "near-far fairness" problem in wireless networks, referring to the unequal quality of services depending on the distance to the base station. A technique based on network clustering into regions based on the spreading factor coefficient values and a relay selection algorithm was applied to extend the network’s coverage and increase the transmission success probability. The relay selection algorithm is based on the harmonic mean of link quality and device energy resource indicators. The link quality is assessed based on the transmission success probability, considering the distance between devices, SNR, and receiver sensitivity. The method was evaluated in the NS-3 simulation environment, considering a LoRa network topology with only a single access point, whereas my approach is tailored for multi-gateway scenarios.
The study referenced as [17] presents an algorithm for selecting relays, wherein a single relay is assigned multiple weak nodes. However, such an approach may not be viable in systems where end devices transmit relatively frequently, such as parking systems or alarm and security systems. Theoretically, an end device operating on SF=7 could transmit dozens of times daily for up to 10 years (including the duty cycle regulation). Managing multiple demanding weak devices with a single relay could lead to rapid battery depletion and frequent replacement of the relay device for weak nodes. In contrast, my solution assigns exactly one weak node to a single relay, which is a long-term, stable solution that makes the system more resilient and easier to manage.
In the well-known work [18], the authors propose relay assignment optimization based on an auction model. The auction model provides incentives for partially cooperative users at the expense of introducing additional computational costs. The Energy-Efficient Maximum Weighted Matching (EE-MWM) algorithm is utilized for optimization. This approach is similar to the method presented in this paper, but does not consider energy consumption of devices at all.
In [19], the authors investigate relay-assisted device-to-device (D2D) communications for 5G wireless cellular networks. This approach, which focuses on relay selection with energy savings, introduces the PRS-D2D algorithm utilizing the Hungarian method [20] to solve the matching problem in polynomial time. It’s important to note that this approach is not dedicated to the LoRa standard and involves a configuration with directional antennas. The study in [21] explores the energy efficiency of LoRa across diverse topologies, encompassing star and mesh networks. A proposed strategy advocates the utilization of both star and mesh network topologies. The analysis considers energy consumption of network density and range, employing various radio configurations. However, the paper needs to delve into the selection of relay nodes to maximize the overall network throughput.
The authors of [22] demonstrate that relay selection algorithms in wireless networks can be executed with low computational complexity and system load. The proposed semi-distributed user-relay algorithm does not exchange channel state information between network nodes. However, this algorithm was designed for IEEE 802.16 (WiMAX) networks, assuming very short distances between nodes (evaluated in a radius of 50m), variable transmit power allocation, which is not typical in most LPWANs, and frequent communication between relays and the base station to exchange channel state information, which is not feasible in LPWANs due to very limited bandwidth.

3. Relay Selection Algorithm

3.1. Introduction

The LoRa network devices operate within a star topology where each device interacts with a LoRa gateway, facilitating straightforward and centralized communication. Some of end devices are installed in areas with limited coverage and may have poor connectivity to the gateway, which results in the loss of some transmission packets and they need to assign a relay-type device. The role of the relay device is to forward signals from a end device with poor connectivity to the destination gateway.
The network topology is represented by an undirected graph G = ( V G , E G ) , with the set of nodes V G corresponding to network devices and set of edges E G . The vertices are connected with an edge if corresponding devices are within range. Each edge ( v , w ) E G is assigned the weight S F v w representing a value of the spreading factor in the communication between the devices corresponding to nodes v and w.

3.1.1. Problem Formulation

The problem is finding a set of devices that can serve as relays, identifying their operational zones to ensure full coverage for the all given end devices with weak connections to the destination gateway (weak nodes), while also optimizing energy usage.
The relay selection problem in the LoRa network can be reduced to the problem of finding a matching with maximum weight among all maximum-cardinality matchings in a weighted graph. Its restriction to bipartite graphs is called the assignment problem – one of the classical combinatorial optimization problems [23]. This study considers two groups of nodes: weak nodes and candidate nodes for relays, between which weighted edges define relationships. Thus, I consider the assignment problem where an assignment with the maximum total sum of weights should be found. This problem is a class P problem, and algorithms like Edmonds-Karp (EK) [24] or Hungarian [20] utilized in the reference method [18] used in performance evaluation Section 5, are known to solve it. However, I propose a heuristic approach based on Ant Colony Optimization (ACO) [25] that provides benefits related to the time it takes to obtain a solution with acceptable accuracy. The heuristic approach does not check all possible solution combinations but instead explores the solution space selectively. Nevertheless, the heuristic function proposed in 3.3 is also utilized in the exact method EK [24] with which the heuristic approach is compared.
The weighted bipartite graph is the relay candidates graph H = U H , W H , E H , η G = ( V G , E G ) , where U H is a set of uncovered weak nodes - the vertices corresponding to devices that need to be assigned a relay. W H is a set of candidates for relay nodes, E H is the set of edges between weak nodes and their neighboring candidates for relays, where each edge ( u , w ) E H is assigned a weight given by (12). This bipartite graph is an input for the proposed heuristic ACO approach and the exact algorithm EK.

3.1.1.1. Relay nodes selection with constraints.

For a given graph H = ( U H , W H , E H , η ) , find the set of a relay nodes R W H , and the bipartite graph J = ( V J , E J ) , which is the subgraph of H, J H , satisfying the following conditions,
1.
V J = U H R
2.
E J = { ( u , r ) : u U H r R r N H ( u ) }
3.
u U H , r R deg J ( u ) = 1 = d e g J ( r ) = 1
4.
The sum of edge weights in graph J is the result of maximization:
max ( u , w ) E H η ( u , w ) x u w
u U H x u w 1 , w W H
w W H x u w = 1 , u U H
where x u w { 0 , 1 } and x u w equals 1 denotes the edge ( u , w ) is an edge in the weak node - relay assignment. If | U H | = | W H | , then u U H x u w = 1 , w W H and w W H x u w = 1 , u U H .

3.2. Energy Consumption Model

In accordance with Casals et al. [26], the energy consumption involved in transmitting a LoRa packet can be segmented into distinct phases, encompassing end device’s waking up, radio preparation, signal transmission, radio deactivation, and post-processing. All these phases, except signal transmission, exhibit minimal or no dependency on resource allocation. Hence, they are assumed to be uniform across all end devices in the proposed model.
Energy consumption of the end device during LoRa packet transmission and reception according to [27]:
T s y m b o l = 2 S F B W
T p r e a m b l e = T s y m b o l × ( n p r e a m b l e + 4.25 )
A = 8 P L 4 S F + 28 + 16 20 H 4 ( S F 2 D E )
P a y l o a d = 8 + max ( A × ( C R + 4 ) , 0 )
T p a y l o a d = P a y l o a d × T s y m b o l
T p a c k e t = T p r e a m b l e + T p a y l o a d
Where: T s y m b o l - ToA for symbol, B W = 125 kHz - bandwidth, n p r e a m b l e = 8 - number of symbols encoding the preamble (value specified in the "Regional Parameters LoRaWAN" [28]) and extended by an additional 4.25 symbols by the radio transmitter, resulting in 12.25 symbols). P L = 51 B - payload size, H = 0 B - header size, D E = 1 if low data rate optimization is enabled (for SF=11 and SF=12), D E = 0 for disabled, C R = 5 - coding rate.
Then, transmission energy usage E T X and reception energy usage E R X for a single packet are as follows
E T X = 37 × T p a c k e t
E R X = 6.5 × T p a c k e t
The calculation results for the presented energy consumption model are included in Table 1, and are utilized in the heuristic function described subsection 3.3 and in the simulation from Section 5.

3.3. Heuristic Function

Each edge { u , w } E H is assigned a weight describing the quality of link between devices corresponding to nodes u and w. The formula of the determining an edge weigh is given by the heuristic function: η : E H R
η ( u , w ) = E w + E R X u + E T X w
where E w + is the daily energy surplus (in mAs) of the relay candidate w, calculated in basis on the device’s battery level and remaining operation time [17]. E R X u is the relay’s reception energy usage depending on the weak node’s u SF value, E T X w is the relay’s transmission energy usage depending on the relay’s SF value, both taking from the Table 1.
The weight function 12 estimates the attractiveness of connection between a weak node u U H and a relay node candidate w W H . The formula 12 consists of two main components, energy surplus per day E w + of the relay node candidate w W H , in the nominator, and relaying energy cost of weak node u U H in denominator, which consists of listening energy cost E R X u and transmission energy cost E T X w corresponding to a single packet of weak node u U H needs to be forward by a relay node w.
The heuristic function 12 considers a key parameter of LoRa technology, the spreading factor S F { 7 , 8 , 9 , 10 , 11 , 12 } . It determines how many chirps (or symbols) are sent per second. Various spreading factor values result in significant differences in time-on-air (ToA) for transmitting symbol [29]. With S F = n , a symbol can encode n information bits into a chirp, and the bit rate is given by R b n = n · 1 M M 2 n / B W , so the symbol period is calculated by T s y m b o l = 2 n B W . So, when the number of bits in the symbol increases only by one, its ToA doubles. However, a higher SF means more resistance to interference and noise, resulting in a more extensive communication range.
In the evaluation of the link quality between a weak node and a relay candidate, it is necessary to consider two values of the SF, both in the communication between a weak node and a relay candidate ( S F u w ) and between a relay candidate and a LoRa gateway ( S F w g ).
The impact of those SFs is captured in appropriate proportions in the denominator of the function 12. The formula considers the energy cost associated with the relay node’s listening, related to receiving packets from the weak node, and the energy cost of retransmitting those packets. It directly corresponds to the daily cost of serving as a relay for a weak node.
Nodes capable of serving as relays for individual weak nodes for as long as possible are prioritized, aiming to minimize future switches from relay mode.
Listening energy usage component E R X u evaluates the node w in basis of the value of spreading factor S F u w in the communication between weak node u and the candidate for relay w.
Transmission energy usage component E T X w evaluates the node w in basis of the value of spreading factor S F w g in the communication between node w and the destination gateway g. As S F w g value decreases, the value of heuristic function 12 increases. Such approach considers power efficient relay nodes selection. The smaller the spreading factor to the destination LoRa gateway S F w g , the less energy is used by the device represented by node w in relay mode. The higher the weight function value, the more attractive node w W H is to be a relay for weak node u U H .
Such clear principle, which divides the surplus energy of a relay node candidate by the cost of operating as a relay, precisely reflects the quality of connection weak node - relay node candidate - LoRa gateway, considering the role of node w W H as a relay for node u U H .
The remaining operational time during which the device w must operate is already incorporated in the formula determining the device’s energy surplus E w + .
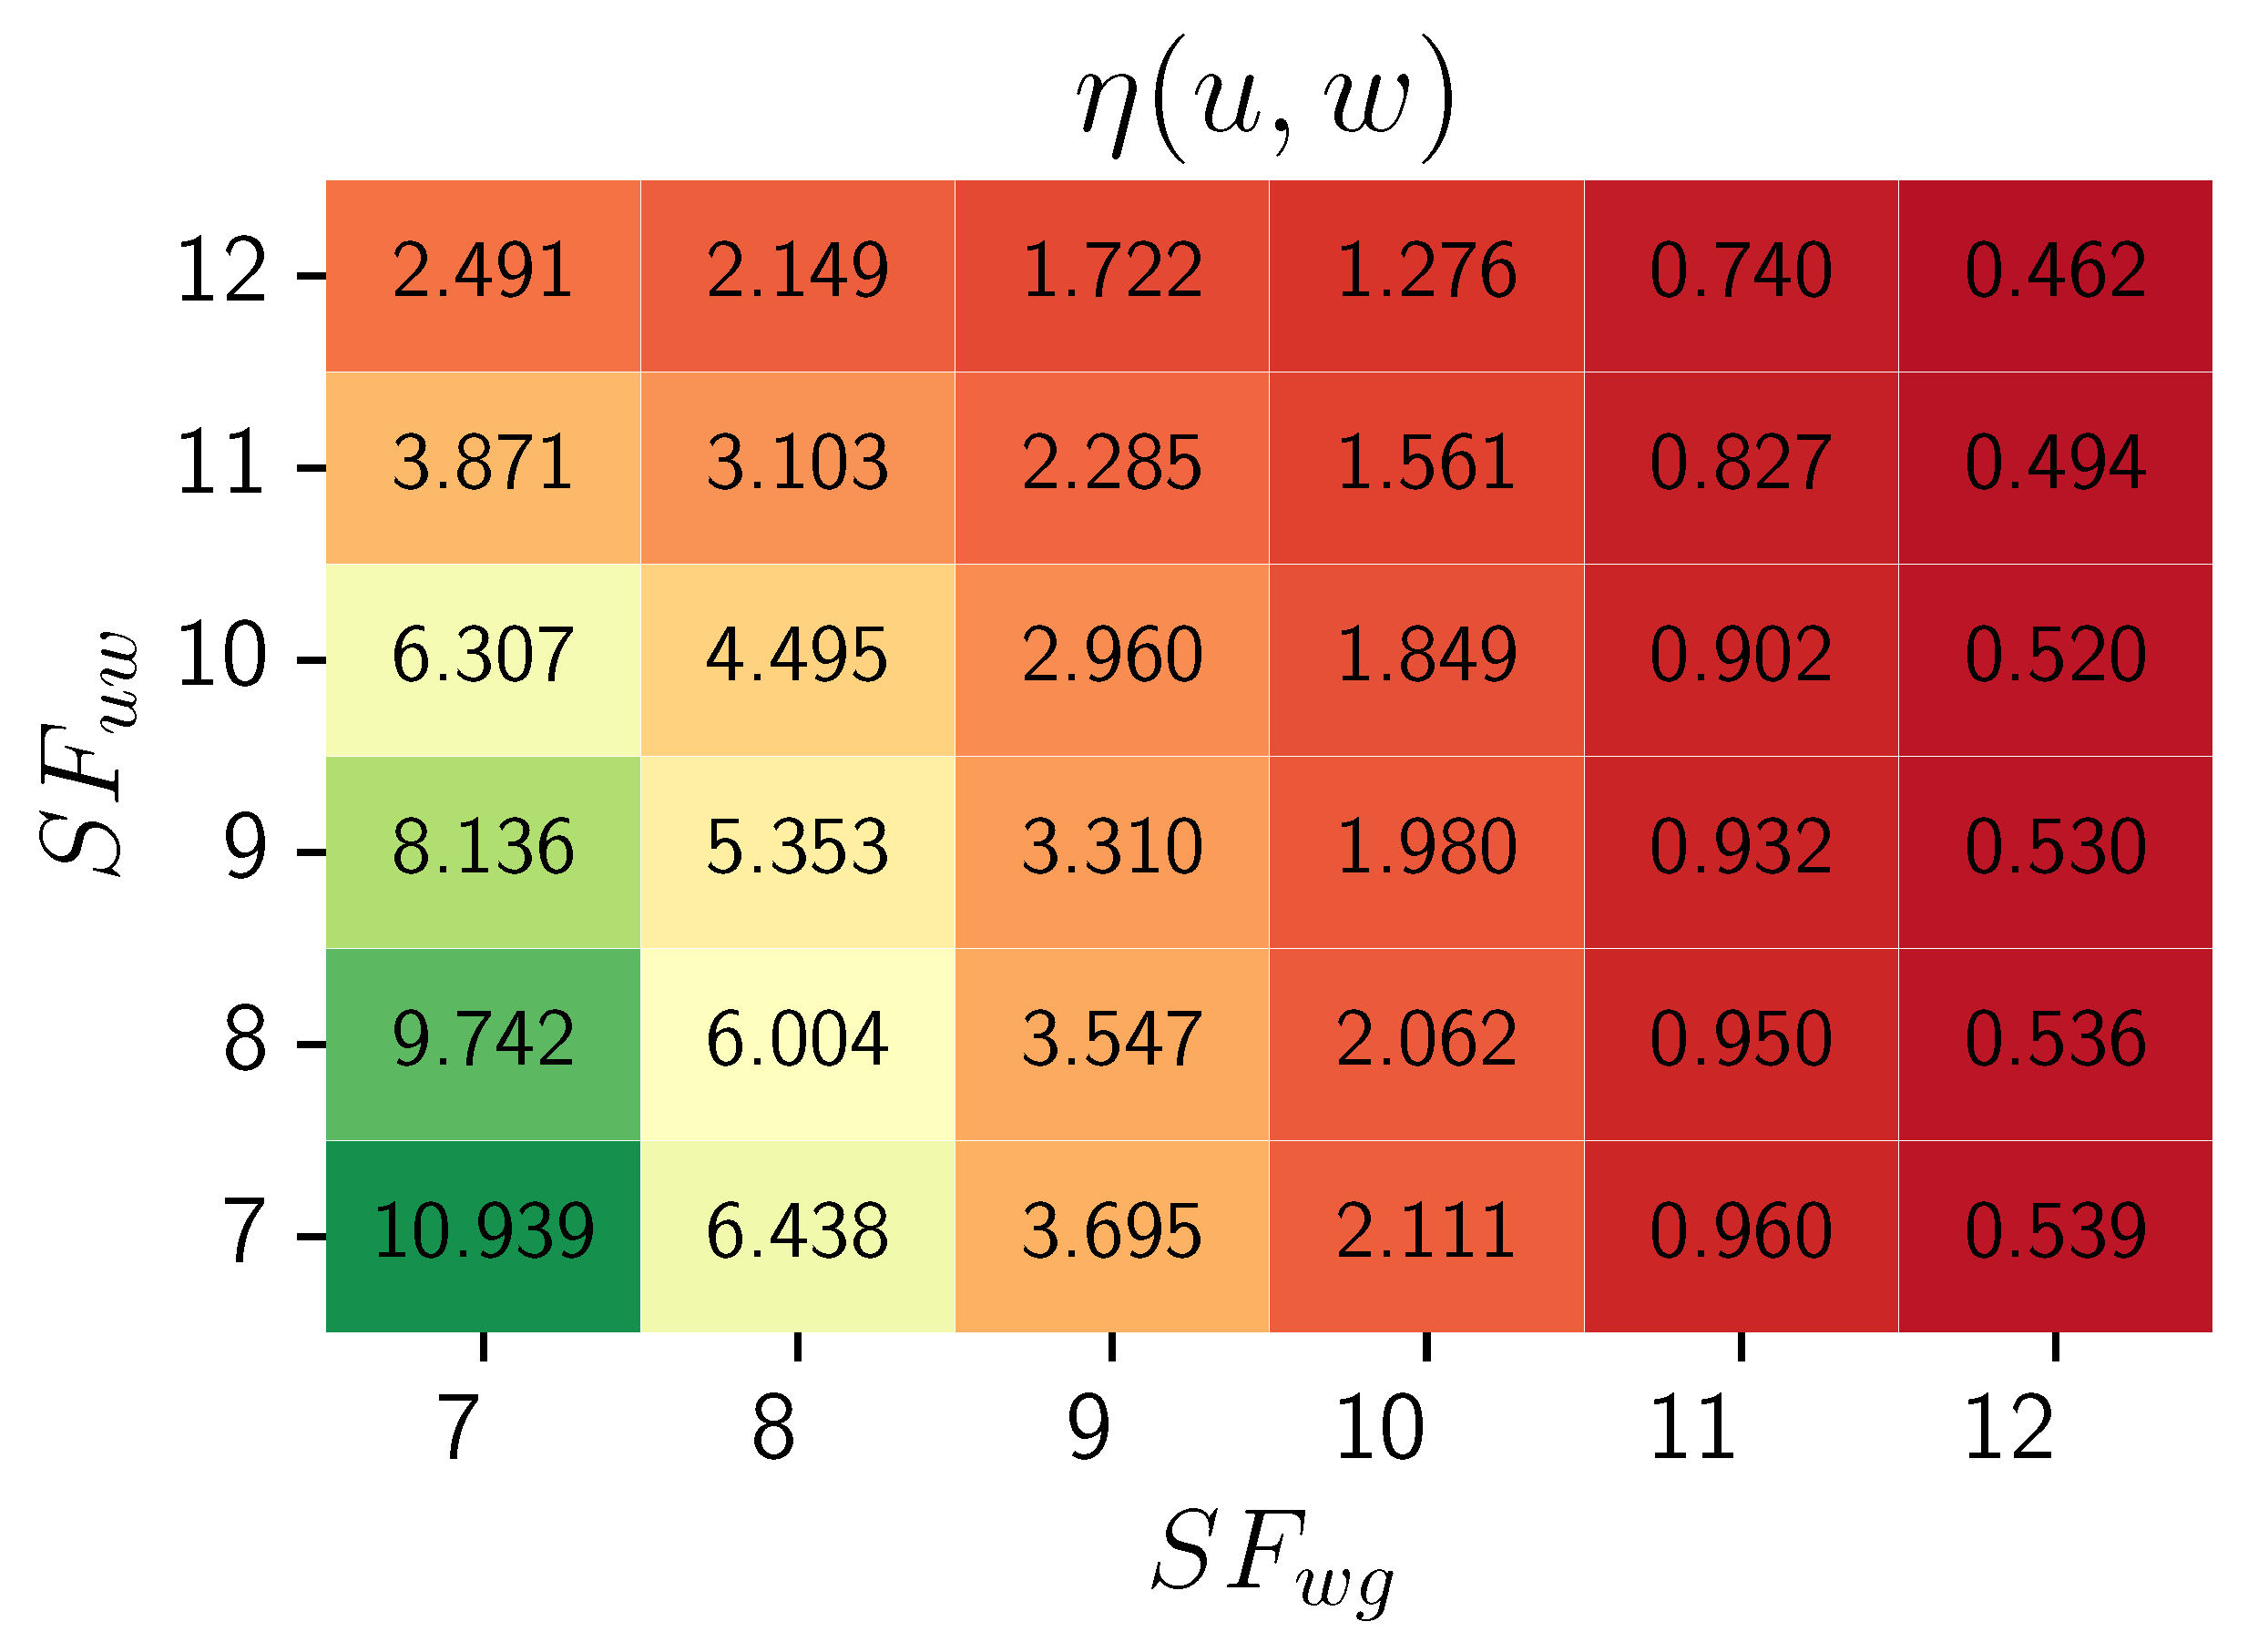
Figure 1 depicts the 2D distribution of weight function 12 values depending on spreading factors in the communication between weak node - relay node candidate ( S F u w ) and relay node candidate - LoRa gateway ( S F w g ) for each u U H , w W H .
As the values of both spreading factors decrease, the edge weight function η ( u , w ) increases. The heatmap effectively highlights the differences in the objective function η ( u , w ) values for the cases S F u w = x 1 , S F w g = x 2 and S F u w = x 2 , S F u g = x 1 , where x 1 , x 2 { 7 , 8 , 9 , 10 , 11 , 12 } x 1 x 2 . The SF in communication between the relay and the gateway ( S F w g ) has a more significant impact on the relay’s energy consumption than the spreading factor in communication between the relay and a weak node ( S F u w ). The heatmap aims to depict SFs’ characteristic influence and visualize their impact on outcomes. It is generated for a constant surplus energy value (the exact value is not significant, as the distribution characteristics will be preserved).

3.4. Relay Selection Algorithm

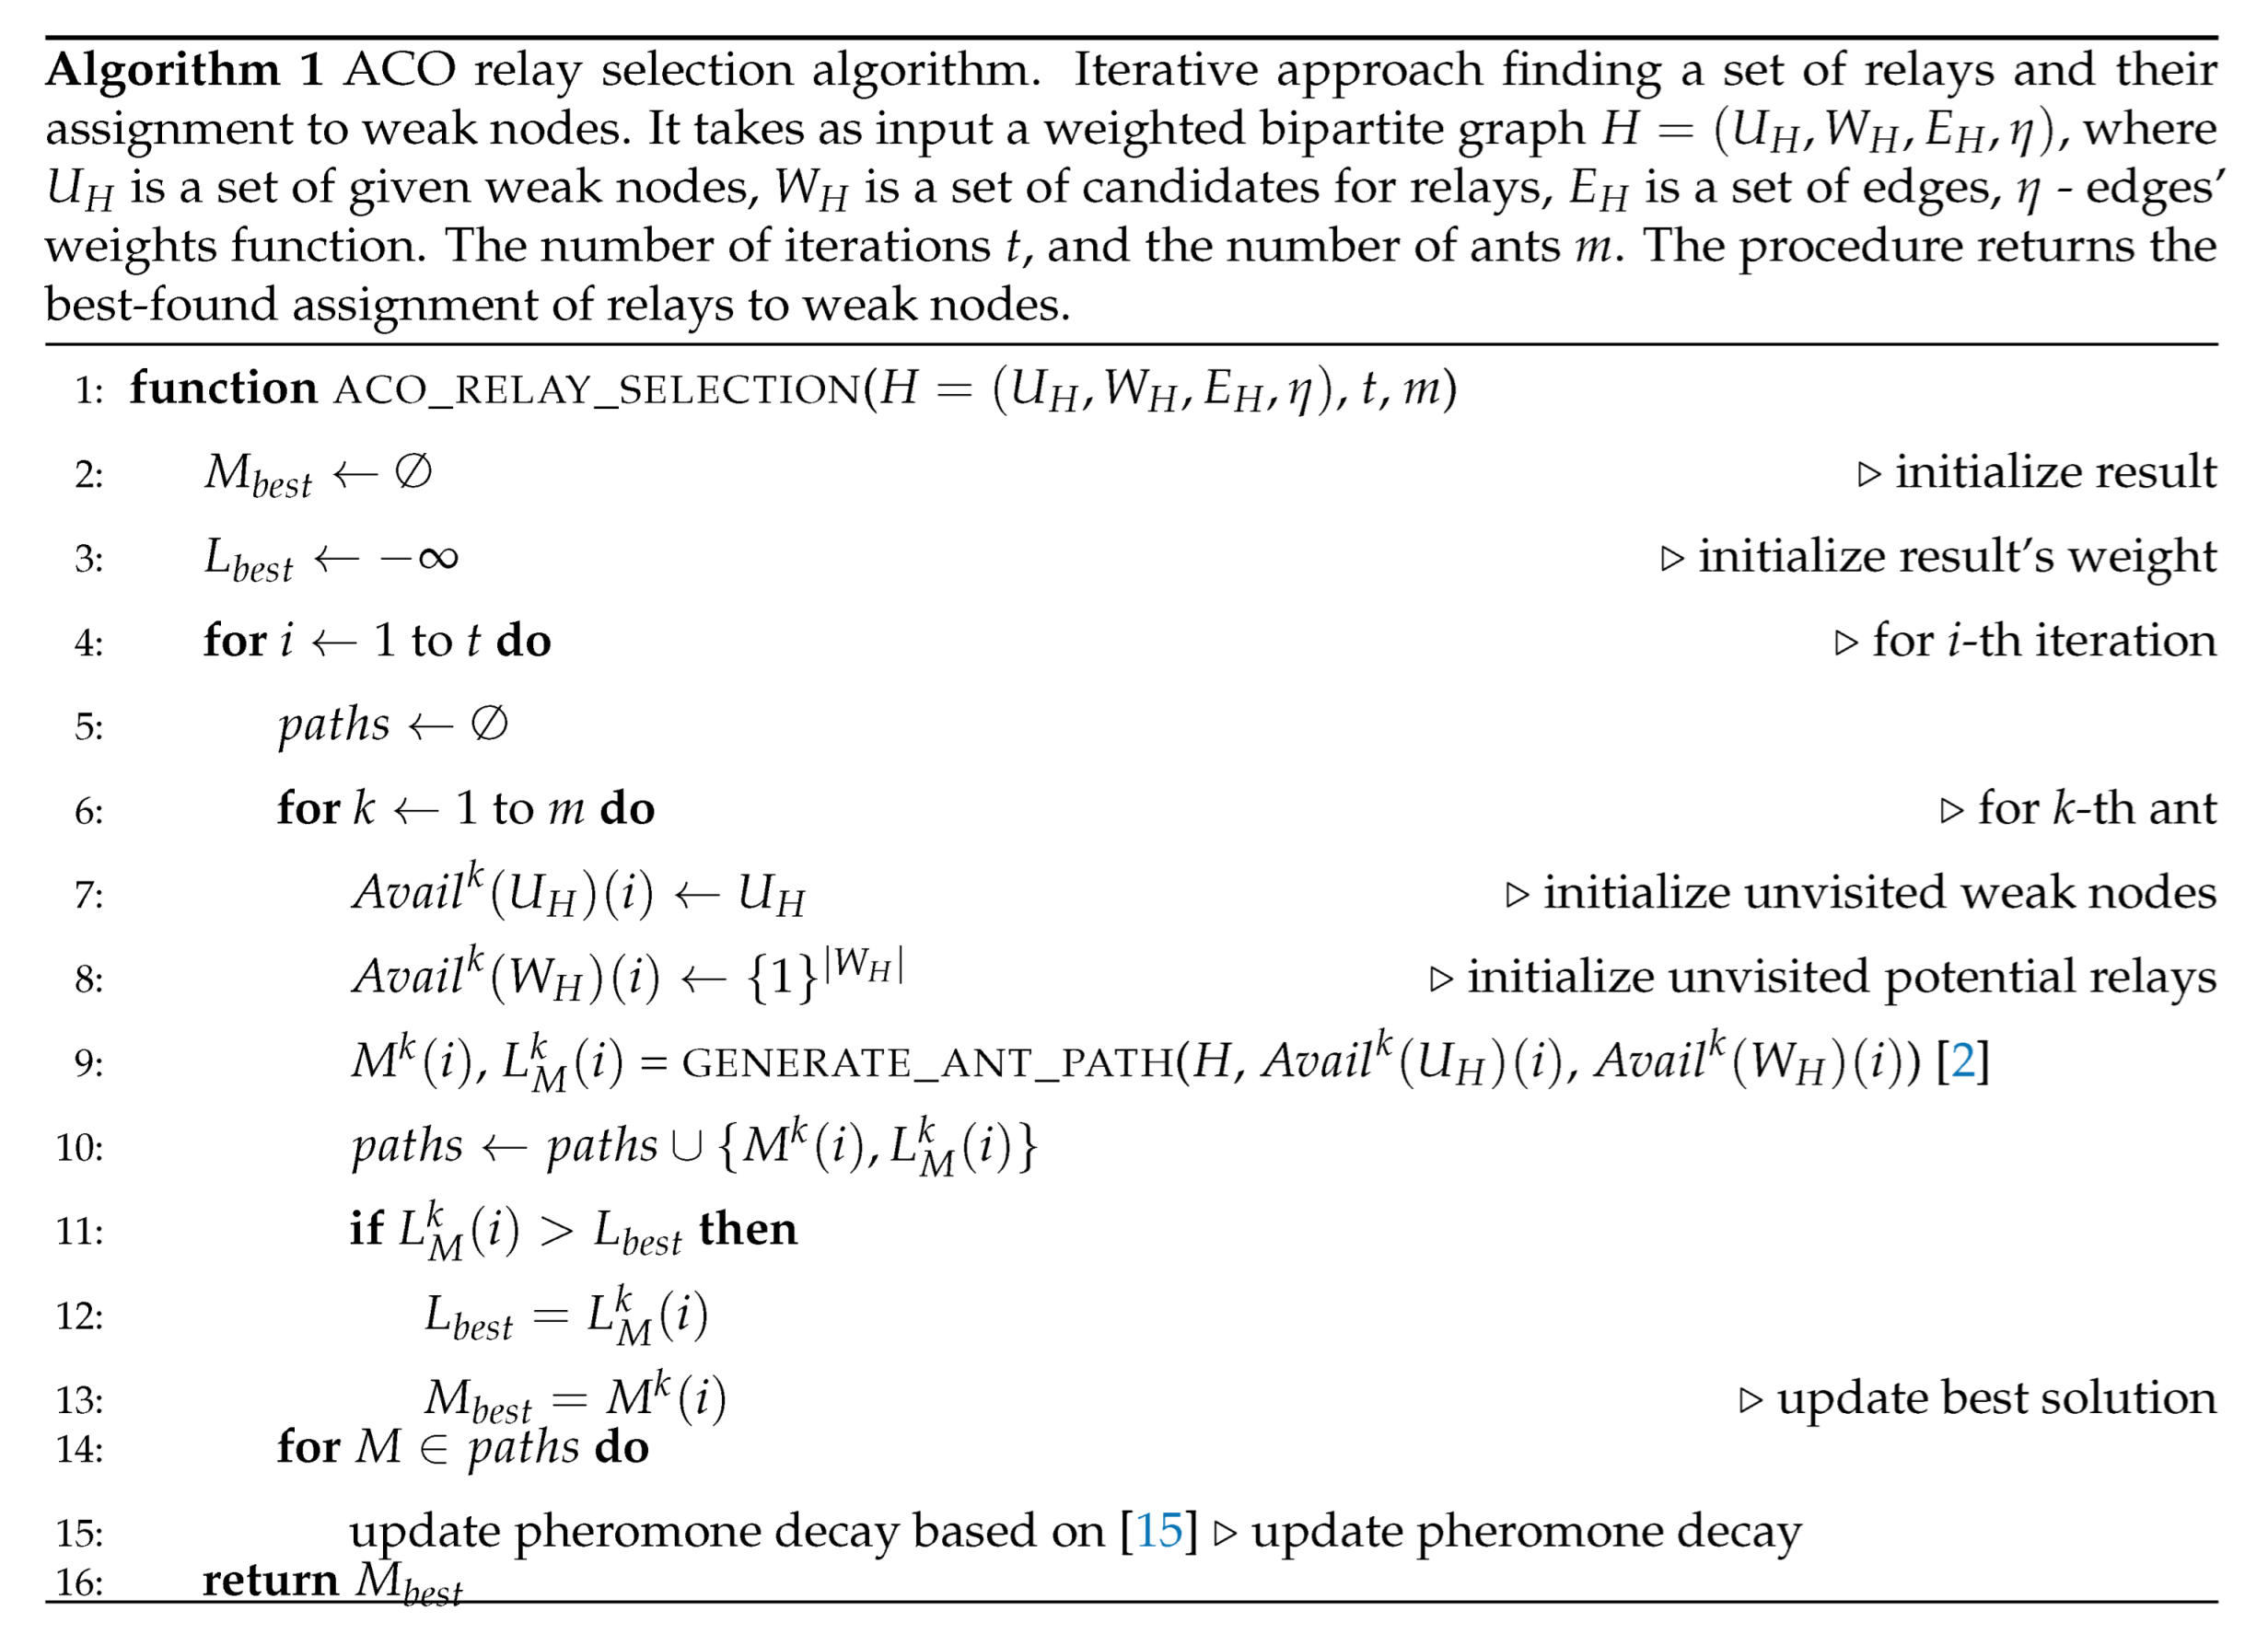
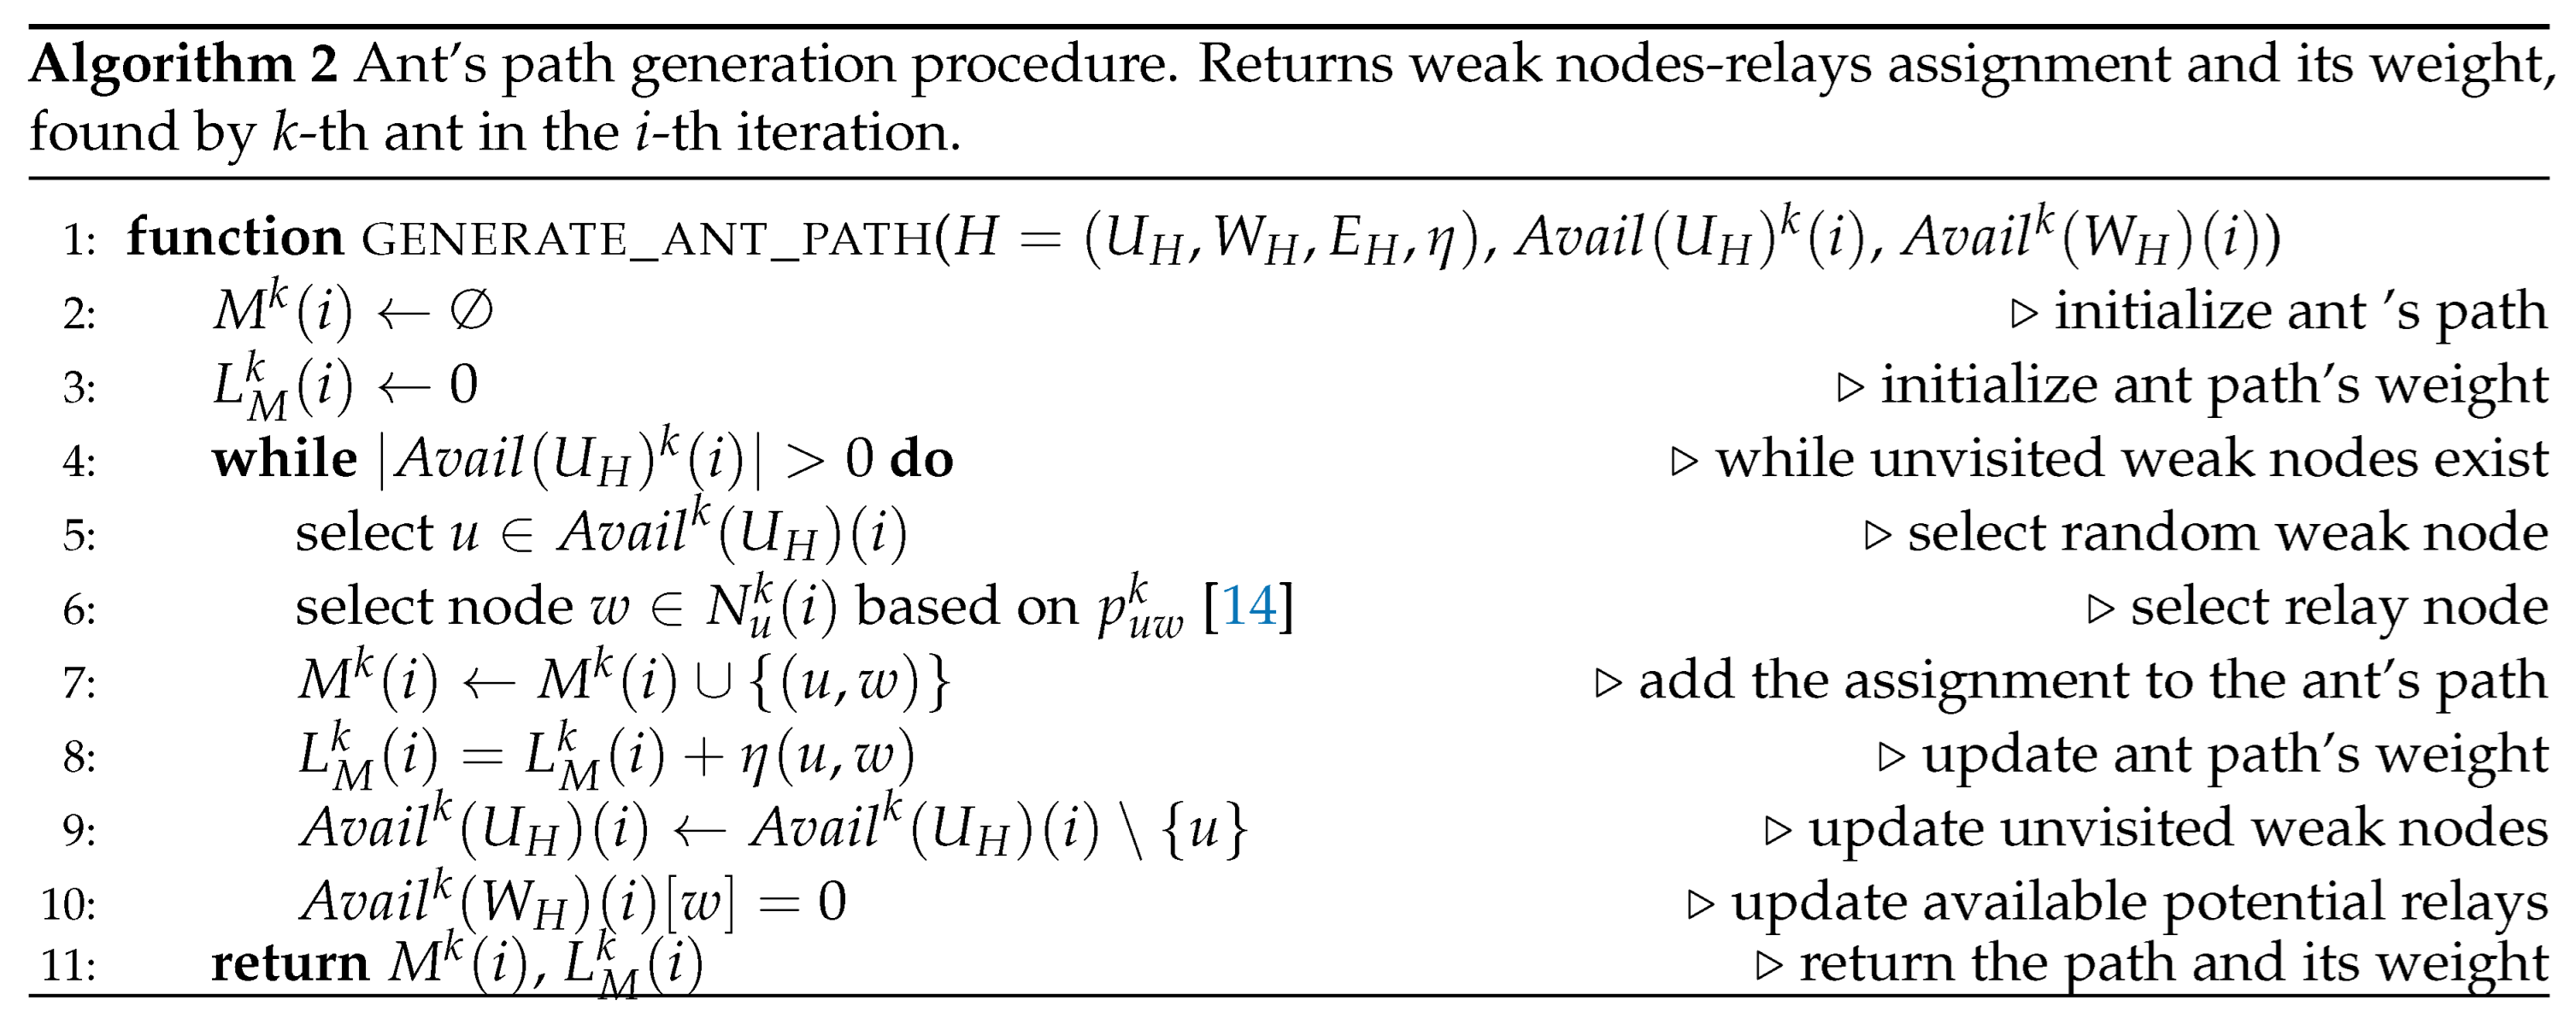
Below is the pseudocode for the ACO relay selection algorithm. The result of 1 corresponds directly to addressing the problem outlined in 3.1.1.
Preprints 104301 i001
Preprints 104301 i002
Probability of selecting node w by k-th ant at position u at i-th iteration is formulated in [25] and given by formula
p u w k ( i ) = [ τ u w ( i ) ] α [ η ( u , w ) ] β l N l k [ τ u l ( i ) ] α [ η ( u , l ) ] β , l N u k ,
where α and β parameters control the relative impact of the pheromone versus heuristic information η ( u , w )  12. N l k is the set of the k-th ant’s unvisited adjacent vertices of node u at i-th iteration.
The pheromone deposition function allows the algorithm to strive for better solutions in subsequent iterations and is given by the following formula [25]:
τ u w ( i + 1 ) = ( 1 ρ ) τ u w ( i ) + k = 1 m Δ τ u w k ( i )
Δ τ u w k ( i ) = η u w Q , ( u , w ) M k ( i ) 0 , ( u , w ) M k ( i )
where Q is the constant value m a x ( u , w ) E H η ( u , w ) . This pheromone deposition strategy rewards the edge based on its quality.

3.5. Computational Complexity

While establishing the running time of the ACO relay selection algorithm 1, I considered the worst-case scenario, i.e., a scenario where the bipartite graph H = ( U H , W H ) is complete. In the analysis, I focused on the most computationally significant components of the procedure where the negligible steps characterized are omitted.
In Table 2 and Table 3, the computational cost and the multiplicity of operations for the algorithm 1 are presented, necessary for determining the pessimistic execution time of the algorithm. According to [30] that each execution of the kth line takes c k time, where c k is a constant.
Let n 1 = | U H | , n 2 = | W H | and n 1 n 2
Then, considering the pessimistic execution time of the algorithm 1 is presented as follows
T ( n 1 , n 2 ) = t · ( m · ( c 1 n 1 + c 2 n 2 + c 3 j = 1 n 1 + 1 j + c 4 j = 1 n 1 ( j + n 2 ) ) + c 5 n 1 )
j = 1 n 1 + 1 j = ( n 1 + 2 ) 2 ( n 1 + 1 ) n 1 2 ,
j = 1 n 1 ( j + n 2 ) = j = 1 n 1 j + j = 1 n 1 n 2 = n 1 + 1 2 n 1 + n 1 · n 2 ,
n 1 + 1 2 n 1 + n 1 · n 2 n 1 2 + n 1 · n 2 n 1 · n 2
then, considering the asymptotic growth of the running time algorithm runs in time
T ( n 1 , n 2 ) = O ( t · m · n 1 · n 2 ) = O ( t · m · U H · W H ) = O ( t · m · E H ) ,
In Table 4, the time complexity of the proposed methods: heuristic ACO, the exact method EK [24], and the reference method [18] are compared.
where V H = U H W H . Compared to the EK and the reference methods, the computational complexity of the ACO algorithm does not solely depend on the size of the number of vertices and edges but also significantly on the number of iterations and ants involved.
4. Parameters Analysis

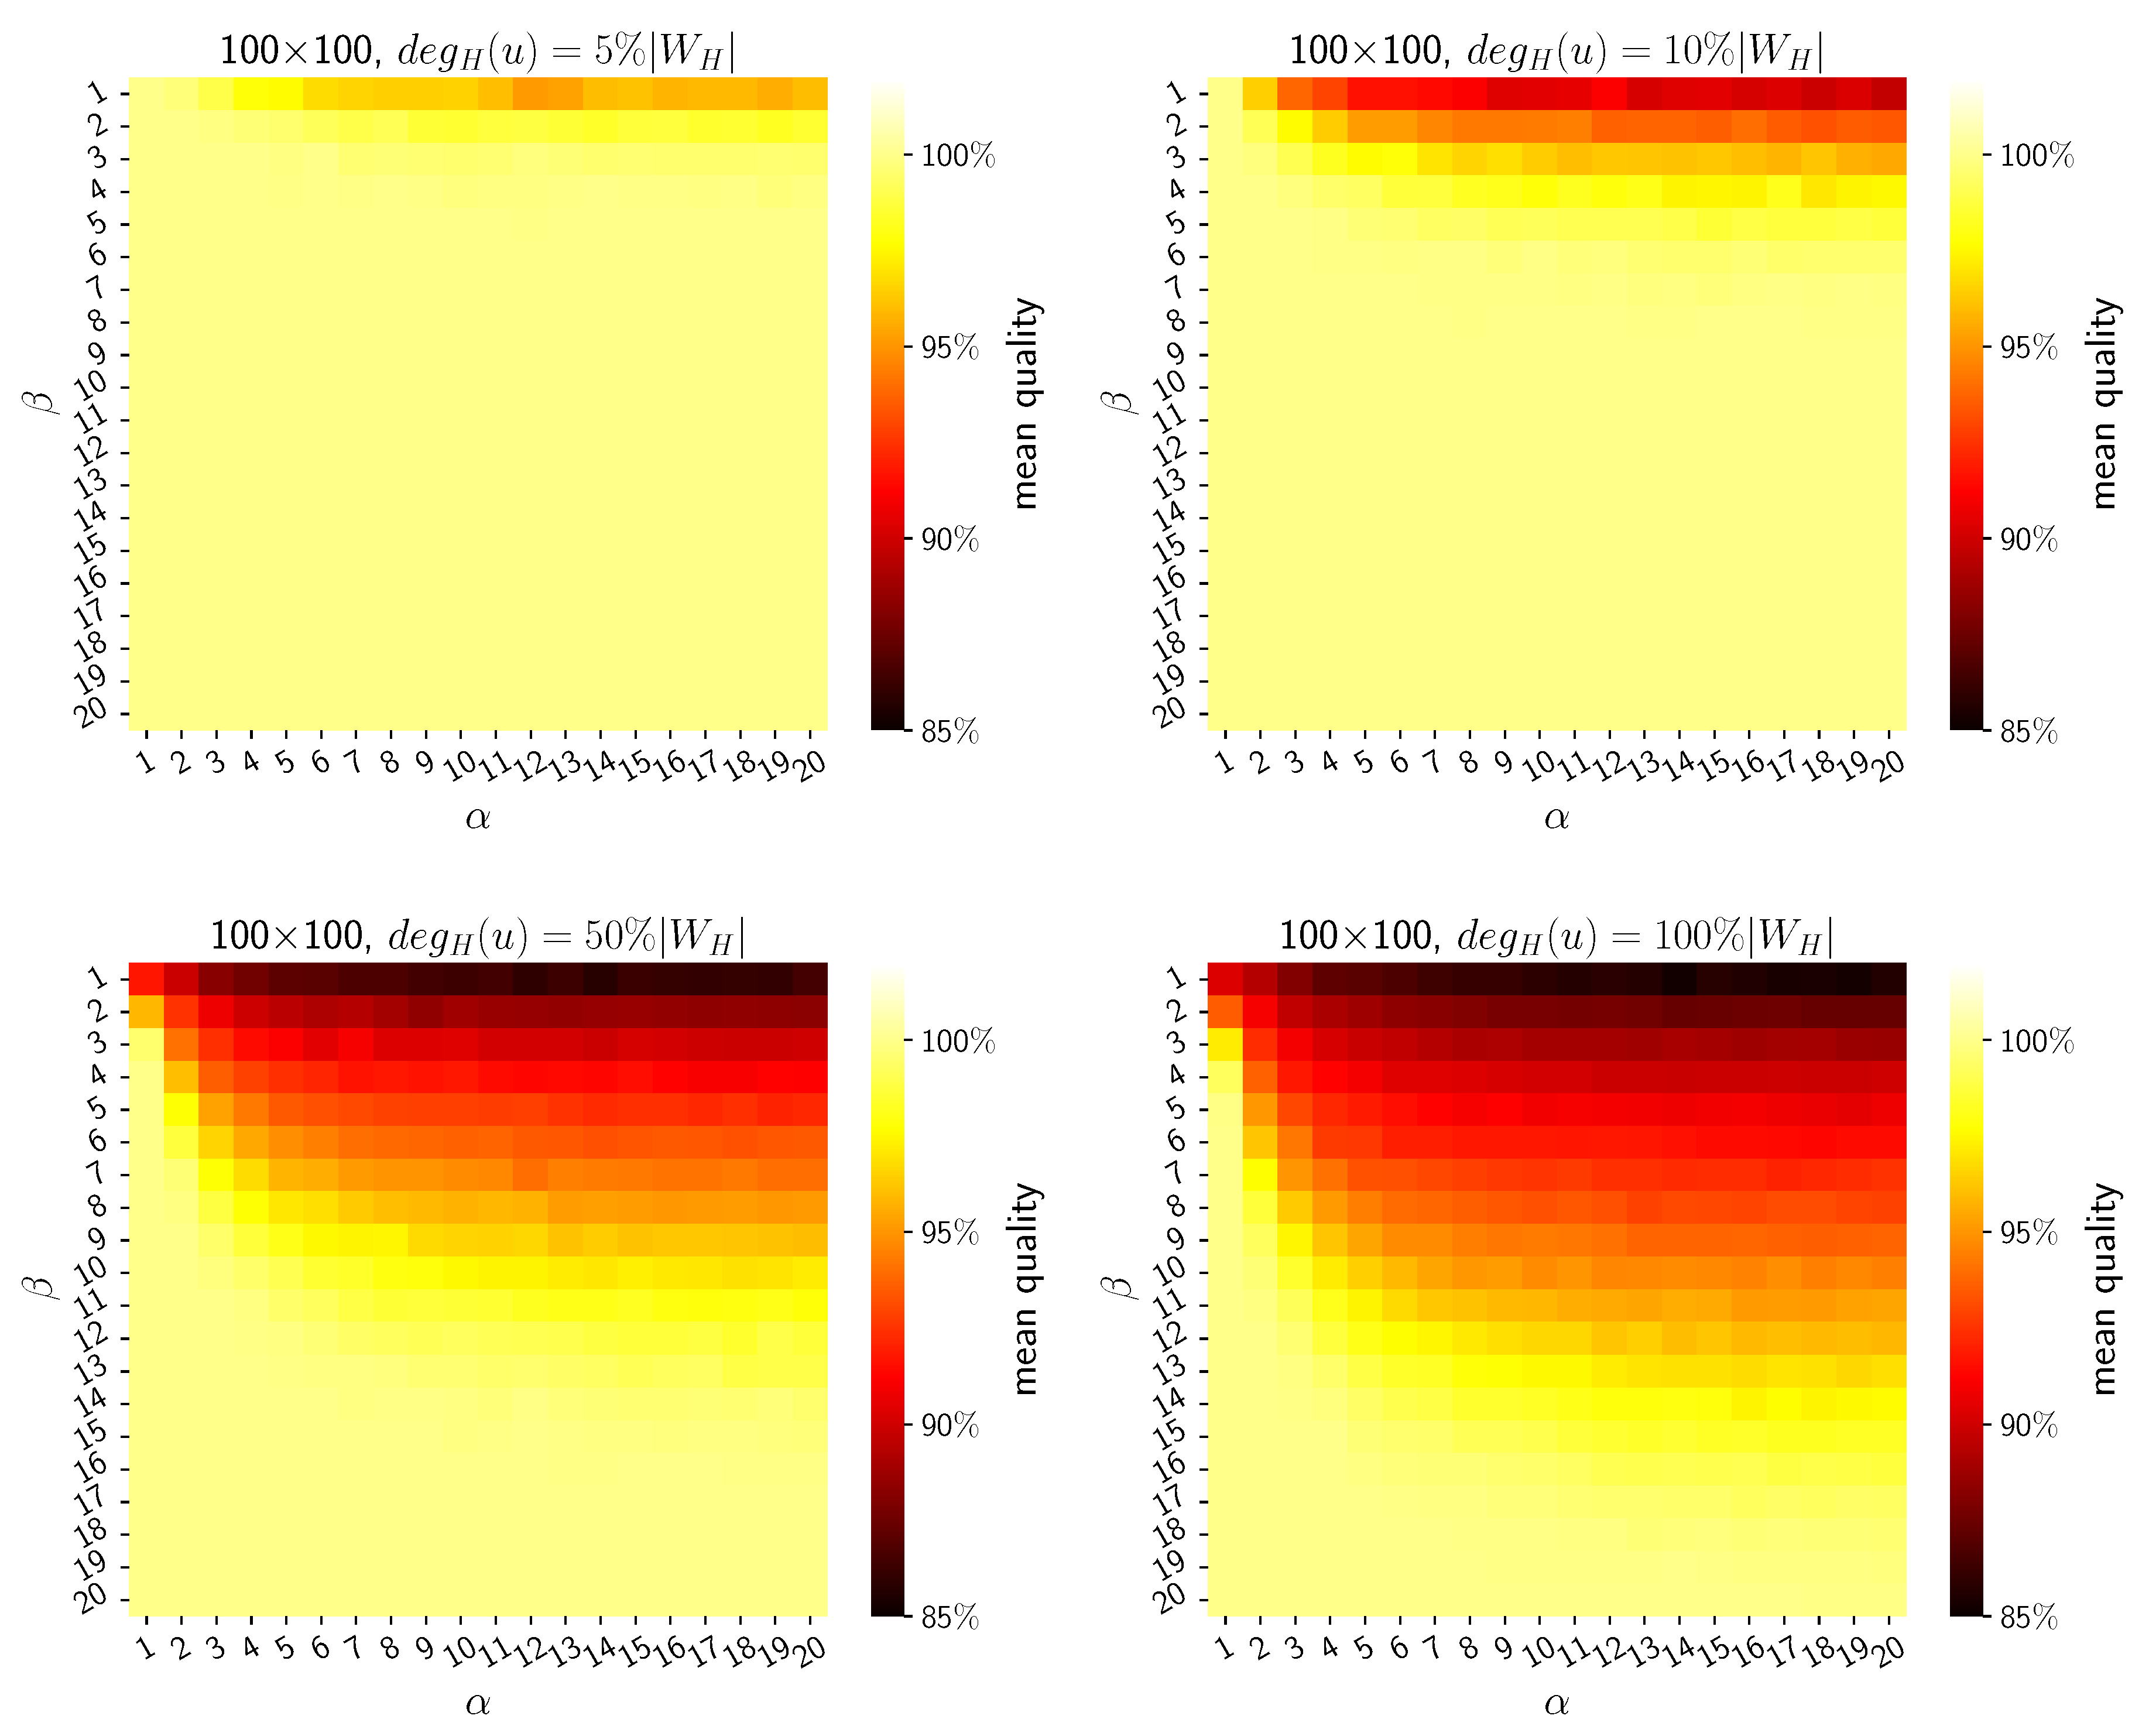
Figure 2 depicts the distributions of mean quality of ACO’s method depending on the problem’s size and values of hyperparameters α and β . The mean quality value is obtained for 30 randomly generated bipartite test graphs, considering varying sparsity. The construction of test graphs incorporated the specification that each graph contains only one optimal solution, aiming for a precise assessment of algorithmic efficacy. The ACO method’s parameters are as follows: a total number of ants equals 20 (the ACO algorithm’s time complexity depends, among other factors, on the number of ants; as the number of ants increases, the algorithm’s runtime also increases. Therefore, a huge number was not considered). The number of iterations is 100, but the algorithm does not always run for all iterations because it implements an intelligent termination condition. The procedure terminates when an optimum solution is found (if it exists) or if the difference in solution quality remains less than or equal to 10 15 for the consecutive 15 (value selected experimentally) iterations.
The method consistently demonstrates robust stability, evidenced by a maximum standard deviation of solution quality at 2.2% among all results. This indicates that the outcomes remain consistent when the method is applied to similar input data. This parameter analysis allows for identifying characteristics and trends associated with their configuration, allowing the heuristic method to perform well. The higher the graph’s density, the more significant the selection of parameters becomes. Specifically, the higher value of the β parameter should be selected about α . High values of parameter α in the ACO algorithm can cause the algorithm to overly rely on pheromone trails, potentially leading to getting stuck in local optima and hindering the exploration of alternative solutions. In dense graphs, high values of the parameter β in the ACO algorithm become significant because they emphasize the importance of the heuristic information η in guiding the ants’ exploration. With many edges in dense graphs, ants have more paths to consider. By increasing β , the algorithm prioritizes paths, which helps ants efficiently navigate through the dense graph structure, potentially leading to faster convergence towards optimal solutions.
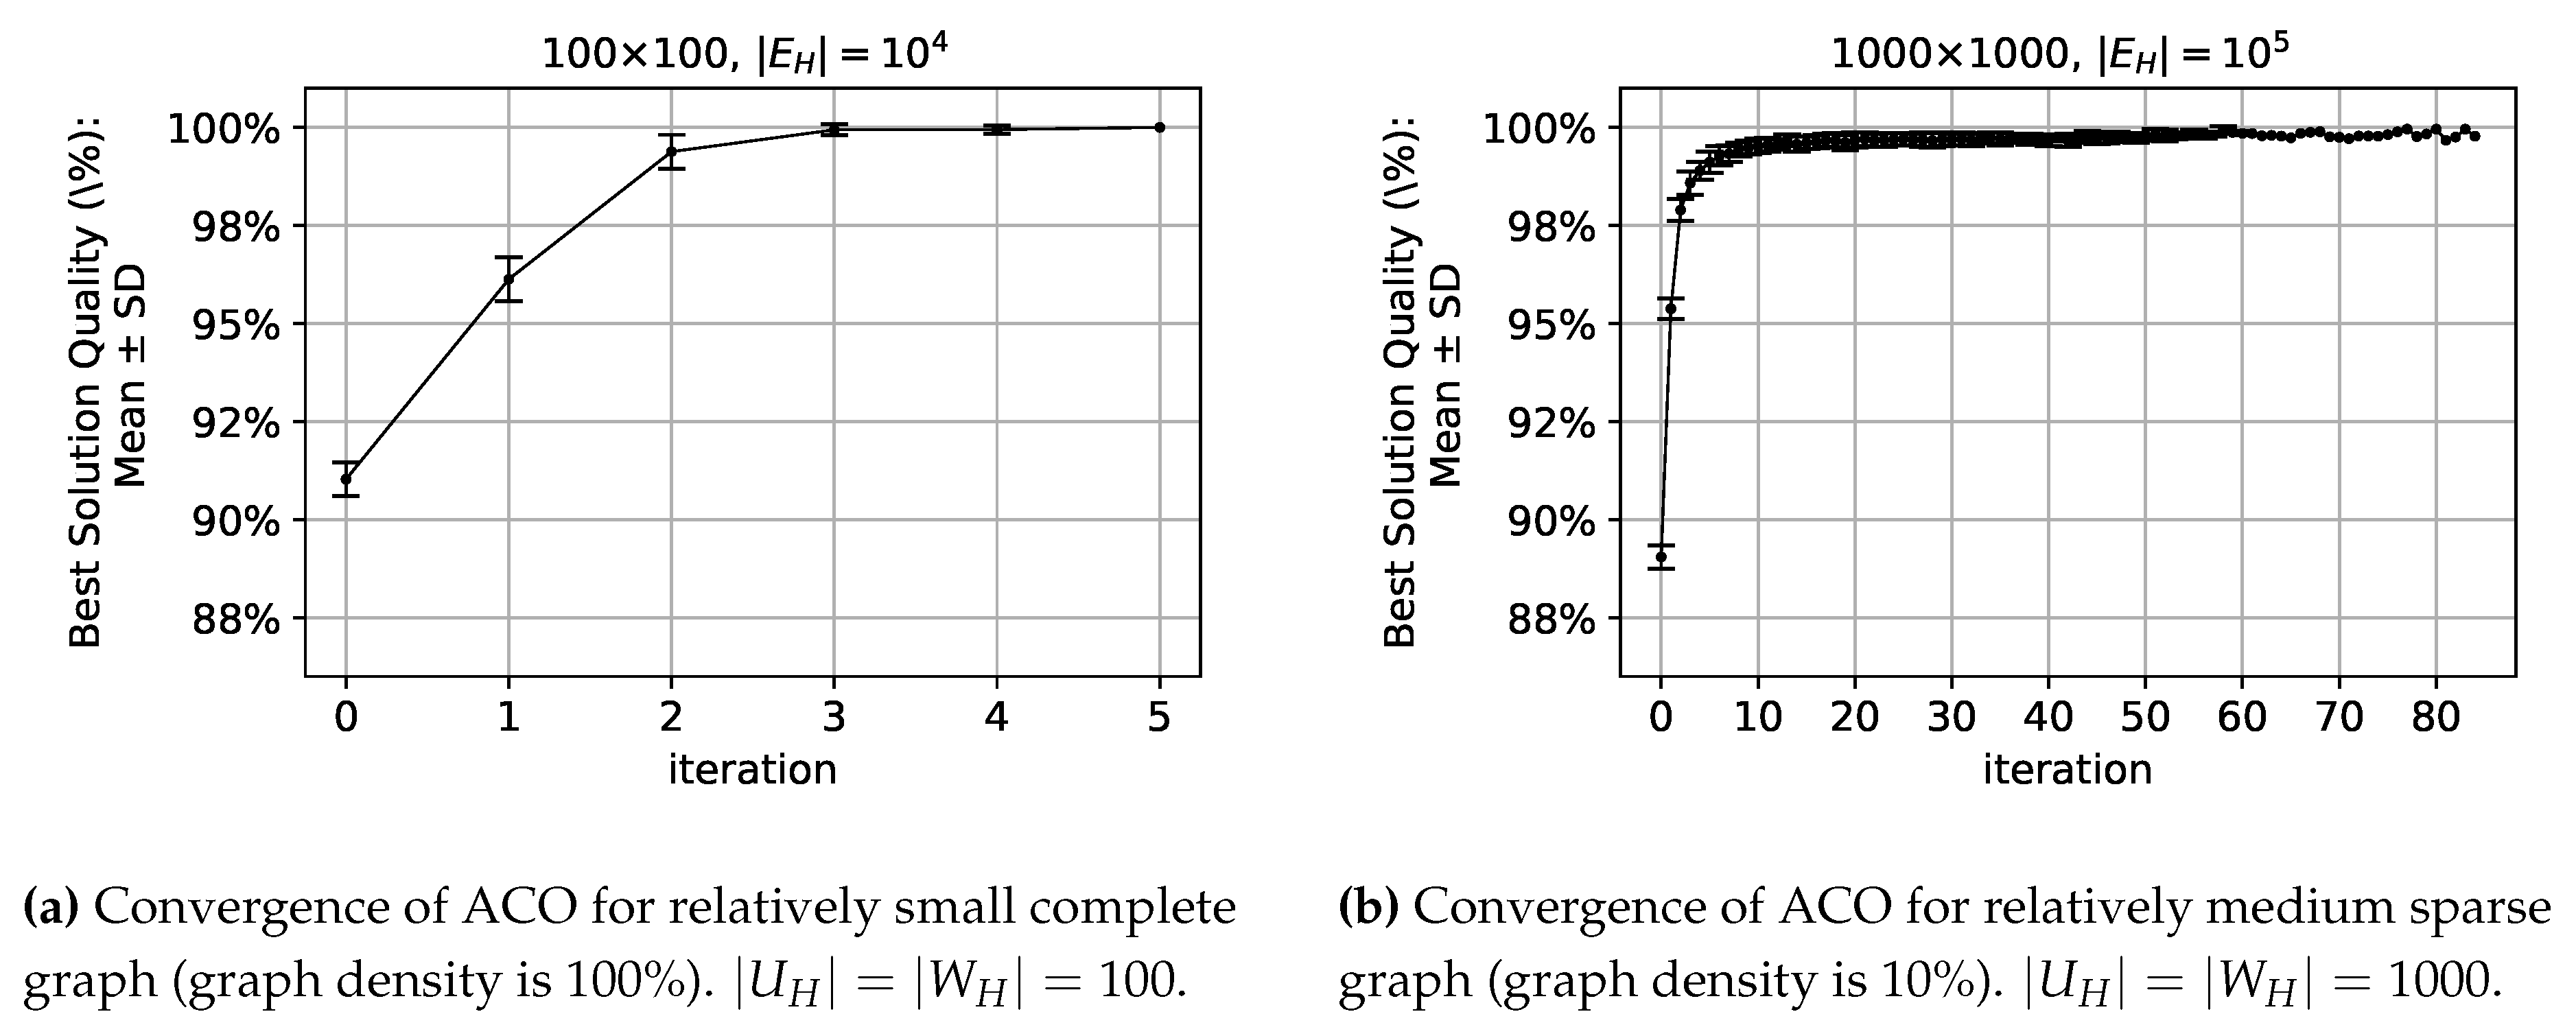
ACO’s algorithm behaviour, like stability and convergence for problem instances of different sizes, are demonstrated in Figure 3. The figure presents the mean and standard deviation of the best solution in each iteration for a population of 30 random test graphs. Results illustrate the improvement in the solution with subsequent iterations, confirming the effectiveness of the pheromone deposition strategy 14, which enhances the solution in subsequent algorithm iterations. Furthermore, in the following iterations of the algorithm, a decreasing standard deviation indicates a reduction in the variation among the best solutions found. For relatively small complete graphs, the algorithm finds optimum up to the 5th iteration 3a. A tenfold increase in vertices and edges significantly extends the time needed to find the optimal solution, necessitating more algorithm iterations 3b.
Table 5 presents the mean and standard deviation of the running time and accuracy for the heuristic ACO method and the exact EK method for relatively large problems, e.g., a graph with the total number of edges equal up to 10 million. The test cases represent the relay selection problem, considering that the ratio of weak nodes to candidate relay nodes is negligible since the number of weak nodes in a properly designed network generally constitutes just a few percent of all devices. Additionally, weak nodes may be dispersed across the entire network and not share the same relay candidates within their range, making the test cases considered sparse graphs.
The results indicate that the heuristic method ACO can operate up to more than twice as fast as the exact method EK while maintaining an accuracy of 98%. Therefore, for problems of such characteristics, the proposed ACO algorithm represents an alternative to the exact method.

5. Performance Evaluation

This section presents the performance evaluation of proposed relay device selection algorithms using a simulation environment. I compare the proposed heuristic ACO scheme alongside the exact EK scheme and the well-known relay selection method [18], which is similar to the proposed approach. The evaluation uses the simulation environment to operate LoRa networks with a relay device functionality for various multi-gateway network topology scenarios involving thousands of nodes detailed in subsection 5.1. The discrete event simulation environment, the Objective Modular Network Testbed in C++ (OMNeT++), was utilized to simulate the LoRa network operation. This model iteration builds upon the framework presented in a previous investigation [33], which concentrated on collision probability derived from radio signal propagation models accessible in OMNeT++. In this study, a simulation model detailed in the paper [17] is utilized.

5.1. Simulation Scenarios

Diverse multi-gateway randomly generated network topology scenarios involving thousands of devices were utilized to evaluate methods through simulations. Table 6 presents network topologies scenarios’ details, i.e., the total number of nodes, area, and percentage of weak nodes. Scenarios R(1000,3) and R(1000,5) account over 600 nodes per 1 k m 2 , while R(1500,3) and R(1500,5) feature around 160 nodes per 1 k m 2 . Therefore, the topologies include areas with lower and higher node density in space. Among the end nodes, a percentage of 3% and 5% are randomly selected as weak nodes. Each network topology scenario also includes LoRa gateways selected through a procedure from [34].

5.1.1. Experiment Scenarios

The experiments are divided into two parts: extensive and a demonstrative case, which are differentiated by the network devices’ initial battery levels. In the first group of experiments, all devices start with the same battery level. The second type of experiment is a demonstrative case involving a scenario where the devices’ initial battery levels vary. The extensive experiments and a demonstrative case are detailed below.

Extensive case

The initial battery level for all network end devices is the same and allows for transmission with the most pessimistic spreading factor SF=12 throughout the entire operational period of the network.
The study analyzes 30 random network topologies for each topology scenario listed in Table 6, totaling 120 network topologies. For each of these 30 topologies within every network topology scenario, three sets of relay nodes are selected using the ACO, EK, and reference [18] methods. Subsequently, simulations of each network’s operation over ten years are performed independently to measure the network-wide energy consumption for each of the three topologies. The simulation model incorporates various SF values on which the devices operate.

Demonstrative case

The initial battery level differs for all network end devices. It depends on the SF value that the device is configured to operate on throughout the entire operational period of the network. This strategy is related to the concept of manufacturers supplying devices adapted to specific areas. This enforces the device configuration for a designated SF and prevents the waste of excess energy allocated to devices that cannot consume it throughout their entire service life.
The experiment involves one 10-year period simulation run for topology scenario R(1500, 3). Each end device is assigned an initial battery capacity based on its SF and a random extra energy drawn according to a uniform distribution. Some devices can use the additional energy surplus to act as relays, but only some have enough surplus energy to perform this role.
The aim of this experiment is to illustrate the effectiveness of the proposed ACO (and also EK) energy-saving method in comparison to the reference method [18] for preventing battery depletion.

5.1.2. Results

Table 7 presents the results for the extensive case group of experiments. It involves simulations run side by side, differing in the set of relays selected for network 10-year operation time, using ACO and EK, and the reference [18] methods. Within a single topology scenario, differences in the average energy consumption in the network for various relay selection methods occur at 10 3 . The experimental results show that the methods give similar outcomes. The level of energy consumption in the network is similar, which proves that sets of relay devices selected independently by all methods are of similar quality.
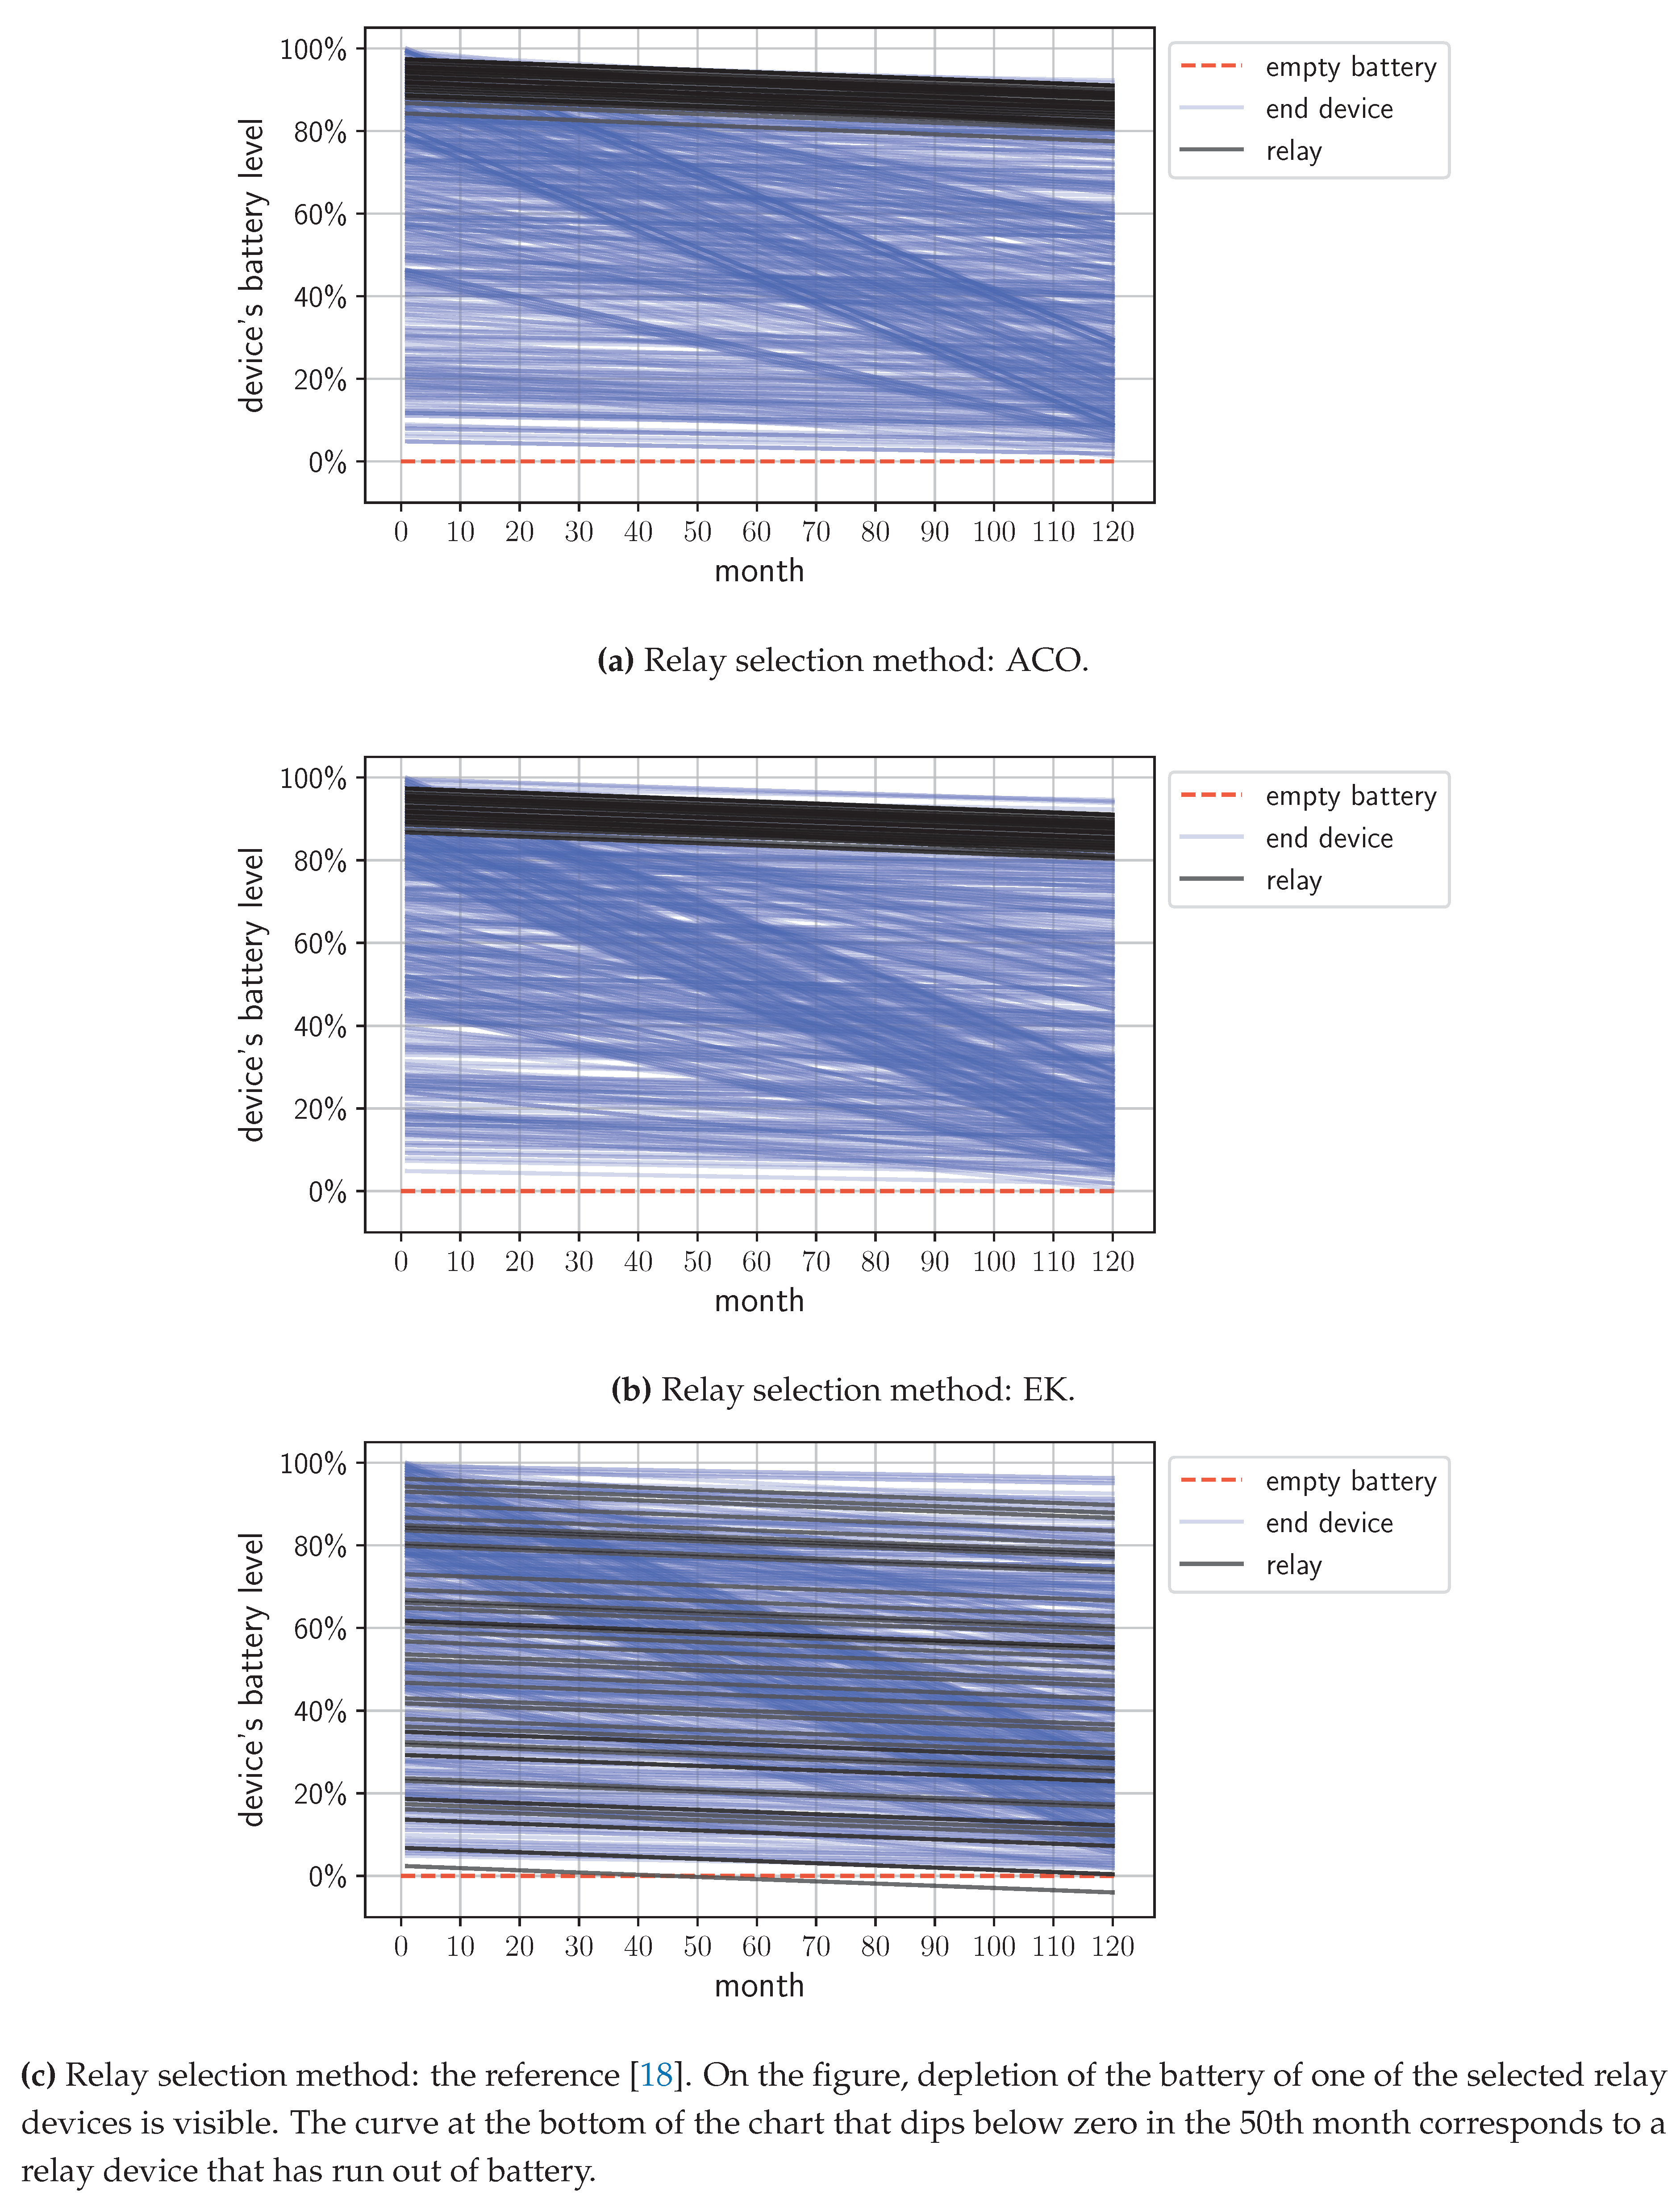
However, the proposed methods ACO and EK are specially adapted to LoRa technology; therefore, they are better optimized for this specific environment, especially for battery-powered devices. The proposed methods allow for more effective network energy management by incorporating the devices’ energy consumption analysis. This aspect is crucial for battery-powered LoRa devices because it prevents battery depletion and packet loss. Figure 4 depicts the simulation results for a demonstrative case utilizing R(1500, 3) topology scenario. The figure specifically shows the change in the battery level of network devices operating over ten years for three independent simulation runs, each differing in the set of relay-type devices selected by ACO, EK, and the reference [18] methods, appropriately.
Curves corresponding to relay devices are marked on the chart in a different color (black) than the rest of the end devices. It can be observed that the resulting sets of relay nodes selected by the heuristic and exact methods are alike. The proposed methods ACO and EK prefer devices with a solid energy reserve, unlike the reference method, which does not consider energy budget analysis. The chart shows that the proposed ACO and EK methods selected nodes with high energy surplus as relays. The battery level curves for the group of relay nodes start from high values. The reference method [18] result leads to battery depletion (indicated by a line dropping below zero), as shown in Figure 4c. An algorithm’s improper selection of relays, which are at risk of depleting their battery life, poses a significant issue. Such a scenario leads to the loss of data not only from the end node being served by the relay but also from the relay itself.
Furthermore, the ACO and EK methods promote nodes with a relatively low SF to the access point as relay devices. This choice is evident from the gentle slope of the battery level change curves. A flatter slope indicates lower SFs in the communication between weak node-relay-gateway, which is associated with the lowest energy consumption.

6. Discussion

This work proposes a novel nature-inspired energy-efficient relay selection scheme for LoRa-based LPWAN technology. It presents a heuristic approach based on Ant Colony Optimization alongside an exact algorithm, both innovatively designed with custom components for the specific challenges of relay selection in LoRa networks. It considers critical technological aspects like SF and energy budget analysis, which are crucial for battery-powered IoT devices. Experimental results show that the heuristic approach operates up to twice as fast as the exact method, with a negligible accuracy loss of less than 2%, as shown on large-scale graphs (with up to 1 million edges). Therefore, the heuristic approach offers a flexible alternative to the exact method, especially for sizable sparse graphs.
Furthermore, comprehensive simulation experiments were conducted, encompassing various scenarios within multi-gateway topologies consisting of thousands of devices operating across different spreading factors. Simulation results show that the proposed approach outperforms the well-known reference method in terms of providing to keep relay device batteries from running out. The proposed method is well-suited for high-demand deployments where devices transmit signals relatively frequently. Assigning exactly one weak node to serve by a single relay and promoting relays with significant energy surplus allows for better scalability and efficiency without overwhelming the network or causing contention with other nodes.
Finally, the proposed approach opens up new perspectives for further LoRa development, like network self-healing, the idea of a system that autonomously responds to faults or failures through dynamic switching devices to relay mode. Moreover, this approach’s adaptability extends to network topology management in response to changes within its infrastructure, such as installing new devices. This adaptability facilitates seamless integration and optimization of network resources, ensuring robust and efficient connectivity even as the network evolves.

References

  1. Mekki, K.; Bajic, E.; Chaxel, F.; Meyer, F. A comparative study of LPWAN technologies for large-scale IoT deployment. ICT express 2019, 5, 1–7. [Google Scholar] [CrossRef]
  2. Ikpehai, A.; Adebisi, B.; Rabie, K.M.; Anoh, K.; Ande, R.E.; Hammoudeh, M.; Gacanin, H.; Mbanaso, U.M. Low-power wide area network technologies for Internet-of-Things: A comparative review. IEEE Internet of Things Journal 2018, 6, 2225–2240. [Google Scholar] [CrossRef]
  3. Semtech Corporation. LoRa® Technology | Semtech. https://www.semtech.com/lora/what-is-lora, 2023. Accessed on April 3, 2024.
  4. Vangelista, L. Frequency shift chirp modulation: The LoRa modulation. IEEE signal processing letters 2017, 24, 1818–1821. [Google Scholar] [CrossRef]
  5. Alliance, L. LoraWAN Relay Specification TS011-1.0.0. https://resources.lora-alliance.org/technical-specifications/ts011-1-0-0-relay, 2022. [Online; accessed 27-November-2023].
  6. Xu, W.; Cai, G.; Fang, Y.; Chen, G. Performance Analysis of a Two-Hop Relaying LoRa System. 2021 IEEE/CIC International Conference on Communications in China (ICCC). IEEE, 2021, pp. 540–545.
  7. He, Q.; Lan, T.; Li, J.; Yuan, X.; Hu, Y. A Wireless Relay Assisted LPWAN for Condition Monitoring of Converter Stations. 2021 IEEE 6th International Conference on Signal and Image Processing (ICSIP). IEEE, 2021, pp. 898–902.
  8. Sanfratello, A.; Mingozzi, E.; Marcelloni, F. Enabling relay-based communication in LoRa networks for the Internet of Things: design implementation and experimental evaluation. Pisa, Italy, 2016.
  9. Sisinni, E.; Ferrari, P.; Fernandes Carvalho, D.; Rinaldi, S.; Marco, P.; Flammini, A.; Depari, A. LoRaWAN Range Extender for Industrial IoT. IEEE Transactions on Industrial Informatics 2020, 16, 5607–5616. [Google Scholar] [CrossRef]
  10. Borkotoky, S.S.; Schilcher, U.; Bettstetter, C. Cooperative Relaying in LoRa Sensor Networks. 2019 IEEE Global Communications Conference (GLOBECOM), 2019, pp. 1–5. [CrossRef]
  11. Barrachina-Muñoz, S.; Bellalta, B.; Adame, T.; Bel, A. Multi-hop communication in the uplink for LPWANs. Computer Networks 2017, 123, 153–168. [Google Scholar] [CrossRef]
  12. Sisinni, E.; Carvalho, D.F.; Ferrari, P.; Flammini, A.; Silva, D.R.C.; Da Silva, I.M.D. Enhanced flexible LoRaWAN node for industrial IoT. 2018 14th IEEE International Workshop on Factory Communication Systems (WFCS), 2018, pp. 1–4. [CrossRef]
  13. Xu, W.; Cai, G.; Fang, Y.; Mumtaz, S.; Chen, G. Performance Analysis and Resource Allocation for a Relaying LoRa System Considering Random Nodal Distances. IEEE Transactions on Communications 2022, 70, 1638–1652. [Google Scholar] [CrossRef]
  14. Xu, W.; Cai, G.; Fang, Y.; Chen, G. Performance Analysis of a Two-Hop Relaying LoRa System. 2021 IEEE/CIC International Conference on Communications in China (ICCC), 2021, pp. 540–545. [CrossRef]
  15. Lee, S.; Lee, J.; Park, H.S.; Choi, J.K. A Novel Fair and Scalable Relay Control Scheme for Internet of Things in LoRa-based Low-Power Wide-Area Networks. IEEE Internet of Things Journal 2020. [Google Scholar] [CrossRef]
  16. Mugerwa, D.; Nam, Y.; Choi, H.; Shin, Y.; Lee, E. SF-Partition-Based Clustering and Relaying Scheme for Resolving Near-Far Unfairness in IoT Multihop LoRa Networks. Sensors 2022, 22. [Google Scholar] [CrossRef] [PubMed]
  17. Grochla, K.; Strzoda, A.; Marjasz, R.; Głomb, P.; Książek, K.; askarzewski, Z. Energy-Aware Algorithm for Assignment of Relays in LP WAN 2022. 18. [CrossRef]
  18. Li, Y.; Liao, C.; Wang, Y.; Wang, C. Energy-Efficient Optimal Relay Selection in Cooperative Cellular Networks Based on Double Auction. IEEE Transactions on Wireless Communications 2015, 14, 4093–4104. [Google Scholar] [CrossRef]
  19. Ma, B.; Shah-Mansouri, H.; Wong, V.W.S. A matching approach for power efficient relay selection in full duplex D2D networks. 2016 IEEE International Conference on Communications (ICC), 2016, pp. 1–6. [CrossRef]
  20. Kuhn, H.W. The Hungarian method for the assignment problem. Naval research logistics quarterly 1955, 2, 83–97. [Google Scholar] [CrossRef]
  21. Ochoa, M.N.; Guizar, A.; Maman, M.; Duda, A. Evaluating LoRa energy efficiency for adaptive networks: From star to mesh topologies. 2017 IEEE 13th International Conference on Wireless and Mobile Computing, Networking and Communications (WiMob). IEEE, 2017, pp. 1–8. [CrossRef]
  22. Cai, J.; Shen, X.; Mark, J.W.; Alfa, A.S. Semi-distributed user relaying algorithm for amplify-and-forward wireless relay networks. IEEE Transactions on Wireless Communications 2008, 7, 1348–1357. [Google Scholar] [CrossRef]
  23. Korte, B.H.; Vygen, J.; Korte, B.; Vygen, J. Combinatorial optimization; Vol. 1, Springer, 2011.
  24. Galil, Z. Efficient algorithms for finding maximum matching in graphs. ACM Computing Surveys (CSUR) 1986, 18, 23–38. [Google Scholar] [CrossRef]
  25. Dorigo, M.; Birattari, M.; Stutzle, T. Ant colony optimization. IEEE Computational Intelligence Magazine 2006, 1, 28–39. [Google Scholar] [CrossRef]
  26. Casals, L.; Mir, B.; Vidal, R.; Gomez, C. Modeling the energy performance of LoRaWAN. Sensors 2017, 17, 2364. [Google Scholar] [CrossRef] [PubMed]
  27. Corporation, S. SX1272/3/6/7/8: LoRa Modem Designer’s Guide AN1200.13. Accessed: 06.08.2019.
  28. LoRa Alliance. LoRaWAN Regional Parameters RP002-1.0.4. https://resources.lora-alliance.org/technical-specifications/rp002-1-0-4-regional-parameters, 2024. Accessed on: February 2, 2024.
  29. Gao, W.; Du, W.; Zhao, Z.; Min, G.; Singhal, M. Towards Energy-Fairness in LoRa Networks. 2019 IEEE 39th International Conference on Distributed Computing Systems (ICDCS), 2019, pp. 788–798. [CrossRef]
  30. Cormen, T.H.; Leiserson, C.E.; Rivest, R.L.; Stein, C. Introduction to algorithms; MIT press, 2022.
  31. Maximum Weight Matching. https://networkx.org/documentation/stable/reference/algorithms/generated/networkx.algorithms.matching.max_weight_matching.html#id1. [Online; accessed 09-January-2024].
  32. Jungnickel, D. Weighted matchings. Graphs, Networks and Algorithms 2008, pp. 419–456.
  33. Marjasz, R.; Grochla, K.; Strzoda, A.; Laskarzewski, Z. Simulation Analysis of Packet Delivery Probability in LoRa Networks. Computer Networks; Gaj, P.; Sawicki, M.; Kwiecień, A., Eds. Springer International Publishing, 2019, pp. 86–98. [CrossRef]
  34. Frankiewicz, A.; Glos, A.; Grochla, K.; Łaskarzewski, Z.; Miszczak, J.; Połys, K.; Sadowski, P.; Strzoda, A. LP WAN gateway location selection using modified k-dominating set algorithm. Modelling, Analysis, and Simulation of Computer and Telecommunication Systems: 28th International Symposium, MASCOTS 2020, Nice, France, November 17–19, 2020, Revised Selected Papers 28. Springer, 2021, pp. 209–223.
Figure 1. Edge weight function 12 distribution depending on SF parameters S F u w and S F w g for weak node u U H and relay candidate w W H .
Preprints 104301 g001
Figure 2. Distribution of ACO’s mean solution quality, depending on the problem’s size and method’s hyperparameters α and β . The sparse and complete bipartite graphs has been included.
Preprints 104301 g002
Figure 3. Convergence of ACO algorithm for problems of varying sizes, specifically the mean and standard deviation of the best solution at each iteration.
Preprints 104301 g003
Figure 4. Change in device battery level consumption during the network’s operation over a 10-year period. The figures show battery life for relay devices and other network end devices.
Preprints 104301 g004
Table 1. Energy consumption for a single packet’s transmission and reception depending on SF.
SF Packet ToA [s] ( T p a c k e t ) E T X [mAs] E R X [mAs]
7 0.118 4.366 0.767
8 0.215 7.955 1.3975
9 0.39 14.43 2.535
10 0.698 25.826 4.537
11 1.56 57.72 10.14
12 2.796 103.452 18.174
Table 2. Computational cost and multiplicity of the significant components in the Algorithm 1
component cost and multiplicity
7: A v a i l k ( U H ) ( i ) U H c 1 · n 1
8: A v a i l k ( W H ) ( i ) { 1 } | W H | c 2 · n 2
9: Algorithm 2 c 3 · j = 1 n 1 + 1 j + c 4 · j = 1 n 1 ( j + n 2 ) (based on Table 3)
17: update pheromone level based on [14] c 5 · n 1
Table 3. Computational cost and multiplicity of the significant components in Algorithm 2 within a while loop 4.
component cost and multiplicity
4: while  | A v a i l ( U H ) k ( i ) | > 0 c 3 · j = 1 n 1 + 1 j
6: choose vertex w N u k ( i ) based on p u w k [13] c 6 · j = 1 n 1 n 2
9: A v a i l k ( U H ) ( i ) A v a i l k ( U H ) ( i ) { u } c 7 · j = 1 n 1 j
Table 4. Computational complexity of rely device selection methods, i.e., heuristic apporach ACO, exact approach EK [24] and reference [18].
Method Computational complexity
ACO O ( t · m · E H )
EK [24] 1 O ( V H 3 )
Reference [18] 2 O ( V H 3 )
14.1cm 1 [31], 2 [32]
Table 5. The average and standard deviation of the running time and accuracy of the heuristic ACO method versus the exact method EK for large sparse graphs.
U H × W H Graph density Avg. Time [s] ACO Avg. Time [s] EK ACO Avg. Time Savings Avg. Accuracy ACO Avg. Accuracy EK
10 3 × 10 4 5 % 752 ( ± 12 ) 1782 ( ± 267 ) 58 % 99 % ( ± 0.0002 ) 100 %
10 % 1709 ( ± 75 ) 3889 ( ± 818 ) 56 % 98 % ( ± 0.01 ) 100 %
10 3 × 10 5 5 % 12971 ( ± 897 ) 15296 ( ± 23 ) 15 % 99 % ( ± 0.0009 ) 100 %
10 % 29556 ( ± 1997 ) 41935 ( ± 9772 ) 30 % 97 % ( ± 0.002 ) 100 %
Table 6. LoRa network topology scenarios utilized in simulations.
Network topology scenario Total nbr. of nodes Area [m] Weak nodes
R(1000,3) 1000 1000 × 1500 3 %
R(1000,5) 1000 1000 × 1500 5 %
R(1500,3) 1500 2500 × 3750 3 %
R(1500,5) 1500 2500 × 3750 5 %
Table 7. Results of side-by-side runs of the proposed methods (ACO and EK) and reference [18] algorithm. Specifically, the mean and standard deviation of energy usage in the whole network with a set of relays selected by those three methods in each simulation scenario. The statistics are calculated for a population of 30 randomly generated network topologies.
Network topology scenario Method Mean battery usage (%) Standard deviation (%)
R(1000,3) EK 5.9550 1.2871
ACO 5.9550 1.2870
Referential [18] 5.9546 1.2868
R(1000,5) EK 6.2125 1.4176
ACO 6.2125 1.4176
Referential [18] 6.2123 1.4179
R(1500,3) EK 25.7492 0.7899
ACO 25.7480 0.7894
Referential [18] 25.7494 0.7898
R(1500,5) EK 25.4126 0.7799
ACO 25.4122 0.7803
Referential [18] 25.4180 0.7755
Disclaimer/Publisher’s Note: The statements, opinions and data contained in all publications are solely those of the individual author(s) and contributor(s) and not of MDPI and/or the editor(s). MDPI and/or the editor(s) disclaim responsibility for any injury to people or property resulting from any ideas, methods, instructions or products referred to in the content.
Copyright: This open access article is published under a Creative Commons CC BY 4.0 license, which permit the free download, distribution, and reuse, provided that the author and preprint are cited in any reuse.
Prerpints.org logo

Preprints.org is a free preprint server supported by MDPI in Basel, Switzerland.

Subscribe

© 2024 MDPI (Basel, Switzerland) unless otherwise stated