1. Introduction
Pharmacological, toxicological and pharmacokinetics preclinical studies are essential for any developing biopharmaceutical and must follow the guidelines of the International Conference on Harmonization of Technical Requirements for Registration of Pharmaceuticals for Human Use (ICH) Document S6, S6 Preclinical Safety Evaluation of Biotechnology-Derived Pharmaceuticals, from 1997 [
1]. In 2010, a specific guidance called Nonclinical Evaluation for Anticancer Pharmaceuticals was released [
2]. According to the document, a successful nonclinical experiment should consider important details as pharmacologic properties of the drug, non-toxic doses for future extrapolation to humans and a toxicological profile to identify damage to specific organs and reversible/irreversible effects. In addition, in 2012 an S6 Addendum to Preclinical Safety Evaluation of Biotechnology-Derived Pharmaceuticals was published with complementary, useful and updated recommendations for
in vivo assays.
In this context, well detailed nonclinical trials for a novel asparaginase biopharmaceutical are critical for future successful clinical trials. Actually, L-asparaginase enzyme for bacteria, commonly known as ASNase, is worldwide used to treat blood cancer, such as well succeeded therapy for acute lymphoblastic leukaemia (ALL) in children and adolescent. First approved FDA enzymes were ASNases from
Escherichia coli (EcA) and
Erwinia chrysanthemi (ErA) in 1978 and 2011, respectively. However, side effects related to their use, mainly on adult patients, such as neurotoxicity, pancreatitis, hypersensitivity or even anaphylactic shock [
3] compel the need for improved versions of this enzyme. In this sense, preclinical toxicological and immune assays are crucial to go further with the clinical trials. Studies with different ASNases on several biomodels are reported on literature under different treatment schemes [
4,
5,
6,
7,
8]. In this sense, herein we proposed a detailed study to complement a previous reported study with double mutant P40S/S206C [
9] and its separated mutations (P40S and S206C) to better characterize the specific effect of them on animals.
Several studies are being carried out looking for better catalytic properties of ASNase to overcome side effects, including prospection of new ASNase sources or development of biobetters [
4,
10,
11,
12]. Protein bioengineering has emerged as an excellent tool that gives researchers the possibility to create new proteins/enzymes with desired profile, such as improved shelf-live and serum half-life stability, better substrate affinity/selectivity and low immunogenicity [
13]. In this context, our research group has been focused on protein bioengineering techniques to create ASNase-biobetters. Appling this approach, several
E. coli ASNases clones were developed and, after
in vitro and
in vivo assays, it was suggested that the P40S/S206C double mutant could be an interesting ALL treatment option as it presented improved plasma half-life and induced low anti-ASNase antibodies formation [
9]. However, the P40S/S206C double mutant enzyme lost significant specific activity to asparagine hydrolysis and presented high relative glutaminase activity. These features motivated a deeper investigation of the double mutant ASNase P40S/S206C, exploring the individual mutation contributions to its improved resistance, stability, and immune system evasion.
Thus, our goals with this study are to characterize and evaluate biological in vitro activity of single-point mutation ASNase P40S and S206C in comparison with the double mutant from Rodrigues’ work (P40S/S206C). Also, to define whether the encouraging results come from the double mutation interaction or if we could rescue specific activity with a single point mutation, while preserving increased serum half-life and low antibodies production. Additionally, published studies of cytotoxicity assays with mutant ASNases on solid tumours are limited. Hence, we evaluated the potential action of these mutants on immortalized adherent cancer cells viability. Finally, to accomplish a detailed in vivo assay with multiple doses scheme, it was accessed toxicological analysis and measured hypersensitivity and inflammatory responses of these proteoforms. These nonclinical studies are essential to researcher groups for designing and performing a safe and effective treatment scheme for clinical studies in humans.
Our results indicate that mutation P40S was detrimental to enzyme activity and isolated S206C mutant rescued WT ability to hydrolyse asparagine. Nonetheless, both single mutants presented activity against ALL cell line. Interestingly, single mutants presented different behaviours related to activity against solid tumour cell lines, induction of antibody titres and resulted in specific physiologic alterations related to biopharmaceutical toxicity. Overall, the S206C mutant seems to be the best option, but each proteoform contains different features and can be more adequate for different situations and/or patients, reinforcing the importance of generating options of ASNase versions for future personalized therapeutic application.
3. Discussion
Considering the ALL-BFM-IC 2009 protocol that recommends an ASNase dose of 5,000 U/m2 every third day, on days 12, 15, 18, 21, 24, 27, 30, 33 (8 doses) during induction phase, an equivalent scheme in mouse should involve around 5 doses within a 24 days-treatment. Mice used in these experiments aged 6 – 8-week-old, with an average weight of 20 grams and an estimated body surface area of 0.007 m
2 [
17], which correlate with a human adolescent of 13 years-old [
18]. Thus, the animal equivalent dose in mouse should be around 1,900 U/Kg [
19]. However, we decided to use a three concentrated doses scheme, considering that our enzymes formulations did not have stabilizers and osmolytes. Therefore, doses of 1,050 and 5,250 U/Kg were administered to the animals on days 0, 14 and 23 to investigate whether these novel mutants evoke toxic responses in healthy and immunocompetent animals. In this context, discomfort or pain, animal weight and corporal temperature were analysed, as well as organ’s weight, morphology, and histology [
5,
20,
21]. Animal weight loss is associated with toxicity or discomfort since it can be caused by lack of appetite due to pain/allergies. Although, it can also result from behavioural factors such as stress, lack of adaptation or fear, metabolic changes such as malabsorption syndrome or increased physical activity [
22]. Indeed, to guarantee animal’s welfare, in the case of losses equal to or greater than 20% of body weight and lack of water consumption, the humane endpoint should be performed [
22,
23]. Our results suggest no progressive chronic diseases or acute toxicity due to the enzyme administration, since until the end of the experiment significant animal weight loss was not observed in any of the tested groups, they all grew normally.
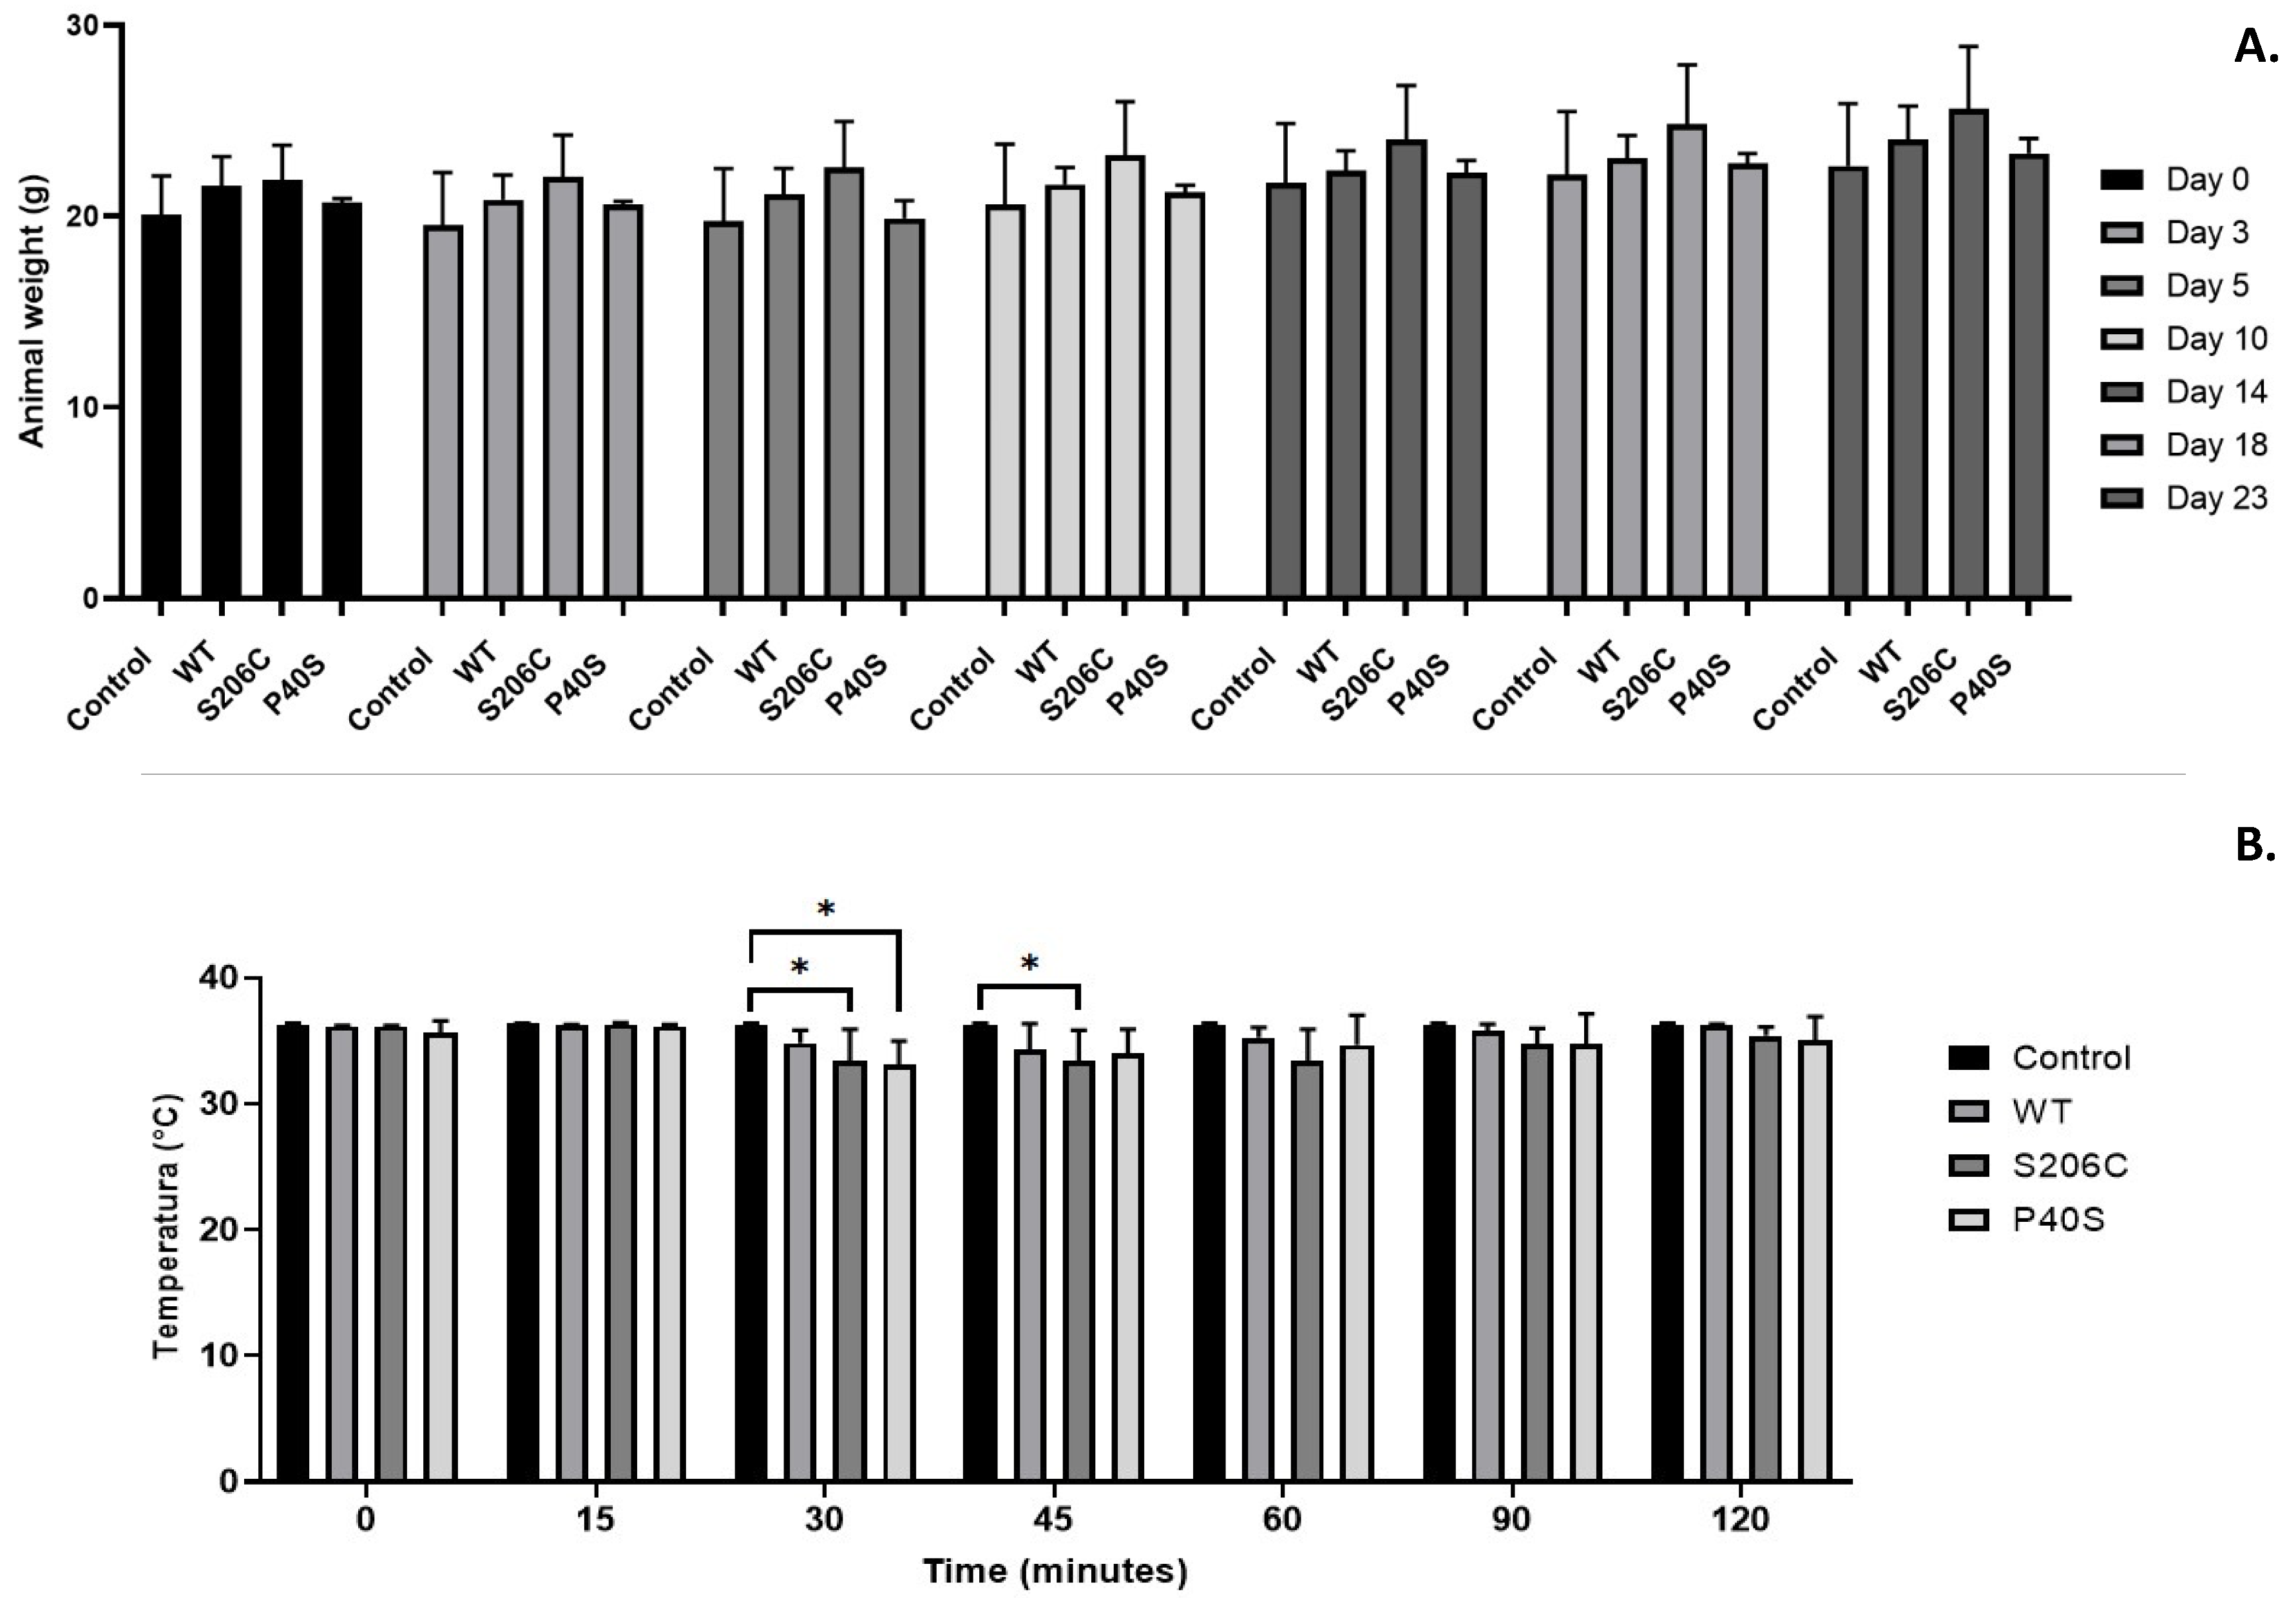
Regarding the analysis of corporal temperature over two hours after each enzymatic formulation injection (days 0, 14 and 23) the first two doses were harmless, and no variation was observed. In contrast, the temperature decreased at the last challenge dose within each group. In general terms, the maximum loss of corporal temperature was 1.9 °C for the WT group, 2.8 °C for the S206C group and 2.6 °C for P40S group. Some authors consider body temperature drop as the first symptom of hypersensitivity reaction [
5,
21]. In that context, except for the control group, all animals had significant drop in body temperature within the first hour after injection; however, temperature was recovered soon after. This means that even at higher doses than the ALL-BFM-IC 2009 protocol recommends these mutant enzymes were not lethal. This could be considered as an induced hypothermia for an initial anaesthetic effect due to the introduction of the “foreign body”, the enzymatic solution, instead of toxicity effect [
24]. Under standard conditions, mice have normal temperatures between 35.5 and 37.5 °C and mild hypothermia range from 32 to 35°C [
25]. Hence, temperature values recorded after the last dose indicate a transient mild hypothermia for around 2 hours. Like weight loss, body temperature drop can be considered as a symptom of animal's discomfort; however, it can also be related to a compensation and protection system [
25]. Hypothermia has neuroprotective effects in ischemia or encephalopathy in animal models and human [
26,
27,
28,
29,
30]. In the case of ischemia, it can reduce the cerebral metabolic rate and preserve energy [
31], reduce the release of free radicals [
32], reduce the formation of cerebral edema and stabilize membranes [
33], and also reduce the rate of apoptosis [
27,
34,
35].
Concerning the blood biometry results, the decrease observed on platelets count may be explained by anti-asparaginase antibodies production. Bougie and collaborators (2010) demonstrated that transient thrombocytopenia can be induced by the presence of anti-drug antibodies. Therefore, anti-asparaginase antibodies may cause thrombocytopenia, with the worst scenario observed in WT group followed for P40S enzyme, although no animal suffered from spontaneous bleeding. Morowski and collaborators (2013) observed that reductions of 70 to 80% of the normal number of platelets do not prevent the correct formation of thrombi in case of injuries or ruptures of veins or small arterioles and that even small amounts of platelets (approximately 3%) are effective in maintaining homeostasis without the presence of spontaneous bleeding [
36]. Based on this, all animals were capable to live without any bleeding complications; even more considering the decreased platelet condition is transitory due to enzyme administration. Our results show that S206C proteoform has the lower impact on platelet count, which can be an advantage to patients with ALL. Also, it is important to mention that higher haematocrit (HCT) percentage on P40S treated animals may be due to dehydration or shock caused by the mutant itself, unlike WT or S206C enzymes effect. In addition, the elevated concentration of granulocytes observed upon P40S ASNase administration may be correlated with enzyme digestion and consequently antigen presentation to the immune system, in agreement with the higher IgG and IgE expression observed.
Michael and colleagues had gathered regulatory guidelines and data from several pharmaceutical companies located in Europe, North America and Japan, regarding toxicity on organs to identify it in rodent. Accordingly, the organs analysed in this work are considered relevant to evaluate drug toxicity. Liver for instance, that reflects physiologic and metabolic distresses, is suitable to identify hepatocellular hypertrophy that matches with histopathological changes, peroxisome proliferation and lipidosis. Also, liver has little animal-to-animal variations and has a primordial function as it is the animal’s primary detoxification organ. Kidneys are frequently a target of toxicity and could reflect acute injuries. Thymus and spleen are essential as they are important indicators of immune toxicities, physiological discomfort, stress and histopathological changes may perfectly correlate with organ weight changes. Also, heart could be valuable by its limited inter-animal variability and its sensitivity to identify toxicity [
37]. In this context, results found in these experiments indicate minor hepatotoxicity, microvesicular steatosis that can result in increased fat accumulation in liver cells, in all enzyme treated groups and an increased organ size, except for the S206C group. This may be caused by an impairment of liver metabolic functions that includes defective fatty acid oxidations, enhanced lipogenesis, irregular triglyceride secretion or increased absorptions of fat acids from the diet [
38,
39]. Hepatic failure, as platelet decrease, may be related with anti-asparaginase antibodies such as IgG and IgE, which also may form and accumulate immune complexes and could be responsible for the increased organ size on WT and P40S enzymes treated groups, unlike S206C exposed group. It is possible that the animals treated with S206C enzyme did not showed an increased organ size due to less recognition of mutant enzyme from host antibodies, as also seen for the double mutant P40S/S206C [
9]. This could mean less accumulation of immune complexes from blood to hepatocytes through the portal vein and, therefore, no liver impairment was produced. Instead, S206C mutation could give the enzyme the ability to escape from hepatocytes and liver macrophages/monocytes from degradation/clearance circumventing its binding to pattern recognition receptors (PRR) as pathogen associated molecular pattern (PAMP) or damage-associated molecular patterns (DAMP). In this sense, avoiding phagocytosis and degradation by lysosomal proteases may prevent S206C liver bioaccumulation or an exacerbated immune response, while maintaining its blood asparaginase activity higher than the other enzymes after injection [
40,
41].
Rathod et al. (2019) identify that ASNase binds mainly to basophils and B cells, and in less amount to neutrophils and macrophages upon two sensitization doses of 10 mg of
E. coli ASNase and challenged with 100 mg on day 24 on 8-week-old female C57BL/6 mice [
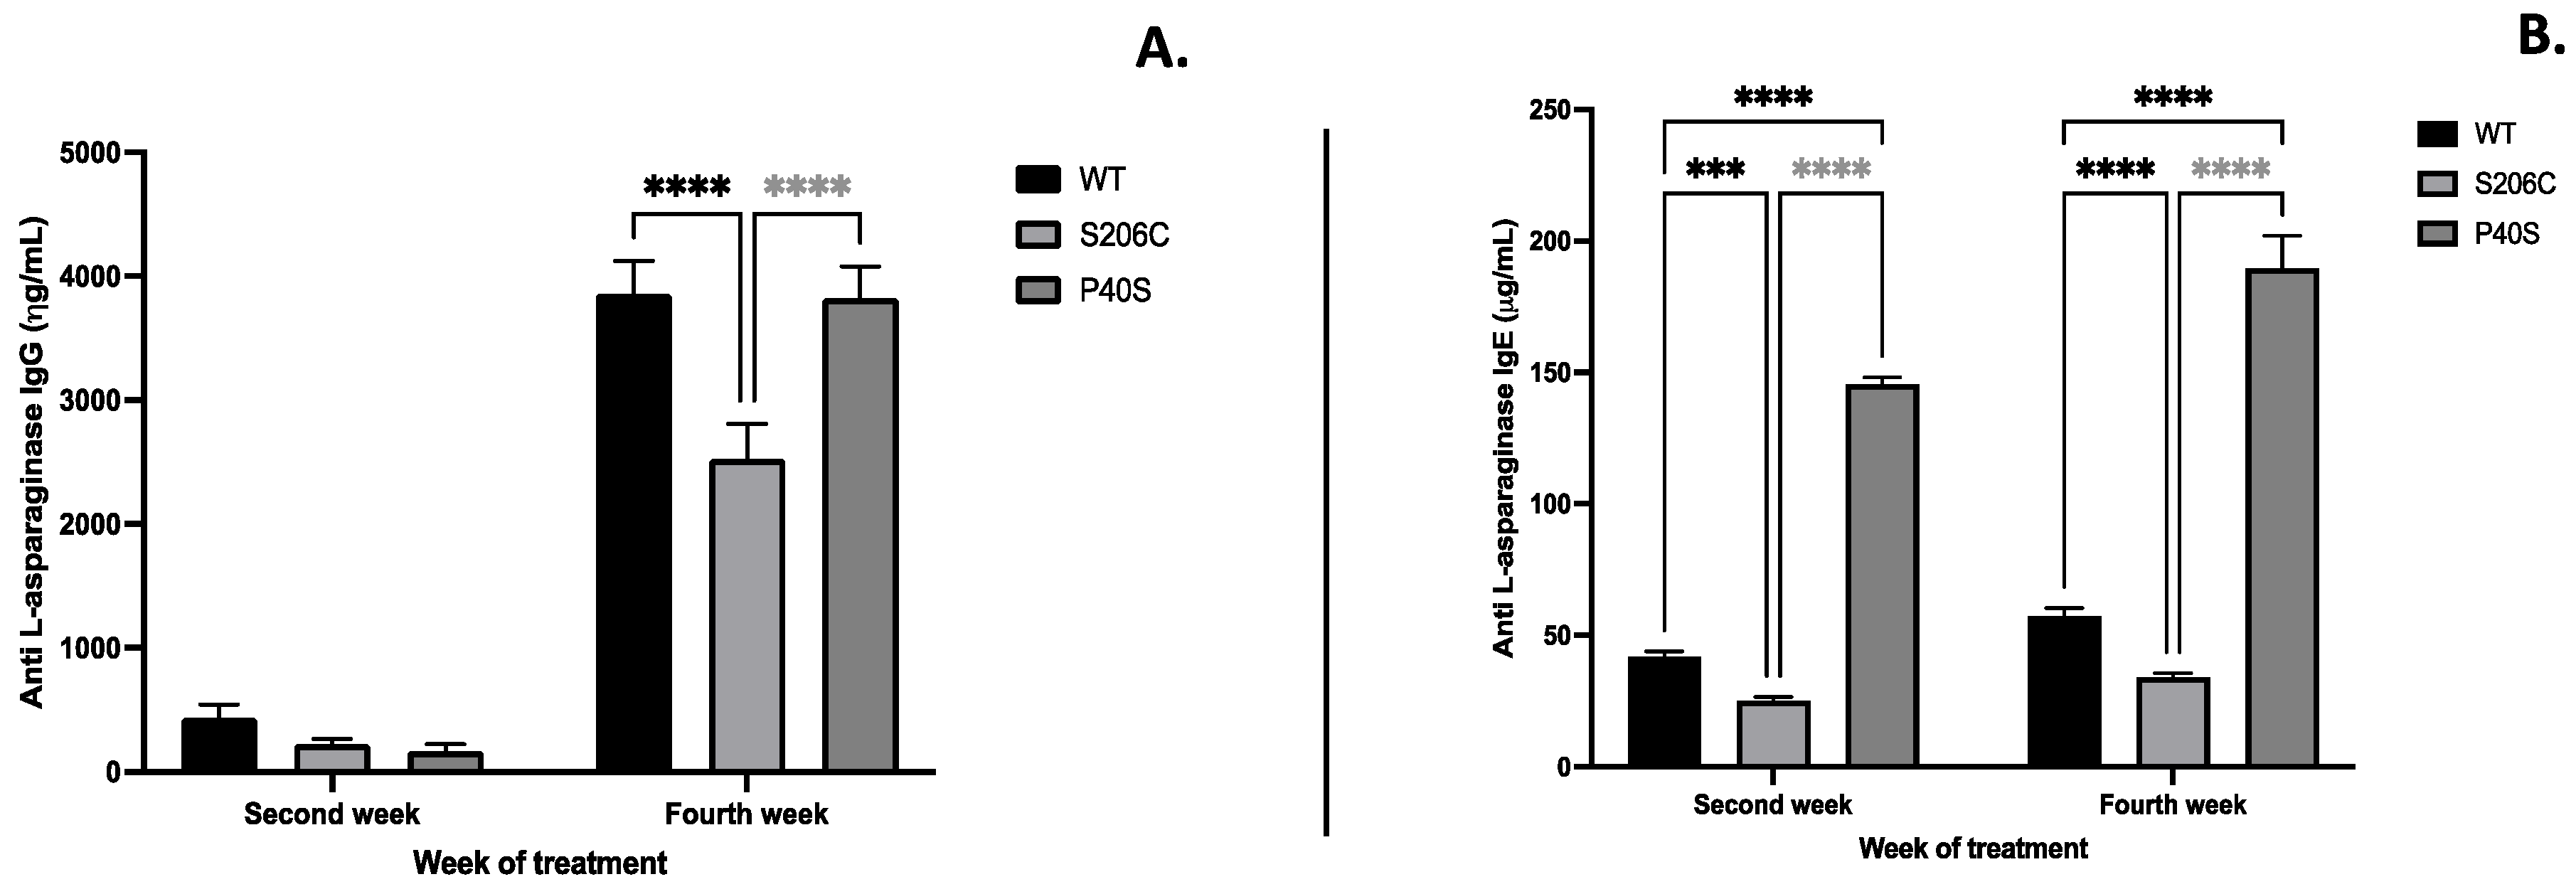
21]. This scheme of treatment was used to stimulate a humoral hypersensitivity by immune complexes sensitization and a re-exposure with the antigen with the challenge dose, likewise our assay. The authors also found that ASNase binding to immune cells could be either free (cell-associated IgE) or by anti-ASNase IgG and IgE immune complexes, mainly to basophils, which express both high affinity IgE receptor FcεRI and low-affinity IgG receptor, FcγRIII. Thus, our results show that anti-ASNase IgG mediated hypersensitivity after the challenge dose was significantly higher on WT and P40S enzymes treated groups on the fourth week, unlike S206C enzyme, which induces the lowest titre of both anti-ASNase IgG and IgE throughout the experiment. Indeed, IgE concentration in mice on WT and S206C enzymes treated groups slightly increased from the second to the fourth week, unlike P40S exposed animals that effectively produced high and increasing titre of anti-ASNase IgE on both measurements.
Hypersensitivity reactions developed to ASNase are mainly related to induction of CD4+ T cells rather than B-cells [
21]. Therefore, MCP-4 chemokine was also quantified as it preferentially attracts T cells, monocytes, and eosinophils. In addition, it is considered homolog to human chymase because both share high substrate specificity, similar tissue distribution and functional serglycin-binding properties [
42,
43]. Our results showed the highest MCP-4 increase in S206C group, as previously reported by Medjene et al (2020). This chymase increase observed can be protective, since it had a potent anti-inflammatory effect in mice with renal ischemia reperfusion injury and bacterial infection, by controlling neutrophil extravasation activation and, consequently, limiting their contribution to the possible associated injuries toward the pathogen/antigen response [
42,
44]. Also, recently MCP-4 was inversely correlated with IgE levels [
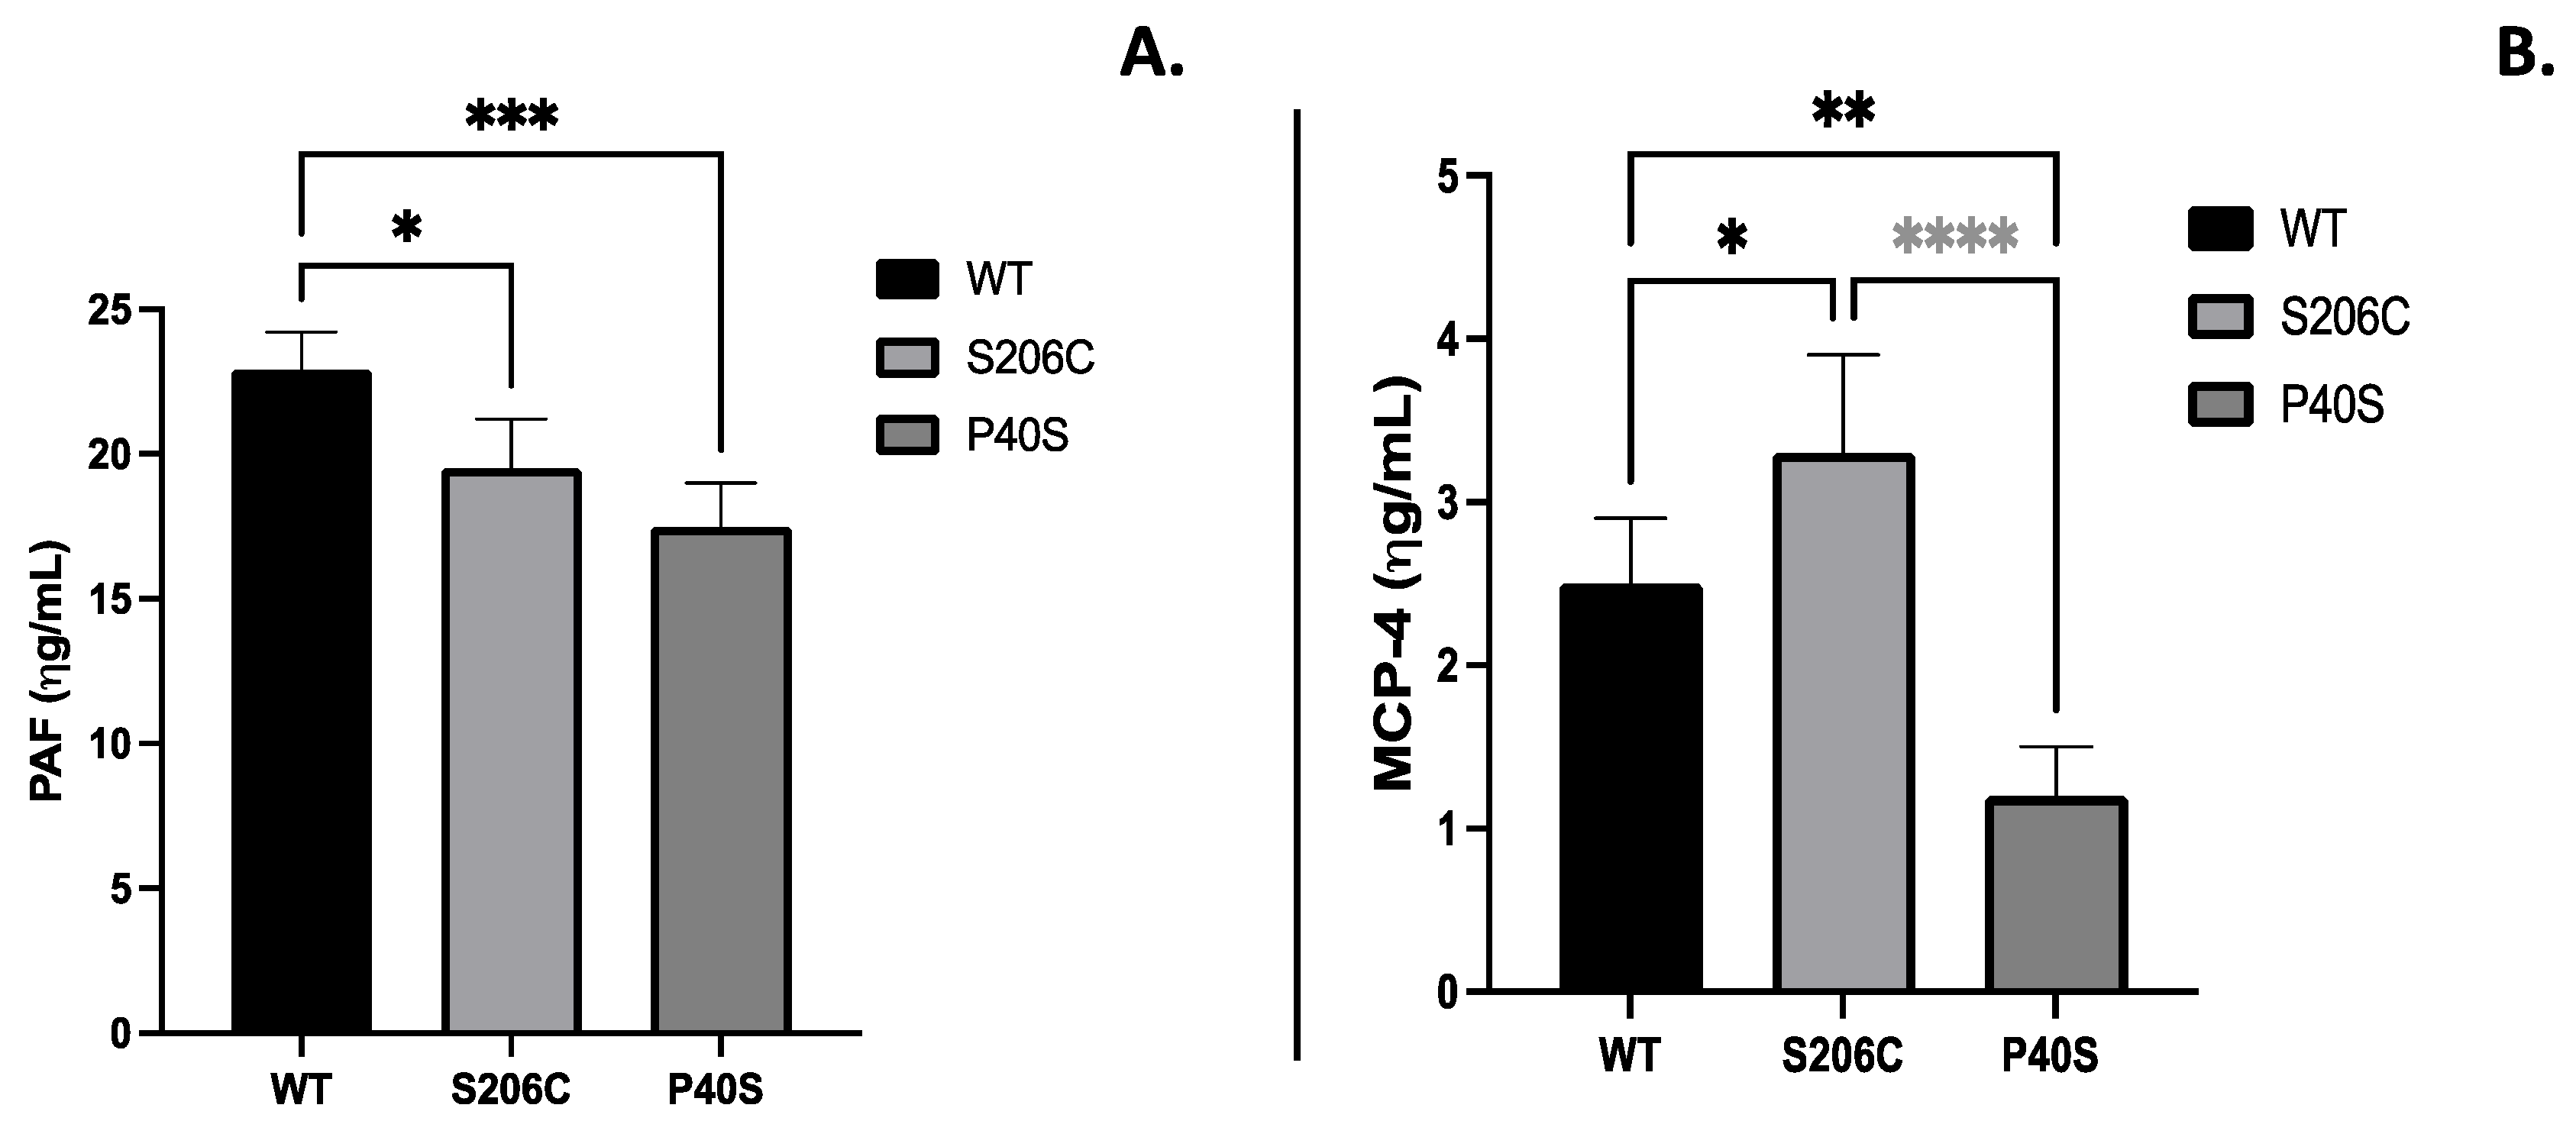
42]. Indeed, P40S enzyme treated group had the highest titre of anti-ASNase IgE and the lowest MCP-4 concentration. The same correlation is true for mice treated with S206C enzyme – high MCP-4 concentration and low IgE titre. Relative to PAF expression, anti-ASNase IgE induces the release of PAF from granulocytes upon re-exposure to the enzyme on day 23 and anaphylaxis reactions may occur. In contrast, if PAF receptor antagonist is used, hypersensitive reactions are considerably reduced [
21]. In this context, significant increased concentrations of PAF were found in the blood of animals treated with WT enzyme, confirming the advantage of S206C mutant, but in this case, also P40S mutant.
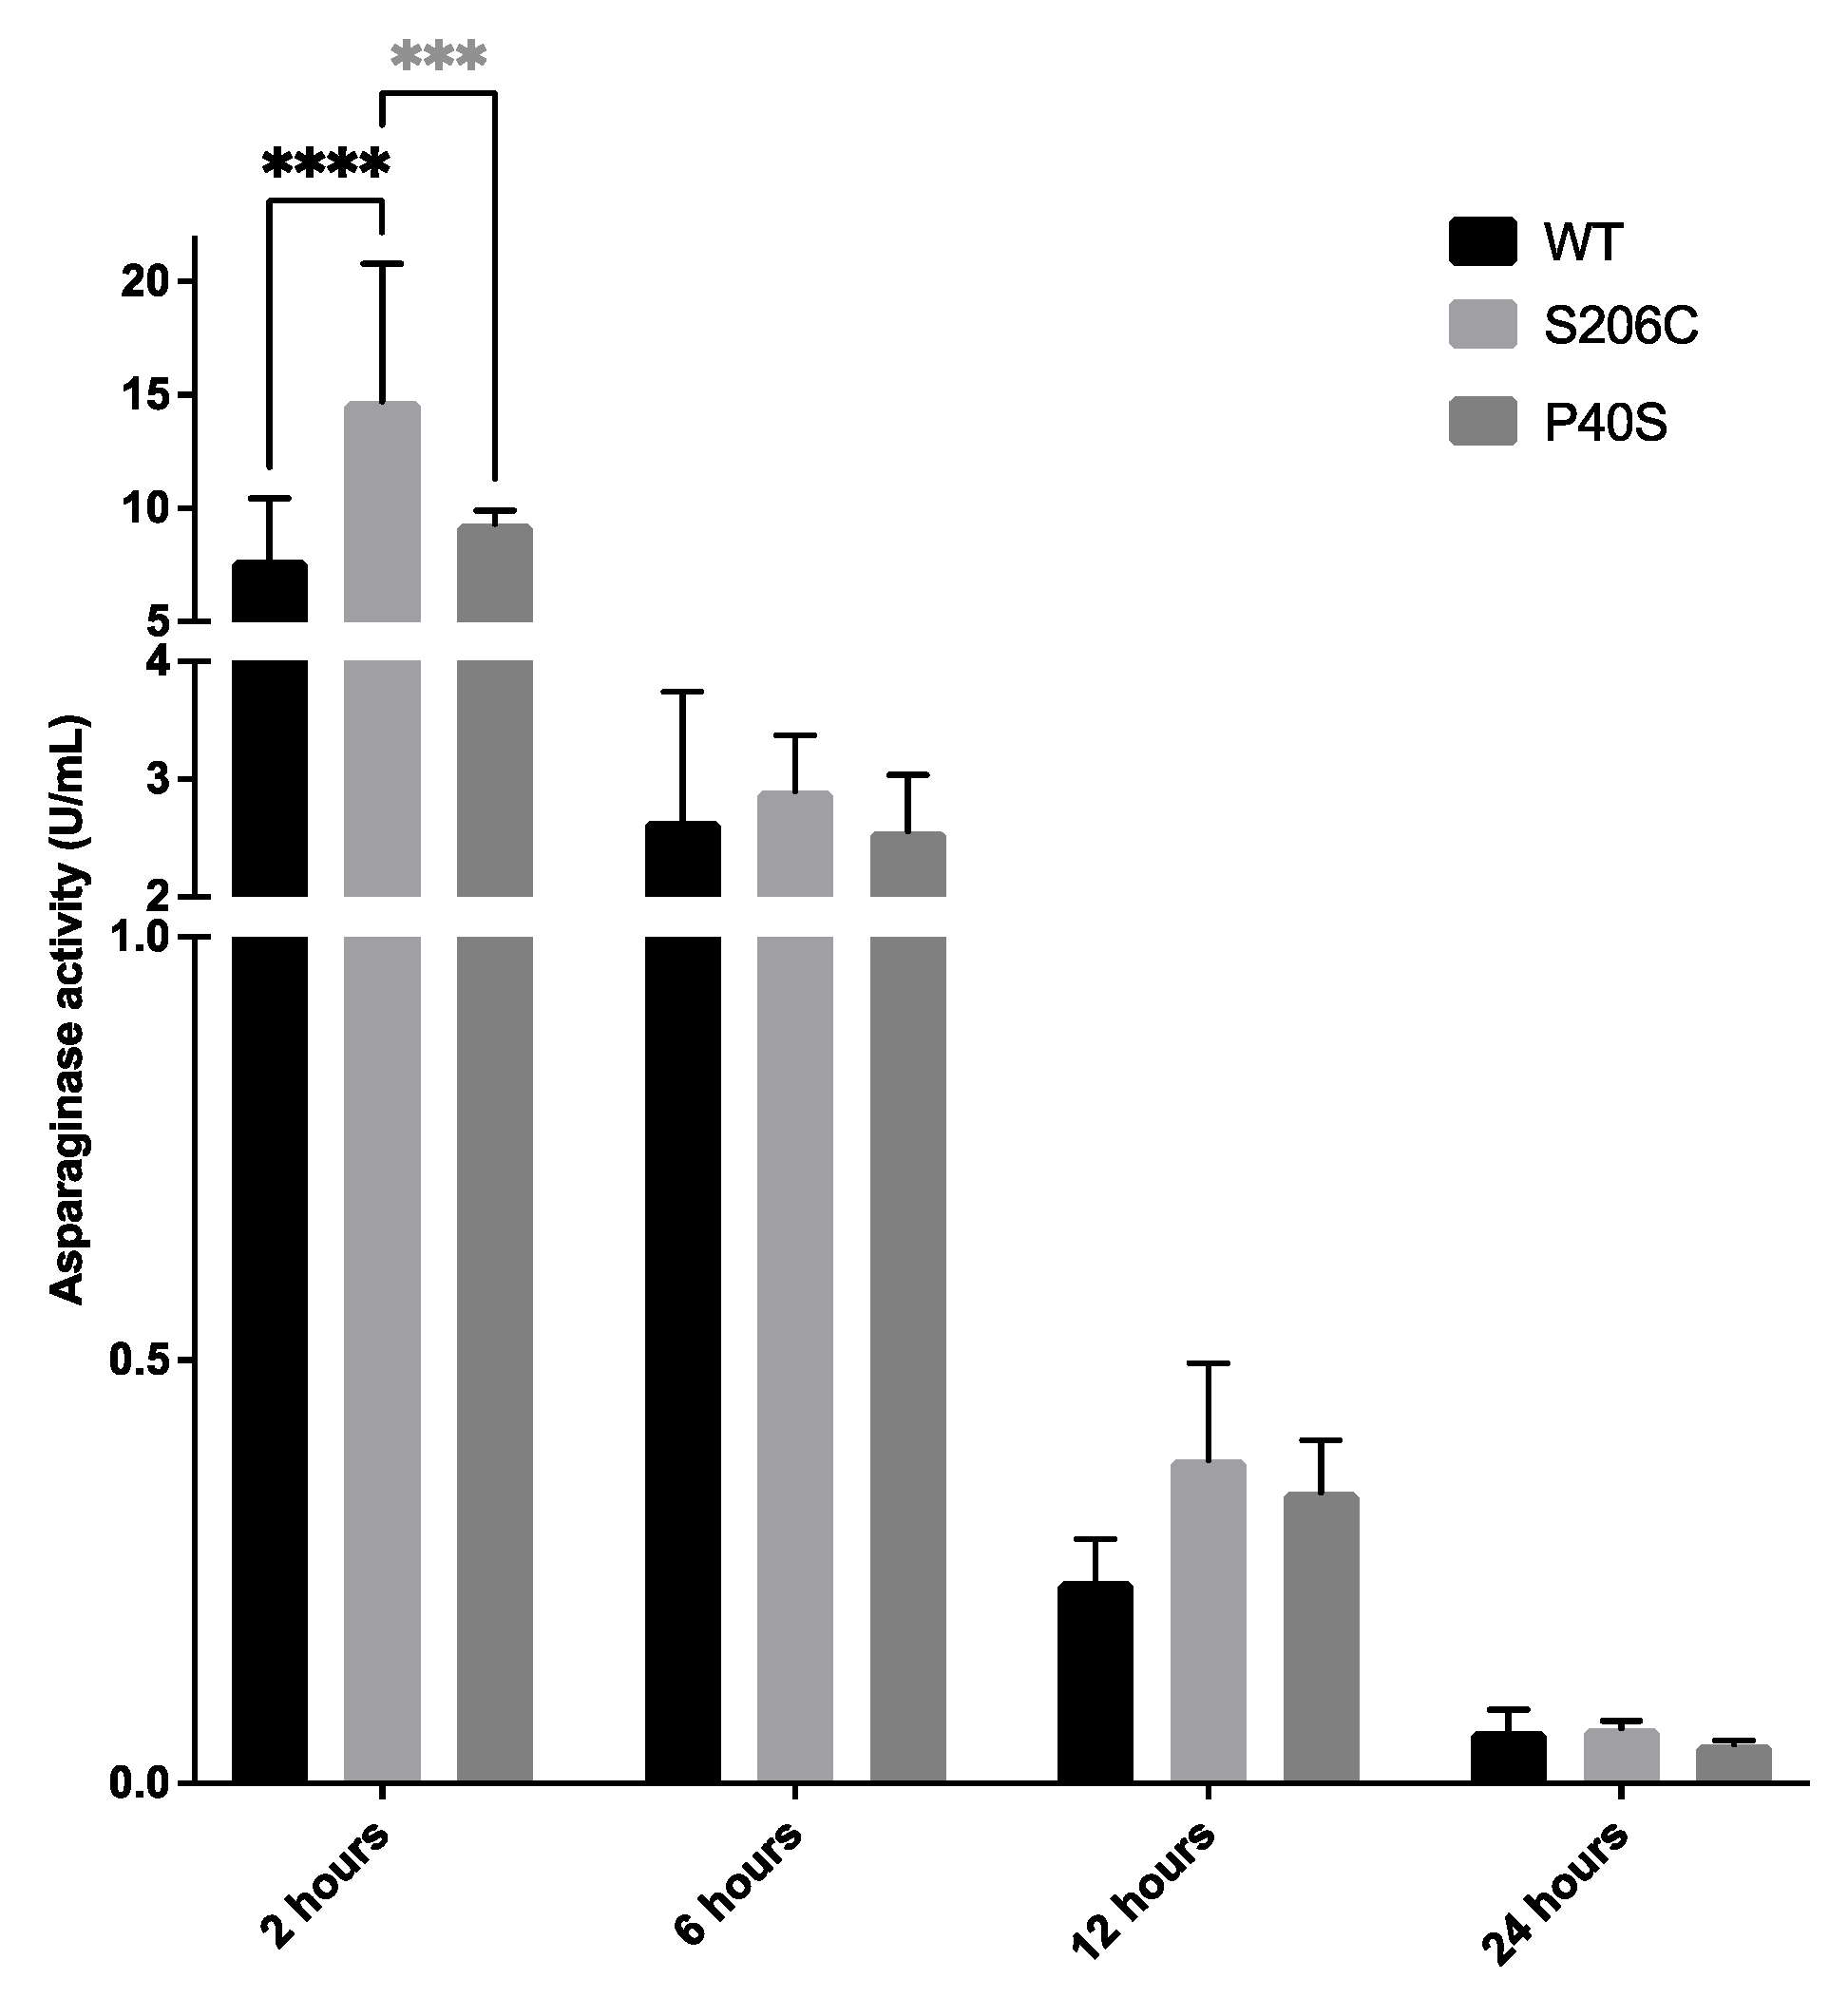
Concerning the pharmacokinetic data collected, enzyme activity of S206C treated group after two hours of the single dose was significantly higher than WT and P40S exposed groups, likely due to less protease inactivation of the enzyme by asparaginyl endopeptidase (AEP or legumain) or cathepsin B (CTSB), as previously described [
9,
41,
45,
46,
47]. Also, as related by Rathod et al. (2019), under the scheme of sensitization, macrophages clearance of ASNase is likely to occur within the following hours after the injection, due to macrophages number increasing up to 10% every hour [
21]. This result was already expected since it was reported that P40S/S206C mutations may protect and camouflage the enzyme from recognition and degradation by AEP and CTSB [
9].
Previous studies indicate that even at relatively low concentration, around of 0.1 U/mL, ASNase is capable to fully deplete physiological concentrations of asparagine (Asn) within seconds in blood plasma and central nervous system [
7,
48,
49,
50]. Here, all proteoforms were therapeutically effective until 12 hours after injection. Also, Horvath et al. (2019) found that mice treated with three doses of 1,000 U/Kg of commercial ASNase had a decrease of Asn concentration to half (22 µM approximately) after 24 hours of administration and reaches its lowest level after 48 hours (6 µM) [
7]. In mice, the normal range of Asn is from 40 to 50 µM, as they had reported. Based on that, our scheme results are relatively close to those obtained in Horvath et al. (2019) experiments using the same dose as this work. It is important to highlight central role of monocyte/macrophages (phagocytic cells) on the liver, spleen, and bone marrow, which promote ASNase degradation and clearance by cathepsin B activity, with ASNase pharmacokinetics therefore reducing its blood and bone marrow niche half-life. Thus, ASNase local rapid degradation specifically in the bone marrow niche mediated by CTSB may explain a resistance mechanism of leukaemic cells to escape from apoptosis [
41]. So, we can hypothesize a reduced affinity of S206C to surface receptors of phagocytic cells or a decrease on lysosomal process of the proteoform and its epitope exposure, which may attenuate immune and allergic response, as observed in S206C group data together.
Finally, relative to cytotoxicity on solid tumour cells, S206C proteoform presents lower IC
50 values, which mean higher cytotoxic effect on Caco-2, PANC-1 and U-87 MG than WT enzyme; however, on SK-OV-3 cell line S206C is less effective. On the other hand, P40S has higher anti-cancer activity on U-87 MG and PANC-1, only defeated for WT on MDA-MB-231 cell line. Indeed, previous results from literature described the IC
50 against Caco-2 of 68.28 U for ASNase from
Pseudonomas aeruginosa [
51], 30 U for ASNase from
Pyrococcus furiosus [
14] and 5 U/mL from
Pyrococcus abyssi compared to 0.41 U and 7.1 U/mL as here identified. On the other hand, cytotoxicity on PANC-1 is not well known. A study using commercial
E. coli ASNase Spectrila® identified IC
50 around 0.11 U/mL [
52], higher efficient when comparing to 3.3 and 2.7 U/mL of our WT and S206C enzymes. Nonetheless, S206C mutant showed improved immunological response than E coli ASNase (WT). Indeed, ASNase sensitivity in PANC-1 is correlated with a decrease in purine synthesis pathway and with Gln starvation due to GLNase co-activity. Also, the resistance mechanism is likely because glutamine synthetase gene over-expression, instead of asparagine synthetase gene [
52]. Thus, to further investigate glutaminase activity of the mutants, we cultured PANC-1 cells without and with the addition of Gln and increasing concentrations of ASNases (WT, S206C and P40S). However, no significant differences on IC
50 were found, suggesting low or absent glutaminase activity of the optimized and bioengineered ansB gene (data not shown) compared with formulated recombinant ASNase Spectrila®. This may explain the differences on IC
50 for Spectrila® [
52] and the mutants presented here. Regarding glioblastoma cells, a work from Karpel-Massler et al. (2016) on different glioblastoma cells treated with recombinant L-asparaginase from
E. coli from Sigma Aldrich effectively showed that these tumour cell lines are sensitive to ASNase, with IC
50 between 0.1 and 1.55 U/mL [
53], while we obtained 1.2 and 0.8 U/mL for S206C and P40S enzymes, respectively. In fact, they demonstrated the increased rate of intrinsic and extrinsic apoptosis under ASNase treatment
in vitro and its enhanced inhibition of glioblastoma cells implanted into SCID SHO mice.
In conclusion, we present the novel S206C mutant ASNase from E. coli that shows improved characteristics compared to native enzyme and recovers specific activity loss from double mutant P40S/S206C. This novel mutant induces lower humoral immunological response, lower allergenic and higher protective inflammatory reaction when compared with the WT enzyme. Additionally, it has the highest enzyme activity two hours after the single dose according to the pharmacokinetic profile. Considering that macrophage recognition and clearance is higher in this period, it suggests less immune stimulation and possibly no hepatic bioaccumulation of immune complex. Furthermore, regarding to cytotoxicity on solid tumours, S206C showed higher cytotoxic effect mainly on Caco-2, PANC-1 and U-87 MG cells than WT. Finally, we propose S206C as a promising option for WT enzyme that could improve the patient´s quality of life and treatment.
Figure 1.
(A) Asparaginase activity of WT, S206C, P40S and P40S/S206C enzymes. The enzyme specific activity is represented as the slope of the linear regression equation of plotted µmole NH3/min against the milligrams of enzyme (U/mg). n=3. (B) Glutaminase activity of WT, S206C, P40S and P40S/S206C enzymes. The slope value corresponds to the glutaminase specific activity in U/mg. As well as asparaginase activity, µmole of NH3 released was quantified by Nessler´s reagent, n=3.
Figure 2.
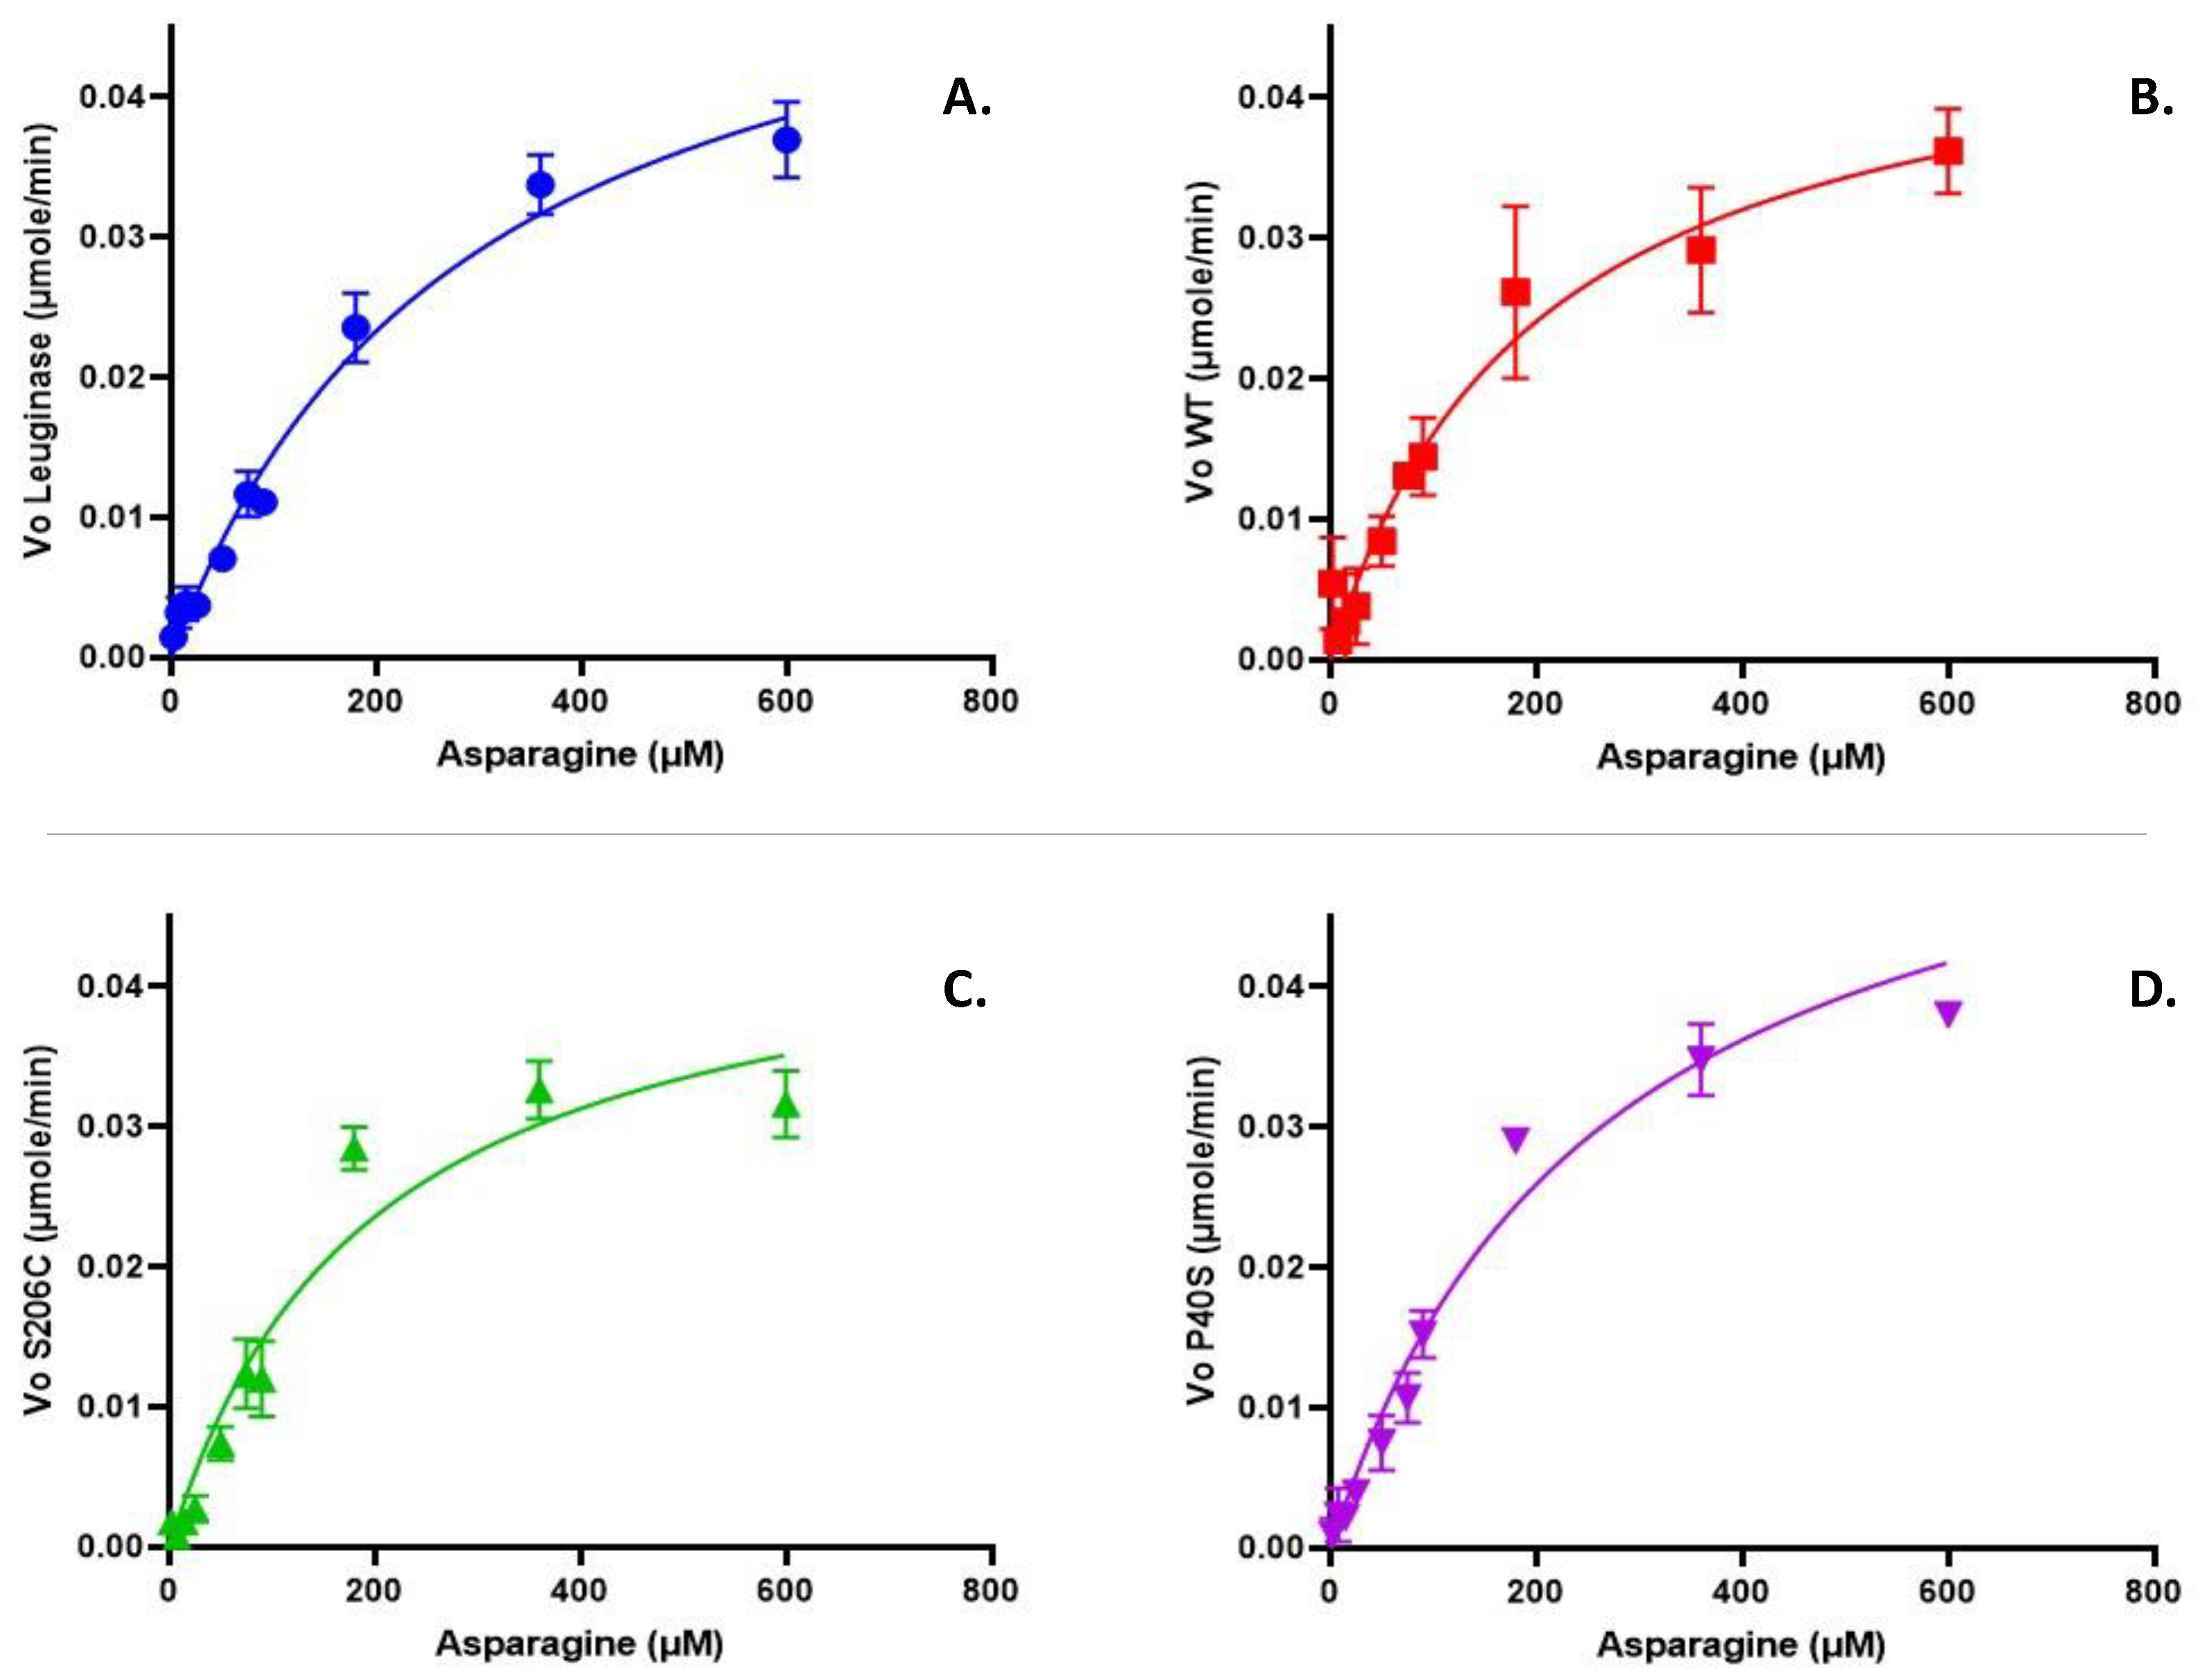
Kinetic profile of a commercial asparaginase Leuginase® (A), and the enzymes produced on our laboratory, WT (B), S206C (C) and P40S (D) ASNases. The µmoles of L-aspartate/minute released after asparaginase hydrolysis of asparagine was quantified by the coupled enzymatic reaction, where for each mole of L-aspartate produced after L-asparagine hydrolysis one mole of NADH is oxidized to NAD+ which decrease in absorbance was continuously measured at 340 nm and 37°C. The analysis was performed on Prism 9 for Enzyme Kinetics - Substrate vs. Velocity with Michaelis-Menten equation.
Figure 3.
Animal health and wellness monitoring. (A) Weight measured on days 0, 3, 5, 10, 14, 18 and 23 of each group (Control, and ASNase treated WT, S206C and P40S) under a scheme of two doses of 1,050 U/Kg on days 0 and 14 and a final dose of 5,250 U/Kg on day 23. Standard deviation is shown by vertical bar, n=3. No significant differences were found between groups or days of treatment. (B) Body temperature values for each enzyme treated group measured for two hours after the challenge injection of 5,250 U/Kg. Standard deviation is shown by vertical bar. n=3. Statistical differences relative to control - *: p value <0.05.
Figure 4.
Blood biometry after challenge injection. (A) Haematocrit percentage, (B) granulocytes concentration and (C) platelets count for all experimental groups. Standard deviation is shown by vertical bar, n=3, *: p value <0.05, **: p value <0.005, ***: p value <0.0005. No statistically significant differences were observed on haematocrit percentage or granulocytes comparing the groups.
Figure 5.
Antibody anti-ASNase quantification by ELISA of (
A) IgG and (
B) IgE after treatment scheme detailed in
Figure 1B. Standard deviation is shown by vertical bar, n=5, ***: p value <0.0005, ****: p value <0.00005.
Figure 5.
Antibody anti-ASNase quantification by ELISA of (
A) IgG and (
B) IgE after treatment scheme detailed in
Figure 1B. Standard deviation is shown by vertical bar, n=5, ***: p value <0.0005, ****: p value <0.00005.
Figure 6.
(
A) PAF and (
B) MCP-4 quantification by ELISA on the fourth week after treatment scheme detailed in
Figure 1B. Standard deviation is shown by vertical bar, n=5, *: p value <0.05, **: p value <0.005, ***: p value <0.0005.
Figure 6.
(
A) PAF and (
B) MCP-4 quantification by ELISA on the fourth week after treatment scheme detailed in
Figure 1B. Standard deviation is shown by vertical bar, n=5, *: p value <0.05, **: p value <0.005, ***: p value <0.0005.
Figure 7.
Asparaginase activity measured in mice plasma after 2, 6, 12 and 24 hours of one single injection dose of 1050 U/Kg of each ASNase, WT and mutants, quantified by oxine method. Standard deviation is shown by vertical bar, n=5, ***: p value <0.0005, ****: p value <0.00005.
Figure 7.
Asparaginase activity measured in mice plasma after 2, 6, 12 and 24 hours of one single injection dose of 1050 U/Kg of each ASNase, WT and mutants, quantified by oxine method. Standard deviation is shown by vertical bar, n=5, ***: p value <0.0005, ****: p value <0.00005.
Figure 8.
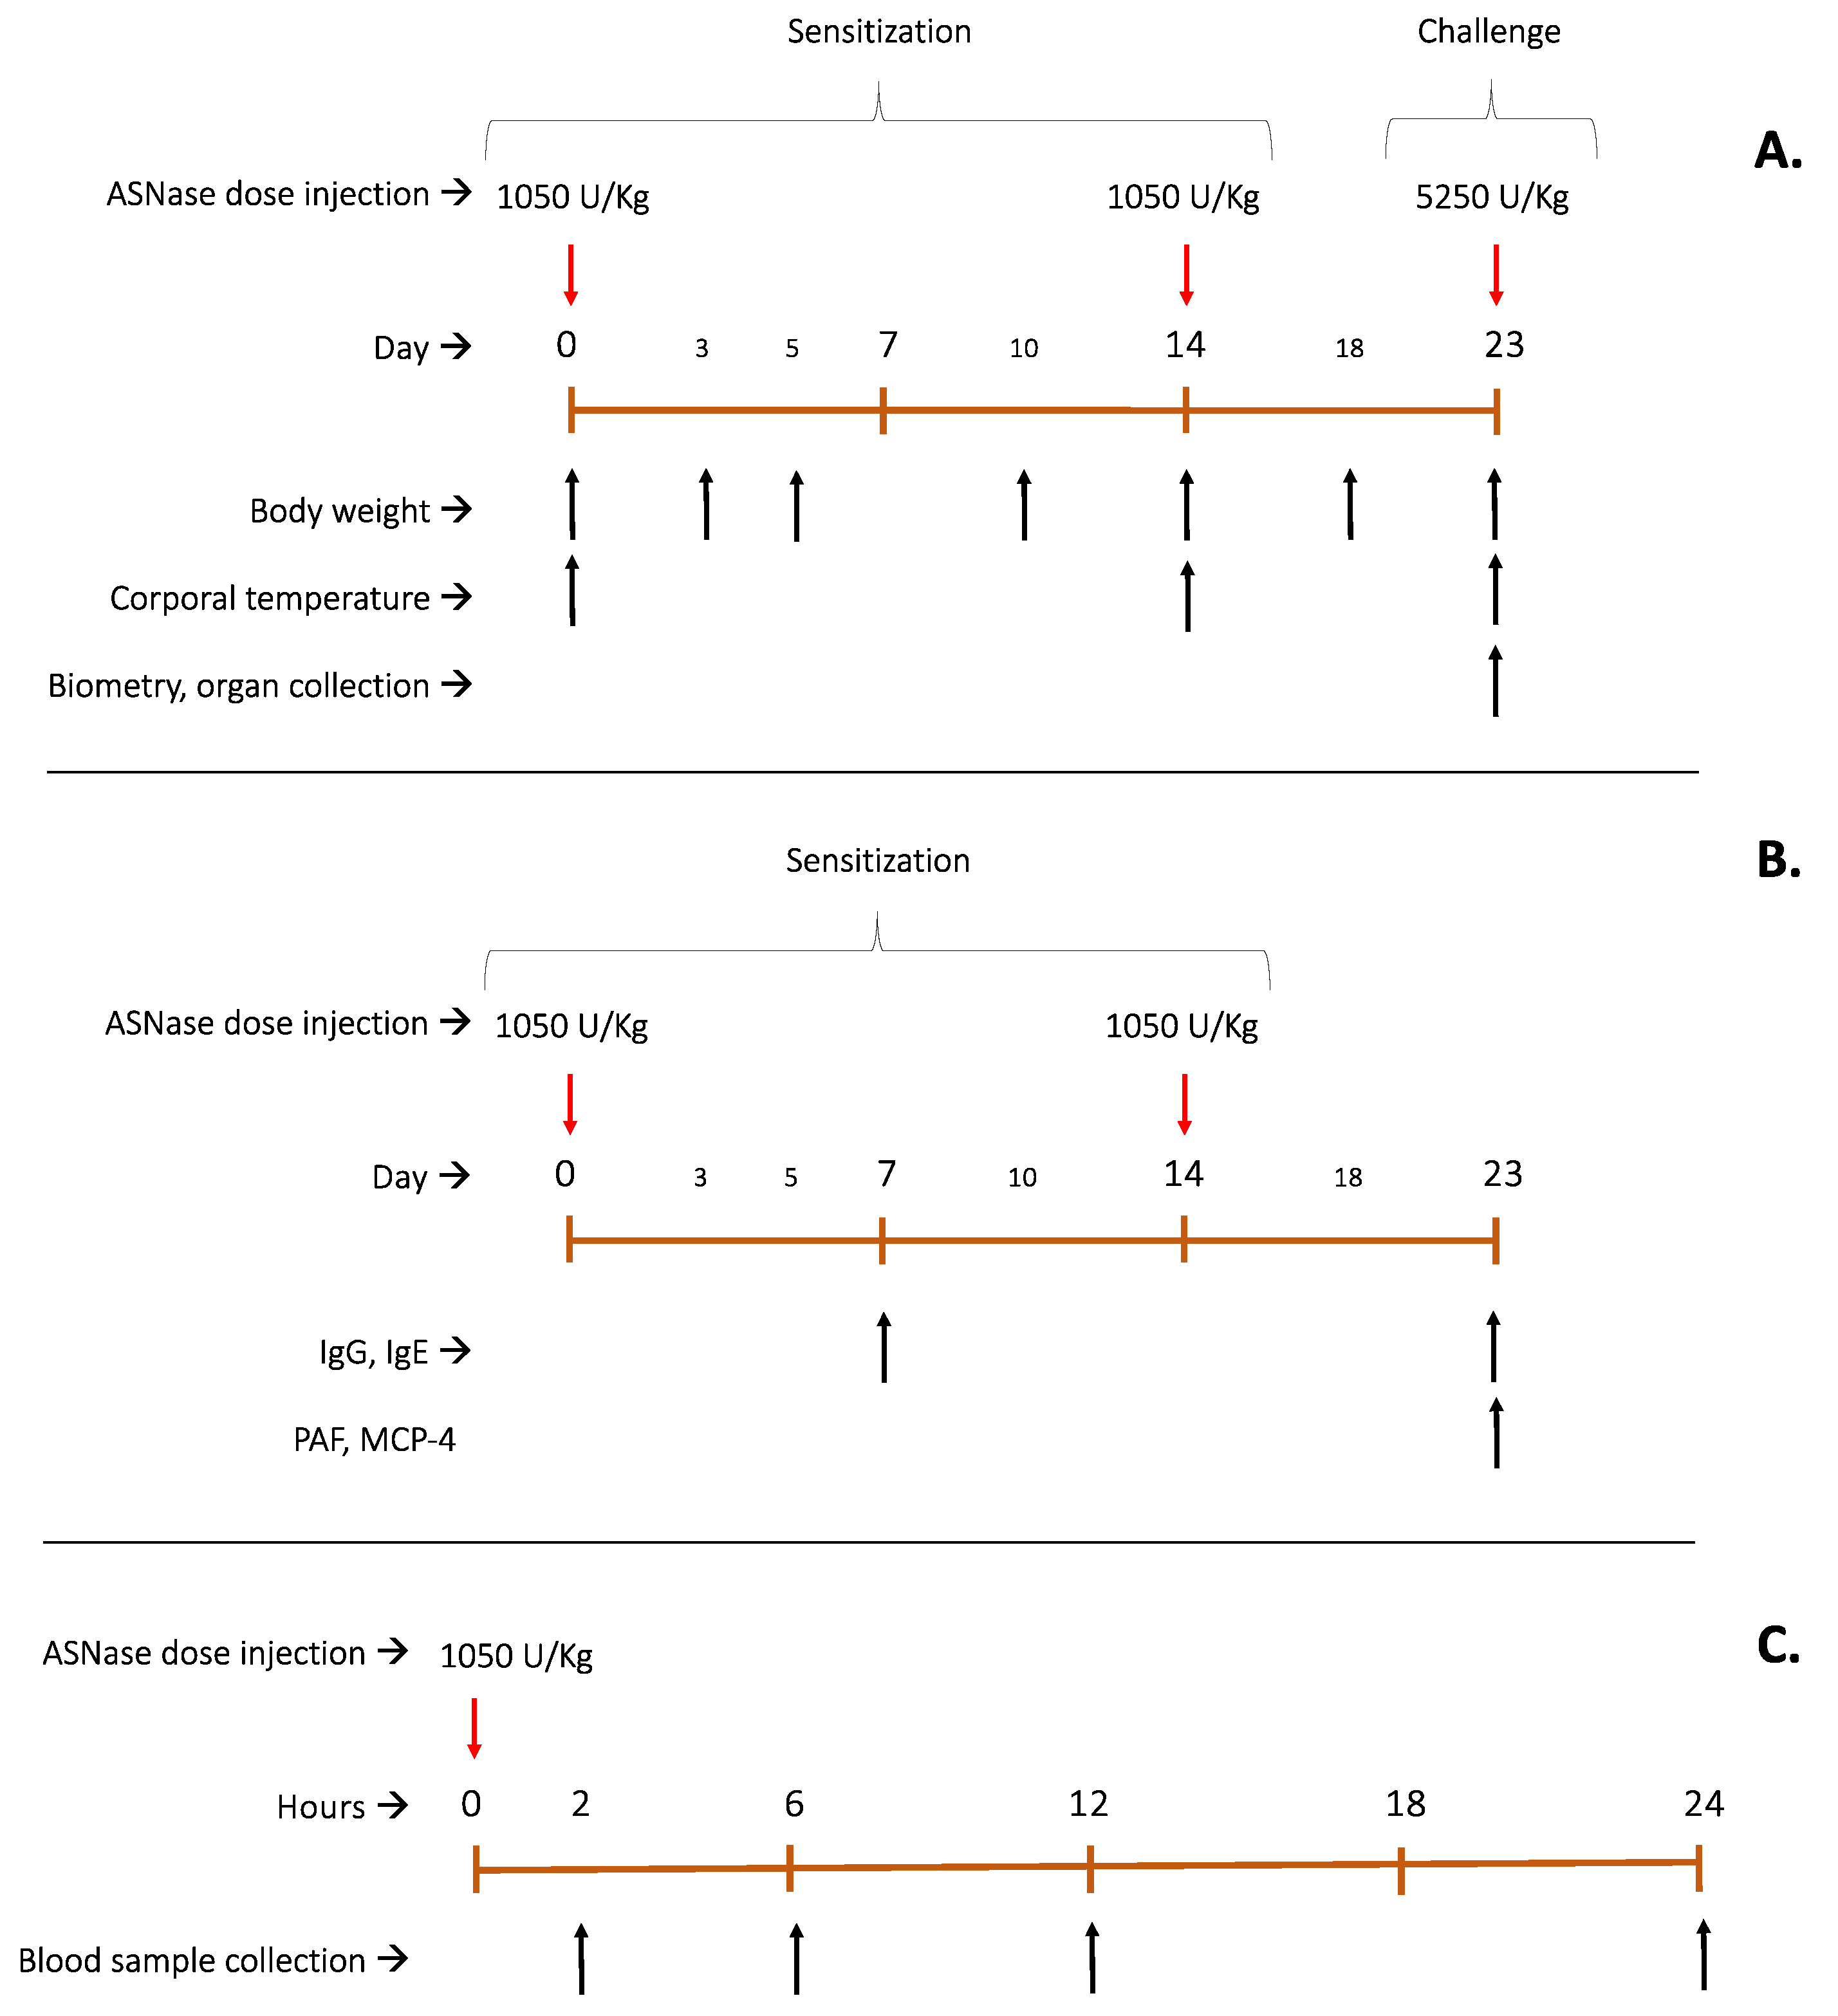
Flowchart of experimental design for in vivo studies. (A): Multi-organs toxicological effects of animal exposure to multiple doses of ASNase (WT and mutants) for 23 days experimentation, with continuous weight control on days 0,3,5,10,14,18 and 23. Temperature was measured for two hours after each ASNase injection on days 0, 14 and 23. On day 23, blood sample was collected to biometry analysis and organs were collected and treated with haematoxylin and eosin (H&E stain). (B): Antigenic and Allergenic potential evaluation of each proteoform after two sensitization doses per IgG, IgE, PAF and MCP-4 plasmatic quantification. (C): Pharmacokinetics profile of ASNase (WT and mutants) for 24 hours, with enzyme activity detection at 2,6,12 and 24 hours after injection. Asparaginase activity was measured by oxine method in plasma.
Table 1.
Specific activity for L-asparagine and L-glutamine of WT, S206C, P40S and P40S/S206C enzymes and their relative glutaminase activity percentage. Statistical differences with WT- **: p value <0.005; ***: p value <0.0005, ****: p value <0.00005. Statistical differences with S206C- ##: p value <0.005; ###: p value <0.0005, ####: p value <0.00005. Statistical differences with P40S- ++: p value <0.005.
| Enzyme |
ASNase activity (U/mg) |
GLNase activity
(U/mg) |
Relative GLNase activity % |
| WT |
76.22 ±0.82 |
1.79 ±0.09 |
2.35 |
| S206C |
74.86 ±0.32 |
1.73 ±0.04 |
2.31 |
| P40S |
60.82 ±0.72***### |
1.27 ±0.02**## |
2.09 |
| P40S/S206C |
52.88 ±1.12****####++ |
1.76 ±0.05++ |
3.33 |
Table 2.
Asparaginase activity of WT, S206C, P40S and P40S/S206C enzymes incubated with PBS 1x or 10% of human serum (HS) at 0 and 96 hours and the percentage of residual activity. n=2. Statistical differences from 0 hours to 96 hours within each row - *: p value <0.05; **: p value <0.005, ***: p value <0.0005.
|
Enzyme
|
ASNase activity
(0 hours)
|
ASNase activity
(96 hours)
|
Residual activity
|
| WT-PBS 1x |
88.1 ±19.8 |
51.4 ±10.1** |
58.3% |
| WT-HS |
87.6 ±14.8 |
61.7 ±13.2 |
70.4% |
| S206C-PBS 1x |
74.7 ±5.0 |
43.9 ±14.8* |
58.8% |
| S206C-HS |
78.0 ±3.3 |
64.8 ±13.2 |
83.2% |
| P40S-PBS 1x |
69.4 ±2.5 |
28.0 ±10.8** |
40.3% |
| P40S-HS |
69.5 ±2.0 |
53.1 ±15.1 |
76.4% |
| P40S/S206C-PBS 1x |
61.1 ±1.6 |
12.1 ±5.6*** |
19.7% |
| P40S/S206C-HS |
62.8 ±1.7 |
27.6 ±9.4* |
44.0% |
Table 3.
Kinetic parameters obtained for commercial Leuginase®, and WT, S206C and P40S ASNases. The analysis was performed on Prism 9 for Enzyme Kinetics - Substrate vs. Velocity with non-linear regression - Michaelis-Menten equation fit. n=2. Statistical differences with Leuginase - *: p value <0.05. Statistical differences with S206C- #: p value <0.05.
| |
|
Leuginase |
WT |
S206C |
P40S |
| Kinetic parameters |
Vmax
(µmole/min) |
0.05728 ±0.0063 |
0.04787 ±0.0073 |
0.04647 ±0.0065 |
0.06001 ±0.0055 |
KM
(µM) |
291.3 ±23.6 |
197.6 ±17.9* |
194.0 ±12.5* |
262.7.2 ±9.8# |
| Goodness of fit |
R2
|
0.9744 |
0.9203 |
0.9362 |
0.9389 |
Table 4.
IC50 (U/mL) for different blood cancer cell lines (MTT assay) when treated for 72 hours with ASNases WT, S206C and P40S. n=2, Statistical differences with WT - *: p value <0.05. No significant differences were observed between mutants.
Table 4.
IC50 (U/mL) for different blood cancer cell lines (MTT assay) when treated for 72 hours with ASNases WT, S206C and P40S. n=2, Statistical differences with WT - *: p value <0.05. No significant differences were observed between mutants.
| Cell line |
ASNase type |
| WT |
S206C |
P40S |
| MOLT-4 |
0.112 ±0.020 |
0.076 ±0.012 |
0.045 ±0.013* |
| REH |
0.114 ±0.019 |
0.149 ±0.031 |
0.114 ±0.002 |
Table 5.
IC50 (U/mL) for different solid cancer cell lines (MTT assay) treated for 72 hours with ASNases WT, S206C and P40S. n=3. Statistical differences with WT - *: p value <0.05; **: p value <0.005; ***: p value <0.0005. Statistical differences with S206C- #: p value <0.05; ##: p value <0.005.
Table 5.
IC50 (U/mL) for different solid cancer cell lines (MTT assay) treated for 72 hours with ASNases WT, S206C and P40S. n=3. Statistical differences with WT - *: p value <0.05; **: p value <0.005; ***: p value <0.0005. Statistical differences with S206C- #: p value <0.05; ##: p value <0.005.
| CELL LINE |
ASNASE TYPE |
| WT |
S206C |
P40S |
| MDA-MB-231 |
5.9 ±0.075 |
6.3 ±0.434 |
7.5 ±0.584**# |
| Caco-2 |
9.2 ±0.522 |
7.1±0.249* |
9.0 ±1.074# |
| SK-OV-3 |
8.5 ±1.344 |
11.9 ±0.43* |
9.4 ±1.013 |
| PANC-1 |
3.3 ±0.166 |
2.7 ±0.075** |
2.9 ±0.201* |
| U-87 MG |
1.5 ±0.107 |
1.2 ±0.099* |
0.8 ±0.098***## |
Table 6.
Average weight of organs collected after 23 days of treatment with multiple doses of ASNase (groups WT and mutants) and control group, n=3. Statistical difference with control group - *: p value <0.05. No statistical significance was identified between WT and mutants.
Table 6.
Average weight of organs collected after 23 days of treatment with multiple doses of ASNase (groups WT and mutants) and control group, n=3. Statistical difference with control group - *: p value <0.05. No statistical significance was identified between WT and mutants.
| Organ |
Weight (mg) |
| Control |
WT |
S206C |
P40S |
| Heart |
147.1 ±7.3 |
162.8 ±4.0 |
151.9 ±3.7 |
153.8 ±11.5 |
| Spleen |
99.1 ±18.0 |
100.2 ±2.3 |
94.3 ±10.3 |
91.7 ±3.2 |
| Liver |
1529.2 ±38.2 |
1846.7* ±50.1 |
1686.7 ±163.7 |
1827.0* ±34.7 |
| Kidney |
317.5 ±27.0 |
291.9 ±1.1 |
264.8 ±7.2 |
251.5 ±12.5 |
| Pancreas |
940.0 ±2.9 |
774.8* ±21.3 |
732.2* ±30.2 |
713.3* ±38.1 |
| Thymus |
85.6 ±13.9 |
99.4 ±11.7 |
57.6 ±2.0 |
84.7 ±7.0 |

