Submitted:
19 April 2024
Posted:
23 April 2024
You are already at the latest version
Abstract
Keywords:
1. Introduction
2. Materials and Methods
2.1. Parasite Culture
2.2. Production of Engineered Transfectant Lines
2.3. Indirect Immunofluorescence Microscopy
2.3. Immunoblots
2.4. Growth Inhibition Assay
2.5. Quantitative Real Time PCR
2.6. Osmotic Lysis Transport Assays
2.7. Computational Analysis and Statistics
3. Results
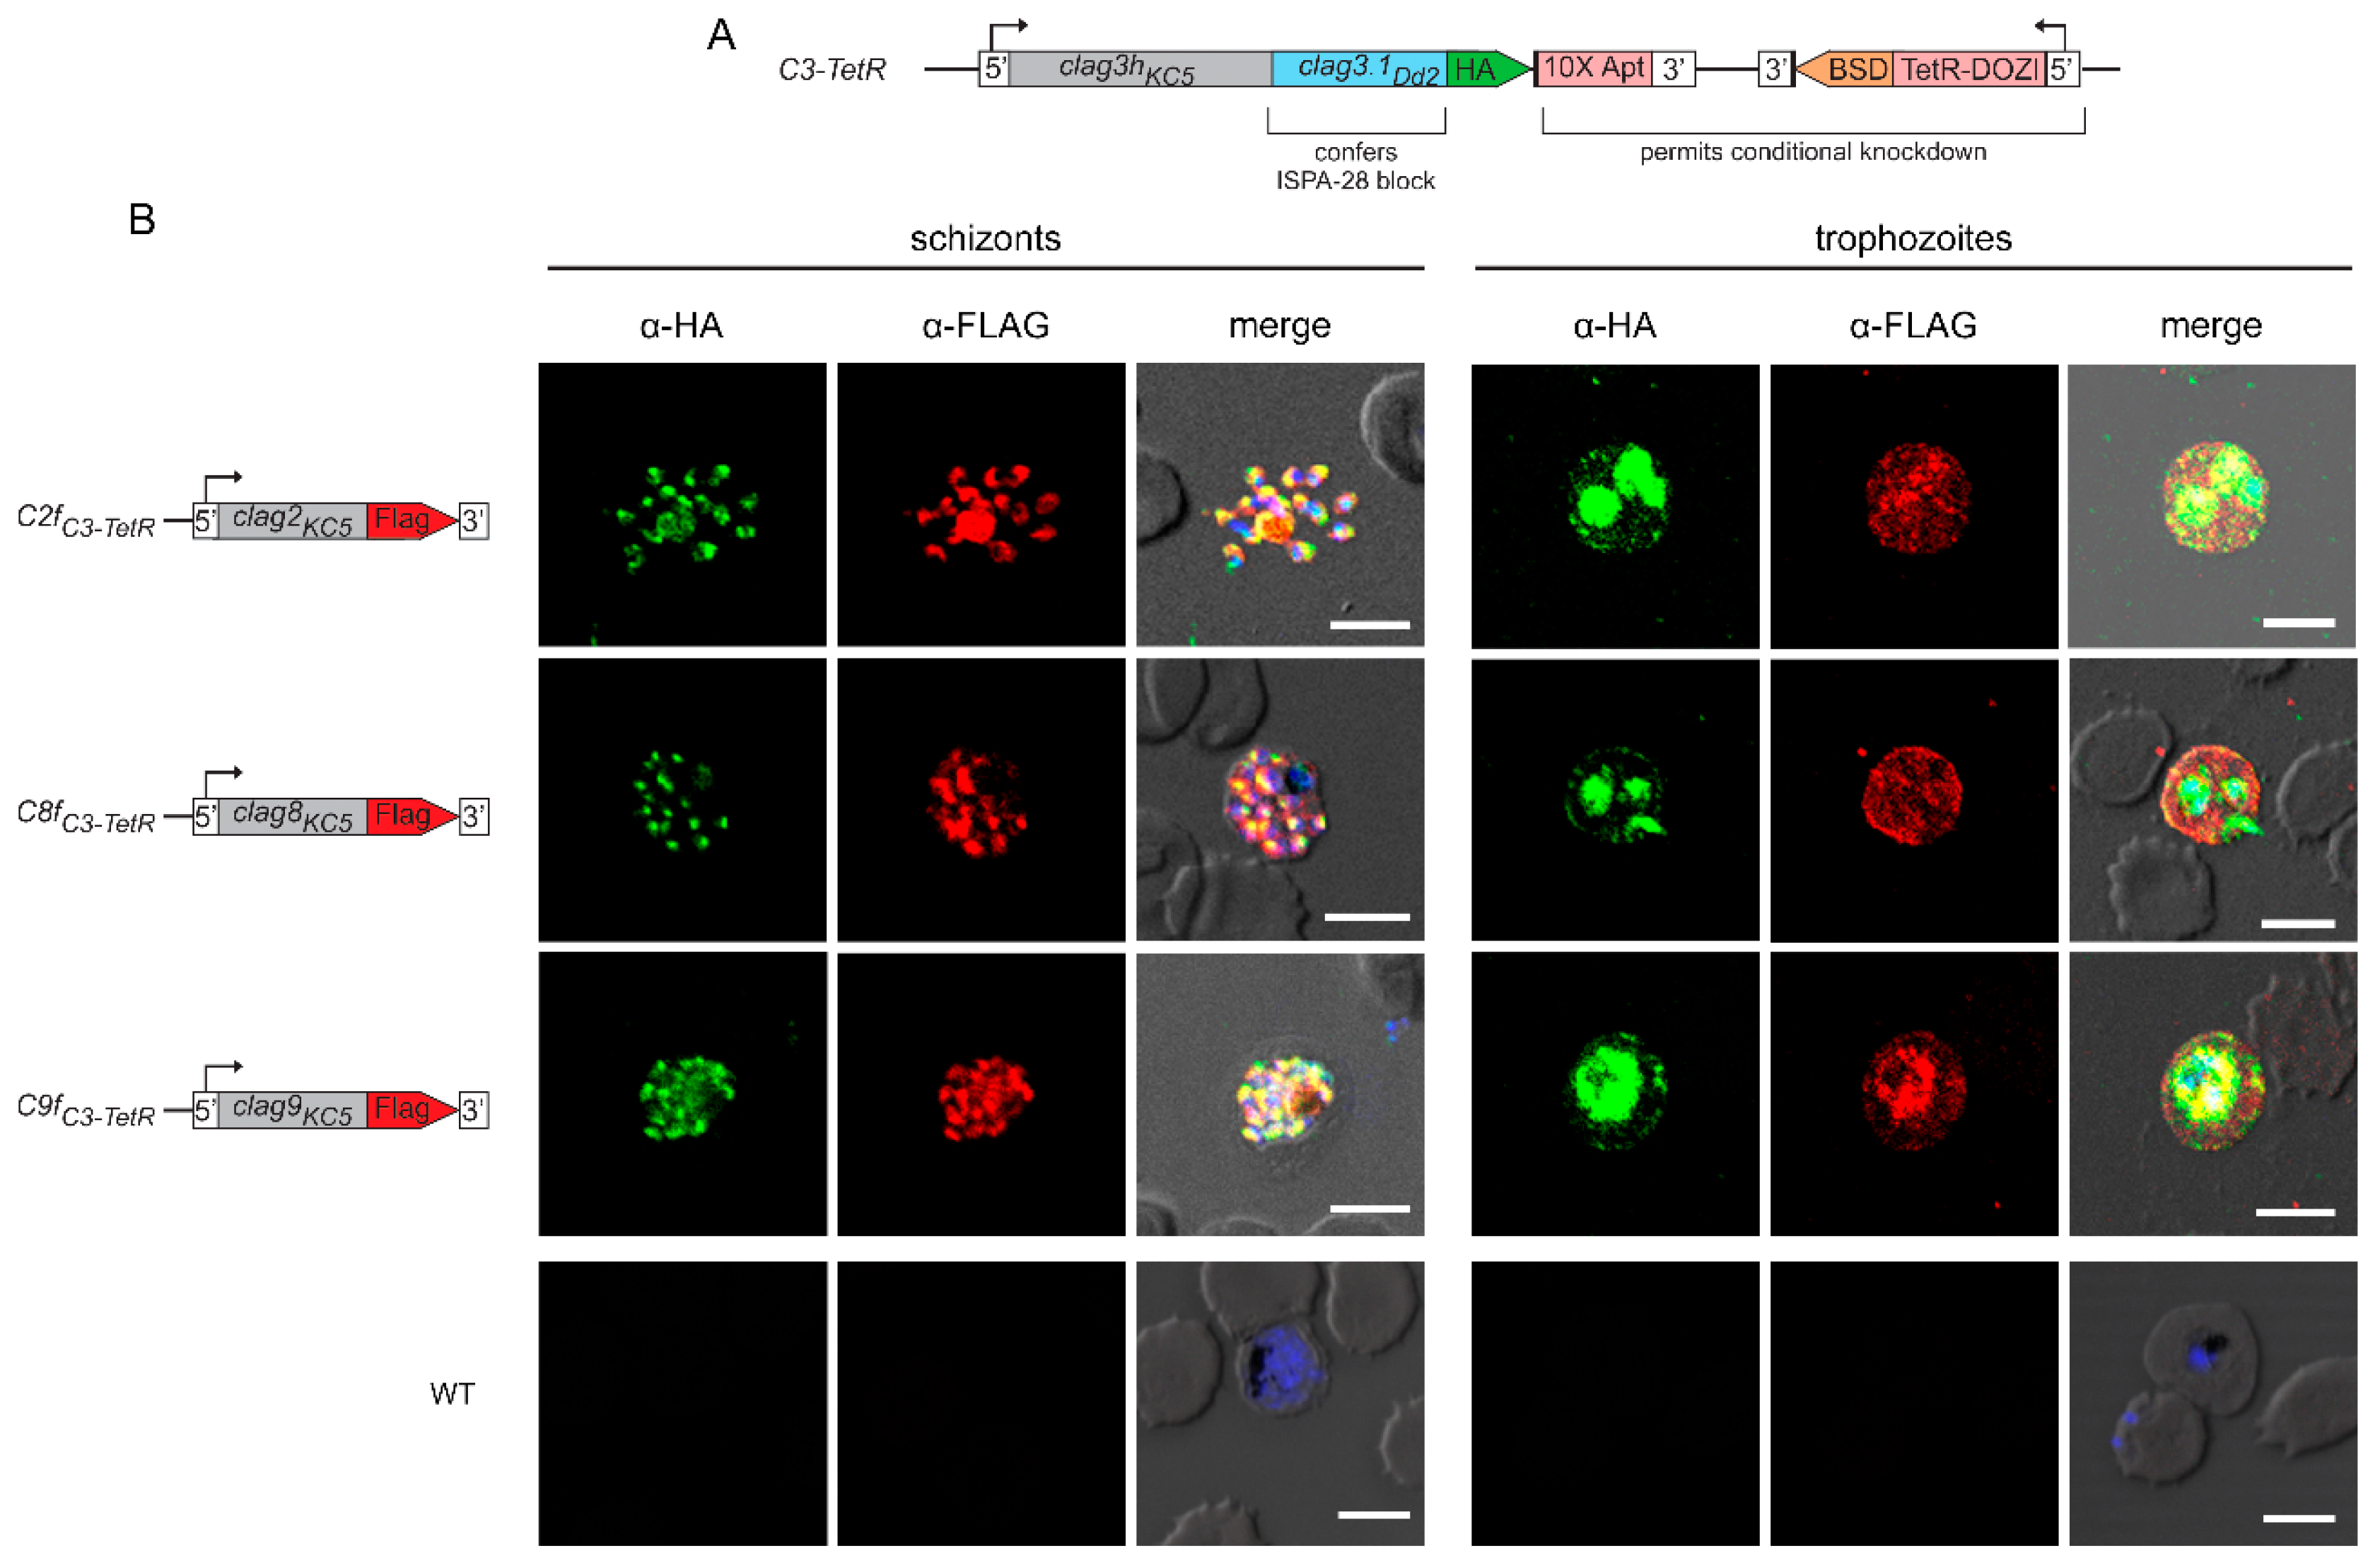
3.1. All CLAG Paralogs Traffic via Schizont Rhoptries to the Host Membrane after Reinvasion
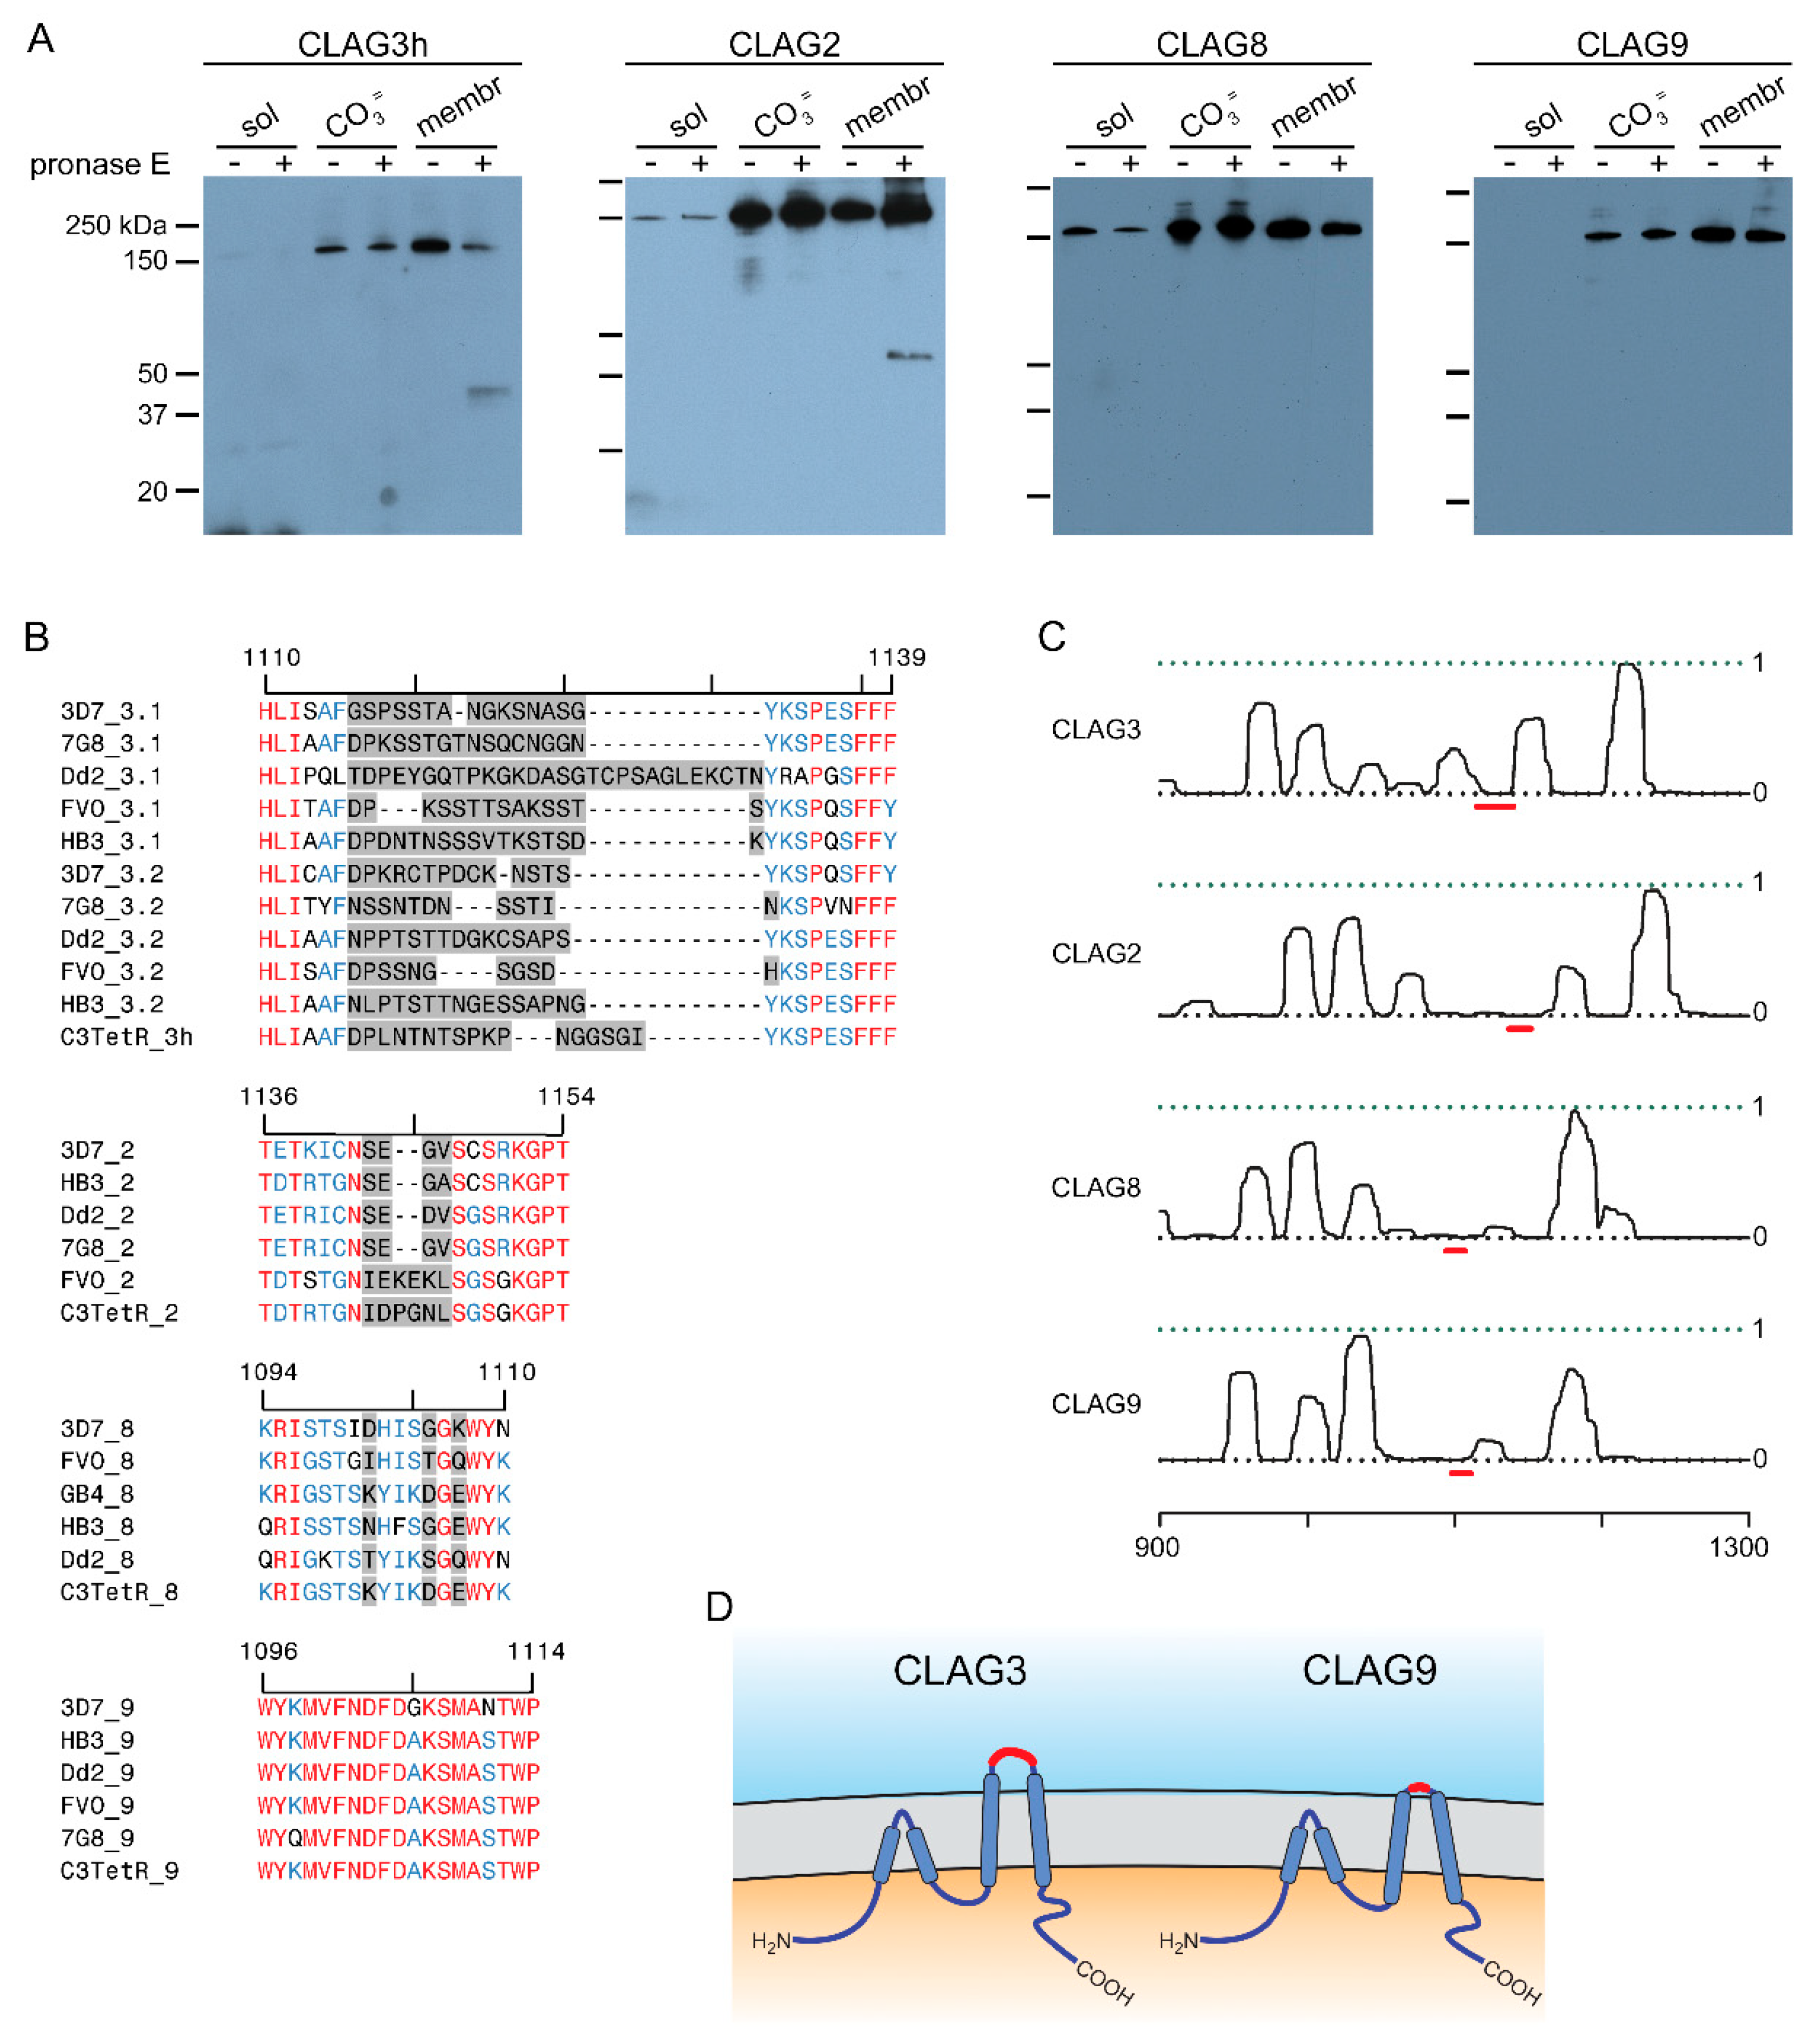
3.2. Two-State Behavior and Exposure at the Host Membrane
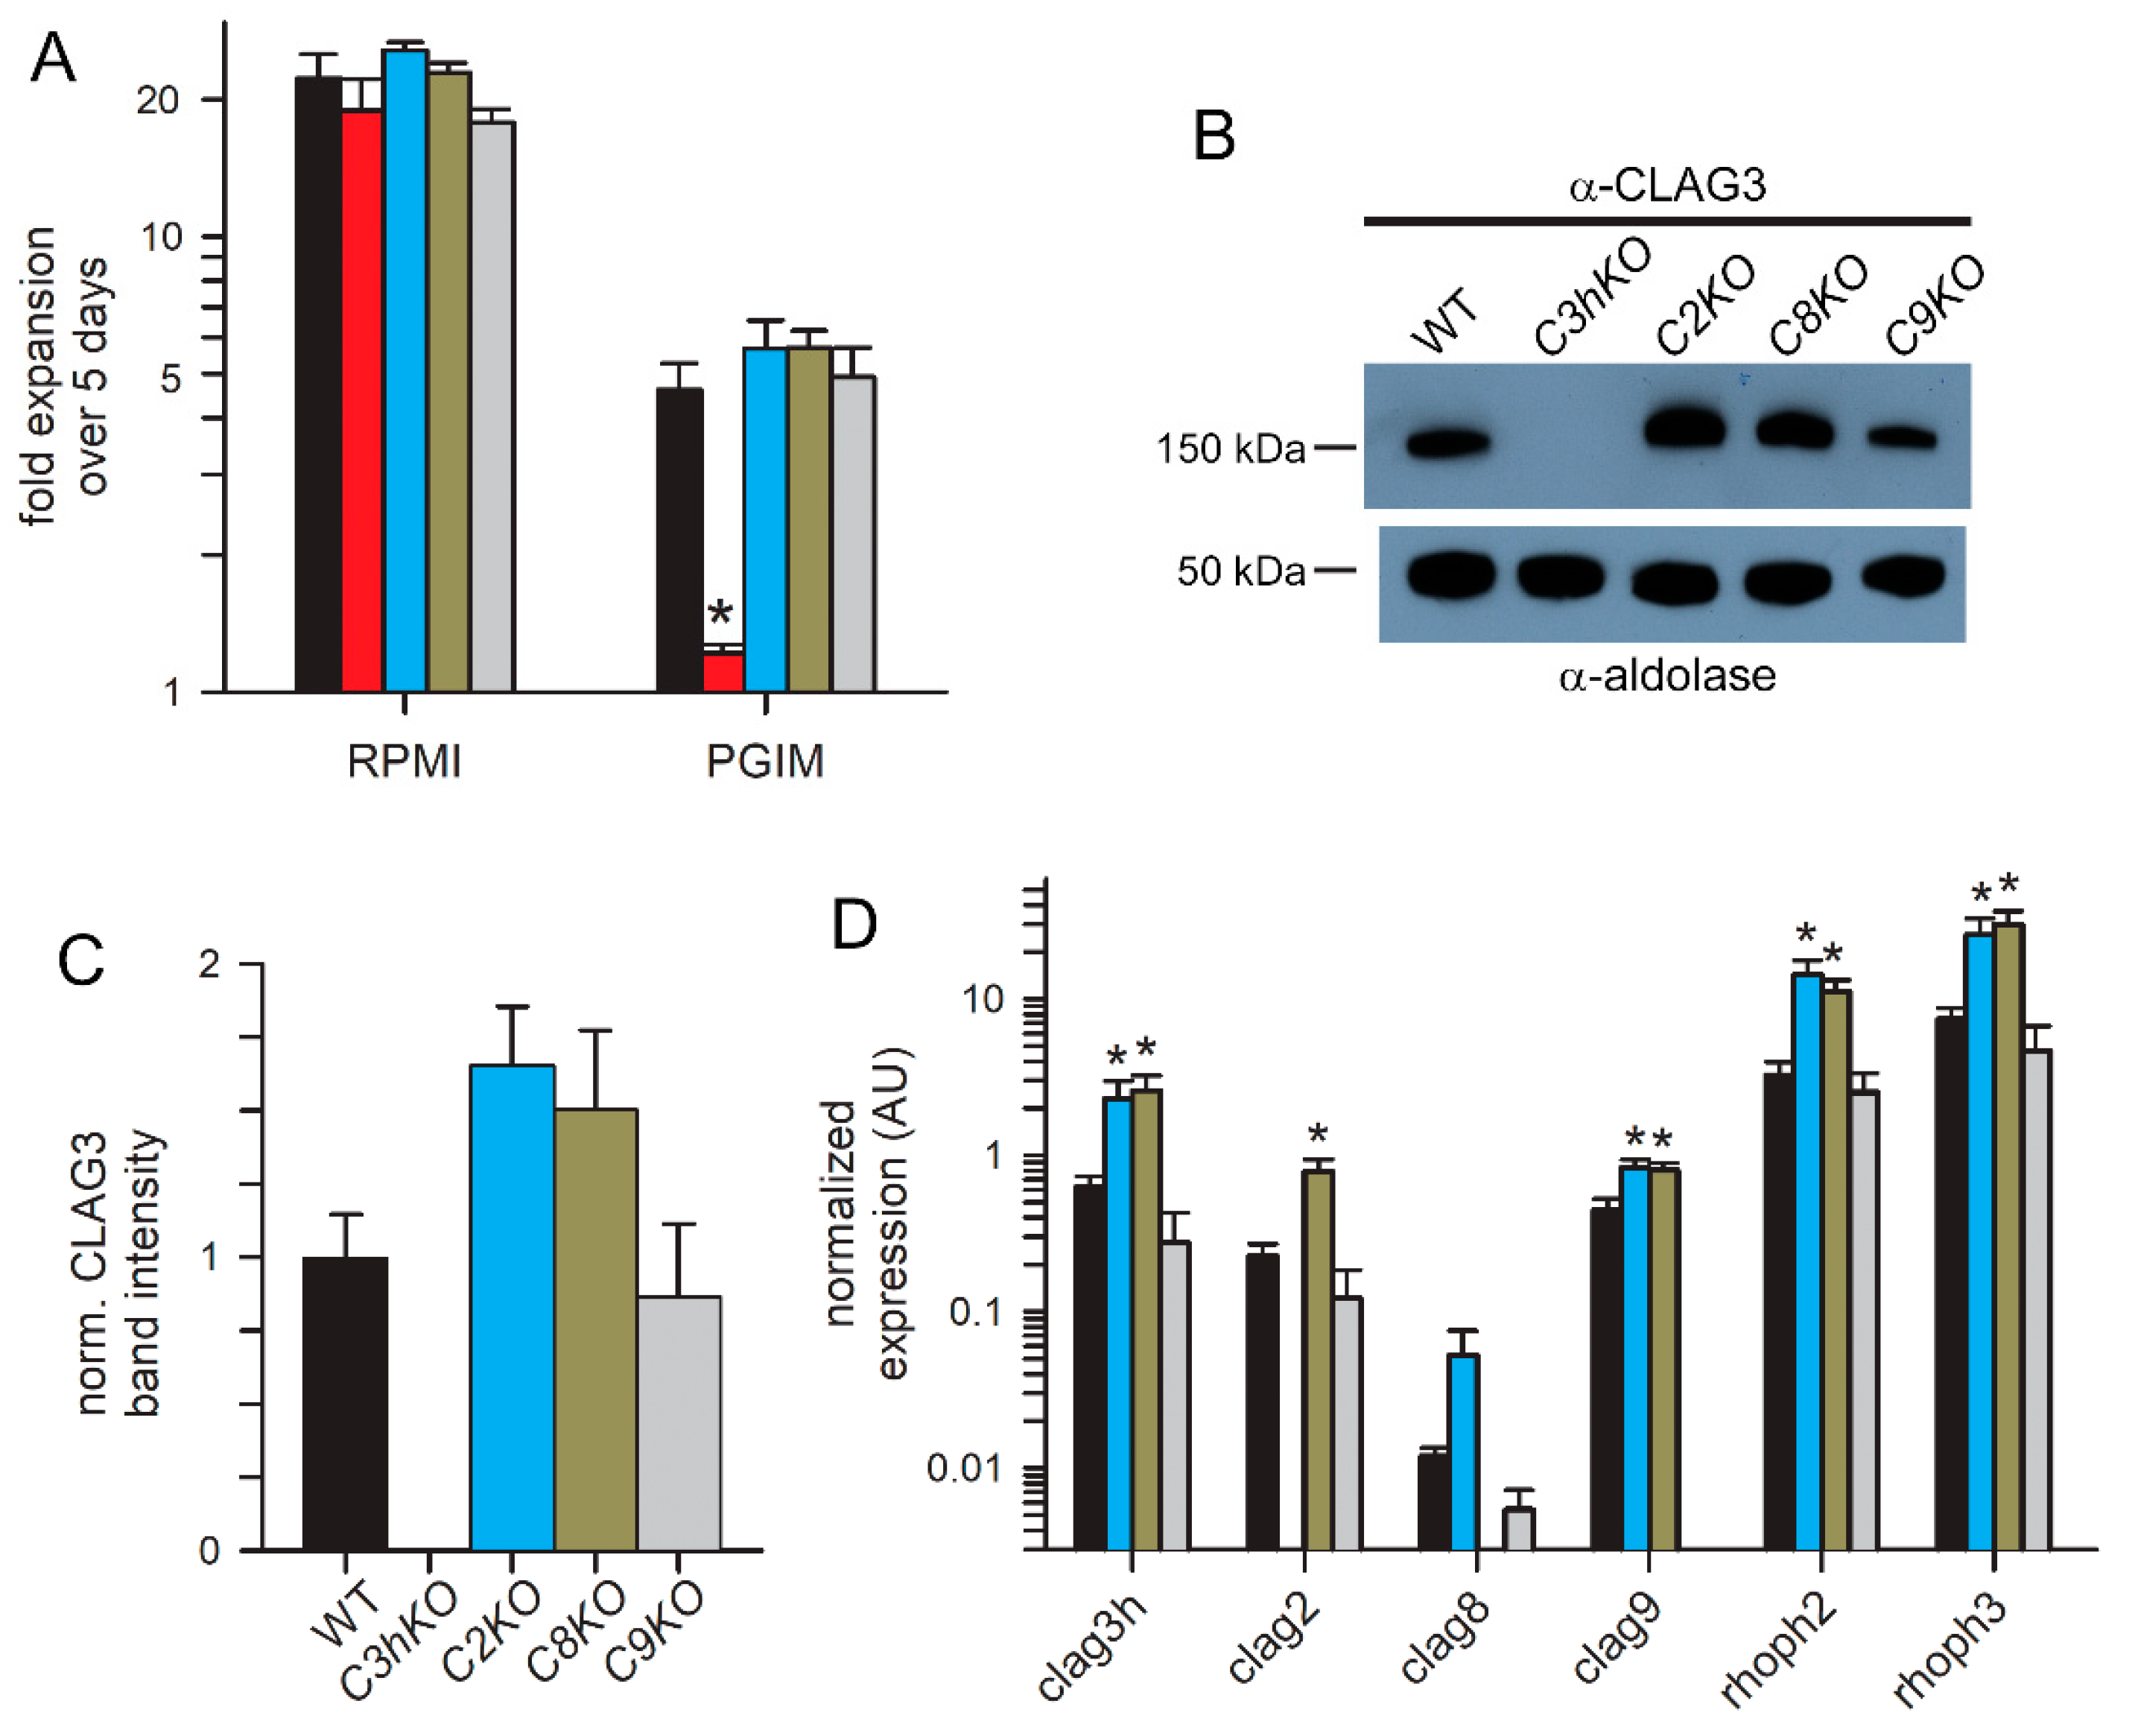
3.3. Preserved Growth in Nutrient-Restricted Medium and Compensatory Changes in Knockout Lines
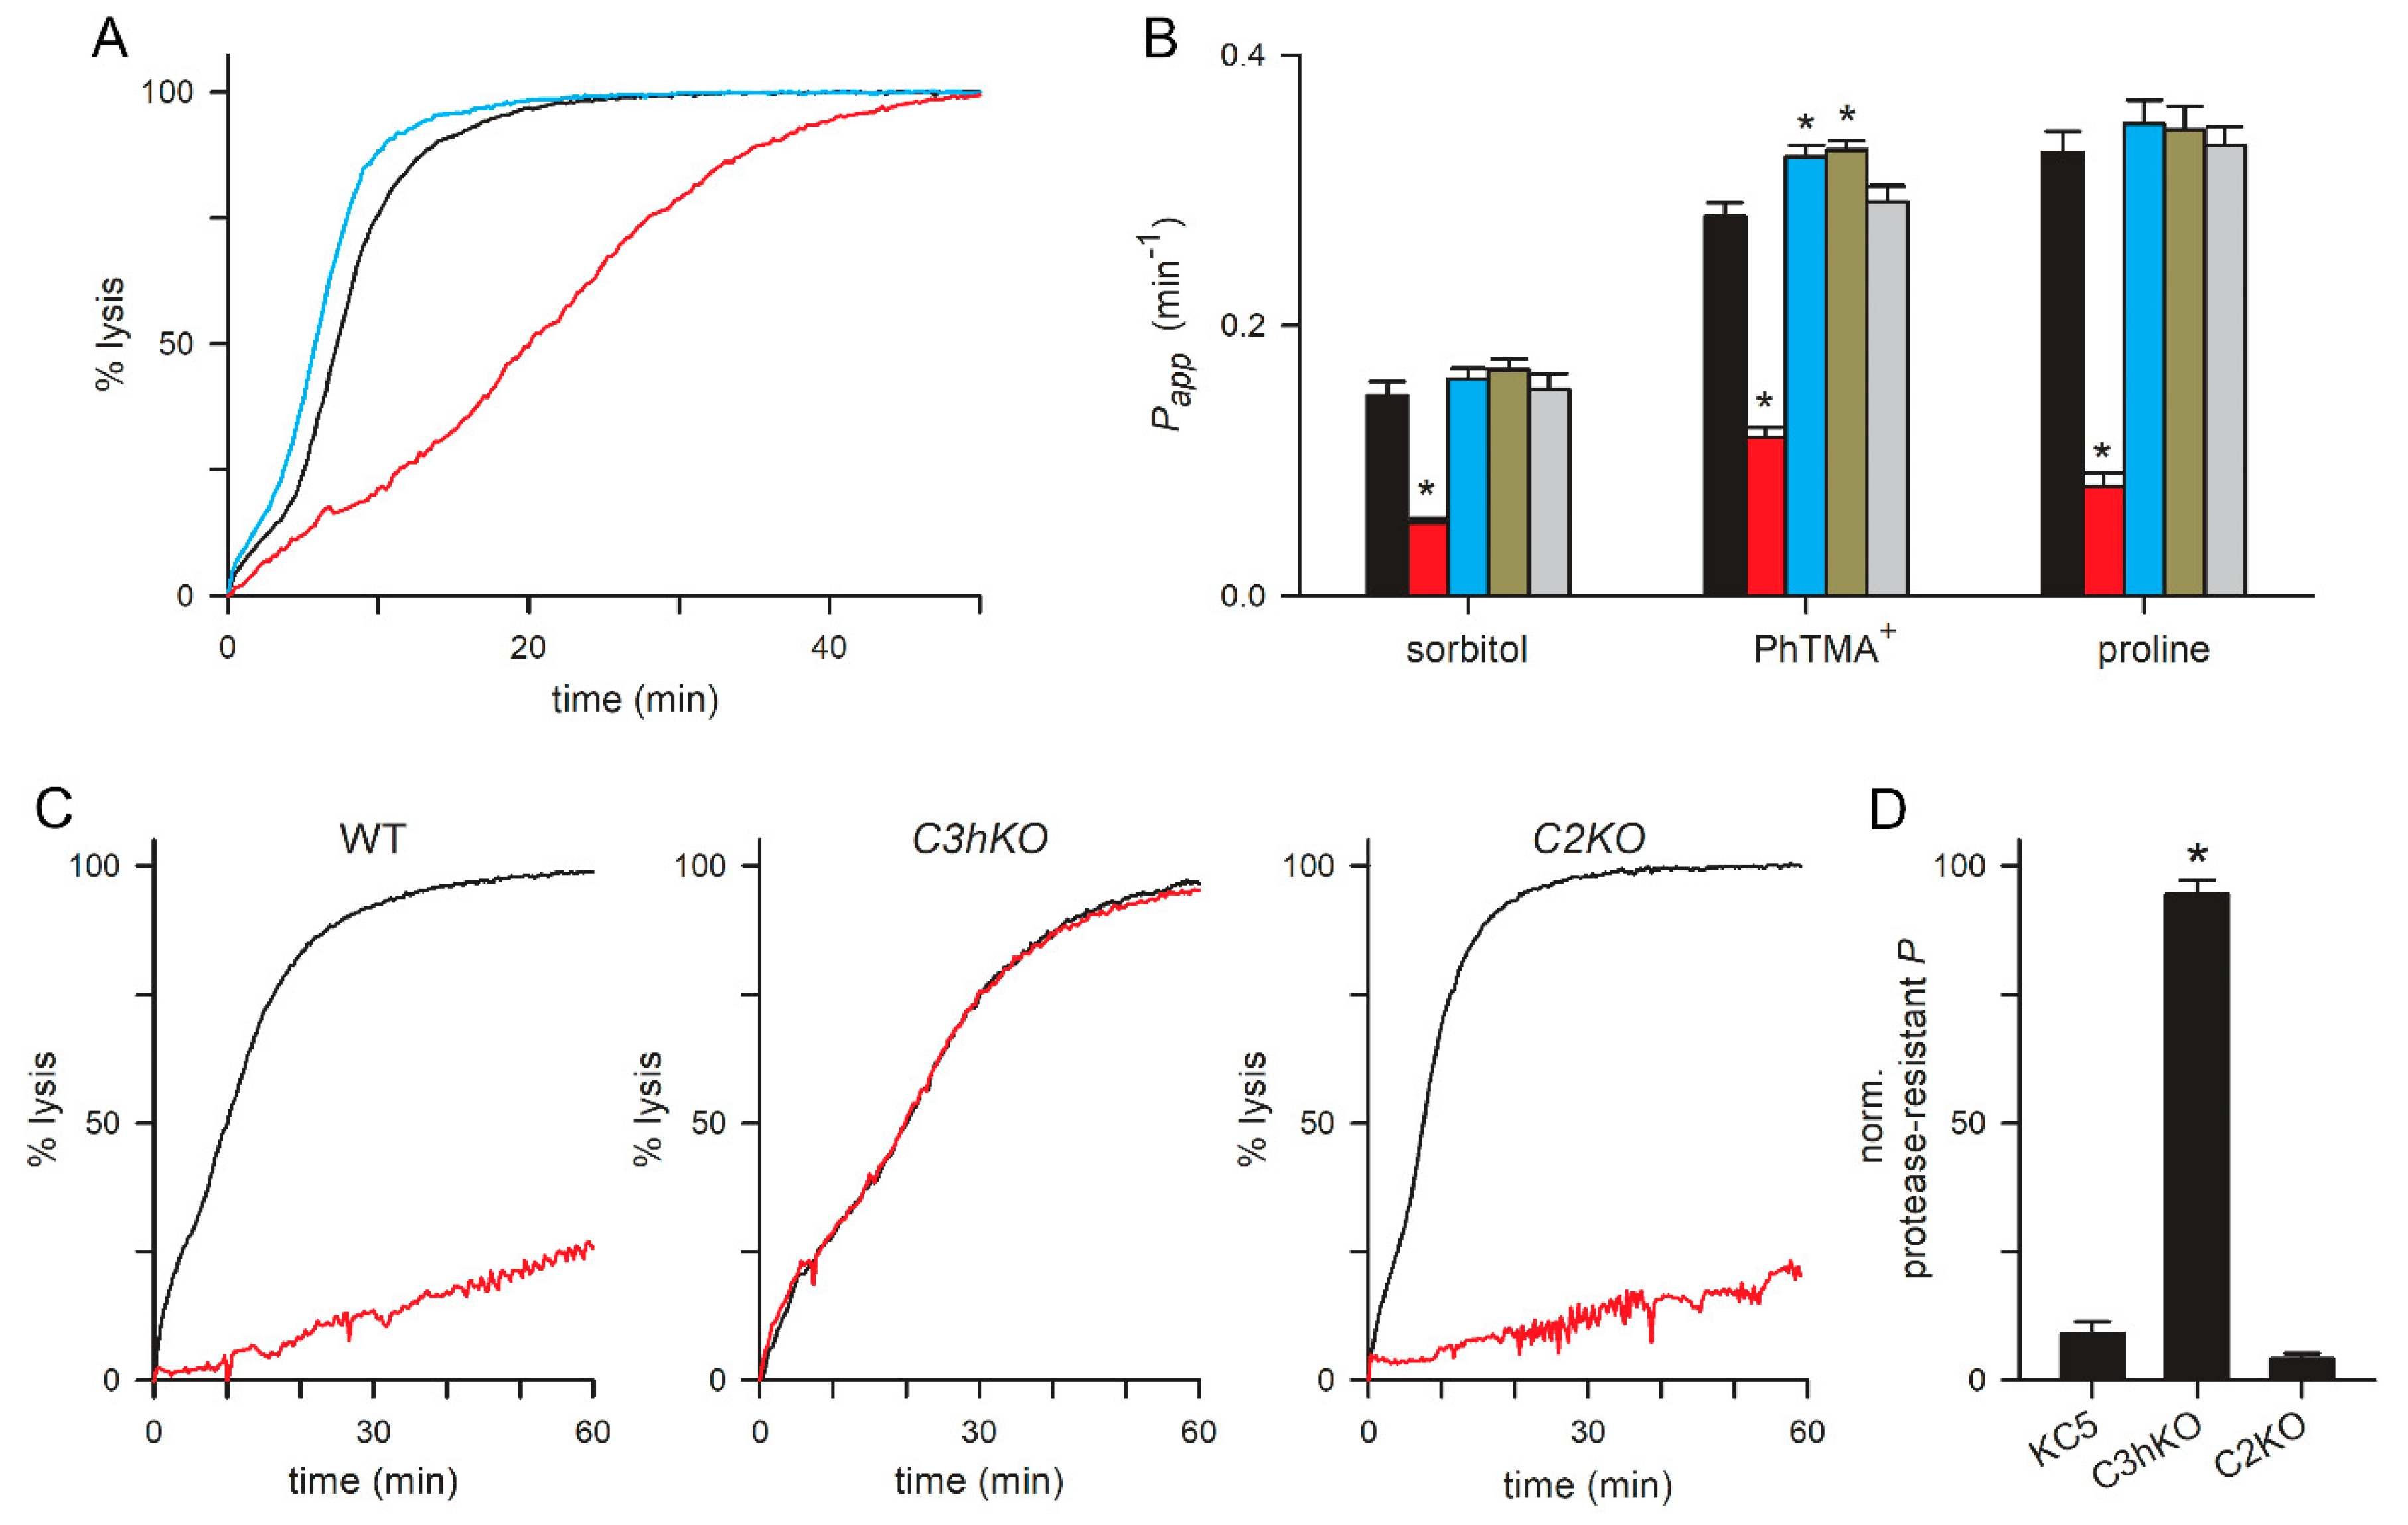
3.4. PSAC Transport Phenotypes of CLAG Knockout Lines
3.5. No significant Change in PSAC Pharmacology
4. Discussion
Supplementary Materials
Author Contributions
Funding
Data Availability Statement
Acknowledgments
Conflicts of Interest
References
- de Koning-Ward, T.F.; Dixon, M.W.; Tilley, L.; Gilson, P.R. Plasmodium species: master renovators of their host cells. Nat Rev Microbiol 2016, 14, 494–507. [Google Scholar] [CrossRef]
- Gabelich, J.A.; Grutzke, J.; Kirscht, F.; Popp, O.; Matz, J.M.; Dittmar, G.; Rug, M.; Ingmundson, A. A member of the tryptophan-rich protein family is required for efficient sequestration of Plasmodium berghei schizonts. PLoS Pathog 2022, 18, e1010846. [Google Scholar] [CrossRef]
- Wahlgren, M.; Goel, S.; Akhouri, R.R. Variant surface antigens of Plasmodium falciparum and their roles in severe malaria. Nat Rev Microbiol 2017, 15, 479–491. [Google Scholar] [CrossRef]
- Janssen, C.S.; Phillips, R.S.; Turner, C.M.; Barrett, M.P. Plasmodium interspersed repeats: the major multigene superfamily of malaria parasites. Nucleic Acids Res 2004, 32, 5712–5720. [Google Scholar] [CrossRef] [PubMed]
- Goo, Y.K. Vivax malaria and the potential role of the subtelomeric multigene vir superfamily. Microorganisms 2022, 10. [Google Scholar] [CrossRef]
- Kirkman, L.A.; Deitsch, K.W. Recombination and diversification of the variant antigen encoding genes in the malaria parasite Plasmodium falciparum. Microbiol Spectr 2014, 2. [Google Scholar] [CrossRef]
- Deitsch, K.W.; Dzikowski, R. Variant gene expression and antigenic variation by malaria parasites. Annu Rev Microbiol 2017, 71, 625–641. [Google Scholar] [CrossRef] [PubMed]
- Gupta, A.; Thiruvengadam, G.; Desai, S.A. The conserved clag multigene family of malaria parasites: essential roles in host-pathogen interaction. Drug Resist. Updat 2015, 18, 47–54. [Google Scholar] [CrossRef] [PubMed]
- Otto, T.D.; Bohme, U.; Sanders, M.; Reid, A.; Bruske, E.I.; Duffy, C.W.; Bull, P.C.; Pearson, R.D.; Abdi, A.; Dimonte, S.; et al. Long read assemblies of geographically dispersed Plasmodium falciparum isolates reveal highly structured subtelomeres. Wellcome Open Res 2018, 3, 52. [Google Scholar] [CrossRef]
- Otto, T.D.; Gilabert, A.; Crellen, T.; Bohme, U.; Arnathau, C.; Sanders, M.; Oyola, S.O.; Okouga, A.P.; Boundenga, L.; Willaume, E.; et al. Genomes of all known members of a Plasmodium subgenus reveal paths to virulent human malaria. Nat Microbiol 2018, 3, 687–697. [Google Scholar] [CrossRef]
- Iriko, H.; Kaneko, O.; Otsuki, H.; Tsuboi, T.; Su, X.Z.; Tanabe, K.; Torii, M. Diversity and evolution of the rhoph1/clag multigene family of Plasmodium falciparum. Mol Biochem. Parasitol 2008, 158, 11–21. [Google Scholar] [CrossRef]
- Pillai, A.D.; Nguitragool, W.; Lyko, B.; Dolinta, K.; Butler, M.M.; Nguyen, S.T.; Peet, N.P.; Bowlin, T.L.; Desai, S.A. Solute restriction reveals an essential role for clag3-associated channels in malaria parasite nutrient acquisition. Mol. Pharmacol 2012, 82, 1104–1114. [Google Scholar] [CrossRef]
- Cortes, A.; Carret, C.; Kaneko, O.; Yim Lim, B.Y.; Ivens, A.; Holder, A.A. Epigenetic silencing of Plasmodium falciparum genes linked to erythrocyte invasion. PLoS. Pathog 2007, 3, e107. [Google Scholar] [CrossRef]
- Trenholme, K.R.; Gardiner, D.L.; Holt, D.C.; Thomas, E.A.; Cowman, A.F.; Kemp, D.J. clag9: A cytoadherence gene in Plasmodium falciparum essential for binding of parasitized erythrocytes to CD36. Proc. Natl. Acad. Sci. U. S. A 2000, 97, 4029–4033. [Google Scholar] [CrossRef] [PubMed]
- Goel, S.; Valiyaveettil, M.; Achur, R.N.; Goyal, A.; Mattei, D.; Salanti, A.; Trenholme, K.R.; Gardiner, D.L.; Gowda, D.C. Dual stage synthesis and crucial role of cytoadherence-linked asexual gene 9 in the surface expression of malaria parasite var proteins. Proc. Natl. Acad. Sci. U. S. A 2010, 107, 16643–16648. [Google Scholar] [CrossRef] [PubMed]
- Nacer, A.; Roux, E.; Pomel, S.; Scheidig-Benatar, C.; Sakamoto, H.; Lafont, F.; Scherf, A.; Mattei, D. Clag9 is not essential for PfEMP1 surface expression in non-cytoadherent Plasmodium falciparum parasites with a chromosome 9 deletion. PLoS. One 2011, 6, e29039. [Google Scholar] [CrossRef]
- Kaneko, O. Erythrocyte invasion: vocabulary and grammar of the Plasmodium rhoptry. Parasitol. Int 2007, 56, 255–262. [Google Scholar] [CrossRef]
- Desai, S.A.; Bezrukov, S.M.; Zimmerberg, J. A voltage-dependent channel involved in nutrient uptake by red blood cells infected with the malaria parasite. Nature 2000, 406, 1001–1005. [Google Scholar] [CrossRef] [PubMed]
- Nguitragool, W.; Bokhari, A.A.; Pillai, A.D.; Rayavara, K.; Sharma, P.; Turpin, B.; Aravind, L.; Desai, S.A. Malaria parasite clag3 genes determine channel-mediated nutrient uptake by infected red blood cells. Cell 2011, 145, 665–677. [Google Scholar] [CrossRef]
- Nguitragool, W.; Rayavara, K.; Desai, S.A. Proteolysis at a specific extracellular residue implicates integral membrane CLAG3 in malaria parasite nutrient channels. PLoS. One 2014, 9, e93759. [Google Scholar] [CrossRef]
- Sharma, P.; Wollenberg, K.; Sellers, M.; Zainabadi, K.; Galinsky, K.; Moss, E.; Nguitragool, W.; Neafsey, D.; Desai, S.A. An epigenetic antimalarial resistance mechanism involving parasite genes linked to nutrient uptake. J. Biol. Chem 2013, 288, 19429–19440. [Google Scholar] [CrossRef] [PubMed]
- Sharma, P.; Rayavara, K.; Ito, D.; Basore, K.; Desai, S.A. A CLAG3 mutation in an amphipathic transmembrane domain alters malaria parasite nutrient channels and confers leupeptin resistance. Infect. Immun 2015, 83, 2566–2574. [Google Scholar] [CrossRef] [PubMed]
- Mira-Martinez, S.; Rovira-Graells, N.; Crowley, V.M.; Altenhofen, L.M.; Llinas, M.; Cortes, A. Epigenetic switches in clag3 genes mediate blasticidin S resistance in malaria parasites. Cell Microbiol 2013, 15, 1913–1923. [Google Scholar] [CrossRef] [PubMed]
- Gupta, A.; Bokhari, A.A.B.; Pillai, A.D.; Crater, A.K.; Gezelle, J.; Saggu, G.; Nasamu, A.S.; Ganesan, S.M.; Niles, J.C.; Desai, S.A. Complex nutrient channel phenotypes despite Mendelian inheritance in a Plasmodium falciparum genetic cross. PLoS Pathog 2020, 16, e1008363. [Google Scholar] [CrossRef] [PubMed]
- Bokhari, A.A.; Solomon, T.; Desai, S.A. Two distinct mechanisms of transport through the plasmodial surface anion channel. J. Membr. Biol 2008, 226, 27–34. [Google Scholar] [CrossRef] [PubMed]
- Corpet, F. Multiple sequence alignment with hierarchical clustering. Nucleic Acids Res 1988, 16, 10881–10890. [Google Scholar] [CrossRef] [PubMed]
- Kall, L.; Krogh, A.; Sonnhammer, E.L. A combined transmembrane topology and signal peptide prediction method. J. Mol. Biol 2004, 338, 1027–1036. [Google Scholar] [CrossRef] [PubMed]
- Dunnett, C.W. New tables for multiple comparisons with a control. Biometrics 1964, 20, 482–491. [Google Scholar] [CrossRef]
- Gupta, A.; Balabaskaran-Nina, P.; Nguitragool, W.; Saggu, G.S.; Schureck, M.A.; Desai, S.A. CLAG3 self-associates in malaria parasites and quantitatively determines nutrient uptake channels at the host membrane. mBio 2018, 9, e02293–17. [Google Scholar] [CrossRef]
- Ganesan, S.M.; Falla, A.; Goldfless, S.J.; Nasamu, A.S.; Niles, J.C. Synthetic RNA-protein modules integrated with native translation mechanisms to control gene expression in malaria parasites. Nat Commun 2016, 7, 10727. [Google Scholar] [CrossRef]
- Ling, I.T.; Florens, L.; Dluzewski, A.R.; Kaneko, O.; Grainger, M.; Yim Lim, B.Y.; Tsuboi, T.; Hopkins, J.M.; Johnson, J.R.; Torii, M.; et al. The Plasmodium falciparum clag9 gene encodes a rhoptry protein that is transferred to the host erythrocyte upon invasion. Mol Microbiol 2004, 52, 107–118. [Google Scholar] [CrossRef] [PubMed]
- Vincensini, L.; Fall, G.; Berry, L.; Blisnick, T.; Braun, B.C. The RhopH complex is transferred to the host cell cytoplasm following red blood cell invasion by Plasmodium falciparum. Mol Biochem. Parasitol 2008, 160, 81–89. [Google Scholar] [CrossRef] [PubMed]
- Ito, D.; Schureck, M.A.; Desai, S.A. An essential dual-function complex mediates erythrocyte invasion and channel-mediated nutrient uptake in malaria parasites. Elife 2017, 6, e23485. [Google Scholar] [CrossRef] [PubMed]
- Booth, P.J.; Clarke, J. Membrane protein folding makes the transition. Proc Natl Acad Sci U S A 2010, 107, 3947–3948. [Google Scholar] [CrossRef] [PubMed]
- Schureck, M.A.; Darling, J.E.; Merk, A.; Shao, J.; Daggupati, G.; Srinivasan, P.; Olinares, P.D.B.; Rout, M.P.; Chait, B.T.; Wollenberg, K.; et al. Malaria parasites use a soluble RhopH complex for erythrocyte invasion and an integral form for nutrient uptake. Elife 2021, 10. [Google Scholar] [CrossRef] [PubMed]
- Counihan, N.; Chisholm, S.A.; Bullen, H.E.; Srivastava, A.; Sanders, P.R.; Jonsdottir, T.K.; Weiss, G.E.; Ghosh, S.; Crabb, B.S.; Creek, D.J.; et al. Plasmodium falciparum parasites deploy RhopH2 into the host erythrocyte to obtain nutrients, grow and replicate. Elife 2017, 6. [Google Scholar] [CrossRef] [PubMed]
- Sherling, E.S.; Knuepfer, E.; Brzostowski, J.A.; Miller, L.H.; Blackman, M.J.; van, O.C. The Plasmodium falciparum rhoptry protein RhopH3 plays essential roles in host cell invasion and nutrient uptake. Elife 2017, 6. [Google Scholar] [CrossRef] [PubMed]
- Cabantchik, Z.I.; Kutner, S.; Krugliak, M.; Ginsburg, H. Anion transport inhibitors as suppressors of Plasmodium falciparum growth in in vitro cultures. Mol. Pharmacol 1983, 23, 92–99. [Google Scholar] [PubMed]
- Ginsburg, H.; Kutner, S.; Krugliak, M.; Cabantchik, Z.I. Characterization of permeation pathways appearing in the host membrane of Plasmodium falciparum infected red blood cells. Mol. Biochem. Parasitol 1985, 14, 313–322. [Google Scholar] [CrossRef]
- Saliba, K.J.; Horner, H.A.; Kirk, K. Transport and metabolism of the essential vitamin pantothenic acid in human erythrocytes infected with the malaria parasite Plasmodium falciparum. J. Biol. Chem 1998, 273, 10190–10195. [Google Scholar] [CrossRef]
- Staines, H.M.; Rae, C.; Kirk, K. Increased permeability of the malaria-infected erythrocyte to organic cations. Biochim. Biophys. Acta 2000, 1463, 88–98. [Google Scholar] [CrossRef] [PubMed]
- Gero, A.M.; Wood, A.M. New nucleoside transport pathways induced in the host erythrocyte membrane of malaria and Babesia infected cells. Adv. Exp. Med. Biol 1991, 309A, 169–172. [Google Scholar] [PubMed]
- Overman, R.R. Reversible cellular permeability alterations in disease. In vivo studies on sodium, potassium and chloride concentrations in erythrocytes of the malarious monkey. Am. J. Physiol 1948, 152, 113–121. [Google Scholar] [CrossRef] [PubMed]
- Ginsburg, H.; Stein, W.D. Biophysical analysis of novel transport pathways induced in red blood cell membranes. J. Membr. Biol 1987, 96, 1–10. [Google Scholar] [CrossRef] [PubMed]
- Breuer, W.V.; Kutner, S.; Sylphen, J.; Ginsburg, H.; Cabantchik, Z.I. Covalent modification of the permeability pathways induced in the human erythrocyte membrane by the malarial parasite Plasmodium falciparum. J. Cell Physiol 1987, 133, 55–63. [Google Scholar] [CrossRef] [PubMed]
- Pouvelle, B.; Spiegel, R.; Hsiao, L.; Howard, R.J.; Morris, R.L.; Thomas, A.P.; Taraschi, T.F. Direct access to serum macromolecules by intraerythrocytic malaria parasites. Nature 1991, 353, 73–75. [Google Scholar] [CrossRef] [PubMed]
- Staines, H.M.; Alkhalil, A.; Allen, R.J.; De Jonge, H.R.; Derbyshire, E.; Egee, S.; Ginsburg, H.; Hill, D.A.; Huber, S.M.; Kirk, K.; et al. Electrophysiological studies of malaria parasite-infected erythrocytes: current status. Int. J Parasitol 2007, 37, 475–482. [Google Scholar] [CrossRef] [PubMed]
- Huber, S.M.; Duranton, C.; Lang, F. Patch-clamp analysis of the “new permeability pathways” in malaria-infected erythrocytes. Int. Rev. Cytol 2005, 246, 59–134. [Google Scholar] [PubMed]
- Verloo, P.; Kocken, C.H.; Van der Wel, A.; Tilly, B.C.; Hogema, B.M.; Sinaasappel, M.; Thomas, A.W.; De Jonge, H.R. Plasmodium falciparum-activated chloride channels are defective in erythrocytes from cystic fibrosis patients. J. Biol. Chem 2004, 279, 10316–10322. [Google Scholar] [CrossRef]
- Hill, D.A.; Pillai, A.D.; Nawaz, F.; Hayton, K.; Doan, L.; Lisk, G.; Desai, S.A. A blasticidin S-resistant Plasmodium falciparum mutant with a defective plasmodial surface anion channel. Proc Natl Acad Sci U S A 2007, 104, 1063–1068. [Google Scholar] [CrossRef]
- Lisk, G.; Pain, M.; Gluzman, I.Y.; Kambhampati, S.; Furuya, T.; Su, X.Z.; Fay, M.P.; Goldberg, D.E.; Desai, S.A. Changes in the plasmodial surface anion channel reduce leupeptin uptake and can confer drug resistance in P. falciparum-infected erythrocytes. Antimicrob. Agents Chemother 2008, 52, 2346–2354. [Google Scholar] [CrossRef] [PubMed]
- Holder, A.A.; Freeman, R.R.; Uni, S.; Aikawa, M. Isolation of a Plasmodium falciparum rhoptry protein. Mol. Biochem. Parasitol 1985, 14, 293–303. [Google Scholar] [CrossRef] [PubMed]
- Mira-Martinez, S.; Pickford, A.K.; Rovira-Graells, N.; Guetens, P.; Tinto-Font, E.; Cortes, A.; Rosanas-Urgell, A. Identification of antimalarial compounds that require CLAG3 for their uptake by Plasmodium falciparum-infected erythrocytes. Antimicrob Agents Chemother 2019, 63, e00052–19. [Google Scholar] [CrossRef] [PubMed]
- Rovira-Graells, N.; Crowley, V.M.; Bancells, C.; Mira-Martinez, S.; Ribas de, P.L.; Cortes, A. Deciphering the principles that govern mutually exclusive expression of Plasmodium falciparum clag3 genes. Nucleic Acids Res 2015, 43, 8243–8257. [Google Scholar] [CrossRef] [PubMed]
- Mira-Martinez, S.; van Schuppen, E.; Amambua-Ngwa, A.; Bottieau, E.; Affara, M.; Van Esbroeck, M.; Vlieghe, E.; Guetens, P.; Rovira-Graells, N.; Gomez-Perez, G.P.; et al. Expression of the Plasmodium falciparum clonally variant clag3 genes in human infections. J Infect Dis 2017, 215, 938–945. [Google Scholar] [CrossRef]
- Desai, S.A. Epigenetics of malaria parasite nutrient uptake, but why? Trends Parasitol 2022, 38, 618–628. [Google Scholar] [CrossRef] [PubMed]
- Liu, J.; Istvan, E.S.; Gluzman, I.Y.; Gross, J.; Goldberg, D.E. Plasmodium falciparum ensures its amino acid supply with multiple acquisition pathways and redundant proteolytic enzyme systems. Proc. Natl. Acad. Sci. U. S. A 2006, 103, 8840–8845. [Google Scholar] [CrossRef]
- Istvan, E.S.; Dharia, N.V.; Bopp, S.E.; Gluzman, I.; Winzeler, E.A.; Goldberg, D.E. Validation of isoleucine utilization targets in Plasmodium falciparum. Proc. Natl. Acad. Sci. U. S. A 2011, 108, 1627–1632. [Google Scholar] [CrossRef]
- Butler, M.M.; Waidyarachchi, S.L.; Shao, J.; Nguyen, S.T.; Ding, X.; Cardinale, S.C.; Morin, L.R.; Kwasny, S.M.; Ito, M.; Gezelle, J.; et al. Optimized pyridazinone nutrient channel inhibitors are potent and specific antimalarial leads. Mol Pharmacol 2022, 102, 172–182. [Google Scholar] [CrossRef]


Disclaimer/Publisher’s Note: The statements, opinions and data contained in all publications are solely those of the individual author(s) and contributor(s) and not of MDPI and/or the editor(s). MDPI and/or the editor(s) disclaim responsibility for any injury to people or property resulting from any ideas, methods, instructions or products referred to in the content. |
© 2024 by the authors. Licensee MDPI, Basel, Switzerland. This article is an open access article distributed under the terms and conditions of the Creative Commons Attribution (CC BY) license (http://creativecommons.org/licenses/by/4.0/).


