Submitted:
02 July 2024
Posted:
03 July 2024
You are already at the latest version
Abstract
As the automotive industry undergoes a phase of rapid transformation driven by technological advancements, the integration of driving simulators stands out as an important tool for research and development. The usage of such simulators offers a controlled environment for studying driver behavior; the alignment of data, however, remains a complex aspect that warrants a thorough investigation. This research investigates driver state classification using a dataset obtained from real-road and simulated conditions, recorded through JINS MEME ES_R smart glasses. The data set encompasses electrooculography signals, with a focus on standardizing and processing data for subsequent analysis. For this purpose, we used a recurrent neural network model, which yielded a high accuracy on the testing dataset (86.5%). The findings of this study indicate that the proposed methodology could be used in real scenarios and that it could be used for the development of intelligent transportation systems and driver monitoring technology.
Keywords:
electrooculography
; driving simulation
; real-world driving
; data distinctions
; biomedical signal processing
1. Introduction
Advancements in technology, particularly in data analysis, machine learning, and artificial intelligence, are driving a significant change in the way individual behaviors and activities are diagnosed, leading to more accurate health assessments and anomaly detection [1,2,3,4]. The field of biomedical engineering is witnessing growing interest, exemplified by studies such as that of Javaid et al., which underscores the integration of Fourth Industrial Revolution techniques into Medical 4.0 for analyzing data sourced from sensors, health monitors, and similar devices [5]. These technologies aim to quickly and objectively assess health and identify abnormal behaviors.
The Academic Pack, provided by JINS MEME ES_R, enables the development of algorithms supporting various applications such as road safety [6], human physical activity [7], recognition of hunger and satiety [8], cognitive activities [9], and emotional states [10].
As advances in technology continue to revolutionize the automotive industry, the integration of driving simulators has become an invaluable tool for research and development. The use of such simulators offers a controlled environment for studying driver behavior, vehicle system tests, and assessments of the impact of various interventions [11,12]. However, the question remains whether the data obtained in these simulation settings are relevant to driving experience in the real world. There are three main types of driving simulators based on their purpose and features:
- Desk-based driving simulators are simplified driving simulators that do not involve physical motion or elaborate setups. These types of simulators are used for training and educational purposes and focus more on cognitive aspects rather than physical feedback.
- Traditional driving simulators that typically include a physical setup resembling a car cockpit. They feature components such as monitors (for visual feedback), a steering wheel, pedals (accelerator, brake, and clutch), and sometimes a gear shifter. Users interact with the simulated environment through these physical controls that mimic real-world driving inputs. Traditional simulators are commonly used for driver training, entertainment, and basic skill development, as well as for research.
- Virtual Reality (VR)-based simulators that immerse users in a virtual environment using headsets or goggles. In this case, instead of physical controls, users manipulate the virtual world using gestures, head movements, and handheld controllers. VR-based simulators allow users to explore different scenarios and environments without needing a physical cockpit. These types of simulators are usually used for entertainment purposes.
For this work, we chose a traditional driving simulator that has previously been used in driving schools and has proven its usefulness in training novice drivers, as well as in research [13,14,15]. The traditional simulator provides a realistic driving experience due to its physical fidelity. Skills learned in traditional simulators often transfer better to real-world driving, as muscle memory and sensory cues play a crucial role in skill acquisition [13]. According to Malone and Brünken [16] the traditional driving simulator is as immersive as the VR-based simulator, but does not come with the risk of simulation sickness, which is a widely researched problem when using VR headsets in general [17,18].
This article focuses on the distinction between data recorded during actual on-road driving and simulated driving experiences, utilizing cutting-edge technology in the form of JINS MEME_R smart glasses. Equipped with an electrooculographic (EOG) sensor, as well as a 3-axis accelerometer and gyroscope, these smart glasses offer a unique opportunity to explore the intricacies of driver physiology and motion patterns [19]. The electrooculographic sensor tracks eye movement, providing insight into gaze behavior and cognitive load, while the accelerometer and gyroscope capture physical movements and orientations during driving.
By analyzing the data acquired from JINS MEME ES_R in both real and simulated driving scenarios, we seek to study the distinctions between these two environments. Our research addresses the challenges arising from the disparity between real-world complexities and the controlled conditions of simulators. Understanding these differences is crucial to improve the reliability and applicability of simulator-based studies, ensuring that insights derived from controlled settings can be effectively translated to real-world driving conditions. This investigation aims to deepen our understanding of the similarities between real and simulated driving data, contributing valuable information to the ongoing discourse on the use of advanced technologies in driving research.
2. Related Work
Spreading of fake (generated, simulated) data has emerged as a significant impediment to technological progress, particularly in the domains of big data analysis, machine learning, and artificial intelligence. This phenomenon has precipitated a profound change in the paradigm of diagnosing individual behaviors and actions, leading to more precise health evaluations and anomaly detection [20,21,22,23,24].
Unlike traditional information systems, vehicle safety data anomalies must be assessed in combination with the diversity of data anomalies, as well as the randomness and subjectivity of driver behavior. The question of how to integrate the characteristics of the Internet of Vehicles (IoV) data into the analysis of driving style to ensure efficient real-time anomaly detection has become an important issue. In [25], the validity of the data related to safe driving in the IoV serves as the foundation for improving vehicle safety. In this research, data are processed through traffic cellular automata, designed to maximize the efficiency of anomalous detection with limited computational resources. To increase the accuracy of their algorithm, the authors use both real and synthetic datasets in conjunction with multi-vehicle cooperation scenarios.
Advances in information processing and signal technology have a significant impact on autonomous driving (AD), improving driving safety and minimizing human driver efforts through advanced artificial intelligence (AI) technology [26]. Recently, deep learning (DL) approaches have solved several complex problems in the real world [27]. However, their strengths in the AD control process have not been thoroughly investigated or emphasized. Muhammad et al. pointed out that DL would remain limited to academic research and controlled testing environments unless this area of AI is actively pursued and that vehicular safety would not take advantage of the enormous potential of the field of Artificial Intelligence [26].
Due to the growing need to use sensors, health monitors, and similar devices in research, the market for manufacturers that specialize in the production of these sensors and monitors evolves. These manufacturers are increasingly innovating their designs to improve the accuracy and reliability of data collection, facilitating more effective monitoring of human physiological state and activities [28,29,30,31,32]. For example, Liu et al. explored the potential of wearable devices to identify driving activities and unsafe driving without relying on car information or sensors. In particular, the study investigates how inertial sensors mounted on the wrist, such as smart watches and fitness monitoring devices, can monitor the use of steering wheels. The tracking of the steering wheel rotation angle can improve the tracking of vehicle movement by mobile devices and help identify unsafe driving behaviors. This approach is based on a motion characteristic that allows the steering action to be differentiated from other hand movements. Their preliminary experiments have shown that the technology achieves a 99.9% accuracy in driving cases and can estimate rotation angles with an average error of less than two degrees [33].
Using advanced sensor technology and data analysis techniques, healthcare professionals can gain valuable insight into patient health status and detect anomalies in a timely manner [34,35,36,37]. The primary objective of these technologies is to facilitate efficient and objective health assessments while simultaneously identifying aberrant behaviors. According to Tsai et al., the development of methods to detect abnormal driving behaviors (ADB) in Taiwan is increasingly incorporating physiological features such as heart rate variability (HRV). The study proposes the use of machine learning techniques to predict instances of ADB, including speeding, abrupt steering, sudden braking, and aggressive acceleration by analyzing HRV parameters [38].
Driving simulators have become indispensable research and development tools due to their ability to provide a safe environment. These simulators offer a controlled environment to study driver behavior, evaluate vehicle systems, and evaluate the effectiveness of various interventions [14,15,39,40,41,42,43,44,45]. In the study by Amini et al., an experimental driving simulator project was introduced to test the main risk factors identified in the i-DREAMS project framework. The study aimed to provide detailed descriptions of risk scenarios for drivers, focusing on three primary risk factors: collisions with vulnerable road users (VRU), driver distraction, and adverse weather conditions. The authors designed three different driving scenarios: 1) monitoring scenarios without intervention, 2) scenarios without intervention, and 3) scenarios with intervention based on the driver’s state. The proposed real-time intervention aims to explore dynamic thresholds, which can be adjusted according to scenario conditions, such as driver distraction and weather. Conducting these studies in a simulator is essential to avoid putting human participants at risk [46].
Understanding the nuances and discrepancies between simulated and real-world driving data is essential to improve the reliability and applicability of simulator-based research [47,48,49,50,51,52]. Robbins et al. studied similarities between the visual attention of the driver at various intersections in simulators and on the road [53]. In the study, the authors compared drivers’ visual attention in high-fidelity driving simulators and on real roads under low and moderate driving demands. They found no significant differences in the frequency and magnitude of driver head movements between the simulator and real-world maneuvers. However, due to the lower visual activity in the simulation environment, differences appeared in the detailed measurement of eye movements. These findings suggest that driving simulators are valuable tools for studying driver visual attention, particularly at intersections, when driving tasks are at least moderately demanding.
Although there are multiple existing studies analyzing data from driving simulators [54] and discussing their fidelity [55], direct comparison and validation of the data, particularly with respect to eye movement patterns, remain unexplored. Our study addresses this gap by demonstrating that electrooculographic signals acquired during simulated driving are correlated with those recorded during real-road driving. Furthermore, as a first step towards simulated-to-real data transformation, we have developed a model capable of accurately classifying these data into real and simulated environments.
3. Materials and Methods
3.1. Dataset Description
The dataset used in this study comprises two distinct sets of data: recordings obtained in real-road conditions and in a simulated environment. Real-road data were collected from 30 subjects, including experienced and inexperienced drivers. Experienced drivers drove their own cars, while inexperienced drivers operated a specially designated and labeled vehicle under the guidance of an instructor. The person in charge of gathering data in both situations was sitting in the back seat. All drivers traveled an identical 28.7 km route, which included elements evaluated in the practical driving exam in Poland, specifically driving through intersections (X-shaped and circular) in each direction and parking (parallel, perpendicular and diagonal). A comprehensive description of the experimental protocol is provided in [56,57].
The simulated data were recorded using a professional driving simulator previously used at the driving school to train novice drivers. The components of the simulator stand included a computer with the Microsoft Windows 10 operating system, a steel structural framework with an adjustable chair, a set of Logitech controls (gearbox, pedals, and steering wheel), three 27-inch LED monitors designed for extended use, and dedicated software. The experimental setup for the simulation is extensively described in the work of Piaseczna et al. and Doniec et al. [11,58]. Data were recorded from 30 volunteers; sixteen subjects in this group had been holding a driver’s license for several years, while the rest had no or limited driving experience. Table 1 provides a summary description of the study group, a detailed description is available as supplementary material (File S1).
In both setups the data were captured using JINS MEME ES_R smart glasses (see Figure 1), which incorporate a 3-axis gyroscope, accelerometer, and a three-point electrooculography (EOG) sensor [19]. The types of data that can be recorded with these smart glasses are especially valuable in driving-related research [53,59,60,61]. The selection of these glasses was based on the assumption that they do not distract the driver and are suitable for use in a car environment [11,56,57,58,62]. To compare data between real-road and simulated environments, it is ideal to use the same type of equipment to record the data to avoid various kinds of bias. For this reason, the use of traditional driving simulator in this research is preferred over VR-based simulators, as it does not exert an influence on the head and face muscles, which would create a bias on the recorded signals.
The tasks performed by the individual driving the simulator mirrored those conducted in real-road conditions, that is, included driving through different types of intersections and different types of parking. In this case, each subject performed several repetitions of each activity. Both setups are illustrated in Figure 2.
The dataset consists of 390 recordings from driving in real road conditions and 1,829 recordings from driving on the simulator. The research adhered to the principles outlined in the Declaration of Helsinki and all participants gave their informed consent before participating in the study.
3.2. Data Processing
The smart glasses used provide two options (modes) for data recording: standard and full. In the full mode, all 10 signals were recorded at a sampling frequency of 100 Hz. The standard mode excludes signals from the gyroscope, recording the EOG signals at a frequency of 200 Hz. Given the lack of significant information observed in the gyroscope and accelerometer signals during the driving of the car simulator, and considering the feasibility of classifying the data solely on the basis of EOG, this study focused exclusively on the EOG signal [11,56].
To standardize the data, the signals recorded in full mode were upsampled to 200 Hz. Demonstrating the beneficial use of raw data, the only processing step involved reducing high frequency signal deflections by filtering the data with a 10th-order median filter applied for each signal channel. Various activities differ in performance time, but generally take longer while driving a real car. Therefore, we decided to perform the analysis based on the signal windows. The filtered signals were segmented into 200-sample (1s) windows with a 100-sample (0.5s) stride. We have chosen such parameters so that we preserve as much real data as possible and enable later application of the created classifier in real time. Subsequently, labels were added to the signals: 0 for simulated driving and 1 for real-road driving, facilitating the distinction (ground truth) between the two categories in the subsequent analysis. The process resulted in a set of 69,512 4-channel signals, including 44,225 data samples collected on the driving simulator (class: 0) and 25,287 data samples collected while driving on the road (class: 1).
3.3. Data Similarities
To check the similarity of signals in two categories, we first calculated general statistics for each signal channel for each class (see Table 2). To provide a visual summary of the central tendency, variability and outliers of the data, we generated box charts for each channel of the data (see Figure 3).
The analysis reveals differences in the means of the signals between two categories. In the next step, we confirm whether the differences are statistically significant by performing a one-way ANOVA analysis and Scheffé’s method for multiple comparison tests. For each test, we received a high F value and a p values = 0.
Despite the clear differences in the average values for signals belonging to different classes, their high intra-class variance can also be observed, which makes the classification of a single data sample not trivial. For this reason, we decided to perform an analysis to check for more specific dependencies between the signals between the groups. For that purpose, we normalized each signal using min-max normalization to ensure that the similarity measures reflect similarities in shape and timing between the signals, rather than being influenced by differences in amplitude. Next, for each pair of signals on the corresponding channels, we computed the following parameters:
- Pearson’s correlation coefficient,
- cross-correlation coefficient,
- maximum magnitude-square coherence,
- euclidean distance,
Comparing each signal from one category with each signal from the other category and computing the aforementioned parameters was performed on the signal widows and resulted in sixteen 44,225 x 25,287 matrices. To summarize the output and evaluate the overall similarity between the two categories, we decided to take into account the average, maximum, and minimum values of each channel, as well as their mean value (see Table 3, Table 5, Table 7, Table 9).
Pearson’s correlation coefficient is a measure of the linear relationship between two continuous variables. It quantifies the degree to which a change in one variable is associated with a change in another variable. The formula for the Pearson correlation coefficient r between two variables X and Y is following:
where:
- and are individual data points,
- and are the means of X and Y, respectively,
- ∑ denotes the summation over all data points [63].
Table 3 contains a summary of the values of the Pearson coefficients.

Table 3.
Pearson correlation coefficient statistics.
| Channel | Minimum | Maximum | Average |
|---|---|---|---|
| EOG_L | -0.9888 | 0.9637 | 0.0000 |
| EOG_R | -0.9757 | 0.9784 | 0.0000 |
| EOG_H | -0.9737 | 0.9629 | 0.0000 |
| EOG_V | -0.9748 | 0.9758 | 0.0000 |
| Average | -0.8504 | 0.8705 | 0.0000 |
The strength and direction of the linear relationship between two signals should be interpreted as follows:
- r close to 1 indicates strong positive linear relationship. As one variable increases, the other variable tends to increase.
- r close to -1 indicates a strong negative linear relationship. As one variable increases, the other variable tends to decrease.
- r close to 0 indicates a weak or no linear relationship. Changes in one variable do not predict changes in the other variable.
Table 4 shows the percentage of values for which the linear correlation coefficient r is within the specified ranges.
Most signal pairs are in the range of weak linear correlation, which means that there is only a slight linear relationship between them, i.e. changes in signal from one group are not linearly associated with changes in the signal from another group. However, the relationship between the signals might be non-linear.
Cross-correlation measures the similarity of two signals or time series data with different time delays. In other words, cross-correlation provides an intuitive way of measuring the similarity of signals by comparing them at different time shifts. The cross-correlation function is defined as follows:
where:
- is the cross-correlation function,
- and are the input signals,
The summary of the values of the cross-correlation coefficients is presented in Table 5.
Table 5.
Cross-correlation coefficient statistics.
| Channel | Minimum | Maximum | Average |
|---|---|---|---|
| EOG_L | 0.2109 | 0.9959 | 0.8111 |
| EOG_R | 0.2307 | 0.9995 | 0.8088 |
| EOG_H | 0.2281 | 0.9981 | 0.8032 |
| EOG_V | 0.2800 | 0.9994 | 0.8115 |
| Average | 0.5215 | 0.9716 | 0.8087 |
The value of the cross-correlation coefficient indicates the degree of similarity between two signals, and the strength of correlation should be interpreted in the same way as in linear correlation. For this purpose, we defined cross-correlation ranges, which are as follows:
- strong correlation: 0.7≤|r|≤1,
- moderate correlation: 0.4≤|r|<0.7,
- weak correlation: 0.1≤|r|<0.4,
- no correlation: |r|<0.1.
Given that the analysis did not show a negative correlation and the minimum correlation for signal pairs in the data set is greater than 0.2, in Table 6 we have provided a summary of the percentages of signal pairs for which the value of the cross-correlation coefficient r is within three of the specified ranges.
Table 6.
Percentage of signal pairs in specific range of cross-correlation coefficient r.
| Channel | r<0.4 | 0.4≤r<0.7 | r≥0.7 |
|---|---|---|---|
| EOG_L | 0.0086% | 7.6939% | 92.2934% |
| EOG_R | 0.0052% | 8.4710% | 91.5237% |
| EOG_H | 0.0074% | 8.9419% | 91.0506% |
| EOG_V | 0.0044% | 6.8368% | 93.1587% |
| Average | 0.0000% | 0.8886% | 99.1073% |
A strong cross-correlation suggests that the two signals have similar patterns or structures. For example, they might exhibit similar peaks and troughs at similar times. For most pairs of signals in the dataset, the value of the cross-correlation coefficient r was greater than 0.7, suggesting high similarity between the two groups of signals.
Spectral coherence is a measure of the similarity between two signals in the frequency domain. It quantifies how well the signals maintain a constant phase relationship over different frequencies. Magnitude Squared Coherence ranges from 0 to 1, where 0 indicates no coherence (independence) and 1 indicates perfect coherence (dependence). Although coherence is usually represented as a function of frequency, providing insights into the frequency-dependent relationship between two signals, a single scalar value can be useful for summarizing the overall coherence between two signals; therefore, we used a maximum value of the coherence function across all frequencies. This value indicates the highest degree of linear relationship between signals at any frequency. The maximum value of magnitude squared coherence between two signals and is given by:
where is the cross power spectral density of and , is the power spectral density of , and is the power spectral density of [66]. Table 7 presents summary of maximum magnitude-square coherence values between the two groups of signals.
Table 7.
Maximum magnitude-square coherence statistics.
| Channel | Minimum | Maximum | Average |
|---|---|---|---|
| EOG_L | 0.0055 | 0.9999 | 0.8368 |
| EOG_R | 0.0048 | 0.9999 | 0.8354 |
| EOG_H | 0.1272 | 0.9994 | 0.8314 |
| EOG_V | 0.1332 | 0.9999 | 0.8379 |
| Average | 0.3549 | 0.9933 | 0.8354 |
The higher the magnitude-square coherence value, the greater the similarity of a pair of signals at a given frequency. In Table 8, we have shown the percentage of signals for which the maximum magnitude-square coherence C is within specific ranges.
Table 8.
Percentage of signal pairs in specific range of magnitude-square coherence value C.
| Channel | C<0.4 | 0.4≤C<0.7 | C≥0.7 |
|---|---|---|---|
| EOG_L | 0.3161% | 11.6373% | 88.0426% |
| EOG_R | 0.3014% | 11.6509% | 88.0476% |
| EOG_H | 0.1611% | 12.1719% | 87.6668% |
| EOG_V | 0.1346% | 11.1321% | 88.7332% |
| Average | 0.0001% | 5.8344% | 94.1614% |
For most signal pairs, the maximum magnitude-square coherence value is greater than 0.7, suggesting a frequency match between the two signal groups.
The Euclidean distance is a measure of the "straight-line" distance between two points in Euclidean space. When applied to signals, it quantifies the difference between two signals by treating each pair of corresponding samples as points in a multi-dimensional space. The Euclidean distance d between two signals x and y, each consisting of n samples, is given by:
where:
- and are the i-th samples of the signals and , respectively,
- n is the number of samples in each signal.
A summary of the distances between the two groups of signals is presented in Table 9.
Table 9.
Euclidean distance statistics.
| Channel | Minimum | Maximum | Average |
|---|---|---|---|
| EOG_L | 0.4622 | 13.3734 | 5.6198 |
| EOG_R | 0.4777 | 12.8738 | 5.5314 |
| EOG_H | 0.7980 | 12.7638 | 5.2635 |
| EOG_V | 0.5217 | 13.5402 | 5.4781 |
| Average | 1.6050 | 12.4880 | 5.4732 |
For normalized signals, similarity can be defined by the Euclidean distance at the level of a few units. Table 10 shows the percentage of signal pairs for which the Euclidean distance d is within specific ranges.
Table 10.
Euclidean distance distribution range
| Channel | d<4 | 4≤d<8 | 8≤d<12 | d>12 |
|---|---|---|---|---|
| EOG_L | 4.5726% | 90.9342% | 4.4866% | 0.0063% |
| EOG_R | 5.0649% | 91.4666% | 3.4644% | 0.0039% |
| EOG_H | 6.7816% | 92.2690% | 0.9487% | 0.0004% |
| EOG_V | 5.3111% | 91.4697% | 3.2150% | 0.0040% |
| Average | 1.2409% | 97.4667% | 1.2922% | 3.5869% |
For most pairs of signals, the Euclidean distance d is in the range of 4 - 8, suggesting a high similarity between the two groups of signals.
Taking into account that the signals show a high degree of similarity, extracting meaningful features for classification can be challenging. For this problem, we decided to incorporate neural networks that can capture complex, nonlinear relationships in the data.
3.4. Classification
The classification task was implemented using a recurrent neural network architecture using MATLAB environment. The network comprises the following layers:
- Sequence Input Layer with 4 features (channels), normalized using z-score normalization,
- Bidirectional Long Short-Term Memory Layer with 100 units, in both forward and backward directions, capturing information from the past and future, configured to output the entire sequence,
- Dropout Layer randomly sets a half of input units to zero at each update during training time, which helps prevent overfitting.
- Bidirectional Long Short-Term Memory Layer with 50 units configured to output the entire sequence,
- Dropout Layer,
- Bidirectional Long Short-Term Memory Layer with 10 units, configured to output the last time step’s hidden state,
- Dropout Layer,
- Fully Connected Layer with 2 neurons for classification,
- Softmax Layer for probability distribution calculation,
- Classification Layer for labeling using class weights to address class imbalance.
Bidirectional LSTM (Long Short-Term Memory) models are commonly used for data classification tasks due to their ability to capture both past and future context. The bidirectional nature of LSTM models makes them well suited for these problems, especially when dealing with sequential data, where capturing context and long-term dependencies is essential for accurate classification [67,68,69].
To avoid overfitting to specific train-test data partitions, we employed the k-fold cross-validation technique. For that purpose, we split the data into five subsets (folds) and performed five model training iterations. We decided to choose five folds, as it provides a good compromise between high bias and high variance of the results [70,71,72].
In each iteration, we chose six subjects from each category to create a test dataset – this set was held out to prevent the data leaks and thus to test the models performance on a completely new data. The remaining data were used to train the model. The data distribution for each training iteration in the training and testing dataset is presented in Figure 4.
We aim to keep the number of subjects in the test set equal so that the performance of the model is as accurate as possible in different cases. Therefore, the size of each iteration varies significantly.
Due to the class imbalance in our dataset, we decided to initialize the class weights to give higher importance to the underrepresented class (1) during the initial training phase, which can help the model learn better representations for those classes. For this, using the training dataset, we first calculated the class weights based on the formula:
where:
- N is the total number of samples in the dataset,
- is the number of samples in class i,
- C is the total number of classes.
Next, we normalize the class weights so that they sum up to the total number of classes. This step ensures that the weights collectively represent the importance of each class relative to the others. The normalized class weight for each class i was calculated as follows:
Finally, we initialized the weights in the classification layer of the neural network using the calculated normalized class weights [73]. Table 11 presents the class weights in each training iteration.
The training parameters were chosen based on common practices and initial testing and were set as follows:
- Optimization algorithm: Adam,
- Mini-batch size: 1000,
-
Learning rate:
- -
- Initial learning rate: 0.001,
- -
- Drop period: 5 epochs,
- -
- Drop factor: 0.5,
- -
- Schedule: Piecewise,
- Data shuffling: Every epoch,
- Sequence length: 200,
- Number of epochs: 20.
The presented configuration was designed to train a robust recurrent neural network for effective classification of the provided dataset. Adam (Adaptive Moment Estimation) is a popular optimization algorithm that combines the advantages of two other extensions of stochastic gradient descent: Adaptive Gradient Algorithm (AdaGrad) and Root Mean Square Propagation (RMSProp). The data is shuffled at the beginning of every epoch. Shuffling helps break the correlation between batches and makes the model more robust. The learning rate controls how much the model needs to change in response to the estimated error each time the model weights are updated. An initial value of 0.001 is a common starting point for many problems. The learning rate is halved every five epochs to prevent overfitting.
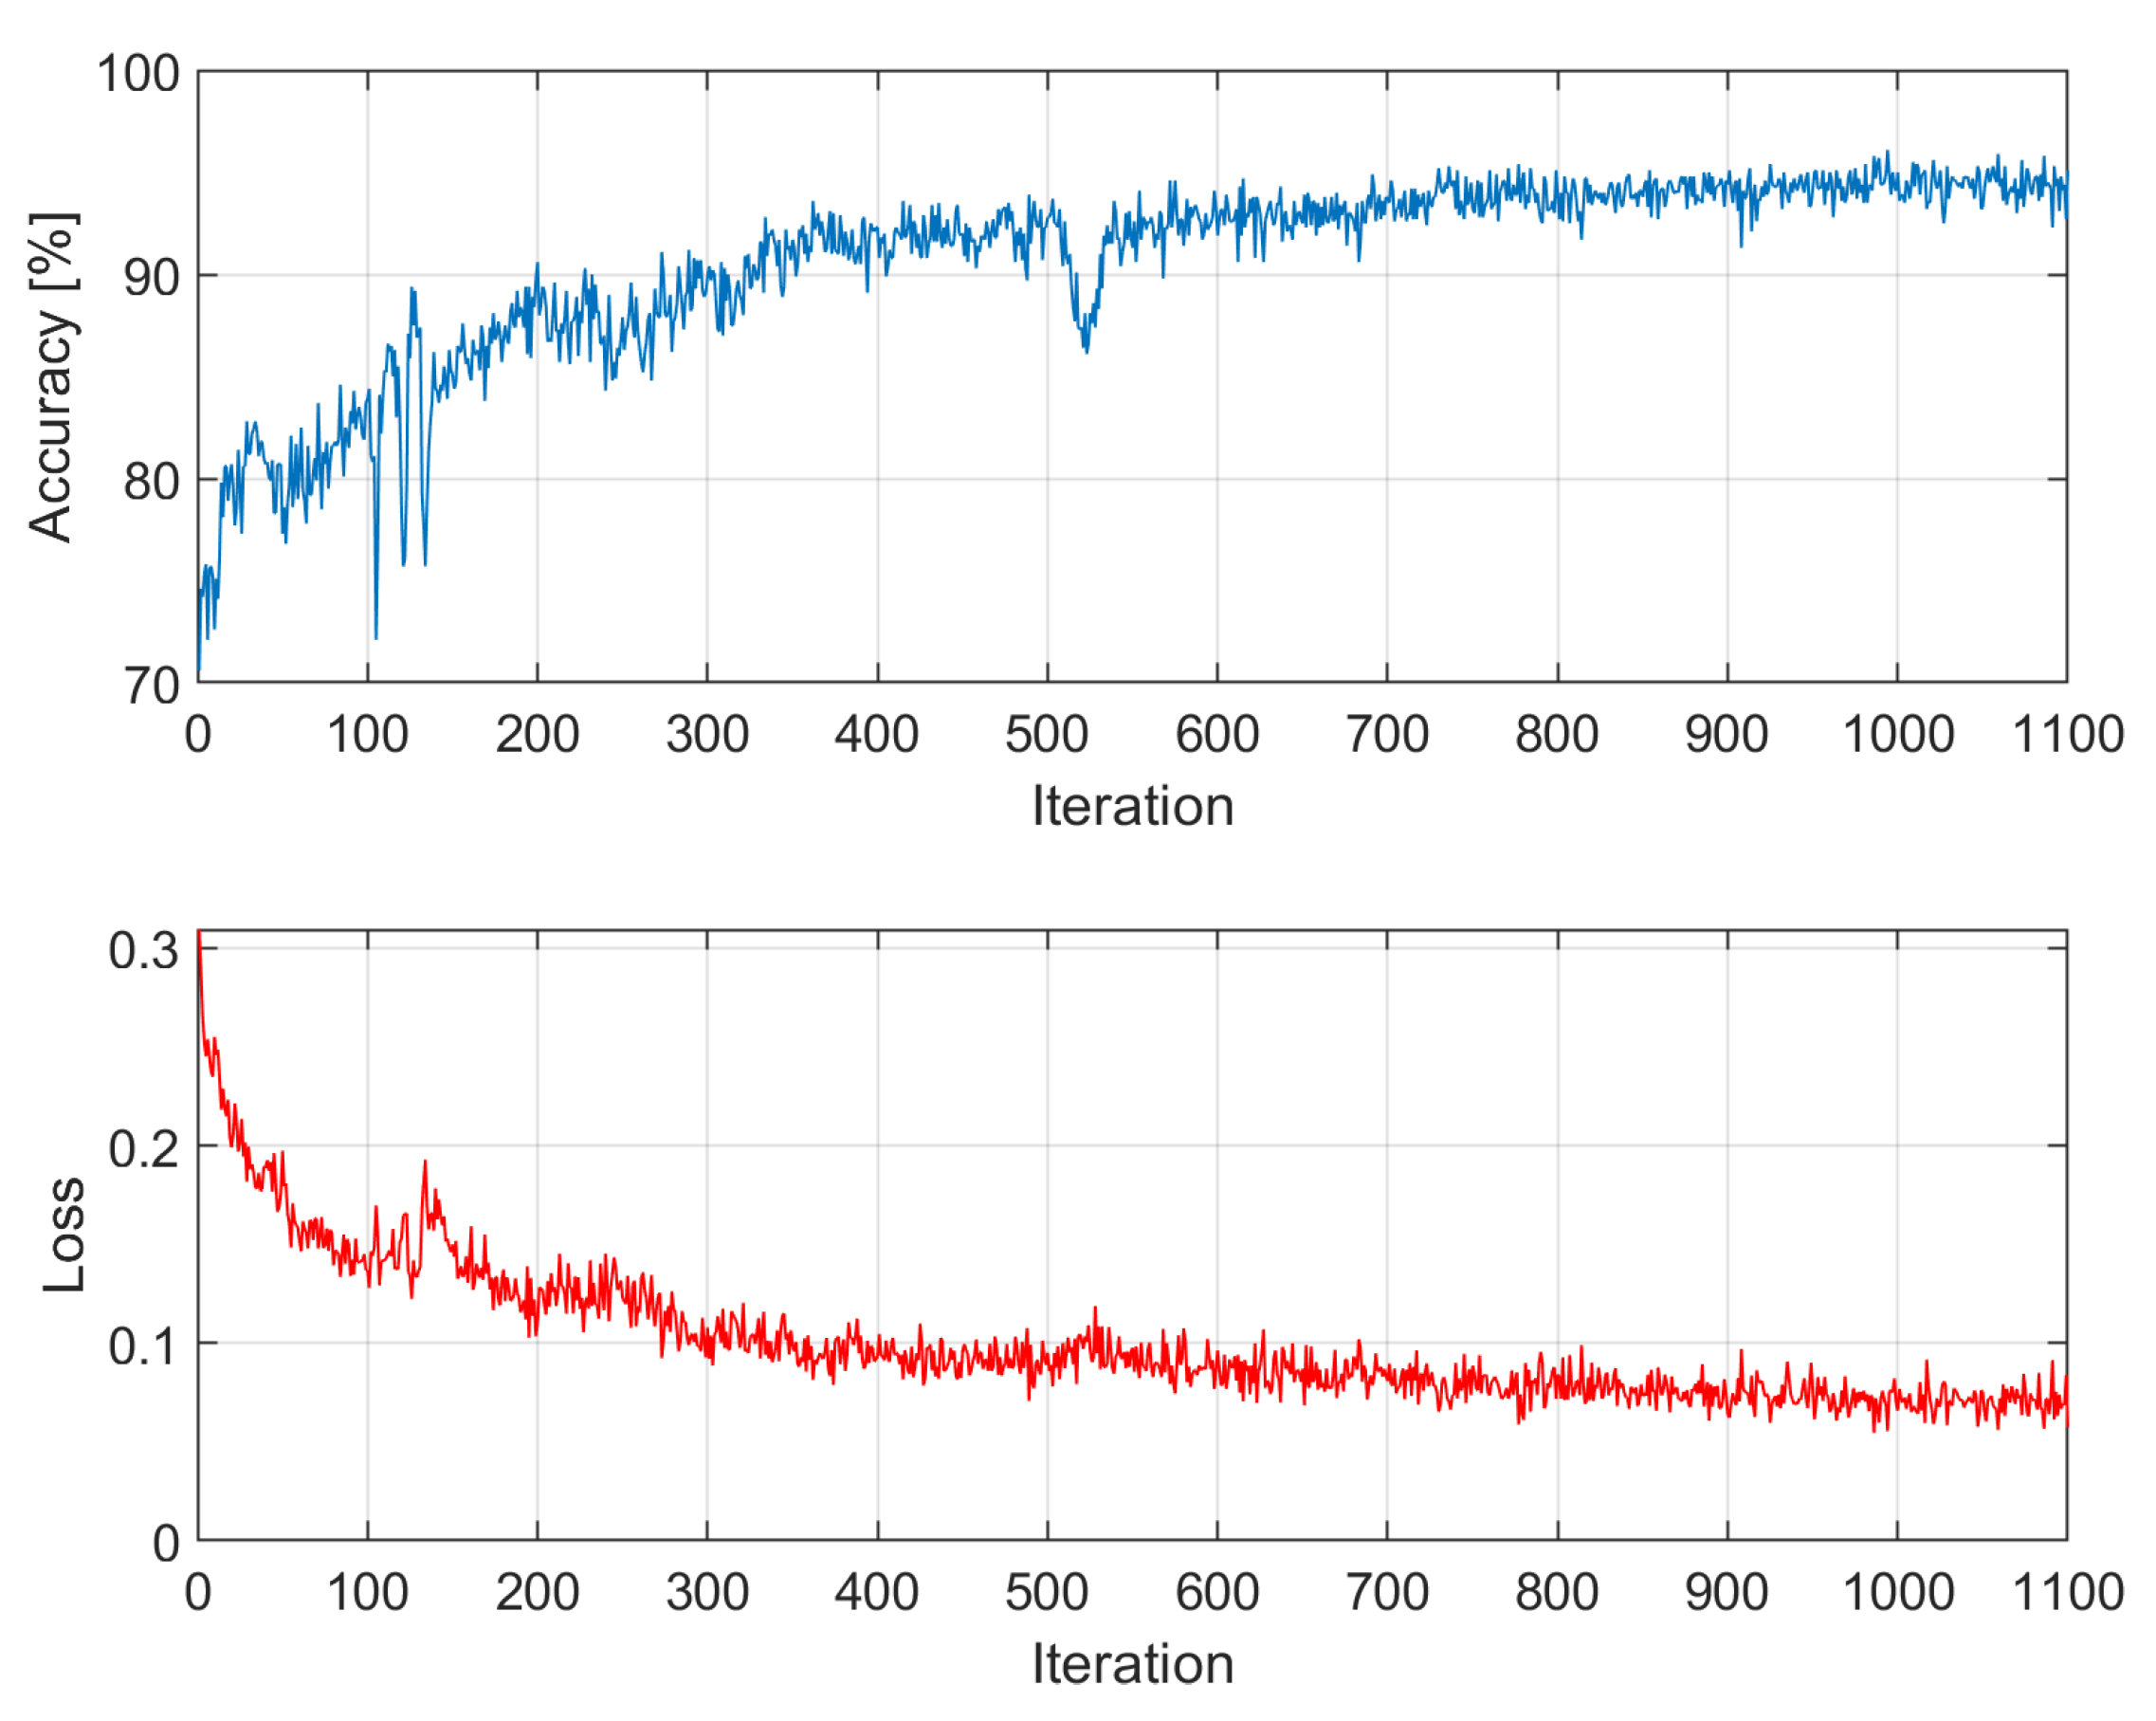
After training, the model was evaluated on a test set prepared previously. The training process is presented in Figure 5. The learning curves for each training iteration as separate figures can be found in the Appendix A.
All operations were executed on a PC with an Intel(R) Core(TM) i5-9300H CPU operating at 2GHz, 16GB of RAM, and a single 8GB NVIDIA GeForce GTX 1650 GPU. Pre-processing and classification tasks were performed using MATLAB 2023b software. Each training iteration lasted 19 minutes and 11 seconds on average.
4. Results
After completion of the model training, we evaluated its performance on the designated test dataset in each iteration. The evaluation results are visually represented in the form of a confusion matrix, illustrated in Figure 6. A confusion matrix is a tabular representation that showcases the model’s classification performance by comparing predicted and actual labels. It provides information on the distribution of true positive, true negative, false positive, and false negative predictions. The matrix presents a normalized sum of all classifications.
Subsequently, we derived a set of key metrics from the confusion matrix to provide a comprehensive evaluation of the performance of the model (see Table 12). The table contains values of common performance metrics for each of the training iterations as well as for the summary results. These metrics provide a more complex picture of how well the model distinguishes between simulated and real-road driving conditions on the test datasets.
Accuracy, as the proportion of correctly classified instances among the total predictions, provides an overall measure of the model’s correctness. The model correctly classified instances with high accuracy for the validation protocol used, demonstrating its overall effectiveness in distinguishing between real-road and simulated driving conditions in the new data. Recall is a ratio of correctly identified positive instances to the total of actual positive instances, indicating the model’s ability to capture relevant cases. The high value of recall implies that the model successfully identified a substantial majority of actual positive instances, showcasing its sensitivity to relevant cases in both real-road and simulated scenarios. High specificity suggests that the model effectively recognized and classified negative instances, underscoring its ability to distinguish non-relevant cases accurately. The precision metric that exceeds 92% indicates that the model’s positive predictions were highly accurate, minimizing false positives in the classification of both driving conditions, despite the imbalance in the training data. F1-score, being the harmonic mean of precision and recall, reflects a balanced trade-off between false positives and false negatives. The F1 score over 88% indicates the robustness of the model in achieving precision and recall simultaneously.
Overall, these high indices together demonstrate the model’s remarkable ability to distinguish between actual driving conditions and simulated driving conditions based on electrooculographic signals. These results demonstrate a high confidence in the reliability of the model in practical applications for monitoring and classification of driver states.
5. Discussion
In this study, we emphasize the distinction between real and simulated driving environments. To the best of our knowledge, there is no similar dataset study, but the problem of incorporating data obtained from the simulation environment itself is covered in other research papers. The study by Yang et al. introduces DU-drive, a framework that uses virtual data from driving simulators to improve vision-based autonomous driving models. DU-drive demonstrates superior prediction performance and interpretive capability by unifying diverse source distributions and optimizing the information bottleneck trade-off [74]. Such algorithms are useful in creating the most optimal simulation conditions. Data obtained using more realistic simulators will more closely resemble the data collected under real conditions, enabling the subsequent direct translation of results.
Karrouchi et al. highlighted the importance of assessing multiple driving-related parameters, such as engine speed, vehicle speed, and steering wheel angle, to determine driver behavior, with particular emphasis on the distinction between normal and aggressive driving patterns. The integration of facial analysis for fatigue detection achieved an impressive average accuracy of 99.1%, demonstrating the effectiveness of the proposed method in recognizing the driver’s condition [75]. Aarthi et al. proposed a real-time eye detection and tracking system based on a discrete computer vision model to solve the problem of driver drowsiness. By focusing on eye tracking as an essential technology in driver assistance systems, the study contributes to ongoing efforts to improve safety in the automotive industry [76]. The authors acknowledged the limitations of existing eye monitoring systems, in particular their sensitivity to changes in light sources, and presented a method that performs effectively in a variety of lighting conditions [77]. In addition, Kaplan et al. presented a comprehensive study of driver behavior analysis techniques, highlighting the importance of driver inattention monitoring systems. The study emphasizes the importance of inattention monitoring systems and proposes future solutions, including car-to-car communication for safer driving [78]. Similarly to our work, these studies focus on driver behavior analysis and safety in the automotive industry, through the integration of smart technology and evidence-based research methodologies [79].
Wallace et al. introduced an initial assessment using machine learning models to automatically evaluate the results of the driving simulation for drivers with cognitive impairment. The results showed a 85% accuracy rate in classifying simulator drives as safe or unsafe compared to expert opinions. This suggests the potential of automated driver simulation assessments to reduce the physician burden and improve the efficiency of driver safety assessments [80]. Compared to this study, our model achieves better classification results.
Taken together, the various studies discussed information about driving behavior, including factors such as cognitive status, gender, distraction detection, and sleep assessment [81]. These insights are key to developing advanced driver assistance systems and policies to improve road safety. Future research efforts should continue to focus on innovative methodologies and interdisciplinary approaches to comprehensively address the complexity of driving behavior in diverse populations. However, the question of the research environment here remains debatable. Work should be undertaken to create suitable and safe simulation environments, as well as algorithms that enable data transformation to improve the reliability of data collected using simulators.
The body of research on immersive simulated environments underscores their profound impact on human behavior and perception. Slater and Sanchez-Vives highlight the concept of presence, demonstrating that immersive virtual reality (VR) systems can create a strong sense of being in an alternate place, which has significant implications for psychological experiences and applications [82]. Freeman et al. extend this understanding to mental health, showing that immersive environments can effectively replicate real-world scenarios for therapeutic purposes, influencing perceptions and behaviors beneficially in treatment settings [83]. Cummings and Bailenson provide a meta-analytic perspective, revealing that higher levels of immersion correlate with increased user presence, which in turn affects emotional and behavioral responses. This relationship is crucial for designing VR systems that maximize user engagement and efficacy [84]. Ahn, Bailenson, and Park explore the long-term behavioral effects of VR, particularly in the context of environmental conservation. Their findings suggest that immersive experiences can lead to lasting changes in real-world behavior, highlighting the powerful role of VR in influencing attitudes and actions [85]. Diemer et al. further delve into the emotional impact of immersive VR, summarizing how presence in virtual environments can evoke strong emotional reactions, which are critical for applications in psychology and therapy [86]. Collectively, these studies illustrate that immersive simulated environments significantly affect human behavior, perception, and emotional responses. This research highlights the importance of designing immersive experiences that accurately reflect real-world conditions to ensure their effectiveness and reliability in various applications, from driver training and safety assessments to therapeutic interventions and educational programs. Understanding the psychological effects of immersion is essential to harness the full potential of VR and other immersive technologies in both research and practical applications.
Distinguishing the data obtained from real-road driving and simulated driving helps verify whether driving simulators accurately replicate real-world driving conditions. If the data from simulations align closely with the real-road data, it indicates that the simulator provides a valid and reliable environment for testing and research. Identifying discrepancies allows for targeted improvements in simulator technology, enhancing their fidelity, and making them more representative of actual driving experiences.
6. Conclusions
We investigated the classification of driver states (driving environment) based on electrooculography signals obtained from both real-road and simulated driving conditions, utilizing a recurrent neural network model. The robustness of the model was demonstrated through a training process and subsequent evaluation on a test dataset. The results indicate the model’s proficiency in distinguishing between real-road and simulated driving scenarios. The high accuracy, recall, specificity, precision and F1-score signify the satisfactory performance and reliability of the model. It should be noted that such parameters were achieved for data completely new to the model. These results imply that the designed RNN architecture can efficiently classify the data with a high degree of precision. The findings of this research extend to the realm of intelligent transportation systems, where accurate monitoring of driver states is crucial to improving safety and efficiency. The use of smart glasses, coupled with machine learning techniques, presents a promising avenue for real-time driver state classification. The insights gained from analyzing the differences in driver behavior and physiological responses between these two environments are crucial for several reasons. Importantly, the utilization of our algorithm does not require substantial computational power due to its simplicity and reliability. This allows practical implementation without the need for high-performance computing resources.
First, understanding these distinctions is vital because individuals often exhibit different behaviors in simulated environments compared to real-world conditions. Simulations, while valuable for controlled experimentation and training, can sometimes lead to a sense of detachment or altered risk perception among participants. This phenomenon can result in data that do not accurately reflect real-world driving behaviors and conditions. By comparing real and simulated data, we can ensure that the insights derived from simulator studies are genuinely applicable to real-world scenarios, thus enhancing the validity and reliability of such research.
Second, in an era where artificial intelligence (AI) is increasingly capable of generating synthetic data, it becomes imperative to verify the authenticity of the data being used for research and development. The ability to distinguish real data from simulated or AI-generated data helps to maintain the integrity of research findings and technological developments. It ensures that decisions based on these data are grounded in actual human behavior and real-world conditions, rather than potentially flawed or misleading simulations.
Our study emphasizes the need for rigorous data validation processes in both simulated and real-world contexts. In doing so, we can bridge the gap between controlled experimental settings and the complex and unpredictable nature of real-world driving. In particular, our study involved different individuals, eliminating the potential impact of personalization factors, and yet we observed many similarities in the data, suggesting the potential to use driving simulators as effective and reliable tools for studying human behavior in real-world driving scenarios, especially including physiological data. However, it is important to recognize the limitations of the study, including the size of the dataset, potential biases, and the specific characteristics of the driving scenarios considered. The research also indicates that, after adequate training, the suggested neural network can differentiate between two environments. Since the simulated environment does not precisely replicate the real one, it becomes imperative to either further transform the data or adjust the relevant conditions to perform reliable tests using driving simulators.
Future research efforts may focus on more extensive datasets, diverse driving environments, and additional features to further enhance the model’s robustness and applicability. We also plan to create a model that will enable the transformation (translation) of data acquired using the simulator into real data. This procedure will make it possible to acquire data in a safe and regulated environment without generating danger on the road and to better use these data in driving research.
In conclusion, the ability to accurately distinguish between real and simulated driving data is essential for advancing automotive research, enhancing driver training, and ensuring the reliability of safety assessments. As technology continues to evolve, maintaining a clear understanding of the differences between simulated and real-world data will be crucial to leveraging the full potential of both environments in the search for safer and more efficient transportation systems.
Supplementary Materials
The following supporting information can be downloaded at: Preprints.org. File S1: Study group information.
Author Contributions
Conceptualization, N.P. and R.D.; methodology, N.P.; software, N.P.; validation, N.P., R.D. and S.S.; formal analysis, N.P.; investigation, N.P.; resources, N.P., R.D., and S.S.; data curation, N.P. and R.D.; writing—original draft preparation, N.P. and R.D.; writing—review and editing, N.P., R.D., S.S., K.B., M.J., and M.G.; visualization, N.P.; supervision, R.D.; project administration, N.P. and R.D.; funding acquisition, R.D and M.G. All authors have read and agreed to the published version of the manuscript.
Funding
This research was funded by a postdoctoral grant number 07/040/RGH22/1015 under the "Excellence Initiative – Research University" pro-quality program - rectoral postdoctoral grants.
Institutional Review Board Statement
The study was conducted in accordance with the Declaration of Helsinki, and approved by the Ethics Committee of the Medical University of Silesia (protocol code KNW/0022/KB1/18, 16 October 2018).
Informed Consent Statement
Informed consent was obtained from all subjects involved in the study.
Data Availability Statement
The original data presented in the study are openly available in IEEE DataPort at: https://ieee-dataport.org/documents/real-simulated-driving
Conflicts of Interest
The authors declare no conflicts of interest.
Appendix A. Learning Process
This section provides visualizations of the training process in each iteration of k-fold cross-validation technique. The learning curves (accuracy and loss) for each training iteration are depicted in Figure A1, Figure A2, Figure A3, Figure A4 and Figure A5. The graphs present the detailed description on the training process.
Figure A1.
Accuracy and loss among epochs – k = 1; training time: 18 min 17 sec; accuracy on validation dataset: 92.3818%.
Figure A1.
Accuracy and loss among epochs – k = 1; training time: 18 min 17 sec; accuracy on validation dataset: 92.3818%.
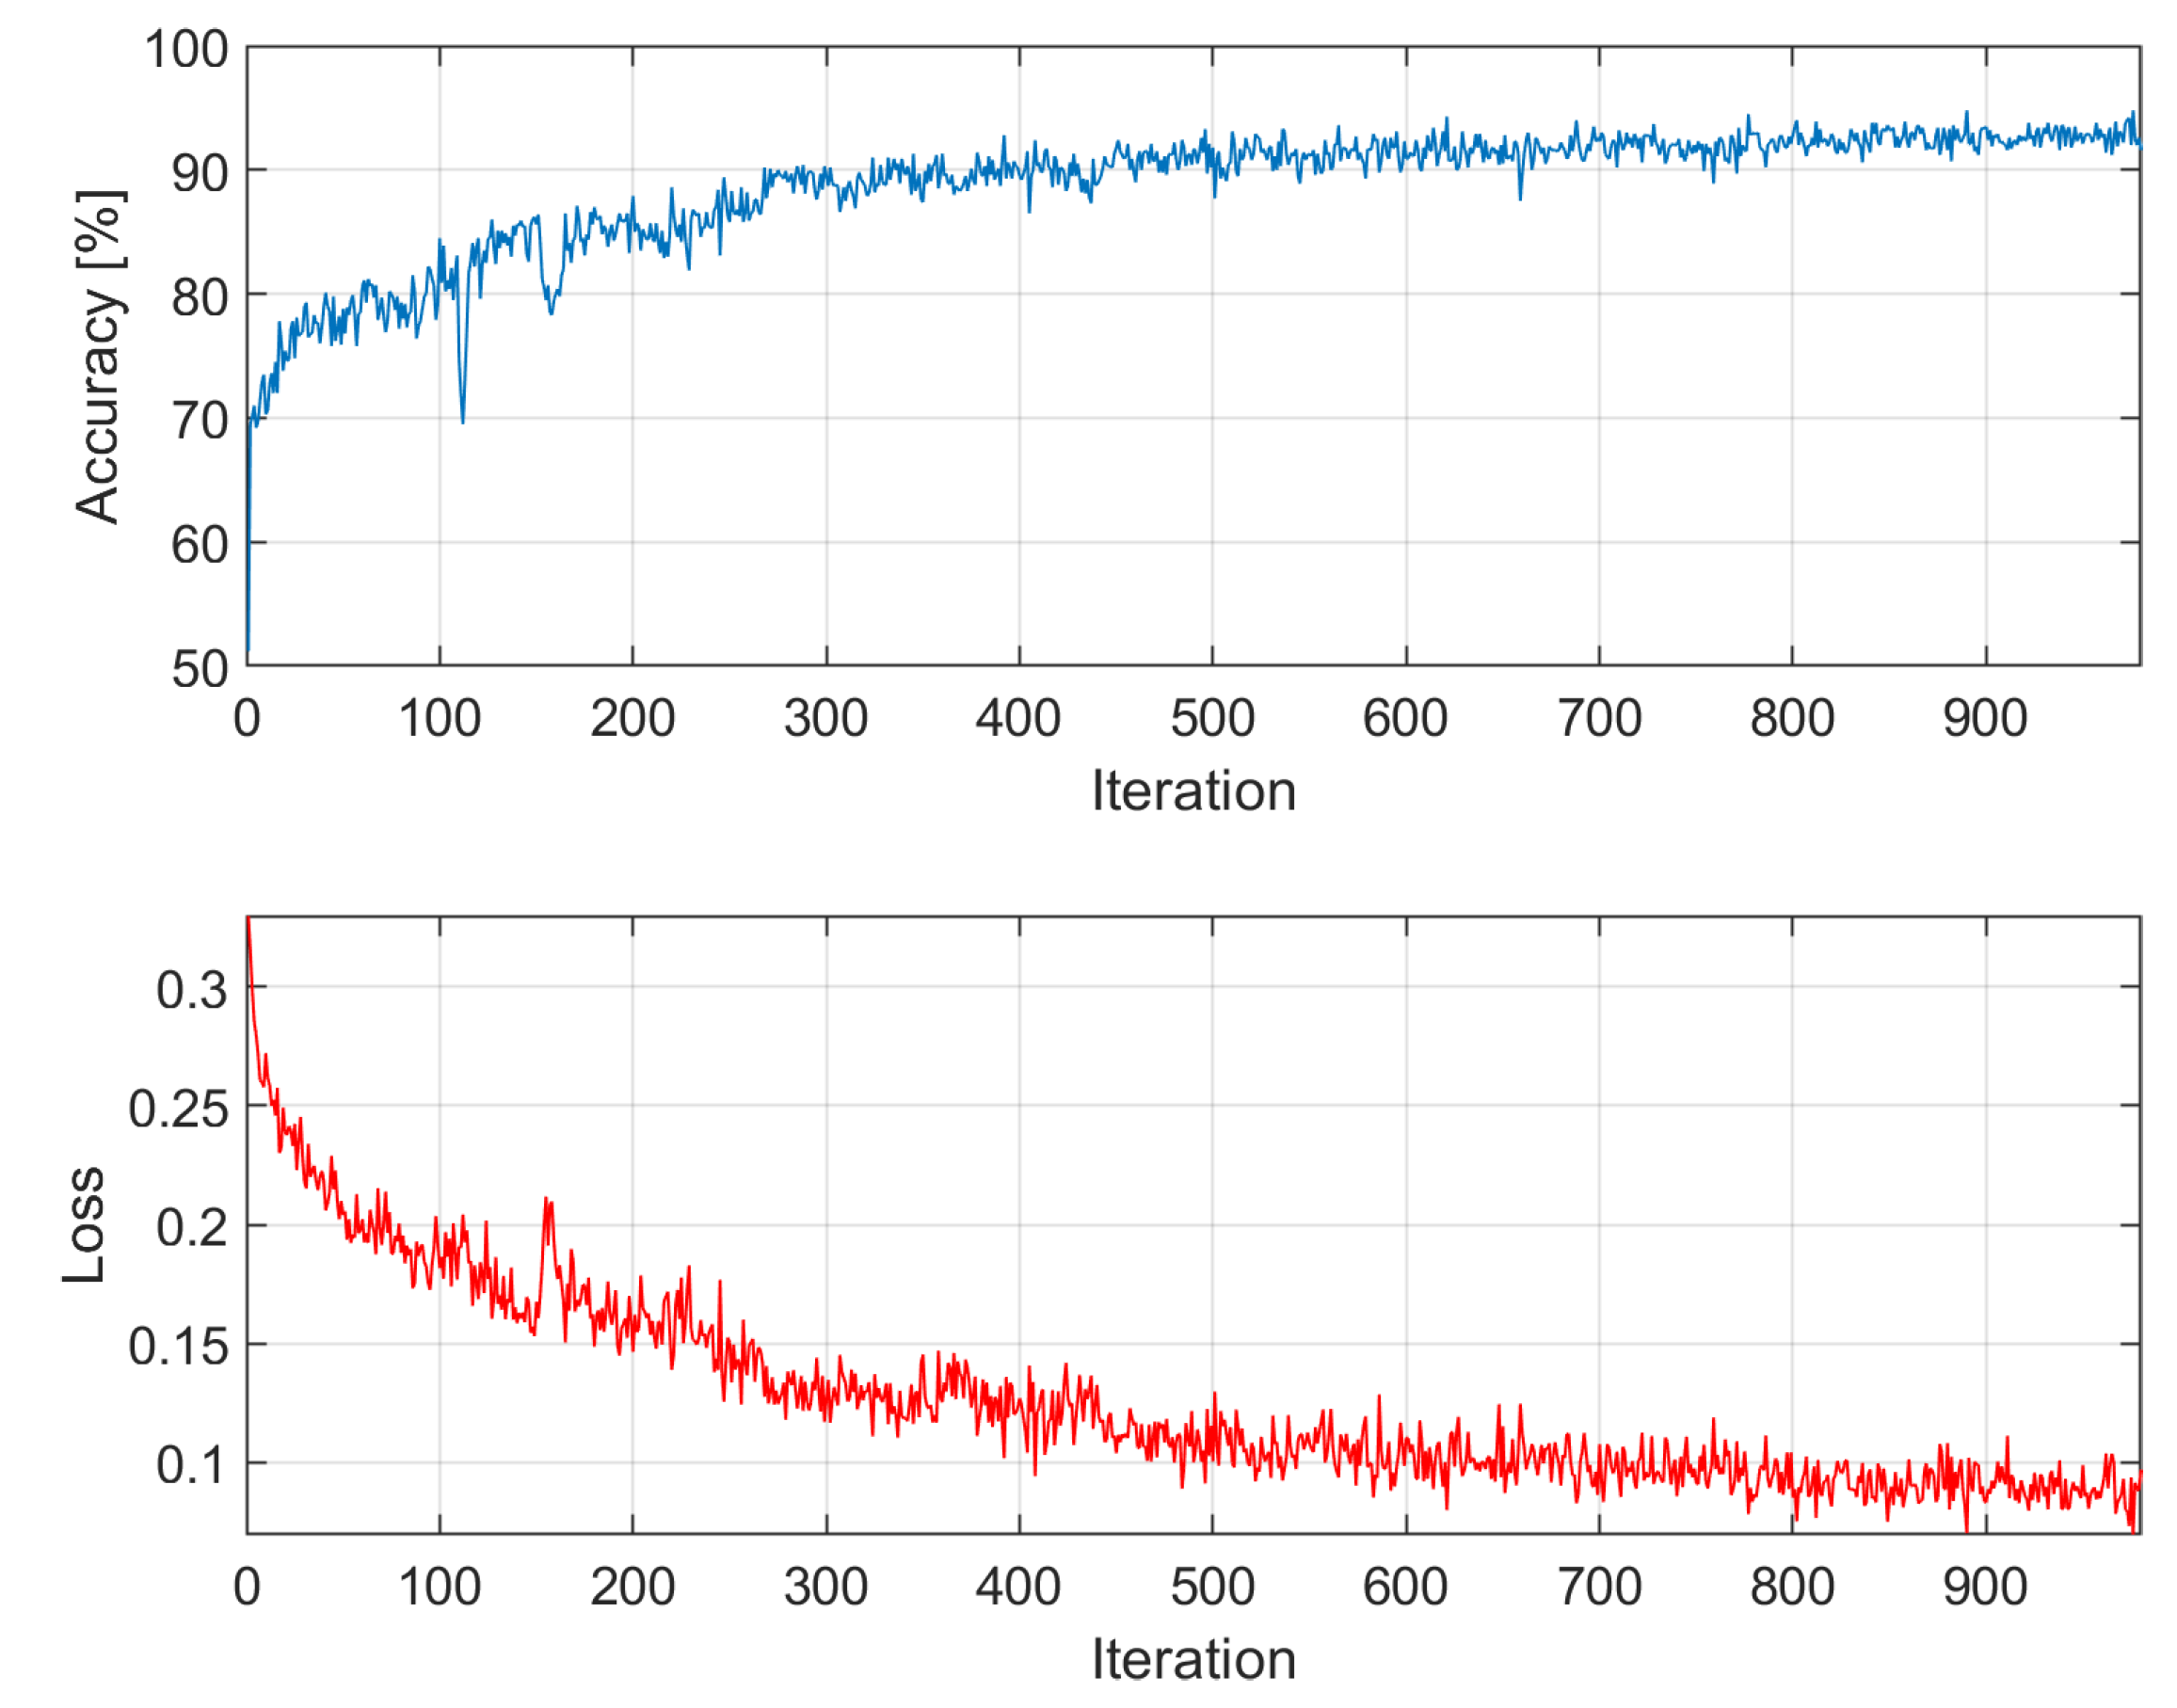
Figure A2.
Accuracy and loss among epochs – k = 2; training time: 19 min 5 sec; accuracy on validation dataset: 87.8709%
Figure A2.
Accuracy and loss among epochs – k = 2; training time: 19 min 5 sec; accuracy on validation dataset: 87.8709%
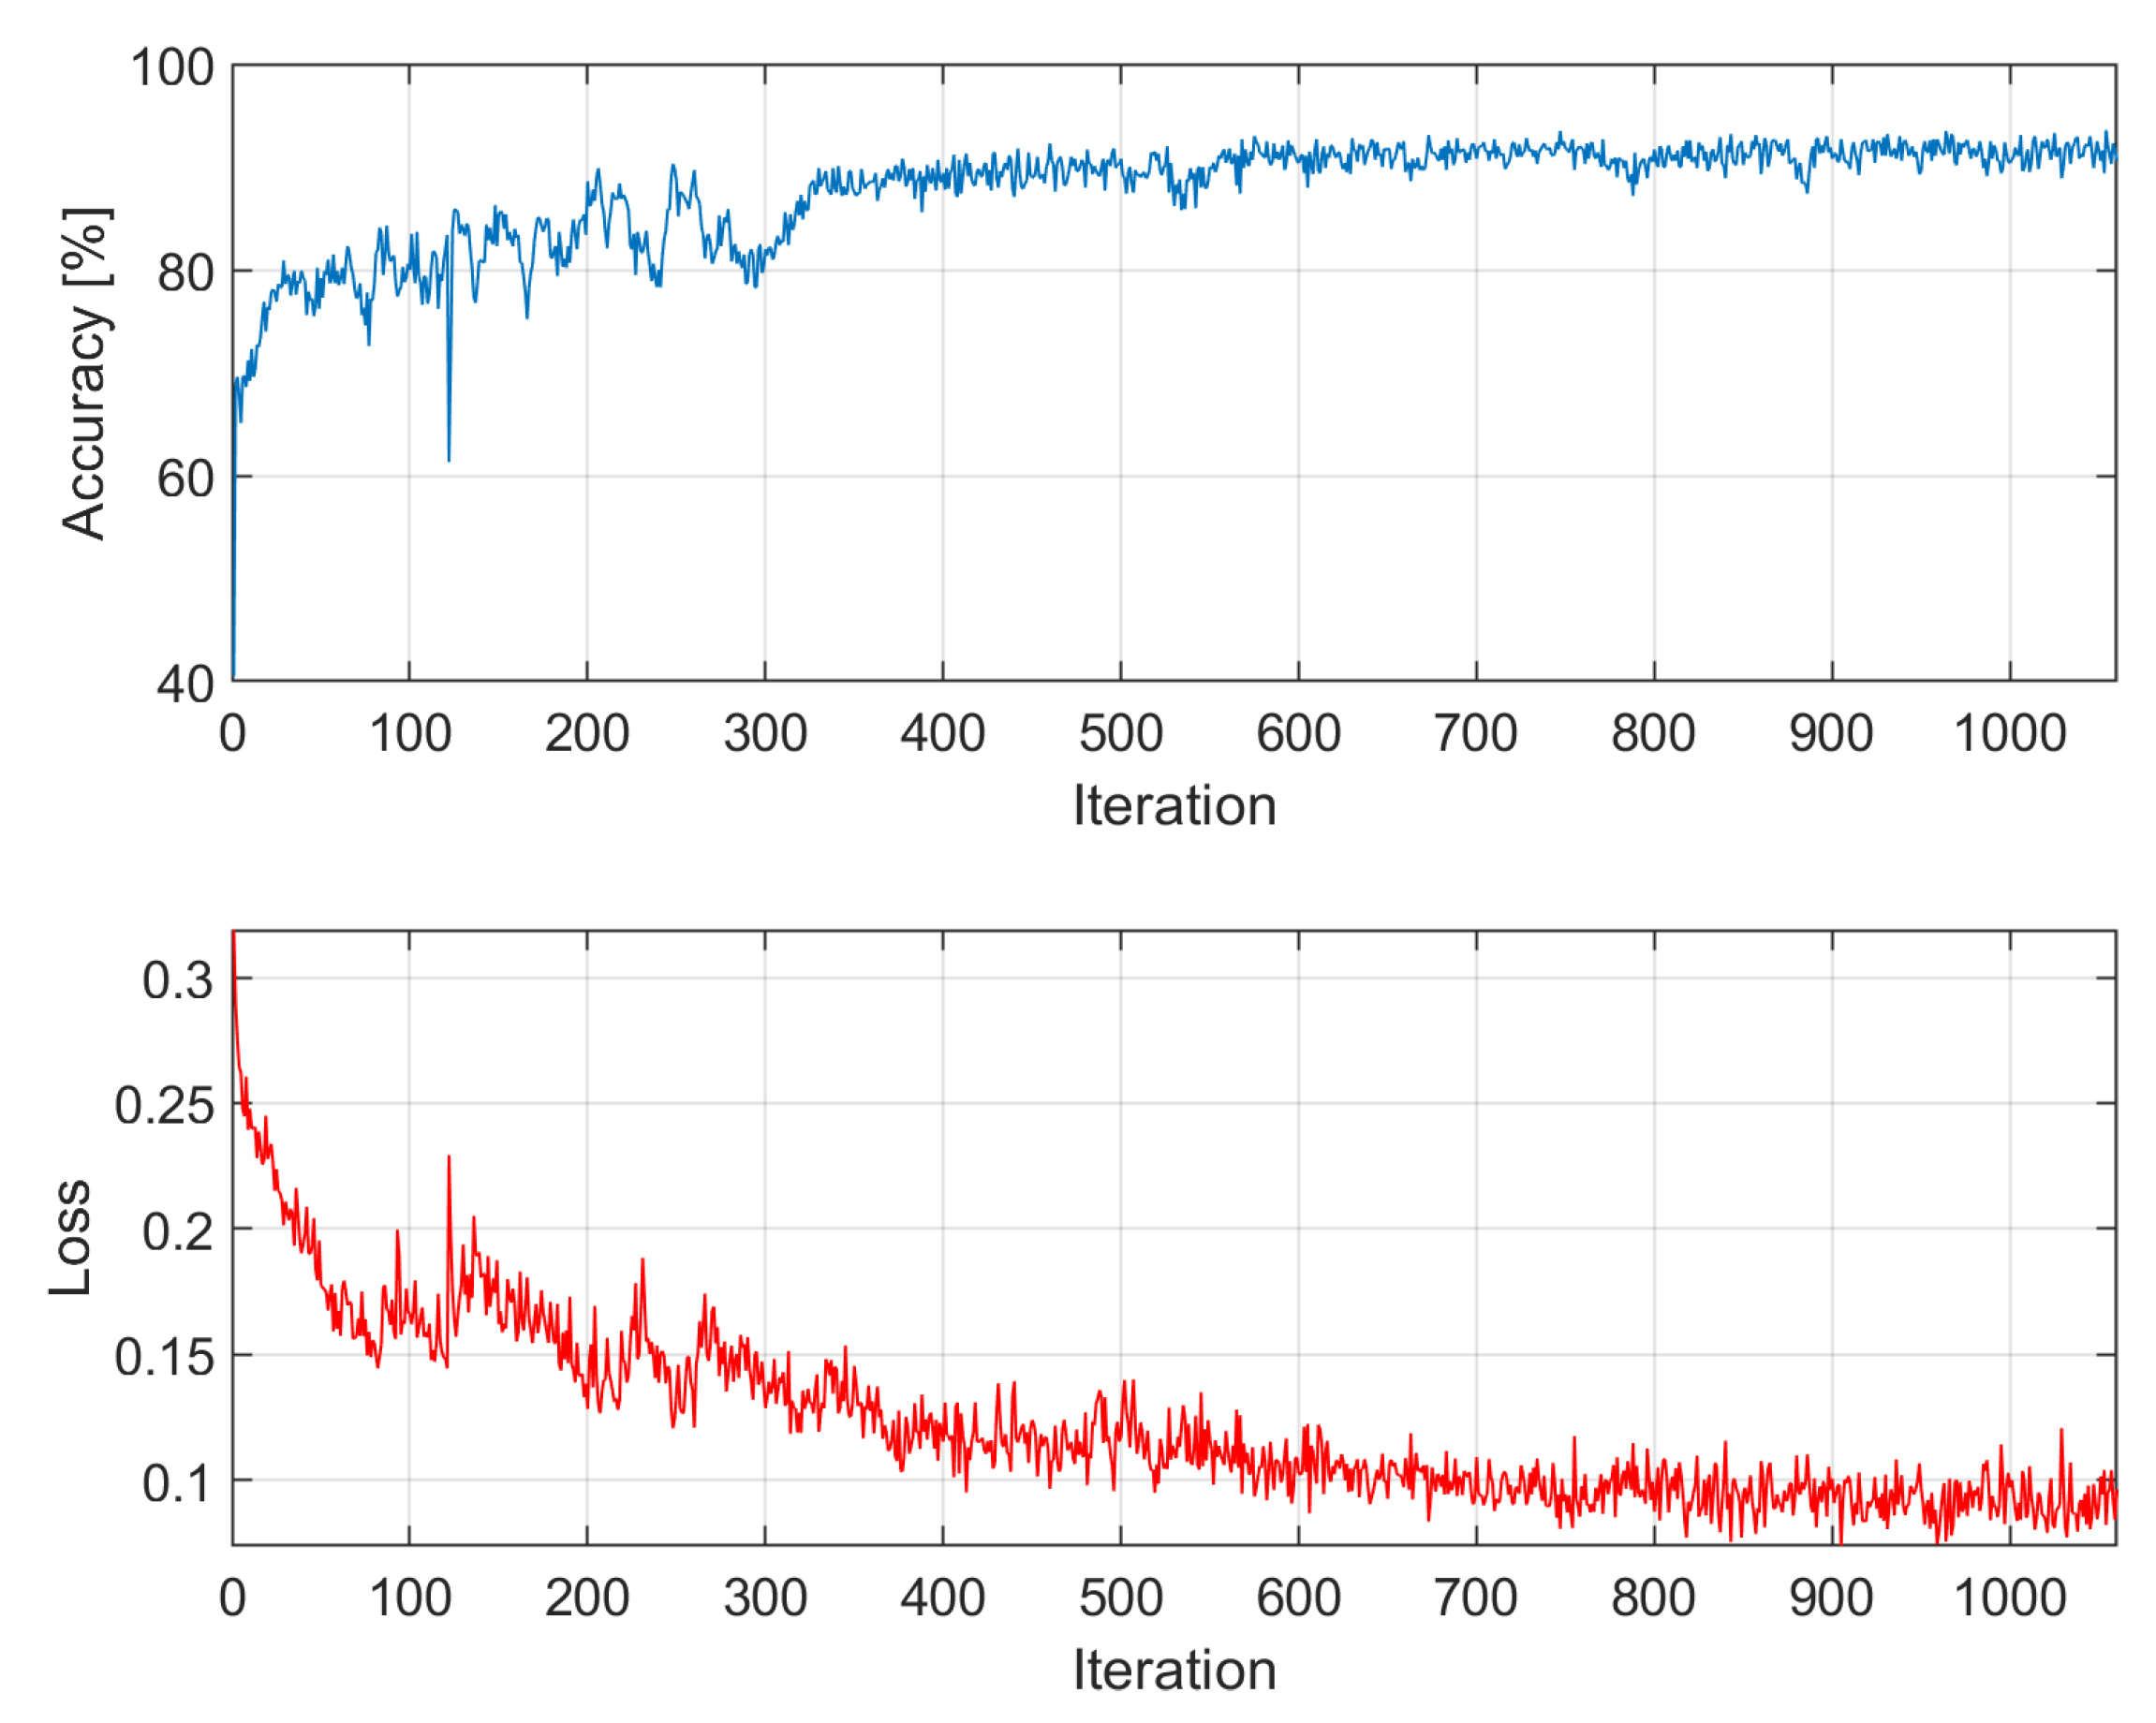
Figure A3.
Accuracy and loss among epochs – k = 3; training time: 18 min 19 sec; accuracy on validation dataset: 79.0243%
Figure A3.
Accuracy and loss among epochs – k = 3; training time: 18 min 19 sec; accuracy on validation dataset: 79.0243%
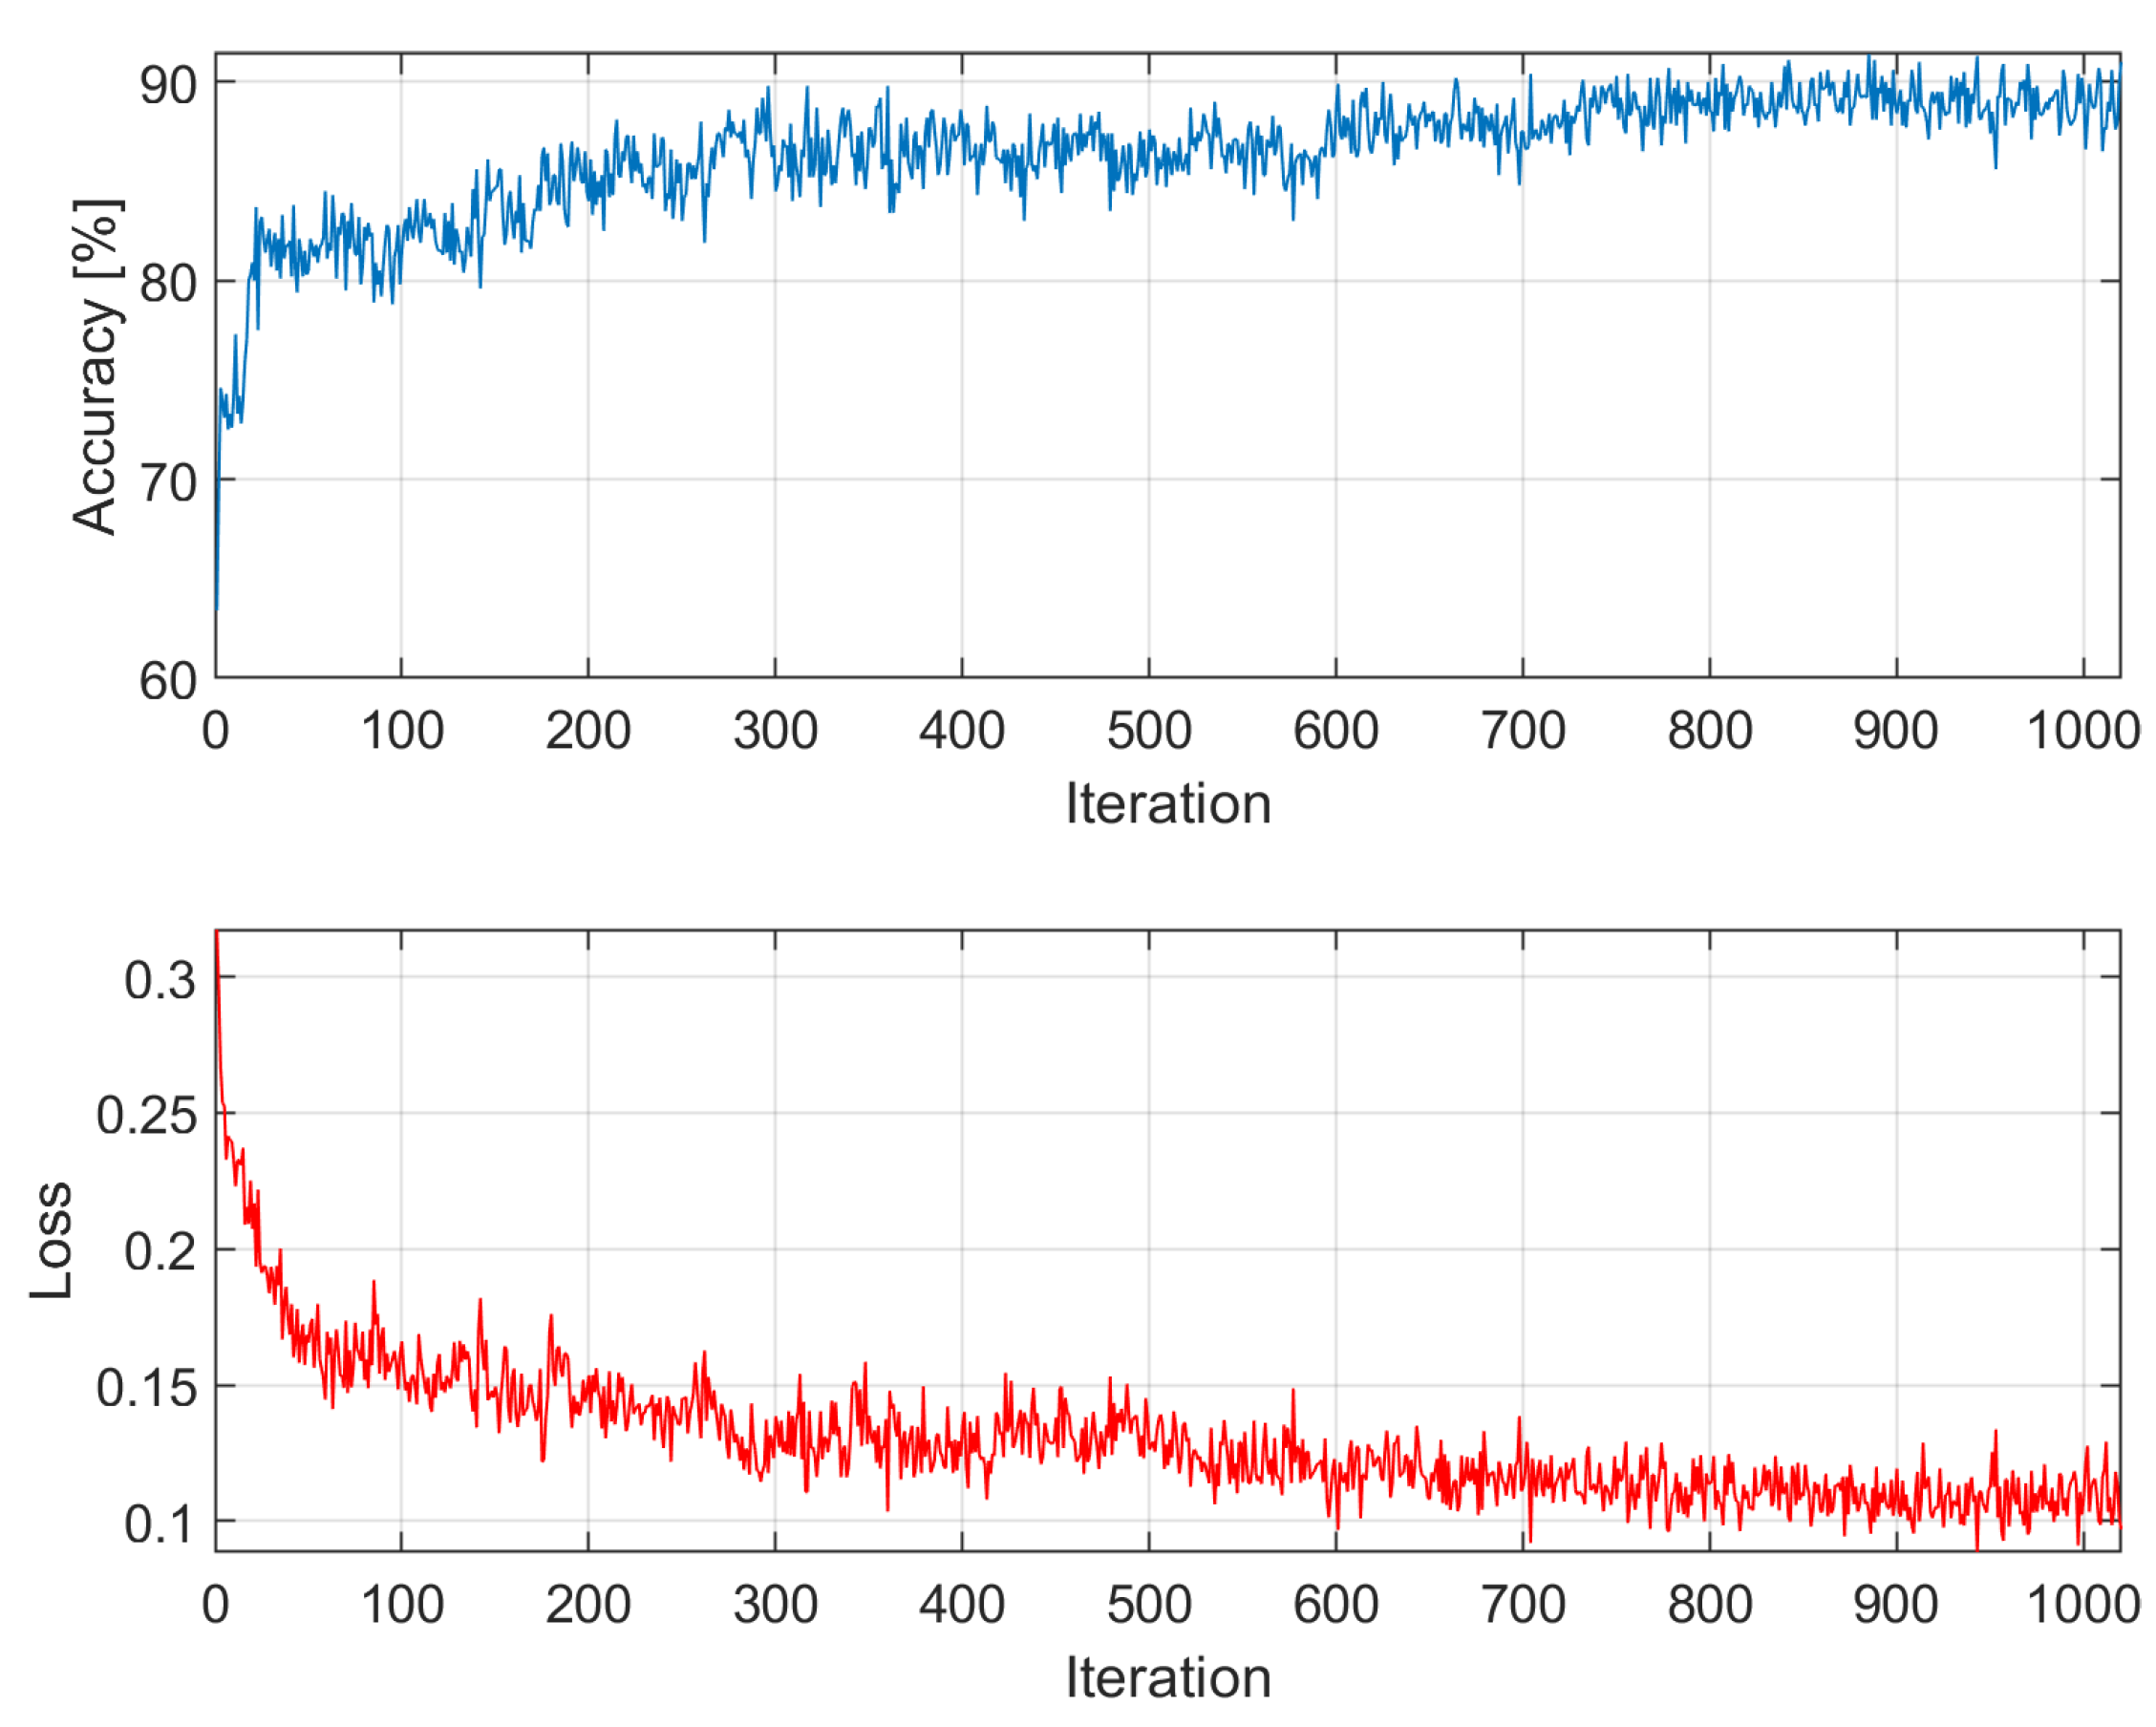
Figure A4.
Accuracy and loss among epochs – k = 4; training time: 19 min 38 sec; accuracy on validation dataset: 84.3988%
Figure A4.
Accuracy and loss among epochs – k = 4; training time: 19 min 38 sec; accuracy on validation dataset: 84.3988%
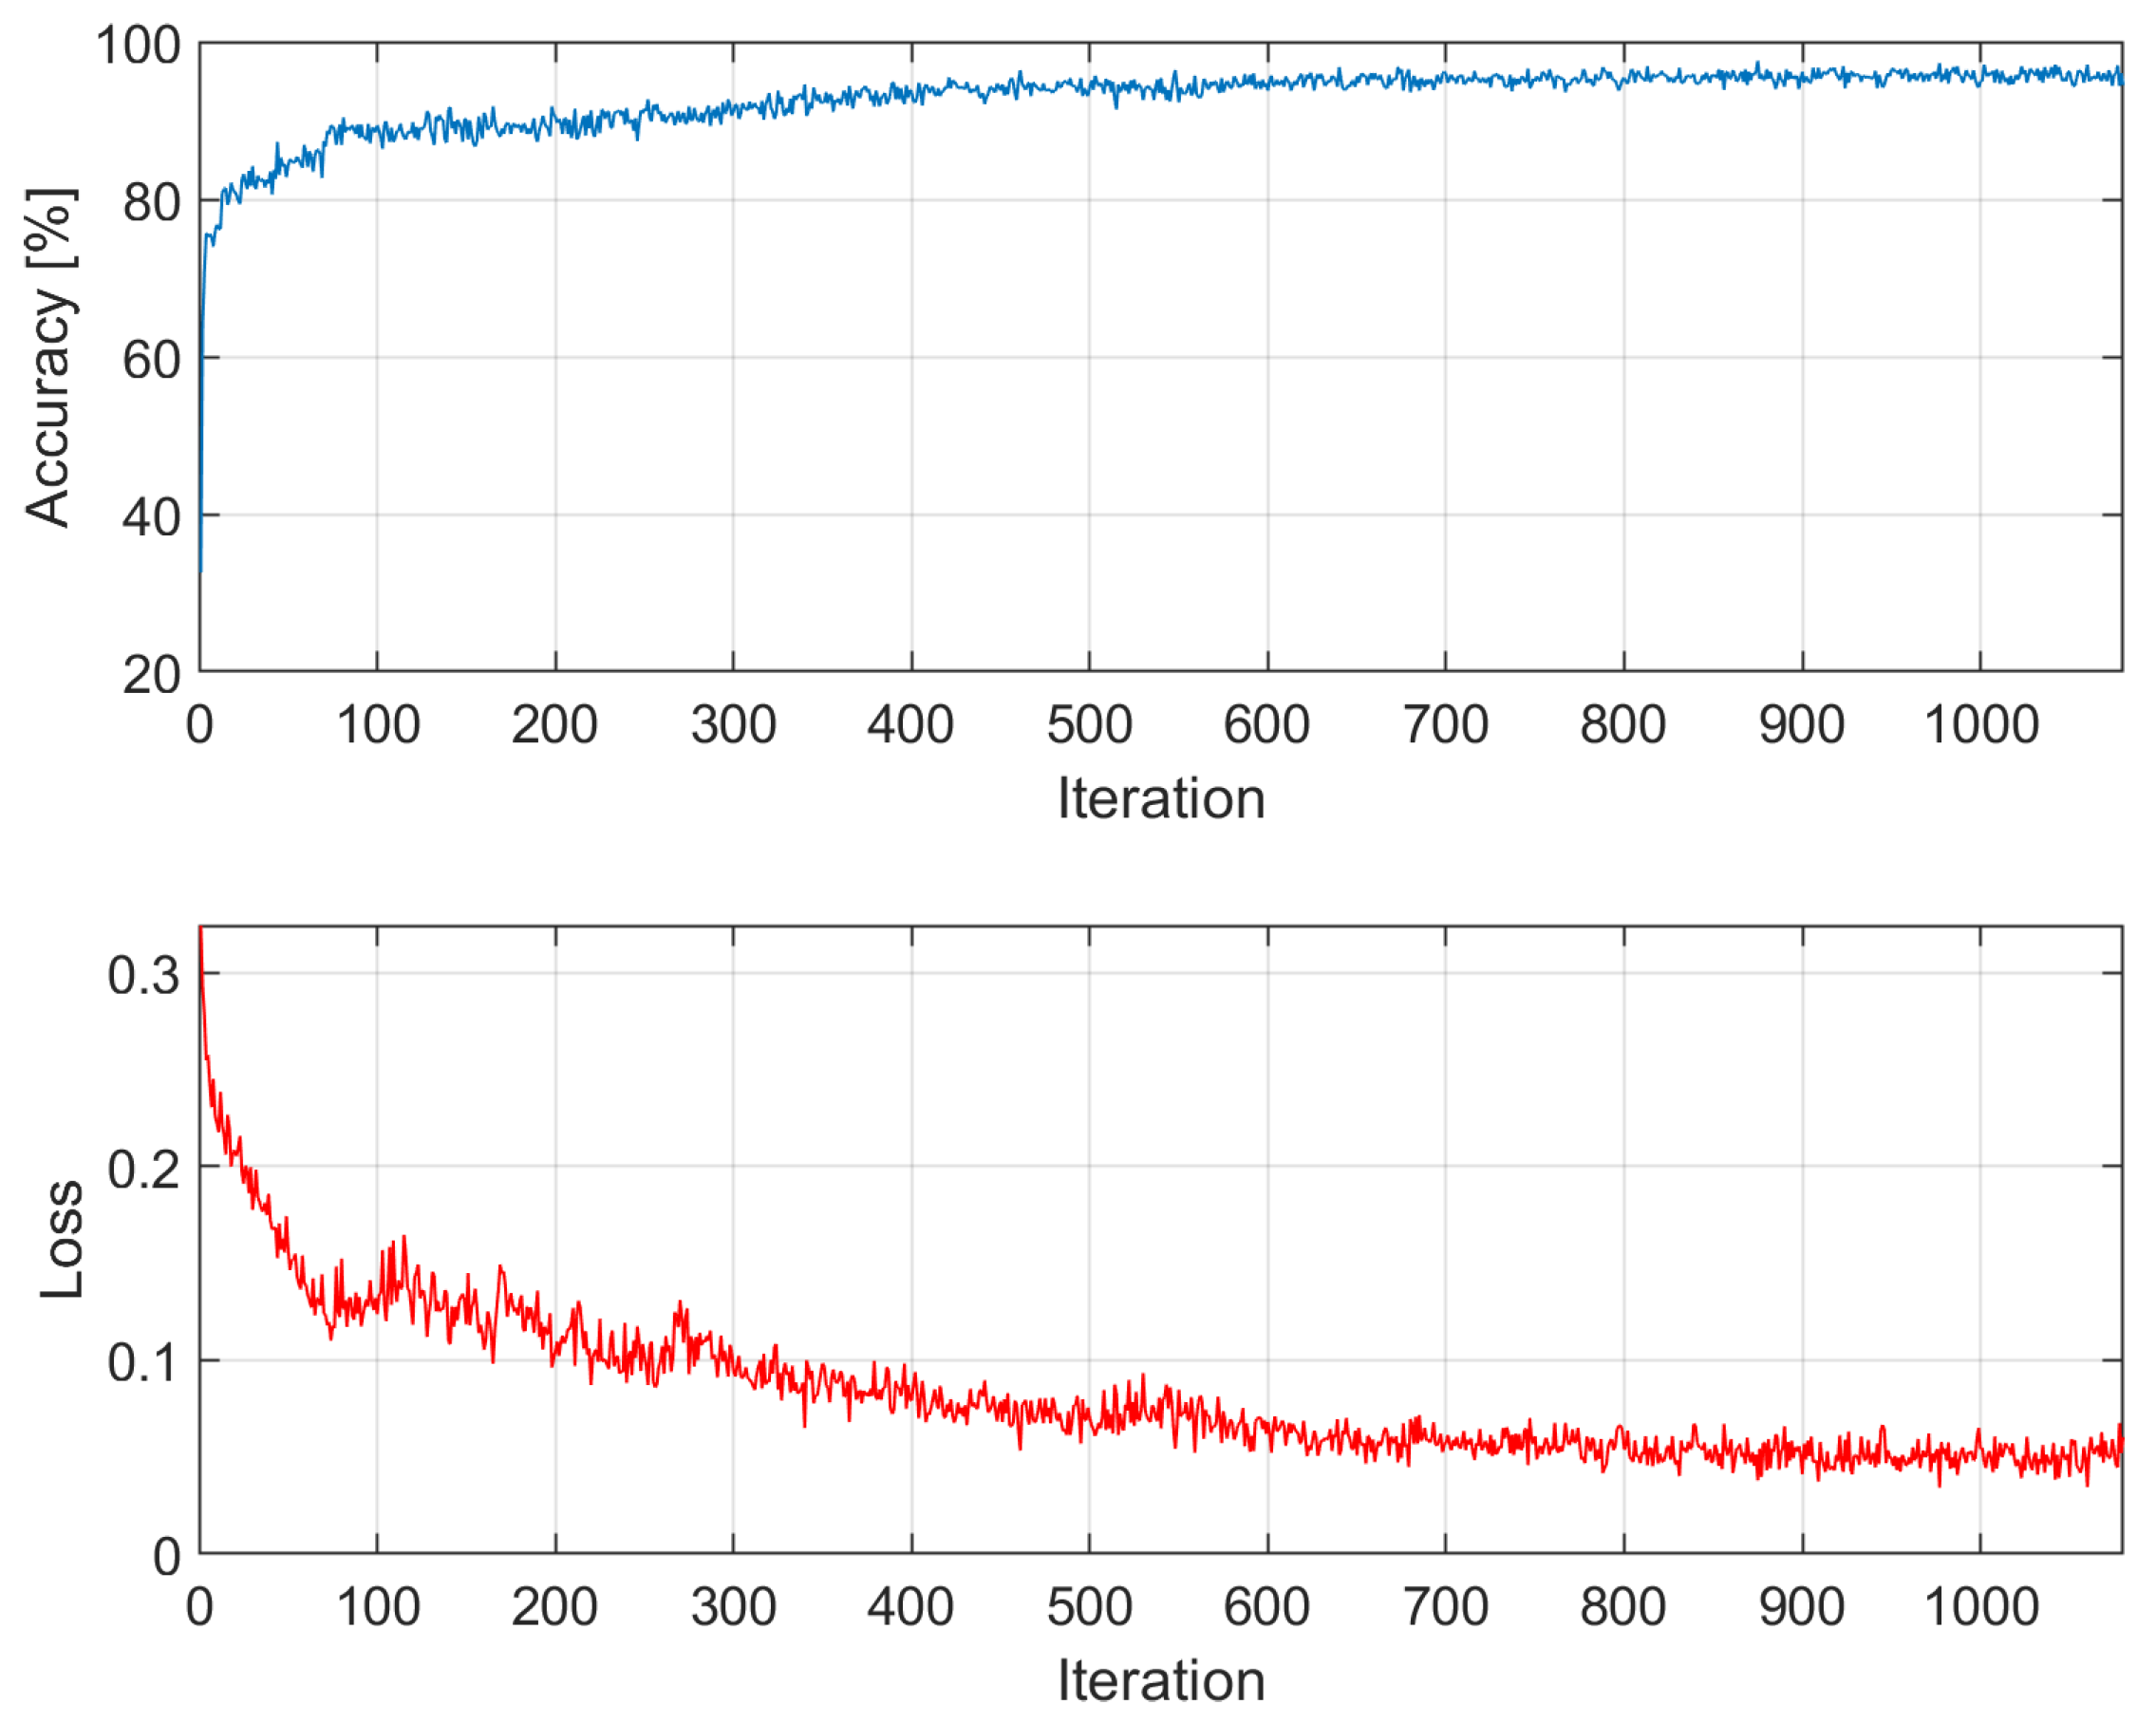
Figure A5.
Accuracy and loss among epochs – k = 5; training time: 20 min 34 sec; accuracy on validation dataset: 88.1874%
Figure A5.
Accuracy and loss among epochs – k = 5; training time: 20 min 34 sec; accuracy on validation dataset: 88.1874%
References
- Yu, K.; Beam, A.; Kohane, I. Artificial Intelligence in Healthcare. Artificial Intelligence and Machine Learning for Business for Non-Engineers 2019. [CrossRef]
- Ravì, D.; Wong, C.; Deligianni, F.; Berthelot, M.; Andreu-Perez, J.; Lo, B.P.L.; Yang, G.Z. Deep Learning for Health Informatics. IEEE Journal of Biomedical and Health Informatics 2017, 21, 4–21. [Google Scholar] [CrossRef] [PubMed]
- Mishra, V.; Ugemuge, S.; Tiwade, Y. Artificial intelligence changing the future of healthcare diagnostics. Journal of Cellular Biotechnology 2023. [Google Scholar] [CrossRef]
- Mateos-García, N.; Gil-González, A.; Luis-Reboredo, A.; Pérez-Lancho, B. Driver Stress Detection from Physiological Signals by Virtual Reality Simulator. Electronics 2023. [Google Scholar] [CrossRef]
- Javaid, M.; Haleem, A.; Singh, R.P.; Suman, R.; Gonzalez, E.S. Understanding the adoption of Industry 4.0 technologies in improving environmental sustainability. Sustainable Operations and Computers 2022, 3, 203–217. [Google Scholar] [CrossRef]
- Hasan, M.A.; Mishuk, M.N. MEMS IMU Based Pedestrian Indoor Navigation for Smart Glass. Wireless Personal Communications 2018, 101, 287–303. [Google Scholar] [CrossRef]
- Uema, Y.; Inoue, K. JINS MEME algorithm for estimation and tracking of concentration of users. Proceedings of the 2017 ACM International Joint Conference on Pervasive and Ubiquitous Computing and Proceedings of the 2017 ACM International Symposium on Wearable Computers; ACM: Maui Hawaii, 2017; pp. 297–300. [Google Scholar] [CrossRef]
- Irshad, M.T.; Nisar, M.A.; Huang, X.; Hartz, J.; Flak, O.; Li, F.; Gouverneur, P.; Piet, A.; Oltmanns, K.M.; Grzegorzek, M. SenseHunger: Machine Learning Approach to Hunger Detection Using Wearable Sensors. Sensors 2022, 22, 7711. [Google Scholar] [CrossRef] [PubMed]
- Ogawa, T.; Takahashi, M.; Kawashima, R. Human Cognitive Control Mode Estimation Using JINS MEME. IFAC-PapersOnLine 2016, 49, 331–336. [Google Scholar] [CrossRef]
- Diaz-Romero, D.J.; Rincon, A.M.R.; Miguel-Cruz, A.; Yee, N.; Stroulia, E. Recognizing Emotional States With Wearables While Playing a Serious Game. IEEE Transactions on Instrumentation and Measurement 2021, 70, 1–12. [Google Scholar] [CrossRef]
- Piaseczna, N.; Duraj, K.; Doniec, R.; Tkacz, E. Evaluation of Intoxication Level with EOG Analysis and Machine Learning: A Study on Driving Simulator*. 2023 45th Annual International Conference of the IEEE Engineering in Medicine & Biology Society (EMBC), 2023, pp. 1–4. [CrossRef]
- Doniec, R.; Konior, J.; Sieciński, S.; Piet, A.; Irshad, M.T.; Piaseczna, N.; Hasan, M.A.; Li, F.; Nisar, M.A.; Grzegorzek, M. Sensor-Based Classification of Primary and Secondary Car Driver Activities Using Convolutional Neural Networks. Sensors 2023, 23. [Google Scholar] [CrossRef] [PubMed]
- De Winter, J.C.; De Groot, S.; Mulder, M.; Wieringa, P.A.; Dankelman, J.; Mulder, J.A. Relationships between driving simulator performance and driving test results. Ergonomics 2009, 52, 137–153. [Google Scholar] [CrossRef]
- Classen, S.; Brooks, J. Driving Simulators for Occupational Therapy Screening, Assessment, and Intervention. Occupational Therapy In Health Care 2014, 28, 154–162. [Google Scholar] [CrossRef] [PubMed]
- Wynne, R.A.; Beanland, V.; Salmon, P.M. Systematic review of driving simulator validation studies. Safety Science 2019, 117, 138–151. [Google Scholar] [CrossRef]
- Malone, S.; Brünken, R. Hazard Perception, Presence, and Simulation Sickness—A Comparison of Desktop and Head-Mounted Display for Driving Simulation. Frontiers in Psychology 2021, 12, 647723. [Google Scholar] [CrossRef]
- LaViola, J.J. A discussion of cybersickness in virtual environments. ACM SIGCHI Bulletin 2000, 32, 47–56. [Google Scholar] [CrossRef]
- Lawson, B.D.; Stanney, K.M. Editorial: Cybersickness in Virtual Reality and Augmented Reality. Frontiers in Virtual Reality 2021, 2, 759682. [Google Scholar] [CrossRef]
- JINS MEME. JINS MEME glasses specifications. https://jins-meme.github.io/apdoc/en/, accessed on 7 May 2024.
- Yuan, L.; Shen, H.; Shi, L.; Cheng, N.; Jiang, H. An Explainable Fake News Analysis Method with Stance Information. Electronics 2023. [Google Scholar] [CrossRef]
- Iqbal, A.; Shahzad, K.; Khan, S.A.; Chaudhry, M.S. The relationship of artificial intelligence (AI) with fake news detection (FND): a systematic literature review. Global Knowledge, Memory and Communication 2023. [CrossRef]
- Khan, S.; Yairi, T. A review on the application of deep learning in system health management. Mechanical Systems and Signal Processing 2018. [Google Scholar] [CrossRef]
- Musleh, A.S.; Chen, G.; Dong, Z. A Survey on the Detection Algorithms for False Data Injection Attacks in Smart Grids. IEEE Transactions on Smart Grid 2020, 11, 2218–2234. [Google Scholar] [CrossRef]
- Yokkampon, U.; Chumkamon, S.; Mowshowitz, A.; Fujisawa, R.; Hayashi, E. Anomaly Detection Using Support Vector Machines for Time Series Data. J. Robotics Netw. Artif. Life 2021, 8, 41–46. [Google Scholar] [CrossRef]
- Ding, N.; Ma, H.; Zhao, C.; Ma, Y.; Ge, H. Data Anomaly Detection for Internet of Vehicles Based on Traffic Cellular Automata and Driving Style. Sensors (Basel, Switzerland) 2019, 19. [Google Scholar] [CrossRef]
- Muhammad, K.; Ullah, A.; Lloret, J.; Ser, J.; Albuquerque, V. Deep Learning for Safe Autonomous Driving: Current Challenges and Future Directions. IEEE Transactions on Intelligent Transportation Systems 2020, 22, 4316–4336. [Google Scholar] [CrossRef]
- Savakis, A.E.; George, N. Infrared target simulation environment for pattern recognition applications. Infrared Imaging Systems: Design, Analysis, Modeling, and Testing V. International Society for Optics and Photonics, SPIE, 1994, Vol. 2224, pp. 190 – 198. [CrossRef]
- Khan, Y.; Ostfeld, A.; Lochner, C.M.; Pierre, A.; Arias, A. Monitoring of Vital Signs with Flexible and Wearable Medical Devices. Advanced Materials 2016, 28. [Google Scholar] [CrossRef] [PubMed]
- Ha, M.; Lim, S.; Ko, H. Wearable and flexible sensors for user-interactive health-monitoring devices. Journal of materials chemistry. B 2018, 6 24, 4043–4064. [Google Scholar] [CrossRef]
- Ali, F.; El-Sappagh, S.; Islam, S.; Ali, A.; Attique, M.; Imran, M.; Kwak, K. An intelligent healthcare monitoring framework using wearable sensors and social networking data. Future Gener. Comput. Syst. 2021, 114, 23–43. [Google Scholar] [CrossRef]
- Mirjalali, S.; Peng, S.; Fang, Z.; Wang, C.H.; Wu, S. Wearable Sensors for Remote Health Monitoring: Potential Applications for Early Diagnosis of Covid-19. Advanced Materials Technologies 2021, 7. [Google Scholar] [CrossRef] [PubMed]
- Chen, L.W.; Chen, H.M. Driver Behavior Monitoring and Warning With Dangerous Driving Detection Based on the Internet of Vehicles. IEEE Transactions on Intelligent Transportation Systems 2021, 22, 7232–7241. [Google Scholar] [CrossRef]
- Liu, L.; Çagdas Karatas. ; Li, H.; Tan, S.; Gruteser, M.; Yang, J.; Chen, Y.; Martin, R. Toward Detection of Unsafe Driving with Wearables. Proceedings of the 2015 workshop on Wearable Systems and Applications 2015. [Google Scholar] [CrossRef]
- Fahim, M.; Sillitti, A. Anomaly Detection, Analysis and Prediction Techniques in IoT Environment: A Systematic Literature Review. IEEE Access 2019, 7, 81664–81681. [Google Scholar] [CrossRef]
- Erhan, L.; Ndubuaku, M.; Mauro, M.; Song, W.; Chen, M.; Fortino, G.; Bagdasar, O.; Liotta, A. Smart Anomaly Detection in Sensor Systems. ArXiv 2020, abs/2010.14946. [CrossRef]
- Bijlani, N.; Nilforooshan, R.; Kouchaki, S. An Unsupervised Data-Driven Anomaly Detection Approach for Adverse Health Conditions in People Living With Dementia: Cohort Study. JMIR Aging 2022, 5. [Google Scholar] [CrossRef]
- Banaee, H.; Ahmed, M.U.; Loutfi, A. Data Mining for Wearable Sensors in Health Monitoring Systems: A Review of Recent Trends and Challenges. Sensors (Basel, Switzerland) 2013, 13, 17472–17500. [Google Scholar] [CrossRef]
- Tsai, C.Y.; Majumdar, A.; Wang, Y.; Hsu, W.H.; Kang, J.H.; Lee, K.Y.; Tseng, C.; Kuan, Y.; Lee, H.C.; Wu, C.J.; Houghton, R.; in Cheong, H.; Manole, I.; Lin, Y.T.; Li, L.Y.J.; Liu, W.T. Machine learning model for aberrant driving behaviour prediction using heart rate variability: a pilot study involving highway bus drivers. International Journal of Occupational Safety and Ergonomics 2022, 29, 1429–1439. [Google Scholar] [CrossRef]
- Bobermin, M.; Silva, M.M.; Ferreira, S. Driving simulators to evaluate road geometric design effects on driver behaviour: A systematic review. Accident; analysis and prevention 2020, 150, 105923. [Google Scholar] [CrossRef] [PubMed]
- Jia, L.; Lu, M.; Wang, J. Using real-world data to calibrate a driving simulator measuring lateral driving behaviour. Iet Intelligent Transport Systems 2011, 5, 21–31. [Google Scholar] [CrossRef]
- Jamson, S.; Jamson, A.H. The validity of a low-cost simulator for the assessment of the effects of in-vehicle information systems. Safety Science 2010, 48, 1477–1483. [Google Scholar] [CrossRef]
- Wang, Y.; Mehler, B.; Reimer, B.; Lammers, V.; D’Ambrosio, L.; Coughlin, J. The validity of driving simulation for assessing differences between in-vehicle informational interfaces: A comparison with field testing. Ergonomics 2010, 53, 404–420. [Google Scholar] [CrossRef]
- Markkula, G.; Romano, R.; Jamson, A.; Pariota, L.; Bean, A.; Boer, E. Using Driver Control Models to Understand and Evaluate Behavioral Validity of Driving Simulators. IEEE Transactions on Human-Machine Systems 2018, 48, 592–603. [Google Scholar] [CrossRef]
- Abdullah, M.; Koetniyom, S.; Carmai, J. Development of a Mobile Driving Simulator to Eliminate False Motion Cues. Journal of the Society of Automotive Engineers Malaysia 2021. [Google Scholar] [CrossRef]
- Beanland, V.; Ritchie, C.; Ousset, C.; Galland, B.C.; Schaughency, E.A. Distracted and unfocused driving in supervised and unsupervised teen drivers: Associations with sleep, inattention, and cognitive disengagement syndrome symptoms. Transportation Research Part F: Traffic Psychology and Behaviour 2024, 100, 169–180. [Google Scholar] [CrossRef]
- Amini, R.; Michelaraki, E.; Katrakazas, C.; Haddad, C.A.; Vos, B.D.; Cuenen, A.; Yannis, G.; Brijs, T.; Antoniou, C. Risk scenario designs for driving simulator experiments. 2021 7th International Conference on Models and Technologies for Intelligent Transportation Systems (MT-ITS) 2021, pp. 1–6. [CrossRef]
- Zhou, M.; yao Hou, X.; Nie, L. Study on 3D highway digital model for driving simulators. Transportation Research Part F: Traffic Psychology and Behaviour 2019. [CrossRef]
- Cremer, J.; Kearney, J.; Papelis, Y. Driving simulation: challenges for VR technology. IEEE Computer Graphics and Applications 1996, 16, 16–20. [Google Scholar] [CrossRef]
- Xu, L.; Hu, J.; Jiang, H.; Meng, W. Establishing Style-Oriented Driver Models by Imitating Human Driving Behaviors. IEEE Transactions on Intelligent Transportation Systems 2015, 16, 2522–2530. [Google Scholar] [CrossRef]
- Miyajima, C.; Kusakawa, T.; Nishino, T.; Kitaoka, N.; Itou, K.; Takeda, K., On-Going Data Collection of Driving Behavior Signals. In In-Vehicle Corpus and Signal Processing for Driver Behavior; Springer US, 2009; pp. 45–54. [CrossRef]
- Morales-Alvarez, W.; Certad, N.; Roitberg, A.; Stiefelhagen, R.; Olaverri-Monreal, C. On Transferability of Driver Observation Models from Simulated to Real Environments in Autonomous Cars. ArXiv 2023, abs/2307.16543. [CrossRef]
- Kemeny, A.; Panerai, F. Evaluating perception in driving simulation experiments. Trends in Cognitive Sciences 2003, 7, 31–37. [Google Scholar] [CrossRef] [PubMed]
- Robbins, C.; Allen, H.; Chapman, P. Comparing drivers’ visual attention at Junctions in Real and Simulated Environments. Applied ergonomics 2019, 80, 89–101. [Google Scholar] [CrossRef] [PubMed]
- Voinea, G.D.; Boboc, R.G.; Buzdugan, I.D.; Antonya, C.; Yannis, G. Texting While Driving: A Literature Review on Driving Simulator Studies. International Journal of Environmental Research and Public Health 2023, 20, 4354. [Google Scholar] [CrossRef] [PubMed]
- Wynne, R.A.; Beanland, V.; Salmon, P.M. Systematic review of driving simulator validation studies. Safety Science 2019, 117, 138–151. [Google Scholar] [CrossRef]
- Doniec, R.J.; Sieciński, S.; Duraj, K.M.; Piaseczna, N.J.; Mocny-Pachońska, K.; Tkacz, E.J. Recognition of Drivers’ Activity Based on 1D Convolutional Neural Network. Electronics 2020, 9. [Google Scholar] [CrossRef]
- Doniec, R.; Piaseczna, N.; Li, F.; Duraj, K.; Pour, H.H.; Grzegorzek, M.; Mocny-Pachońska, K.; Tkacz, E. Classification of Roads and Types of Public Roads Using EOG Smart Glasses and an Algorithm Based on Machine Learning While Driving a Car. Electronics 2022, 11, 2960. [Google Scholar] [CrossRef]
- Doniec, R.J.; Piaseczna, N.; Duraj, K.; Sieciński, S.; Irshad, M.T.; Karpiel, I.; Urzeniczok, M.; Huang, X.; Piet, A.; Nisar, M.A.; Grzegorzek, M. The detection of alcohol intoxication using electrooculography signals from smart glasses and machine learning techniques. Systems and Soft Computing 2024, 6, 200078. [Google Scholar] [CrossRef]
- Doniec, R.; Konior, J.; Sieciński, S.; Piet, A.; Irshad, M.T.; Piaseczna, N.; Hasan, M.A.; Li, F.; Nisar, M.A.; Grzegorzek, M. Sensor-Based Classification of Primary and Secondary Car Driver Activities Using Convolutional Neural Networks. Sensors 2023, 23, 5551. [Google Scholar] [CrossRef] [PubMed]
- Hnoohom, N.; Mekruksavanich, S.; Jitpattanakul, A. Driving Activity Classification Using Deep Residual Networks Based on Smart Glasses Sensors. Intelligent Automation & Soft Computing 2023, 38, 139–151. [Google Scholar] [CrossRef]
- Ortega, D.G.; Pernas, F.; Martínez-Zarzuela, M.; Antón-Rodríguez, M. Comparative Analysis of Kinect-Based and Oculus-Based Gaze Region Estimation Methods in a Driving Simulator †. Sensors (Basel, Switzerland) 2020, 21. [Google Scholar] [CrossRef]
- Piaseczna, N.; Doniec, R.; Sieciński, S.; Grzegorzek, M.; Tkacz, E. Does glucose affect our vision? A preliminary study using smart glasses. 2023 IEEE EMBS Special Topic Conference on Data Science and Engineering in Healthcare, Medicine and Biology, 2023, pp. 113–114. [CrossRef]
- Stuart, A. Kendall’s Advanced Theory of Statistics, 3 Volume Set, 6th Edition.; John Wiley & Sons, 2010. OCLC: 940705630.
- Buck, J.R.; Daniel, M.M.; Singer, A. Computer explorations in signals and systems using MATLAB, 2nd ed ed.; Prentice-Hall signal processing series; Prentice Hall: Upper Saddle River, N.J, 2002. [Google Scholar]
- Stoica, P.; Moses, R.L. Spectral analysis of signals; Pearson/Prentice Hall: Upper Saddle River, N.J, 2005. [Google Scholar]
- Kay, S.M. Modern spectral estimation: theory and application; Prentice-Hall signal processing series; Prentice Hall: Englewood Cliffs, N.J, 1988. [Google Scholar]
- Mekruksavanich, S.; Jitpattanakul, A. Smartwatch-based Human Activity Recognition Using Hybrid LSTM Network. 2020 IEEE SENSORS, 2020, pp. 1–4. [CrossRef]
- Mekruksavanich, S.; Jitpattanakul, A. LSTM Networks Using Smartphone Data for Sensor-Based Human Activity Recognition in Smart Homes. Sensors 2021, 21. [Google Scholar] [CrossRef] [PubMed]
- Mekruksavanich, S.; Jitpattanakul, A. Biometric User Identification Based on Human Activity Recognition Using Wearable Sensors: An Experiment Using Deep Learning Models. Electronics 2021, 10. [Google Scholar] [CrossRef]
- Hastie, T.; Tibshirani, R.; Friedman, J. The Elements of Statistical Learning; Springer Series in Statistics; Springer New York: New York, NY, 2009. [Google Scholar] [CrossRef]
- Breiman, L.; Spector, P. Submodel Selection and Evaluation in Regression. The X-Random Case. International Statistical Review / Revue Internationale de Statistique 1992, 60, 291. [Google Scholar] [CrossRef]
- Kohavi, R. A study of cross-validation and bootstrap for accuracy estimation and model selection. Proceedings of the 14th International Joint Conference on Artificial Intelligence - Volume 2; Morgan Kaufmann Publishers Inc.: San Francisco, CA, USA, 1995; IJCAI’95; pp. 1137–1143. [Google Scholar]
- Smith, L.N. A disciplined approach to neural network hyper-parameters: Part 1 – learning rate, batch size, momentum, and weight decay, 2018. [CrossRef]
- Yang, L.; Liang, X.; Wang, T.; Xing, E. Real-to-Virtual Domain Unification for End-to-End Autonomous Driving. Proceedings of the European Conference on Computer Vision (ECCV), 2018.
- Karrouchi, M.; Nasri, I.; Rhiat, M.; Atmane, I.; Hirech, K.; Messaoudi, A.; Melhaoui, M.; Kassmi, K. Driving behavior assessment: A practical study and technique for detecting a driver’s condition and driving style. Transportation Engineering 2023, 14, 100217. [Google Scholar] [CrossRef]
- Steinberger, F.;Schroeter, R.;Babiac, D., Engaged Drivers–Safe Drivers:Gathering Real-Time Data from Mobile and Wearable Devices for Safe-Driving Apps.In Automotive User Interfaces:Creating Interactive Experiences in the Car; Springer International Publishing: Cham, 2017; pp.55–76. [CrossRef]
- Aarthi, M.; Mahima, R.; Sujanthi, S.; Santosh, A.M.; Sekar, S.; Matthew, J.R.R.; Rooban, C.; Ramamoorthy. Driver drowsiness detection using deep learning technique. AIP Conference Proceedings 2023, 2822, 020248. [Google Scholar] [CrossRef]
- Driver Behavior Analysis for Safe Driving: A Survey. IEEE Transactions on Intelligent Transportation Systems 2015, 16, 3017–3032. Conference Name:IEEE Transactions on Intelligent Transportation Systems,. [CrossRef]
- Tomiło, P. Classification of the Condition of Pavement with the Use of Machine Learning Methods. Transport and Telecommunication 2023, 24, 158–166. [Google Scholar] [CrossRef]
- Wallace, B.; Gagnon, S.; Stinchcombe, A.; Yamin, S.; Goubran, R.; Knoefel, F. Preliminary Results for the Automated Assessment of Driving Simulation Results for Drivers with Cognitive Decline. 2021 IEEE Sensors Applications Symposium (SAS), 2021, pp. 1–6. [CrossRef]
- Cai, A.W.T.; Manousakis, J.E.; Singh, B.; Francis-Pester, E.; Kuo, J.; Jeppe, K.J.; Rajaratnam, S.M.W.; Lenné, M.G.; Howard, M.E.; Anderson, C. Subjective awareness of sleepiness while driving in younger and older adults. Journal of Sleep Research 2024, 33, e13933. [Google Scholar] [CrossRef] [PubMed]
- Slater, M.; Sanchez-Vives, M.V. Enhancing Our Lives with Immersive Virtual Reality. Frontiers in Robotics and AI 2016, 3. [Google Scholar] [CrossRef]
- Freeman, D.; Reeve, S.; Robinson, A.; Ehlers, A.; Clark, D.; Spanlang, B.; Slater, M. Virtual reality in the assessment, understanding, and treatment of mental health disorders. Psychological Medicine 2017, 47, 2393–2400. [Google Scholar] [CrossRef]
- Cummings, J.J.; Bailenson, J.N. How Immersive Is Enough? A Meta-Analysis of the Effect of Immersive Technology on User Presence. Media Psychology 2016, 19, 272–309. [Google Scholar] [CrossRef]
- Ahn, S.J.G.; Bailenson, J.N.; Park, D. Short- and long-term effects of embodied experiences in immersive virtual environments on environmental locus of control and behavior. Computers in Human Behavior 2014, 39, 235–245. [Google Scholar] [CrossRef]
- Diemer, J.; Alpers, G.W.; Peperkorn, H.M.; Shiban, Y.; Mühlberger, A. The impact of perception and presence on emotional reactions: a review of research in virtual reality. Frontiers in Psychology 2015, 6. [Google Scholar] [CrossRef] [PubMed]
Figure 1.
JINS MEME ES_R smart glasses [11]
Figure 1.
JINS MEME ES_R smart glasses [11]
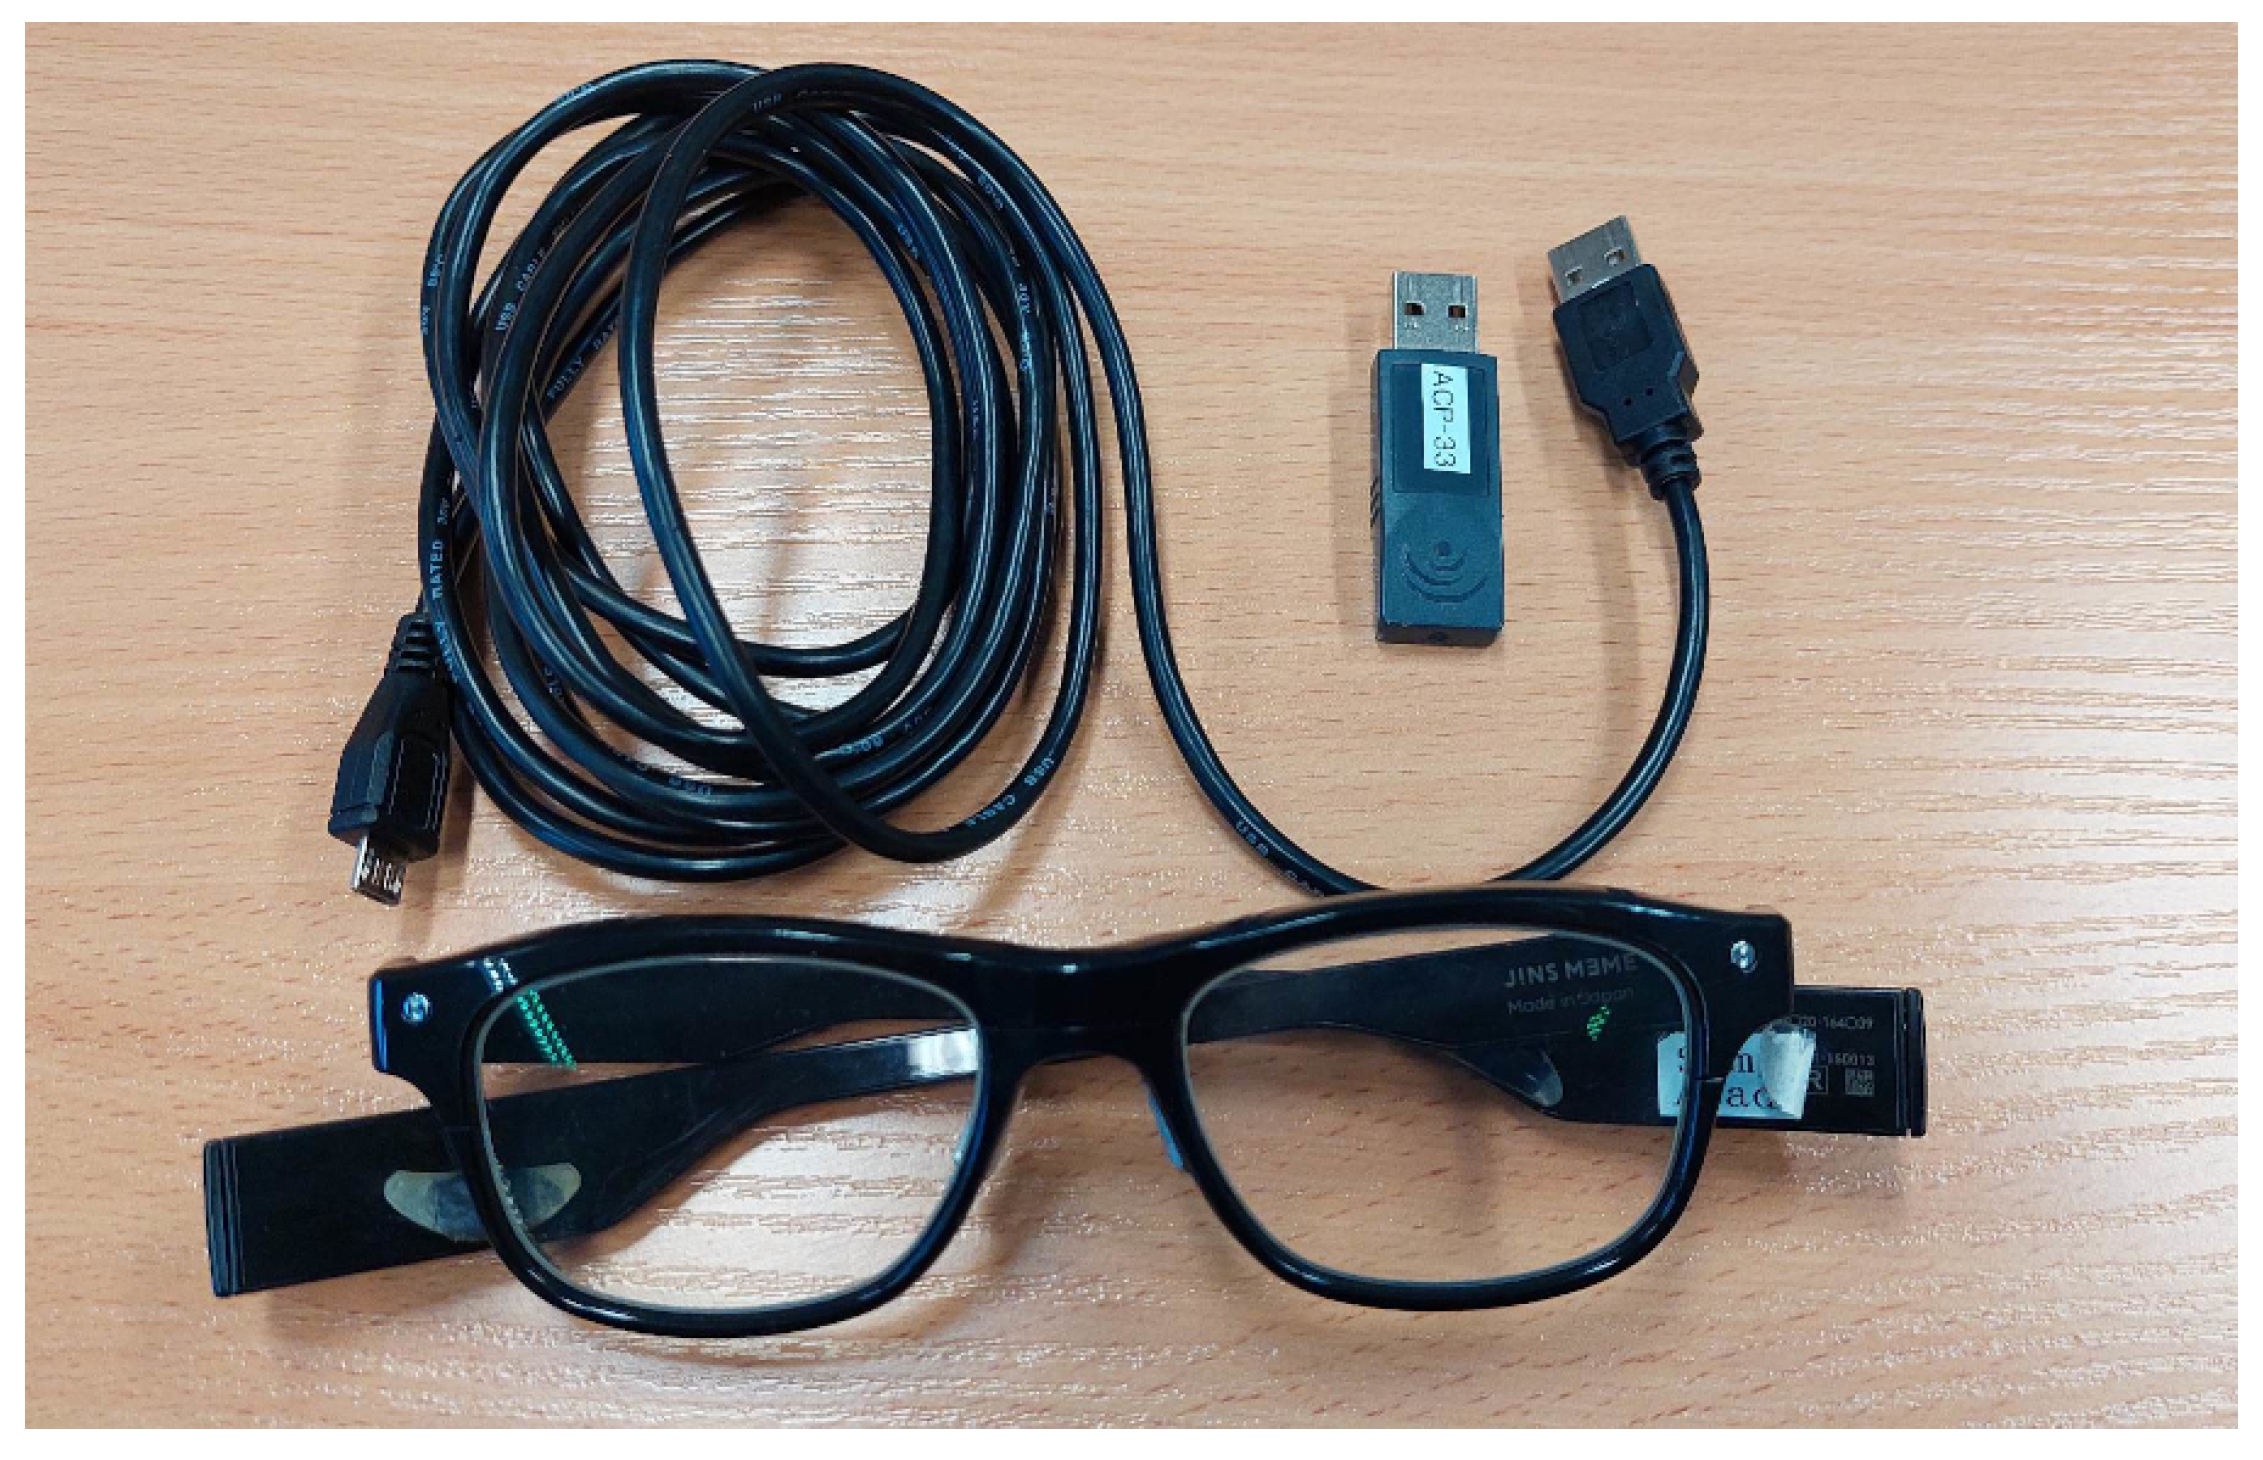
Figure 2.
Experimental setup
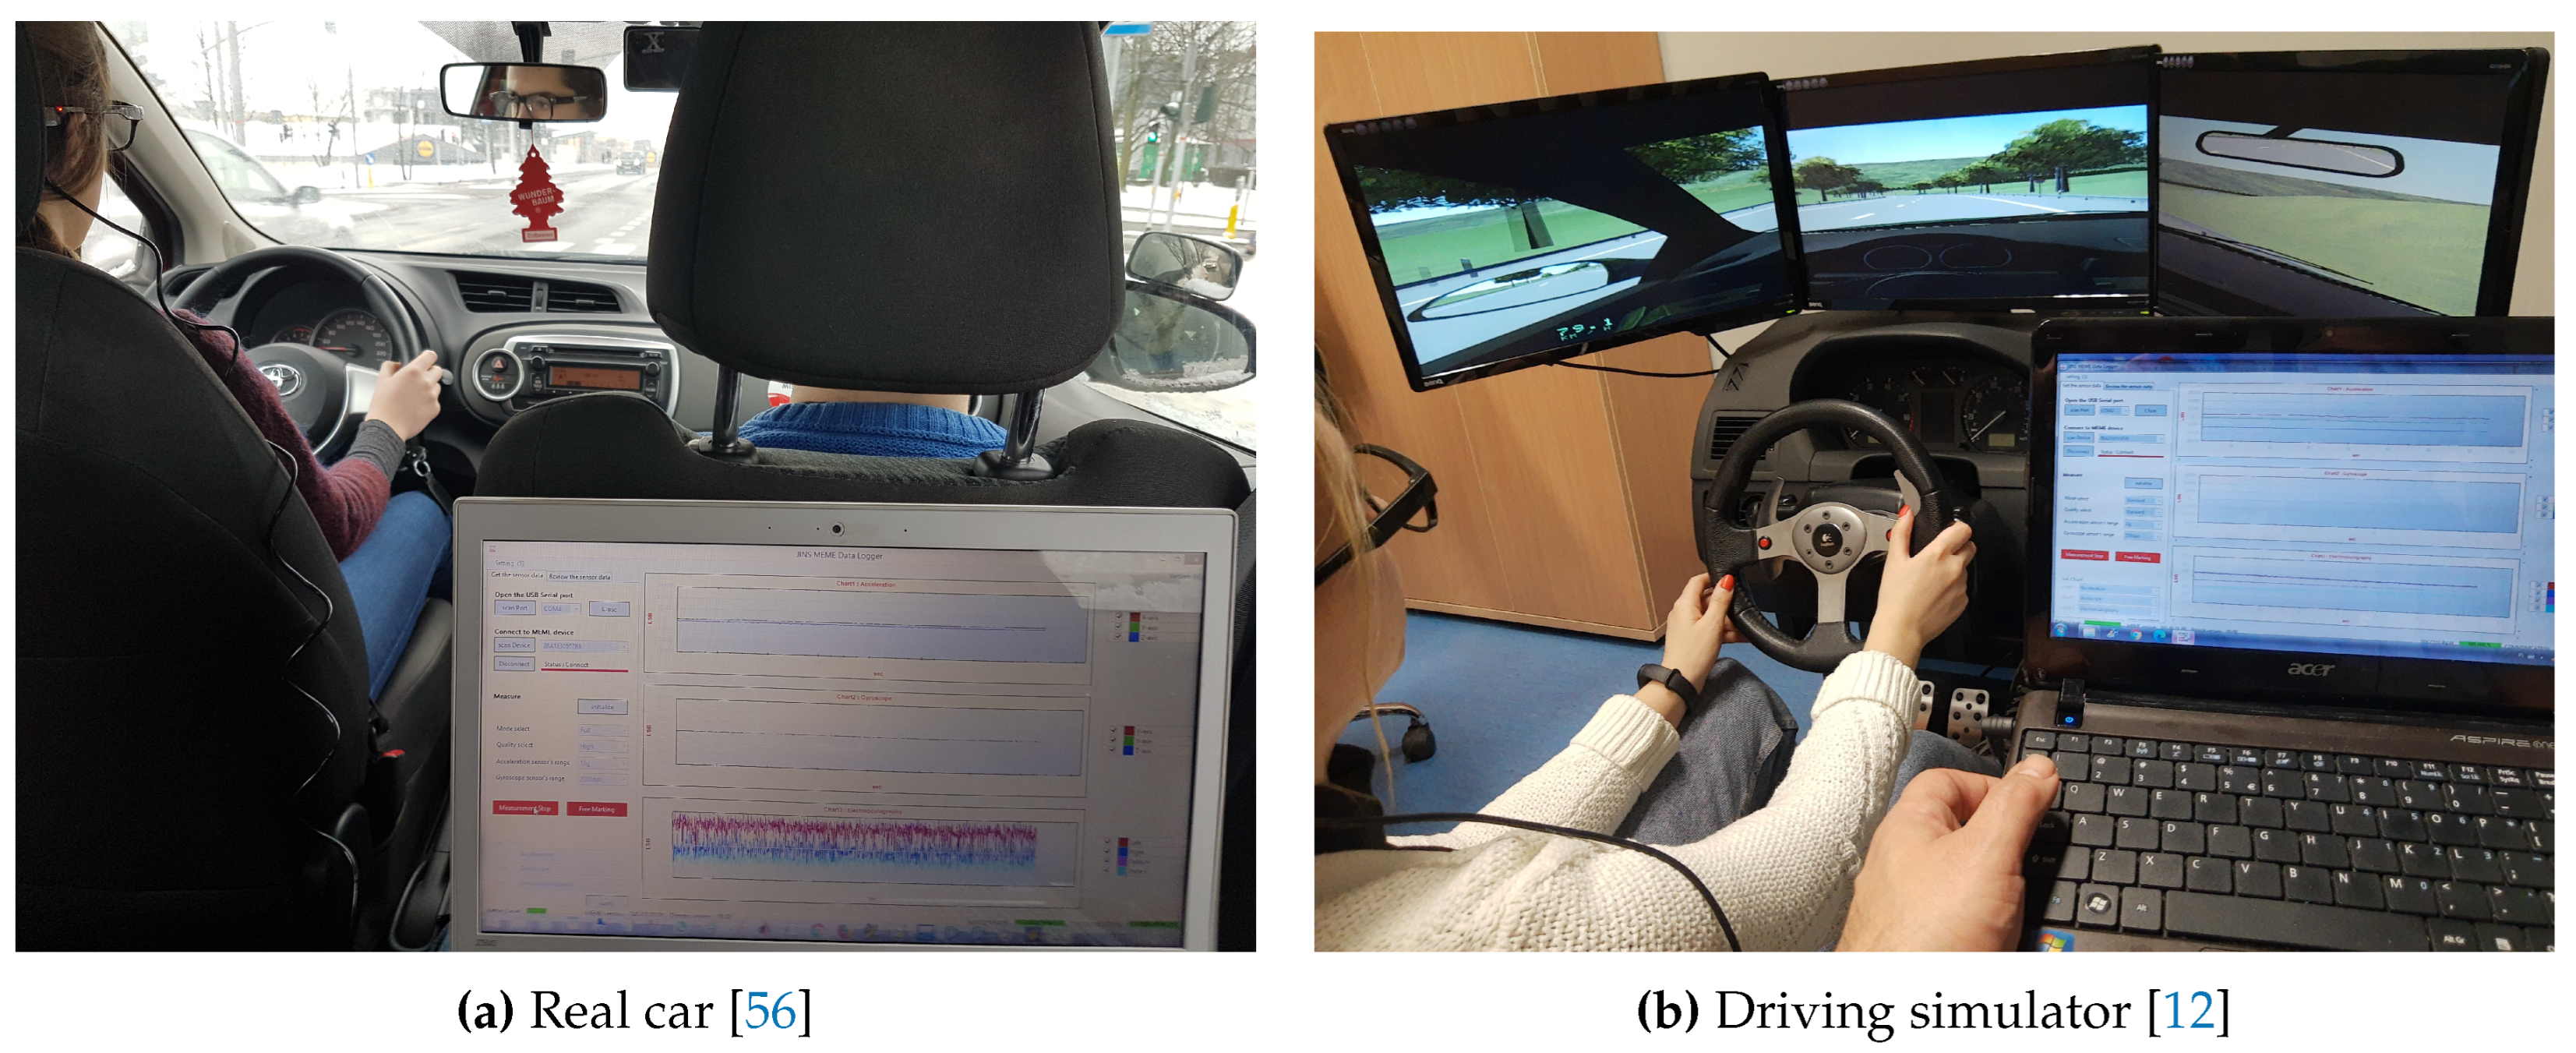
Figure 3.
Graphical representation of the distribution of a dataset
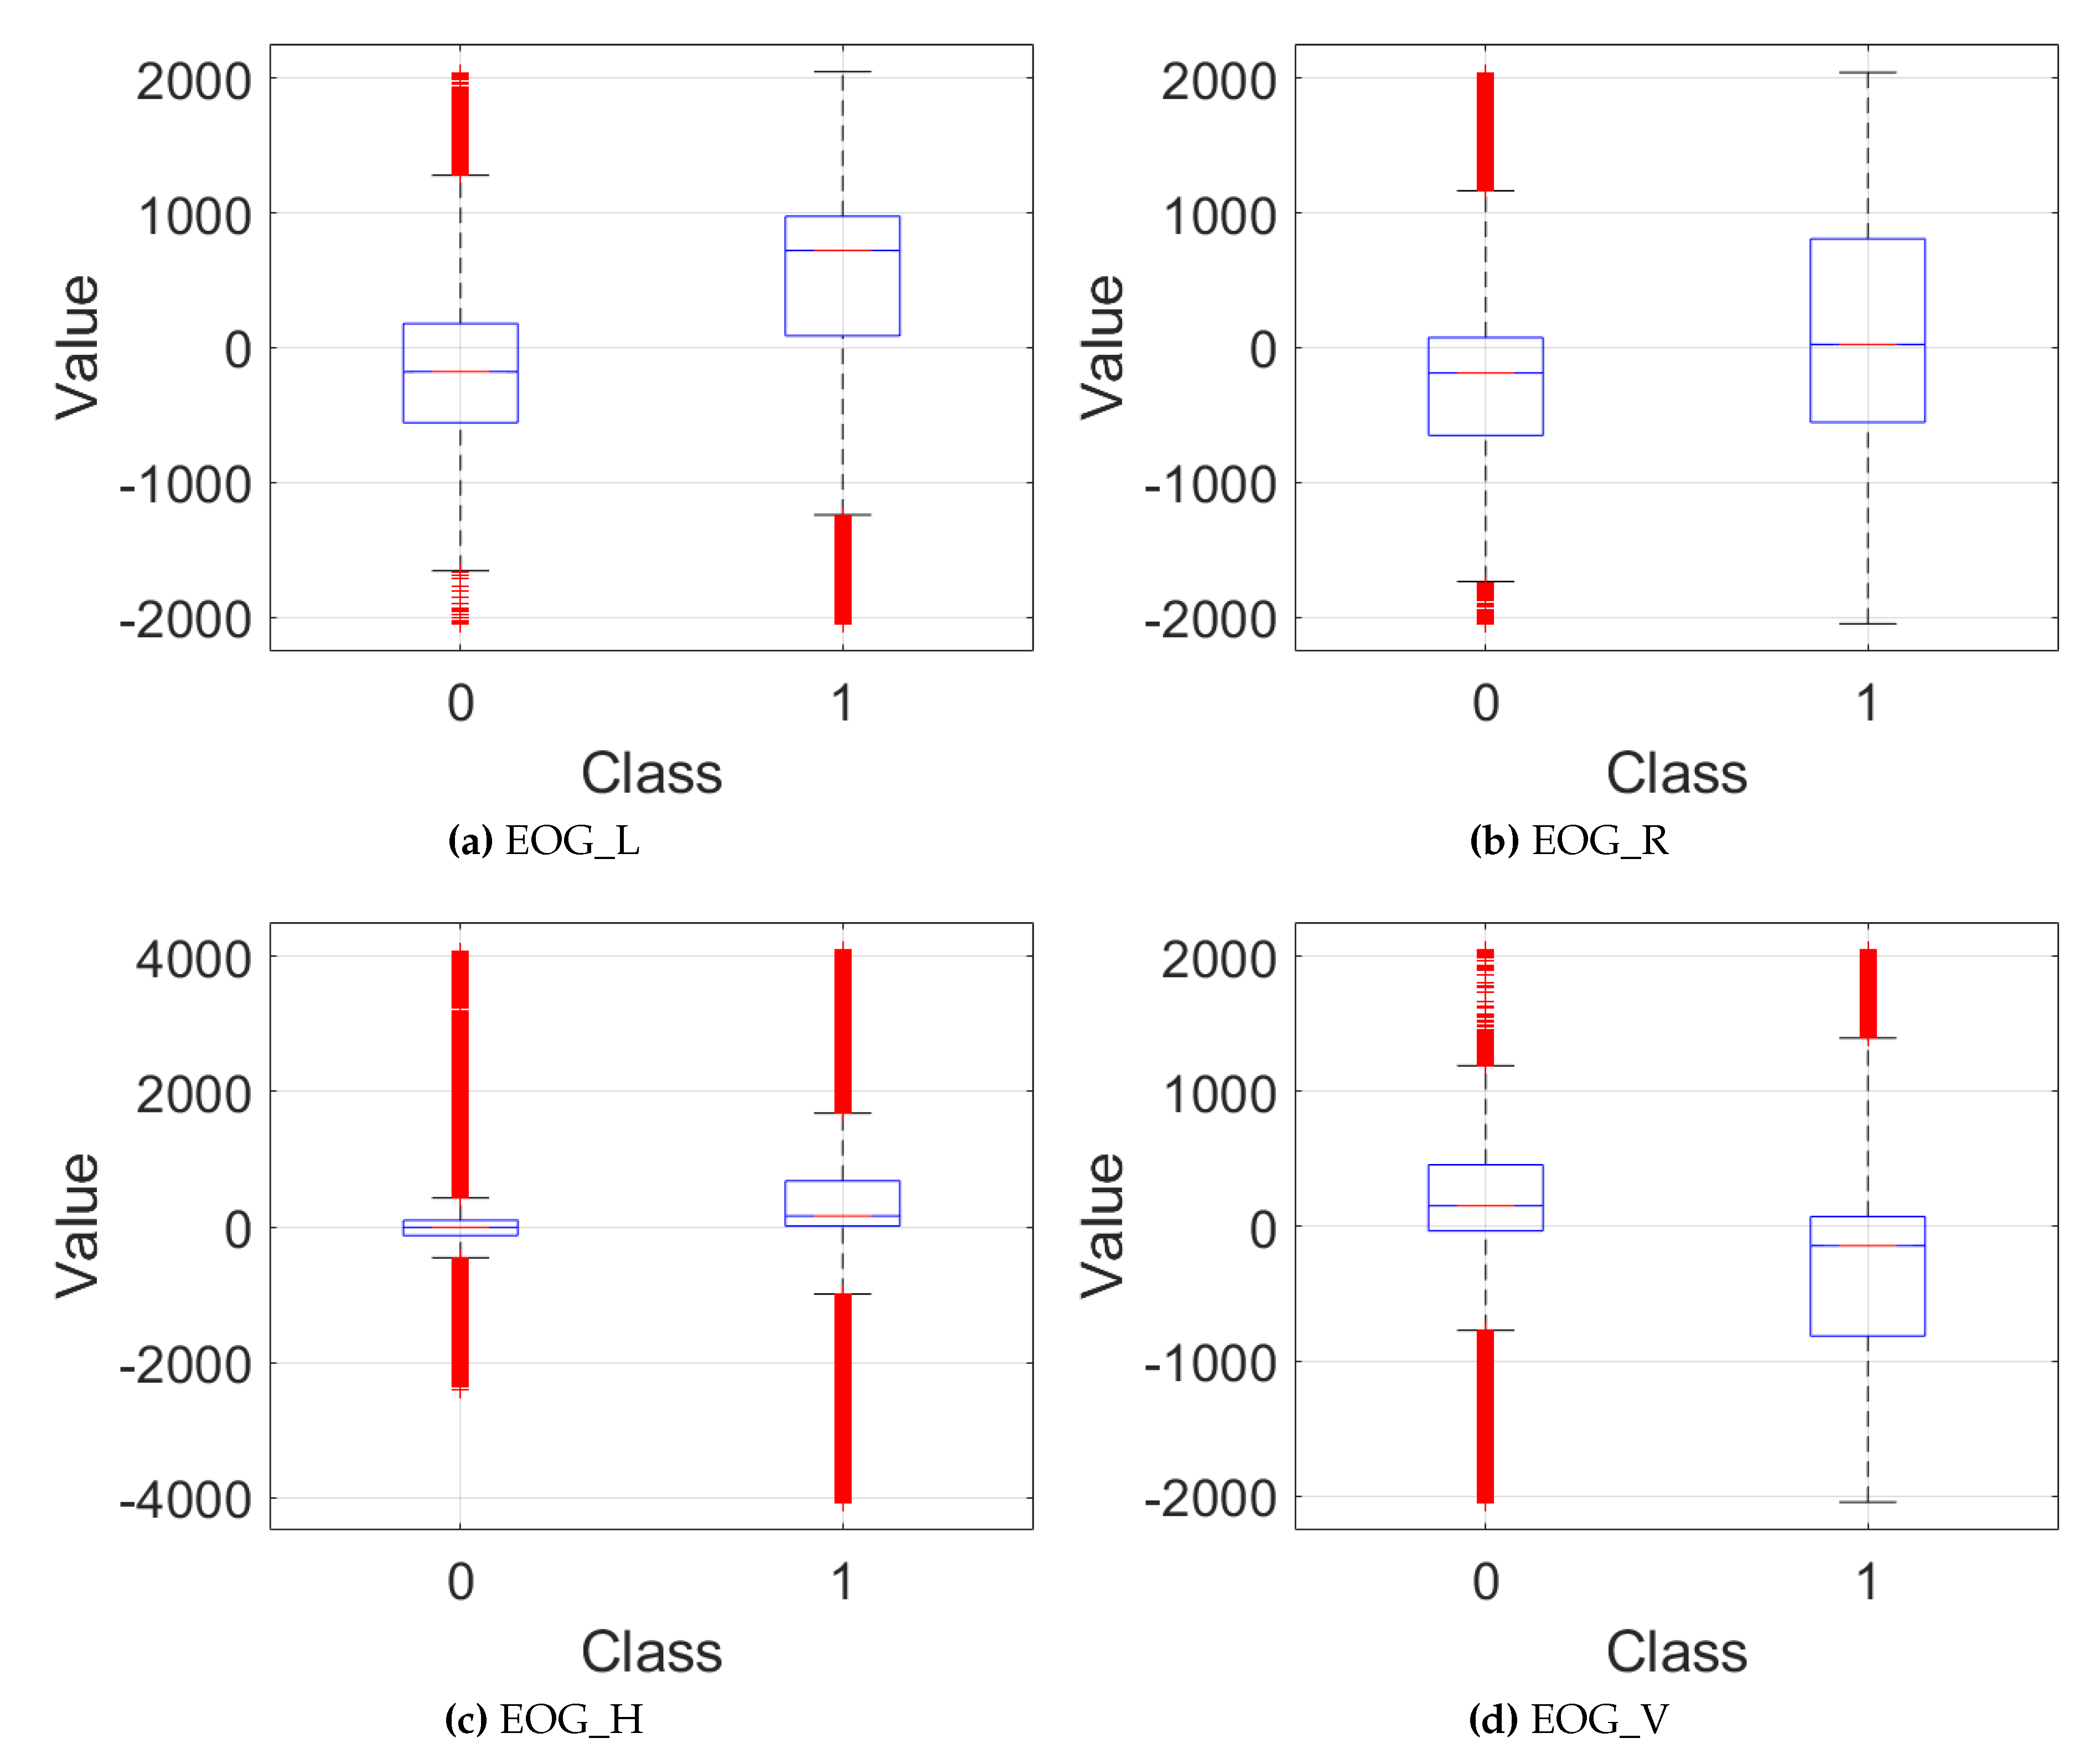
Figure 4.
Data distribution in the datasets among training iterations.
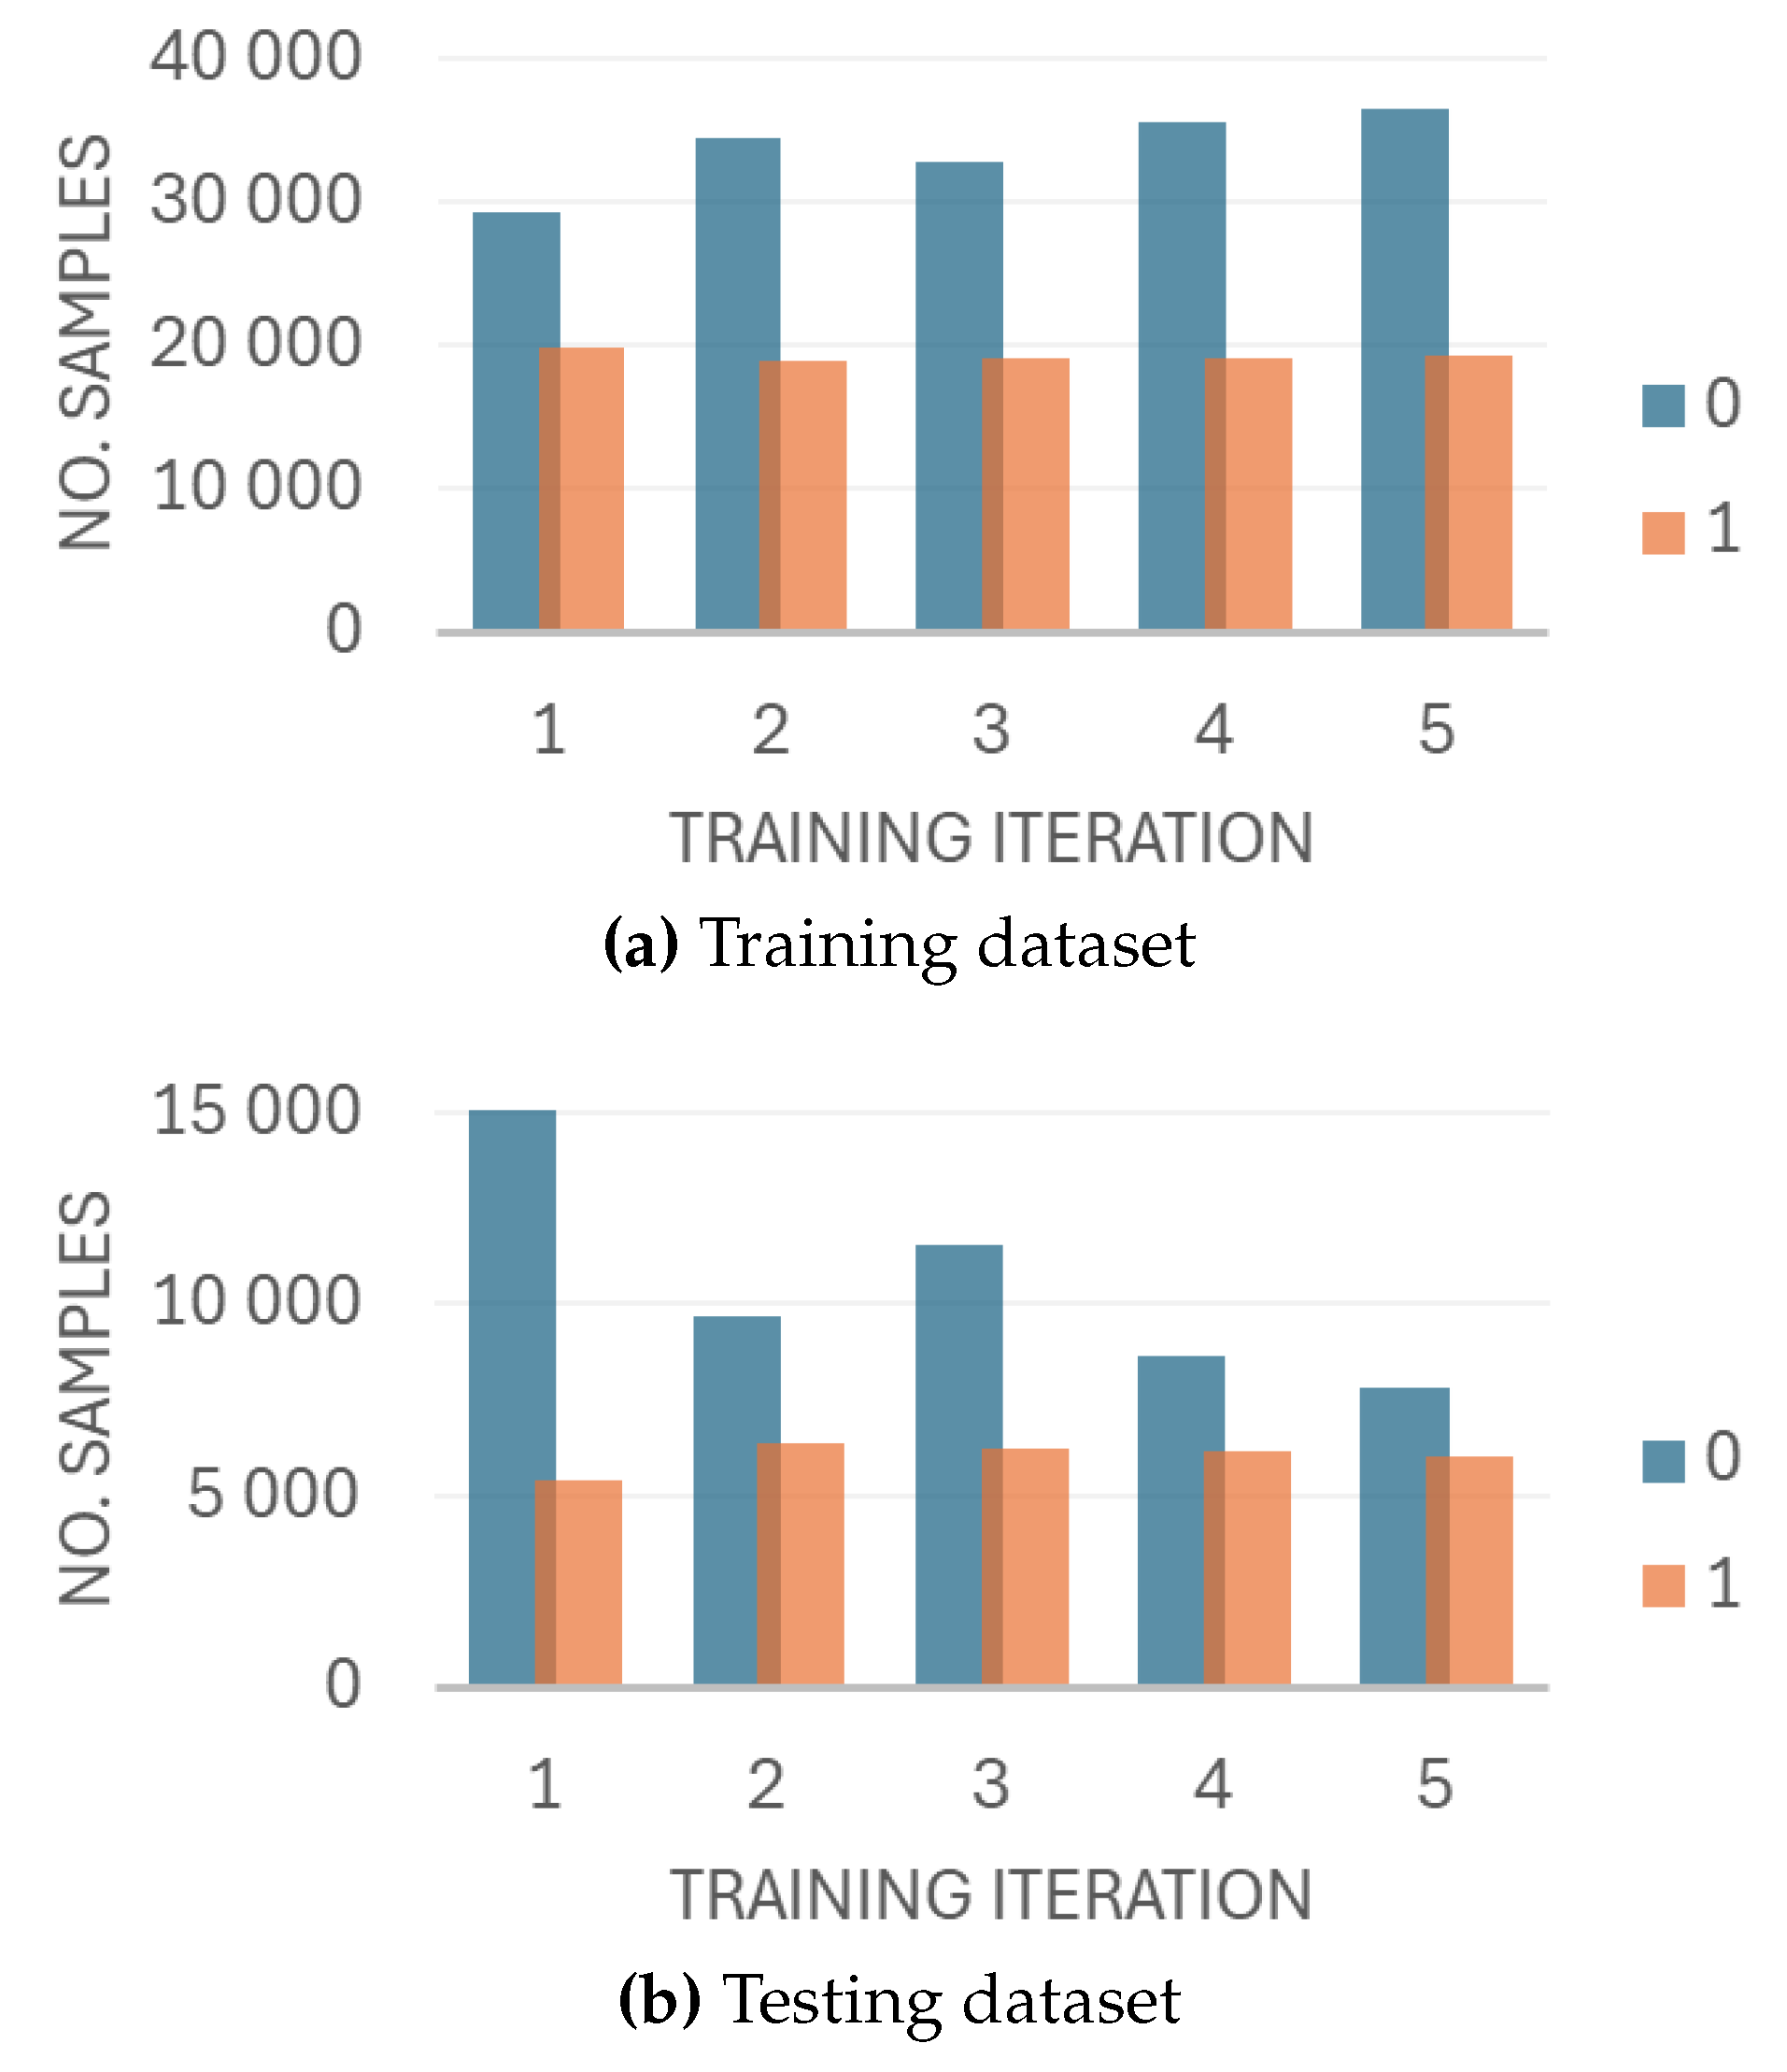
Figure 5.
Accuracy and loss among iterations.
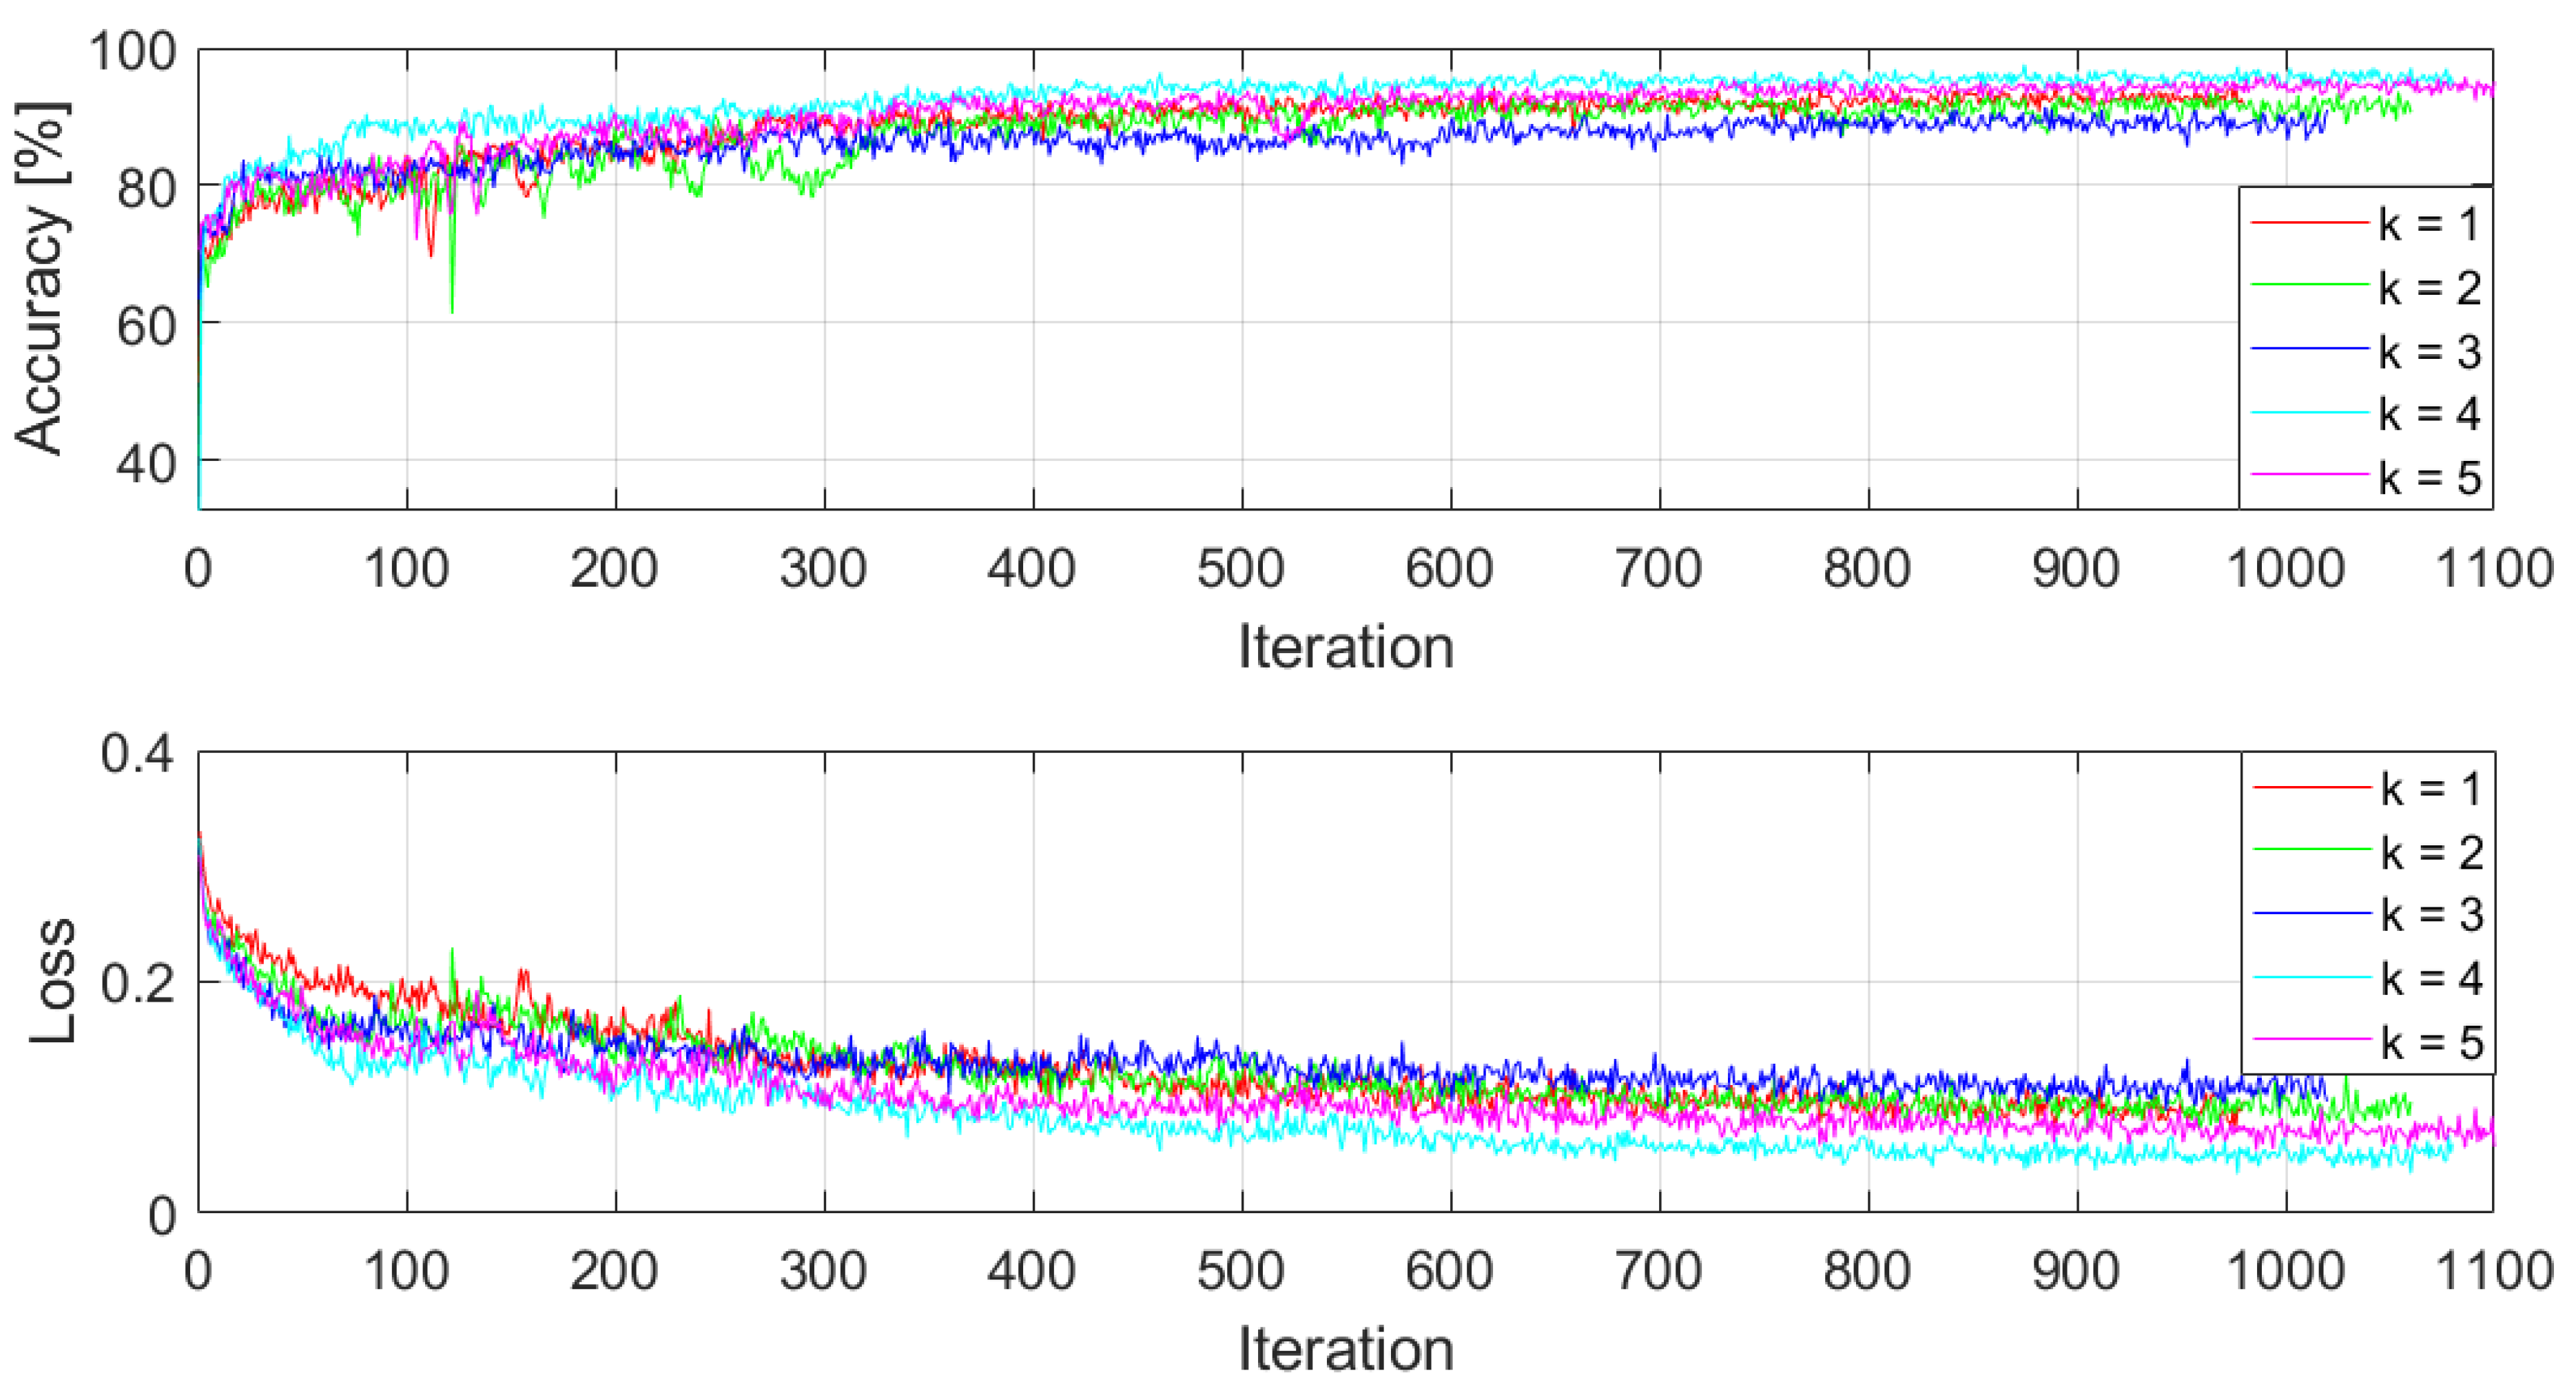
Figure 6.
Confusion matrix on test dataset.
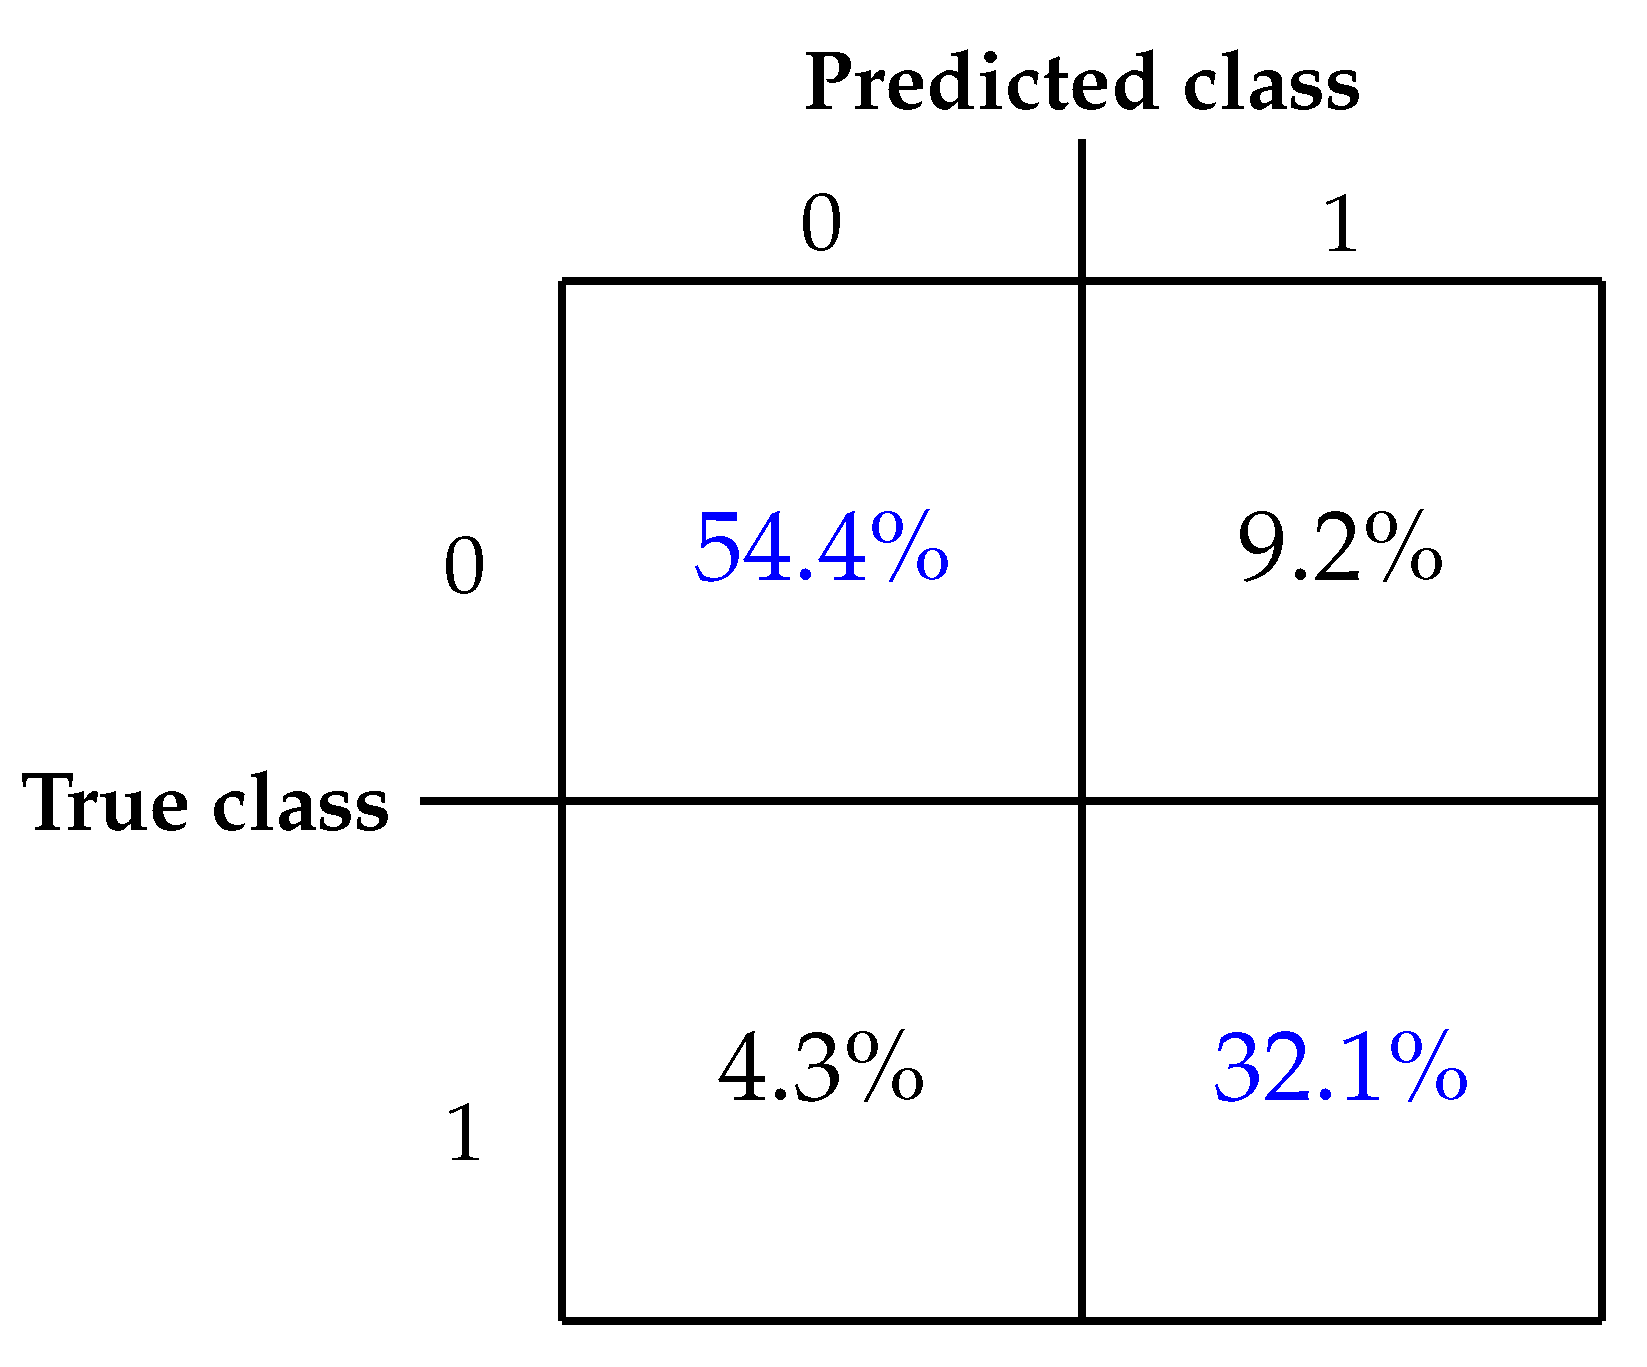
Table 1.
A summary of the study group. Driving experience was calculated only for experienced drivers.
Table 1.
A summary of the study group. Driving experience was calculated only for experienced drivers.
| Age [years] | Gender | Driving experience [years] | Experimental setup |
|---|---|---|---|
| 38.7±16.8 | 13 F, 17 M | 26.7±12.9 | real car |
| 29.5±14.3 | 13 F, 17 M | 15.4±18.0 | driving simulator |
Table 2.
Descriptive statistics of the dataset
| Signal | EOG_L | EOG_R | EOG_H | EOG_V | ||||
|---|---|---|---|---|---|---|---|---|
| Class | 0 | 1 | 0 | 1 | 0 | 1 | 0 | 1 |
| Minimum | -2048.0 | -2048.0 | -2048.0 | -2048.0 | -2399.8 | -4071.0 | -2047.0 | -2044.0 |
| Median | -178.5 | 720.9 | -188.5 | 23.7 | -9.5 | 159.7 | 150.5 | -141.7 |
| Maximum | 2047.0 | 2047.0 | 2047.0 | 2040.5 | 4085.4 | 4095.0 | 2048.0 | 2048.0 |
| Mean | -179.9 | 482.3 | -240.4 | 92.9 | 60.5 | 387.3 | 210.0 | -287.3 |
| St. dev. | 511.7 | 705.0 | 473.2 | 795.1 | 641.3 | 870.7 | 373.9 | 611.3 |
Table 4.
Percentage of signal pairs in specific range of linear correlation coefficient r.
| Channel | |r|<0.1 | 0.1≤|r|<0.3 | 0.3≤|r|<0.5 | 0.5≤|r|<0.7 | 0.7≤|r|<0.9 | |r|≥0.9 |
|---|---|---|---|---|---|---|
| EOG_L | 35.1727% | 46.9666% | 14.8945% | 2.6388% | 0.3160% | 0.0072% |
| EOG_R | 34.8528% | 46.9660% | 15.1643% | 2.7285% | 0.2839% | 0.0042% |
| EOG_H | 35.0922% | 47.6963% | 14.7746% | 2.2401% | 0.1945% | 0.0020% |
| EOG_V | 35.0067% | 46.9488% | 15.0645% | 2.6795% | 0.2954% | 0.0049% |
| Average | 49.6120% | 44.1441% | 5.8566% | 0.3754% | 0.0077% | 0.000% |
Table 11.
Class weights among training iterations
| Class | k = 1 | k = 2 | k = 3 | k = 4 | k = 5 |
|---|---|---|---|---|---|
| 0 | 0.4052 | 0.3535 | 0.3684 | 0.3205 | 0.3460 |
| 1 | 0.5948 | 0.6465 | 0.6316 | 0.6498 | 0.6540 |
Table 12.
Classification report.
| Training iteration | Accuracy | Recall | Specificity | Precision | F1-score |
|---|---|---|---|---|---|
| 1 | 92.38% | 92.23% | 92.80% | 97.27% | 94.68% |
| 2 | 87.87% | 88.46% | 86.98% | 91.14% | 89.78% |
| 3 | 79.02% | 69.27% | 97.12% | 97.81% | 81.10% |
| 4 | 84.40% | 87.64% | 79.81% | 86.00% | 86.81% |
| 5 | 88.19% | 90.46% | 85.25% | 88.83% | 89.64% |
| Overall | 86.53% | 85.51% | 88.31% | 92.75% | 88.98% |
Disclaimer/Publisher’s Note: The statements, opinions and data contained in all publications are solely those of the individual author(s) and contributor(s) and not of MDPI and/or the editor(s). MDPI and/or the editor(s) disclaim responsibility for any injury to people or property resulting from any ideas, methods, instructions or products referred to in the content. |
© 2024 by the authors. Licensee MDPI, Basel, Switzerland. This article is an open access article distributed under the terms and conditions of the Creative Commons Attribution (CC BY) license (http://creativecommons.org/licenses/by/4.0/).
Copyright: This open access article is published under a Creative Commons CC BY 4.0 license, which permit the free download, distribution, and reuse, provided that the author and preprint are cited in any reuse.


