Preprint
Article

Computational Modeling of Sodium Ion Channel-Based Glucose Sensing Biophysics to Study Cardiac Atrial Cell Electrophysiology

Altmetrics

Downloads

160

Views

77

Comments

0

A peer-reviewed article of this preprint also exists.

Submitted:

19 May 2024

Posted:

20 May 2024

You are already at the latest version

Alerts
Abstract
Elevated blood glucose levels, known as glycemia, play a significant role in sudden cardiac arrest, often resulting in sudden cardiac death, particularly among those with diabetes. Understanding the internal mechanisms has been a challenge for healthcare professionals, leading many research groups to investigate the relationship between blood glucose levels and cardiac electrical activity. Our hypothesis suggests that glucose-sensing biophysics mechanisms in cardiac tissue could clarify this connection. To explore this, we adapted a single-compartment, computational model of the human atrial node's action potential. We incorporated glucose-sensing mechanisms with voltage-gated sodium ion channels using ordinary differential equations. Parameters for the model were based on existing experimental studies to mimic the impact of glucose levels on atrial node action potential firing. Simulations using voltage clamp and current clamp techniques showed that elevated glucose levels decreased sodium ion channel currents, leading to a reduction in the sinoatrial node action potential frequency. In summary, our mathematical model provides a cellular-level understanding of how high glucose levels can lead to bradycardia and sudden cardiac death.
Keywords: 
Subject: Biology and Life Sciences  -   Biophysics

1. Introduction

Cardiovascular disease is the leading global cause of death and imposes significant economic burdens due to healthcare costs and societal impacts. Effective prevention and management strategies are urgently needed for ischemic heart disease and stroke to mitigate their public health impact [1,2]. A heart attack is typically defined as the obstruction of oxygenated blood flow from the heart to a specific segment. Electrical signaling in cardiac muscle coordinates the heart's contractions, regulating its rhythm and ensuring effective pumping. Sudden cardiac arrest (SCA), occurring abruptly due to irregular electrical activities of the heart, leads to sudden cardiac death (SCD) if the victim does not receive immediate treatment [3,4]. Bradycardia (heart rate of less than 60 beats per minute) and tachycardia (heart rate of more than 100 beats per minute) are two arrhythmic conditions that can lead to SCA and SCD [5,6]. Cardiac tissues are electrically excitable, initiating a series of electrical activities including depolarization, hyperpolarization, and the generation of action potentials (AP), which in turn generate mechanical forces responsible for pumping blood into various organs of the body [7,8,9,10]. The cardiac AP is a voltage change that propagates along the membrane of a myocyte, and it's an "all-or-nothing" event triggered by a sufficient depolarization reaching a threshold voltage [11]. In addition, the electrical signaling in different regions of the heart are not uniform as these sections generate a set of clearly distinguishable AP configurations [12,13]. Cardiac APs generated at the location of the sinoatrial node, atrioventricular node, and bundle of His and Purkinje fibers are major contributors to rhythmic function [14]. A diverse group of ion channels are present in the different regions of the cardiac tissue to generate and modulate all these electrical properties including the AP [15,16]. The most common ion channels in both excitable and non-excitable tissues are sodium, potassium, and calcium ion channels. Sodium channels initiate the rapid depolarization phase by allowing sodium influx, while potassium channels contribute to repolarization by facilitating potassium efflux. Calcium channels are involved in both depolarization and repolarization phases, maintaining the plateau phase and regulating contraction. These channels ensure the proper rhythmicity and contractility of the heart, essential for its normal function and circulation [17].
A set of clinical and experimental studies indicate that abnormal blood glucose concentrations are intricately linked to cardiac electrical properties, contributing significantly to SCD [18,19,20]. About one-third of SCD cases are associated with an interplay between abnormal blood glucose levels and cardiac electrical dysfunctions [21]. Hyperglycemia, characteristic of diabetes and glucose intolerance, can lead to non-enzymatic glycosylation and damage to cardiac tissues, affecting the heart's electrical conductivity and predisposing individuals to fatal arrhythmias [19,21]. Elevated glucose levels are also correlated with increased arterial stiffness and microvascular damage, further exacerbating the risk of cardiac events [21]. These findings highlight the complex relationship between metabolic disturbances and cardiac function, underscoring the importance of managing blood glucose levels in preventing SCD. It is well known that elevated blood glucose levels are primary symptoms in people with both type 1 and type 2 diabetes due to a lack of sufficient insulin secretion from the pancreatic β cells [22,23,24]. Patients with type 2 diabetes are associated with an increased risk of SCA [25,26,27]. The scientific communities are exploring novel promising therapies to overcome the limitations of current exogenous insulin delivery for maintaining stable basal blood glucose concentrations. The ion channels are new medical research interests in finding novel pharmacological agents to maintain constant electrical properties in cardiac tissues [28,29,30]. In our body, the ion channels act as biological sensors by facilitating the flow of respective ions across the cell membrane after sensing several stimuli such as pH, light, force, hormones, chemicals, and electrical potentials [31,32]. In cardiac electrophysiology, voltage-gated sodium channels are the transmembrane proteins located across the cell membrane of cardiomyocytes. The influx of sodium ions through these ion channels is responsible for the initial fast upstroke of the cardiac AP [33]. Therefore, any dysfunction in this ion channel can alter the AP patterns and electrical signaling in the cardiomyocytes. It is demonstrated that extracellular glucose application inhibits the voltage-gated sodium channel current in the pancreatic β cells [34]. Therefore, we can predict a hypothesis that the cardiac voltage-gated sodium ion channels also act like glucose sensors and modulate the cardiac AP patterns concerning blood glucose concentrations. So, any additional knowledge of the glucose-sensing mechanism by these sodium ion channels might be useful to explore new pharmacological targets for SCA. Unfortunately, the in-depth understanding of the relationship among cardiac ion channel biophysics, AP generation, and blood sugar levels is unexplored due to the complex nature of the cardiac electrophysiology experimental setup.
For several decades, computational, mathematical, and in silico techniques have significantly contributed to the understanding of complex biological signaling processes by simulating various scenarios, predicting outcomes, and providing insights that might be challenging to obtain through traditional experimental methods [35,36]. Computational simulations have contributed to understanding various types of muscle electrophysiology by exploring cellular biophysics, thus modulating cellular electrical activities [37,38]. These models provide insights into ion channel function, including conductance, ion selectivity, and channel opening, which are pivotal in pathological conditions [39,40]. Another positive aspect of biophysical modeling is that models directly simulate ion flux through membrane channels, aiding in understanding their behavior and contribution to disease processes [40]. Biophysical modeling of cardiac muscle electrophysiology plays a pivotal role in the discovery of novel therapies by providing a virtual platform to simulate the intricate electrical dynamics of the heart. Through these models, researchers can explore the effects of various pharmacological interventions and ion channel modulations on the cardiac AP, offering insights into potential therapeutic targets. By iteratively refining these models based on experimental data and clinical observations, researchers can identify promising drug candidates, predict their efficacy, and optimize treatment strategies for cardiovascular diseases [41]. Additionally, patient-specific models, tailored to individual clinical measurements, enable personalized medicine approaches, allowing for the development of precision therapies optimized for specific cardiac conditions [42]. Ultimately, biophysical modeling serves as a valuable tool in the translation of basic research findings into clinically relevant therapies, contributing to advancements in cardiovascular medicine and patient care [43]. Computational biophysical models are also continually enhanced by integrating new experimental data, refining parameters, and adjusting algorithms to better align with empirical findings [44]. This iterative process ensures that models accurately represent biological phenomena and facilitate deeper insights into complex systems [45]. Although there are numerous biophysical models for cardiac AP (detailed in the methods section) aimed at understanding the underlying ion channel kinetics and signaling pathways, currently, there is no computational model describing the electrophysiological responses to blood glucose concentrations with ion channel kinetics in cardiac tissues, particularly for atrial node (AN) cell electrophysiology. Here, we present a biophysically explained in silico model of AN cell electrophysiology to examine the effect of glycemia on the AN AP firing rate. Our objectives for establishing this model are threefold. First, supported by experimental data, we will simulate and validate the voltage-gated sodium ion channel kinetics concerning blood glucose concentration. Second, we will incorporate the ion channel into a single compartmental biophysical model to simulate the APs and investigate changes in AP parameters concerning blood glucose concentration. Third, we aim to draw new biological insights to support existing hypotheses from various experiments and propose new hypotheses for future research directions.

2. Materials and Methods

2.1. Model Adaptation

Biophysically detailed cell modeling made its debut in 1952 in neuroscience, thanks to the groundbreaking work of Hodgkin and Huxley on the squid giant axon. In the 1960s, Noble pioneered the first models of cardiac cellular activity [46]. Since then, an impressive array of mathematical models for cardiac muscle electrophysiology has emerged. The complexity of these models has steadily increased over the years as more experimental data has become available [47]. Recently, several models in atrial node (AN) and sinoatrial node (SAN) electrophysiology have been mathematically designed to mimic the behavior of cardiac electrical activities [48,49,50,51,52,53,54,55,56]. These models also serve as a bridge between cellular-level models and organ-level function, offering a comprehensive understanding of cardiac electrical activity across different scales. For establishing a single compartmental human AN AP model, we have adapted these models to get all active ion channel components.

2.2. General Membrane Current Descriptions

The schematic diagram of Figure 1 shows all the ionic components in our model. It consists of L-type calcium current (ICaL), T-type calcium current (ICaT), Sodium–calcium exchange current (INaCa), Fast sodium current (INa), Background sodium current (IbNa), Sustained inward current (Ist), ATP-dependent potassium current (IKATP), Ultrarapid component of delayed rectifying potassium current (IKur), Rapid component of delayed rectifying potassium current (IKr), Slow component of delayed rectifying potassium current (IKs), Background potassium current (IbK), Transient outward current (Ito), Hyperpolarizing-activated current (If), Muscarinic potassium current (IKACh), and Sodium-potassium pump current (Ip). The sarcoplasmic reticulum, the internal storage of Ca2+, also consists of several components. Itr is Ca2+ transfer current, Iup is Ca2+ uptake current, and Irel is Ca2+ release current.
The AN cell is electrically defined by a resistor-capacitor (RC) circuit, where the membrane capacitance Cm is parallel with the variable ion channel conductance gion. All active ion channel conductances gion are associated with respective Nernst potential Eion in series. In addition, non-specific ionic currents are incorporated to compensate for any cellular leakage current. Figure 2. Illustrates the schematic overview of the parallel conductance model for ionic current (INa).
The time-dependent characteristics of the AN membrane potential Vm for Figure 1 are described by Equation (1).
d V m ( t ) d t = 1 C m   I C a L + I C a T + I N a C a + I N a + I b N a + I s t +   I l + I K A T P + I K u r + I K r + I K s + I b K + I t o + I f + I K A C h + I p
Then, the individual ionic current is calculated by conventual Ohm’s law. It is described in Equation (2).
I i o n = g ¯ [ m ( V m , t , C a 2 + i ) ] x [ h ( V m , t , C a 2 + i ) ] y ( V m E N e r n s t )
where g ¯ and ENerrnst is the maximum channel conductance and Nernst potential of the respective ion channel.
The parameters m and h in Equation (2) are time/voltage/ Ca2+ dependent dimensionless activation and inactivation gating variables respectively. For equation fitting purposes, another set of dimensionless parameters ‘x’ and ‘y’ are used. The m and h are computed by a set of first-order differential equations according to the classical Hodgkin-Huxley (HH) formulation mechanism [57]. For example, Equation (3) computes the instantaneous value of the activation variable “m” in our AN cell model.
d m ( V m ,   t ) d t = m   ( V m ) m ( V m , t ) τ m
where m, is the steady-state value, and τm, is the time constant, all being functions of voltage and/or ionic concentrations.
Here the state parameter dependence on Vm for ion channels is described by the Boltzmann equation.
m = 1 1 + e x p ( ( V m + V m 1   2 ) / S m )
where V1/2 is the half activation potential and S is the slope factor.
Table 1 consists of the general constant parameters used in this computational model

2.3. Na Channel with Blood Glucose Sensing Mechanism

I N a = g N a ¯   n 3 h ( V E N a )
n = 1 1 + exp V + 9 8
h = 1 1 + exp V + 30 13
The blood glucose sensing mechanism is mimicked by altering the maximum channel conductance ( g N a ¯ ) value of the sodium ion channel according to the experimental data [34]. Observations were made of changes in the AP, total inward, and sodium ion channel current.
Simulations were conducted using a consistent time step of 0.04 ms via the Euler Method on a PC equipped with an Intel Core i7 CPU operating at 3.80 GHz and a dual-core setup. The NEURON simulation environment was employed for model creation, known for its accurate representation of excitable cells [58]. The Euler method is a primary numerical approach for solving ODEs. NEURON offers stability and adaptability in simulations of neuronal dynamics, making it suitable for ODE solutions due to its straightforwardness [58]. While NEURON primarily adopts implicit integration techniques like backward Euler and a version of Crank-Nicolson for stability, it also accommodates Euler's method due to its efficiency and minimal memory footprint [58]. Post-modeling, stability, and consistency were assessed by varying the maximum conductance (gmax) of ionic conductances within +/− 30% of the default. Results showed stable action potentials, with expected responses to changes in conductance, such as increased gmax resulting in higher AP peak amplitudes, while maintaining the AP's normal characteristics. The model code will be available in GitHub and the repository (https://modeldb.science, accessed on 15/04/2024) for free code sharing.

3. Results

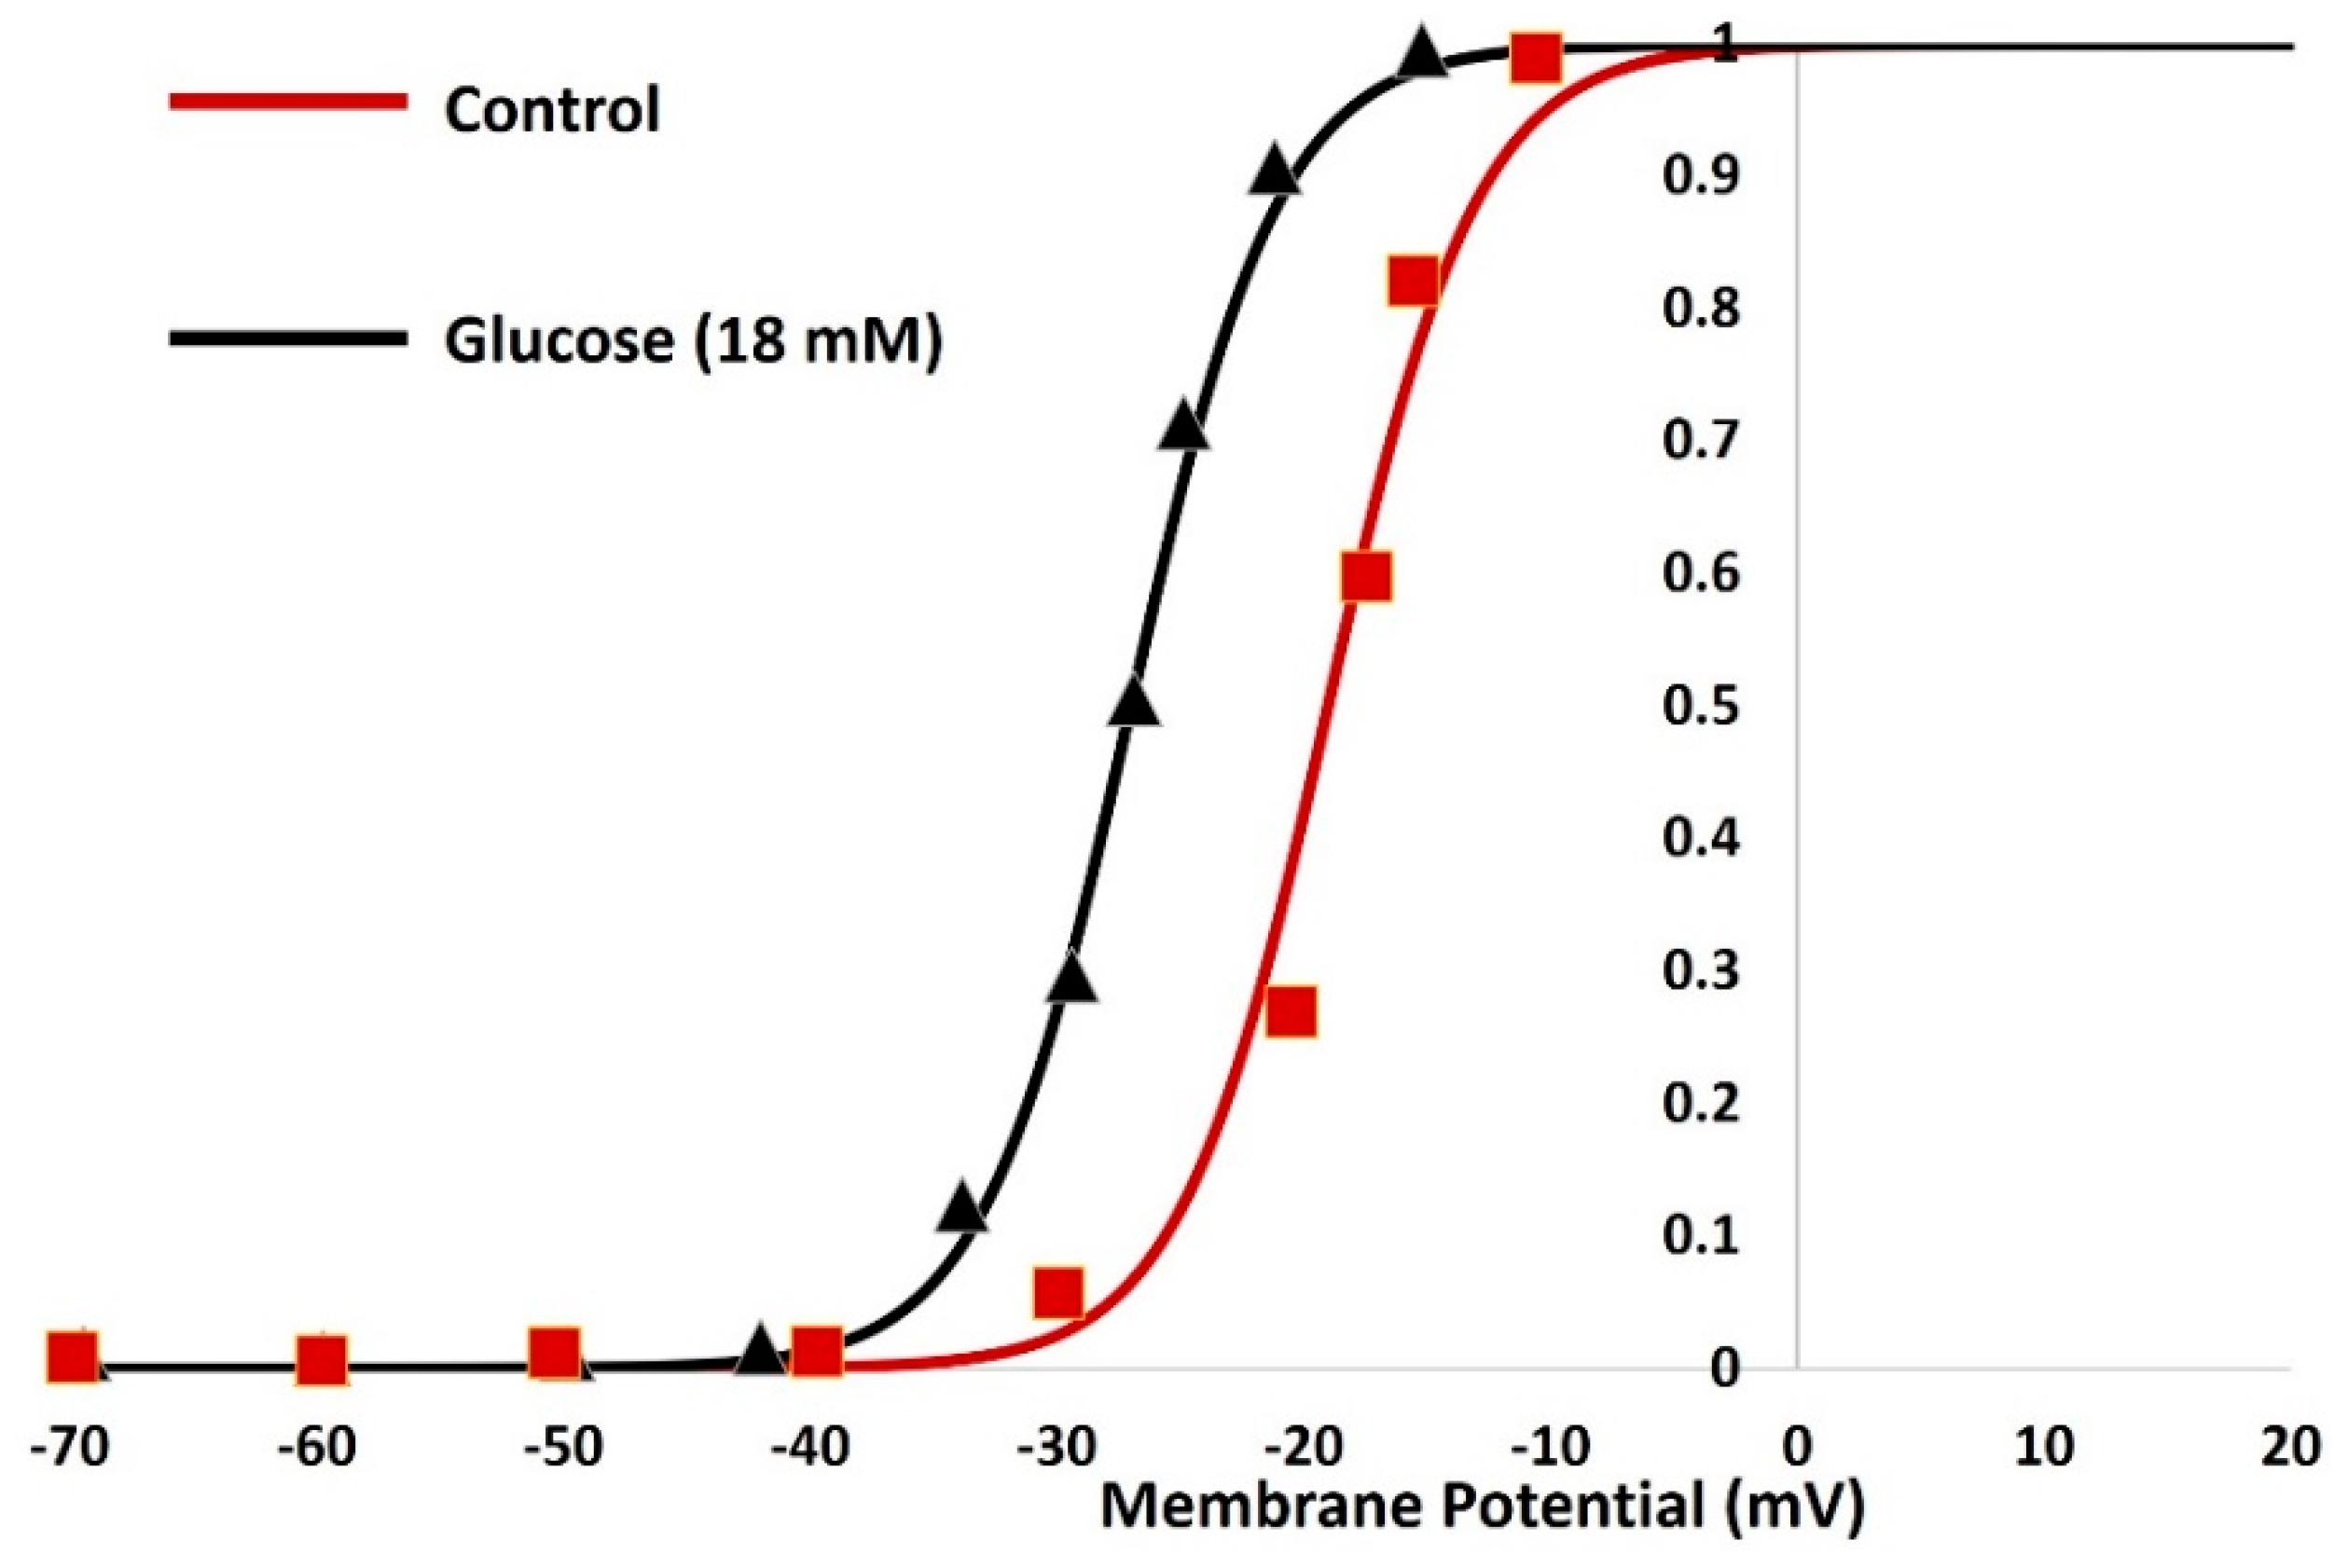
The internal kinetics, current-voltage curve, and currents under the voltage-clamp protocol are generated for the voltage-gated sodium channel currents (INav) under both control and application of glucose 18 mM) conditions. The INav is formulated according to the Equations (5), (6), and (7). The HH formalism consists of both activation and inactivation parameters. Figure 3 displays the simulated and validated curves for the steady-state activation current of INav. The red solid line represents the simulated curve from our model under control conditions, while the black solid line depicts the curve with 18 mM glucose application. The filled red squares and black triangles represent the combined experimental data sourced from Chen 2018 [34]. It also supports that our simulated curve has good matching with the experimental data.
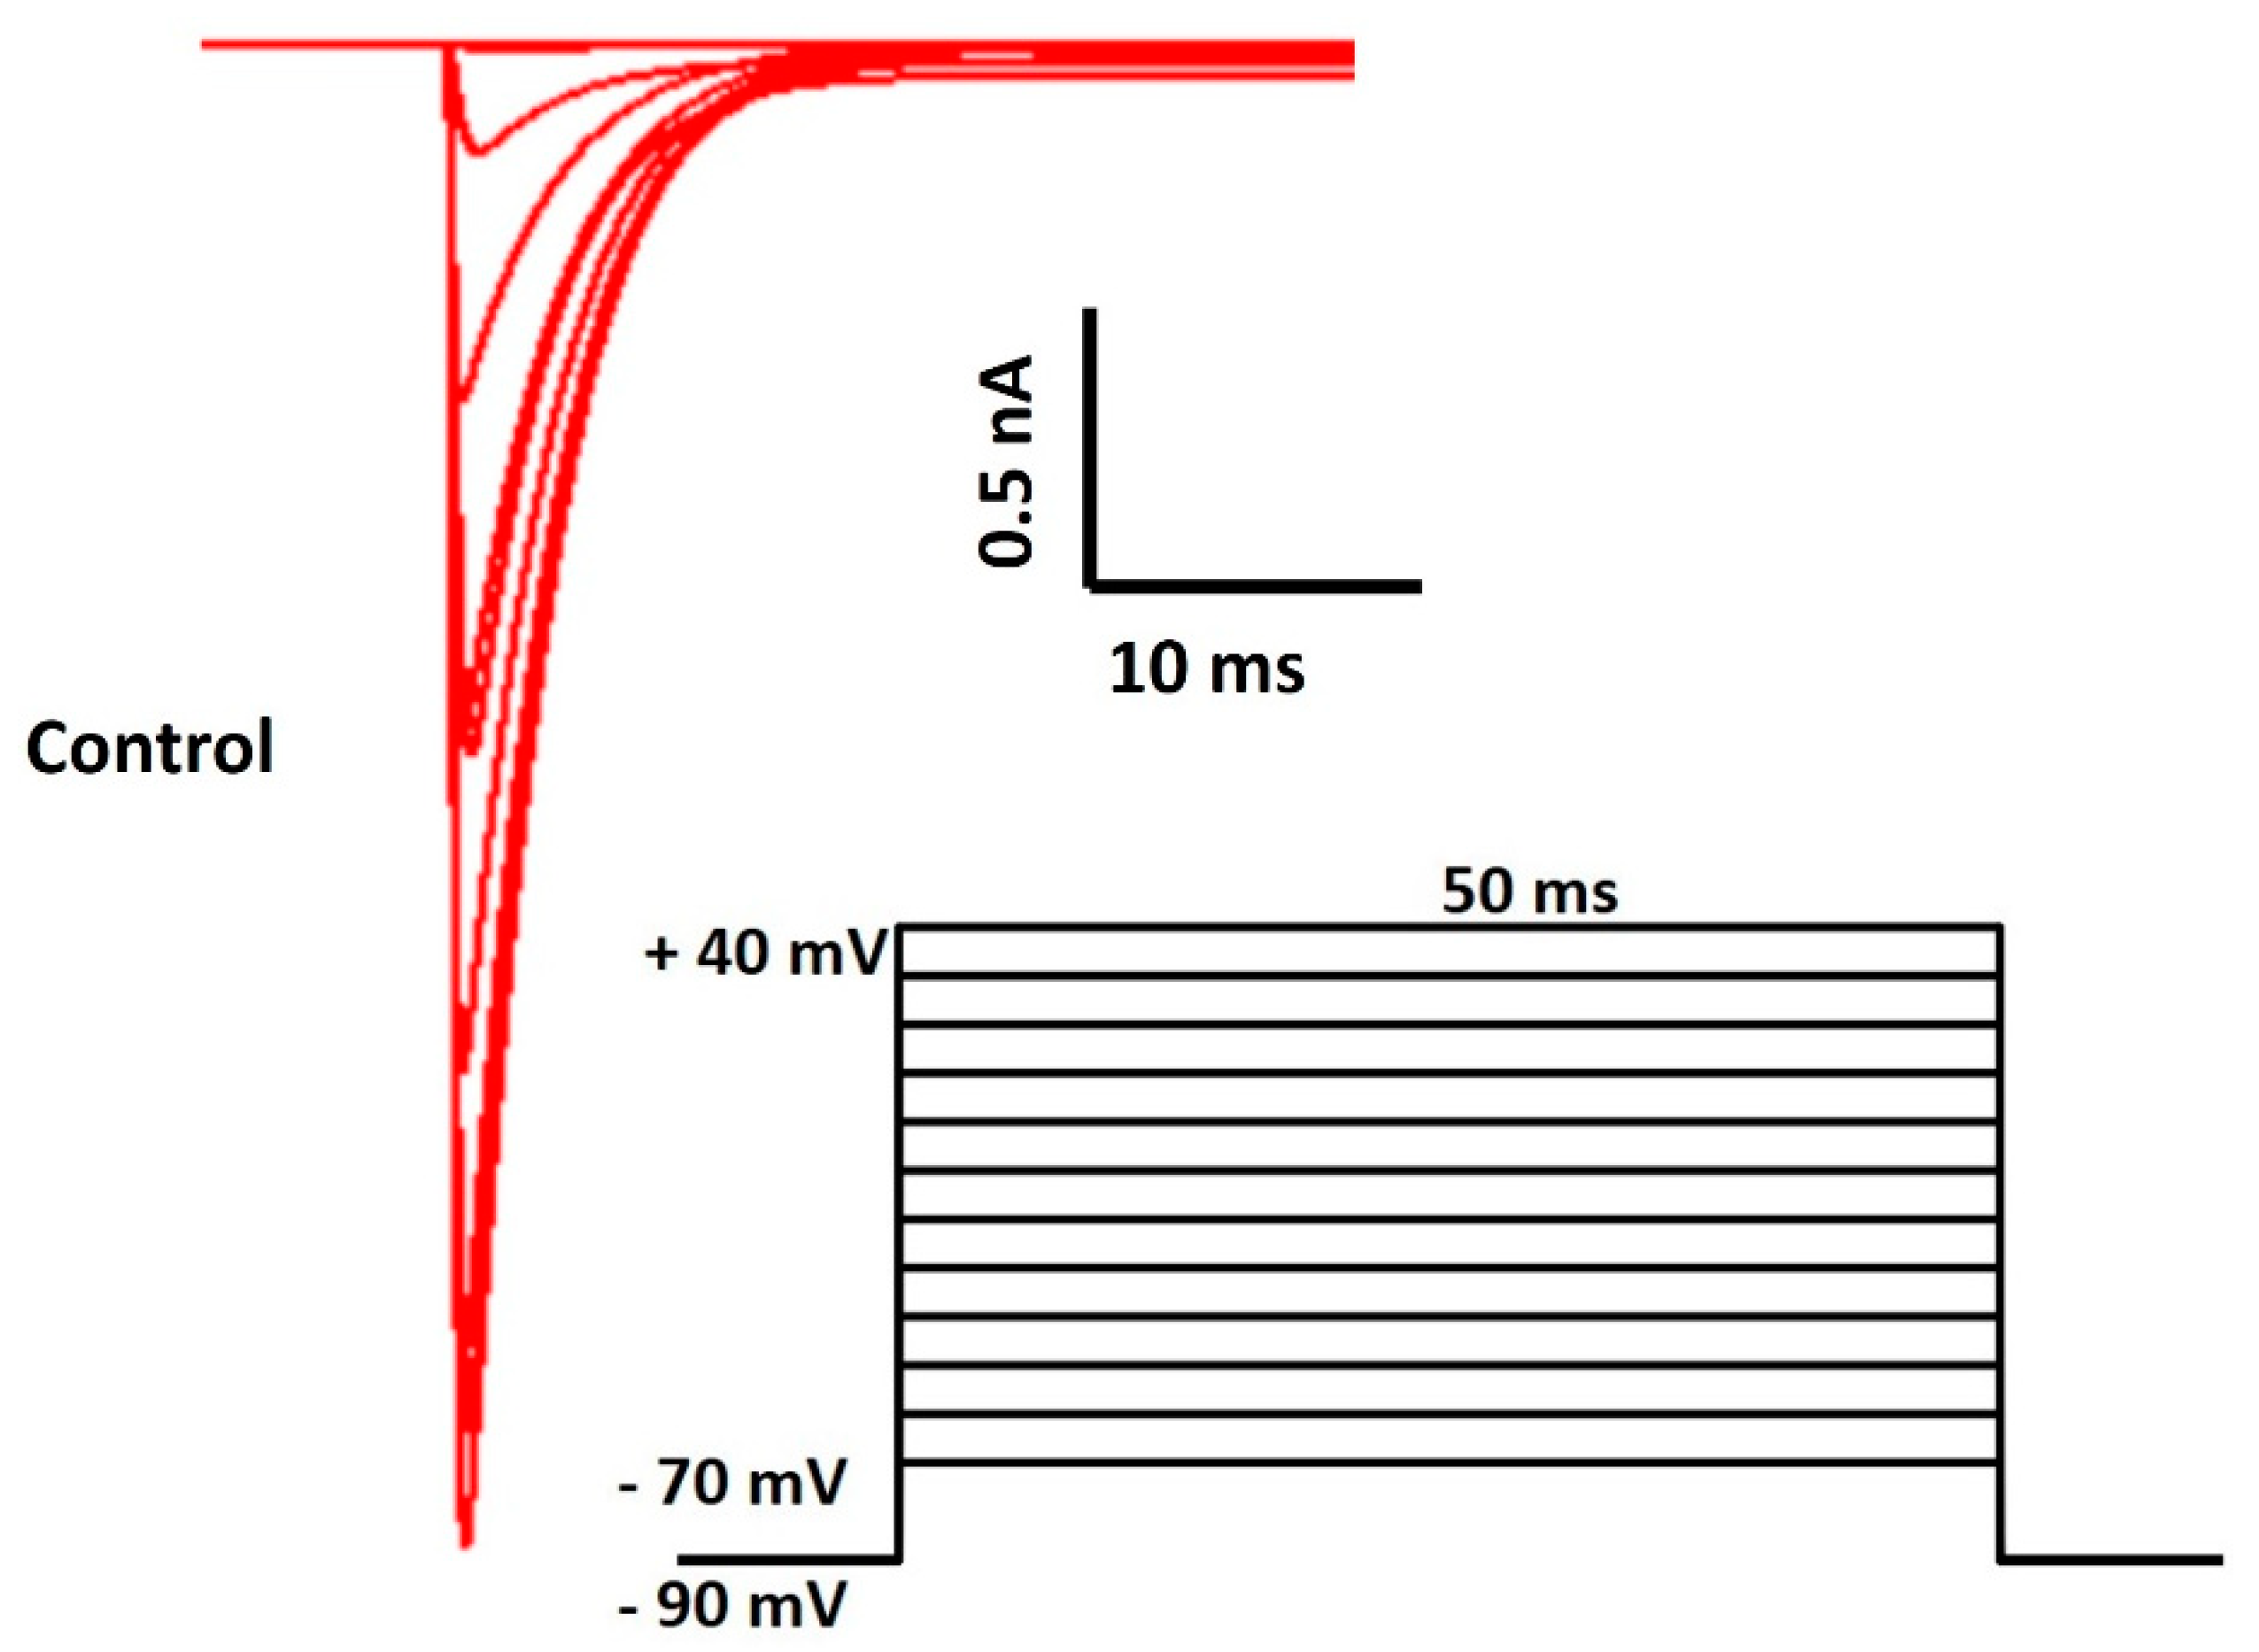
Next, we simulated the INav both for 50 ms under the voltage clamp protocol. The holding potential was held at −90 mV and the membrane potential increased with 10 mV step voltage from −70 mV to 40 mV. Figure 4 illustrates the INav under the voltage clamp protocol.
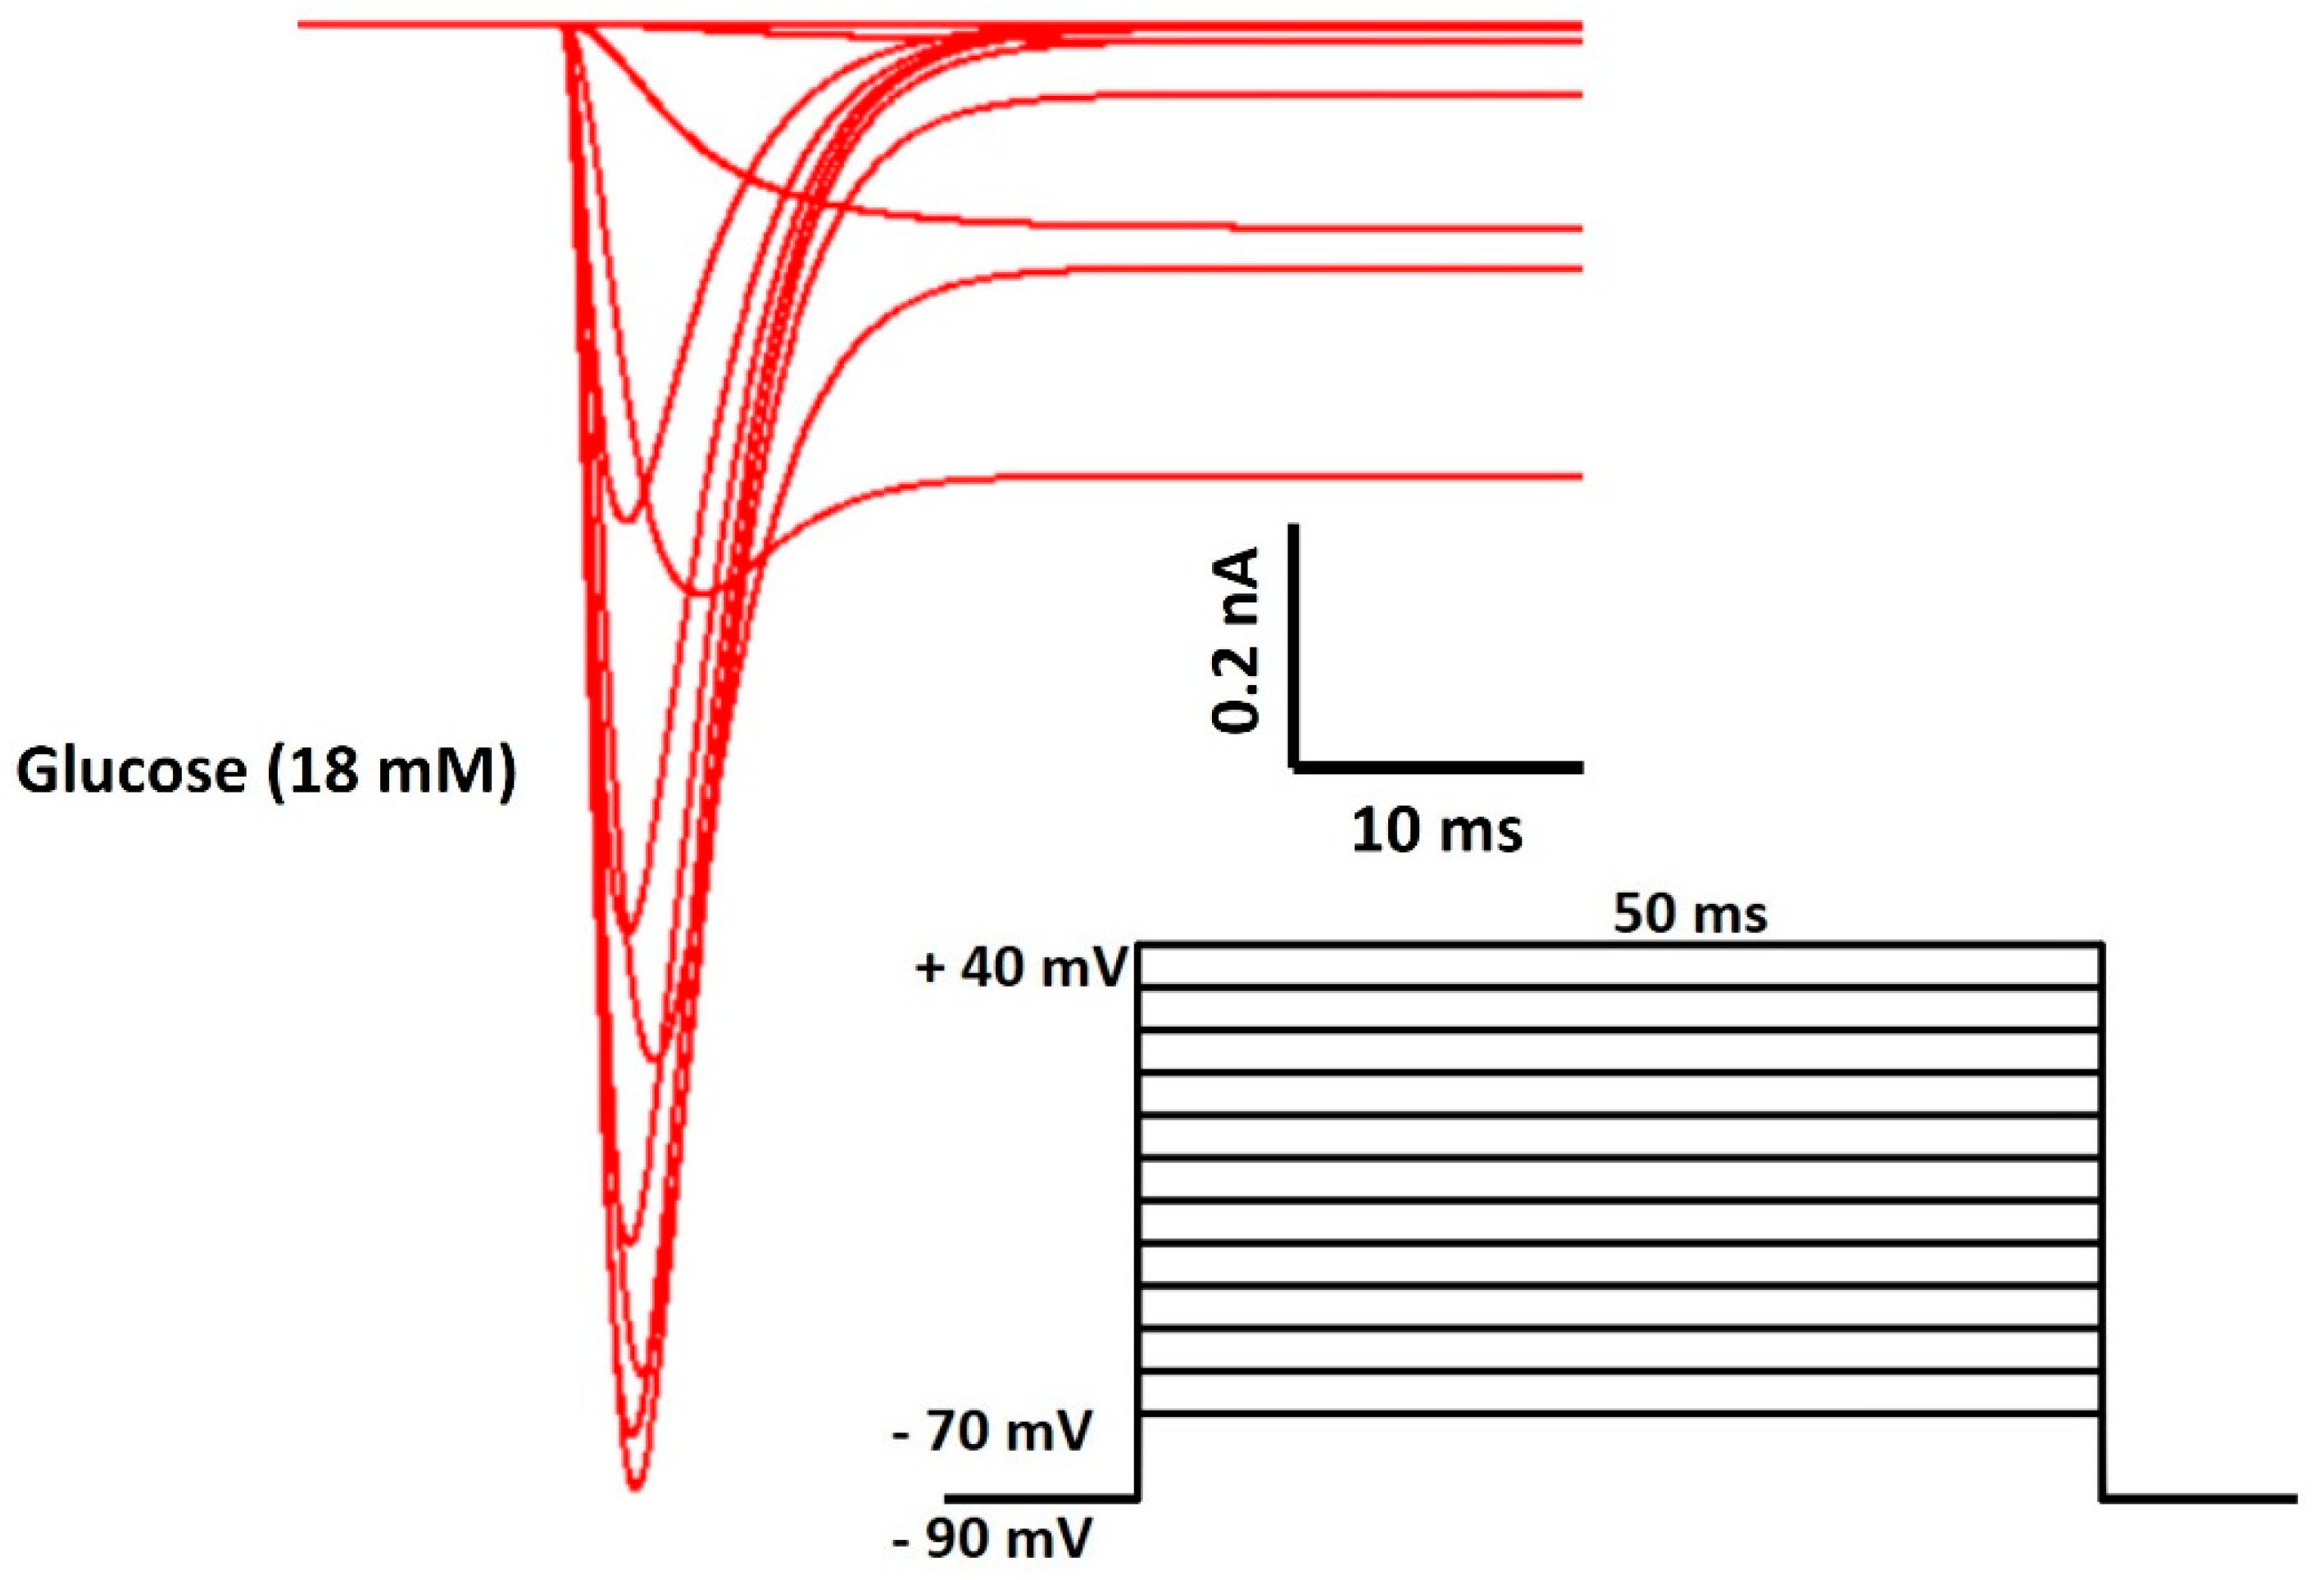
Then, the INav was generated again under the same voltage clamp protocol with the application of 18 mM glucose. The simulated current is shown in Figure 5. When we compare the current amplitude (Y-axis) in Figure 4 and Figure 5, it is clearly illustrated that the glucose concentration is reducing the INav significantly.
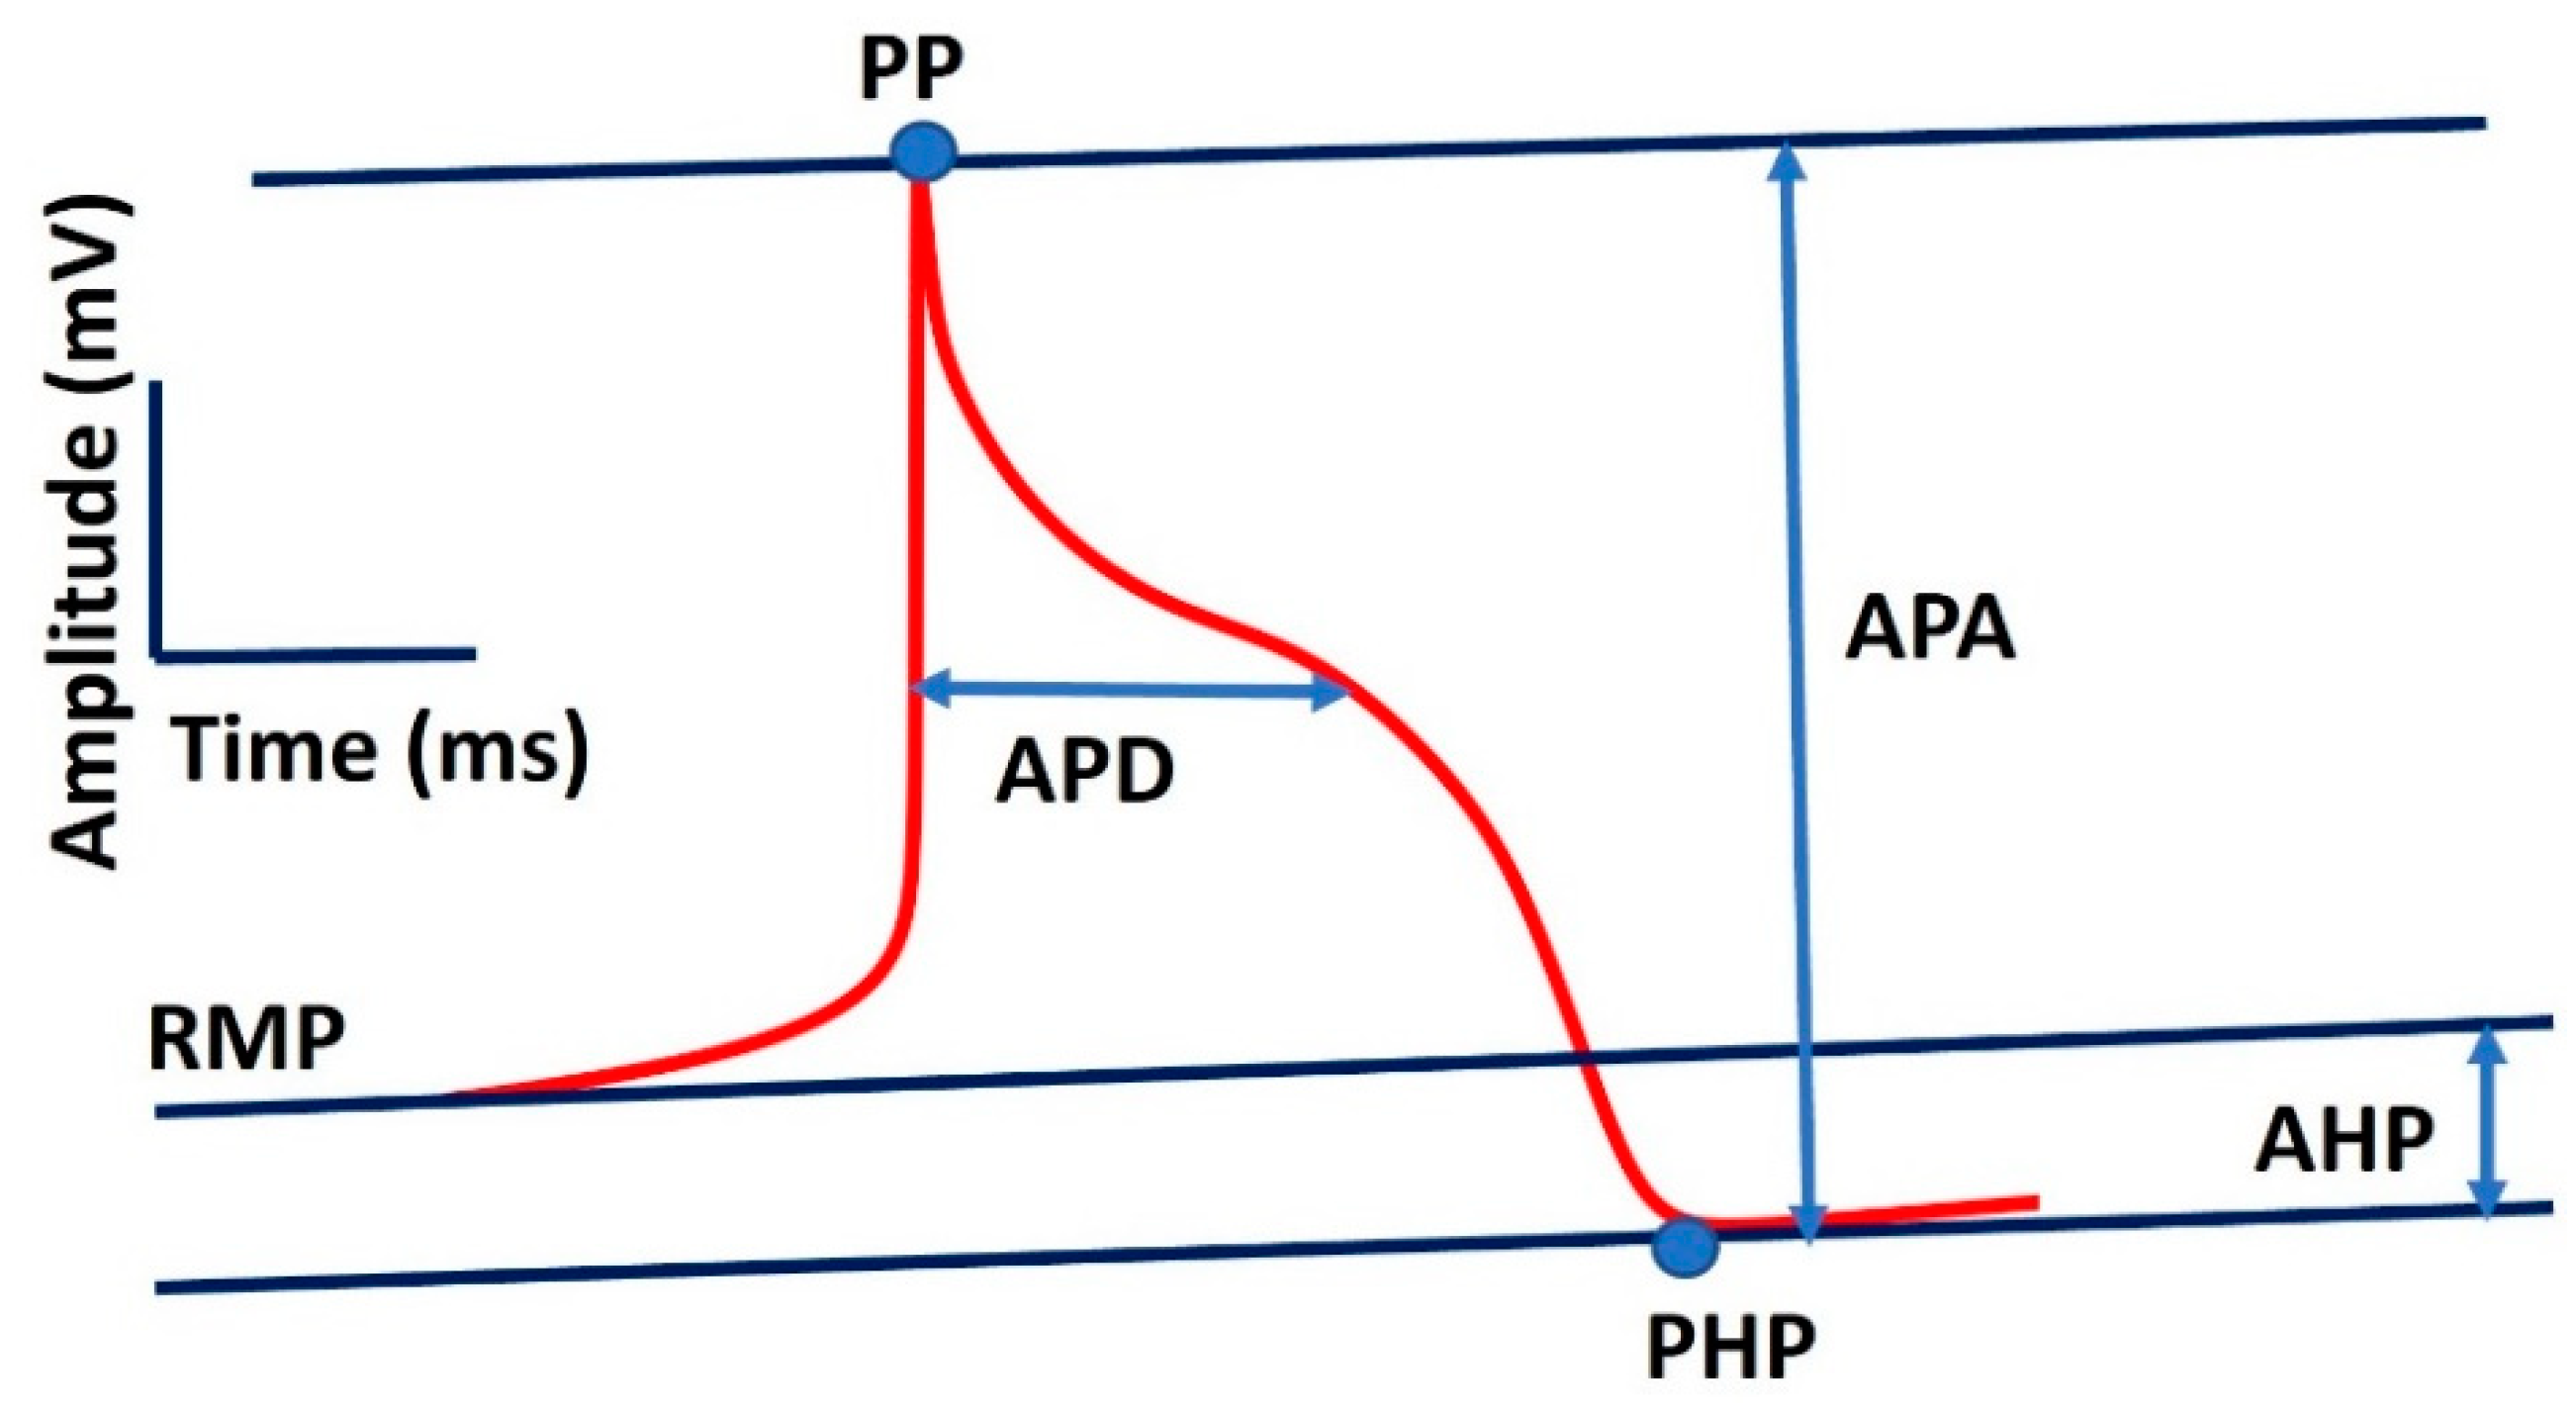
The model of INav is incorporated into a whole cell single compartmental AN model to simulate the Aps under both control and glucose application. We characterized the atrial AP waveform using a set of parameters, and we calculated them based on the guidelines for the standardization of AP parameters. The following parameters were calculated: CL—cycle length of the pacemaker activity, defined as the duration between the peaks of two consecutive APs; PP—peak action potential, peak (maximum value) of the AP; APA—AP amplitude, defined as the difference between the maximum and minimum AP potentials; MDP—maximum diastolic potential preceding the PP, defined as the most negative repolarization potential; DDR—diastolic depolarization rate; DDR100—diastolic depolarization rate over the first 100 ms of diastolic depolarization; APD90—AP duration at 90% repolarization (Figure 6). RMP—Resting membrane potential; PP—peak potential; APA—AP amplitude; APD—AP duration; PHP—peak hyperpolarization; AHP—after hyperpolarization.
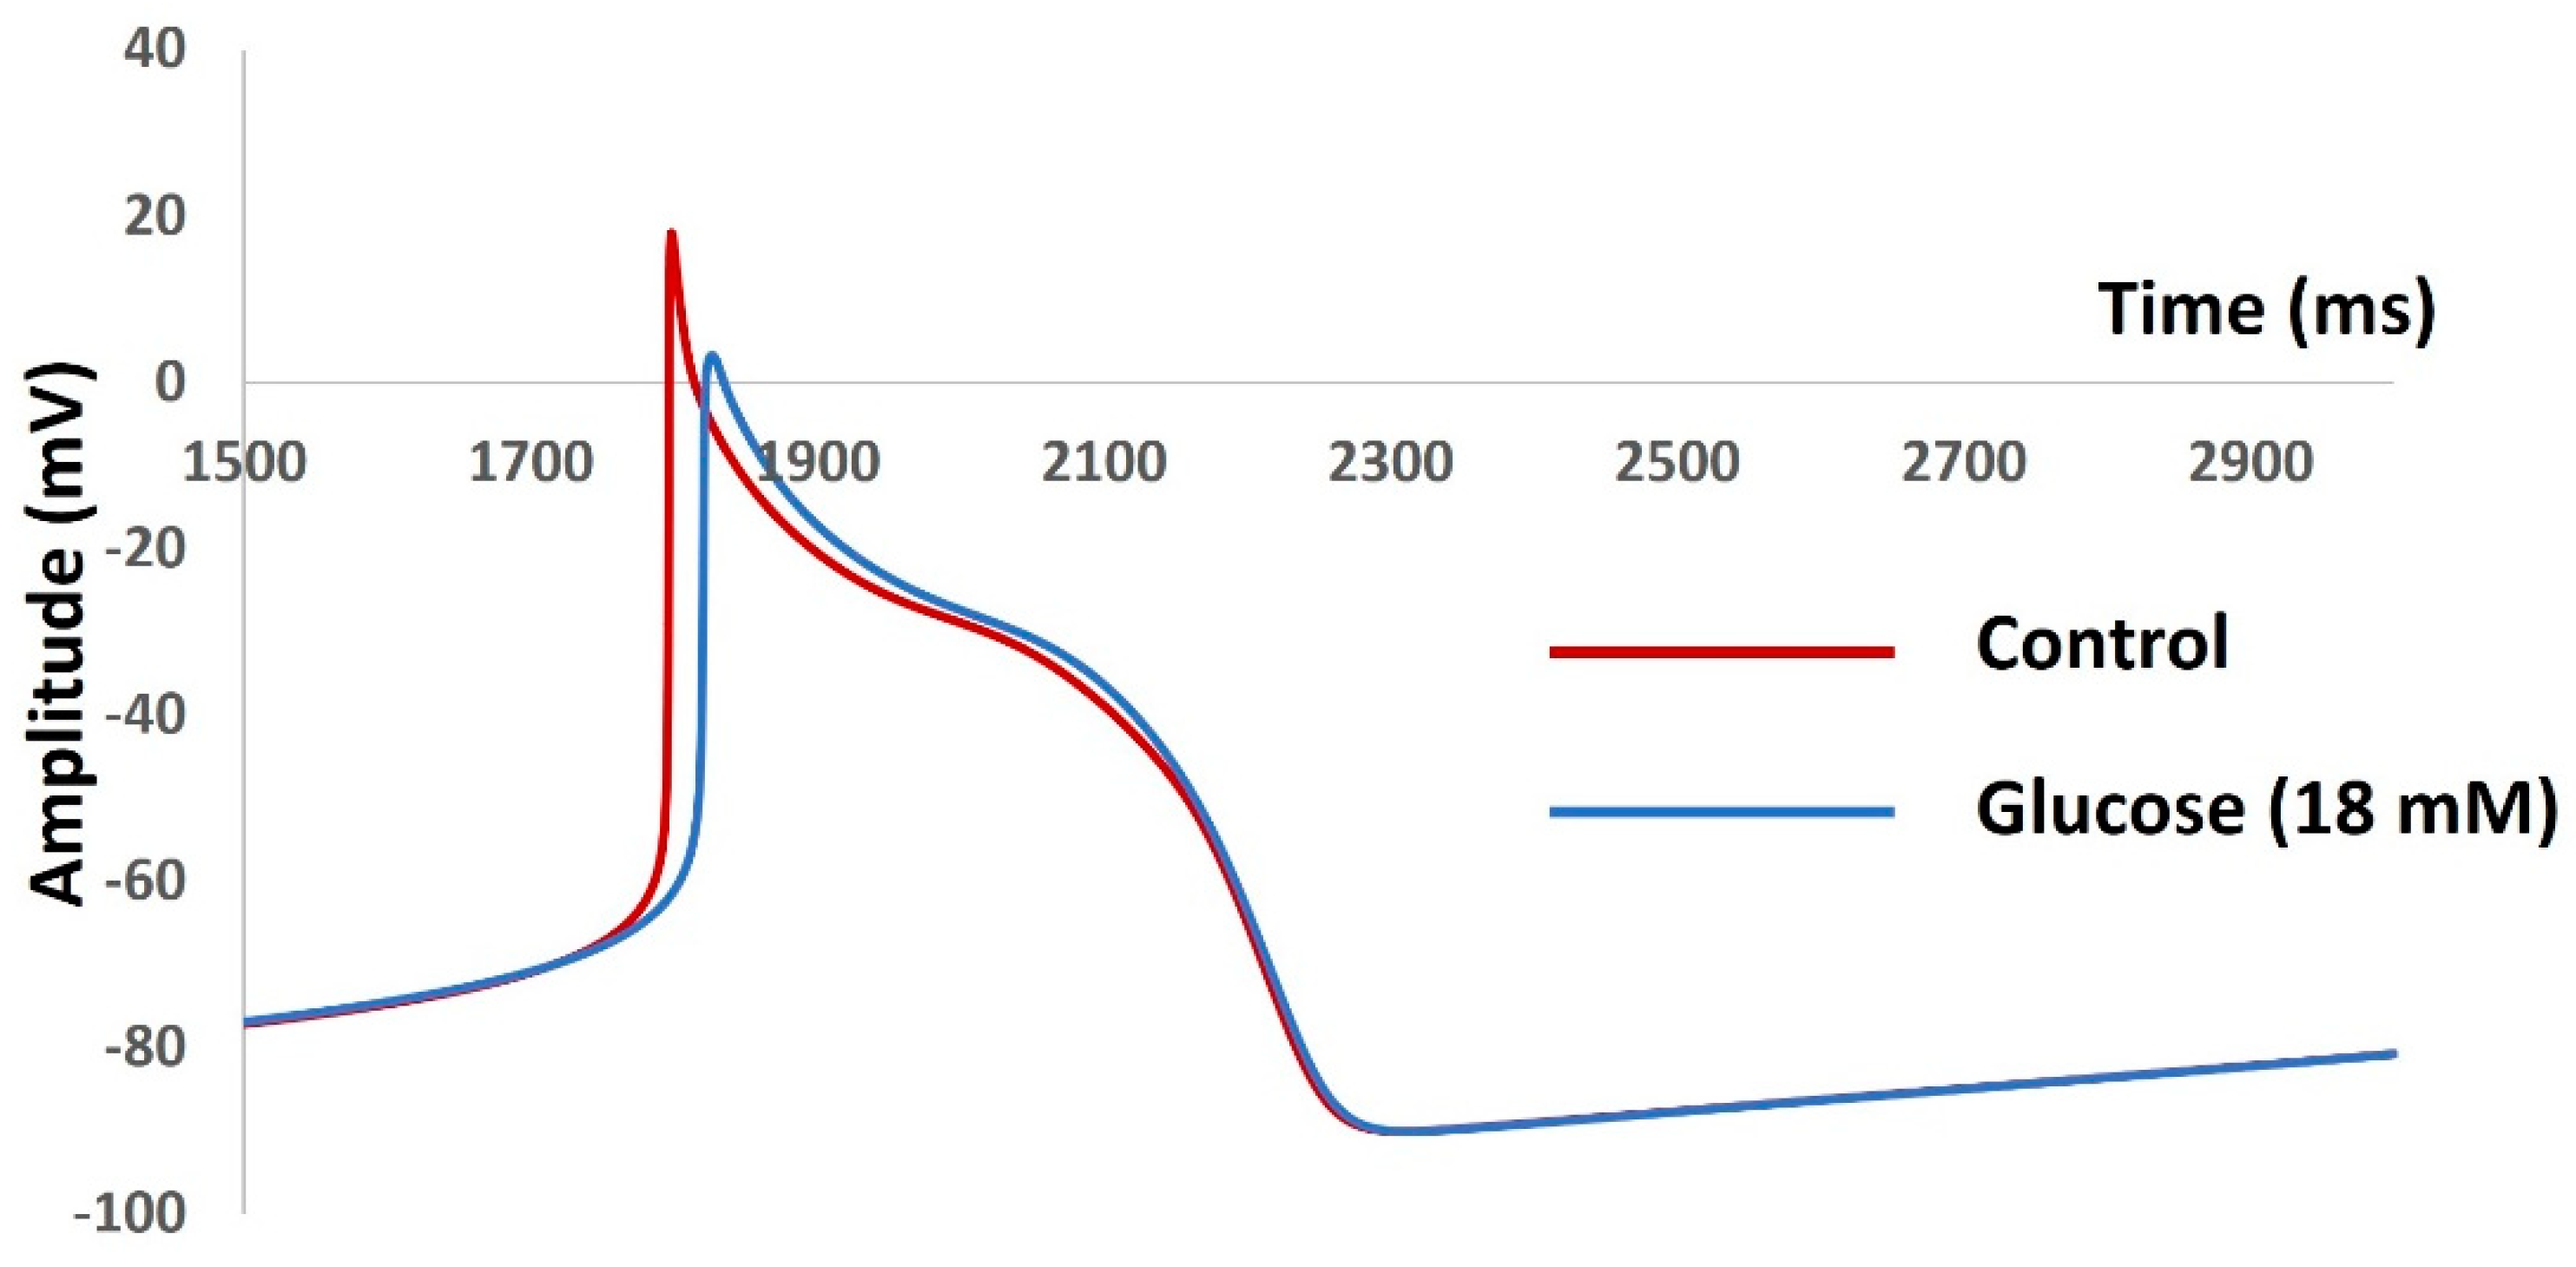
We ran the simulations to simulate AN model APs under both control and 18 mM glucose concentration. It is shown in Figure 7.
We then compared all important parameters for both APs and listed in Table 2. We explored the changes induced by hyperglycemia and the main features of AP responsible for these changes.

4. Discussion

The human heart is the most delicate organ of the body and cardiac arrest is a common fatal crisis across the globe. Similarly, a large portion of the population in the world is affected by type 2 diabetes due to unhealthy diet. High blood glucose concentration can damage all major organs of the body including the heart, kidneys, eyes, and brain. Glucose sensing mechanism As cardiac arrest leads to death immediately, protecting the heart from the negative impact of high glucose concentration is the highest priority. Balancing the basal level of the blood glucose level with optimal insulin therapy is an invasive discomfort process. Therefore, researchers are investigating all kinds of alternative medication approaches to protect the heart. A plethora of experimental evidence has demonstrated the possible linking mechanism between the blood glucose concentration and the abnormal pacemaker rhythms of the cardiac tissue. The voltage-gated sodium channels play a crucial role in regulating hearts’ pace-making activities by modulating the AP shapes. The biophysical properties of these ion channels are altered due to high blood glucose concentrations in pancreatic beta cells. Therefore, voltage-gated sodium channels might be suitable candidates for a new therapy approach. Experimental studies are always complex and need a longer time to investigate any new biological process. To overcome these limitations, computational modeling approaches are substantially useful for expanding our knowledge in fundamental biological research. In this in silico study, we, therefore, established a computational model of the glucose sensing mechanisms in the human AN cell electrophysiology. First, the biophysically detailed voltage-gated sodium ion channel is built and the ionic currents are simulated under the voltage clamp protocol. The simulation showed reduced current patterns for the high blood glucose concentration. Second, we integrated the sodium ion channel mechanism into a single compartmental AN cell model, which was rebuilt from the published models. Under the current clamp protocols, we simulated the AN AP under both control and high blood glucose concentration conditions. The simulation showed the changes in the AP shapes for RMP, APP, and APD. It supports the less excitability property of the AN Cell. That means the less numbers of AP are evoked for a current stimulus with a fixed duration. It will lead to bradycardia which is a reduced frequency of the pace-making activity. In the introduction part, we have discussed how bradycardia causes SCA. From this simulation results, we can conclude that the agonists of the voltage-gated sodium ion channel of a specific subtype might be useful to compensate for the high glucose concentration effects. An elaborate experimental study can support this hypothesis. One major limitation of this computational study is that we have not considered the effects of glucose upon other ion channels due to a lack of experimental data. Another limitation is the simulation of the single compartmental biophysical AN model. The electrical properties of the multi-cellular network model will be different from the single-cell model. However, this present model is flexible to integrate other ion channels and extend for a multi-compartmental network model by adding experimental data in the future.

Author Contributions

Conceptualization, C.M; methodology, C.M. and K.S.; software, C.M. and K.S.; validation, C.M.and K.S.; formal analysis, C.M. and K.S.; investigation, C.M. and K.S.; resources, C.M. and K.S.; data curation, C.M. and K.S.; writing—original draft preparation, C.M.; writing—review and editing, C.M. and K.S.; visualization, C.M. and K.S.; project administration, C.M. and K.S.; funding acquisition, K.S. All authors have read and agreed to the published version of the manuscript.

Funding

This research received no external funding.

Data Availability Statement

Data available within the manuscript.

Acknowledgments

The authors would like to thank the reviewers for their fruitful comments and suggestions for improving the manuscript.

Conflicts of Interest

The authors declare no conflicts of interest.

References

  1. Tsao, C.W.; Aday, A.W.; Almarzooq, Z.I.; Anderson, C.A.; Arora, P.; Avery, C.L.; Baker-Smith, C.M.; Beaton, A.Z.; Boehme, A.K.; Buxton, A.E.; et al. Heart Disease and Stroke Statistics—2023 Update: A Report From the American Heart Association. Circulation 2023, 147, E93–E621. [Google Scholar] [CrossRef] [PubMed]
  2. Roth, G.A.; Mensah, G.A.; Johnson, C.O.; Addolorato, G.; Ammirati, E.; Baddour, L.M.; Barengo, N.C.; et al. Global burden of cardiovascular diseases and risk factors, 1990–2019: Update from the GBD 2019 study. Journal of the American college of cardiology 2020, 76, 2982–3021. [Google Scholar] [CrossRef] [PubMed]
  3. Lambert, C.; Vinson, S.; Shofer, F.; Brice, J. The Relationship between Knowledge and Risk for Heart Attack and Stroke. J. Stroke Cerebrovasc. Dis. 2013, 22, 996–1001. [Google Scholar] [CrossRef] [PubMed]
  4. Virmani, R.; Burke, A.P.; Farb, A. Sudden cardiac death. Cardiovascular pathology 2001, 10, 211–218. [Google Scholar] [CrossRef] [PubMed]
  5. Israel, C.W. Mechanisms of sudden cardiac death. Indian heart journal 2014, 66, S10–S17. [Google Scholar] [CrossRef] [PubMed]
  6. Wong, M.C.; Kalman, J.M.; Pedagogos, E.; Toussaint, N.; Vohra, J.K.; Sparks, P.B.; Sanders, P.; Kistler, P.M.; Halloran, K.; Lee, G.; et al. Bradycardia and Asystole Is the Predominant Mechanism of Sudden Cardiac Death in Patients With Chronic Kidney Disease. Circ. 2015, 65, 1263–1265. [Google Scholar] [CrossRef] [PubMed]
  7. Fozzard, H.A. Cardiac muscle: Excitability and passive electrical properties. Prog. Cardiovasc. Dis. 1977, 19, 343–359. [Google Scholar] [CrossRef] [PubMed]
  8. Reilly, J.P.; Antoni, H. Electrical properties of the heart. Applied Bioelectricity: From Electrical Stimulation to Electropathology, 1998; 148–193. [Google Scholar] [CrossRef]
  9. Varro, A.; Tomek, J.; Nagy, N.; Virag, L.; Passini, E.; Rodriguez, B.; Baczko, I. Cardiac transmembrane ion channels and action potentials: Cellular physiology and arrhythmogenic behavior. Physiol. Rev. 2021, 101, 1083–1176. [Google Scholar] [CrossRef] [PubMed]
  10. Bers, D.M.; Bers, D.M. Cardiac action potential and ion channels. Excitation-Contraction Coupling and Cardiac Contractile Force, 2001; 63–100. [Google Scholar] [CrossRef]
  11. Alberts, B.; Johnson, A.; Lewis, J.; Raff, M.; Roberts, K.; Walter, P. Ion channels and the electrical properties of membranes. In Molecular Biology of the Cell, 4th edition. Garland Science, 2002.
  12. Kass, R.S. Ionic basis of electrical activity in the heart. In Physiology and Pathophysiology of the Heart; Springer: Boston, MA, 1989; pp. 81–93. [Google Scholar]
  13. Johnson, E.A.; Lieberman, M. Heart: Excitation and Contraction. Annu. Rev. Physiol. 1971, 33, 479–530. [Google Scholar] [CrossRef]
  14. Santana, L.F.; Cheng, E.P.; Lederer, W.J. How does the shape of the cardiac action potential control calcium signaling and contraction in the heart? J. Mol. Cell. Cardiol. 2010, 49, 901–903. [Google Scholar] [CrossRef]
  15. Grant, A.O. Cardiac ion channels. Circulation: Arrhythmia and Electrophysiology 2009, 2, 185–194. [Google Scholar] [CrossRef] [PubMed]
  16. Bartos, D.C.; Grandi, E.; Ripplinger, C.M. Ion channels in the heart. Comprehensive Physiology 2015, 5, 1423. [Google Scholar] [PubMed]
  17. Morad, M.; Tung, L. Ionic events responsible for the cardiac resting and action potential. Am. J. Cardiol. 1982, 49, 584–594. [Google Scholar] [CrossRef] [PubMed]
  18. Senges, J.; Brachmann, J.; Pelzer, D.; Krämer, B.; Kübler, W. . Combined effects of glucose and hypoxia on cardiac automaticity and conduction. Journal of Molecular and Cellular Cardiology 1980, 12, 311–323. [Google Scholar] [CrossRef] [PubMed]
  19. Jouven, X.; Lemaître, R.N.; Rea, T.D.; Sotoodehnia, N.; Empana, J.P.; Siscovick, D.S. . Diabetes, glucose level, and risk of sudden cardiac death. European heart journal 2005, 26, 2142–2147. [Google Scholar] [CrossRef] [PubMed]
  20. Singh, K.B.; Nnadozie, M.C.; Abdal, M.; Shrestha, N.; Abe, R.A.M.; Masroor, A.; Khorochkov, A.; Prieto, J.; Mohammed, L. Type 2 Diabetes and Causes of Sudden Cardiac Death: A Systematic Review. Cureus 2021, 13. [Google Scholar] [CrossRef] [PubMed]
  21. Poznyak, A.V.; Litvinova, L.; Poggio, P.; Sukhorukov, V.N.; Orekhov, A.N. Effect of Glucose Levels on Cardiovascular Risk. Cells 2022, 11, 3034. [Google Scholar] [CrossRef] [PubMed]
  22. Tenenbaum, A.; Fisman, E.Z. Impaired Glucose Metabolism in Patients with Heart Failure. Am. J. Cardiovasc. Drugs 2004, 4, 269–280. [Google Scholar] [CrossRef] [PubMed]
  23. Gallego, M.; Zayas-Arrabal, J.; Alquiza, A.; Apellaniz, B.; Casis, O. Electrical Features of the Diabetic Myocardium. Arrhythmic and Cardiovascular Safety Considerations in Diabetes. Front. Pharmacol. 2021, 12. [Google Scholar] [CrossRef]
  24. Grisanti, L.A. Diabetes and arrhythmias: Pathophysiology, mechanisms and therapeutic outcomes. Frontiers in physiology 2018, 9, 409132. [Google Scholar] [CrossRef]
  25. Riise, H.K.R.; Igland, J.; Sulo, G.; Graue, M.; Haltbakk, J.; Tell, G.S.; Iversen, M.M. Casual blood glucose and subsequent cardiovascular disease and all-cause mortality among 159 731 participants in Cohort of Norway (CONOR). BMJ Open Diabetes Res. Care 2021, 9, e001928. [Google Scholar] [CrossRef] [PubMed]
  26. Fu, L.; Deng, H.; Lin, W.-D.; He, S.-F.; Liu, F.-Z.; Liu, Y.; Zhan, X.-Z.; Fang, X.-H.; Liao, H.-T.; Wei, W.; et al. Association between elevated blood glucose level and non-valvular atrial fibrillation: A report from the Guangzhou heart study. BMC Cardiovasc. Disord. 2019, 19, 1–8. [Google Scholar] [CrossRef]
  27. Siscovick, D.S.; Sotoodehnia, N.; Rea, T.D.; Raghunathan, T.E.; Jouven, X.; Lemaitre, R.N. Type 2 diabetes mellitus and the risk of sudden cardiac arrest in the community. Rev. Endocr. Metab. Disord. 2010, 11, 53–59. [Google Scholar] [CrossRef] [PubMed]
  28. Rajan, A.S.; Aguilar-Bryan, L.; Nelson, D.A.; Yaney, G.C.; Hsu, W.H.; Kunze, D.L.; Boyd, A.E. Ion Channels and Insulin Secretion. Diabetes Care 1990, 13, 340–363. [Google Scholar] [CrossRef]
  29. Boyd, A.E. The role of ion channels in insulin secretion. J. Cell. Biochem. 1992, 48, 234–241. [Google Scholar] [CrossRef]
  30. Ozturk, N.; Uslu, S.; Ozdemir, S. Diabetes-induced changes in cardiac voltage-gated ion channels. World J. Diabetes 2021, 12, 1–18. [Google Scholar] [CrossRef]
  31. Thompson, M.J.; Baenziger, J.E. Ion channels as lipid sensors: From structures to mechanisms. Nat. Chem. Biol. 2020, 16, 1331–1342. [Google Scholar] [CrossRef]
  32. Zaydman, M.A.; Silva, J.R.; Cui, J. Ion Channel Associated Diseases: Overview of Molecular Mechanisms. Chem. Rev. 2012, 112, 6319–6333. [Google Scholar] [CrossRef]
  33. Remme, C.A.; Bezzina, C.R. REVIEW: Sodium Channel (Dys)Function and Cardiac Arrhythmias. Cardiovasc. Ther. 2010, 28, 287–294. [Google Scholar] [CrossRef] [PubMed]
  34. Chen, C.; Wang, S.; Hu, Q.; Zeng, L.; Peng, H.; Liu, C.; Huang, L.-P.; Song, H.; Li, Y.; Yao, L.-H.; et al. Voltage-Gated Na+ Channels are Modulated by Glucose and Involved in Regulating Cellular Insulin Content of INS-1 Cells. Cell. Physiol. Biochem. 2018, 45, 446–457. [Google Scholar] [CrossRef] [PubMed]
  35. Bartocci, E.; Pietro, L. Computational modeling, formal analysis, and tools for systems biology. PLoS computational biology 2016, 12, e1004591. [Google Scholar] [CrossRef]
  36. Brodland, G.W. How computational models can help unlock biological systems. Semin. Cell Dev. Biol. 2015, 47-48, 62–73. [Google Scholar] [CrossRef]
  37. Mahapatra, C.; Samuilik, I. A Mathematical Model of Spontaneous Action Potential Based on Stochastics Synaptic Noise Dynamics in Non-Neural Cells. Mathematics 2024, 12, 1149. [Google Scholar] [CrossRef]
  38. Mahapatra, C.; Kaur, A. Abstract 2221 In silico electrophysiological study reveals Ibrutinib, an important therapeutic agent for B-Cell lymphoma causes cardiac toxicity by inhibiting sodium current. J. Biol. Chem. 2024, 300. [Google Scholar] [CrossRef]
  39. Mahapatra, C.; Brain, K.; Manchanda, R. Biophysically Realistic Models of Detrusor Ion Channels: Role in shaping spike and excitability. In Urinary Bladder Physiology: Computational Insights; Publ Narosa Publishing House, 2024.
  40. Mahapatra, C.; Brain, K.L.; Manchanda, R. A biophysically constrained computational model of the action potential of mouse urinary bladder smooth muscle. PLoS ONE 2018, 13, e0200712. [Google Scholar] [CrossRef]
  41. Amanfu, R.K.; Saucerman, J.J. Cardiac Models in Drug Discovery and Development: A Review. Crit. Rev.™ Biomed. Eng. 2011, 39, 379–395. [Google Scholar] [CrossRef]
  42. McCulloch, A.D. Systems Biophysics: Multiscale Biophysical Modeling of Organ Systems. Biophys. J. 2016, 110, 1023–1027. [Google Scholar] [CrossRef]
  43. Mayourian, J.; Sobie, E.A.; Costa, K.D. . In Experimental Models of Cardiovascular Diseases; Humana Press: New York, NY, 2018; pp. 17–35.arrhythmogenicity. In Experimental Models of Cardiovascular Diseases; Humana Press: New York, NY, 2018; pp. 17–35. [Google Scholar]
  44. Puertas-Martin, S.; Banegas-Luna, A.J.; Paredes-Ramos, M.; Redondo, J.L.; Ortigosa, P.M.; Brovarets', O.O.; Perez-Sanchez, H. Is high performance computing a requirement for novel drug discovery and how will this impact academic efforts? Expert Opin. Drug Discov. 2020, 15, 981–985. [Google Scholar] [CrossRef]
  45. Southern, J.; Pitt-Francis, J.; Whiteley, J.; Stokeley, D.; Kobashi, H.; Nobes, R.; Kadooka, Y.; Gavaghan, D. Multi-scale computational modelling in biology and physiology. Prog. Biophys. Mol. Biol. 2007, 96, 60–89. [Google Scholar] [CrossRef] [PubMed]
  46. Noble, D.; Garny, A.; Noble, P.J. How the Hodgkin–Huxley equations inspired the Cardiac Physiome Project. J. Physiol. 2012, 590, 2613–2628. [Google Scholar] [CrossRef] [PubMed]
  47. Amuzescu, B.; Airini, R.; Epureanu, F.B.; Mann, S.A.; Knott, T.; Radu, B.M. Evolution of mathematical models of cardiomyocyte electrophysiology. Math. Biosci. 2021, 334, 108567. [Google Scholar] [CrossRef]
  48. Earm, Y.E.; Noble, D. A model of the single atrial cell: Relation between calcium current and calcium release. Proc. R. Soc. London. Ser. B. Biol. Sci. 1990, 240, 83–96. [Google Scholar] [CrossRef]
  49. Lindblad, D.S.; Murphey, C.R.; Clark, J.J.W.; Giles, W.R.; Muñoz, M.A.; Kaur, J.; Vigmond, E.J.; Fink, M.; Noble, P.J.; Noble, D.; et al. A model of the action potential and underlying membrane currents in a rabbit atrial cell. Am. J. Physiol. Circ. Physiol. 1996, 271, H1666–H1696. [Google Scholar] [CrossRef]
  50. Courtemanche, M.; Ramirez, R.J.; Nattel, S.; Muszkiewicz, A.; Liu, X.; Bueno-Orovio, A.; Lawson, B.A.J.; Burrage, K.; Casadei, B.; Rodriguez, B.; et al. Ionic mechanisms underlying human atrial action potential properties: Insights from a mathematical model. Am. J. Physiol. Circ. Physiol. 1998, 275, H301–H321. [Google Scholar] [CrossRef]
  51. Nygren, A.; Fiset, C.; Firek, L.; Clark, J.W.; Lindblad, D.S.; Clark, R.B.; Giles, W.R. . Mathematical model of an adult human atrial cell: The role of K+ currents in repolarization. Circulation research 1998, 82, 63–81. [Google Scholar] [CrossRef]
  52. Ramirez, R.J.; Nattel, S.; Courtemanche, M. . Mathematical analysis of canine atrial action potentials: Rate, regional factors, and electrical remodeling. American Journal of Physiology-Heart and Circulatory Physiology 2000, 279, H1767–H1785. [Google Scholar] [CrossRef]
  53. Grandi, E.; Pandit, S.V.; Voigt, N.; Workman, A.J.; Dobrev, D.; Jalife, J.; Bers, D.M. . Human atrial action potential and Ca2+ model: Sinus rhythm and chronic atrial fibrillation. Circulation research 2011, 109, 1055–1066. [Google Scholar] [CrossRef]
  54. Davies, M.R.; Wang, K.; Mirams, G.R.; Caruso, A.; Noble, D.; Walz, A.; Lavé, T.; Schuler, F.; Singer, T.; Polonchuk, L. Recent developments in using mechanistic cardiac modelling for drug safety evaluation. Drug Discov. Today 2016, 21, 924–938. [Google Scholar] [CrossRef]
  55. Di Francesco, D.; Noble, D. A model of cardiac electrical activity incorporating ionic pumps and concentration changes. Philos. Trans. R. Soc. London. B, Biol. Sci. 1985, 307, 353–398. [Google Scholar] [CrossRef]
  56. Fabbri, A.; Fantini, M.; Wilders, R.; Severi, S. Computational analysis of the human sinus node action potential: Model development and effects of mutations. J. Physiol. 2017, 595, 2365–2396. [Google Scholar] [CrossRef] [PubMed]
  57. Hodgkin, A.L.; Huxley, A.F. A quantitative description of membrane current and its application to conduction and excitation in nerve. J. Physiol. 1952, 117, 500–544. [Google Scholar] [CrossRef] [PubMed]
  58. Hines, M.L.; Carnevale, N.T. The NEURON Simulation Environment. Neural Comput. 1997, 9, 1179–1209. [Google Scholar] [CrossRef] [PubMed]
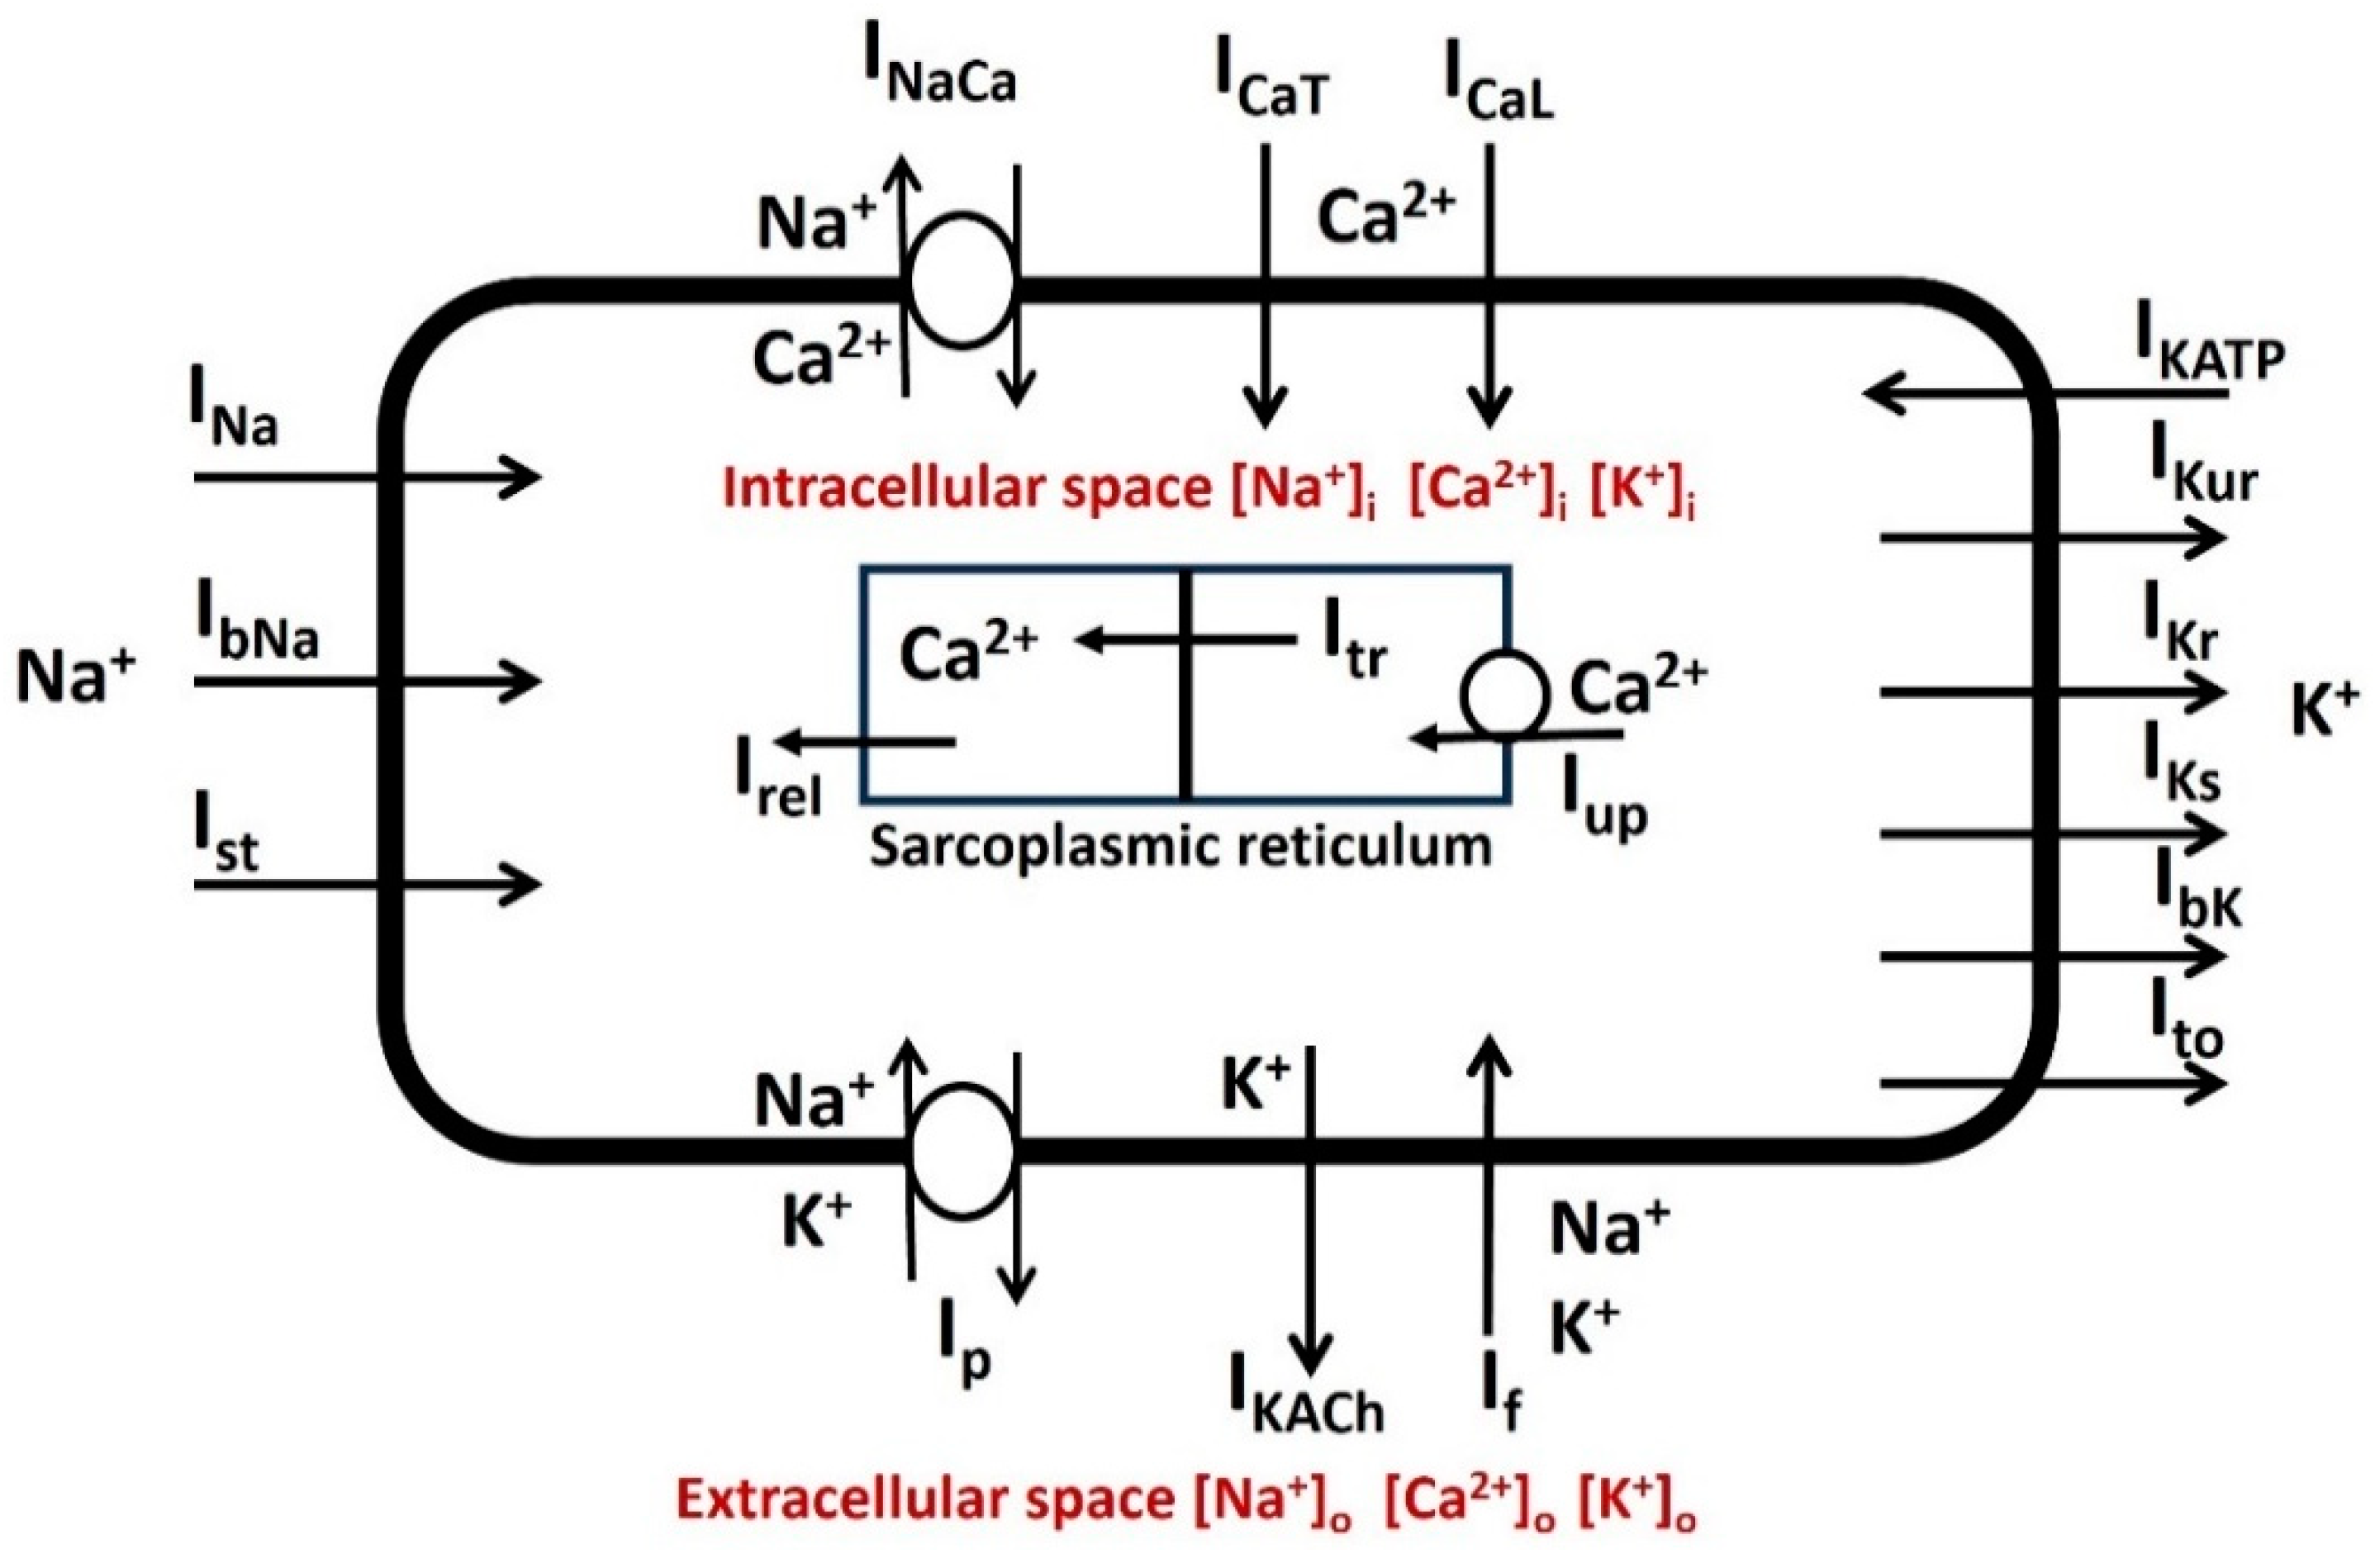
Figure 1. Schematic diagram illustrating all ionic components within a cardiac atrial node cell. The accompanying paragraph provides descriptions for each component.
Preprints 106927 g001
Figure 2. Schematic overview of parallel conductance model for ionic current (INa). It represents the flow of ion Na+ by gNa in series with Na+ Nerst potential ENa. Cm is the membrane capacitance.
Preprints 106927 g002
Figure 3. The simulated and validated curve for steady-state activation current of INav. The red solid line and black solid lines are the simulated curves from our model for control and 18 mM glucose application. The filled red squares and black triangles are the merged experimental data from Chen 2018 [34].
Preprints 106927 g003
Figure 4. Simulated INav under the voltage clamp protocol. The holding potential was held at −90 mV and the membrane potential increased with 10 mV step voltage from −70 mV to 40 mV.
Preprints 106927 g004
Figure 5. Simulated INav with 18 mM glucose under the voltage clamp protocol. The holding potential was held at −90 mV and the membrane potential increased with 10 mV step voltage from −70 mV to 40 mV.
Preprints 106927 g005
Figure 6. AP parameters for comparison. Details are described in the paragraph above the Figure 5.
Preprints 106927 g006
Figure 7. AP simulation under both control and 18 mM glucose concentration.
Preprints 106927 g007
Table 1. Model general constant parameters (Adapted from Courtemanche 1998 [50], Davies 2016 [54], Di Francesco 1985 [55], Fabbri 2017 [56]).
Parameter Definition Value
R Gas constant 8.3143 J.K−1.mol−1
T Temperature 310 K
Cm Membrane capacitance 100 pF
F Faraday constant 96.4867 C/mmol
Vcell Cell volume 20,100 μm3
Vi Intracellular volume 13,668 μm3
Vup SR uptake compartment volume 1,109.52 μm3
Vrel SR release compartment volume 96.48 μm3
[K+]o Extracellular K1 concentration 5.4 mM
[Na+]o Extracellular Na1 concentration 140 mM
[Ca2+]o Extracellular Ca21 concentration 1.8 mM
Table 2. Comparison between simulated AP and experimental AP.
Parameter Control Glucose
RMP (mV) −48 −50
AP Peak (mV) 47 55
AHP peak (mV) −53 −52
AP Duration (ms) 38 35
Disclaimer/Publisher’s Note: The statements, opinions and data contained in all publications are solely those of the individual author(s) and contributor(s) and not of MDPI and/or the editor(s). MDPI and/or the editor(s) disclaim responsibility for any injury to people or property resulting from any ideas, methods, instructions or products referred to in the content.
Copyright: This open access article is published under a Creative Commons CC BY 4.0 license, which permit the free download, distribution, and reuse, provided that the author and preprint are cited in any reuse.
Prerpints.org logo

Preprints.org is a free preprint server supported by MDPI in Basel, Switzerland.

Subscribe

© 2024 MDPI (Basel, Switzerland) unless otherwise stated