Submitted:
23 April 2024
Posted:
23 April 2024
You are already at the latest version
Abstract
Keywords:
1. Introduction
2. Materials and Methods
2.1. Estimation of the Sample Size
2.2. Data Collection Approach
2.3. Interviews and Focus Group Discussions
2.4. Evaluation Workshop Discussions
2.5. Geographical Location of Study Areas
2.5.1. Description of Muchinga Province
2.5.2. Climate and Hydrology
2.5.3. Description of Landforms for Muchinga Province
2.6. Catchment Surveys and Data Collection
2.7. Riverbed Soil Properties Along Simple Weir Traverse Lines
3. Results
3.1. Common Types of Simple Weirs Constructed by Farmers in Muchinga Province
3.1.1. Single-line Weirs
3.1.2. Double-Line Weirs
3.2. Farmers` Social Perception of Simple Weirs
3.3. Runoff (m3/s) Estimation Based on Catchment Characteristics and Shape
3.4. Riverbed Soil Properties Characterization
4. Discussion
4.1. Social Perception of Simple Weirs
4.2. Analysis of the Effect of Catchment Characteristics and Different Shapes on Run-off Yield
4.3. Assessment of Riverbed Soil Properties
5. Conclusions
Author Contributions
Funding
Data Availability Statement
Acknowledgments
Conflicts of Interest
References
- Nhemachena, C.; Matchaya, G.; Nhlengethwa, S.; Nhemachena, C.R. Exploring Ways to Increase Public Investments in Agricultural Water Management and Irrigation for Improved Agricultural Productivity in Southern Africa. WSA 2018, 44. [Google Scholar] [CrossRef]
- Tafesse, M. Small-scale irrigation for food security in sub-Saharan Africa; Technical Report and Recommendations of a CTA study visit: Ethiopia; 2003; pp. 1–102. [Google Scholar]
- De Bont, C.; Veldwisch, G.J. State Engagement with Farmer-Led Irrigation Development: Symbolic Irrigation Modernisation and Disturbed Development Trajectories in Tanzania. The Journal of Development Studies 2020, 56, 2154–2168. [Google Scholar] [CrossRef]
- Holzapfel, E.A.; Pannunzio, A.; Lorite, I.; Silva De Oliveira, A.; Farkas, I. Design and Management of Irrigation Systems. Chilean J. Agric. Res. 2009, 69, 17–25. [Google Scholar] [CrossRef]
- Lam, W.F. Improving the Performance of Small-Scale Irrigation Systems: The Effects of Technological Investments and Governance Structure on Irrigation Performance in Nepal. World Development 1996, 24, 1301–1315. [Google Scholar] [CrossRef]
- Singh, A.M. Modernization Farmers’ Managed Irrigation Systems in Nepal. Hydro Nepal 2010, 6, 55–60. [Google Scholar] [CrossRef]
- Ambler, J. Small-Scale Surface Irrigation in Asia. Land Use Policy 1994, 11, 262–274. [Google Scholar] [CrossRef]
- Mulenga, B.; Takao, N.; Haruhiko, H.; Yoshihiko, O. Participatory Irrigation Management Model and Proposal for Adoption in Zambia. Rural and Environmental Engineering 2003, 8, 68–79. [Google Scholar]
- Food and Agriculture Organization of the United Nations (FAO). FAO,2005, AQUASTAT Country Profile-Zambia; Rome, Italy, 2005; pp. 1–18. [Google Scholar]
- Burney, J.A.; Naylor, R.L. Smallholder Irrigation as a Poverty Alleviation Tool in Sub-Saharan Africa. World Development 2012, 40, 110–123. [Google Scholar] [CrossRef]
- Hamududu, B.H.; Ngoma, H. Impacts of Climate Change on Water Resources Availability in Zambia: Implications for Irrigation Development. Environ Dev Sustain 2020, 22, 2817–2838. [Google Scholar] [CrossRef]
- Nilsson, E. Socio-Economical Feasibility Study; Technical Report for a Proposed Weir on the Magoye River; Zambia: Lund, Sweden, 2012; pp. 1–27. [Google Scholar]
- Kay, M.G.; Stephens, W.; Carr, M.K.V. The Prospects for Small Scale Irrigation in Sub-Saharan Africa. Outlook Agric 1985, 14, 115–121. [Google Scholar] [CrossRef]
- Akayombokwa, I.M.; van Koppen, B.; Matete, M. Trends and Outlook: Agricultural Water Management in Southern Africa; Technical Report Country Zambia; Lusaka, Zambia, 2015; pp. 1–32. [Google Scholar]
- Wanyama, J.; Ssegane, H.; Kisekka, I.; Komakech, A.J.; Banadda, N.; Zziwa, A.; Ebong, T.O.; Mutumba, C.; Kiggundu, N.; Kayizi, R.K.; et al. Irrigation Development in Uganda: Constraints, Lessons Learned, and Future Perspectives. J. Irrig. Drain Eng. 2017, 143, 04017003–04017010. [Google Scholar] [CrossRef]
- Lefore, N.; Giordano, M.; Ringler, C.; Barron, J. Sustainable and Equitable Growth in Farmer Led Irrigation in Sub-Saharan Africa: What Will It Take? Water Alternative 2019, 12, 156–168. [Google Scholar]
- Zambia Statistics Agency (ZSA). 2022 Census of population and housing; Government of the Republic of Zambia: Lusaka, Zambia, 2022; pp. 1–39. [Google Scholar]
- Kabwe, A.L.; Hyodo, M.; Ogata, H.; Sagawa, Y.; Adachi, Y.; Ishii, M. Simple Weir Types and Their Prospects for Small-Scale Irrigation Development in Northern Zambia. International Journal of Environmental and Rural Development 2023, 14, 1–8. [Google Scholar]
- Food and Agriculture Organisation of the United Nations (FAO). Irrigation Techniques for Small-Scale Farmers: Key Practices for Disaster Risk Reduction Implementers in Southern Africa. FOA: Rome, Italy, 2014; pp. 1–52. [Google Scholar]
- Mhembwe, S.; Chiunya, N.; Dube, E. The Contribution of Small-Scale Rural Irrigation Schemes towards Food Security of Smallholder Farmers in Zimbabwe. Jàmbá- Journal of Disaster Risk Studies 2019, 11, 1–11. [Google Scholar] [CrossRef]
- De Fraiture, C.; Giordano, M. Small Private Irrigation: A Thriving but Overlooked Sector. Agricultural Water Management 2014, 131, 167–174. [Google Scholar] [CrossRef]
- Merrey, J.D.; Sullivan, A.; Mangisoni, J.; Mugabe, F.; Simfukwe, M. Evaluation of USAID/OFDA Small-scale irrigation programs in Zimbabwe and Zambia 2003-2006: Lessons for future programs; Final Report for National Resources Policy Analysis Network: USAID, Regional Office, Southern Africa. 2008; pp. 1–64. [Google Scholar]
- Mutiro, J.; Lautze, J. Irrigation in Southern Africa; Success or Failure? Irrigation and Drainage 2015, 64, 180–192. [Google Scholar] [CrossRef]
- Van Averbeke, W. Best Management Practices for Small-Scale Subsistence Farming on Selected Irrigation Schemes and Surrounding Area through Participatory Adaptive Research in Limpopo Province; Technical Report for Water Resources Management: Gezina, South Africa. 2008; pp. 1–356. [Google Scholar]
- Ertiro, F.; Pingale, S.M.; Wagesho, N. Evaluation of Failures and Design Practices of River Diversion Structures for Irrigation: A Revisit of Two Ssi Schemes in Ethiopia. International Journal of Earth Sciences and Engineering 2017, 10, 495–505. [Google Scholar] [CrossRef]
- Mwendera, E.; Chilonda, P. Methodological Framework for Revitalisation of Small-Scale Irrigation Schemes in Southern Africa. International Journal of Agricultural Science Research 2013, 2, 67–73. [Google Scholar]
- Krejcie, R.V.; Morgan, D.W. Determining Sample Size for Research Activities. Educational and Psychological Measurement 1970, 3, 607–610. [Google Scholar] [CrossRef]
- Taherdoost, H. Sampling Methods in Research Methodology; How to Choose a Sampling Technique for Research. International Journal of Academic Research in Management 2016, 5, 18–27. [Google Scholar] [CrossRef]
- Brigadier, L.; Barbara, N.; Bathsheba, M. Rainfall Variability over Northern Zambia. Journal of Scientific Research and Reports 2015, 6, 416–425. [Google Scholar] [CrossRef] [PubMed]
- Republic of Zambia. The Mechanical Protection of Arable Land, A Guide to Agricultural Planning; Revised Edition. Department of Agriculture: Lusaka, Zambia, 1977; pp. 67–118. [Google Scholar]
- Kabwe, A.L.; Hyodo, M.; Ogata, H.; Sagawa, Y.; Adachi, Y.; Ishii, M. Diagnostic Assessment in the Wet and Dry Seasons of Simple Weirs Constructed by Small-Scale Farmers in the Northern Region Provinces of Zambia. Water 2023, 15, 3935. [Google Scholar] [CrossRef]
- The Republic of Zambia Technical Cooperation Project on Community-Based Smallholder Irrigation, Project Report No. 1. Japan International Cooperation Agency: Tokyo, Japan, 2014; pp. 1–94.
- International Water Management Institute (IWMI) Agricultural Water Management National Situation in Zambia. Analysis Report of the AgWater Solutions Project. International Water Management Institute: Colombo, Sri Lanka, 2009; pp. 1–4. [Google Scholar]
- Colenbrander, W.; Kabwe, A.; van Koppen, B. Agricultural Water Management Technology Adoption in Zambia: An Inventory Report Agwater Solutions Project Case Study. International Water Management Institute: Colombo, Sri Lanka, 2012; pp. 1–17. [Google Scholar]
- United States Department of Agriculture. United States Department of Agriculture Soil Survey Laboratory Information Manual, Soil Survey Investigation Report No. 45. National Resources Conservation Service: National Soil Survey Centre, Lincoln, Nebraska, USA, 2011; pp. 1–506. [Google Scholar]
- Crosby, C.T.; De Lange, M.; Stimie, C.M.; Van der Stoep, I. A Review of Planning and Design Procedure Applicable to Small-Scale Farmer Irrigation Projects; Technical Report for Evaluation of Irrigation Techniques Used by Small-scale Farmers; Water Research Commission: Pretoria, South Africa, 2000; pp. 3–278. [Google Scholar]
- Everson, C.; Everson, T.M.; Csiwila, D.; Fanadzo, M.; Naiken, V.; Auerbach, R.M.B.; Moodley, M.; Mtshali, S.M.; Dladla, R. Sustainable Techniques and Practices for Water Harvesting and Conservation and Their Effective Application in Resource-Poor Agricultural Production through Participatory Adaptive Research: Report to the Water Research Commission; Technical Report for Water Research Commission. Gezina, South Africa, 2011; pp. 1–192. [Google Scholar]

| Description of Catchment Landscape | Prevailing Catchment Characteristics | Assigned Value |
|---|---|---|
| Catchment slopes | flat slopes (0-1%) | 5 |
| moderate slopes (1-5%) | 10 | |
| rolling slopes (5-8%) | 15 | |
| hilly, steep slopes (8-12%) | 20 | |
| mountainous slopes (< 12%) | 25 | |
| Soil physical characteristics, drainage conditions | deep permeable soils (>90cm) | 10 |
| shallow, semi-pervious soil (<60-90cm) | 20 | |
| shallow soil with underlying hard rock (<30cm) | 30 | |
| waterlogged soils | 50 | |
| Catchment vegetation cover density, land uses | heavy grass cover | 10 |
| moderate grass cover | 15 | |
| agricultural use | 20 | |
| bare catchment landscape | 25 |
| Demographic Data and Information | District | |||||
|---|---|---|---|---|---|---|
| Isoka, n=50 | Nakonde, n=50 | Mpika, n=50 |
Kanchibiya, n=50 |
Lavushimanda, n=50 |
Average | |
| Marital status | ||||||
| Single | 18 | 21 | 17 | 12 | 17 | 17.0 |
| Divorced | 6 | 3 | 7 | 5 | 0 | 4.2 |
| Widowed | 5 | 2 | 4 | 1 | 3 | 3.0 |
| Married | 21 | 24 | 22 | 32 | 30 | 25.8 |
| Gender | ||||||
| Males | 32 | 29 | 35 | 30 | 23 | 29.8 |
| Females | 18 | 21 | 15 | 20 | 27 | 20.2 |
| Age group | ||||||
| 20-30 | 10 | 8 | 13 | 15 | 5 | 10.2 |
| 31-40 | 22 | 15 | 18 | 20 | 16 | 18.2 |
| 41-50 | 13 | 27 | 16 | 3 | 18 | 15.4 |
| 51-60 | 5 | 0 | 3 | 12 | 11 | 6.2 |
| Common types of irrigation | Districts | ||||
|---|---|---|---|---|---|
| Isoka | Nakonde | Mpika | Kanchibiya | Lavushimanda | |
| Bucket Method | 9 | 17 | 8 | 4 | 6 |
| Simple weirs | 25 | 28 | 31 | 39 | 42 |
| Masonry/concrete weirs | 10 | 3 | 7 | 1 | 1 |
| Treadle pump | 1 | 0 | 2 | 5 | 0 |
| Gasoline pumps | 5 | 2 | 2 | 1 | 1 |
| Average education level | Districts | ||||
|---|---|---|---|---|---|
| Isoka | Nakonde | Mpika | Kanchibiya | Lavushimanda | |
| Primary school | 21 | 35 | 36 | 41 | 27 |
| Secondary school | 15 | 5 | 14 | 5 | 23 |
| Tertailly education | 14 | 10 | 0 | 4 | 0 |
| Catchment Area(ha) | Catchment Characteristic values | Catchment Shape | ||||||||
| 35 | 40 | 45 | 50 | 55 | 60 | 65 | 70 | 75 | Rectangular | |
| Average catchment run-off (mᶾ/s) | 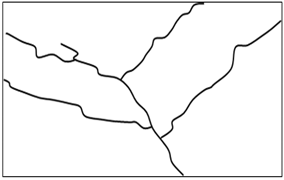 |
|||||||||
| 2 | 0.20 | 0.30 | 0.40 | 0.60 | 0.75 | 0.80 | 0.95 | 1.10 | 1.50 | |
| 2.5 | 0.19 | 0.27 | 0.30 | 0.35 | 0.45 | 0.55 | 1.05 | 1.50 | 1.80 | |
| 3.1 | 0.30 | 0.43 | 0.60 | 0.70 | 0.95 | 1.10 | 1.05 | 1.50 | 1.80 | |
| 5 | 0.50 | 0.60 | 0.90 | 1.10 | 1.40 | 1.60 | 1.90 | 2.10 | 2.40 | |
| 10 | 0.90 | 1.10 | 1.40 | 1.80 | 2.10 | 2.50 | 3.00 | 3.50 | 4.00 | |
| 15 | 1.40 | 1.80 | 2.10 | 2.50 | 3.00 | 3.60 | 4.30 | 5.00 | 5.80 | |
| 20 | 1.80 | 2.30 | 2.80 | 3.40 | 4.00 | 4.80 | 5.50 | 6.40 | 7.30 | |
| 30 | 2.30 | 2.90 | 3.60 | 4.50 | 5.50 | 6.60 | 7.90 | 9.10 | 10.50 | |
| 40 | 2.60 | 3.50 | 4.40 | 5.60 | 6.90 | 8.30 | 9.80 | 11.40 | 13.10 | |
| Catchment Area(ha) | Catchment Characteristic Values | Catchment Shape | |||||||||
| 35 | 40 | 45 | 50 | 55 | 60 | 65 | 70 | 75 | Square | ||
| Average catchment run-off (mᶾ/s) | |||||||||||
| 10 | 0.70 | 0.90 | 1.10 | 1.40 | 1.70 | 2.00 | 2.40 | 2.80 | 3.20 | 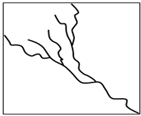 |
|
| 20 |
1.40 |
1.80 |
2.20 |
2.70 |
3.20 |
3.80 |
4.40 |
5.10 |
5.80 |
||
| Catchment Area(ha) | Catchment Characteristic Value | Catchment Shape | ||||||||
| 35 | 40 | 45 | 50 | 55 | 60 | 65 | 70 | 75 | Narrow and elongated | |
| Average Catchment run-off (mᶾ/s) |  |
|||||||||
| 5 | 0.30 | 0.40 | 0.60 | 0.70 | 0.70 | 1.00 | 1.20 | 1.40 | 1.70 | |
| 10 | 0.60 | 0.70 | 0.90 | 1.10 | 1.10 | 1.60 | 1.90 | 2.20 | 2.60 | |
| 15 |
0.90 |
1.10 |
1.40 |
1.60 |
1.60 |
2.30 |
2.70 |
3.20 |
3.70 |
|
| District and Site Identification Number | Sample Location Depth(cm) | Organic Matter (%) | Sandy SoilParticles (%) | Silt Soil Particles (%) | Clay Soil Particles (%) |
|---|---|---|---|---|---|
| Lavushimanda 1 | 0-25 | 3.60 | 10.16 | 20.74 | 65.50 |
| 25-50 | 1.76 | 12.34 | 18.90 | 67.00 | |
| 50-75 | 1.00 | 17.32 | 9.68 | 72.00 | |
| Lavushimanda 2 | 0-25 | 3.25 | 20.55 | 26 | 50.20 |
| 25-50 | 1.20 | 6.10 | 26.90 | 65.80 | |
| 50-75 | 0.40 | 22.32 | 9.14 | 68.14 | |
| Lavushimanda 3 | 0-25 | 4.20 | 14.50 | 20.40 | 60.90 |
| 25-50 | 1.50 | 5.20 | 17.85 | 75.45 | |
| 50-75 | 0.10 | 29.66 | 9.74 | 60.50 | |
| Lavushimanda 4 | 0-25 | 5.50 | 11.16 | 17.74 | 65.60 |
| 25-50 | 2.10 | 8.76 | 20.24 | 68.90 | |
| 50-75 | 1.40 | 13.36 | 9.74 | 75.50 |
| District and Site Identification Number | Sample Location Depth(cm) | Organic Matter (%) | sand Soil Particles (%) | Silt Soil Particles (%) | Cay Soil Particles (%) |
|---|---|---|---|---|---|
| Nakonde 1 | 0-25 | 2.20 | 61.16 | 20.40 | 16.24 |
| 25-50 | 1.76 | 76.76 | 16.60 | 4.88 | |
| 50-75 | 0.10 | 68.32 | 22.74 | 8.84 | |
| Nakonde 2 | 0-25 | 3.60 | 70.1 | 16.65 | 9.65 |
| 25-50 | 0.76 | 76.76 | 12.52 | 9.96 | |
| 50-75 | 1.00 | 76.32 | 12.50 | 10.18 | |
| Nakonde 3 | 0-25 | 1.50 | 61.16 | 15.60 | 21.74 |
| 25-50 | 0.60 | 66.76 | 10.55 | 22.09 | |
| 50-75 | 0.10 | 76.32 | 15.20 | 8.38 | |
| Nakonde 4 | 0-25 | 2.10 | 61.16 | 14.50 | 22.24 |
| 25-50 | 0.15 | 76.76 | 16.80 | 6.29 | |
| 50-75 | 0.00 | 72.32 | 12.52 | 15.16 | |
| Nakonde 5 | 0-25 | 4.50 | 71.10 | 13.25 | 11.15 |
| 25-50 | 2.10 | 56.65 | 15.90 | 25.35 | |
| 50-75 | 0.10 | 76.32 | 12.55 | 11.03 | |
| Nakonde 6 | 0-25 | 0.50 | 72.60 | 12.80 | 14.10 |
| 25-50 | 0.30 | 78.05 | 15.60 | 6.05 | |
| 50-75 | 0.10 | 76.25 | 18.20 | 5.45 |
| District and Site Identification Number | Sample Location Depth(cm) | Organic Matter (%) | Sand Soil Particles (%) |
Silt Soil Particles (%) |
Clay Soil Particles (%) |
|---|---|---|---|---|---|
| Mpika 1 | 0-25 | 4.20 | 21.16 | 4.45 | 70.19 |
| 25-50 | 3.50 | 16.76 | 19.16 | 60.58 | |
| 50-75 | 2.00 | 15.30 | 7.60 | 75.10 | |
| Mpika 2 | 0-25 | 5.00 | 27.30 | 2.50 | 65.20 |
| 25-50 | 3.10 | 22.60 | 4.30 | 70.00 | |
| 50-75 | 1.50 | 20.30 | 9.83 | 68.37 | |
| Mpika 3 | 0-25 | 0.50 | 27.30 | 1.32 | 70.88 |
| 25-50 | 0.20 | 25.60 | 3.70 | 70.50 | |
| 50-75 | 0.10 | 25.30 | 9.20 | 65.40 | |
| Mpika 4 | 0-25 | 3.27 | 25.50 | 2.65 | 68.58 |
| 25-50 | 3.00 | 24.60 | 2.32 | 70.08 | |
| 50-75 | 2.40 | 18.50 | 13.30 | 65.80 | |
| Mpika 5 | 0-25 | 3.65 | 29.27 | 8.48 | 58.6 |
| 25-50 | 2.74 | 25.25 | 1.03 | 70.98 | |
| 50-75 | 3.25 | 27.93 | 8.04 | 60.78 | |
| Mpika 6 | 0-25 | 2.76 | 15.32 | 9.24 | 72.68 |
| 25-50 | 4.43 | 15.73 | 7.34 | 72.50 | |
| 50-75 | 3.5 | 27.93 | 7.79 | 60.78 | |
| Mpika 7 | 0-25 | 2.6 | 25.32 | 3.10 | 68.98 |
| 25-50 | 4.43 | 26.73 | 8.49 | 60.35 | |
| 50-75 | 4.2 | 27.93 | 2.62 | 65.25 | |
| Mpika 8 | 0-25 | 3.4 | 27.93 | 4.17 | 64.50 |
| 25-50 | 1.75 | 35.32 | 2.03 | 60.90 | |
| 50-75 | 1.45 | 16.70 | 9.5 | 72.35 |
| District and Site Identification Number | Sample Location Depth(cm) | Organic Matter (%) | Sand Soil Particles (%) | Silt Soil particles (%) |
Clay Soil Particles (%) |
|---|---|---|---|---|---|
| Kanchibiya 1 | 0-25 | 3.25 | 27.93 | 35.04 | 33.78 |
| 25-50 | 2.76 | 35.32 | 35.23 | 26.69 | |
| 50-75 | 2.43 | 66.73 | 12.54 | 18.30 | |
| Kanchibiya 2 | 0-25 | 3.25 | 27.93 | 35.04 | 33.78 |
| 25-50 | 2.76 | 35.32 | 35.23 | 26.69 | |
| 50-75 | 2.43 | 66.73 | 12.54 | 18.30 | |
| Kanchibiya 3 | 0-25 | 3.25 | 27.93 | 35.04 | 33.78 |
| 25-50 | 2.76 | 35.32 | 35.23 | 26.69 | |
| 50-75 | 2.43 | 66.73 | 12.54 | 18.30 | |
| Kanchibiya 4 | 0-25 | 3.25 | 27.93 | 35.04 | 33.78 |
| 25-50 | 2.76 | 35.32 | 35.23 | 26.69 | |
| 50-75 | 2.43 | 66.73 | 12.54 | 18.30 | |
| Kanchibiya 5 | 0-25 | 3.25 | 27.93 | 35.04 | 33.78 |
| 25-50 | 2.76 | 35.32 | 35.23 | 26.69 | |
| 50-75 | 2.43 | 66.73 | 12.54 | 18.30 | |
| Kanchibiya 6 | 0-25 | 3.25 | 27.93 | 35.04 | 33.78 |
| 25-50 | 2.76 | 35.32 | 35.23 | 26.69 | |
| 50-75 | 2.43 | 66.73 | 12.54 | 18.30 | |
| Kanchibiya 7 | 0-25 | 3.25 | 27.93 | 35.04 | 33.78 |
| 25-50 | 2.76 | 35.32 | 35.23 | 26.69 | |
| 50-75 | 2.43 | 66.73 | 12.54 | 18.30 |
| District and Site Identification Number | Sample Location Depth (cm) | Organic Matter (%) | Sand Soil Particles (%) | Silt Soil Particles (%) | Clay Soil Particles (%) |
|---|---|---|---|---|---|
| Isoka 1 | 0-25 | 3.00 | 71.60 | 20.40 | 5.00 |
| 25-50 | 2.76 | 75.60 | 16.90 | 4.74 | |
| 50-75 | 2.10 | 76.32 | 12.50 | 9.08 | |
| Isoka 2 | 0-25 | 4.20 | 61.60 | 15.80 | 18.40 |
| 25-50 | 1.80 | 56.76 | 25.80 | 15.64 | |
| 50-75 | 0.50 | 67.32 | 26.50 | 5.68 | |
| Isoka 3 | 0-25 | 1.20 | 70.50 | 15.50 | 12.80 |
| 25-50 | 0.70 | 65.15 | 16.90 | 17.25 | |
| 50-75 | 0.20 | 66.25 | 24.50 | 9.05 | |
| Isoka 4 | 0-25 | 2.20 | 75.10 | 12.45 | 10.25 |
| 25-50 | 0.76 | 58.75 | 35.20 | 5.29 | |
| 50-75 | 0.70 | 75.20 | 13.55 | 10.55 | |
| Isoka 5 | 0-25 | 5.50 | 76.20 | 14.52 | 3.78 |
| 25-50 | 3.50 | 65.80 | 18.50 | 12.20 | |
| 50-75 | 2.10 | 76.32 | 15.85 | 5.73 | |
| Isoka 6 | 0-25 | 6.20 | 60.80 | 18.50 | 14.50 |
| 25-50 | 4.70 | 72.70 | 12.20 | 10.40 | |
| 50-75 | 1.40 | 76.32 | 15.25 | 7.03 | |
| Isoka 7 | 0-25 | 0.20 | 61.00 | 13.50 | 25.30 |
| 25-50 | 0.10 | 78.50 | 14.75 | 6.65 | |
| 50-75 | 0.00 | 76.32 | 18.50 | 5.18 |
Disclaimer/Publisher’s Note: The statements, opinions and data contained in all publications are solely those of the individual author(s) and contributor(s) and not of MDPI and/or the editor(s). MDPI and/or the editor(s) disclaim responsibility for any injury to people or property resulting from any ideas, methods, instructions or products referred to in the content. |
© 2024 by the authors. Licensee MDPI, Basel, Switzerland. This article is an open access article distributed under the terms and conditions of the Creative Commons Attribution (CC BY) license (http://creativecommons.org/licenses/by/4.0/).


