1. Introduction
Biomass is widely adopted as a renewable energy source with high sustainability. Its diverse sources include forestry, agriculture, organic waste, and livestock and poultry manure [
1,
2]. Through thermochemical conversions such as pyrolysis, gasification, and combustion, biomass can be transformed into valuable energy [
3]. Notably, biomass is considered a carbon-neutral energy source, capable of achieving zero carbon emissions and mitigating greenhouse gas effects, particularly carbon dioxide [
4,
5]. With stringent requirements to reduce carbon emissions, China aims to run carbon reduction plans by 2030 and achieve carbon neutrality by 2060 [
6,
7]. To this end, the development of biomass energy is of significant importance. By reducing reliance on fossil fuels and addressing environmental concerns, biomass energy holds significant potential. Accordingly, numerous investigations have been conducted focusing on biomass energy to enhance global energy structures while meeting stringent carbon emission regulations.
Applications of biomass mainly include combustion directly or indirectly as fuel or the production of charcoal, bio-oil, tar, and gas by pyrolysis technology. The content of sulfur and nitrogen in biomass is low, and the emission of SOx and NOx in the combustion process is less, which has good emission characteristics. After combustion, there is less ash, and the generated ash contains a large amount of organic potassium salt, which can be used to recover and extract potash fertilizer, greatly reducing the site of ash stacking, and reducing the cost of ash disposal and resource waste [
8]. Therefore, based on the advantages of low cost, low risk and high efficiency of biomass, biomass power generation is one of the most promising utilization technologies, which can generate efficient and clean electric energy by direct combustion or gasification after simple treatment of collected biomass as raw materials. Promoting the deepening development of biomass energy will help increase the supply of high-quality energy, ease the pressure on domestic coal power generation, and play an important guiding role in improving the energy consumption structure and ecological environment.
Peanut shells represent a substantial agricultural waste in key peanut-producing nations like China, Vietnam, and Indonesia. China, as the world’s largest peanut producer, produces 17 million tons of peanuts, accounting for more than 40% of the world’s total production. The production of peanut shells is as high as 5 million tons, some of which are used as fuel, most of which are piled up or directly burned, wasting substantial resources [
9]. Hence, exploring the utilization potential of peanut shells has become a hot research topic in recent years. In this context, understanding the combustion features and thermal characteristics of solid fuel in depth is crucial for designing combustion equipment on an industrial scale [
10,
11].
Methods for addressing the dynamic parameters of the combustion process are primarily categorized into model-fitting and model-free methods [12–14]. In the former method, kinetic parameters are calculated by assuming a model for each reaction and then finding the best fit of the data to the model. This method mainly adopts the method of a single heating rate, thus the kinetic parameters obtained are not applicable, and often cannot predict the reaction process under other heating rate conditions. This makes the model-fitting method under a single heating rate limited to some extent. The latter method, on the other hand, calculates the kinetic parameters at the same conversion from several pyrolysis curves with different heating rates. In this approach, variations in the activation energy with conversion rate can be determined using the iso-conversion rate method, which can reveal the nature of some seemingly simple reactions that are complex.
This paper aims to explore the thermochemical conversion of peanut shells during combustion. Through a combination of experimental analysis and theoretical approaches, thermogravimetric analysis is conducted to examine the combustion characteristics of peanut shell raw materials under atmospheric air. The study employs two model-free kinetic methods, namely the Kissinger–Akahira–Sunose (KAS) and Flynn–Wall–Ozawa (FWO) methods, to explore the combustion kinetics parameters. Additionally, a thermodynamic analysis is carried out. The findings of this study can offer valuable insights for the design, transformation, and operational optimization of combustion equipment, thereby facilitating the efficient and clean utilization of peanut shells..
2. Materials and Methods
2.1. Materials
The peanut shells utilized in this experimental investigation originated from Hubei province, China. These samples were grounded using a 150-mesh sieve. Subsequently, the finely ground samples were dried at 373 K for 24 hours.
The proximate analysis of the peanut shell was conducted following the GB/T 212–2008 standard. For the ultimate analysis, a CHNS/O analyzer was employed, which simultaneously detected the weight percentage of carbon, hydrogen, nitrogen, and sulfur in the samples. The weight percentage of oxygen was determined by the difference. Each experiment was repeated twice, and the average values were recorded. The results of the proximate and ultimate analyses of the peanut shell are summarized in
Table 1. The significant volatile and fixed carbon content indicates the potential of peanut shells as a fuel source in thermochemical processes. The low nitrogen and sulfur contentin the ultimate analysisis advantageous as it leads to lower emissions of toxic NOx and SOx during conversion processes, making peanut shells a promising alternative for bioenergy production regarding environmental sustainability and high volatility [
15].
2.2. Experimental Procedures
Thermogravimetric testing was conducted using a thermogravimetric analyzer (TGA5500, Waters, USA). Each sample, weighing approximately 6±0.5 mg, was placed in an alumina crucible. The samples were then heated at various rates: 10, 20, and 30 K/min, starting from room temperature and reaching 1073 K, under atmospheric air with a flow rate of 100 mL/min. The real-time change in mass loss was monitored throughout the entire process. To enhance accuracy, each test was performed in triplicate to minimize vibration errors.
2.3. Combustion Characteristic Parameters
To explore the oxidative decomposition of peanut shells, it is crucial to explore the characteristic temperature, characteristic time, and weight loss rate from the TG/DTG curve during the process.
2.3.1. Characteristic Temperature and Characteristic time
The ignition temperature (
Ti) represents the minimum temperature at which the fuel ignites spontaneously without an external source. Typically, the ignition temperature is determined using the TG-DTG tangent method [
16]. This method involves drawing a vertical line on the X-axis at the maximum peak of the DTG curve and intersecting the TG curve at a point. Subsequently, a tangent line is drawn on the TG curve after this point. When the tangent line intersects with a parallel line parallel to the X-axis, it indicates the point at which the TG begins to lose weight. The temperature corresponding to this point is the ignition temperature (
Ti), and the time corresponding to reaching the ignition temperature is the ignition time (
ti).
The burnout temperature (
Tb) represents the temperature at which the combustion of the sample ceases, indicating the difficulty of sample burnout. It is identified when the TG curve approaches a horizontal line and the DTG curve approaches 0, signifying that the fuel combustion is essentially complete. In this study, the burnout temperature is defined as the point where the weight loss at the terminal phase of the TG profile reaches 98% [
17]. The time corresponding to reaching the burnout temperature is referred to as the burnout time (
tb).
The initial release temperature of volatile matter (
Tv) is defined as the temperature corresponding to a mass loss rate of 0.1 mg/min [
18]. The peak temperature (
Tm) refers to the temperature of the maximum weight loss peak in the DTG curve during the combustion process. The time corresponding to reaching the peak temperature is
tm. Δ
T1/2 represents the temperature interval at half the value of the peak weight loss rate in both the descending and rising parts of the DTG peak, while Δ
t1/2 represents the time interval at half the value of the peak weight loss rate.
2.3.2. Weight Loss Rate
The maximum combustion rate (vmax) refers to the highest weight loss rate of the fuel during combustion, indicating the intensity of the fuel combustion reaction. A higher maximum combustion rate suggests a more vigorous release of volatile matter, leading to a faster weight loss rate after ignition, typically associated with a lower corresponding temperature. Meanwhile, vmean represents the average weight loss rate of the sample throughout the entire combustion process, from the ignition temperature to the burnout temperature. A higher vmean value indicates a more intense overall combustion process.
2.3.3. Combustion Performance Parameters
To assess the combustion characteristics of peanut shells, several parameters were utilized in this study: volatile matter release (
Dv), ignition index (
Di), burnout index (
Db), combustion intensity (
Hf), combustion stability index (
Dsi), and comprehensive combustibility (
S). These parameters are defined in terms of characteristic temperature, characteristic time, and weight loss rate. Relevant expressions of combustion performance parameters are described as follows [
19,
20,
21]:
2.4. Kinetic Method
The kinetics analysis plays a crucial role in understanding the reaction process of biomass. As recommended by the Kinetics Committee of the International Confederationfor Thermal Analysis and Calorimetry [
22], this article employs model-free methods like FWO and KAS to compute the kinetic parameters. The solid-gas reaction rate is defined as follows:
where α represents the conversion degree,
t denotes the combustion time,
k(
T) stands for the reaction rate constant, and
f(α) represents the differential expression of the reaction model. The α during the combustion process can be obtained from thermogravimetric analysis data, as follows:
where
m0,
mt, and
m∞ are the initial, instant, and residual mass of biomass during the combustion process, respectively. Based on the Arrhenius law,
k(T) can be obtained using the following expression:
where
T represents the combustion temperature,
A is the pre-exponential factor,
Eα is the activation energy, and
R represents the universal gas constant. Combining Equations (7) and (9) at a given constant (
β=d
T/d
t), and rearranging yields Equation (10):
The integral form of
f(α) can be presented as:
2.4.1. FWO method
The FWO approach utilizes Doyle’s approximation for temperature integration and is formulated as Equation (12) [
23,
24]. It is worth noting that
Eα can be determined from the gradient−1.052
Eα/
R of the regression lines.
2.4.2. KAS method
The KAS technique is expressed by Equation (13) [
25].
Ea can be derived from the slope −
Eα/
R of the regression lines.
2.5. Thermodynamic Method
Based on
Eαcomputed using the FWO and KAS methods, the pre-exponential factor
A, as well as thermodynamic parameters like change in enthalpy (Δ
H), change in Gibbs free energy (Δ
G), and change in entropy (Δ
S) at a specific heating rate, can be determined as follows [
26,
27]:
In these equations, kB=1.381×10⁻²³ J/K represents the Boltzmann constant, and h=6.626×10⁻³⁴ J/s is the Planck’s constant.
3. Results and Discussion
3.1. Thermogravimetric Analysis
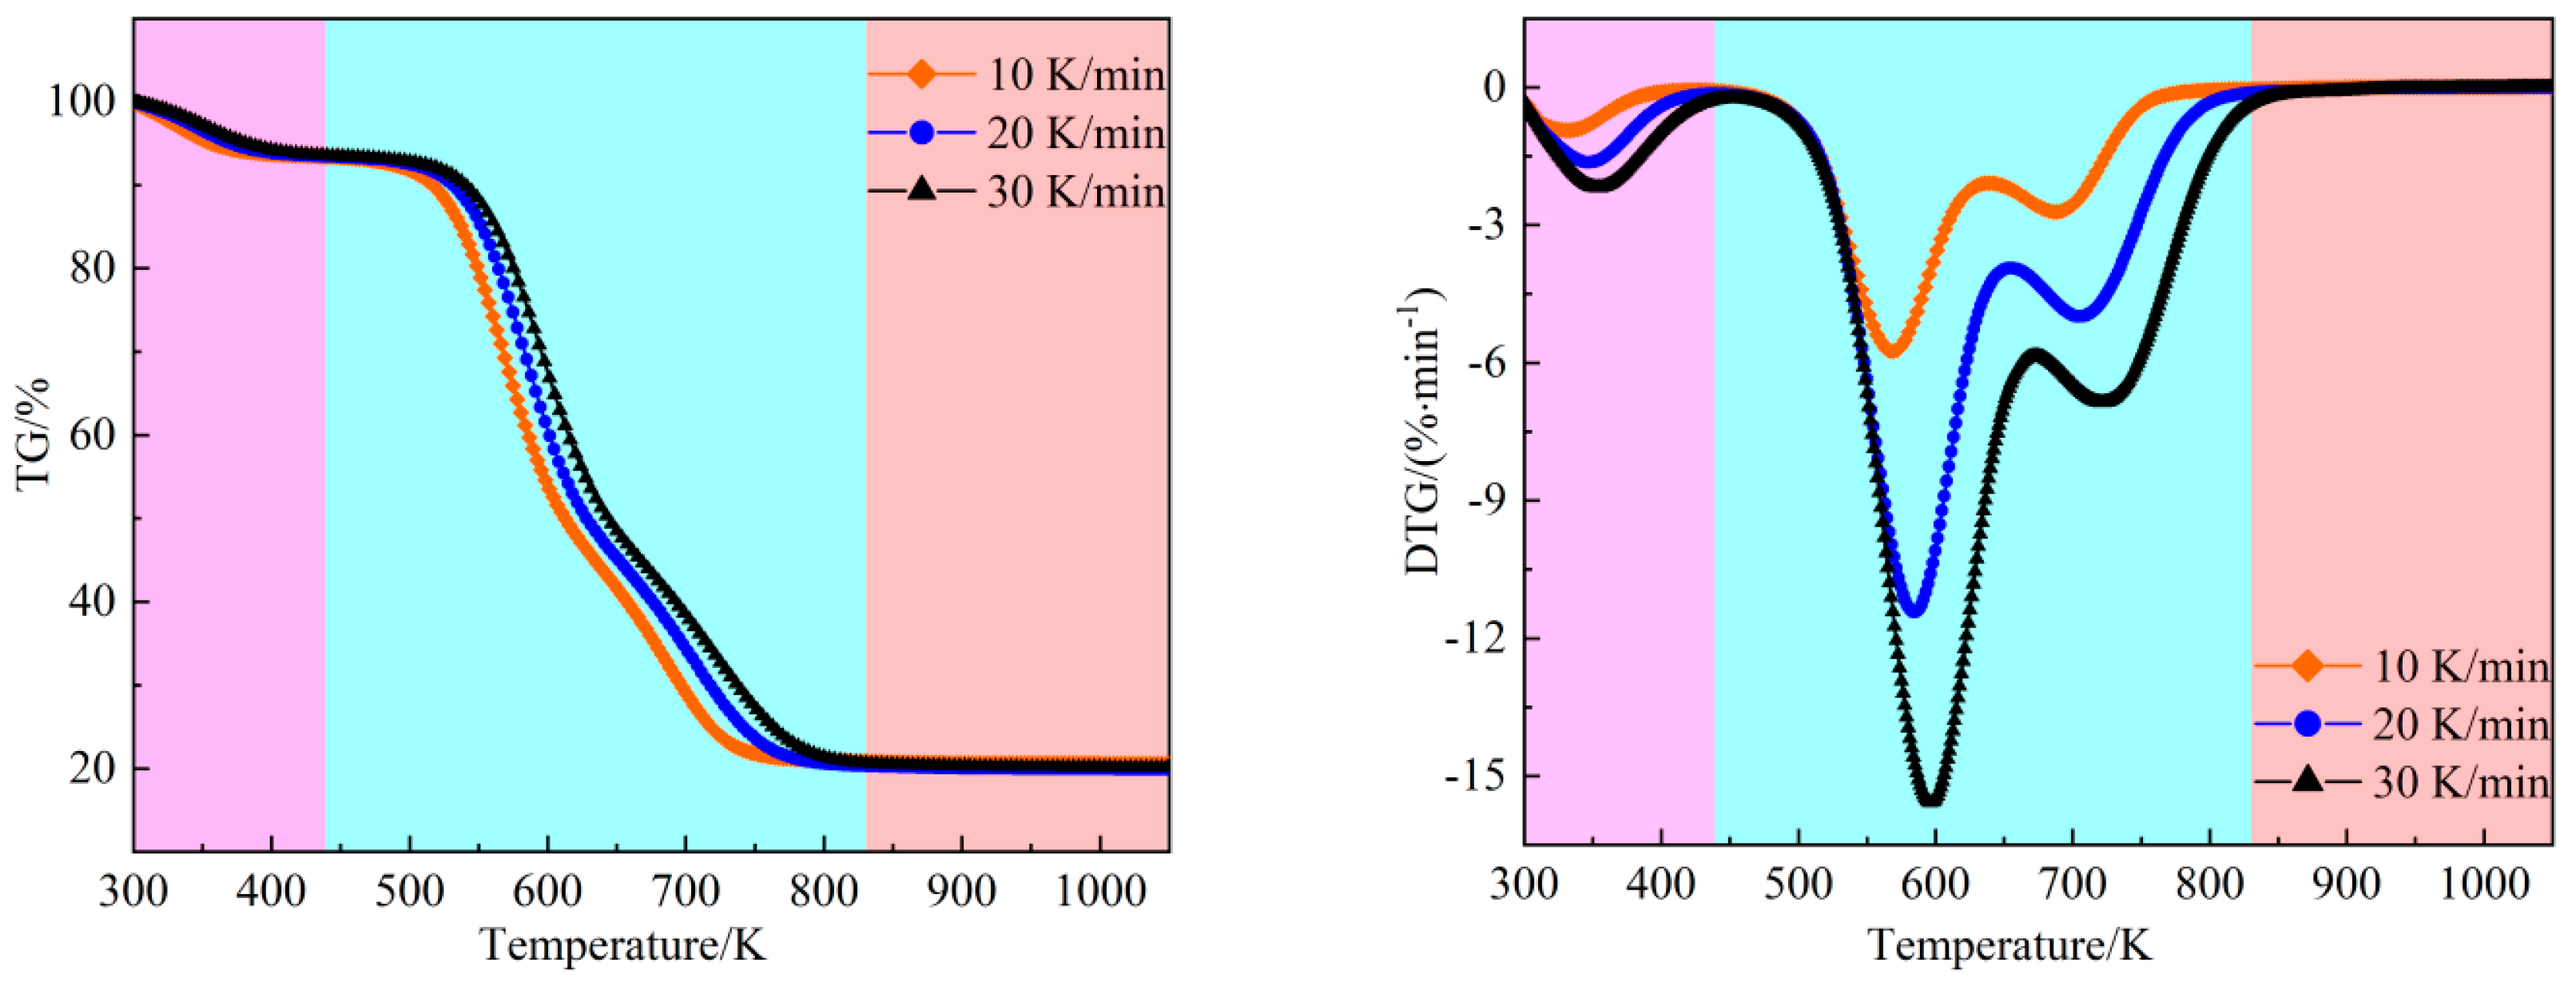
Figure 1 illustrates the TG and DTG profiles of peanut shells from room temperature to 1073 K at three different heating rates. Focusing on the TG and DTG curves obtained at a heating rate of 20 K/min, distinct combustion stages are evident. Initially, there is a stage corresponding to water evaporation (ambient to 440 K), primarily involving the release of bound water within peanut shells. This stage is characterized by a minor decrease in the TG curve and a low weight loss rate, constituting approximately 7.68% of the total weight loss, closely aligning with the water content indicated in
Table 1. The subsequent stage, spanning from 440 K to 832 K, represents the main combustion phase, exhibiting the highest weight loss rate and accounting for 72.39% of the total weight loss. Notably, this stage is marked by a significant decline in weight on the TG curve, accompanied by two distinct peaks on the DTG curve. The first peak corresponds to the combustion of volatile components, occurring at approximately 584.60 K. These weight losses primarily result from the thermal degradation and combustion of volatile substances such as hemicelluloses, celluloses, and certain lignin components [
28]. The second peak corresponds to the combustion of residual volatiles and fixed carbon, with the weight loss peak occurring at 705.31 K. This stage mainly involves the combustion of lignin and fixed carbon, where the latter cannot combust until the volatile matter has been consumed, and the temperature is sufficiently elevated [
29]. The maximum combustion rate is observed at the first DTG peak. The final stage, ranging from 832 K to 1073 K, is the burnout phase, during which both the TG and DTG curves stabilize, and there is no further change in sample mass. After the combustion process, the residual mass amounts to 19.93%.
Table 2 presents the combustion stages and their associated weight losses throughout the entire combustion process at various heating rates. It indicates that the heating rate has minimal impact on the weight loss during stage II and the final residual at the end of the combustion. However, with an increase in heating rate, both the onset temperature of the main combustion stage and the temperature corresponding to the weight loss peak gradually rise. This observationmay be attributed to the shorter residence time associated with higher heating rates, which impedes effective heat transfer. Consequently, a larger temperature differential between the surface and interior of the sample is observed, resulting in an upward shift of the overall DTG curve towards higher temperatures.
3.2. CombustionCharacteristic Analysis
Table 3 provides detailed outcomes outlining the influence of heating rate on combustion characteristic parameters and performance parameters for a clearer comprehension of how variations in heating rate impact combustion behavior. It is observed that alterations in heating rate exert varying degrees of influence on these characteristics. As the heating rate rises, ignition and burnout temperatures increase, alongside the maximum combustion rate and its corresponding peak temperature. The elevation of the heating rate results in a noticeable delay in the combustion reaction of the sample, hindering ignition and prolonging burnout time. The elevation in ignition temperature can be attributed to the heightened heating rate, which increases the volatilization of fuel components and decreases the residual fuel content. Consequently, the combustion reaction shifts towards higher temperature ranges. Similarly, the rise in burnout temperature is a consequence of the increased heating rate, prolonging the incomplete volatilization analysis of the sample and delaying combustion, thereby increasing the sample’s burnout temperature. Moreover, the escalation in maximum combustion rate and its corresponding peak temperature signifies a more vigorous combustion capacity per unit time with the heightened heating rate. However, as the heating rate increases, the heat transfer rate may not keep pace with temperature changes, resulting in a temperature differential between the sample’s surface and interior [
30]. This thermal lag exacerbates the temperature gradient within the sample particles, leading to a noticeable thermal shock effect and an accelerated combustion reaction rate, thereby increasing the maximum peak temperature.
Di and
Db align with the findings regarding ignition temperature and burnout temperature. Higher values of
Db indicate enhanced ignition performance [
31,
32]. This suggests that as the heating rate increases, the flammability and burnout capabilities of the fuel improve. The heightened heating rate intensifies the volatilization analysis, leading to the formation of more pores within and on the surface of the coke. This phenomenon may induce the collapse of the coke structure, resulting in increased surface area conducive to oxygen transport to the interior of the coke and combustion of the coke surface, thereby enhancing combustion efficiency.
Table 3 indicates that the initial devolatilization temperature exhibits minimal change, suggesting that the heating rate slightly affects the temperature at which volatiles begin to precipitate. However, it does impact the volatile matter release index (
Dv), which signifies the release performance of volatile matter in the fuel. It is also found that as the heating rate increases, the volatile matter release index increases too. A higher
Dv value indicates a more centralized combustion region of char residues and higher burnout performance [
33]. The comprehensive combustibility
S encompasses various characteristics, including ignition and burnout. Utilizing the combustion index enables an evaluation of relative combustibility, offering the ability to select the most suitable option for specific conditions and purposes. A high
S value indicates a high combustion reactivity of the material [
34]. The combustion stability index
Dsi is employed to reflect the combustion stability [
35]. It is observed that both the comprehensive combustibility and combustion stability index exhibit an increasing trend with the rise in heating rate. This suggests that within the discussed heating rate range, increasing the heating rate can enhance its comprehensive combustion performance and improve the stability of high combustion. Conversely, the combustion intensity (
Hf) decreases with the rising heating rate.
Hf characterizes the rate and intensity of the combustion process, with a smaller value indicating more efficient combustion [
36]. Overall, the heating rate exhibits a positive correlation with the comprehensive combustion characteristics. However, due to variations in the degree of influence of the heating rate on different combustion indices, excessively high heating rates may induce instability and fluctuations in the combustion process of the sample.
3.3. Kinetics Analysis
The model-free methods, which don’t rely on specific mechanism functions, have been commonly used for estimating more reliable activation energies (
Eα). The
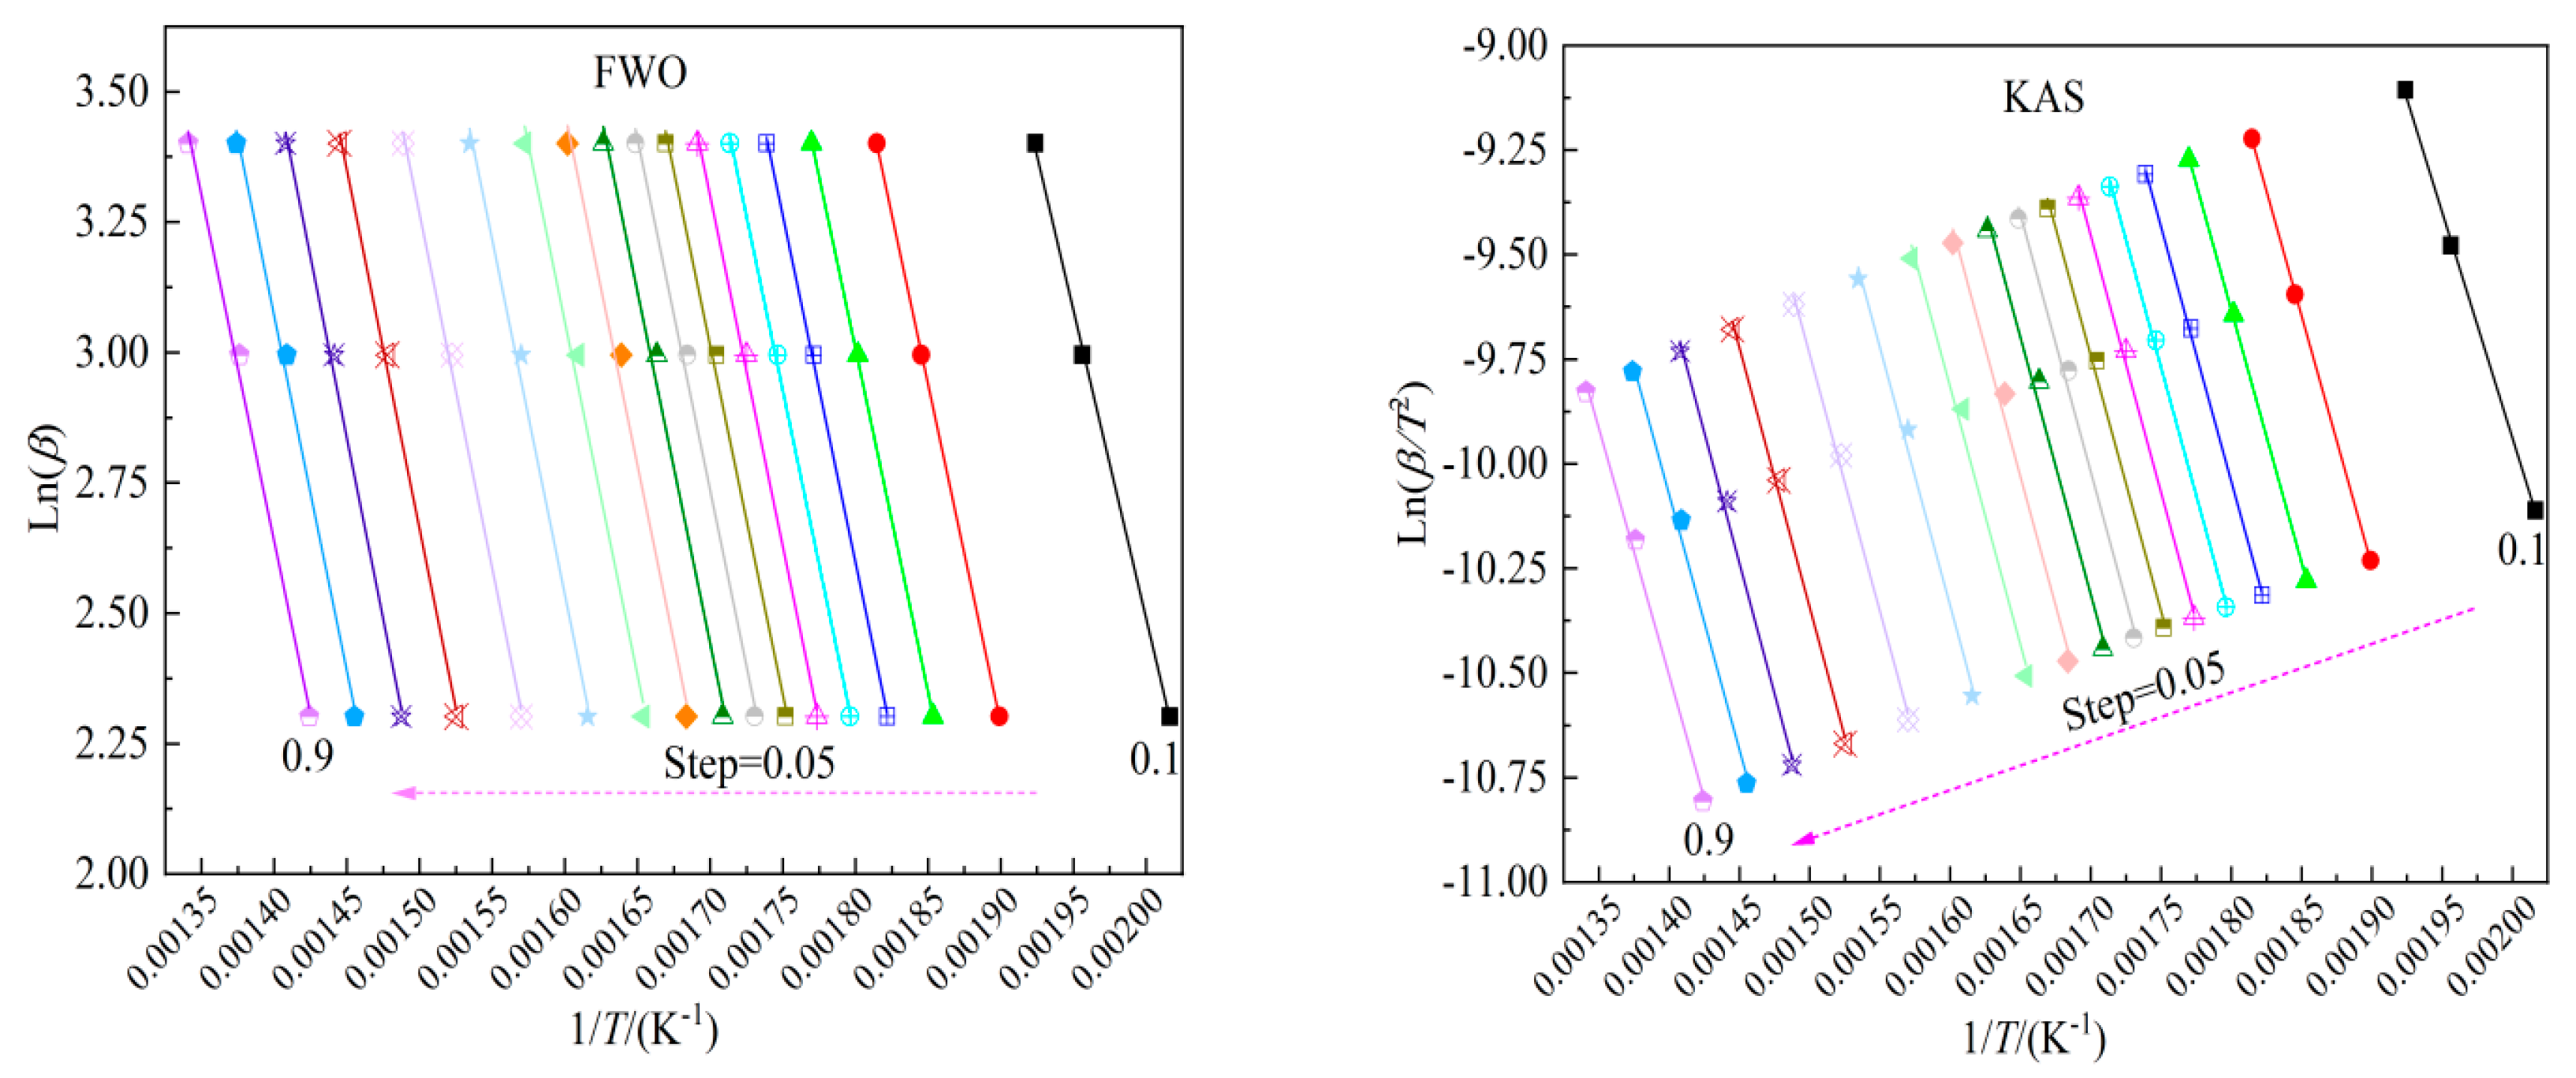
Eα values for the combustion of peanut shells were estimated considering the conversion (α). Utilizing Equations (12) and (13), kinetics with conversions ranging from 0.10 to 0.90 at intervals of 0.05 were computed.
Figure 2 illustrates the results.
Table 4 reveals that
Eαvaries from 93.30 to 109.65 kJ/mol and 89.72 to 103.88 kJ/mol, respectively, with average values of 105.60 kJ/mol and 100.93 kJ/mol for FWO and KAS methods. All correlations demonstrate statistical sufficiency, with
R2 values ranging from 0.9901 to 1.0, verifying the accuracy of the outcomes.
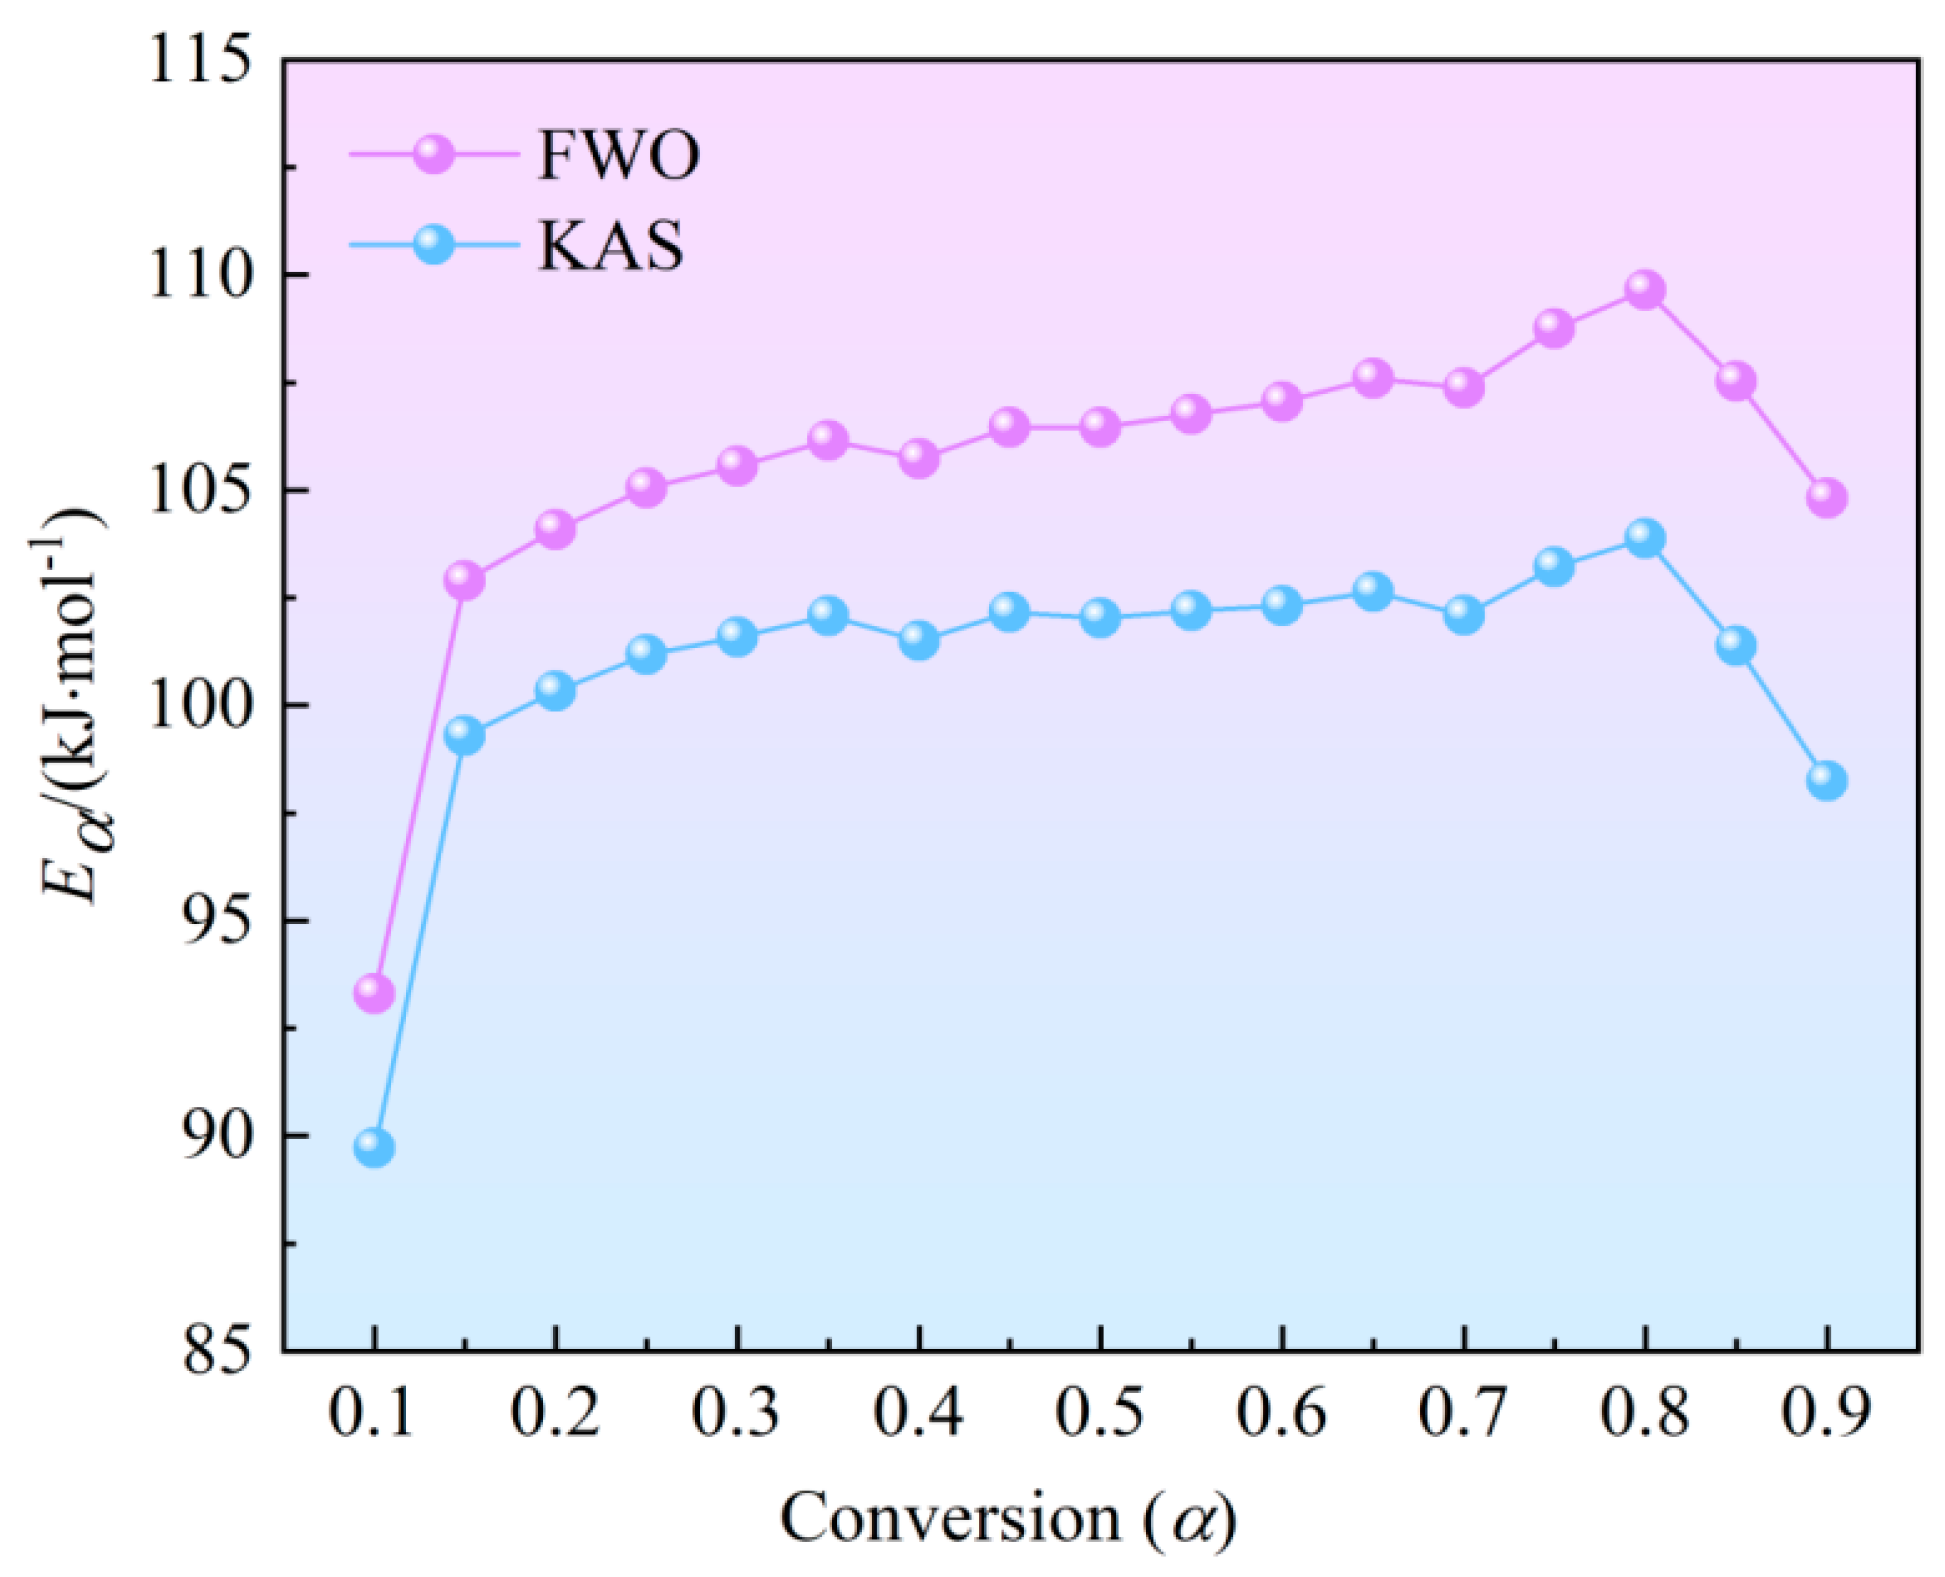
Figure 3 illustrates the variations of
Eαagainst the conversion rate, indicating that both methods yield similar activation energy values, with slightly higher values obtained using the FWO method. These curvecan be categorized into three stages: Initially, in the α range of 0.10 to 0.15, there is a slight increase in
Eα values. For the KAS and FWO methods,
Eα rises from 93.30 to 102.89 kJ/mol and 89.72 to 99.29 kJ/mol, respectively. The second region had a stable
Eα, but a substantial decrease in the third region with a range of 0.80 to 0.90.
At the initial stage of the reaction, with the increase in temperature, the precipitation of volatile substances and the initial decomposition of hemicellulose and cellulose first occur. The initial decomposition requires a higher temperature and more heat to achieve its activation state, which leads to an increase in activation energy. With a further increase in temperature, the combustion process enters the main combustion stage of volatiles. At the same time, cellulose and lignin with high polymerization degree gradually transform into coke, the carbon structure tends to be orderly, the active site decreases, and the semi-coke formed on the surface of the reactants will increase the reaction difficulty inside the reactants, and the activation energy will further increase. However, the overall increase trend is relatively gentle with increase amplitude of 6.6% and 4.6% for FWO and KAS methods, respectively. Eα reaches its maximum value when α reaches 0.80. Then, the Eα gradually decreases, mainly in the combustion stage of fixed carbon. The porosity of semi-coke increases due to the volatilization and carbonization process, and the pre-pyrolysis, aerobic cracking and volatilization ignition processes can provide more heat, which improves the reaction activity of fixed carbon in the combustion stage, and thus the activation energy decreases.
The parameter
A is a crucial indicator of the sample’s surface structure or the complexity of the combustion reaction [
37].
A value lower than 10
9 s
–1 suggests surface reactions, while
A higher than 10
9 s
–1 indicates simpler complexes with higher reactivity [
38]. The results demonstrate that at a heating rate of 10 K/min, the parameter
A calculated by the FWO and KAS methods ranges from 2.19×10
6 to 8.06×10
7 s
–1 and from 9.72×10
5 to 2.25×10
7 s
–1, respectively. All
A values fall below 10
9 s
–1, suggesting that the combustion process of peanut shells primarily involves surface reactions associated with a closed complex. The trend of variation in the pre-exponential factor with conversion aligns with that of the activation energy.
3.4. Thermodynamic Analysis
Estimating the thermodynamic parameters of combustion is crucial for designing combustion reactors on a large scale and selecting appropriate biofuels. Δ𝐻, Δ𝐺, and Δ𝑆are presented in
Table 5 at the heating rate of 10 K/min.
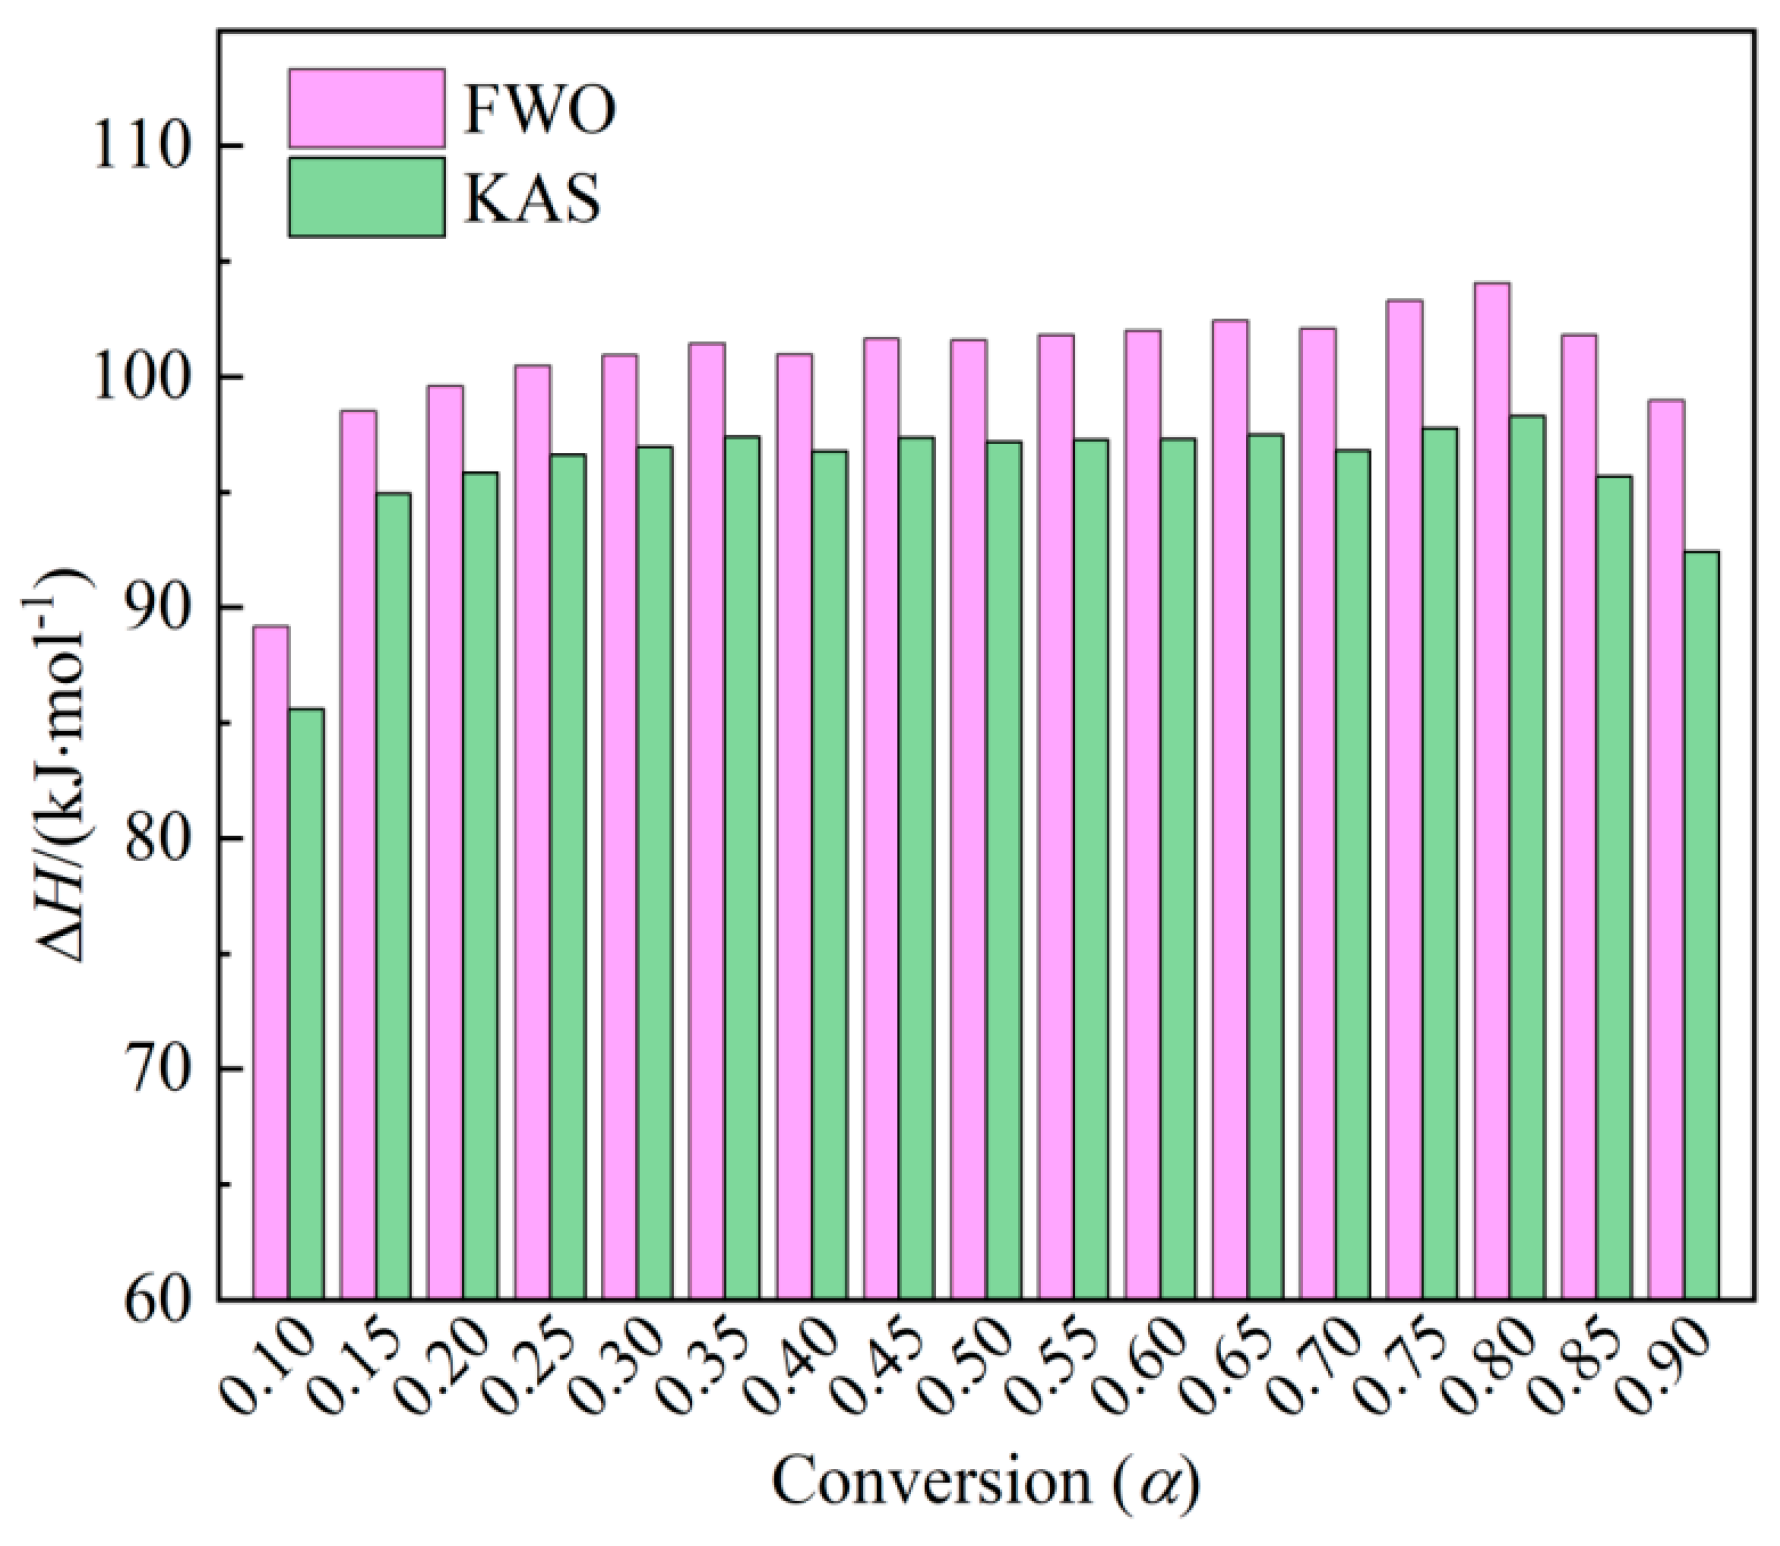
The reaction enthalpy (Δ𝐻) signifies the energy exchange in a chemical reaction or the energy necessary for the thermal degradation of the feedstock. Thevariation trend concerning conversion (
α) is depicted in
Figure 4. The calculated Δ𝐻 values range from 89.18 to 104.06 kJ/mol and 158.74 to 446.68 kJ/mol, with average values of 85.59 and 98.29 kJ/mol, respectively. All Δ𝐻 values corresponding to different degrees of conversion are positive, indicating the occurrence of endothermic reactions throughout the combustion process. The difference between Δ𝐻 and 𝐸
𝑎 values, lower than ±6 kJ/mol, reflects the potential energy barrier in the process for the formation of activated complexes [
39].
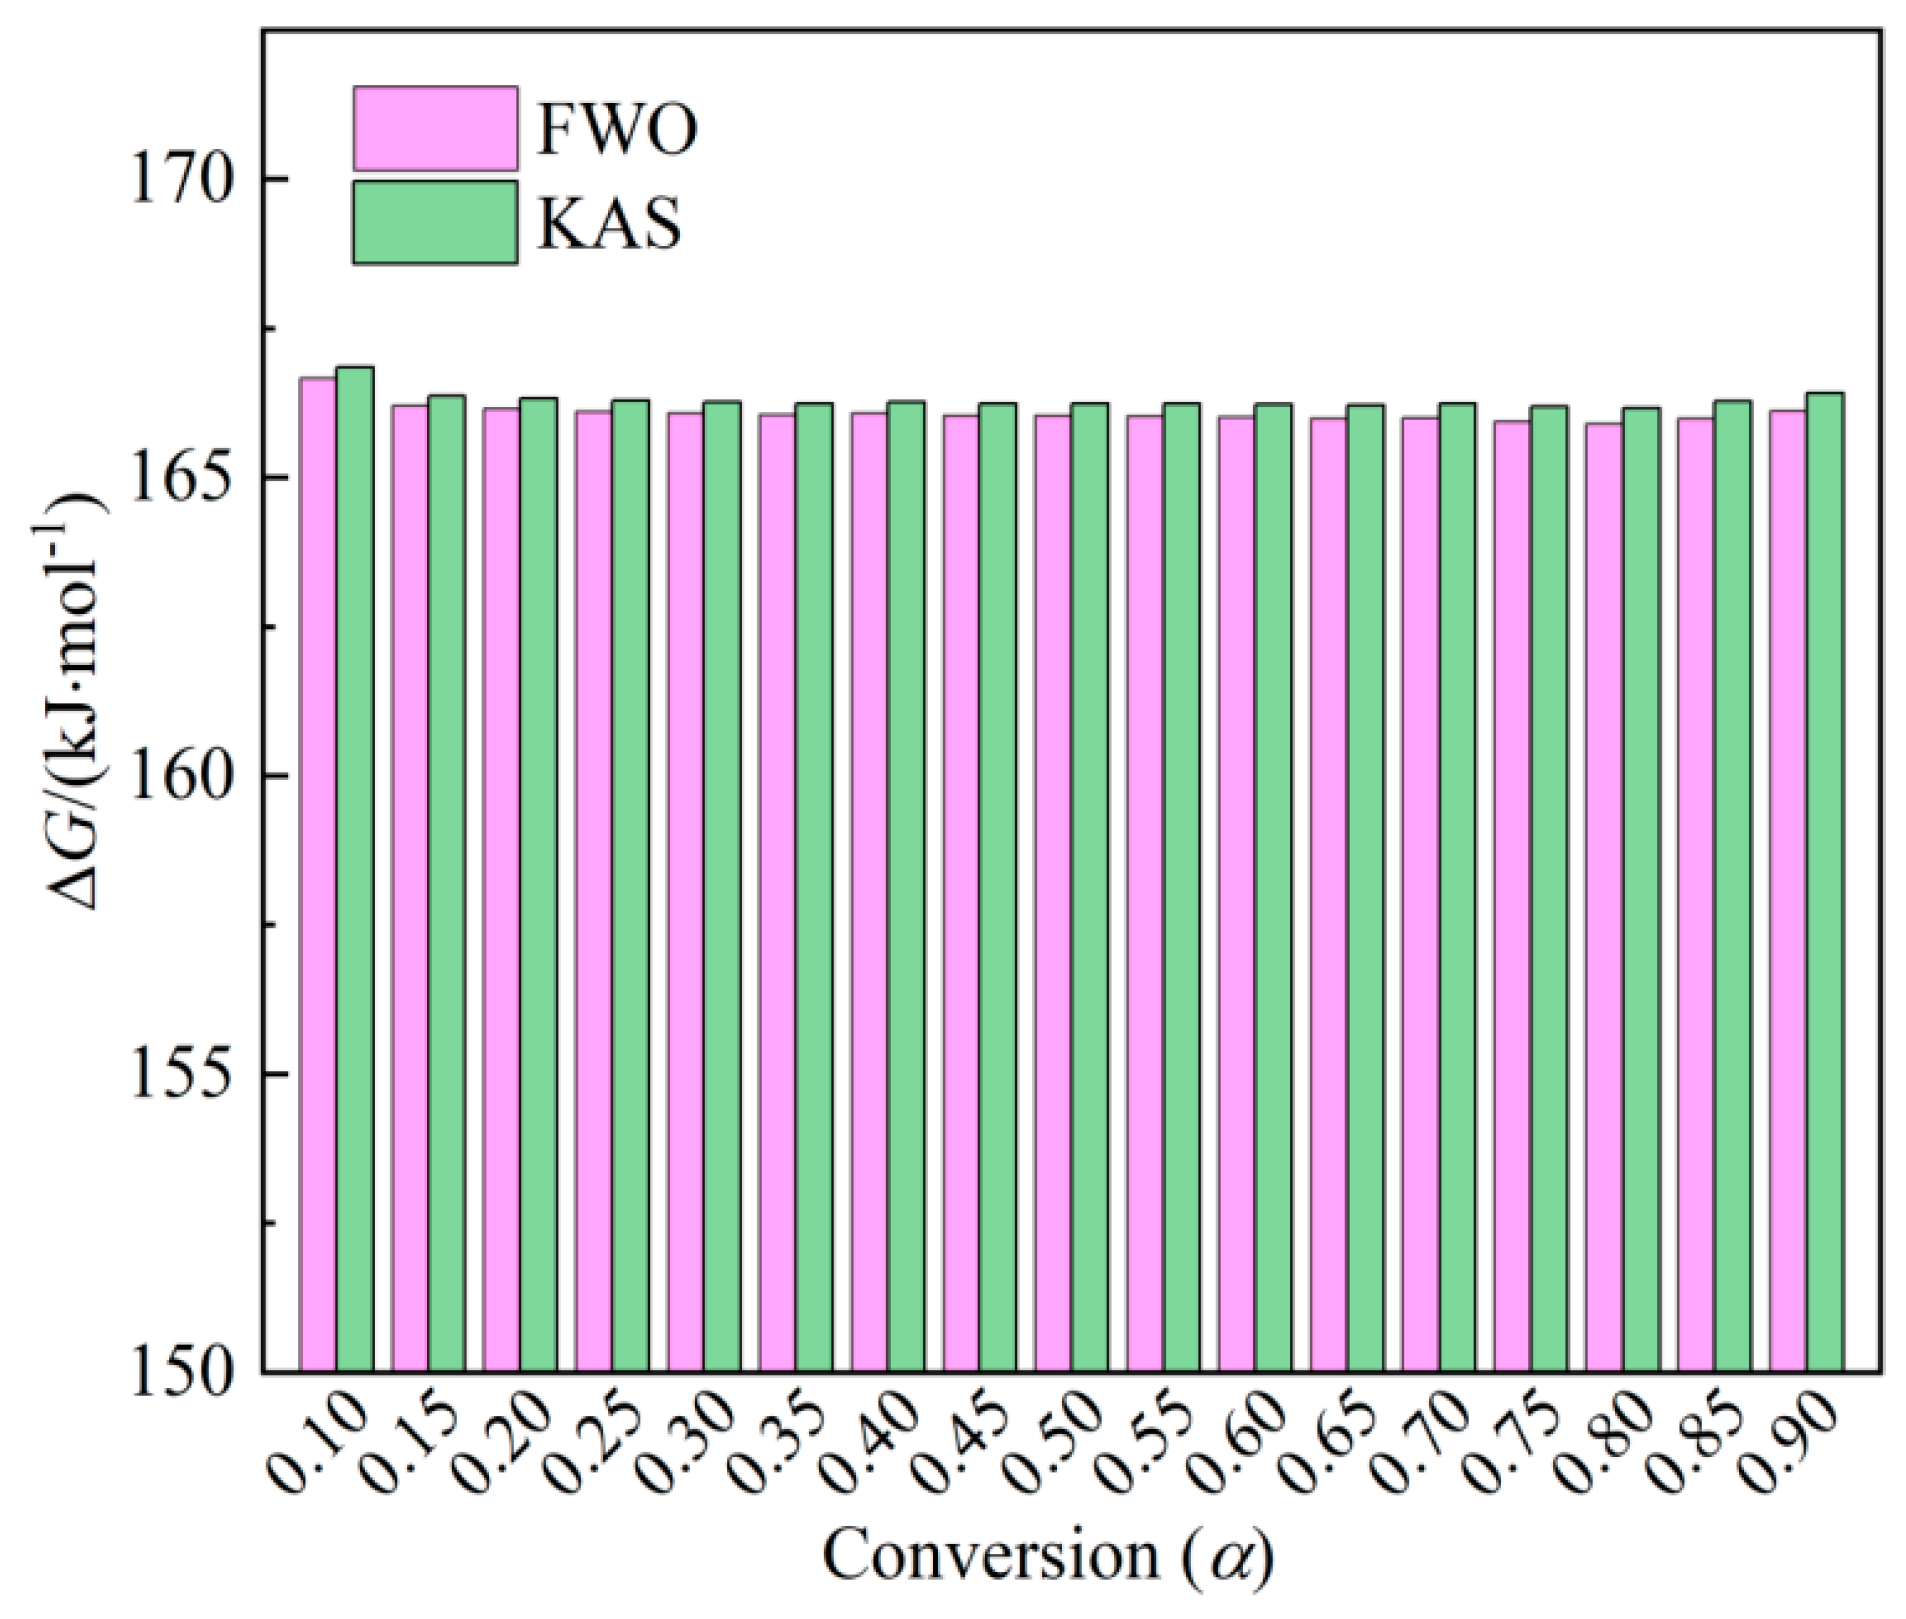
Gibbs free energy (Δ𝐺) reflects the difficulty and direction of reactions and the total energy of the system, where a higher Δ𝐺 value indicates lower reaction favorability.
Figure 5 illustrates the variations concerning conversion (α). The Δ𝐺 values calculated by the FWO and KAS methods range from 165.90 to 166.66 kJ/mol and 166.16 to 166.85 kJ/mol. The average values of Δ𝐺 for the thermal combustion of peanut shell are 166.08 kJ/mol for FWO and 166.29 kJ/mol for KAS, respectively. Δ𝐺 values at different conversions are all positive, suggesting non-spontaneous reactions in peanut shell combustion. Moreover, the values of Δ𝐺 vary within ±1 kJ/mol corresponding to each conversion (
α), indicating that the peanut shell maintains a stable energy output throughout the combustion process.
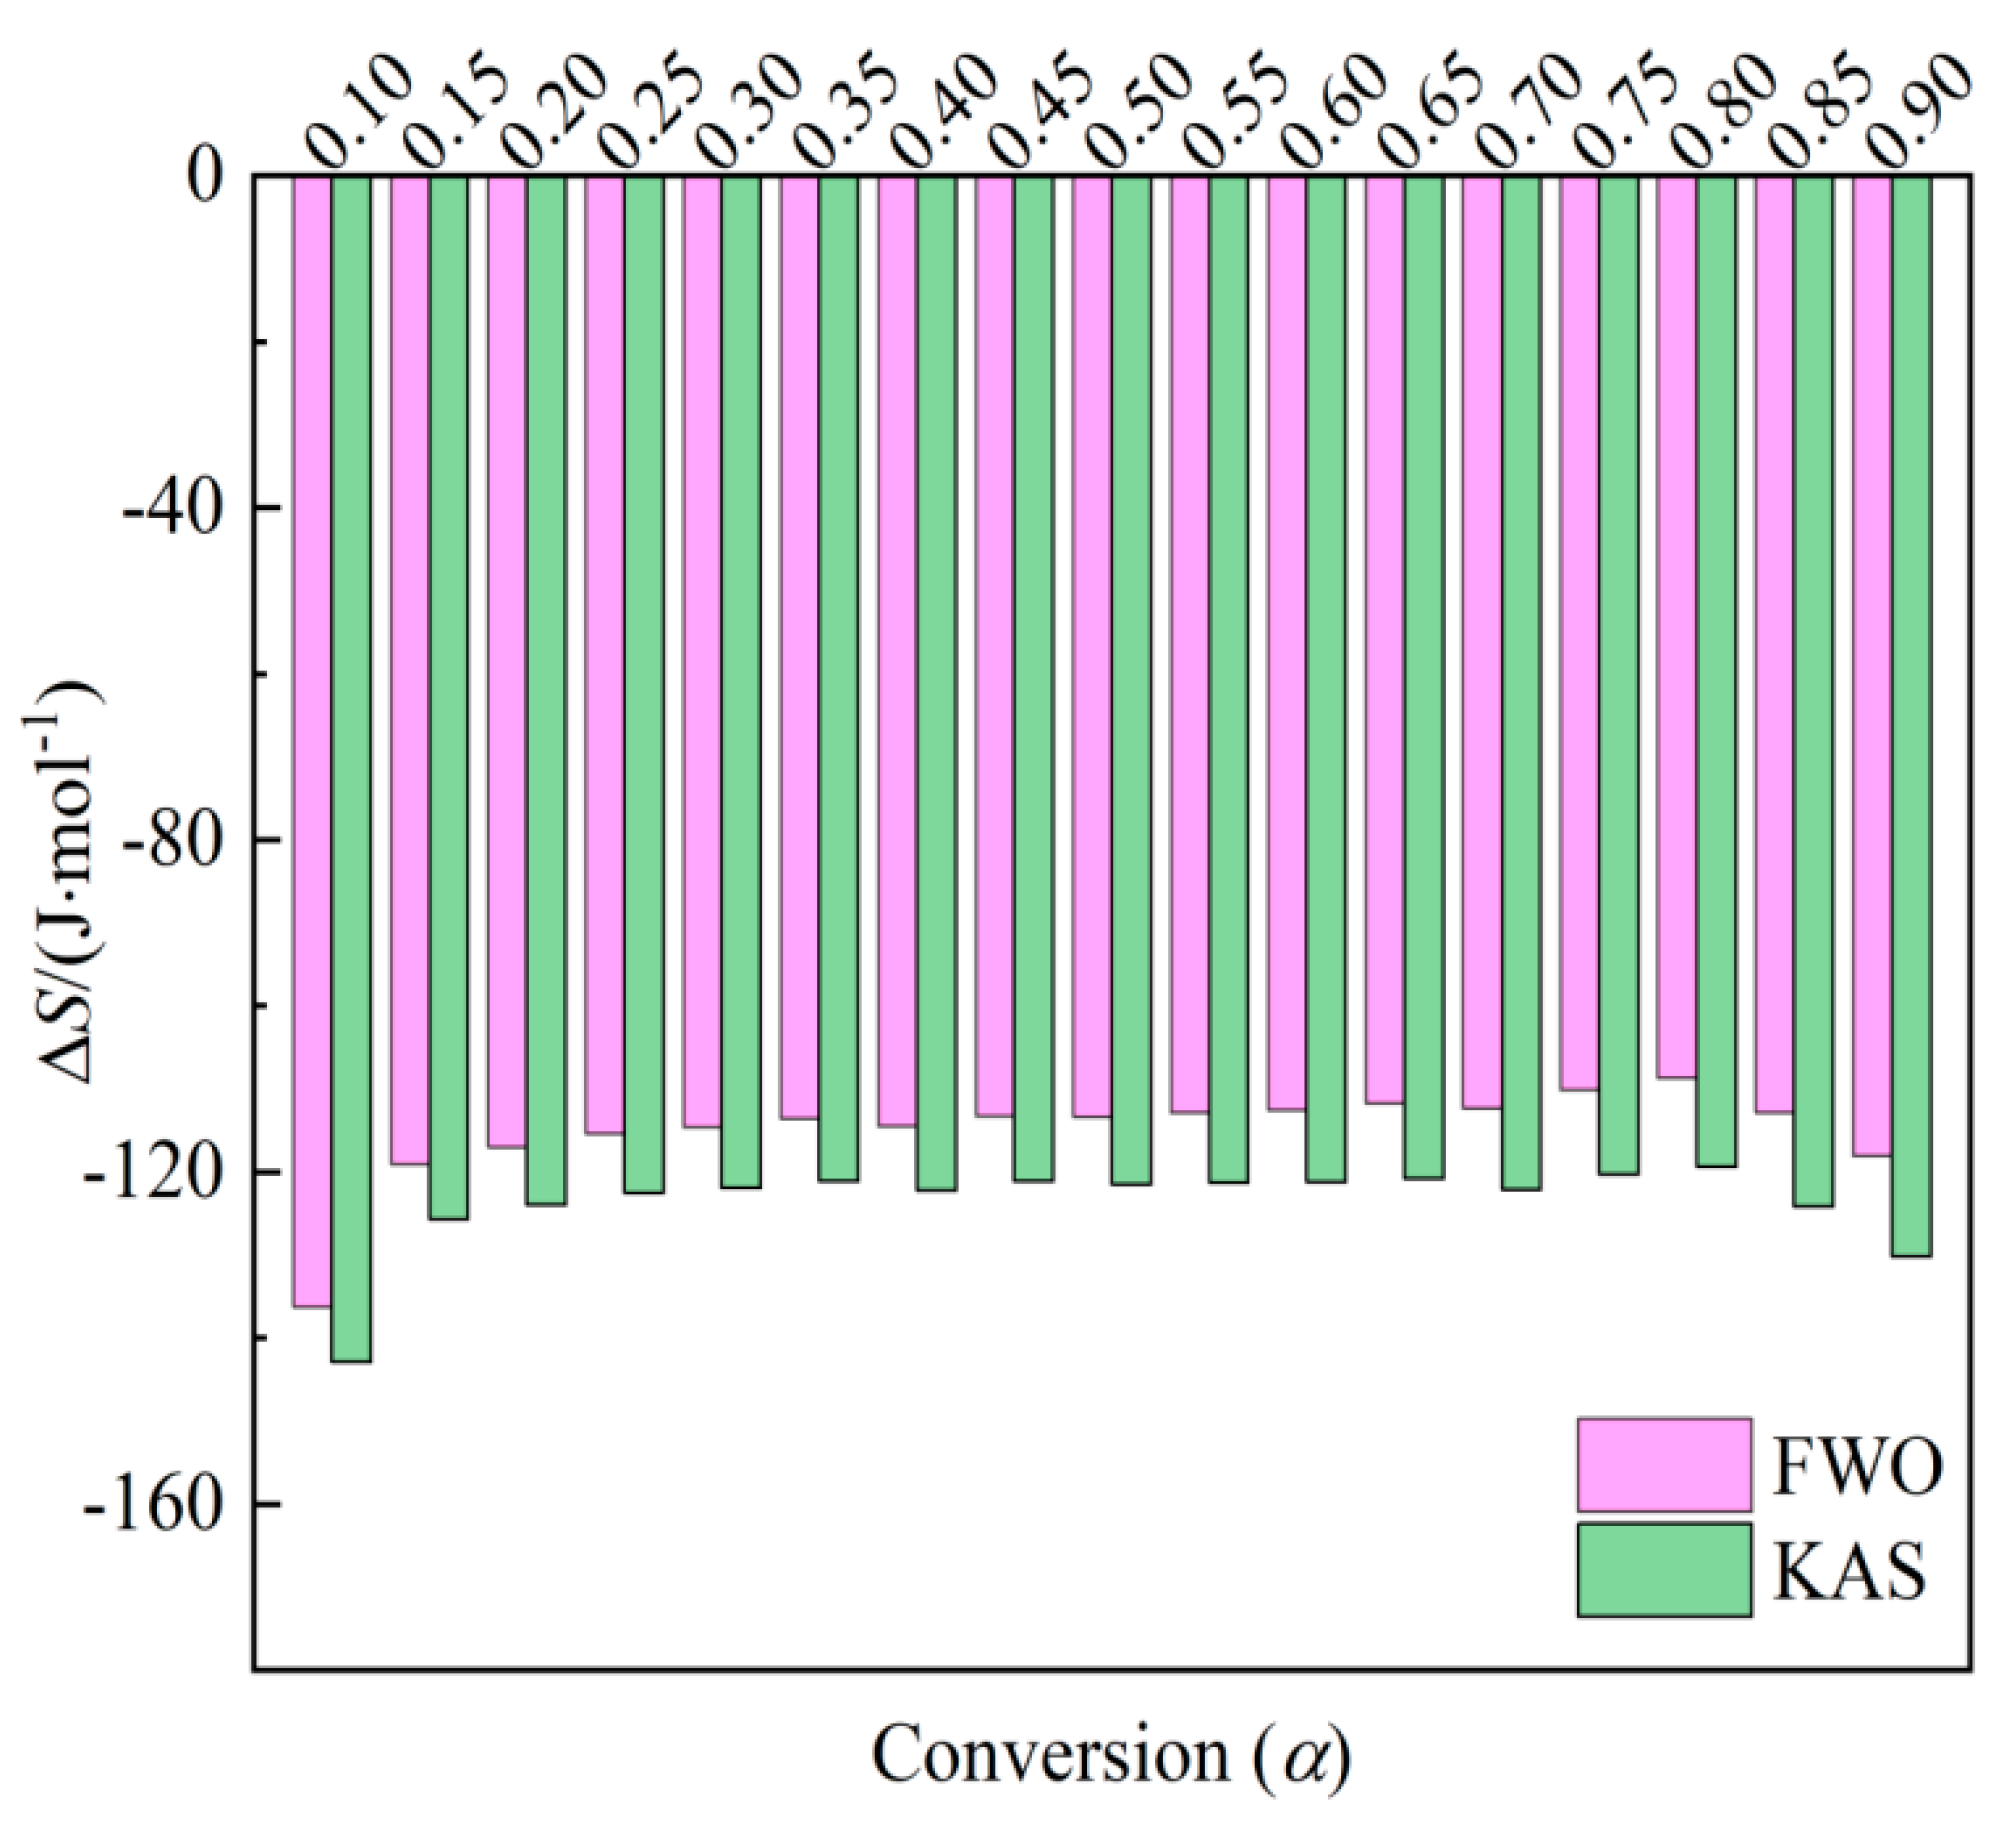
Entropy (Δ𝑆) is an indicator reflecting the degree of system disorder, with reaction systems exhibiting low Δ𝑆values more readily reaching thermodynamic equilibrium.
Figure 6 reveals thatthe entropy changes calculated by the FWO and KAS methods range from -136.27 to -108.75 J/(mol×K) and -142.91 to -119.37 J/(mol×K), respectively. Δ𝑆 for peanut shell falls within the negative range of -136.27 to -108.75 J/(mol×K) and -142.91 to -119.37 J/(mol×K) across the conversion range of 0.10–0.90, indicating proximity to thermodynamic equilibrium [
40]. This range corresponds to volatile combustion and fixed carbon combustion, where a thermally stable product is produced and the degree of disorder in the products is lower than that in the reactants.
4. Conclusions
This study usesthermogravimetric analysis (TGA) to investigatecombustion characteristics and kinetics at three different heating ratesunder atmospheric air for peanut shell. Meanwhile, the thermodynamicsparameters are obtained based on the activation energy (Eα) and pre-exponential factor (A) at the heating rate of 10 K/min. The main achievements can be summarizedas follows:
(1) The combustion of peanut shell is mainly divided into three stages: water evaporation, volatile and fixed carbon combustion, and burnout stage. As theheating rate increases, the combustion characteristics temperatureof peanut shell transitions to a high-temperaturezone. Meanwhile, the combustion performance parameters analysis of volatile matter release (Dv), ignition index (Di), burnout index (Db), combustion intensity (Hf), combustion stability index (Dsi), and comprehensive combustibility (S) indicate that the heating rate has obvious influence on the combustion performance parameters, a higher heating rate could intensify and improve the combustion performance.
(2) Activation energy (Eα) determined through the FWO and KAS model-free methods falls within the range of 93.30 to 109.65 kJ/mol and 89.72 to 103.88 kJ/mol, respectively, with average values of 105.60 kJ/mol and 100.93 kJ/mol. All correlations exhibit statistical adequacy, with coefficient of determination values (R2) ranging from 0.9901 to 1.0. Notably, all values of pre-exponential factor (A) are below 109 s–1, suggesting that the combustion process of peanut shell primarily includes surface reactions associated with a closed complex.
(3) The thermodynamic analysis reveals thatthe difference between ΔH and Eα values is within ±6 kJ/mol, suggesting a favorable formation of the activated complex due to the low potential energy barrier. Additionally, the ΔG values fluctuate within ±1 kJ/mol for each conversion rate, indicating a stable energy output throughout the combustion process. Furthermore, all ΔS values are negative, indicating a tendency towards thermodynamic equilibrium. The results indicate that the combustion of peanut shell was an endothermic and non-spontaneous process, and more homogeneous or well-ordered products are generated with the progress of combustion.
Author Contributions
Conceptualization, J.L.; methodology, J.L. and X.L.; formal analysis, J.L. and Y.F.; investigation, X.L.; data curation, B.X. and Z.L.; writing—original draft preparation, J.L.; writing—review and editing, J.L. and X.L.; supervision, Y.F. All authors have read and agreed to the published version of the manuscript.
Funding
This research was funded by the Opening Foundation of The State Key Laboratory of Refractories and Metallurgy (Wuhan University of Science and Technology), grant number G202208, and the Joint Supported by Hubei Provincial Natural Science Foundation and Huangshi of China, grant number 2023AFD010.
Institutional Review Board Statement
Not applicable.
Informed Consent Statement
Not applicable.
Data Availability Statement
Not applicable.
Acknowledgments
The authors gratefully acknowledge the resources partially provided by the State Key Laboratory of Refractories & Metallurgy, Wuhan University of Science and Technology.
Conflicts of Interest
The authors declare no conflict of interest.
References
- Al-Hamamre, Z.; Saidan, M.; Hararah, M.; Rawajfeh, K.; Alkhasawneh, H.E.; Al-Shannag, M. Wastes and Biomass Materials as Sustainable-renewable Energy Resources for Jordan. Renew. Sustain. Energy Rev. 2017, 67, 295–314. [CrossRef]
- Sagastume Gutiérrez, A.; Cabello Eras, J.J.; Hens, L.; Vandecasteele, C. The Energy Potential of Agriculture, Agroindustrial, Livestock, and Slaughterhouse Biomass Wastes Through Direct Combustion and Anaerobic Digestion. The Case of Colombia. J. Clean. Prod. 2020, 269, 122317. [CrossRef]
- Demirbaş, A. Biomass Resource Facilities and Biomass Conversion Processing for Fuels and Chemicals. Energy Convers. Manag. 2001, 42, 1357–1378. [CrossRef]
- Yang, C; Kwon, H.; Bang, B.; Jeong, S.; Lee, U. Role of Biomass as Low-carbon Energy Source in the Era of Net Zero Emissions. Fuel 2022, 328, 125206. [CrossRef]
- Wang, R.; Song, X.L.; Liu, S.J.; Liu, Z.W. Research on Co-Combustion Behaviors of Binary and Ternary Blends of Coal, Walnut Shell, and Biochar by TGA. Processes 2022, 10, 2264. [CrossRef]
- Zhao, X.;Ma, X.W.;Chen, B.Y.;Shang, Y.P.;Song, M.H. Challenges Toward Carbon Neutrality in China: Strategies and Countermeasures. Resour. Conserv. Recy. 2022, 176, 105959. [CrossRef]
- Li, W; Zhang, S.H.; Lu, C. Exploration of China’s Net CO2 Emissions Evolutionary Pathways by 2060 in the Context of Carbon Neutrality. Sci. Total Environ. 2022, 831, 154909. [CrossRef]
- Wang,Y.B.; Wang, X.B.; Tan,H.Z.; Du, W.Z.; Qu, X.D. Extraction and Quantitation of Various Potassium Salts in Straw Ash. Environ. Prog. Sustain. Energy 2015, 34, 333–338. [CrossRef]
- Yang, B.L.; Zhang, C.X.; Zhang, X.J.; Wang, G.; Li, L.; Geng, H.R.; Liu, Y. Survey of Aflatoxin B1 and Heavy Metal Contamination in Peanut and Peanut Soil in China during 2017–2018. Food Control 2020, 118, 107372. [CrossRef]
- Lang, Q.Q.; Liu, Z.G.; Li, Y.F.; Xu, J.X.; Li, J.J.; Liu, B.S.; Sun, Q.P. Combustion Characteristics, Kinetic and Thermodynamic Analyses of Hydrochars Derived from Hydrothermal Carbonization of Cattle Manure. J. Environ. Chem. Eng. 2022, 10, 106938. [CrossRef]
- Alves, J.L.F.; da Silva, J.C.G.; Sellin, N.; Prá, F. de B.; Sapelini, C.; Souza, O.; Marangoni, C. Upgrading of Banana Leaf Waste to Produce Solid Biofuel by Torrefaction: Physicochemical Properties, Combustion Behaviors, and Potential Emissions. Environ. Sci. Pollut. Res. 2022, 29, 25733–25747. [CrossRef]
- Mahmood, H.; Shakeel, A.; Abdullah, A.; Khan, M.I.; Moniruzzaman, M. A Comparative Study on Suitability of Model-Free and Model-Fitting Kinetic Methods to Non-Isothermal Degradation of Lignocellulosic Materials. Polymers 2021, 13, 2504. [CrossRef]
- Du, W.Z.; Wang, G.; Wang, Y.; Liu, X.L. Thermal Degradation of Bituminous Coal with Both Model-Free and Model-Fitting Methods. Appl. Therm. Eng. 2019, 152, 169–174. [CrossRef]
- Vyazovkin, S.; Wight, C. A. Model-free and Model-fitting Approaches to Kinetic Analysis of Isothermal and Nonisothermal Data. Thermochim. Acta 1999, 340, 53–68. [CrossRef]
- Kalak, T. Potential Use of Industrial Biomass Waste as a Sustainable Energy Source in the Future. Energies 2023, 16, 1783. [CrossRef]
- Zhang, Y.Y.; Cuo, Y.X.; Cheng, F.Q.; Yan, K.Z.; Cao, Y. Investigation of Combustion Characteristics and Kinetics of Coal Gangue with Different Feedstock Properties by Thermogravimetric Analysis. Thermochim. Acta 2015, 614, 137−148. [CrossRef]
- Deng, S.H.; Wang, X.B.; Tan, H.Z.; Mikulčić, H.; Yang, F.X.; Li, Z.F.; Duić, N. Thermogravimetric Study on the Co-Combustion Characteristics of Oily Sludge with Plant Biomass. Thermochim. Acta 2016, 633, 69–76. [CrossRef]
- Liu, X.; Chen, M.; Yu, D. Oxygen Enriched Co-combustion Characteristics of Herbaceous Biomass and Bituminous Coal. Thermochim. Acta 2013, 569, 17–24. [CrossRef]
- Chen, J.B.; Mu, L.; Cai, J.C.; Yao, P.K.; Song, X.G.; Yin, H.C.; Li, A.M. Pyrolysis and Oxy-Fuel Combustion Characteristics and Kinetics of Petrochemical Wastewater Sludge Using Thermogravimetric Analysis. Bioresour. Technol. 2015, 198, 115–123. [CrossRef]
- Wang, G.W.; Zhang, J.L.; Shao, J.G.; Jiang, Y.K.; Gao, B.; Zhao, D.; Liu, D.H.; Wang, H.Y.; Liu, Z.J.; Jiao, K.X. Experiments and Kinetic Modeling for the Oxidative Decomposition of Herbaceous and Wooden Residues. BioResources 2016, 11, 4821–4838. [CrossRef]
- Tang, L.; Xiao, J.; Mao, Q.Y.; Zhang, Z.H.; Yao, Z.; Zhu, X.D.; Ye, S.C.; Zhong, Q.F. Thermogravimetric Analysis of the Combustion Characteristics and Combustion Kinetics of Coals Subjected to Different Chemical Demineralization Processes. ACS Omega 2022, 7, 13998–14008. [CrossRef]
- Vyazovkin, S.; Chrissafis, K.; Di Lorenzo, M.L.; Koga, N.; Pijolat, M.; Roduit, B.; Sbirrazzuoli, N.; Suñol, J.J. ICTAC Kinetics Committee Recommendations for Collecting Experimental Thermal Analysis Data for Kinetic Computations. Thermochim. Acta 2014, 590, 1–23. [CrossRef]
- Flynn, J.H. The “Temperature Integral”–Its Use and Abuse. Thermochim. Acta 1997, 300, 83–92. DOI:0.1016/S0040-6031(97)00046-4.
- Ozawa, T.A. A New Method of Analyzing Thermogravimetric Data. B. Chem. Soc. Jpn. 1965, 38, 1881–1886. [CrossRef]
- Ahmad, M.S.; Mehmood, M.A.; Ayed, O.S. Kinetic Analyses and Pyrolytic Behavior of Para Grass (Urochloa mutica) for Its Bioenergy Potential. Bioresour. Technol. 2017, 224, 708–713. [CrossRef]
- Alves, J.L.F.; Da Silva, J.C.G.; da Silva Filho, V.F.; Alves, R.F.; Ahmad, M.S.; Ahmad, M.S.; Galdino, W.V. de A.; De Sena, R.F. Bioenergy Potential of Red Macroalgae Gelidium Floridanum by Pyrolysis: Evaluation of Kinetic Triplet and Thermodynamics Parameters. Bioresour. Technol. 2019, 291, 121892. [CrossRef]
- Chen, R.Y.; Li, Q.W.; Xu, X.K.; Zhang, D.D.; Hao, R.L. Combustion Characteristics, Kinetics and Thermodynamics of Pinus Sylvestris Pine Needle via Non-isothermal Thermogravimetry Coupled with Model-free and Model-fitting Methods. Case Stud. Therm. Eng. 2020, 22, 100756. [CrossRef]
- Cai, H.M.; Zou, H.H.; Liu, J.Y.; Xie, W.M.; Kuo, J.H.; Buyukada, M.; Evrendilek, F. Thermal Degradations and Processes of Waste Tea and Tea Leaves via TG-FTIR: Combustion Performances, Kinetics, Thermodynamics, Products and Optimization. Bioresour. Technol. 2018, 268, 715–725. [CrossRef]
- Cao, W.H.; Li, J.; Martí-Rosselló, T.; Zhang, X.L. Experimental Study on the Ignition Characteristics of Cellulose, Hemicellulose, Lignin and Their Mixtures. J. Energy Inst. 2019, 92, 1303–1312. [CrossRef]
- Qiao, Y.Y.; Wang, B.; Ji, Y.Y.; Xu, F.; Zong, P.J.; Zhang, J.H.; Tian, Y.Y. Thermal Decomposition of Castor Oil, Corn Starch, Soy Protein, Lignin, Xylan, and Cellulose during Fast Pyrolysis. Bioresour. Technol. 2019, 278, 287–295. [CrossRef]
- Vamvuka, D.; Sfakiotakis, S. Combustion Behaviour of Biomass Fuels and Their Blends with Lignite. Thermochim. Acta 2011, 526, 192–199. [CrossRef]
- Çakman, G. Pyrolysis of Euphorbia Rigida: A Study on Thermal Characterizations, Kinetics, Thermodynamics via TG-FTIR Analysis. J. Environ. Manage. 2024, 357, 120835. [CrossRef]
- Yu, D.; Chen, M.Q. Oxygen Enriched Co-combustion of Biomass and Bituminous Coal. Energy Sources, Part A Recover. Util. Environ. Eff. 2016, 38, 994–1001. [CrossRef]
- Jia, G.H. Combustion Characteristics and Kinetic Analysis of Biomass Pellet Fuel Using Thermogravimetric Analysis. Processes 2021, 9, 868. [CrossRef]
- Liao, X.J.; Singh, S.; Yang, H.P.; Wu, C.F.; Zhang, S.H. A Thermogravimetric Assessment of the Tri-Combustion Process for Coal, Biomass and Polyethylene. Fuel 2021, 287, 119355. [CrossRef]
- Mureddu, M.; Dessi, F.; Orsini, A.; Ferrara, F.; Pettinau, A. Air- and Oxygen-blown Characterization of Coal and Biomass by Thermogravimetric Analysis. Fuel 2018, 212, 626–637. [CrossRef]
- Chong, C.T.; Mong, G.R.; Ng, J.H.; Chong, W.W.F.; Ani, F.N.; Lam, S.S.; Ong, H.C. Pyrolysis Characteristics and Kinetic Studies of Horse Manure using Thermogravimetric Analysis. Energy Convers. Manag. 2019, 180, 1260–1267. [CrossRef]
- Ahmad, M.S.; Mehmood, M.A.; Taqvi, S.T.H.; Elkamel, A.; Liu, C.G.; Xu, J.; Rahimuddin, S.A.; Gull, M. Pyrolysis, Kinetics Analysis, Thermodynamics Parameters and Reaction Mechanism of Typha Latifolia to Evaluate Its Bioenergy Potential. Bioresour. Technol. 2017, 245, 491–501. [CrossRef]
- Patidar, K.; Singathia, A.; Vashishtha, M.; Sangal, V.K.; Upadhyaya, S. Investigation of Kinetic and Thermodynamic Parameters Approaches to Non-isothermal Pyrolysis of Mustard Stalk using Model-free and Master plots Methods. Mater. Sci. Energy Technol. 2022, 5, 6–14. [CrossRef]
- Petrovič, A.; Vohl, S.; Cenčič Predikaka, T.; Bedoić, R.; Simonič, M.; Ban, I.; Čuček, L. Pyrolysis of Solid Digestate from Sewage Sludge and Lignocellulosic Biomass: Kinetic and Thermodynamic Analysis, Characterization of Biochar. Sustainability 2021, 13, 9642. [CrossRef]
|
Disclaimer/Publisher’s Note: The statements, opinions and data contained in all publications are solely those of the individual author(s) and contributor(s) and not of MDPI and/or the editor(s). MDPI and/or the editor(s) disclaim responsibility for any injury to people or property resulting from any ideas, methods, instructions or products referred to in the content. |
© 2024 by the authors. Licensee MDPI, Basel, Switzerland. This article is an open access article distributed under the terms and conditions of the Creative Commons Attribution (CC BY) license (http://creativecommons.org/licenses/by/4.0/).
