1. Introduction
In the realm of additive manufacturing, particularly in the DED process, achieving precise control over weld seam geometry is one crucial factor for ensuring structural integrity and functional performance of fabricated components [
1]. To this end, understanding the intricate interplay between process parameters and resulting weld characteristics is indispensable. In this paper, we present comprehensive investigations focused on elucidating the effects of various machine parameters and specifically the temperature of the substrate on weld track geometry in DED processes. The experimental setup employed in this study integrates a specialized apparatus for heating of sample sheets within the workspace of the DMG MORI LT65 3D DED machine. This setup facilitates controlled thermal conditioning of the samples, essential for reproducible experimentation.
In previous studies [
2,
3,
4], researchers investigated the impact of temperature on DED processes. However, they did not address the broader scope covered in this work. Here, we focus on developing a comprehensive model to ensure consistent weld geometry across a wide substrate temperature range, up to 800 °C. Key process parameters including laser power, traversing speed, powder mass flow, and substrate temperature are therefore methodically altered to examine their influence on weld track geometry. Utilizing Design of Experiments (DoE) methods, a total of 360 individual weld marks are generated and analyzed. The geometric characteristics of each weld track, including height, width, dilution and contact angle, are assessed through incident light microscopy. Subsequently, the acquired data is employed to construct regression models, enabling the prediction of suiting machine parameters for a desired weld geometry at different substrate temperatures. Validation of the regression models is conducted through additional experiments, where machine parameters are determined based on target geometry specifications. Results of these validation experiments, along with their comparison to the specified values, provide insights into the accuracy and reliability of the regression models. Through this systematic investigation, we aim to enhance the understanding of the intricate relationships between process parameters and weld track geometry in DED processes. The findings presented herein offer valuable insights for optimizing DED process parameters to achieve desired weld characteristics, thereby advancing the capabilities and reliability of this additive manufacturing technology.
2. Materials and Methods
The following section of this work gives a brief introduction into the here used additive manufacturing technology DED. Finally, the experimental setup and procedures are explained.
2.1. Directed Energy Deposition (DED)
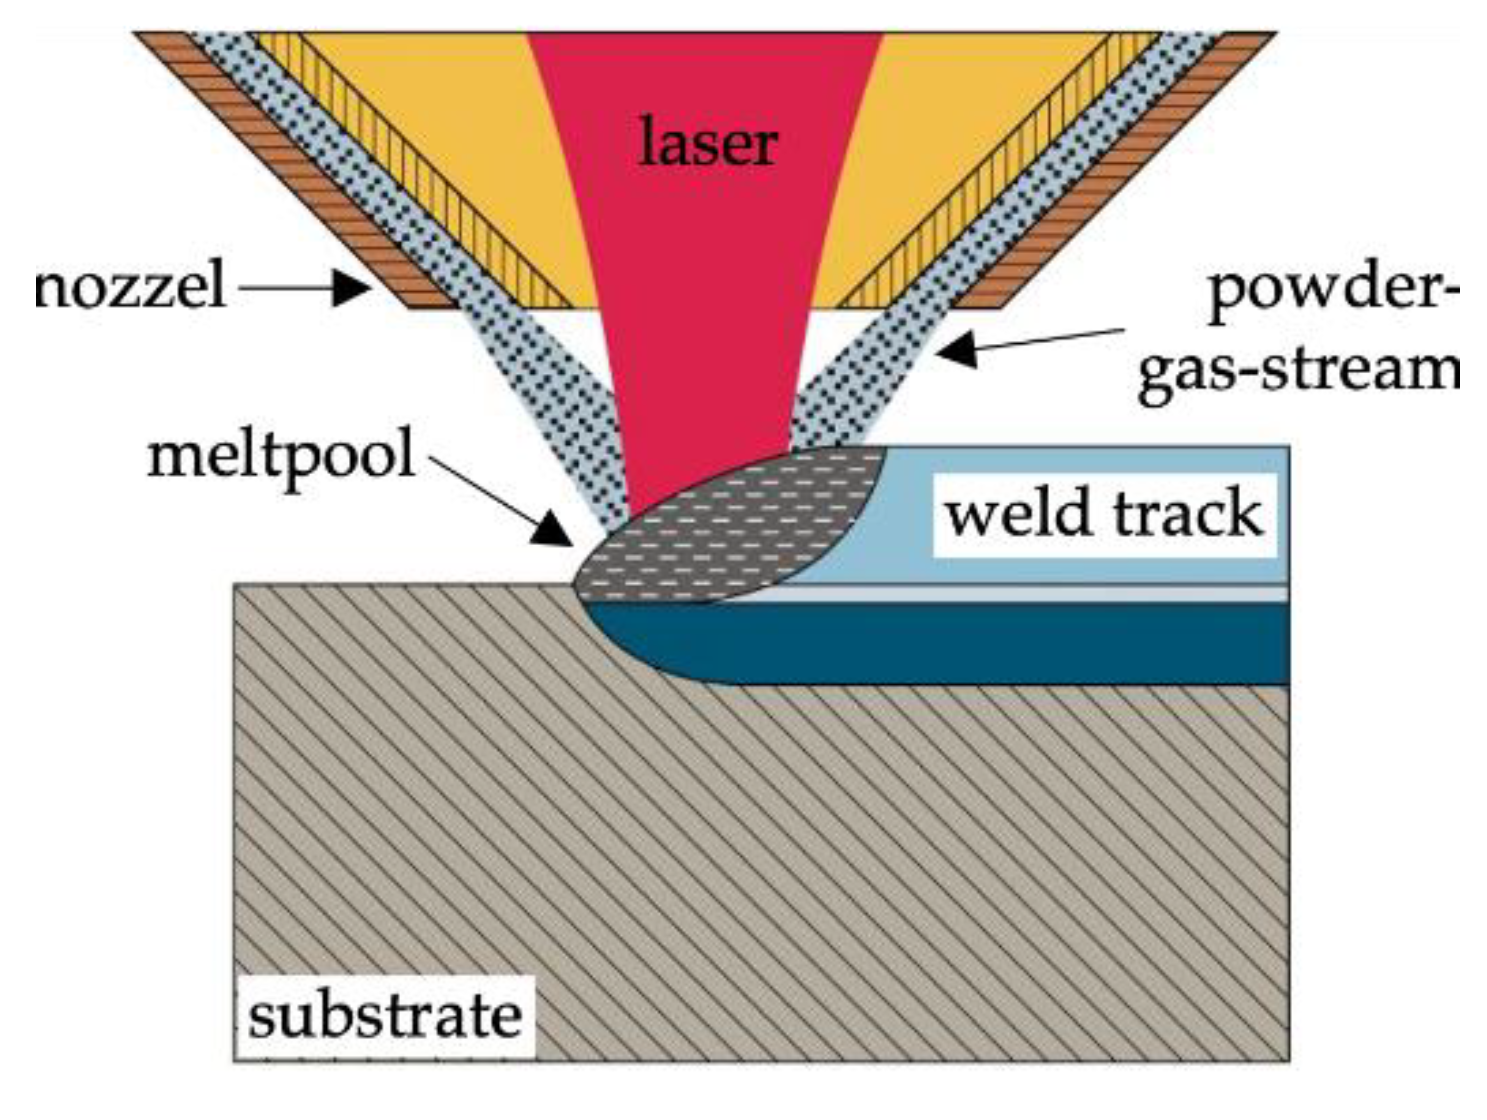
The DED process is characterized by the simultaneous delivery of powder and laser onto a substrate. As shown in
Figure 1, metal powder in the form of particles is carried within an inert gas flow through the channels of a coaxial nozzle. A laser heat source, directed through the inner opening of the nozzle, creates a locally allocated melt pool on a chosen substrate. The fine metal powder particles are then melted within the melt pool and fused to the substrate. By placing welds next to each other and stacking the created layers, a 3D object is created. Besides creating whole 3D parts, the process can also be used to repair high-value parts by, e.g., filling in worn-out regions of a die-cast tool. By facilitating special powder delivery systems, it is also possible to change or mix different powders during the process to create graded materials. The particle size of typically used powder in the DED process ranges between 50 and 150 μm [
5]. It should be noted that there is a variety of different names for the DED-Process in the literature [
6]. [
7] gives a good overview about the used terms in the literature for the interested reader.
Figure 1.
Schematics of the DED process [
5].
Figure 1.
Schematics of the DED process [
5].
2.2. Experimental Setup
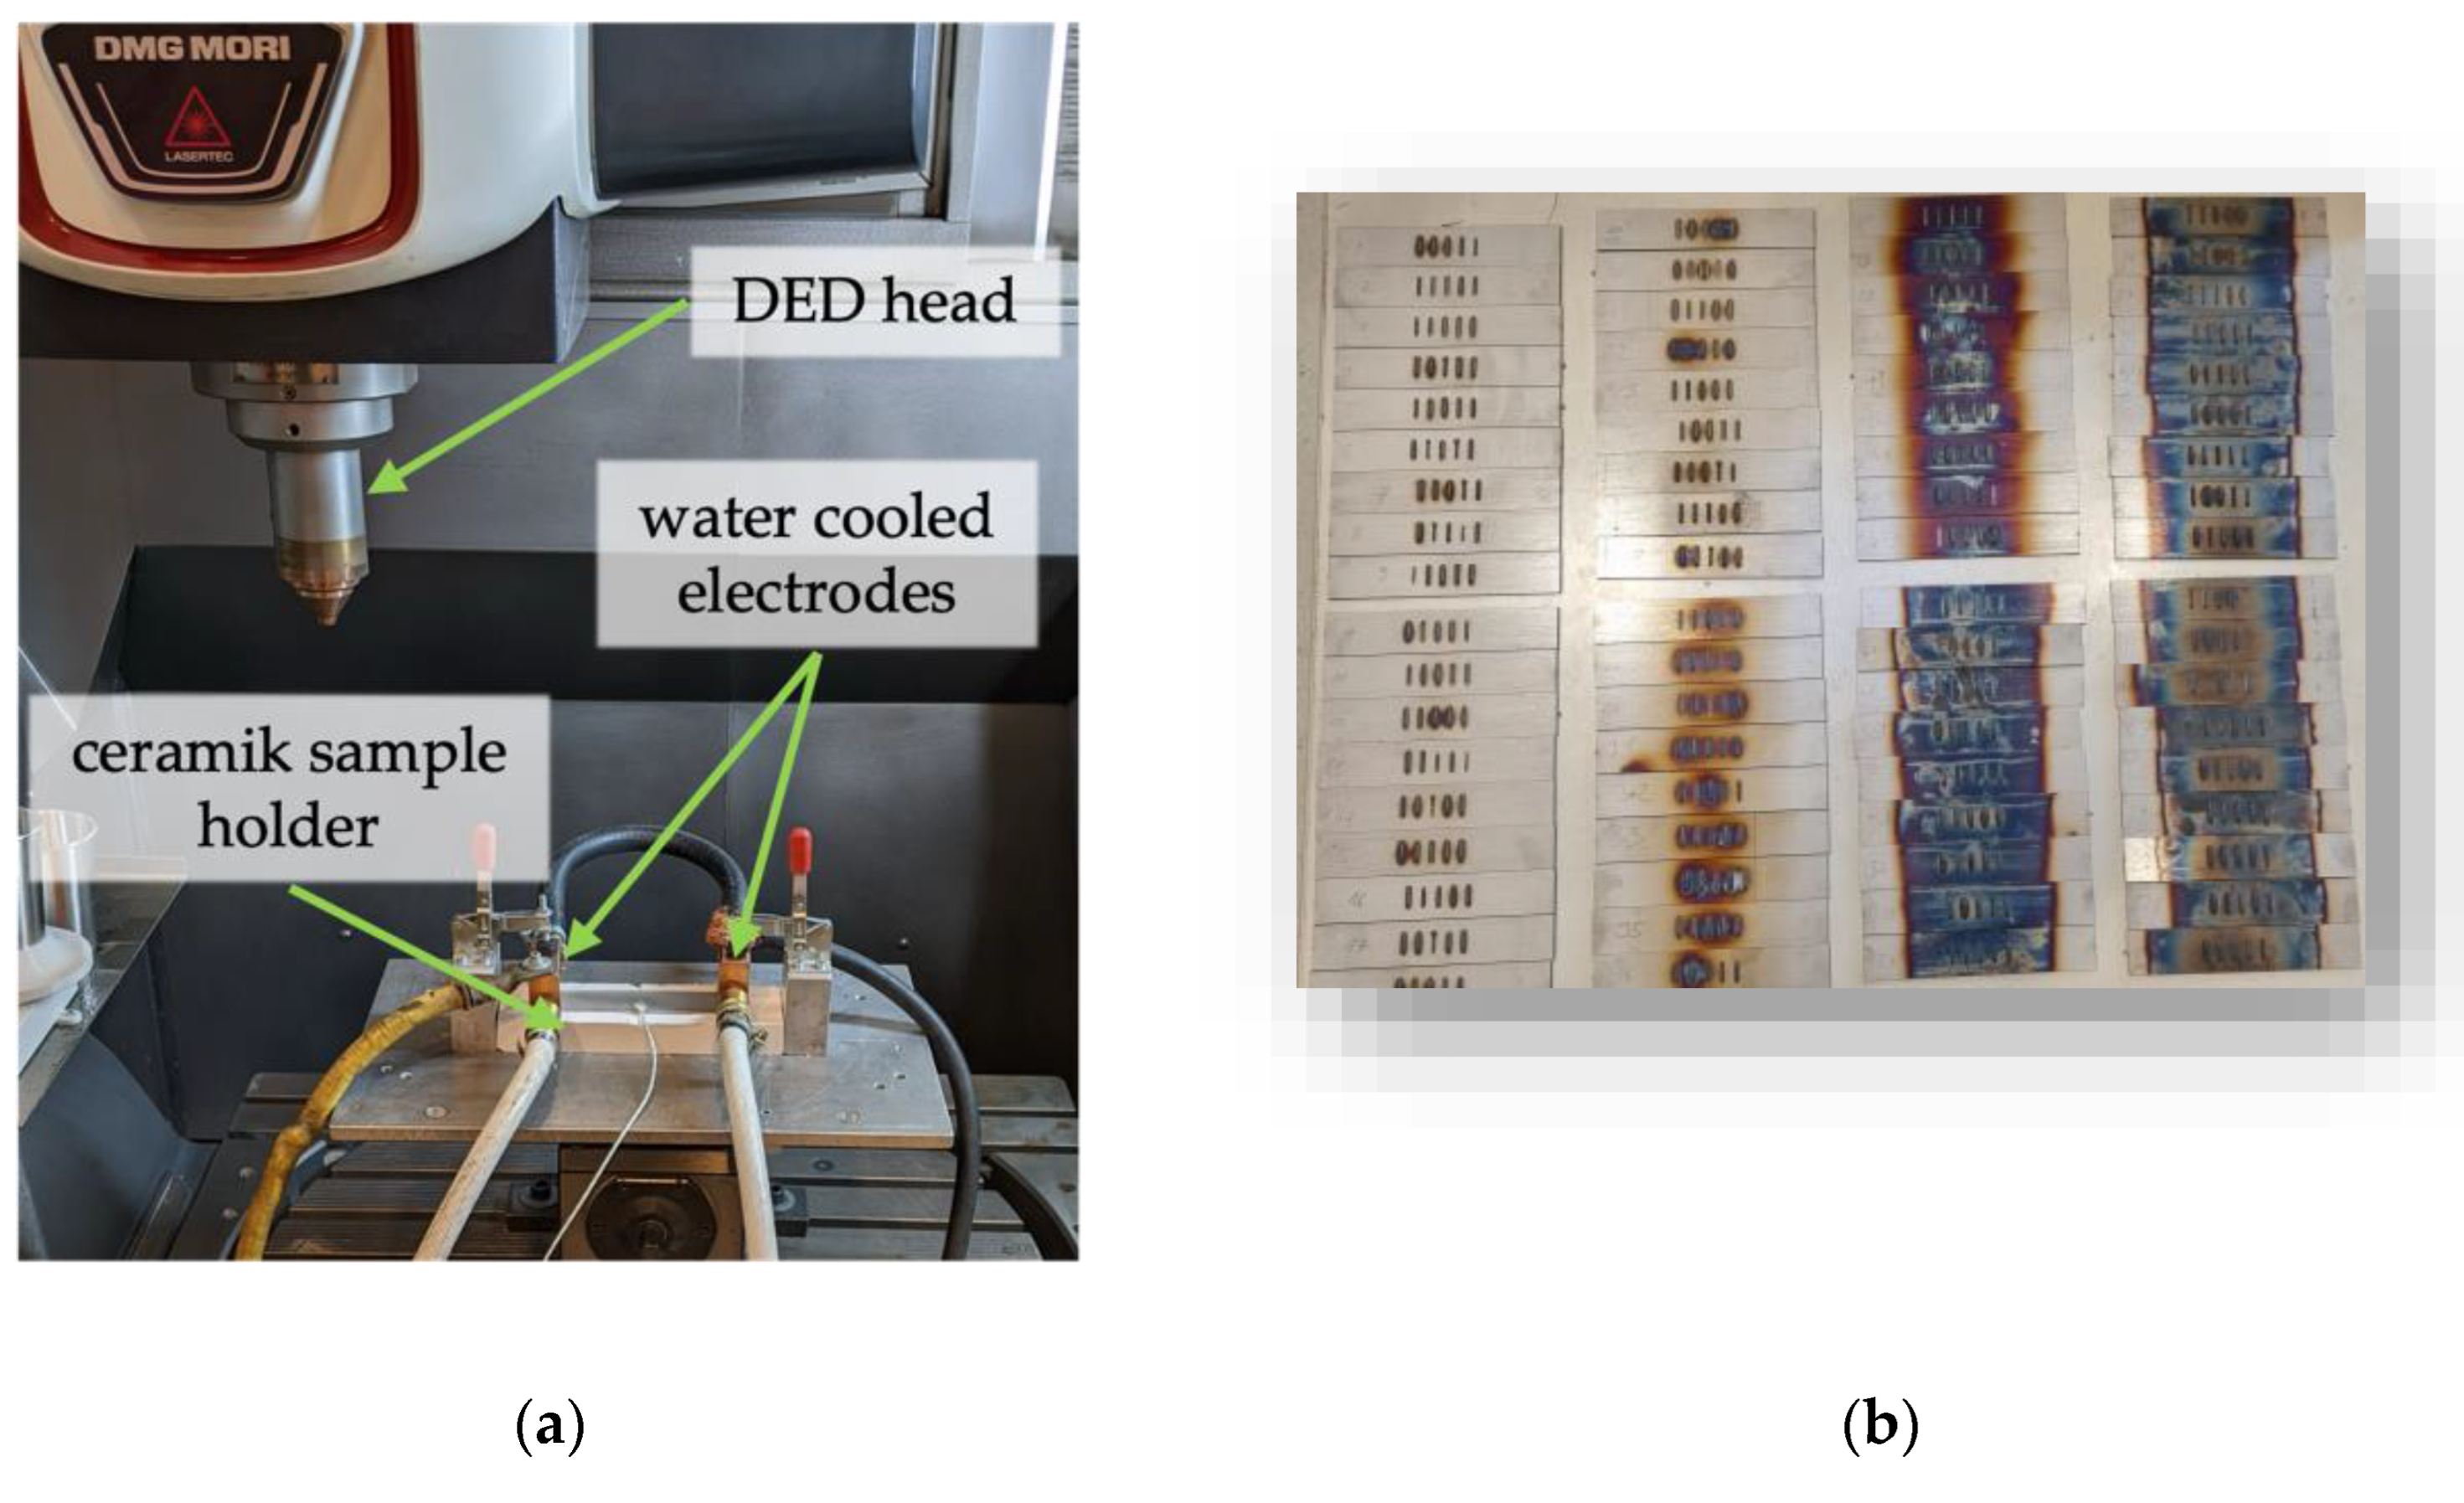
To conduct the experiments, a dedicated apparatus for precise heating of the samples was integrated within the workspace of the DMG MORI LT65 3D DED machine (see Figure 2a). This apparatus comprises a ceramic body designed to securely accommodate the sample sheets, thereby providing both thermal insulation and electrical isolation from the ambient environment. The sample sheets are affixed onto the ceramic body through the utilization of water-cooled electrodes, which are secured by toggle levers. Each sample sheet measures 30 x 170 x 3 mm and is composed of the material 1.4404. For resistive heating, a welding transformer delivering a peak current of 630 A at a voltage of 4.85 V was used. The temperature of the sample sheets was monitored utilizing an infrared camera (Optris Pl400i) in conjunction with a thermocouple. The used nozzle was the machines standard COAX14 AA13 nozzle.
Figure 2.
Experimental setup and samples: (a) experimental setup; (b) Samples sorted in ascending bins by substrate temperature in zig-zag-fashion (Start: Upper Left Corner → down → right & up).
Figure 2.
Experimental setup and samples: (a) experimental setup; (b) Samples sorted in ascending bins by substrate temperature in zig-zag-fashion (Start: Upper Left Corner → down → right & up).
2.3. Experimental Procedure
The experimental protocol commenced with the initiation of the welding program for the application of individual weld tracks, with the laser head positioned just prior to the starting point of the operation. Subsequently, the feed rate was manually adjusted to 0%, and the sample sheet was heated to approximately 50°C above the target temperature. Once the temperature of the sample sheet approached within a range of ±5°C of the target temperature, as determined through temperature measurements, the feed rate was reinstated to 100%, and the program execution was thereby initiated. Following the heating phase, five individual welding tracks, each measuring 20 mm in length, were deposited onto the preheated substrate under identical powder mass flow rate conditions. The parameters for the welding tracks were systematically varied as outlined below:
1. laser power in W: 500, 1000, 1500, 2000, 2500
2. traversing speed in mm/min: 400, 800, 1200
3. powder mass flow in g/min: 5, 12.5, 20
4. substrate temperature in °C: RT, 100, 200, 300, 400, 600, 800, 1000
The experimental setup as well as the experimental outcome is shown in Figure 1.
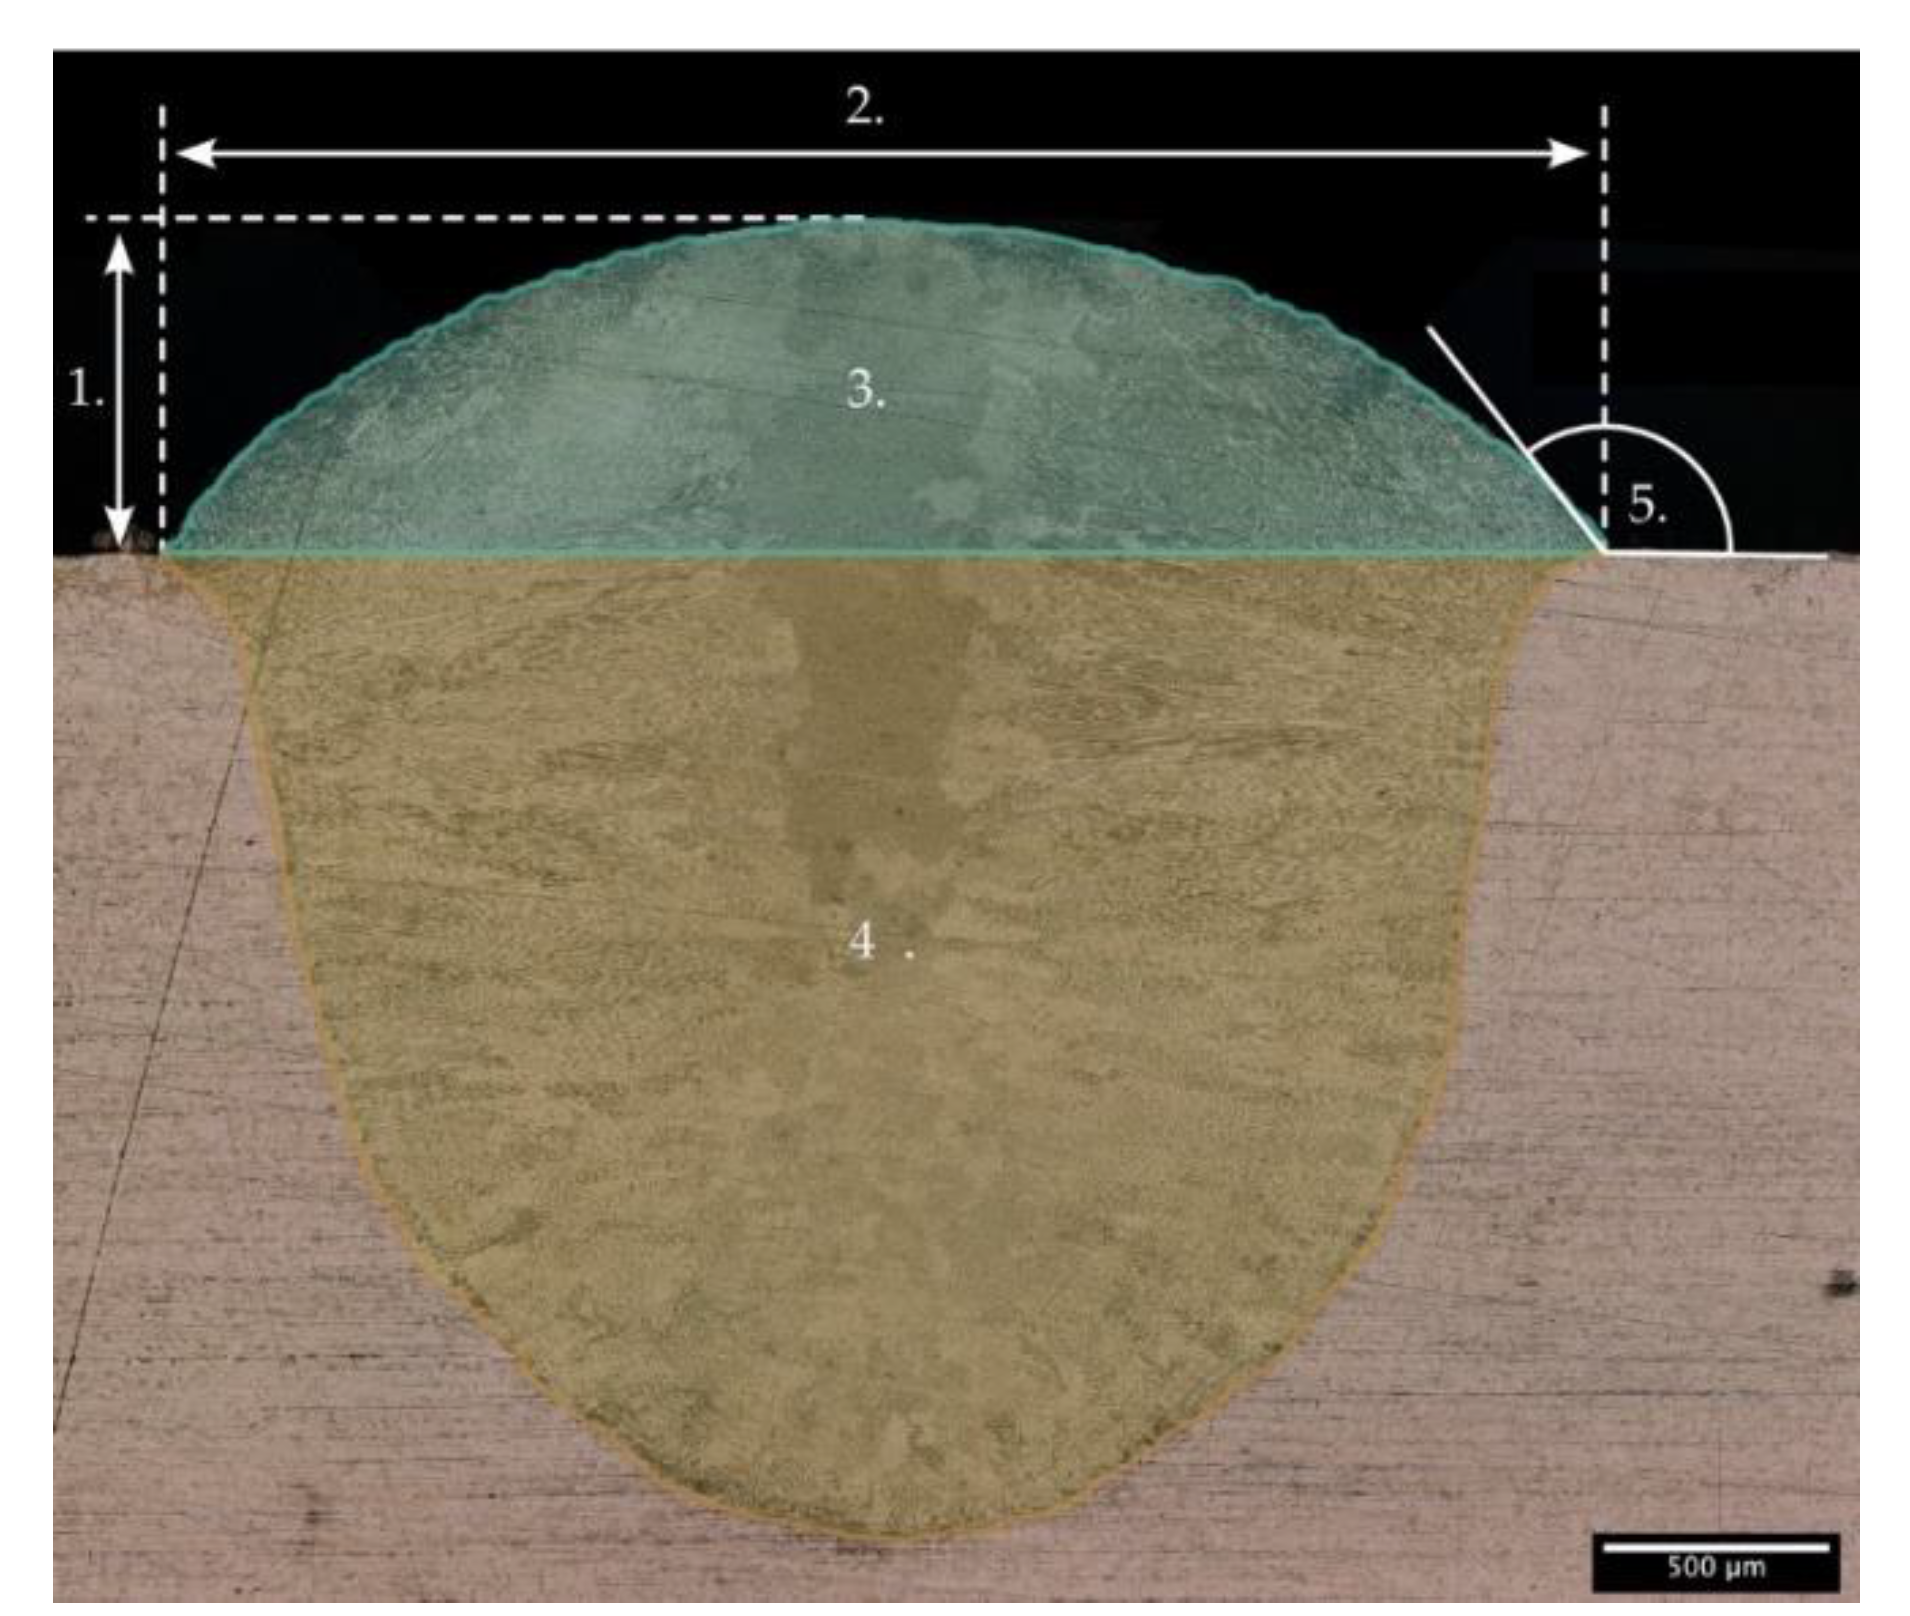
Using DoE-Methods, the parameters were combined and experiments with the chosen combinations were conducted. The resulting 360 individual weld marks were first separated orthogonal to the direction of application and embedded, ground, polished and etched using V2A etching component (hydrochloric acid fuming 37%: 500 ml/l, nitric acid >65%: 50 ml/l, Dr. Vogel’s economy etch: 1.5 ml/l) for further investigations. Stitched images of the weld track cross-section were then taken using an incident light microscope (Keyence digital microscope VHX5000) with 200 times magnification. This images then were used to determine the geometric characteristics analog to the literature [
2,
8,
9,
10,
11] as shown in
Figure 2.
The data obtained was then used to create a regression model to make specific predictions about the machine parameters required for different desired geometric characteristics. The ones chosen were bead width and height, dilution and contact angle of individual weld seams at different substrate temperatures. The contact angle has been measured at both sides of the weld and used to form a mean value. To approximate the level of dilution the ratio between the area of the molten substrate Material (4.) and the total area of molten material (3. + 4.) is used.
The “Minitab 2018” software was then used to create regression functions. The boundary conditions are defined as follows:
Responses
Travel speed Laser power ∙ Contact angle
|
Continuous predictors
Bead width Bead height Dilution Substrate temperature Powder mass flow
|
All other settings within the software have been left as standard. The contact angle response is used as a check to ensure that the contact angle is within a specified tolerance range of > 90 °. As mentioned in the work of [
12], contact angles of near 90° or below are not desirable since they can lead to a higher probability for lack of fusion defects with the substrate. Another, more recent work suggests that for a fully dense component outcome, the contact angle should be between 120 and 140 ° [
13]. As the powder mass flow rate is not a directly controllable process variable, it was assumed here as a predictor as it can be kept constant during the process. The model can therefore be used to specify the desired target geometry in the form of seam width, height, and dilution. With knowledge over the desired powder mass flow and the substrate temperature, the traversing speed and laser power required to generate these target variables will then be calculated using the developed regression functions.
3. Results
The measurement results of the conducted experiments were analyzed using correlation analysis. The Pearson correlation coefficients and the corresponding p-values resulting from the data are shown in
Table 1.
Table 1.
Correlationmatrix.
Table 1.
Correlationmatrix.
| |
Laser power |
Feedrate |
Powder mass flow |
Substrate temp. |
Bead width |
Contact angle |
Bead height |
| Feedrate |
0.00 |
|
|
|
|
|
|
| 1.00 |
|
|
|
|
|
|
| |
|
|
|
|
Cell contents:
- -
Correlation according to Pearson - -
p-value
|
| Powder mass flow |
0.00 |
0.00 |
|
|
| 1.00 |
1.00 |
|
|
| |
|
|
|
|
| Substrate temperature |
0.00 |
0.00 |
0.00 |
|
|
|
|
| 1.00 |
1.00 |
1.00 |
|
|
|
|
| |
|
|
|
|
|
|
|
| Bead width |
0.53 |
-0.23 |
0.11 |
0.26 |
|
|
|
| 0.00 |
0.00 |
0.04 |
0.00 |
|
|
|
| |
|
|
|
|
|
|
|
| Contact angle |
-0.26 |
-0.15 |
0.57 |
-0.34 |
-0.28 |
|
|
| 0.00 |
0.00 |
0.00 |
0.00 |
0.00 |
|
|
| |
|
|
|
|
|
|
|
| Bead height |
0.10 |
-0.60 |
0.68 |
-0.01 |
0.49 |
0.61 |
|
| 0.06 |
0.00 |
0.00 |
0.91 |
0.00 |
0.00 |
|
| |
|
|
|
|
|
|
|
| Dilution |
0.64 |
0.03 |
-0.47 |
0.23 |
0.33 |
-0.61 |
-0.33 |
| 0.00 |
0.64 |
0.00 |
0.00 |
0.00 |
0.00 |
0.00 |
The following main dependencies can be derived from this:
Track width & laser power (0.527)
Contact angle & powder mass flow (0.566)
Track height & powder mass flow + feed rate (0.677 + -0.597)
Dilution & laser power (0.638)
Thus, the track width increases with increasing laser power. The contact angle increases with increasing powder mass flow. The track height increases with increasing powder mass flow and decreases with increasing feed rate. The dilution increases with increasing laser power. Since the powder mass flow is not reliably controllable during the process – it must be calibrated before each print job – this process parameter will be kept constant. This leaves the feedrate and laser power as controllable process-parameters. The evaluation of the 360 experiments yielded the following regression functions for the responses travel speed, laser power, and contact angle:
To validate the model, experiments were carried out in which the regression functions were used to determine the machine parameters for selected geometry target variables. In this experiment, we deposited five beads at each substrate temperature level, using identical process parameters. This mirrors the setup of the previous 360 experiments, with a minor adjustment: we controlled the temperature between each bead and, if needed, waited for the substrate to cool before proceeding. The values for the continuous predictors and geometry target variables were chosen as 3 mm for the bead width, 1 mm for the bead height, 15% for the dilution, and 15 g/min for the powder mass flow at substrate temperatures of RT, 200, 400, 600, and 800°C. Choosing 15 g/min is the attempt of maximizing the material output while not fully utilizing the material transport capabilities of the machine. The height and width that has been chosen fits the literature requirement of an aspect ratio of 3 to 5 (aspect ratio = width / height) [
14]. The resulting machine parameters can be found in
Table 2:
Table 2.
Answers to regressions functions at different substrate temperatures.
Table 2.
Answers to regressions functions at different substrate temperatures.
| Substrate temperature °C |
Feedrate
mm/min |
Laserpower
W |
Contact Angle
° |
| RT |
775.09 |
1485.865 |
111.77825 |
| 200 |
775.125 |
1358.57 |
106.2675 |
| 400 |
775.165 |
1213.09 |
99.9695 |
| 600 |
775.205 |
1067.61 |
93.6715 |
| 800 |
775.245 |
922.13 |
87.3735 |
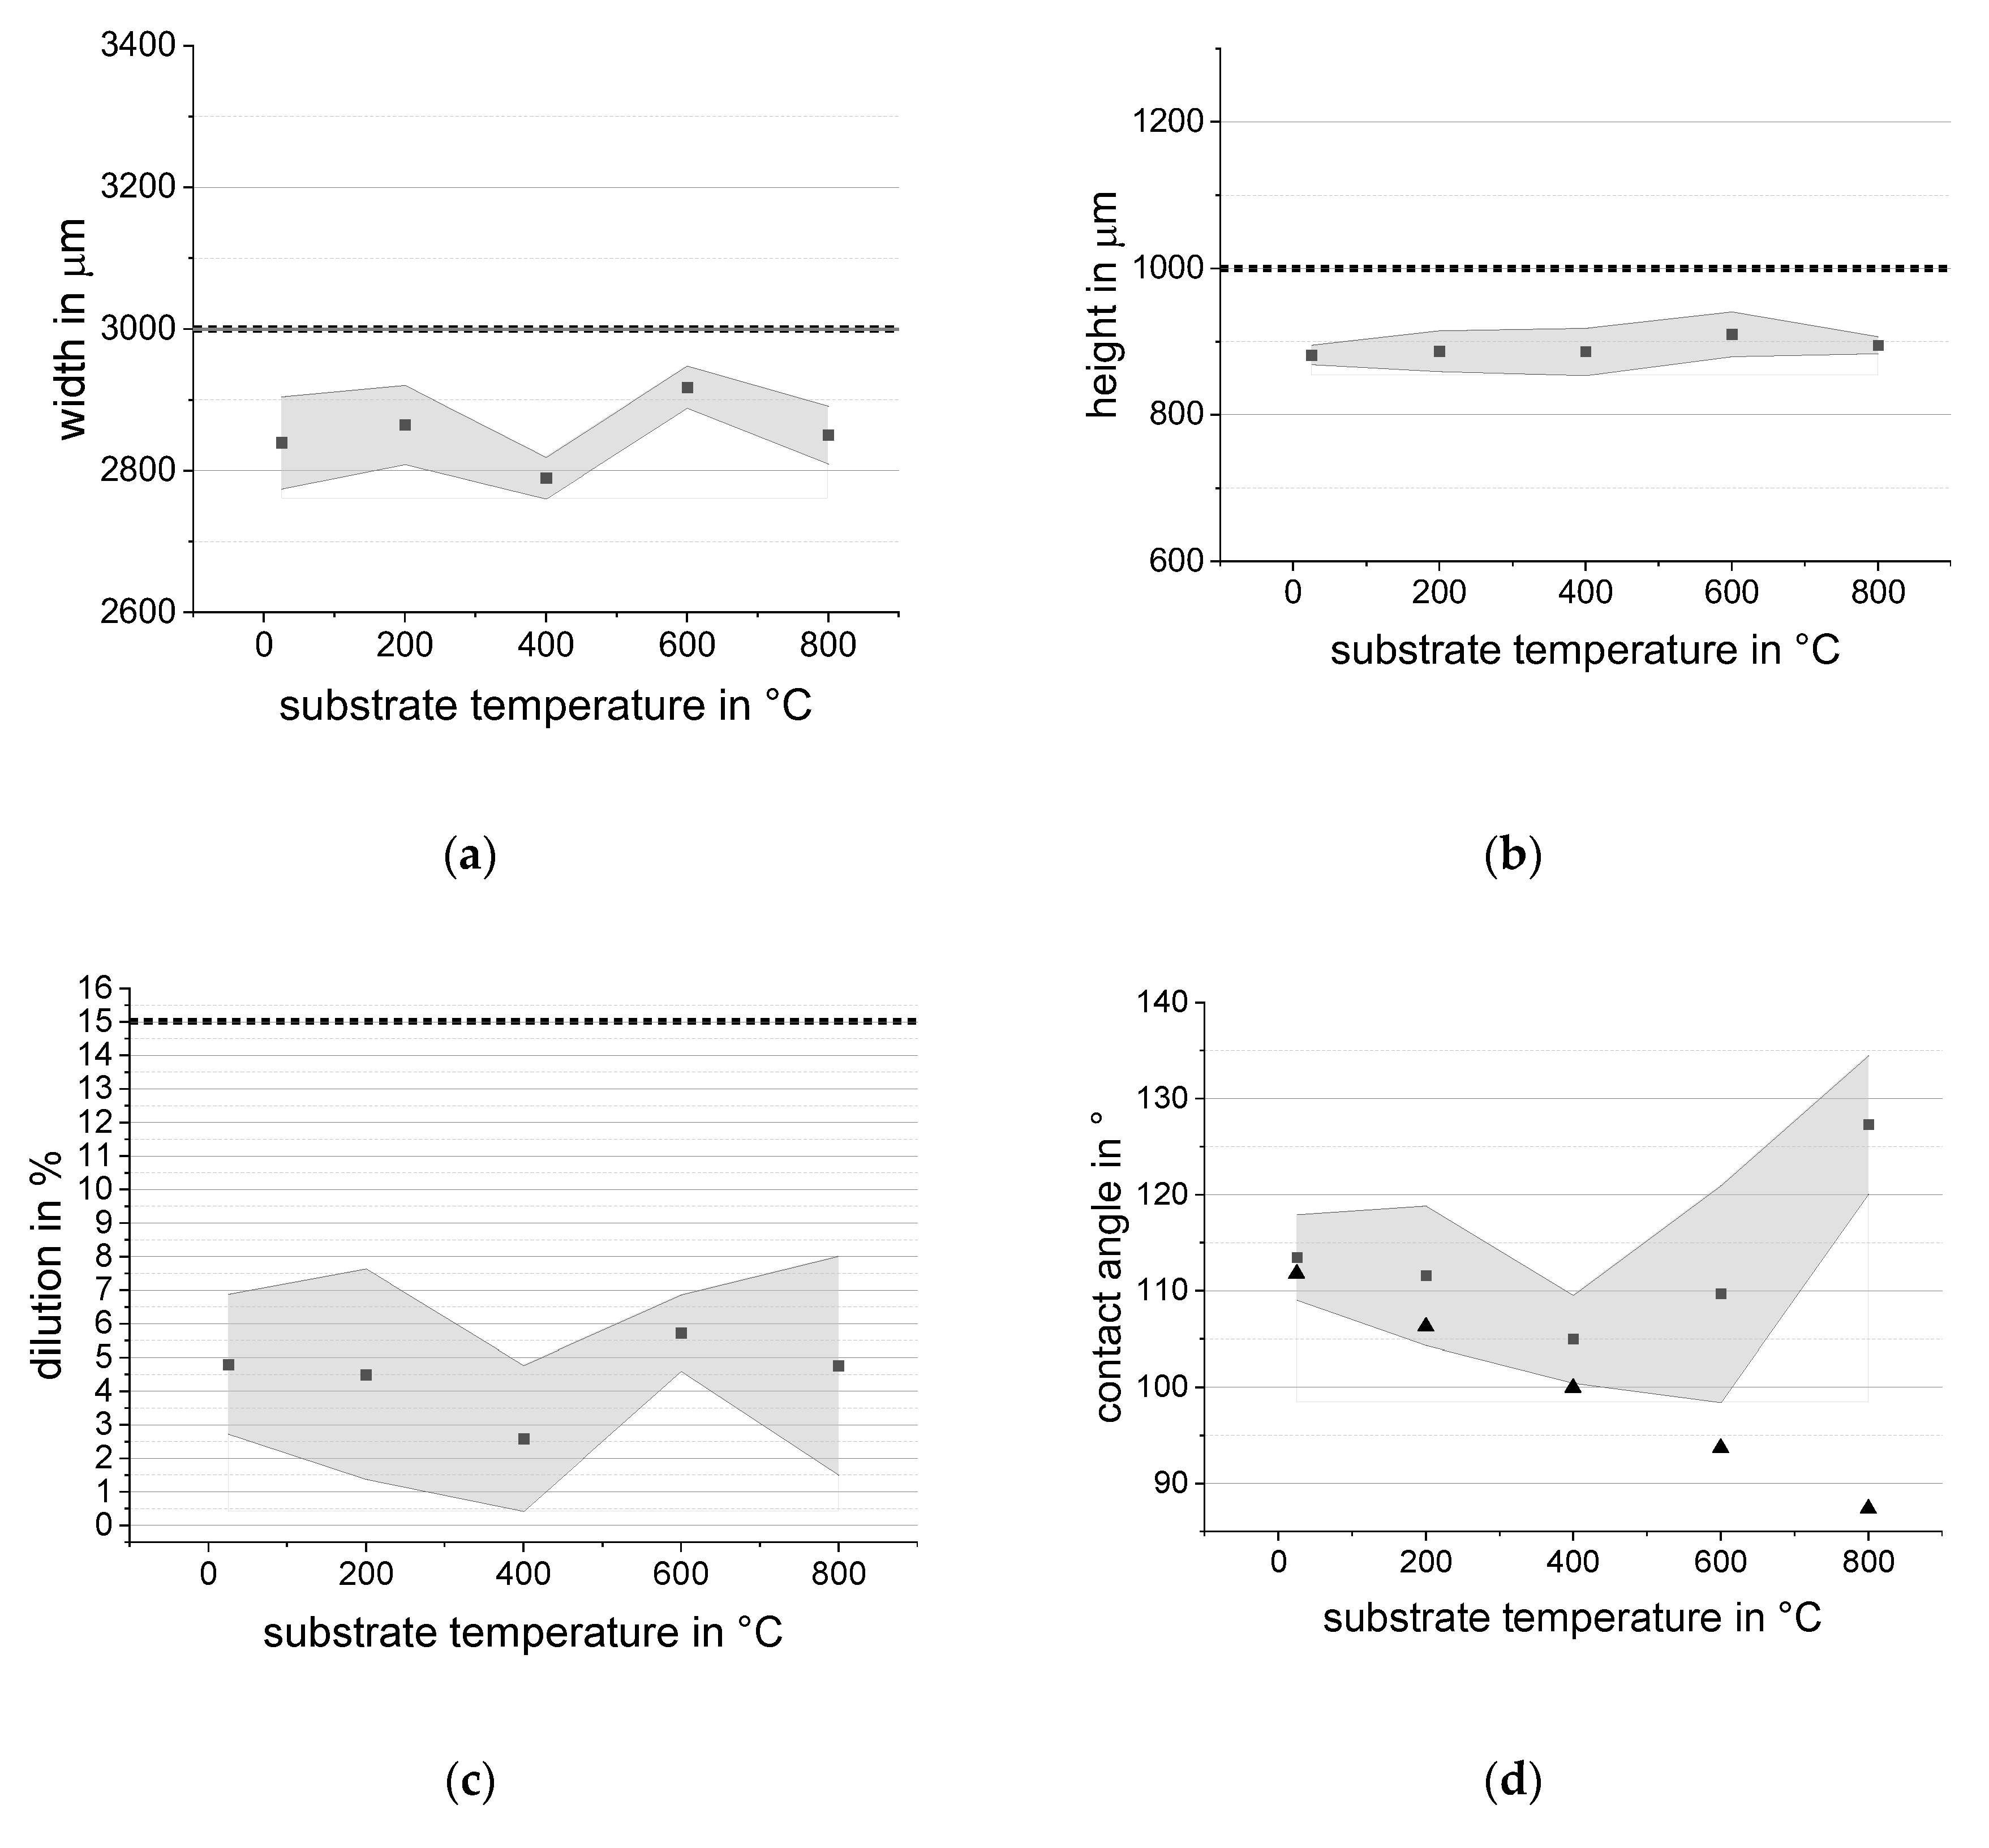
As can be seen, the difference in feed rate is negligible compared to the laser power. However, according to the model, there is a significant difference in the resulting contact angle of the individual tracks, which must be considered in further investigations if it actually occurs. Three weld beads were produced for each parameter pair for model validation using the same experimental setup as before. The results of the investigations are shown in Figure 3.
Figure 3.
Cross-sectional image of a weld track with the measured geometric characteristics. 1: height, 2: width, 3: welded-on area above substrate surface, 4: welded-in area within substrate, 5: contact area.
Figure 3.
Cross-sectional image of a weld track with the measured geometric characteristics. 1: height, 2: width, 3: welded-on area above substrate surface, 4: welded-in area within substrate, 5: contact area.
Figure 4.
Results of model validation experiments shown as error bands (squares indicate mean value, error-band derived from standard deviation) for individual welding bead bins with the desired quantities as horizontal dashed line and the anticipated contact angle values as triangles: (a) width; (b) height; (c) dilution; (d) contact angle.
4. Discussion
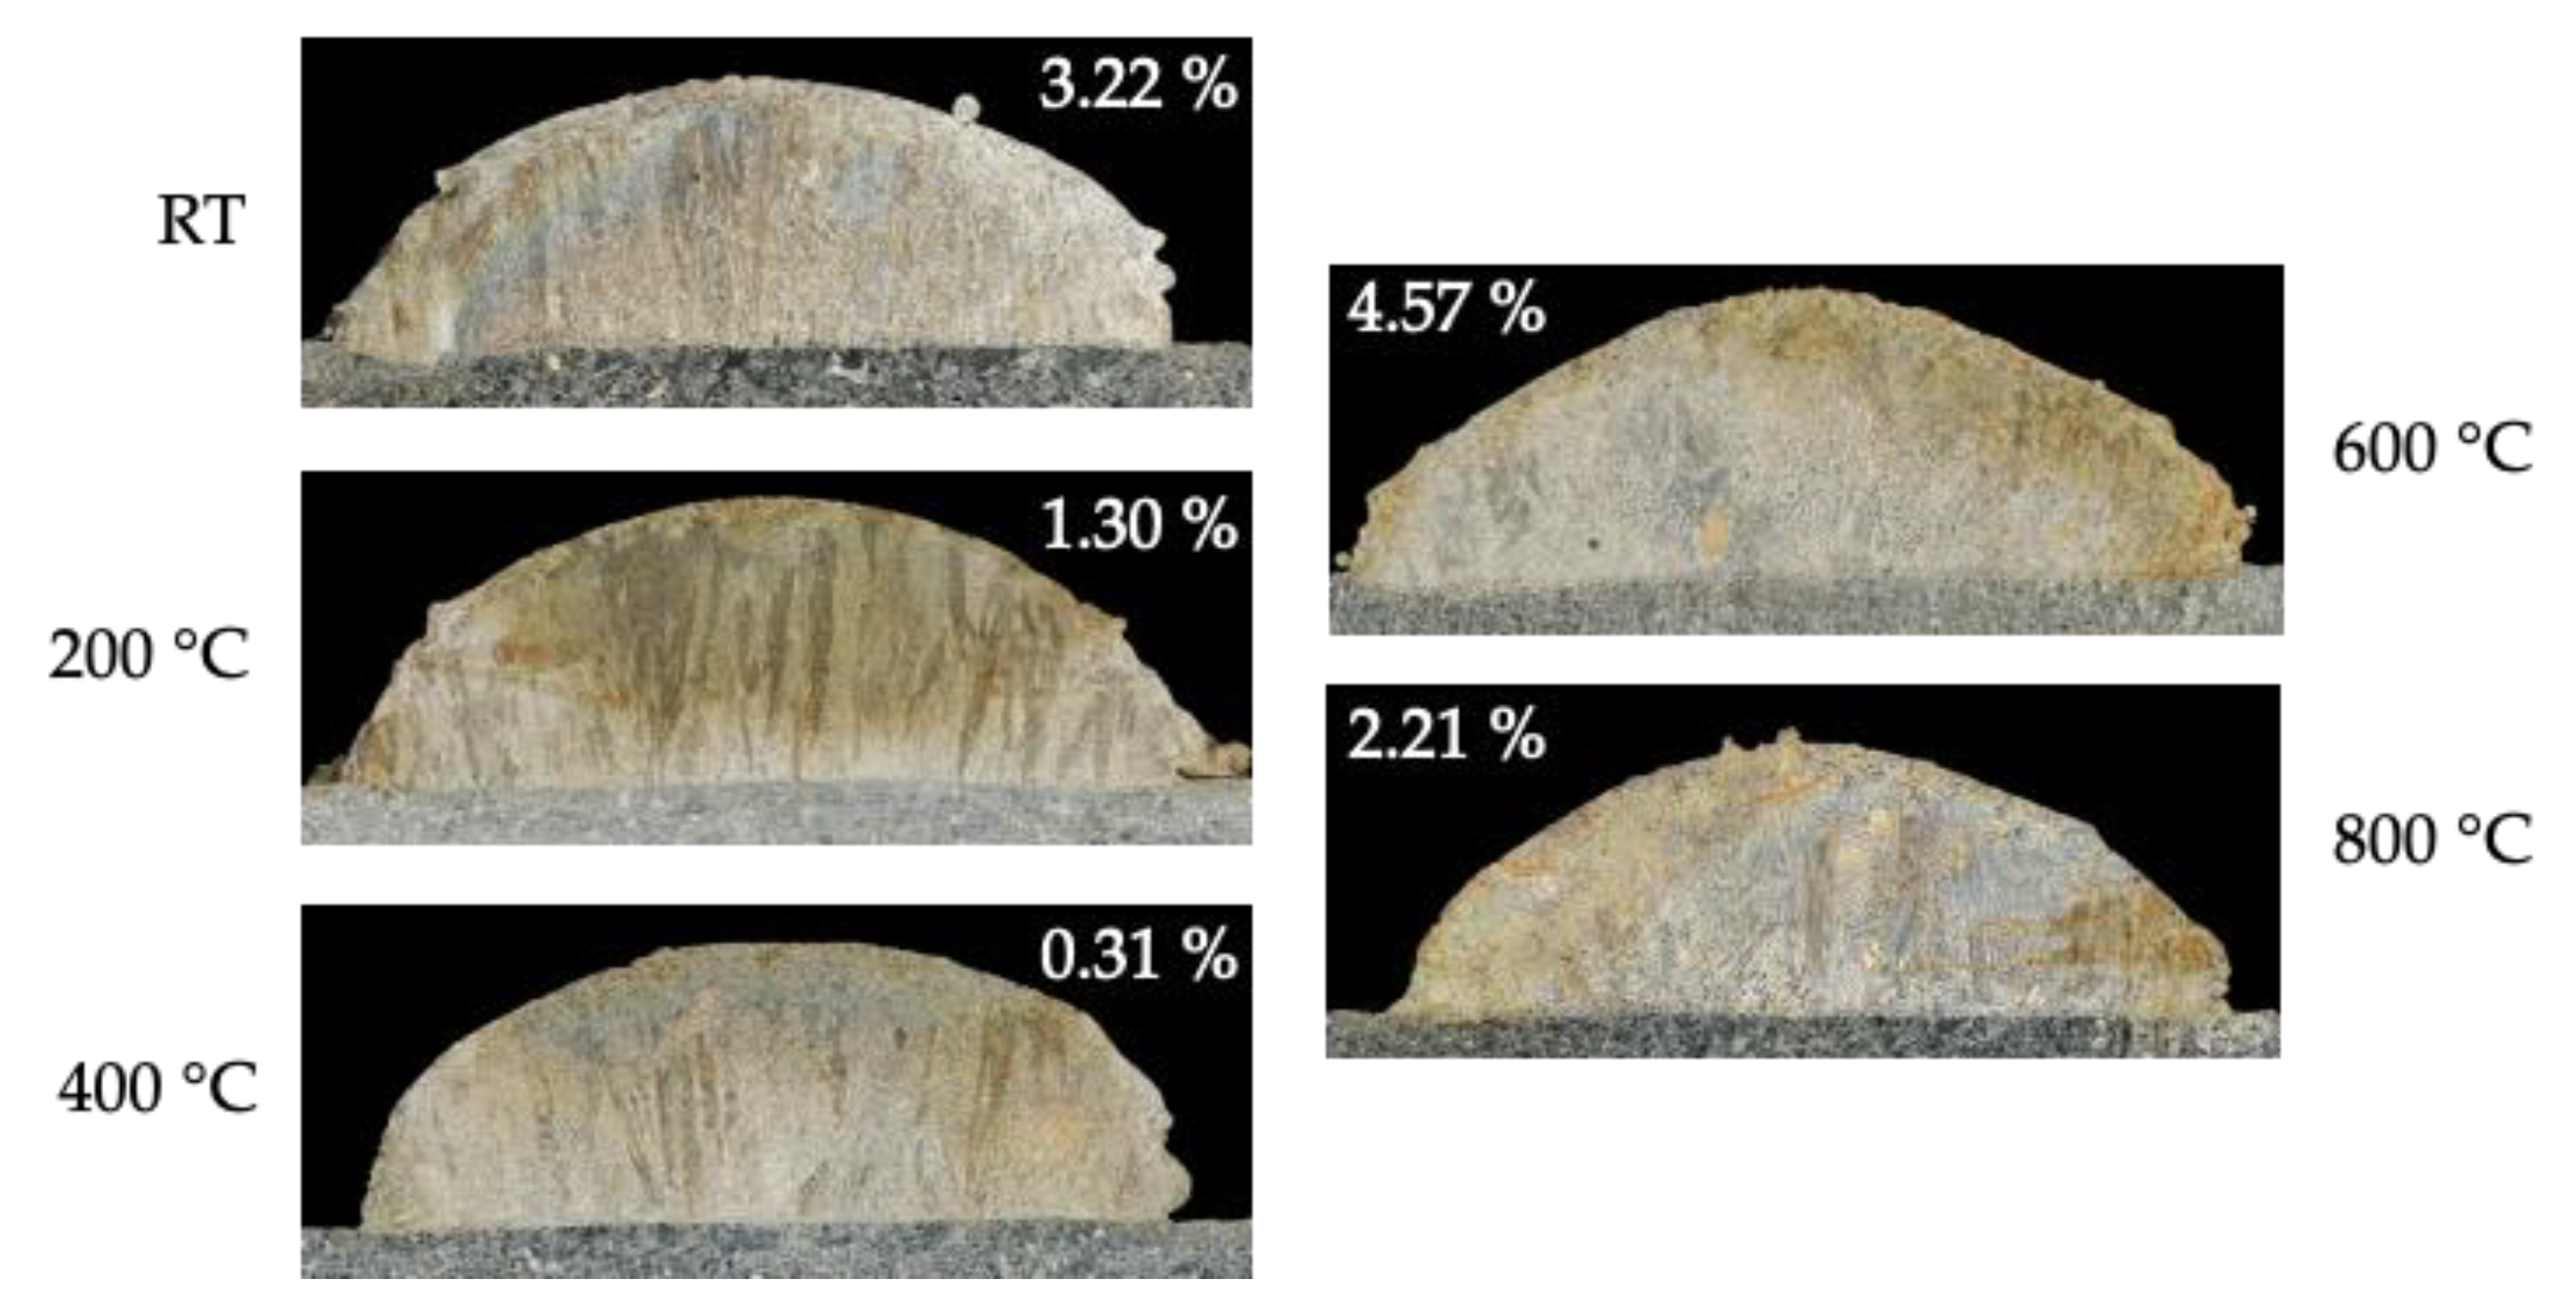
The results of the model validation indicate a deviation between the measured target variables and the specified values. However, it’s important to note that the DED process typically exhibits a certain level of variability in results, particularly concerning weld bead heights and widths. This inherent variability is well-known in the field, and as such, the observed results can be considered sufficiently accurate. Notably, there is a consistent trend towards the target values of geometric features across the range of substrate temperatures, which aligns with the primary objective of this study. The maximum deviation of the mean measured value across the temperature range from the target value is 7% for width, 11.82% for height, and notably, 82.69% for dilution. While the significant deviation in dilution may initially raise concerns, it’s essential to consider the practical implications. Despite the low measured dilution values, examination of cross-sectional images (Figure 5) reveals a robust bond between the weld and the substrate, demonstrating successful fabrication even with minimal measured dilution.
Figure 5.
Images of cross-sectional cut weld beads, dilution in % in the upper part of pictures, substrate temperature adjacent to each picture.
Figure 5.
Images of cross-sectional cut weld beads, dilution in % in the upper part of pictures, substrate temperature adjacent to each picture.
Regarding the prediction of contact angles, the model demonstrates decent precision, particularly at room temperature and 200°C substrate temperatures, where the error band closely encompasses the predicted values. Although the model predicts a decrease in contact angle with increasing temperature, real-world investigations reveal a different trend. Nonetheless, the contact angles for each temperature level falls within the range necessary for proper deposition, spanning from 90 to 140 degrees.
In summary, the developed model effectively forecasts process parameters for different substrate temperatures, resulting in a consistent geometric outcome of individual weld beads. While adjustments may be necessary to enhance the accuracy of the prediction, the manufactured weld beads meet all criteria for the theoretical production of fully dense volumetric parts. Future endeavours should focus on refining the regression model using data from validation experiments and conducting a precise analysis of the relationships between process parameters and target values.
Author Contributions
For research articles with several authors, a short paragraph specifying their individual contributions must be provided. The following statements should be used “Conceptualization, S.G. and T.T.; methodology, S.G.; validation, A.W. and R.R.; investigation, S.G. A.W. and R.R.; writing—original draft preparation, S.G.; writing—review and editing, S.G.; supervision, T.T. All authors have read and agreed to the published version of the manuscript.
Conflicts of Interest
The authors declare no conflicts of interest.
References
- Mani, M.; Lane, B.M.; Donmez, M.A.; Feng, S.C.; Moylan, S.P. A review on measurement science needs for real-time control of additive manufacturing metal powder bed fusion processes. International Journal of Production Research 2017, 55, 1400–1418. [CrossRef]
- Heilemann, M.; Jothi Prakash, V.; Beulting, L.; Emmelmann, C. Effect of heat accumulation on the single track formation during laser metal deposition and development of a framework for analyzing new process strategies. Journal of Laser Applications 2021, 33, 12003. [CrossRef]
- Isquierdo, D.V.; Siqueira, R.; Carvalho, S.M.; Lima, M. Effect of the initial substrate temperature on heat transfer and related phenomena in austenitic stainless steel parts fabricated by additive manufacturing using direct energy deposition. Journal of Materials Research and Technology 2022, 18, 5267–5279. [CrossRef]
- Moheimani, S.K.; Iuliano, L.; Saboori, A. The role of substrate preheating on the microstructure, roughness, and mechanical performance of AISI 316L produced by directed energy deposition additive manufacturing. Int J Adv Manuf Technol 2022, 119, 7159–7174. [CrossRef]
- Jambor, T. Funktionalisierung von bauteiloberflächen durch Mikro-Laserauftragsschweißen, 2012.
- Mazzucato, F.; Tusacciu, S.; Lai, M.; Biamino, S.; Lombardi, M.; Valente, A. Monitoring Approach to Evaluate the Performances of a New Deposition Nozzle Solution for DED Systems. Technologies 2017, 5, 29. [CrossRef]
- Saboori, A.; Aversa, A.; Marchese, G.; Biamino, S.; Lombardi, M.; Fino, P. Microstructure and Mechanical Properties of AISI 316L Produced by Directed Energy Deposition-Based Additive Manufacturing: A Review. Applied Sciences 2020, 10, 3310. [CrossRef]
- Aleksandr, K.; Ferdinando, S.; Joel, R.; Joel, C.; Jordan, M.; Thomas, J. Effect of direct energy deposition parameters on morphology, residual stresses, density, and microstructure of 1.2709 maraging steel. Int J Adv Manuf Technol 2021, 117, 1287–1301. [CrossRef]
- Sreekanth, S.; Ghassemali, E.; Hurtig, K.; Joshi, S.; Andersson, J. Effect of Direct Energy Deposition Process Parameters on Single-Track Deposits of Alloy 718. Metals 2020, 10, 96. [CrossRef]
- Sciammarella, F.; Salehi Najafabadi, B. Processing Parameter DOE for 316L Using Directed Energy Deposition. JMMP 2018, 2, 61. [CrossRef]
- Zhong, C.; Biermann, T.; Gasser, A.; Poprawe, R. Experimental study of effects of main process parameters on porosity, track geometry, deposition rate, and powder efficiency for high deposition rate laser metal deposition. Journal of Laser Applications 2015, 27. [CrossRef]
- Borovkov, H.; La Yedra, A.G. de; Zurutuza, X.; Angulo, X.; Alvarez, P.; Pereira, J.C.; Cortes, F. In-Line Height Measurement Technique for Directed Energy Deposition Processes. JMMP 2021, 5, 85. [CrossRef]
- Javidrad, H.; Aydin, H.; Karakaş, B.; Alptekin, S.; Kahraman, A.S.; Koc, B. Process parameter optimization for laser powder directed energy deposition of Inconel 738LC. Optics & Laser Technology 2024, 176, 110940. [CrossRef]
- Michael Cornelius Hermann Karg; Oliver Hentschel; Bhrigu Ahuja; Daniel Junker; Ulf Hassler; Claus Schäperkötter; Andreas Haimerl; Horst Arnet; Marion Merklein; Michael Schmidt. Comparison of process characteristics and resulting microstructures of maraging steel 1.2709 in Additive Manufacturing via Laser Metal Deposition and Laser Beam Melting in Powder Bed, 2016.
|
Disclaimer/Publisher’s Note: The statements, opinions and data contained in all publications are solely those of the individual author(s) and contributor(s) and not of MDPI and/or the editor(s). MDPI and/or the editor(s) disclaim responsibility for any injury to people or property resulting from any ideas, methods, instructions or products referred to in the content. |
© 2024 by the authors. Licensee MDPI, Basel, Switzerland. This article is an open access article distributed under the terms and conditions of the Creative Commons Attribution (CC BY) license (http://creativecommons.org/licenses/by/4.0/).
