Preprint
Article

Analysis Methodology for the Evaluation of Energy Efficiency and Energy Classification of Buildings in the Residential Sector

Altmetrics

Downloads

76

Views

24

Comments

0

Submitted:

23 April 2024

Posted:

24 April 2024

You are already at the latest version

Alerts
Abstract
The implementation of sustainable practices, such as the use of renewable sources and efficient technologies, is crucial for reducing climate change. Energy efficiency is highly important on a global scale due to its relationship with climate change, aiming to minimize environmental impact. In Spain, renewable energy policies have increased self-sufficiency and reduced the use of fossil fuels. Optimizing energy consumption in residences, buildings, and industries is essential for improving efficiency. This was taken into consideration for conducting this study, focusing on the residential sector. The desire to understand the level of energy efficiency in Extremadura drove this project, which focuses on collecting and analyzing data on a set of homes located in the au-tonomous community of Extremadura, with the purpose of evaluating their energy efficiency. To achieve this, a computer tool will be employed to provide a detailed view of the different levels of energy efficiency present in the community. In addition to data collection and analysis, research will be conducted to identify areas for improvement. This will allow proposing a series of specific measures that users can implement to optimize energy efficiency in their homes, adapting them to the particular characteristics of each residence.
Keywords: 
Subject: Engineering  -   Energy and Fuel Technology

1. Introduction

Currently, energy efficiency [1,2,3] is a highly important issue globally due to its relationship with climate change [4] and sustainability [5,6] .This concept refers to the ability to achieve maximum output using the least amount of energy possible. This method not only reduces costs but also minimizes environmental impact by decreasing greenhouse gas emissions [7] and reducing dependence on non-renewable energy resources [1,8]
The implementation of more sustainable practices plays a crucial role in mitigating climate change [10] .This exercise includes renewable energy sources such as solar, wind, hydroelectric, among others, which are abundant and do not emit gases into the atmosphere during operation. Additionally, adopting energy-efficient technologies, optimizing industrial processes, and promoting responsible energy use habits are essential for reducing carbon footprint and preserving the environment.
Spain was highly energy-dependent, as it imported most of the energy it consumed. However, from 2005 onwards, the implementation of renewable energy policies increased self-sufficiency and led to a significant decline in the use of coal-produced energy, prompting the establishment of Royal Decree 235/2013 of April 5. This decree approved the basic procedure for the certification of energy efficiency in buildings, with its predecessor being Royal Decree 390/2021 [11,12,13,14,15].
Equitable utilization of energy resources ensures long-term sustainable energy supply [2] .Harnessing renewable and clean sources reduces dependence on fossil fuels, which emit high levels of carbon dioxide. One of the key steps in promoting the transition to a more ecological energy system is investing in renewable technologies.
In residential [14,16] building, and industrial sectors, optimizing energy consumption is crucial to reducing energy demand and improving operational efficiency. This can be achieved through the adoption of energy-saving measures such as insulation installation, use of more efficient appliances and equipment, but above all, responsible energy use practices.
Energy efficiency and sustainable practices are directly linked to the fight against climate change by reducing greenhouse gas emissions and minimizing their impacts on the environment and society [17] .By optimizing energy consumption in residences, buildings, and industries, carbon footprint can be reduced, contributing to a more sustainable future for our planet.
Building on the background, this project focuses on collecting and analyzing data from a series of homes located in the autonomous community of Extremadura. The purpose is to understand the level of energy efficiency in this region, using a computer tool that provides a classification of the different levels present in the community.

2. Materials and Methods

In this study, the most relevant regulations have been considered as primary references. In particular, the UNE 60364-8 standard [17] has been used as a starting point, which establishes the requirements and recommendations for the electrical part of the energy management system, along with UNE ISO 50001 [11,18].
UNE 60364-8 provides and describes the method for obtaining the energy efficiency level of a dwelling through a series of levels ranging from 0 to 5, as shown in Table 1. Additionally, it covers the modifications and renovations made to existing dwellings to improve their energy efficiency.
This regulation focuses on reducing energy consumption through improvements in the electrical installation by replacing equipment, conducting inspections, etc. The mission is to design an efficient system that adapts to the user's needs without changing their daily habits.
As mentioned, the aforementioned standard is related to UNE ISO 50001, which aims to outline the requirements for implementing and improving an energy management system (EMS). This methodology continuously improves an energy system, optimizing consumption across various infrastructures. Additionally, the effectiveness of an EMS depends on the commitment and availability of all stakeholders in the organization [19].
This system is based on four fundamental steps:
-
Step 1, Plan: Establish energy policy and the energy management team, create improvements, objectives, and goals for subsequent evaluation.
-
Step 2, Do: Create the necessary documentation for the system and implement action plans.
-
Step 3, Check: Analyze progress and proposed follow-up and control measures. Also, study the key operations and objectives that determine energy efficiency, reporting on the results obtained.
-
Step 4, Act: Acknowledge achievements and make decisions to improve previous actions, conducting a conformity assessment.
Returning to UNE 60364-8 and its six levels of energy efficiency, these levels are obtained through a series of points, as dictated by the standard in Table 2. These points are defined by a series of parameters.
-
II01: Energy consumption
-
EM01: Zones
-
EM03: Demand response
-
EM04: Meshes
-
EM05: Uses
-
EM08: HVAC control
-
EM09: Lighting control
-
BS01: Renewable energy
-
BS02: Electrical energy storage
Some parameters, such as II01, EM01, EM03, are determined by the following quotient, and depending on the criterion, variables a and b take on different values.
k x = a * 100 b
In parameter II01, it determines the energy consumption of the dwelling; factors a and b represent the annual energy consumption of the measured loads and the consumption of the installation, respectively.
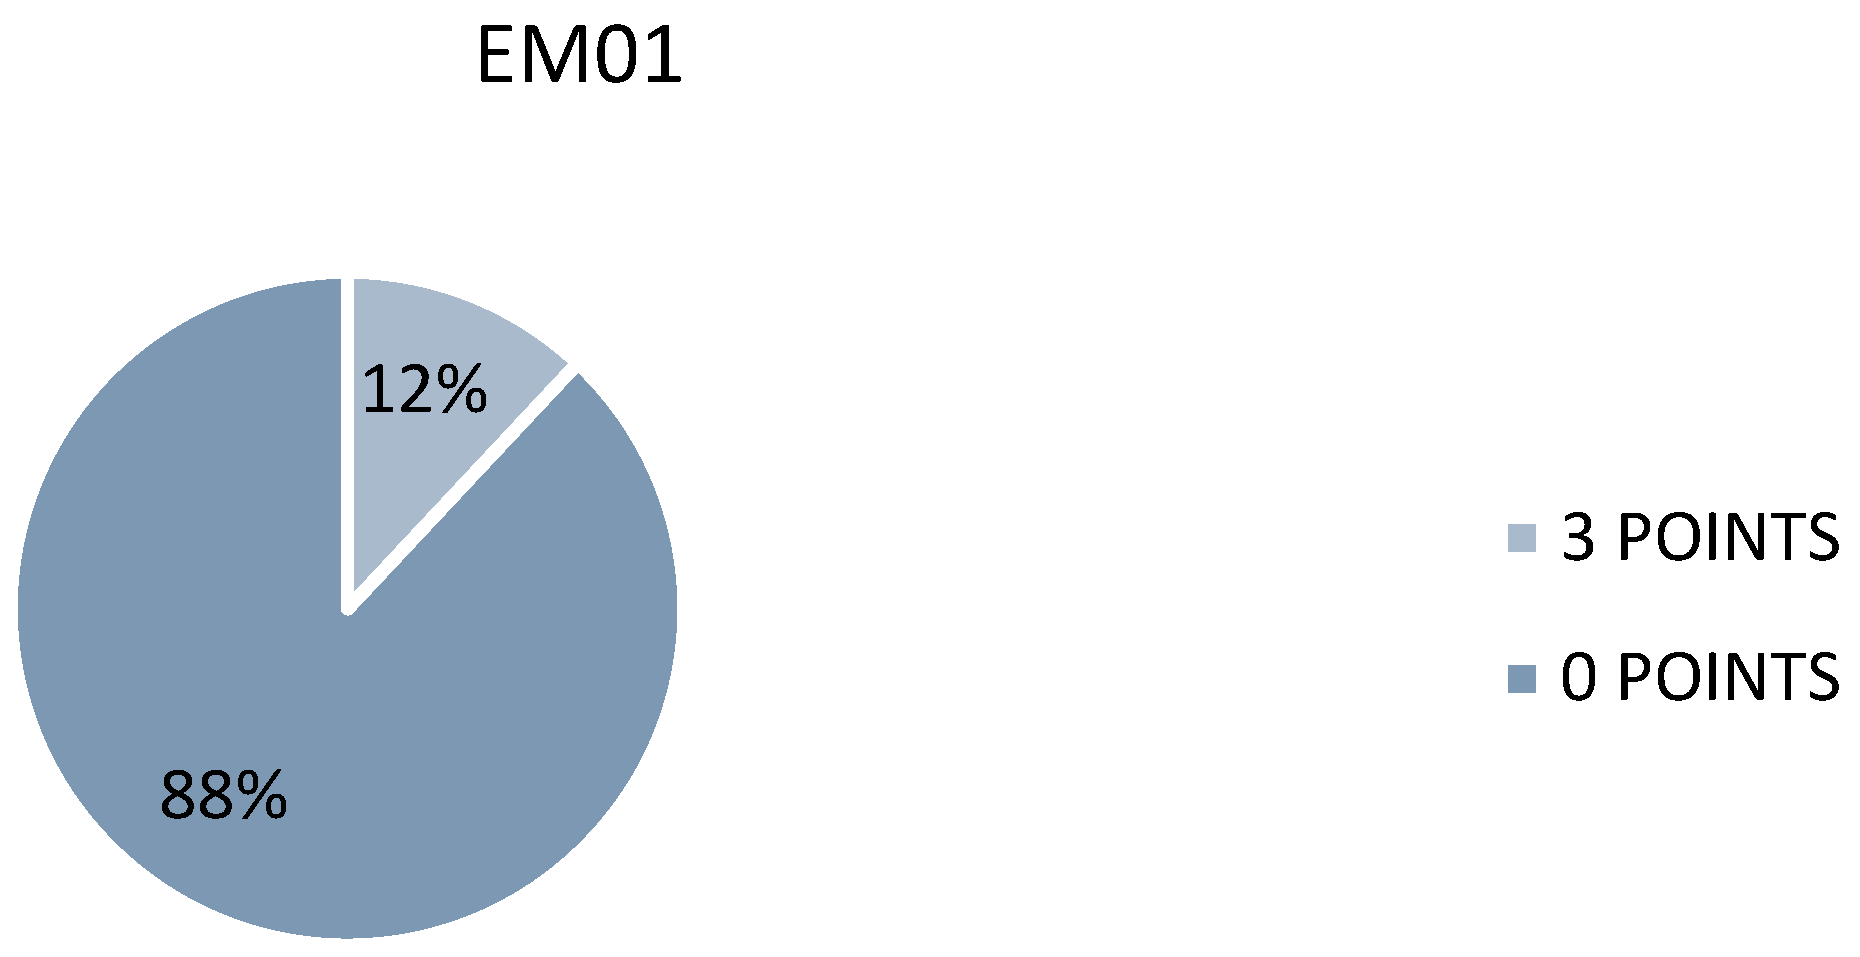
In EM01, it deals with the zones we have in the installation where a is the surface area of the defined zones and b is the total surface area.
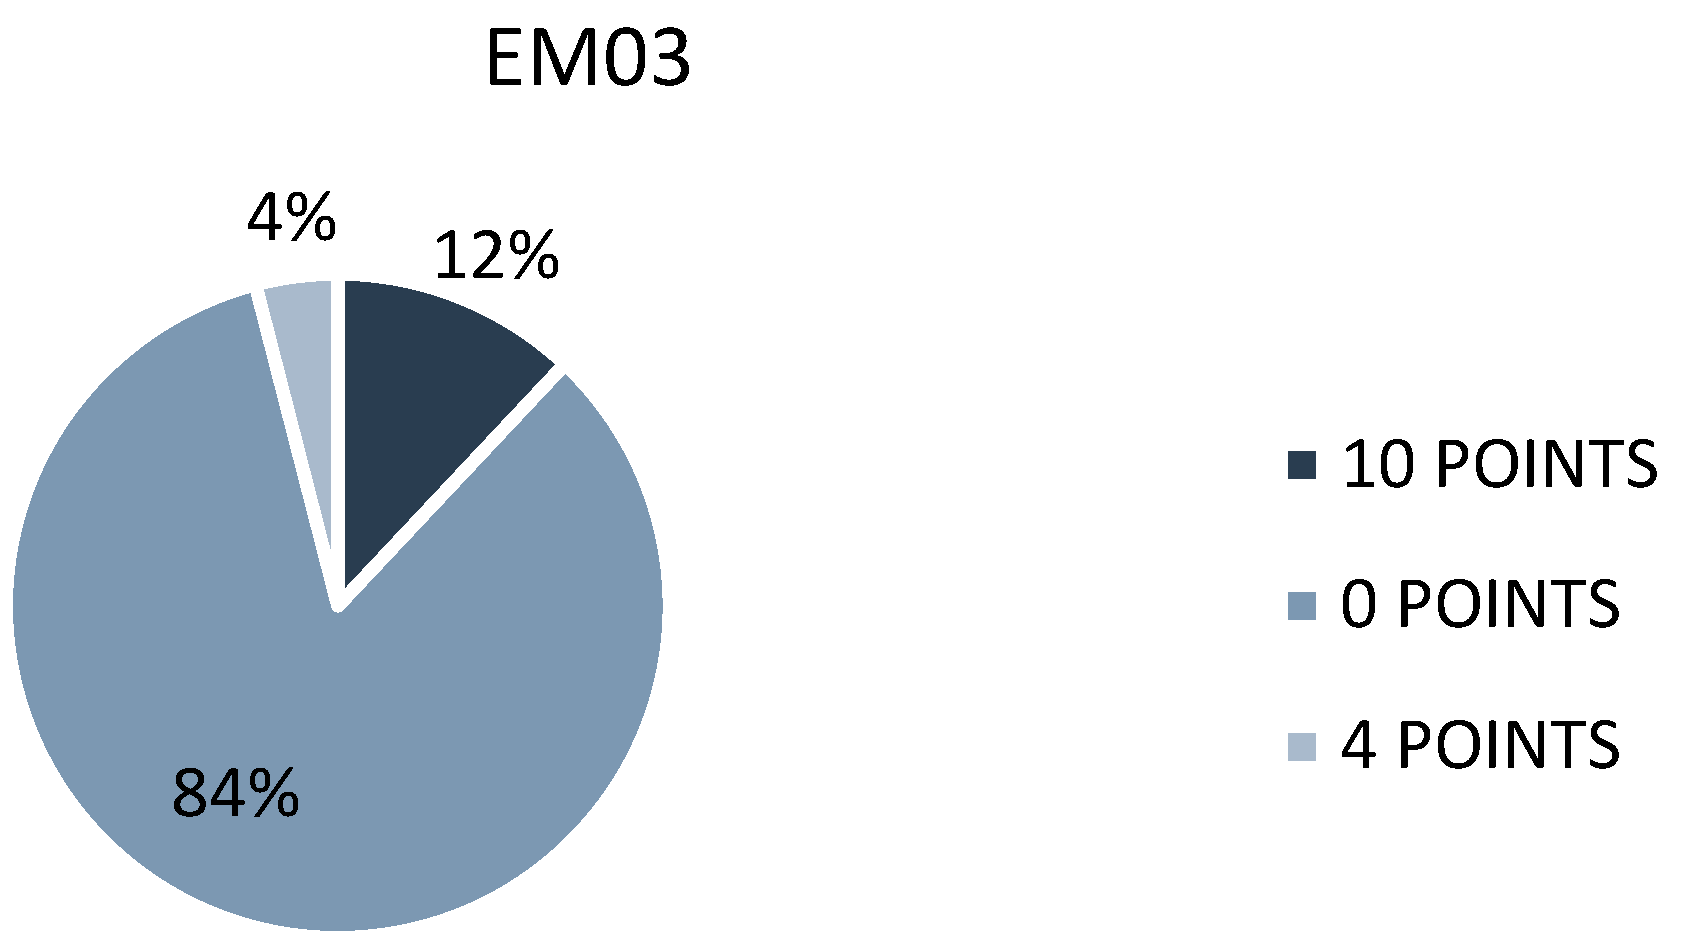
Lastly, EM03 relates to the demand of the devices connected to the installation; a represents the assigned power of the loads with load shedding, and b represents the total power of the installation.
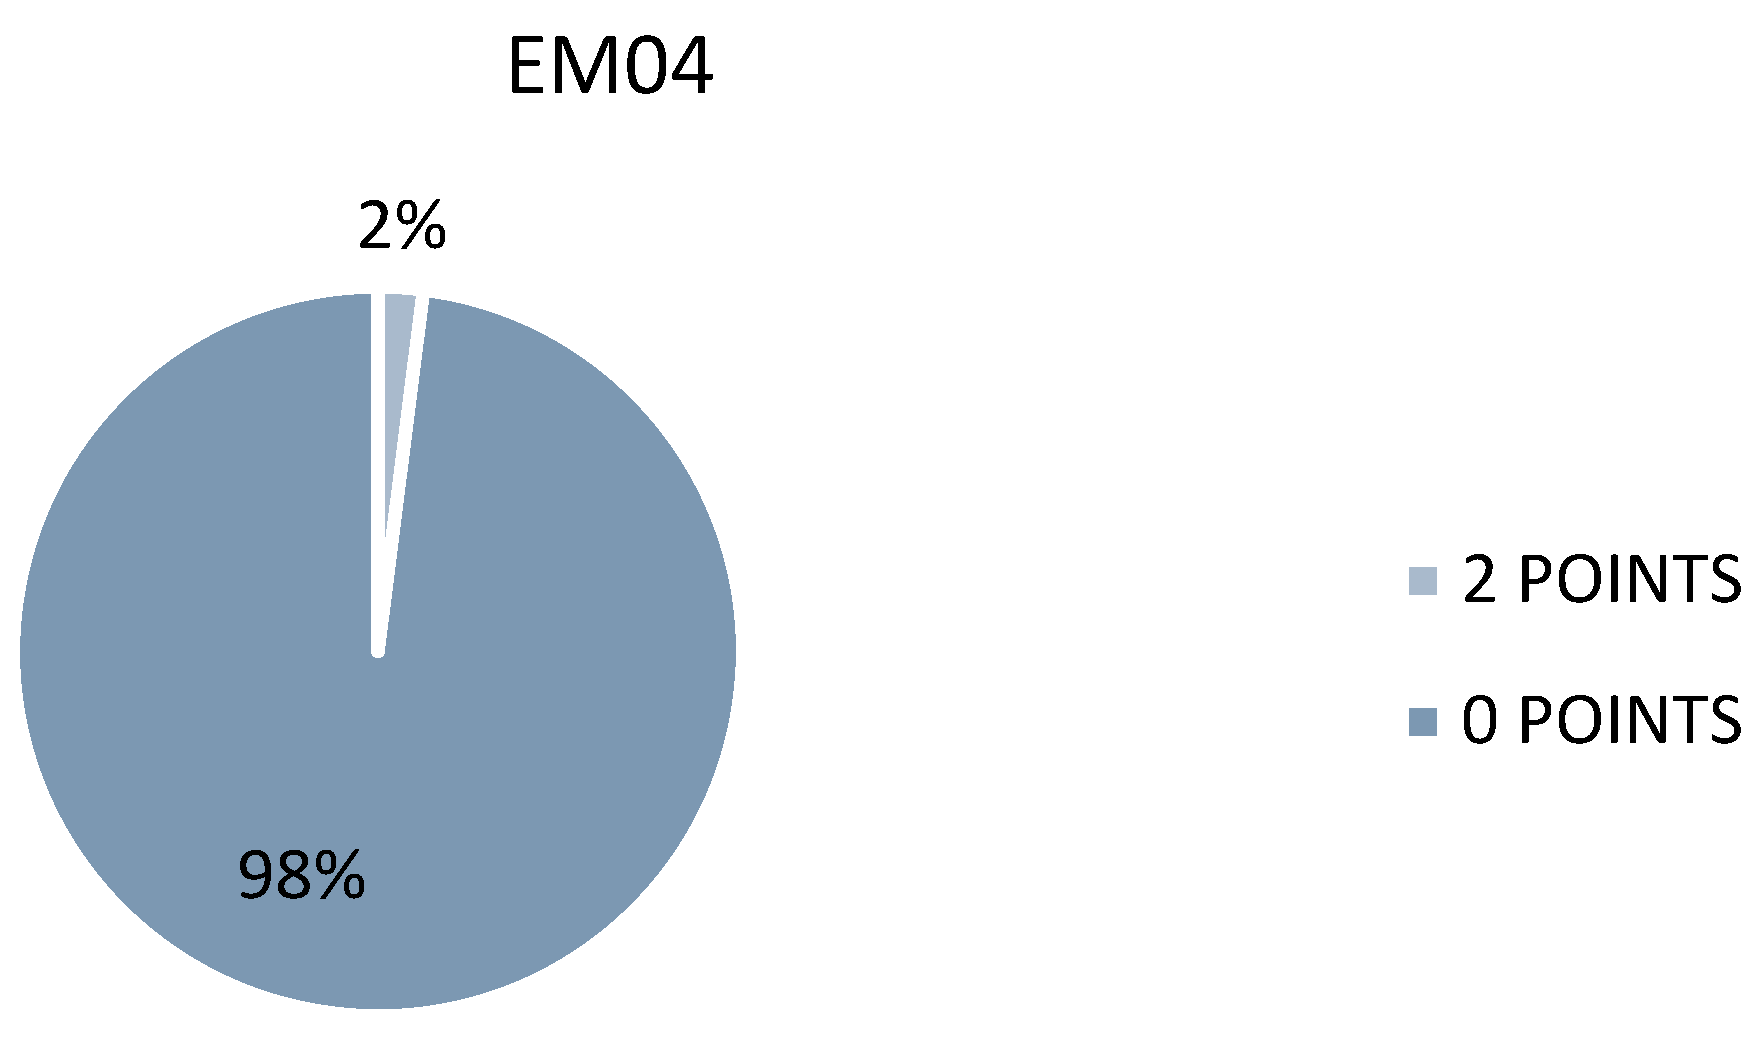
Subsequently, parameter EM04 focuses on circuit classification, considering a series of criteria that take into account circuits responsible for more than 80% of the total energy consumption of the installation, in order to determine its meshes.
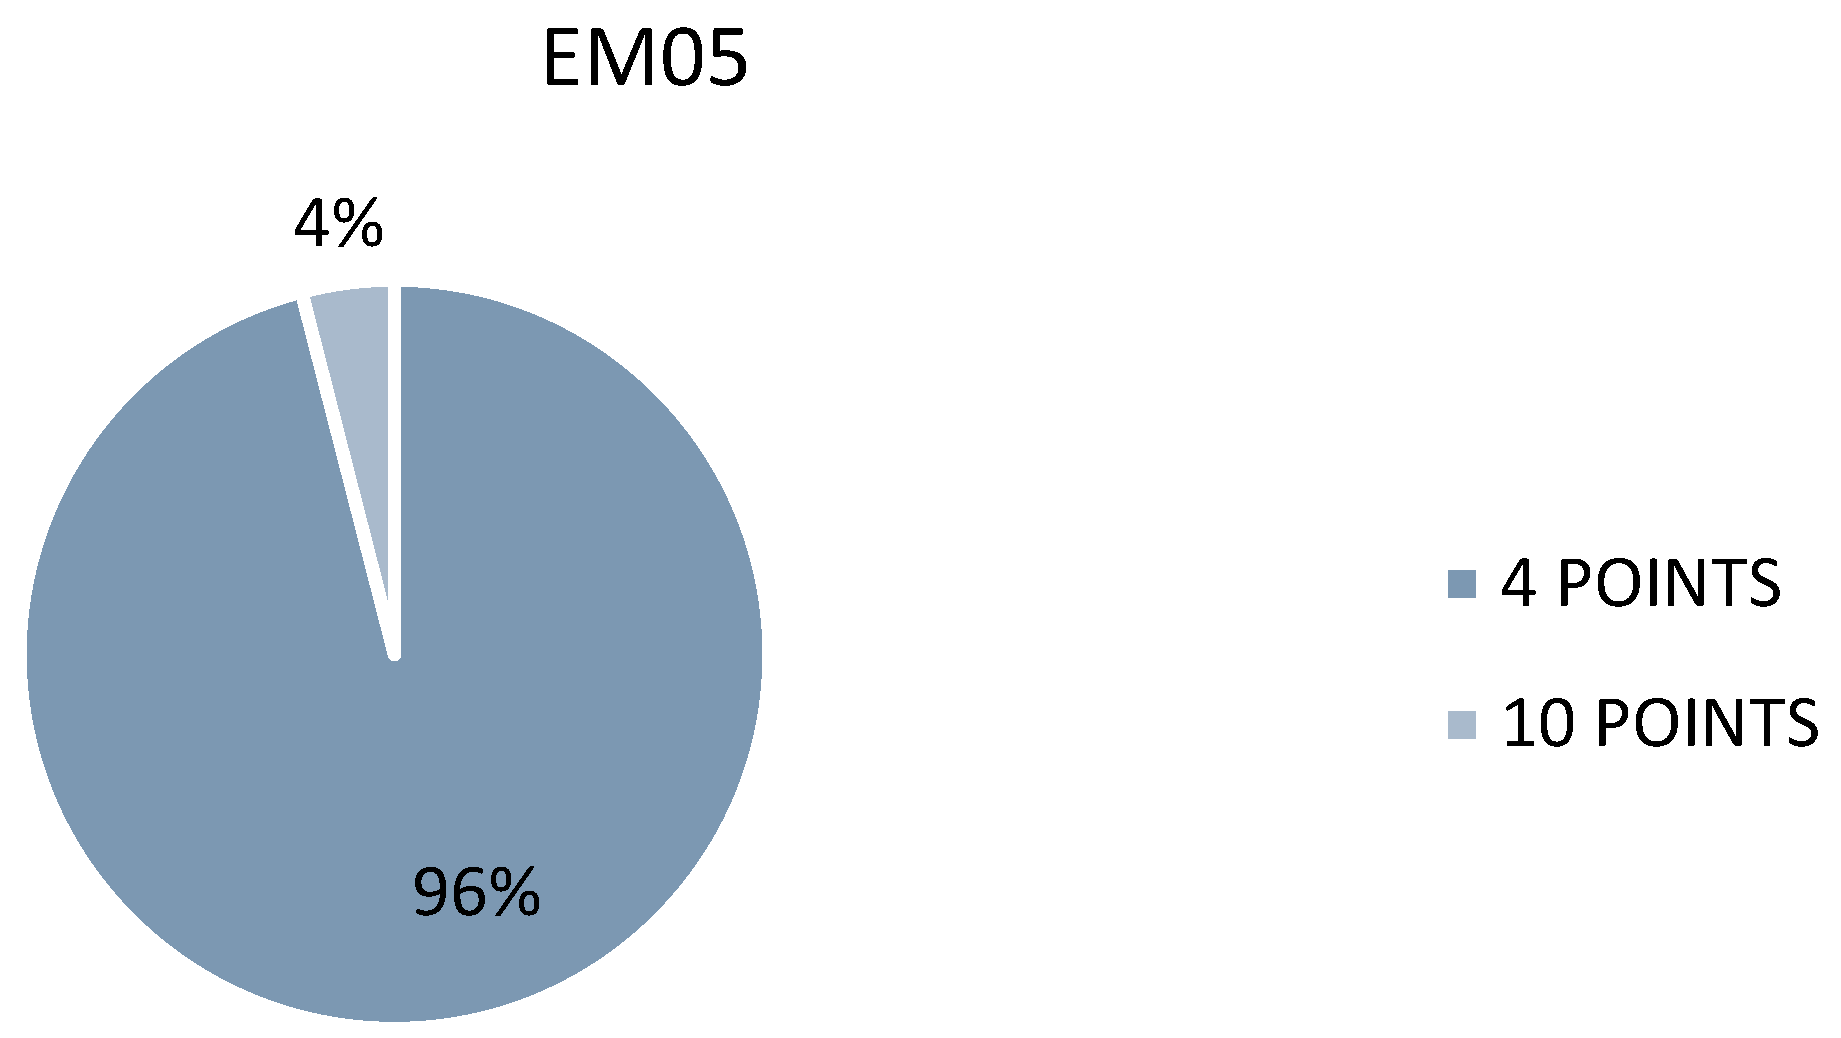
Parameter EM05 addresses the installation of corresponding power meters and monitoring devices to obtain precise measurements of energy consumption for specific uses.
Next, parameters EM08 and EM09 identify the installed air conditioning capacity and lighting control, respectively. In particular, parameter EM09 represents the ratio between the annual energy consumption for automatically controlled lighting and the total annual energy consumption of the lighting installation, which are determined by different types, percentages, or values as detailed in the following table (see Table 2).
Parameter BS01 indicates the relationship between annual energy production from renewable sources and the total energy consumption of the installation. On the other hand, BS02 is defined as the maximum power of energy storage systems divided by the total energy consumption of the installation and the number of days in a year (365 days).
With the defined parameters, a form is prepared in both digital and paper formats, consisting of a series of questions about the contracted tariff, consumption, and energy generation. This form (see Table 3) is available at the following link [20].
The form is structured with a series of questions divided into sections. It begins with the client's personal data; in case it is necessary to contact them. Additionally, questions are asked about their consumption, the surface area of the property, and its location. Next, there is an inquiry about the devices used in the home to measure and control its consumption, along with their recorded values. This is followed by questions about the existence of air conditioning systems, their distribution, and lighting control. Finally, the form concludes with questions about renewable energy sources available at the residence for self-consumption and storage.
Once a sample of 50 dwellings is obtained, the energy efficiency value is determined using the Excel tool [11].
This tool is categorized into two sections: residential and industrial. It starts with entering customer data, such as name, surname, and dwelling location. The program facilitates the user to input this data in a simple and straightforward manner. Details regarding the parameters to be filled out and how to do so in the program are outlined in the following paragraphs.
Once all data is entered, the tool generates a report with the energy rating of the dwelling and a series of measures to increase its efficiency value.
Parameter II01, energy consumption, has values provided in sections 2, 3, 4, 5, and 6 of the questionnaire (see Table 3). Sections 2 and 5 clarify the values of annual consumption and the number of meters in the electrical panel and outlets, while sections 3, 4, and 6 provide values of consumption from the electrical panel and/or outlets depending on whether they are connected to the grid or on an independent circuit.
Parameter EM01, zones, is also observed in the sections from the previous paragraph, as it asks for the total surface area of the dwelling, as well as the surface area measured by the aforementioned devices.
EM03, demand response, is filled out with sections 7 and 8, which request values for contracted power and load shedding power, which is the sum of power from devices that disconnect during peak consumption.
EM04, meshes, is unlikely to be known exactly, as it is a subjective value. It represents the number of criteria that the resident has in their dwelling, for example, to turn on and off the air conditioning system during summer or heating during winter. Therefore, the minimum value of 1 criterion per dwelling is always considered.
EM05, uses, is related to the measurements of the aforementioned devices. Each measurement is used in a circuit of the house or in a zone, so the sum of all of them represents the total number of uses. However, as with the previous data, EM04, it is unlikely to know this value exactly, so 1 and < 2 uses per dwelling are assumed.
Parameter EM08, HVAC control, is answered with sections 9, 10, and 11. The first is to determine if there is an air conditioning system in the residence, the second if it is present throughout the house or only in one zone, and the last to see if there is a thermostat with or without time control.
EM09, lighting control, is resolved with sections 12 and 13, which reveal the existence of such control in the dwelling and the total values of consumed and controlled lighting.
BS01 deals with renewable energies related to section 14 and partially section 15, where it asks if such sources are present in the residence and what their consumption value is.
Finally, BS02, electrical energy storage, is section 16, where the capacity and voltage of the battery from renewable energy sources are provided. However, the value obtained is not directly provided to the Excel program; a conversion to kW is required as shown in the following equation.
A h * V = W h
In the equation above, it is indicated that the two values provided in the questionnaire should be multiplied together. The resulting value is then divided by the operating hours of the renewable energy sources in the dwelling. Finally, it is converted to kW, and this value is the final result.
We conclude by summing up all the points obtained in the different parameters to obtain the energy efficiency value, as shown in Table 1.

3. Results

3.1. Analysis of the Results

In this stage, we will examine various approaches using the results obtained from the 50 dwellings regarding their energy efficiency. We will begin by comparing the different parameters used in the residential installations in each dwelling (see Table 4).
Next, we will show the percentage of dwellings that have each of the different parameters.
We start with II01, which corresponds to meters, in the panel and outlets. In the previous graph, Figure 1, only 12% have meters and not all of them, meaning they have one or two. The remaining 88% do not have this device.
Figure 2 is connected to the previous one. If they have meters, they have defined zones, therefore, the surfaces where those meters read consumption are placed. Since the majority do not have them, the maximum value is 88%; the rest are those that have a meter.
In Figure 3, the devices that the system disconnects when it has a very high consumption peak are depicted. 84% do not have it, and the rest have one and deactivate different equipment.
In Figure 4, the criteria of a dwelling have been taken into account. Since this data cannot be known, one criterion has been placed in all cases, except for one where two criteria were assumed. That's why 49 of the houses have a 98% with one criterion.
Figure 5 represents the uses. Since most houses do not have meters, it has not been possible to determine exactly how many uses they have in all dwellings. Therefore, it has been predetermined that they have at least one use, with 96%. Two of these houses have more than one use, which could be determined with the different data obtained, accounting for the remaining 4%.
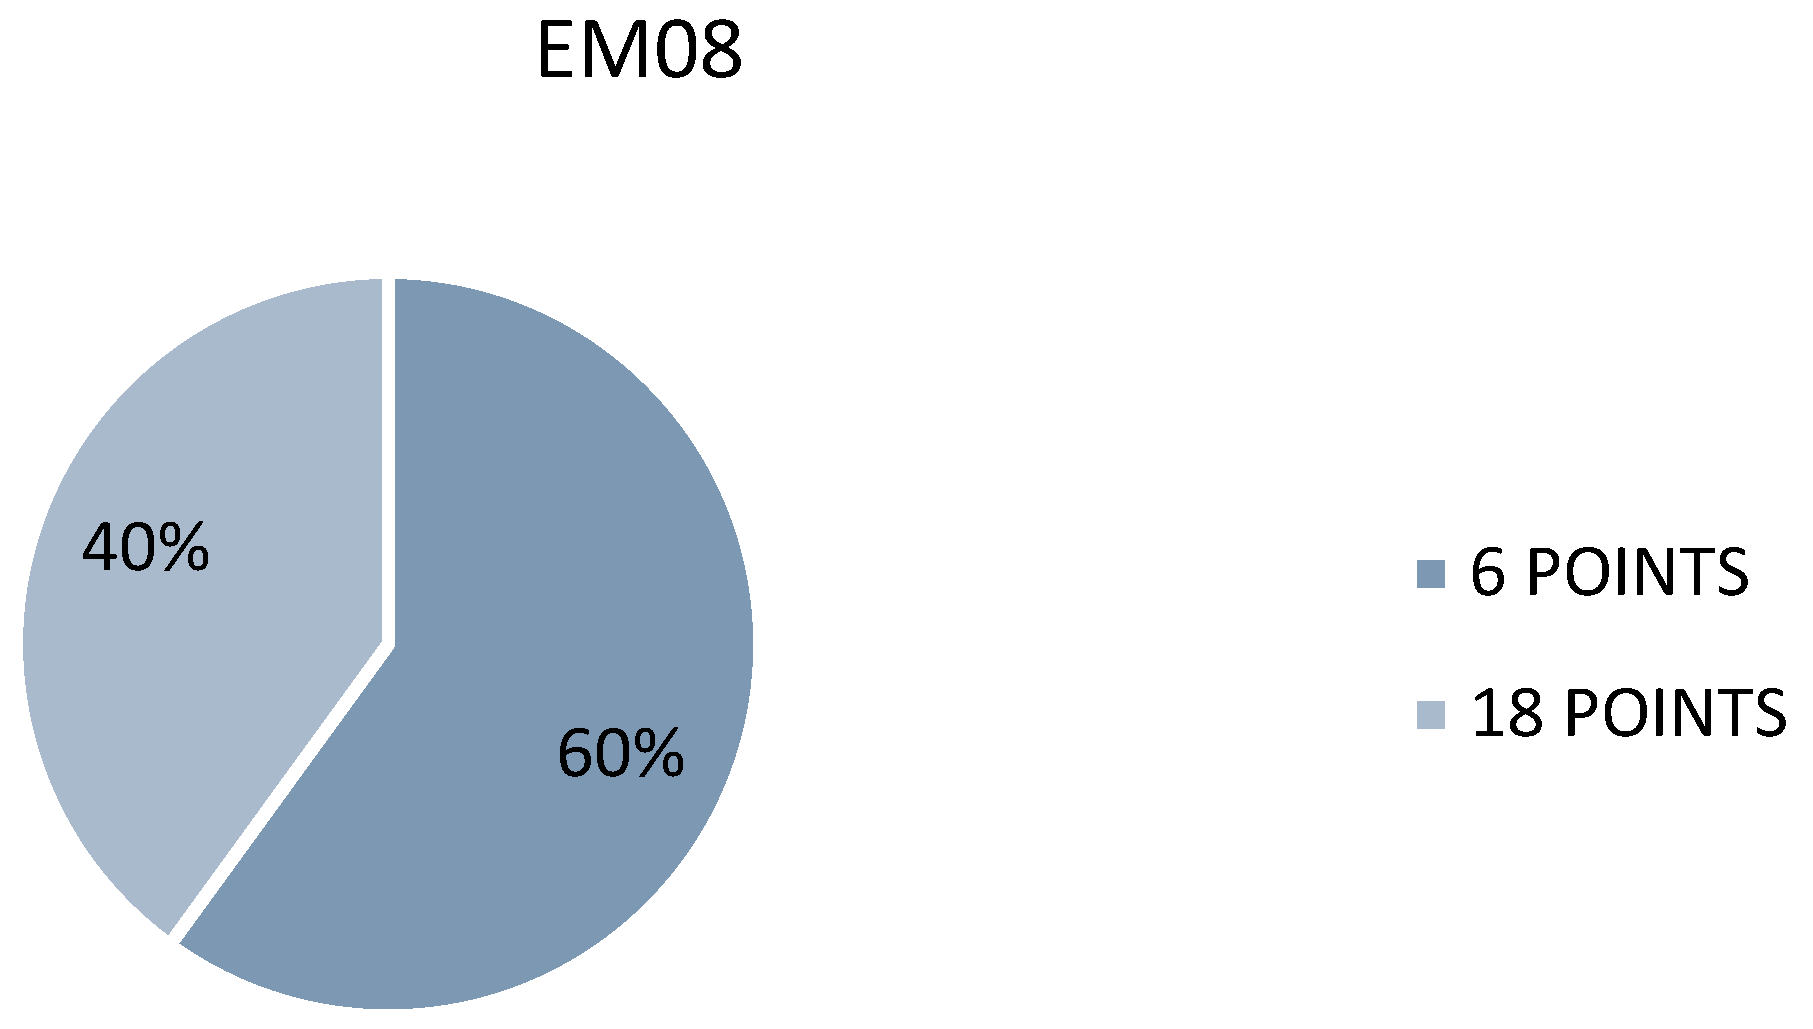
In Figure 6, it is shown whether the houses have air conditioning units installed. All houses know this data and whether they are present in all rooms with thermostat control and time settings. Therefore, 60% of them have air conditioning units with thermostats in some rooms but without time control, and 40% have them at the room level, with thermostats and time control.
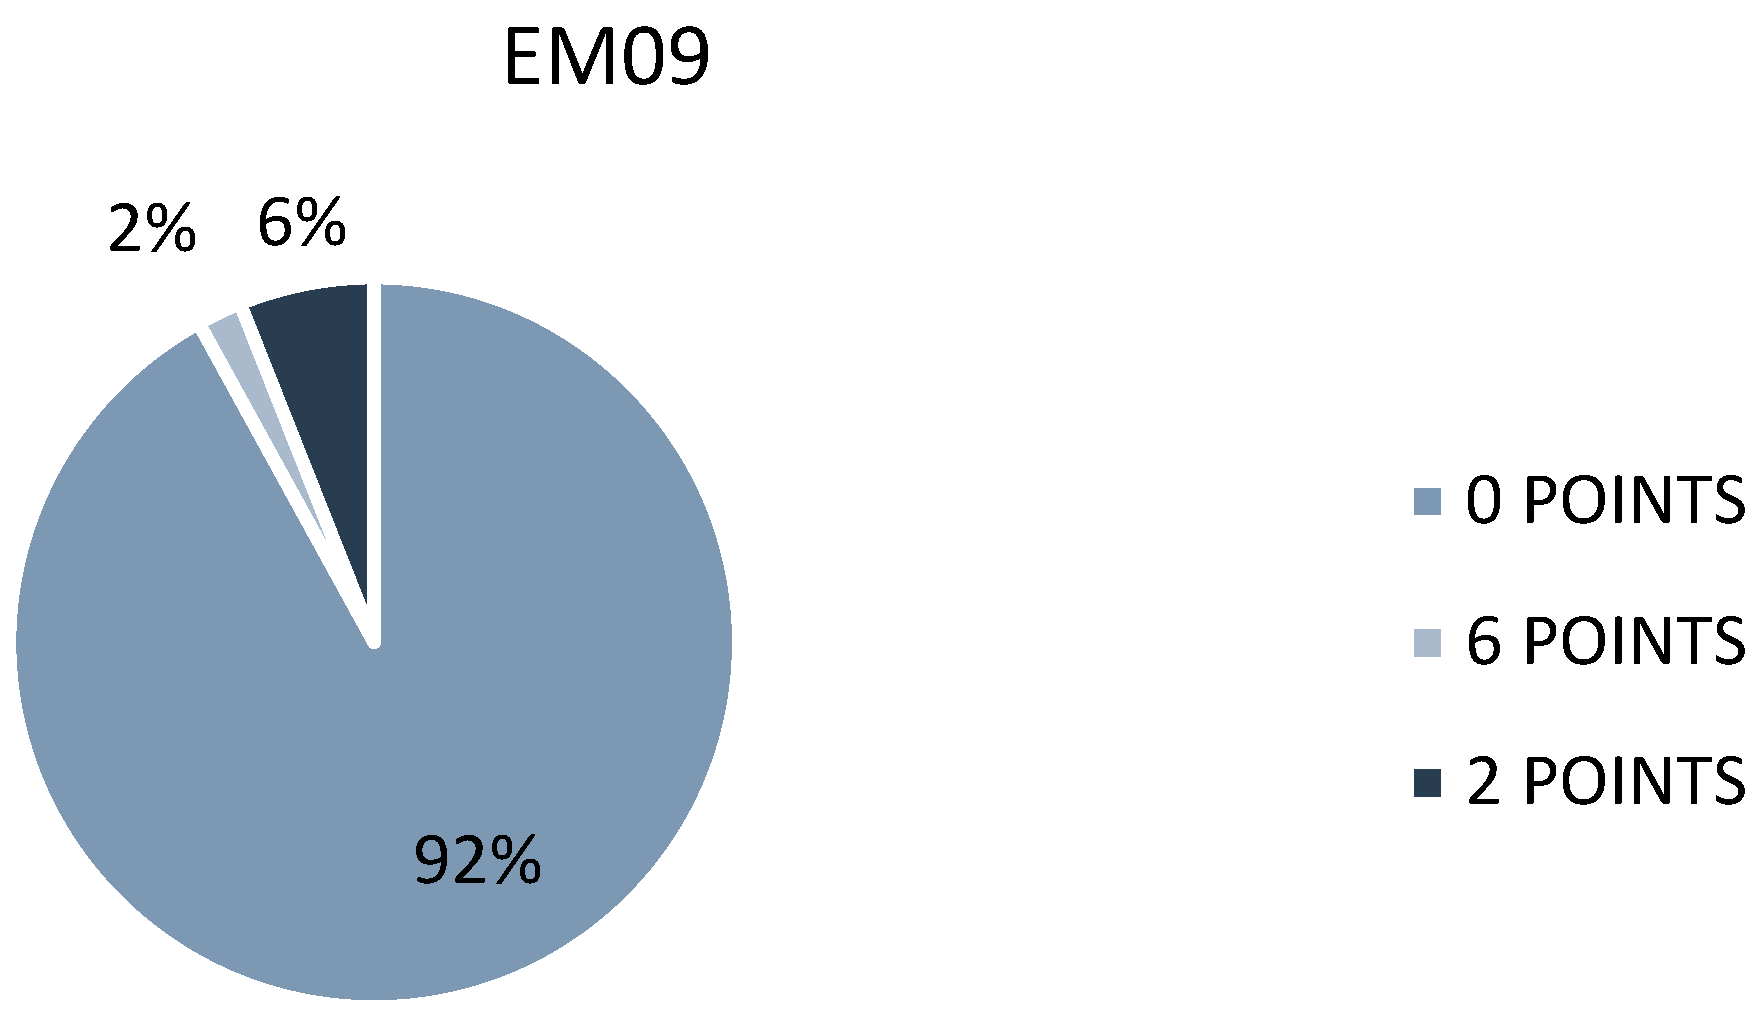
In Figure 7, the majority of cases do not have a controlled lighting installation in their homes (92%). The cases that have it are divided into those that consume a lot and control little (6%) and those that have it well balanced and save energy (2%).
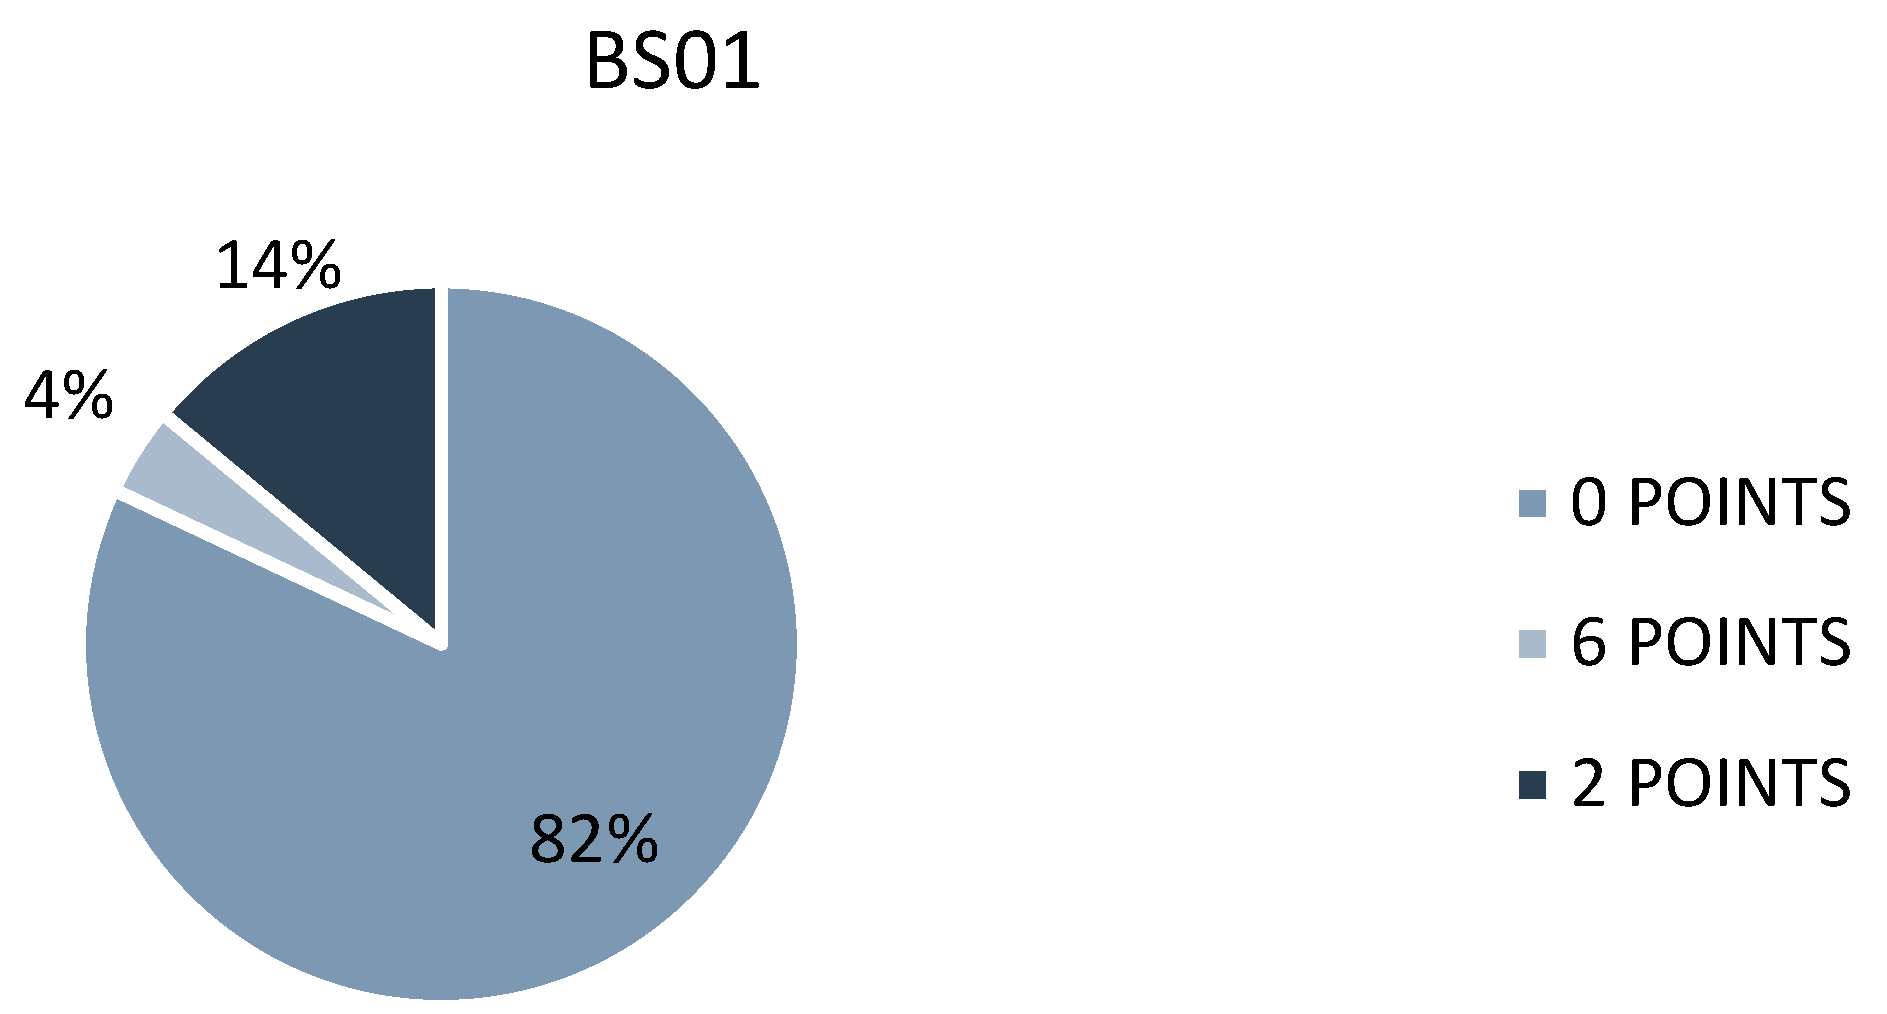
As observed in Figure 8, the majority of cases do not have any renewable energy sources (82%). The rest are divided into two categories: those that have sources and do not save significantly (14%) and those that save a considerable amount (4%).
None of the houses in the study have batteries to store the energy obtained from renewable energy sources.
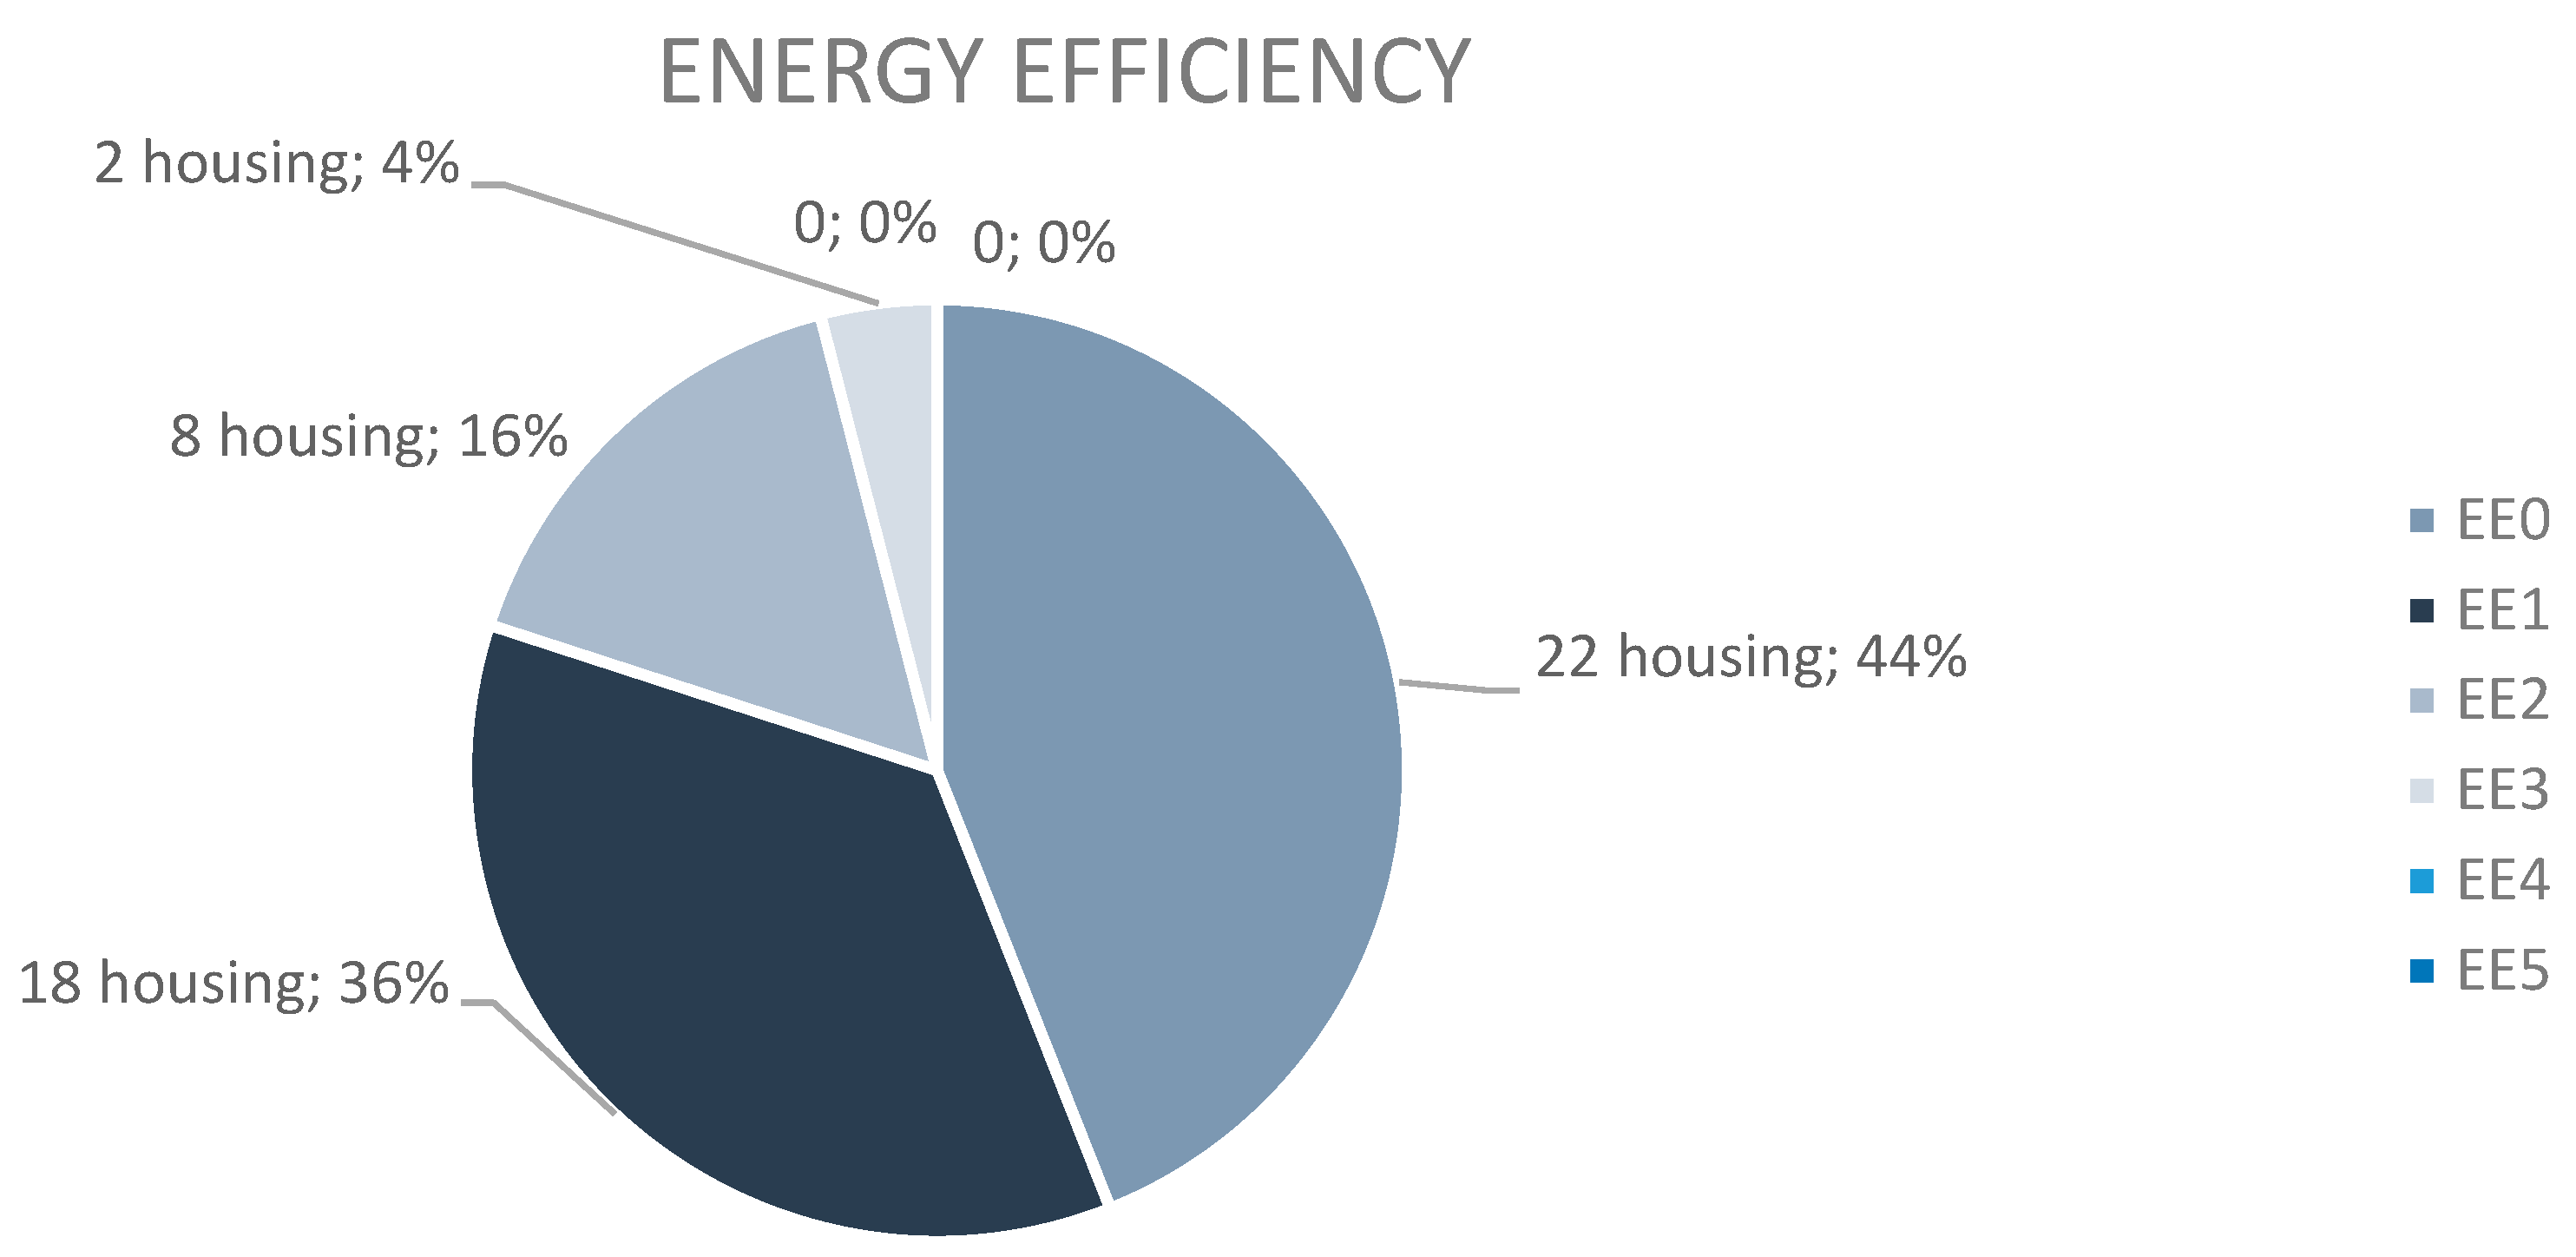
The analysis continues by studying the levels of energy efficiency. That is, with the data previously collected, Figure 9 has been prepared, showing the total energy efficiency values of all cases.
In Figure 9, there are 22 residences with the lowest efficiency value (EE0), the next 18 with EE1, only 8 houses with a positive value (EE2), and the remaining 2 buildings have an intermediate value of EE3. The other higher efficiency levels were not achieved in the study.
The conclusion is that there is a very high number of inefficient houses; 44% with an efficiency of EE0 and 36% with EE1.
To conclude the analysis, the year of construction of the houses will be studied to obtain a result on whether there has been evolution and awareness over the years in the implementation of renewable energies.
Observing the construction years of the 50 residences (see Figure 10), it is concluded that the starting year to divide the study is 1994 because there was a turning point from that date.
As shown in Figure 10, the area shaded in dark blue represents the houses built before 1994, totalizing 17 residences. Only the first two efficiency levels were considered for these houses. 24% of the houses, a total of 12, did not have any devices to improve their efficiency status; 10%, or 5 residences, had an EE1 value, meaning their status had improved but was not very high.
The lighter blue areas in Figure 10 represent houses built after 1994, totalizing 33. It can be observed that there is more variety in efficiency levels. 20%, or 10 houses, continue to maintain a low level of efficiency, as do 28% with an EE1 level. However, it is noteworthy that from this year onwards, residents have become more aware of the importance of saving energy consumption, hence the appearance of EE2 and EE3 values, albeit in very low percentages, 16% and 2% respectively.
Since the 1990s, we have become more aware that we need to be more conservative with what we consume to save the planet. The graph shows that before those dates, there were only two types of efficiency, the lowest EE0 and EE1. In contrast, after that year, we have more variety of efficiency levels, taking into account the higher levels such as EE2 and EE3. In 29 years (1994-2023), we have doubled the number of efficiency levels; previously there were 2, now there are 4.

3.2. Measures to Improve Energy Efficiency in Homes

An exhaustive examination has been carried out on the possible measures that can be implemented in residential buildings, and it has been concluded that the following measures are the most appropriate for different types of homes.
Table 5. Measures.
Table 5. Measures.
MEASURES
Scenario from 0 to 1 Only meters are placed.
Meters with ballast shedding devices.
Meters with conditioning system in some rooms.
Meters with conditioning system in all rooms.
Conditioning system in all rooms.
Meters with lighting control.
Scenario from 1 to 2 Meters, ballast devices, lighting control.
Meters, ballast devices, conditioning system in some rooms.
Meters, ballast devices, conditioning system in all rooms with time control
Scenario from 2 to 3 Meters, ballast devices, conditioning system in some rooms, lighting control.
Meters, ballast shedding devices, conditioning system in some rooms, renewable energy sources.
Meters, ballast devices, conditioning system in all rooms, lighting control.
Meters, ballast shedding devices, conditioning system in all rooms, renewable energy sources.
Meters, de-ballasts, air-conditioning system in all rooms with time control.
Scenario from 3 to 4 Meters, ballast devices, 4 criteria, measured zones > equal 2 and 3, conditioning system in some rooms, lighting control, renewable energy sources.
Meters, de-ballasts, 4 criteria, measured zones > equal 2 and 3, air-conditioning system in all rooms, lighting control, renewable energy sources
Meters, de-gliding devices, 4 criteria, measured zones > equal 2 and 3, conditioning system in all rooms with time control.
Meters, load-shedding devices, 4 criteria, metered zones > equal 2 and 3, conditioning system in some rooms, renewable energy sources, batteries > equal 30%.
Scenario 5 Metering, load-shedding devices, 5 criteria, metered zones > equal 4, air-conditioning system in some rooms, lighting control, renewable energy sources, batteries > equal 30%.
Meters, load-shedding devices, 5 criteria, metered zones > equal 4, conditioning system in all rooms, lighting control.
The aforementioned measures are viable in any residence where one aims to improve the level of energy efficiency, always starting from one of the scenarios, meaning the home must initially have its efficiency value and improvements will be added as desired by the client.

2.3. Validation and Constrast Process

In addition to the 50 residences obtained in the study, 5 residences were set aside to validate and contrast the efficiency levels, as well as the year of construction and the different parameters. This information is shown in Table 6 below.
In Table 6 the different data of the five residences are shown to validate the study. We will start with the efficiency levels, where as it is observed, there are no higher levels, meaning they remain in the lowest ones, thus corroborating the conclusion reached in Figure 10.
Moving on to the year of construction, four out of the five residences were built before the study year, 1994, indicating that before this date, there was no special concern for being more sustainable. Hence, in these cases, the levels remain in the lowest ones, EE0 and EE1, as shown in Figure 11. The remaining residence, with an EE1, indicates that the levels have improved slightly, as depicted in Figure 10.

2.4. Cost of Energy-Saving Measures

The cost of various energy-saving measures has been suggested to enhance efficiency in the analyzed household. However, what is of greatest interest to the client seeking to optimize their home's energy consumption is the analysis of costs associated with the different measures to be implemented. Therefore, a detailed Table 7 has been created, which includes the prices of various devices to be installed, as well as the expenses associated with installations and the required work to carry out all these improvements.
In Table 7, various analyzed prices are displayed. Most of them have fixed costs; however, in the case of meters, two prices are shown due to the existence of two different types: those connected to the electrical panel and those that register from the outlets. Likewise, two types of packages are distinguished in the solar panels, with or without batteries, and within these variants, different panels can be installed depending on the watts to be installed.
Regarding labor costs, hourly rates in euros have been considered, as some installations can be completed in less than a day.
Finally, in the installations, options such as simple or multi-split air conditioning have been taken into account, depending on the client's preferences, as well as heating installations. Additionally, the option of installing home automation for three types of homes according to their size is offered.
Next, Table 8 is presented, detailing all the measures proposed in Table 5, with the associated costs obtained from Table 7.
The Table 8 presents different scenarios, using a standard house as reference, with three bedrooms, two bathrooms, a living room, a kitchen, and an entrance, and the maximum points that can be achieved when moving from one scenario to another. The prices corresponding to each measure have been calculated using Table 7, considering that some measures include an air conditioning system, which may consist of one or several terminal units, as well as heating with two or five radiators, depending on the client's preferences. This is because the study addresses the HVAC system, considering its presence in some or all rooms of the residence.
Initially, the described house has a consumption of 3000 kWh, an area of 150 square meters, a contracted power of 4.4 kW, and a lighting consumption of 3285 kW. Based on these data, the different scenarios have been generated with the corresponding measures, thus improving the level of energy efficiency in each case and calculating the costs associated with each of them.

2.5. Cost of Energy Saving Measures

At this point, five residences with initial data will be selected, and the proposed measures in Table 5 will be implemented to determine if it is possible to increase the level of efficiency in different cases.
The selected residences, as shown in Table 9, are number 7 with an efficiency of EE3, numbers 21 and 52 with EE0, the lowest level of efficiency, number 41 with EE2, and finally number 34 with an EE1. Different levels and residences have been chosen to verify the feasibility of the study. Additionally, a price list will be provided to observe the cost of becoming more efficient.
In house 21, with an initial EE0, it is assumed that the client does not have any type of device to improve energy efficiency, except for a partial control over lighting and a climate control system in some areas of the house. Therefore, the proposal to increase its efficiency level to EE1 involves implementing a single, cost-effective measure, as shown in Table 9, which is to install meters in the electrical panel and on the power outlets. Simply by implementing this small measure, the residence can move to the next level.
If the client wished to employ the other proposed measures to reach EE1, it would be possible, but not necessary, as all the measures increase the points to 16, according to Table 9. Therefore, it is considered that the client prefers to spend as little as possible.
In residence 52, starting with an EE0, the difference from the previous case is that there is no control over lighting. Therefore, the proposed measure is to install meters in the electrical panel and on the power outlets, and demand response devices on some appliances in the residence to disconnect them during peak consumption. The cost of this measure is higher than the previous one, as shown in Table 9. Again, the points for all three proposed measures are very similar, so it doesn't matter which one is chosen; they all increase the efficiency level to EE1. Therefore, the most economical measure is presented.
Residence 34, with an EE1, already has climate control in all rooms with thermostat and timer control. This is an exceptional case because even with just one measure implemented, it has a much higher efficiency level than other cases. However, an attempt will still be made to increase efficiency by installing meters in the electrical panel and on the power outlets. This measure is not listed to move from EE1 to EE2, but as mentioned earlier, this is an exceptional case.
To conclude, with just one cost-effective measure, such as installing meters in the residence, the efficiency level is raised to EE2.
Residence 41, with an initial EE2, already has meters and climate control in some areas. Therefore, the proposal is to install demand response devices on some of the residence's appliances and control 65% of the lighting. This case is also exceptional because the measure to be implemented will be partial, as the client already has some devices installed. Therefore, the cost is lower than in Table 8, as the prices for those already installed devices have been omitted. The final cost is found in Table 9, depending on the type of climate control system installed. Only with this measure, which is somewhat expensive, would EE3 be reached. Again, with all the proposed measures, the same number of points is obtained, so the most cost-effective one has been chosen.
Finally, residence number 7, which has an initial energy efficiency level of EE3, has already begun installing meters, demand response devices, renewable energy sources without batteries, as well as a climate control system in all rooms equipped with a thermostat and temperature and time control.
The measure to be implemented is to install three additional meters between the electrical panel and the power outlets and for the client to increase the criteria in the residence to three, although this does not incur any cost. Therefore, the price is minimal, as shown in Table 9, to achieve an efficiency level of EE4.

4. Conclusions

The main purpose of this study was to evaluate energy efficiency and seek to improve the energy classification in the residential sector of the autonomous community of Extremadura.
One key finding is related to the year of construction. It was observed that houses built before 1994 had very low energy efficiency ratings. However, after that year, a greater diversity of higher ratings was evident. In other words, as we move forward in time, people are more aware of the environment and the preservation of the planet.
This research can contribute to raising awareness in the Extremadura community about the possibilities in a territory with abundant sun and extensive rural areas. Although it faced limitations in data acquisition, the results from the 50 houses provided valuable insights applicable in community practice.
The methodology employed proved to be effective in addressing the research questions, from data collection to the analysis of energy ratings, using the Excel tool. The results obtained were clear and effective, making them applicable in future residential interventions. Additionally, it is important to note that the tool used to obtain efficiency levels also comes from the Excel program [11].
In conclusion, we emphasize that energy efficiency is crucial in the 21st century, and we all share the responsibility of caring for the planet to ensure its habitability in the years to come. Every small gesture contributes to a cleaner and more sustainable future.

Author Contributions

Conceptualisation, J.F.G., D.C.-F. and M.A.P.T.; methodology, M.A.P.T and D.D.A; software, M.A.P.T. and D.D.A.; validation, M.A.P.T.; formal analysis, M.A.P.T. and D.C.-F.; investigation, M.A.P.T; resources, J.F.G., D.C.-F.; data curation, M.A.P.T., D.D.A. and D.C.-F.; writing—original draft preparation, M.A.P.T.; writing—review and editing, J.F.G.G. and M.A.P.T.; visualisation, J.F.G.G; supervision, J.F.G.G.; project administration, J.F.G., D.C.-F.; funding acquisition, J.F.G., D.C.-F. All authors have read and agreed to the published version of the manuscript.

Institutional Review Board Statement

Not applicable.

Informed Consent Statement

Not applicable.

Data Availability Statement

Unavailable data due to privacy restriction.

Acknowledgments

We thank the Project TED2021-132326B-I00 financed by MCIN/AEI /10.13039/501100011033 and by the European Union NextGenerationEU/PRTR for their financial support.

Conflicts of Interest

The authors declare no conflict of interest.

References

  1. BOLETÍN OFICIAL DEL ESTADO, “DECISIÓN no 406/2009/CE DEL PARLAMENTO EUROPEO Y DEL CONSEJO de 23 de abril de 2009 sobre el esfuerzo de los Estados miembros para reducir sus emisiones de gases de efecto invernadero a fin de cumplir los compromisos adquiridos por la Comunidad hasta 2020,” 2009.
  2. B. Li, “The role of financial markets in the energy transition: an analysis of investment trends and opportunities in renewable energy and clean technology,” Environmental Science and Pollution Research, vol. 30, no. 43, pp. 97948–97964, Sep. 2023. [CrossRef]
  3. BOLETÍN OFICIAL DEL ESTADO, “DIRECTIVA (UE) 2018/ 2002 DEL PARLAMENTO EUROPEO Y DEL CONSEJO - de 11 de diciembre de 2018 - por la que se modifica la Directiva 2012/ 27/ UE relativa a la eficiencia energética,” 2018.
  4. T. F. Stocker et al., Cambio climático 2013 Bases físicas Resumen para responsables de políticas Resumen técnico Preguntas frecuentes Editado por. 2013.
  5. G. Swathi, P. Srinivasa Varma, S. R. Donepudi, and K. Ramash Kumar, “Consumer-Centric Rate Design for Peak Time Energy Demand Coincidence Reduction at Domestic Sector Level-A Smart Energy Service for Residential Demand Response,” Journal of Electrical and Computer Engineering, vol. 2022, 2022. [CrossRef]
  6. Renewable Energy Agency and G. Renewables Alliance, “Global Renewables Alliance TRIPLING RENEWABLE POWER AND DOUBLING ENERGY EFFICIENCY BY 2030 CRUCIAL STEPS TOWARDS 1.5°C 3 2 0 0,” 2023. [Online]. Available: www.globalrenewablesalliance.org/.
  7. J. Goldemberg, United Nations Development Programme., United Nations. Department of Economic and Social Affairs., and World Energy Council., World energy assessment : energy and the challenge of sustainability. United Nations Development Programme, 2000.
  8. K. Muley, “Greenhouse Gases and Their Impact on Global Warming,” 2023. [CrossRef]
  9. ASOCIACIÓN ESPAÑOLA DE NORMALIZACIÓN, “UNE-EN 15900: Servicios de eficiencia energética. Definiciones y requisitos esenciales,” 2010. [Online]. Available: www.aenor.es.
  10. S. Naiyer and S. S. Abbas, “Effect of Greenhouse Gases on Human Health,” in Greenhouse Gases: Sources, Sinks and Mitigation, Springer Nature, 2022, pp. 85–106. [CrossRef]
  11. D. Carmona, F. Silvia, and R. Suero, “Propuestas educativas y de investigación para una gestión energética eficiente,” OCTAEDRO S.L., 2023, pp. 59–83.
  12. BOLETÍN OFICIAL DEL ESTADO, “Directiva 2010/31/UE del Parlamento Europeo y del Consejo, de 19 de mayo de 2010, relativa a la eficiencia energética de los edificios,” 2010.
  13. BOLETÍN OFICIAL DEL ESTADO, “Directiva (UE) 2018/ del Parlamento Europeo y del Consejo, de 30 de mayo de 2018, por la que se modifica la Directiva 2010/31/UE relativa a la eficiencia energética de los edificios y la Directiva 2012/27/UE relativa a la eficiencia energética,” 2018.
  14. BOLETÍN OFICIAL DEL ESTADO, “Real Decreto 390/2021, de 1 de junio, por el que se aprueba el procedimiento básico para la certificación de la eficiencia energética de los edificios.,” 2021.
  15. BOLETÍN OFICIAL DEL ESTADO, “BOE A 2021-9176 Consolidado, de 1 de junio, por el que se aprueba el procedimiento básico para la certificación de la eficiencia energética de los edificios.,” 2021.
  16. A. C. Silvosa, A. Faina, J. Lopez-Rodriguez, and P. Montes-Solla, “Expert evaluation network delivering policy analysis on the performance of Cohesion policy 2007-2013 Year 1-2011 Task 1: Policy paper on Renewable Energy and Energy Efficiency of,” 2011. [Online]. Available: https://www.researchgate.net/publication/260675352.
  17. Aenor, “UNE-EN ISO 50001 2018 Sistemas de gestión de la energía. Requisitos con orientación para su uso.,” 2018.
  18. Aenor, “UNE-HD 60364-8-1 2020 Instalaciones eléctricas de baja tensión. Parte 8-1: Aspectos funcionales. Eficiencia energética.,” 2020.
  19. N. E. P. (Conuee), L. E. F. (GIZ) Lázaro Flores Díaz (Consultor independiente), “MANUAL Para la Implementación de un Sistema de Gestión de la Energía SEGUNDA EDICIÓN,” 2016.
  20. Marina A. Pavón Tapia, “Cuestionario: Certificación energética de instalaciones eléctricas en viviendas.” Accessed: Mar. 11, 2024. [Online]. Available: https://docs.google.com/forms/d/12WFWgCRwkAm2KGE-UYSssjUcrnFthubfpATABz7Naao/viewform?edit_requested=true.
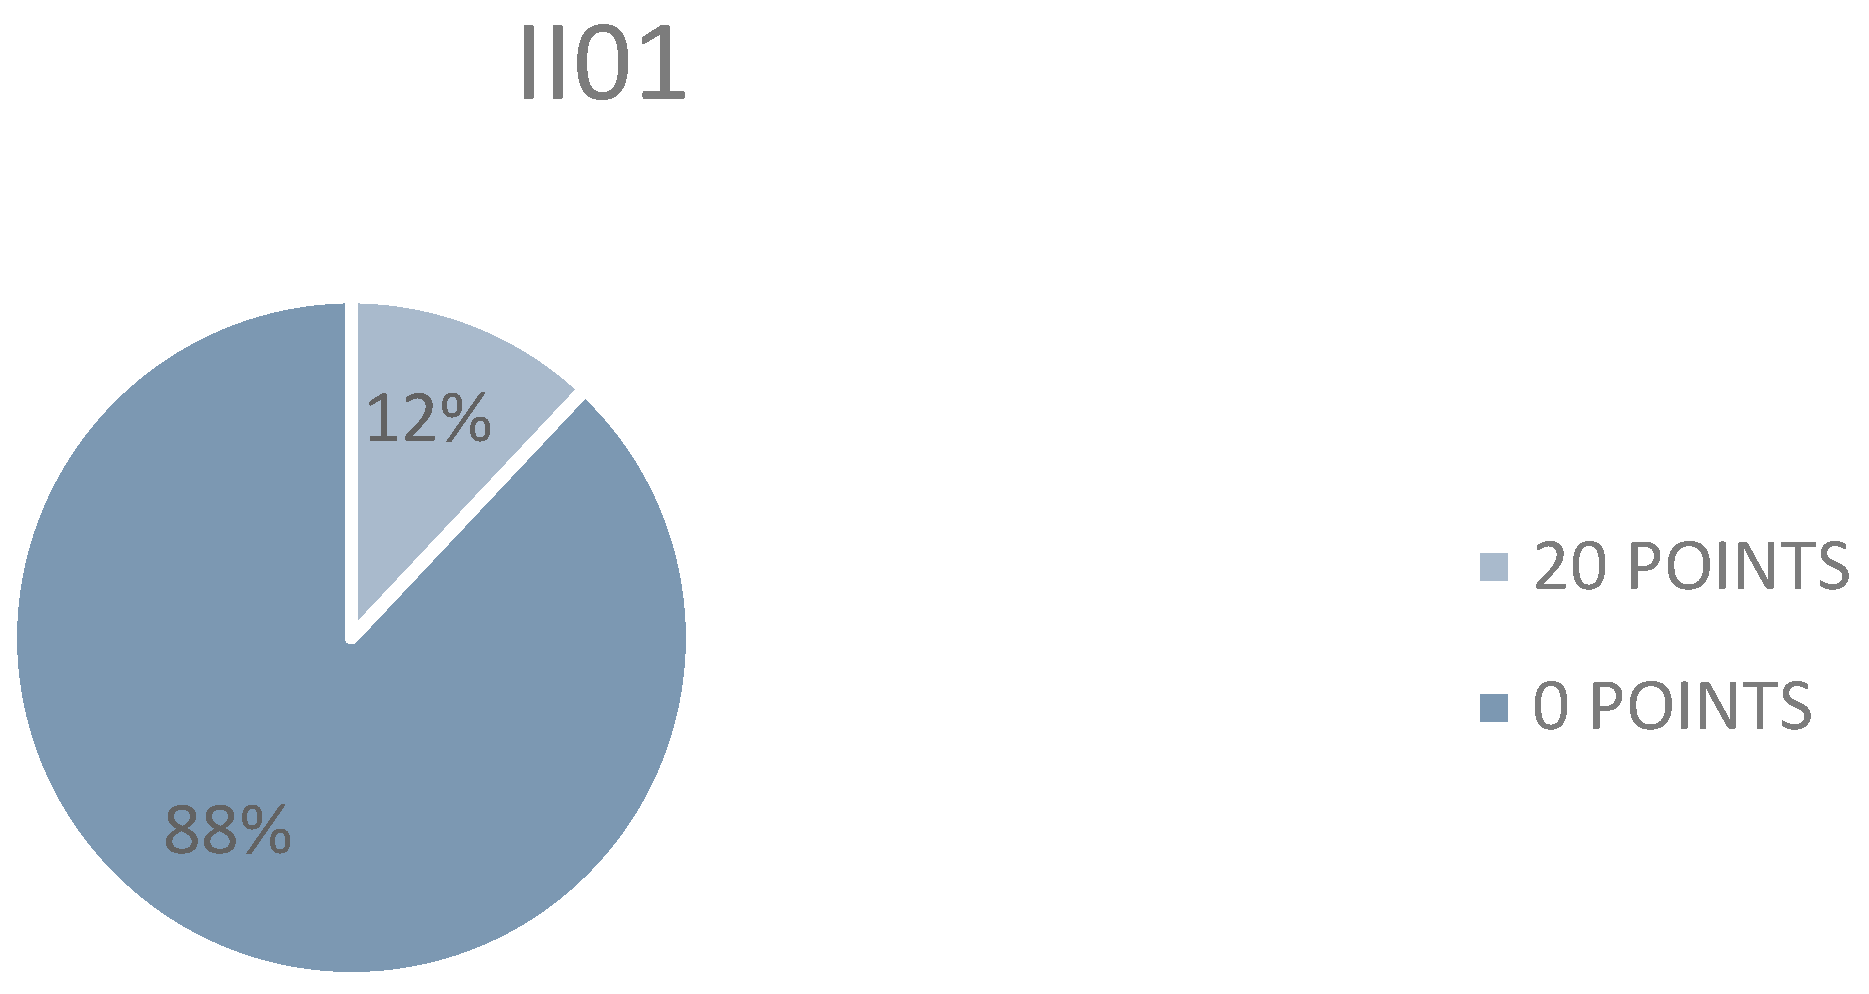
Figure 1. Parameter II01.
Preprints 104637 g001
Figure 2. Parameter EM01.
Preprints 104637 g002
Figure 3. Parameter EM03.
Preprints 104637 g003
Figure 4. Parameter EM04.
Preprints 104637 g004
Figure 5. Parameter EM05.
Preprints 104637 g005
Figure 6. Parameter EM08.
Preprints 104637 g006
Figure 7. Parameter EM09.
Preprints 104637 g007
Figure 8. Parameter BS01.
Preprints 104637 g008
Figure 9. Energy efficiency of the 50 cases.
Preprints 104637 g009
Figure 10. Year of construction of the dwellings.
Preprints 104637 g010
Table 1. Energy efficiency levels.
EE0 EE1 EE2 EE3 EE4 EE5
POINTS From 0 to 14 From 15 to 30 From 31 to 49 Fro 50 to 69 D From 70 to 89 From 90 or more
Table 2. Parameter values.
Parameter Application values Points
II01 < 40% 0
≥ 40% y < 50% 2
≥ 50% y < 60% 6
≥ 60% y < 80% 10
≥ 80% y < 90% 16
≥ 90% 20
EM01 < 40% 0
≥ 40% y < 60% 1
≥ 60% y < 80% 2
≥ 80% 3
EM03 < 10% 0
≥ 10% y < 50% 4
≥ 50% y < 60% 10
≥ 80% 16
EM04 0 or less than 80% of the circuits are considered 0
1 2
2 5
3 10
4 15
More of 4 20
EM05 0 0
≥ 1 y < 2 4
≥ 2 y 3 10
≥ 3 y < 4 16
≥ 4 20
EM08 Without consideration 0
Temperature control 6
Temperature control at room level 12
Temperature and level control at room level 18
EM09 < 10% 0
≥ 10% y < 50% 2
≥ 50% 6
BS01 < 5% 0
≥ 5% y < 30% 2
≥ 30% y < 60% 3
≥ 60% y < 80% 4
≥ 80% 6
BS02 < 5% 0
≥ 5% y < 15% 1
≥ 15% y < 30% 2
≥ 30% 3
Table 3. Quiz questions.
SECTION QUESTIONS DESCRIPTION
1 Emai A means of contact with the client is needed in case of any disagreement with the results
2 Location Location where the dwelling is situated
Year of construction The year the home was built
Annual consumption Total consumption of the electrical installation
Total area Square meters of the home
Consumption meters Meters to control the consumption of your home
3 Meter and network The meter gives a value equal to that of the network
4 Meter connection What circuit the meter is connected to, the brand consumption of the meter and the surface it measures
5 Meter connected to power outlet Meter that controls the consumption of the mesh to which it is connected
6 Number of connected meters The total number of meters connected to the outlets
Area Surface in square meters measured by the previous devices
Consumption Number measured by meters, annually
7 Hired potency Power, in kilowatts, contracted in the invoice
Ballast shedding devices Devices to turn off the device to which it is connected when there is a peak in consumption
8 Shedding power Sum of power of those devices that are disconnected
9 Conditioning system Ventilation and/or heating system
10 Air conditioning in all rooms or in some Ventilation and/or heating system in all rooms or in some areas of the home
11 Air conditioning with thermostat without time control or with time control How to control the air conditioning system
12 Lighting control Installation of a device to control home lighting
13 Consumption of controlled and total lighting Consumption values for house lighting, controlled and total
14 Renewable energy sources Devices to generate self-sufficient energy
15 Total energy production Value of energy generated by renewable means
Storage devices There are solar batteries in the home
16 Battery capacity Value, in Ah, of the battery
Battery voltage Value, in V, of the battery
Table 4. Parámetros de las viviendas.
POINTS OBTAINED Number of houses %
II01 20 POINTS 6 12%
0 POINTS 44 88%
EM01 3 POINTS 6 12%
0 POINTS 44 88%
EM03 10 POINTS 6 12%
0 POINTS 42 84%
4 POINTS 2 4%
EM04 2 POINTS 1 2%
0 POINTS 49 98%
EM05 4 POINTS 48 96%
10 POINTS 2 4%
EM08 6 POINTS 30 60%
18 POINTS 20 40%
EM09 0 POINTS 46 92%
6 POINTS 1 2%
2 POINTS 3 6%
BS01 0 POINTS 41 82%
6 POINTS 2 4%
2 POINTS 7 14%
BS02 0 POINTS 50 100%
20 POINTS 6 12%
Table 6. Parameters of the remaining 5 dwellings.
HOUSES Efficiency levels Year of construction Points
51 EE1 2003 18
52 EE0 1950 6
53 EE1 1980 18
54 EE0 1932 0
55 EE0 1980 6
Table 7. Cost of energy-saving measures.
TYPES PRICE (€) PRICE (€/h)
DEVICE Meters 19,99 – 25,99
Dredging apparatus 20,53
Air conditioning 389
Thermostat 54,99
Radiator 192
Boiler 1559
Solar panels (100 W) 100
Solar panels (175 W) 240
Solar panels (2* 100 W) 190
Solar panels with battery (1 kWh /day) 620
Solar panels with battery (2 kWh /day) 790
Solar panels with battery (3 kWh /day) 1170
LABOUR Electrician 30 € / h.
Home automation installer 17024 – 24286 € /annuales 45,763
Solar panel installer (mid-range) 23350 €/annuales 62,768
INSTALLATIONS Simple air conditioning installation 375
Multi Split air conditioning installation 550+(389 * uds. of air conditioning)
Heating installation (IRI* + RITE*) 560+190
Home automation system installation Apartment (50 – 100) m2 650-2000
Home automation installation Single-family house (200 – 300) m2 2400 - 4000
Home automation installation in detached house (400- 500) m2 5000 - 8000
*IRI: Individual Receiving Installation. This is the one you need to guarantee that the conditions of the gas installation in your home or premises are adequate, and thus be able to register it. *RITE: The “Reglamento de Instalaciones Térmicas en los Edificios” is the Spanish regulation that regulates the design, installation and maintenance of air conditioning and domestic hot water production installations.
Table 8. Costs of the Proposed Measures.
SCENARIOS MAXIMUN POINTS MEASUREMENTS POINTS OBTAINED TYPES COSTS (€)
Initial 0 0 - 14 None 0 - 0
From 0 to 1 15 - 30 1 16 - 55,99
2 16 -- 76,52
3 16 Air conditioning 1 819,99
Heating 2 radiators 2748,99
4 16 Air conditioning 5 2550,99
Heating 7 radiators 3708,99
5 18 Air conditioning 5 2495
Heating 7 radiators 3653
6 16 - 2201,753
From 1 to 2 31 - 49 1 42 - 2222,283
2 46 Air conditioning 1 840,52
Heating 2 radiators 2769,52
3 48 Air conditioning 5 2626,51
Heating 7 radiators 3729,52
From 2 to 3 50 - 69 1 52 Air conditioning 1 2986,283
Heating 2 radiators 4915,283
2 52 Air conditioning 1 1473,288
Heating 2 radiators 3402,288
3 52 Air conditioning 5 4717,283
Heating 7 radiators 5875,283
4 50 Air conditioning 5 3014,288
Heating 7 radiators 4172,288
5 58 Air conditioning 5 2626,51
Heating 7 radiators 3784,51
From 3 to 4 70 - 89 1 70 Air conditioning 1 3429,051
Heating 2 radiators 5358,051
2 70 Air conditioning 5 5160,051
Heating 7 radiators 6318,051
3 73 Air conditioning 5 2626,51
Heating 7 radiators 3784,51
4 70 Air conditioning 1 1693,288
Heating 2 radiators 3622,288
From 4 to 5 90 1 90 Air conditioning 1 3839,051
Heating 2 radiators 5768,051
2 94 Air conditioning 5 4717,283
Heating 7 radiators 5875,283
Table 9. Improvements in housing with the proposed measures.
INITIAL SCENARIO ADDITIONAL MEASURES COSTS (€) INITIAL SCENARIO
HOUSE 21 (EE0) No meters Placing meters 55,99 HOUSE 21 (EE1)
No de-tracking devices
No renewable energy sources
Air conditioning in some areas
Lighting control
HOUSE 52 (EE0) No meters Placing meters and de-tracking devices 76,52 HOUSE 52 (EE1)
No de-tracking devices
No renewable energy sources
Air conditioning in some areas
No lighting control
HOUSE 34 (EE1) No meters Placing meters 55,99 HOUSE 34 (EE2)
No de-tracking devices
No renewable energy sources
Air-conditioning in all rooms with temperature and time.
No lighting control
HOUSE 41 (EE2) Yes meters Lighting control and light control devices Air conditioning2196,293
Heating
2388,293
HOUSE 41 (EE3)
No de-tracking devices
No renewable energy sources
Air conditioning in some areas
No lighting control
HOUSE 7 (EE3) Yes meters More meters are placed
Proposed to client to increase criteria to 3
55,99 HOUSE 7 (EE4)
Yes de-tracking devices
Yes renewable energy sources without batteries
Air conditioning in all rooms with temperature and time control
Yes lighting control
Disclaimer/Publisher’s Note: The statements, opinions and data contained in all publications are solely those of the individual author(s) and contributor(s) and not of MDPI and/or the editor(s). MDPI and/or the editor(s) disclaim responsibility for any injury to people or property resulting from any ideas, methods, instructions or products referred to in the content.
Copyright: This open access article is published under a Creative Commons CC BY 4.0 license, which permit the free download, distribution, and reuse, provided that the author and preprint are cited in any reuse.
Prerpints.org logo

Preprints.org is a free preprint server supported by MDPI in Basel, Switzerland.

Subscribe

© 2024 MDPI (Basel, Switzerland) unless otherwise stated