1. Introduction
Ovarian cancer is a prevalent illness and at diagnosis, the median age is 63 years old. [1, 2]. Germ cell tumors are more common among individuals under 20; borderline tumors are more common in patients in their 30s and 40s; and epithelial ovarian cancer is more common in women who are 50 or older. [
2]. It is the sixth most common cancer in women overall and the third most common gynecological cancer (after endometrial and cervical cancers), causing over
200,000 deaths globally per annum [
3]. The strongest predictors of a decreased risk of ovarian cancer are breastfeeding, parity, tubal ligation, hysterectomy, use of contraceptive pills, and bilateral adnexectomy [
4,
5,
6]. Approximately 10% of patients with ovarian cancer have a genetic predisposition like
BRCA1 or
BRCA2 gene mutations or Lynch syndrome [
7]. Because of this, early detection of ovarian cancer is most important for its treatment, as auspicious treatment outcomes are better within the early stages of the disease [
3]. Regrettably, most ovarian tumors are detected in the later stages of development, mostly due to the non-specificity of symptoms and overdue gynecological examination [
8]. Tests evaluated for screening generally fail to diagnose ovarian cancer promptly to decrease the death rate and have led to unnecessary surgical procedures for false-positive results [
9].
Cancer stem cells (CSCs) are a rapidly expanding subset of tumor cells that can replicate and reappear as primary tumors [
10]. Because of their ability for self-healing and initial tumor recurrence, CSCs are possible targets for therapeutic efforts. [
11]. CSCs in ovarian cancer are usually defined by CD44
+, CD117
+, CD24
+, CD133
+, CD49f
+, or Aldehyde dehydrogenase (ALDH)
+ phenotype. They are considered to be the cause of treatment resistance in several malignancies, including ovarian cancer. [
12].
Another possible biomarker for ovarian cancer is glycosphingolipids (GSLs) which are crucial segments of the cell plasma membrane and are composed of hydrophilic carbohydrate residues and hydrophobic ceramides. Many cellular activities are regulated by them, including adhesion, proliferation, apoptosis, recognition, alterations of signaling channels, and metastasis. [
13,
14].
A complex disease requires complex forms of treatment, and in this case, there are not many options. For this reason, it is necessary to find new ways of treating ovarian tumors, especially those that are diagnosed in the late development of the disease [7, 8], and newly synthesized compounds could fulfill this role.
Thieno[2,3-
b]pyridines were invented using virtual high throughput screens (vHTS) as possible modifiers of phospholipase C isoforms. They have antitumor effects on numerous tumor cell lines, including ovarian tumor cells [
15]. Thieno[2,3-
b]pyridine derivatives are known to moderate multiple biological targets, such as G protein-coupled receptor (GPCR), P2Y12 platelet receptor, a DNA repair enzyme, tyrosyl DNA phosphodiesterase 1, colchicine binding site tubulin, phospholipase C-δ1, PIM1-like kinases, and eEF2K, elongation kinases eukaryotic factor 2 and cyclooxygenase [
16]. One of the thieno[2,3-
b]pyridine derivatives’ effects is a change in the expression of glycosphingolipids (GSLs) on the cellular plasma membrane of many tumor CSCs and non-CSCs [
17].
This study aimed to elucidate the potential effect of thieno[2,3-
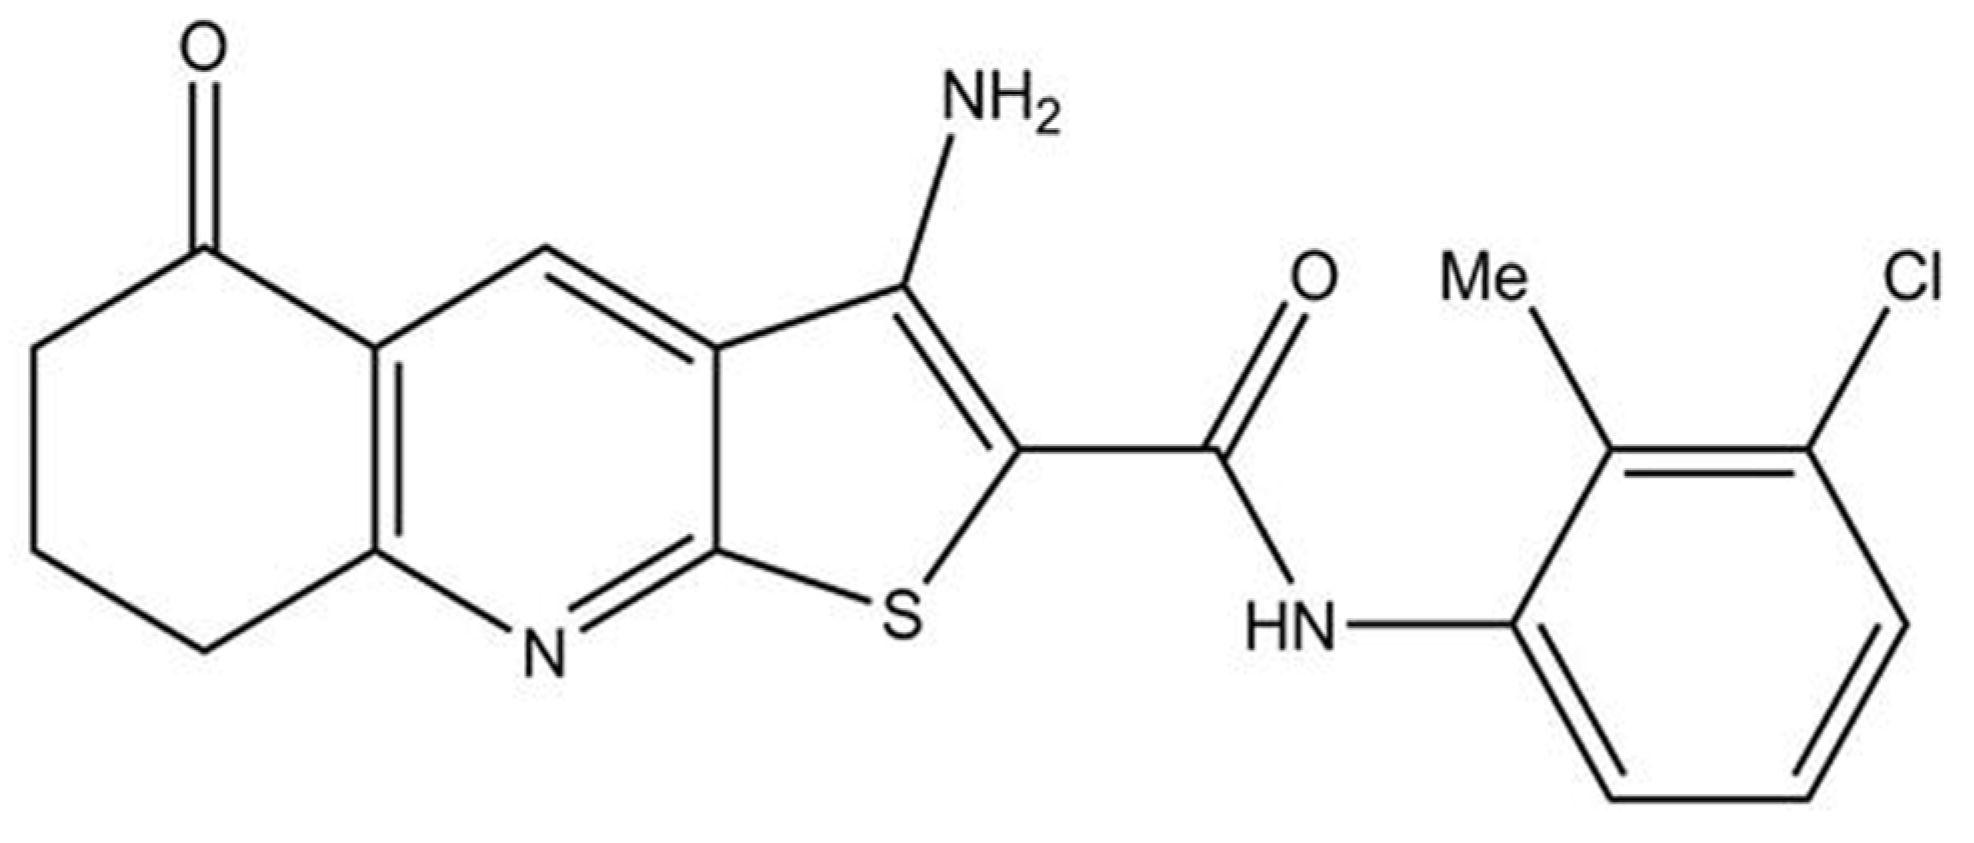
b]pyridine derivatives on ovarian cancer cells and obtain insight into possible mechanisms of action, which may allow the potential development of these compounds into a new drug in treating this cancer. We started our research with 4 different thieno[2,3-
b]pyridine compounds. Chosen 3-Amino-
N-(3-chloro-2-methylphenyl)-5-oxo-5,6,7,8-tetrahydrothieno[2,3-
b]quinoline-2-carboxamide (Compound 1) was the most potent, whose structure and mechanisms of action on other cancer types are known [
16,
18] (
Figure 1).
3. Discussion
To the best of our knowledge, 3-amino-
N-(3-chloro-2-methylphenyl)-5-oxo-5,6,7,8-tetrahydrothieno[2,3-
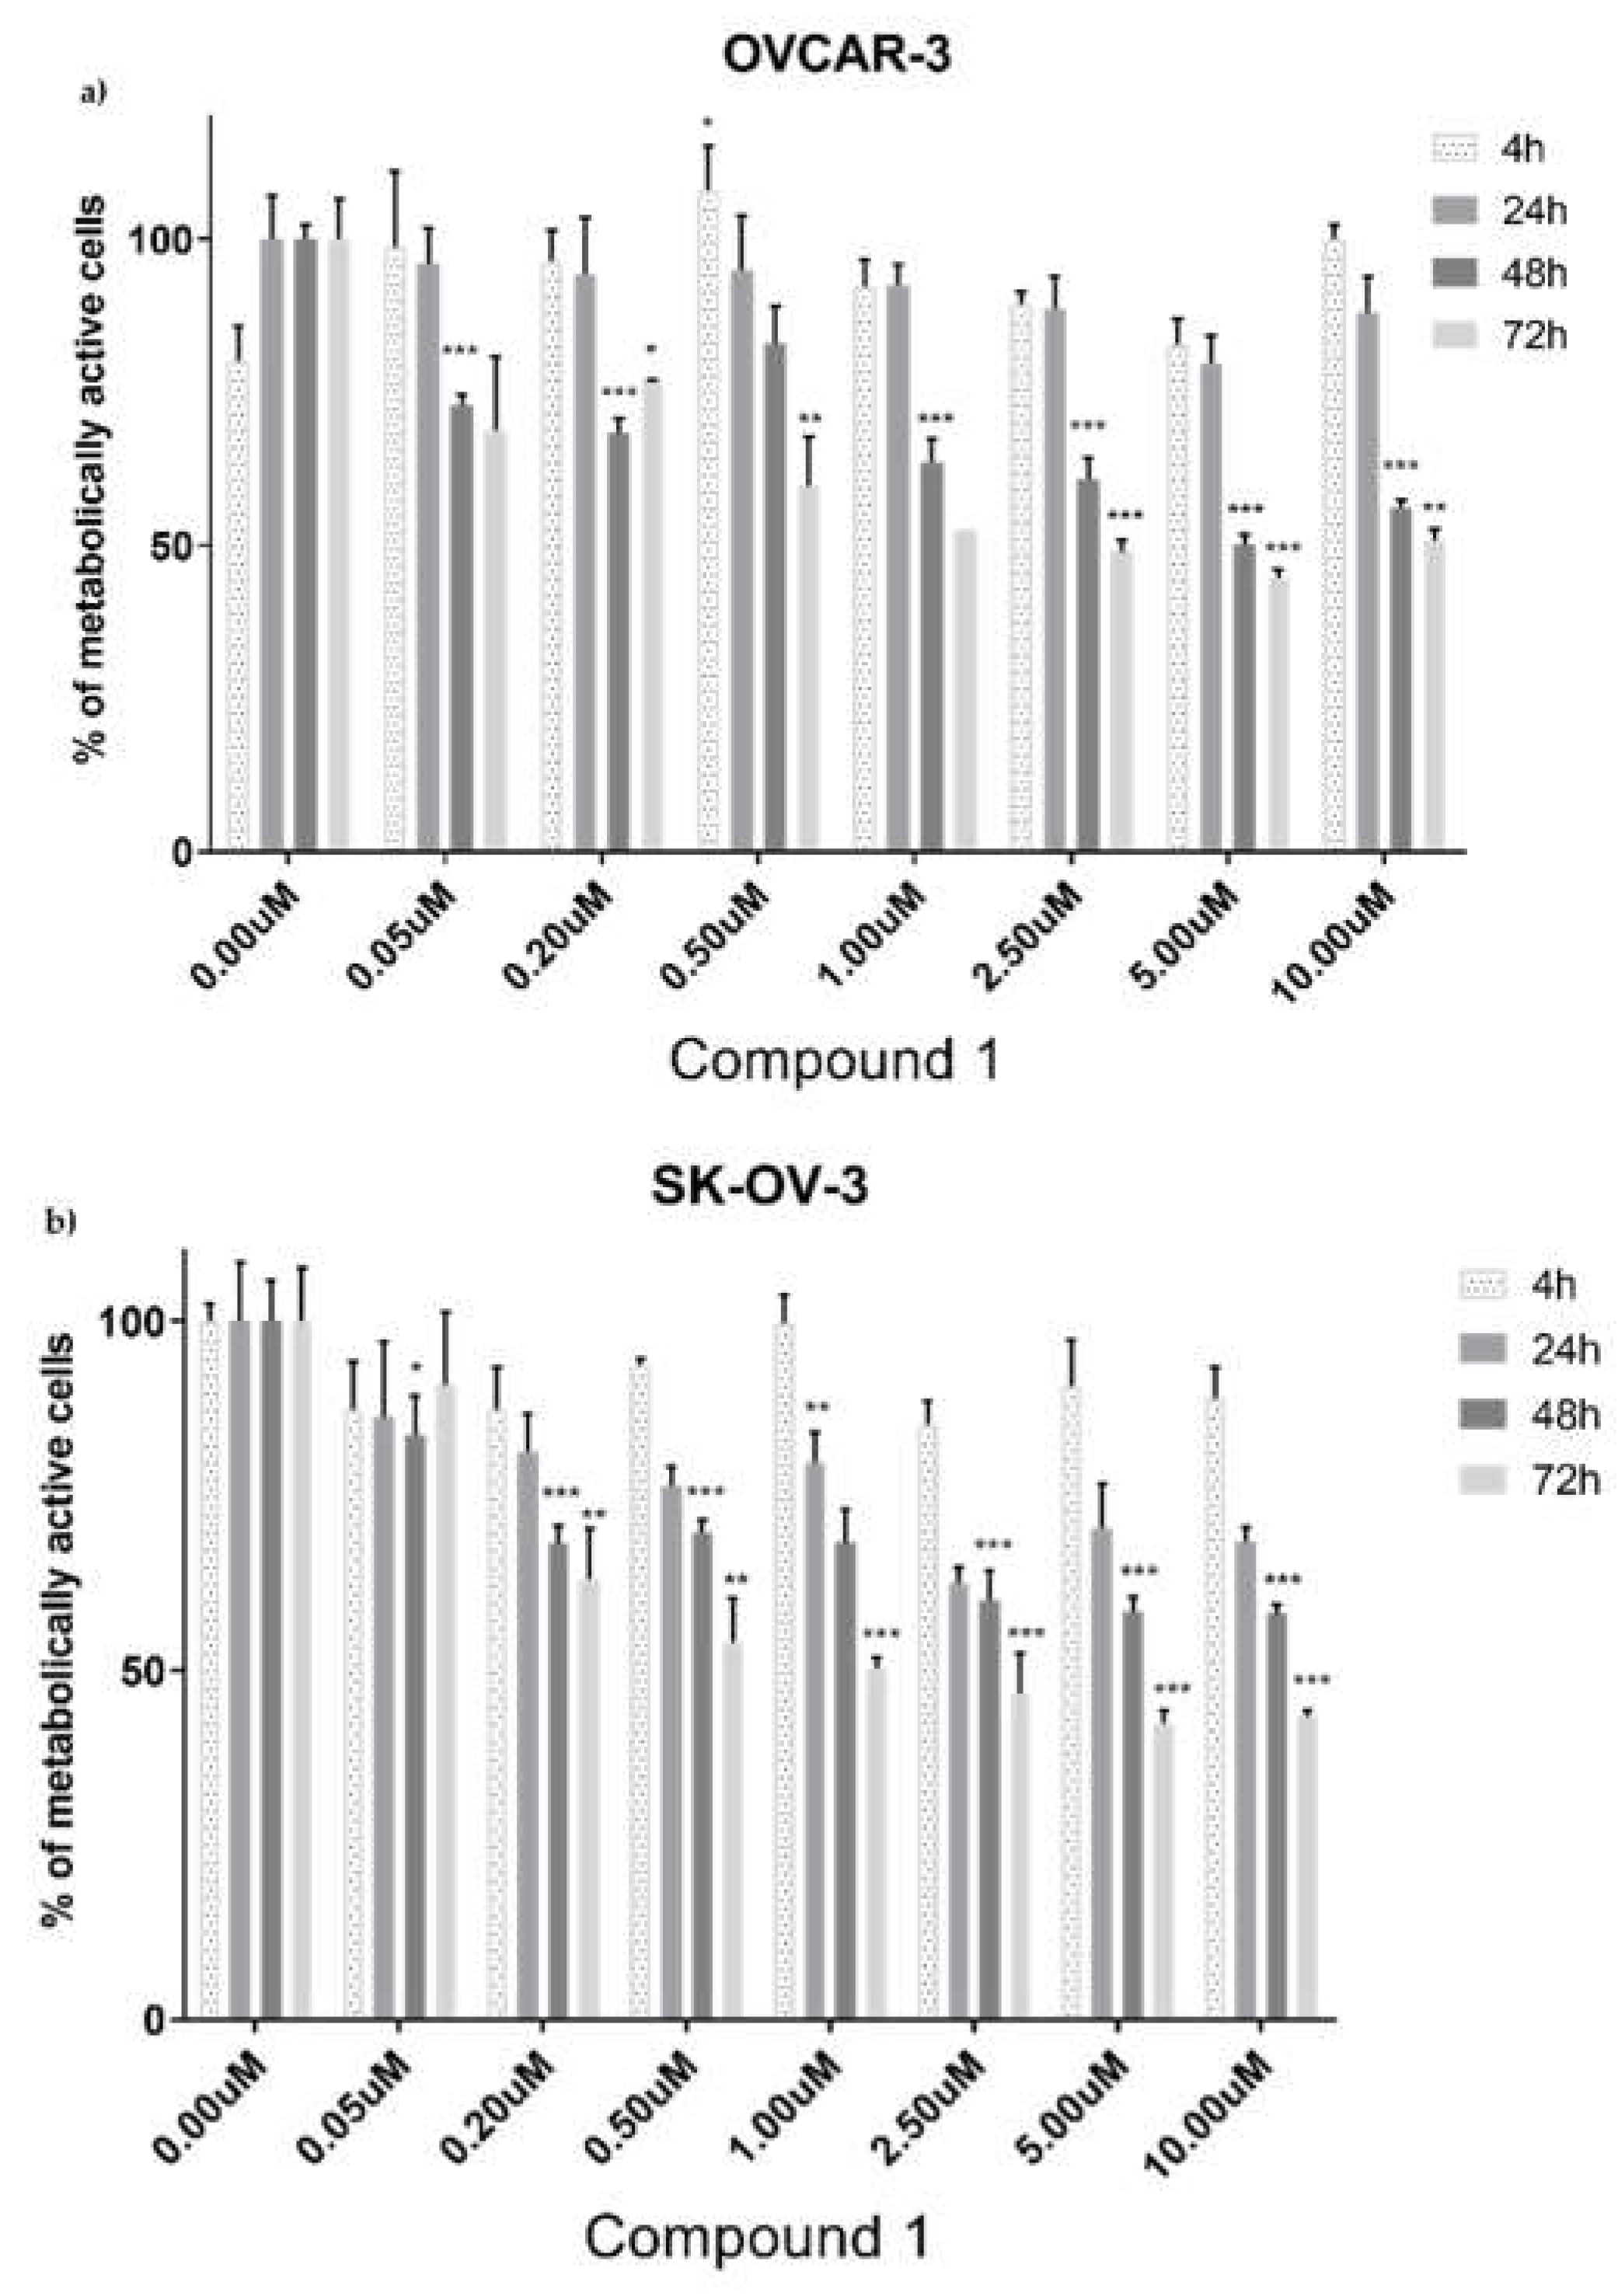
b]quinoline-2–carboxamide (the Compound 1) has not been investigated for ovarian tumor cells. For breast tumor cells, Marijan
et al. found that the IC
50 of Compound 1 after 48 h was 50 nM with maximum cytotoxicity after 72 h at a concentration of 5 µM [
14]. In our research, the IC
50 after 48 h was 5.5 µM for SK-OV-3 cells and 5.0 µM for OVCAR-3 cells, respectively, showing Compound 1 to be more cytotoxic.
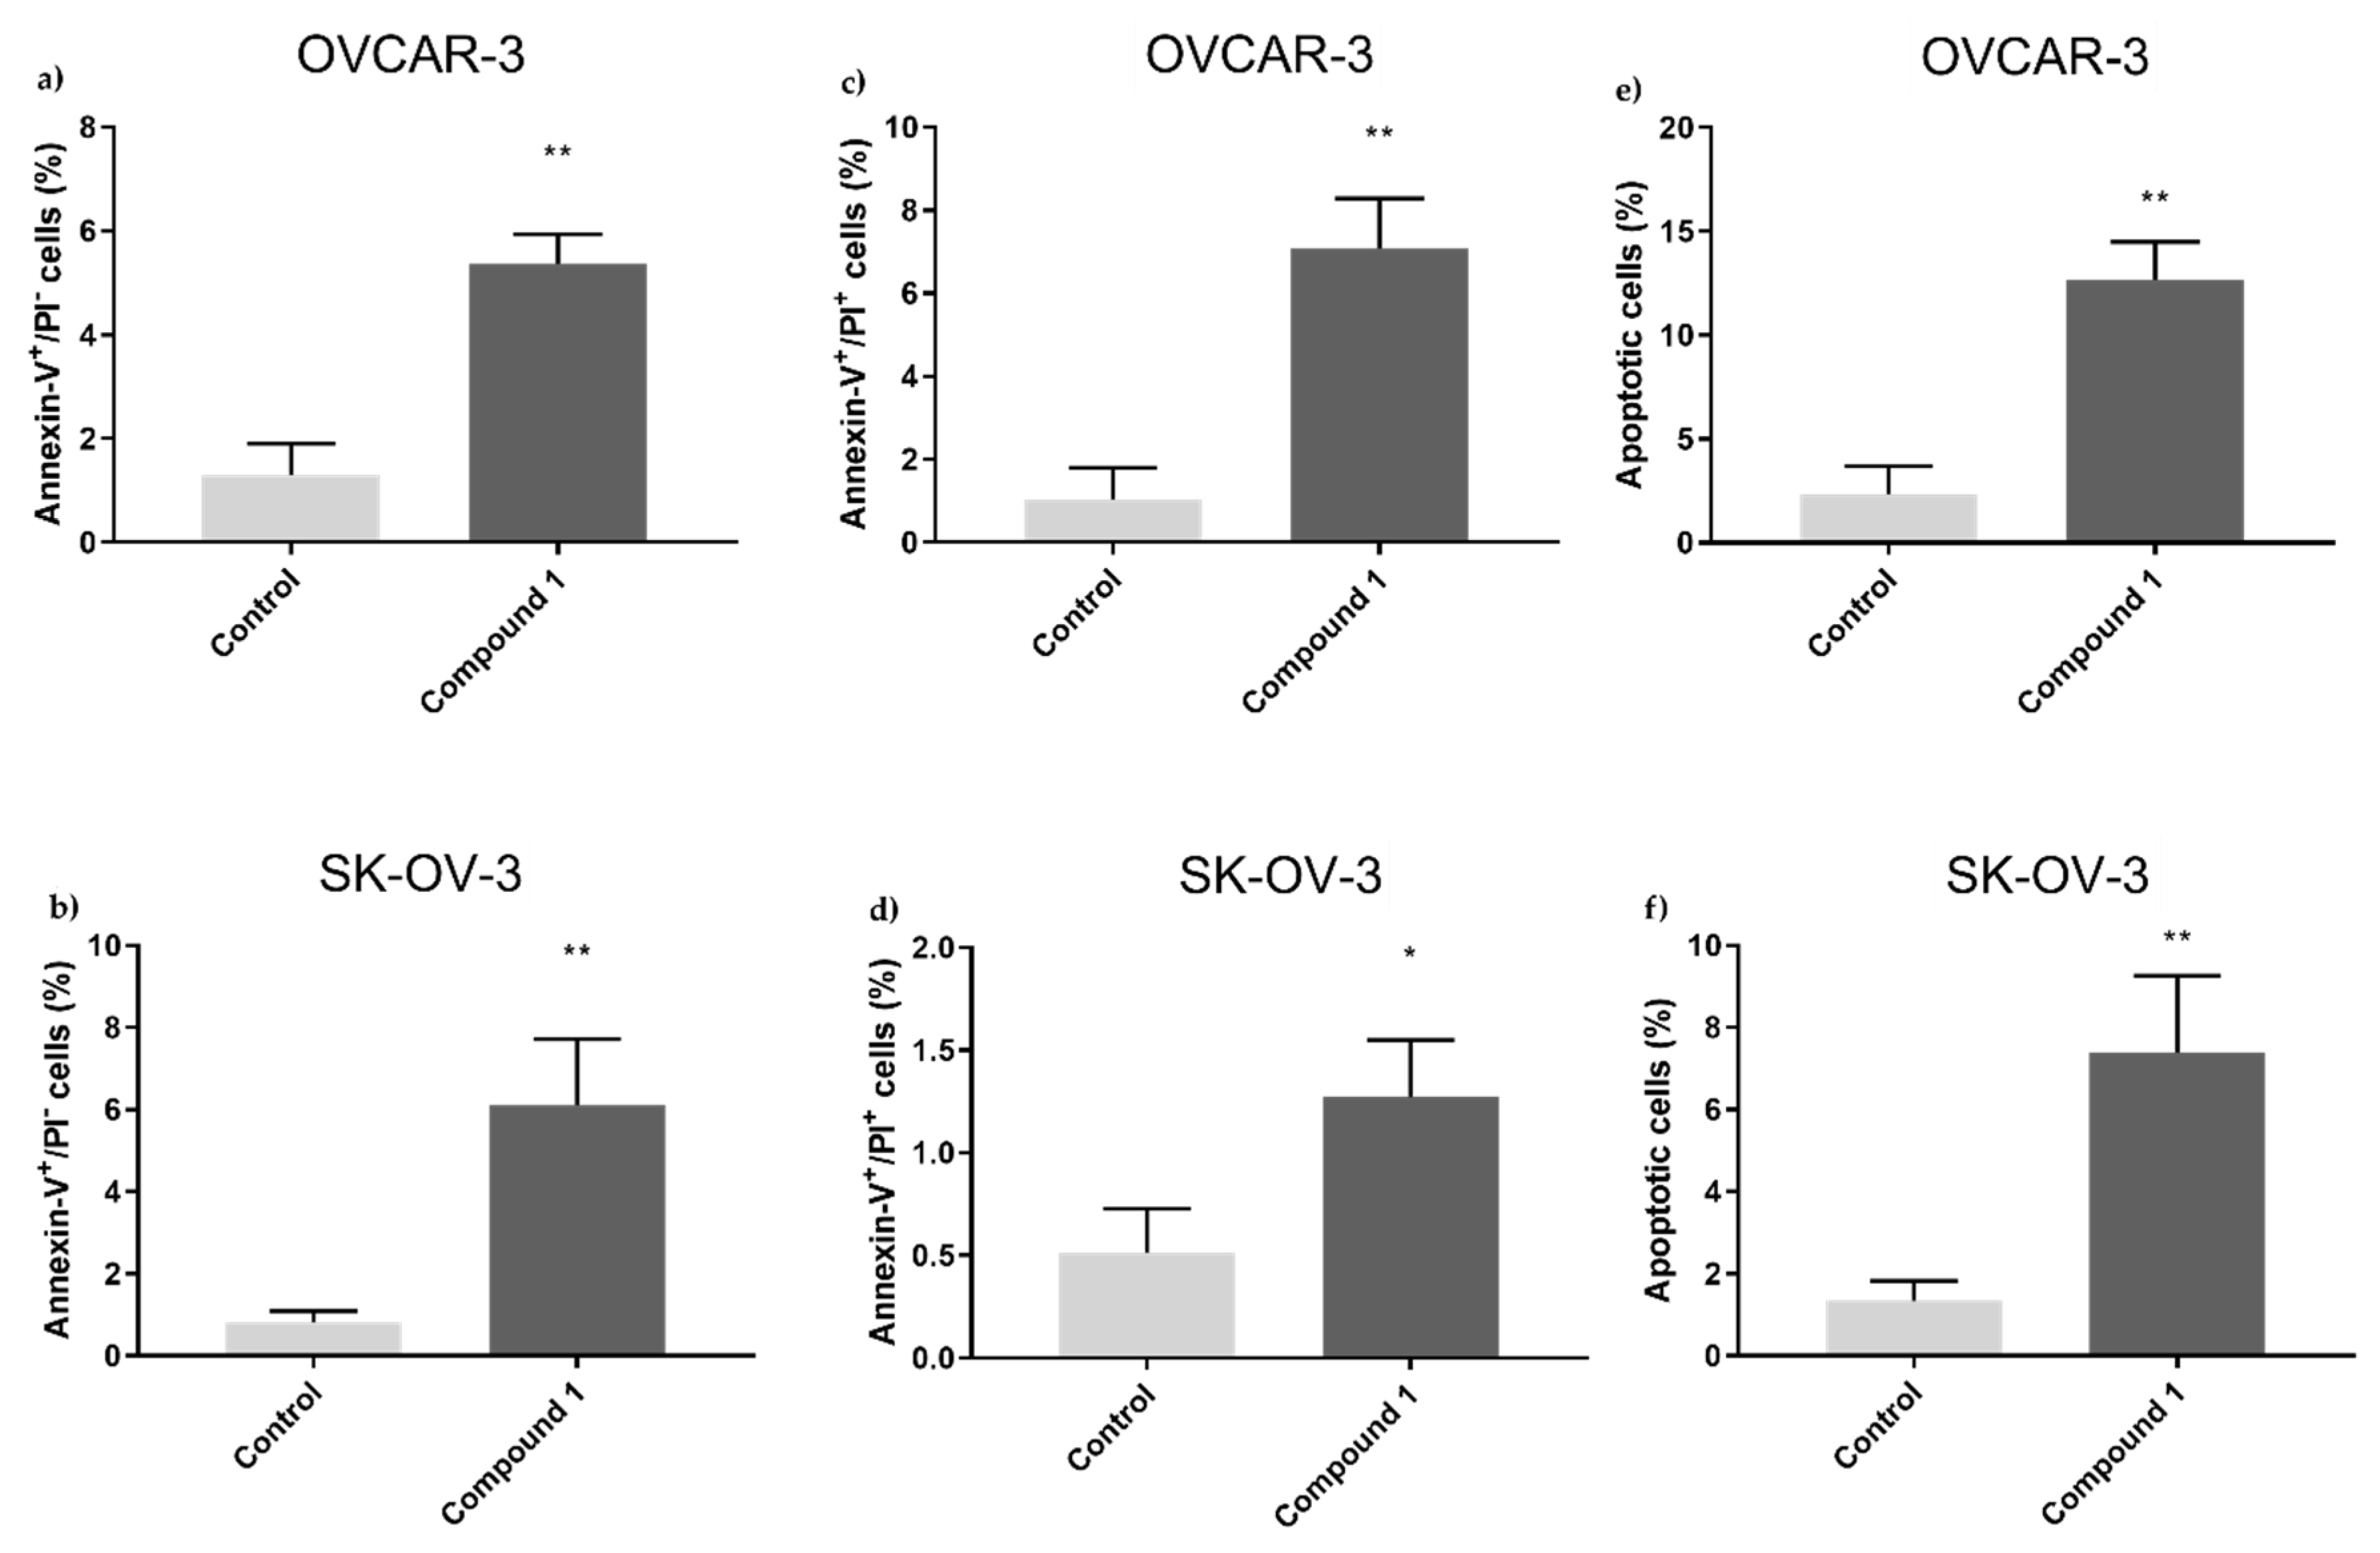
It's especially intriguing to observe the form of cell death that Compound 1 causes in ovarian cell lines. It has been shown that primarily programmed cell death (apoptosis) takes part in this cell turnover process and is not non-programmed (necrosis). In both cell lines, treated cells displayed a substantial rise in apoptotic cell percentage. In the SK-OV-3 cell line, we observed a more prominent effect on early apoptosis - the percentage was over seven times higher in treated cells compared to ones without treatment, while the rate of the cells in late apoptosis was around twice in treated cells compared to non-treated cells. In the OVCAR-3 cell line, there was around four times higher percentage of cells in early apoptosis compared to non-treated ones, while the percentage was almost seven times higher for treated cells in late apoptosis.
It has been demonstrated that various signaling pathways control the CSCs' ability to differentiate, maintain themselves, and resist drugs. Finding the signaling mechanisms that control CSCs is essential for eliminating them, which will then help leverage medication resistance and tumor recurrence
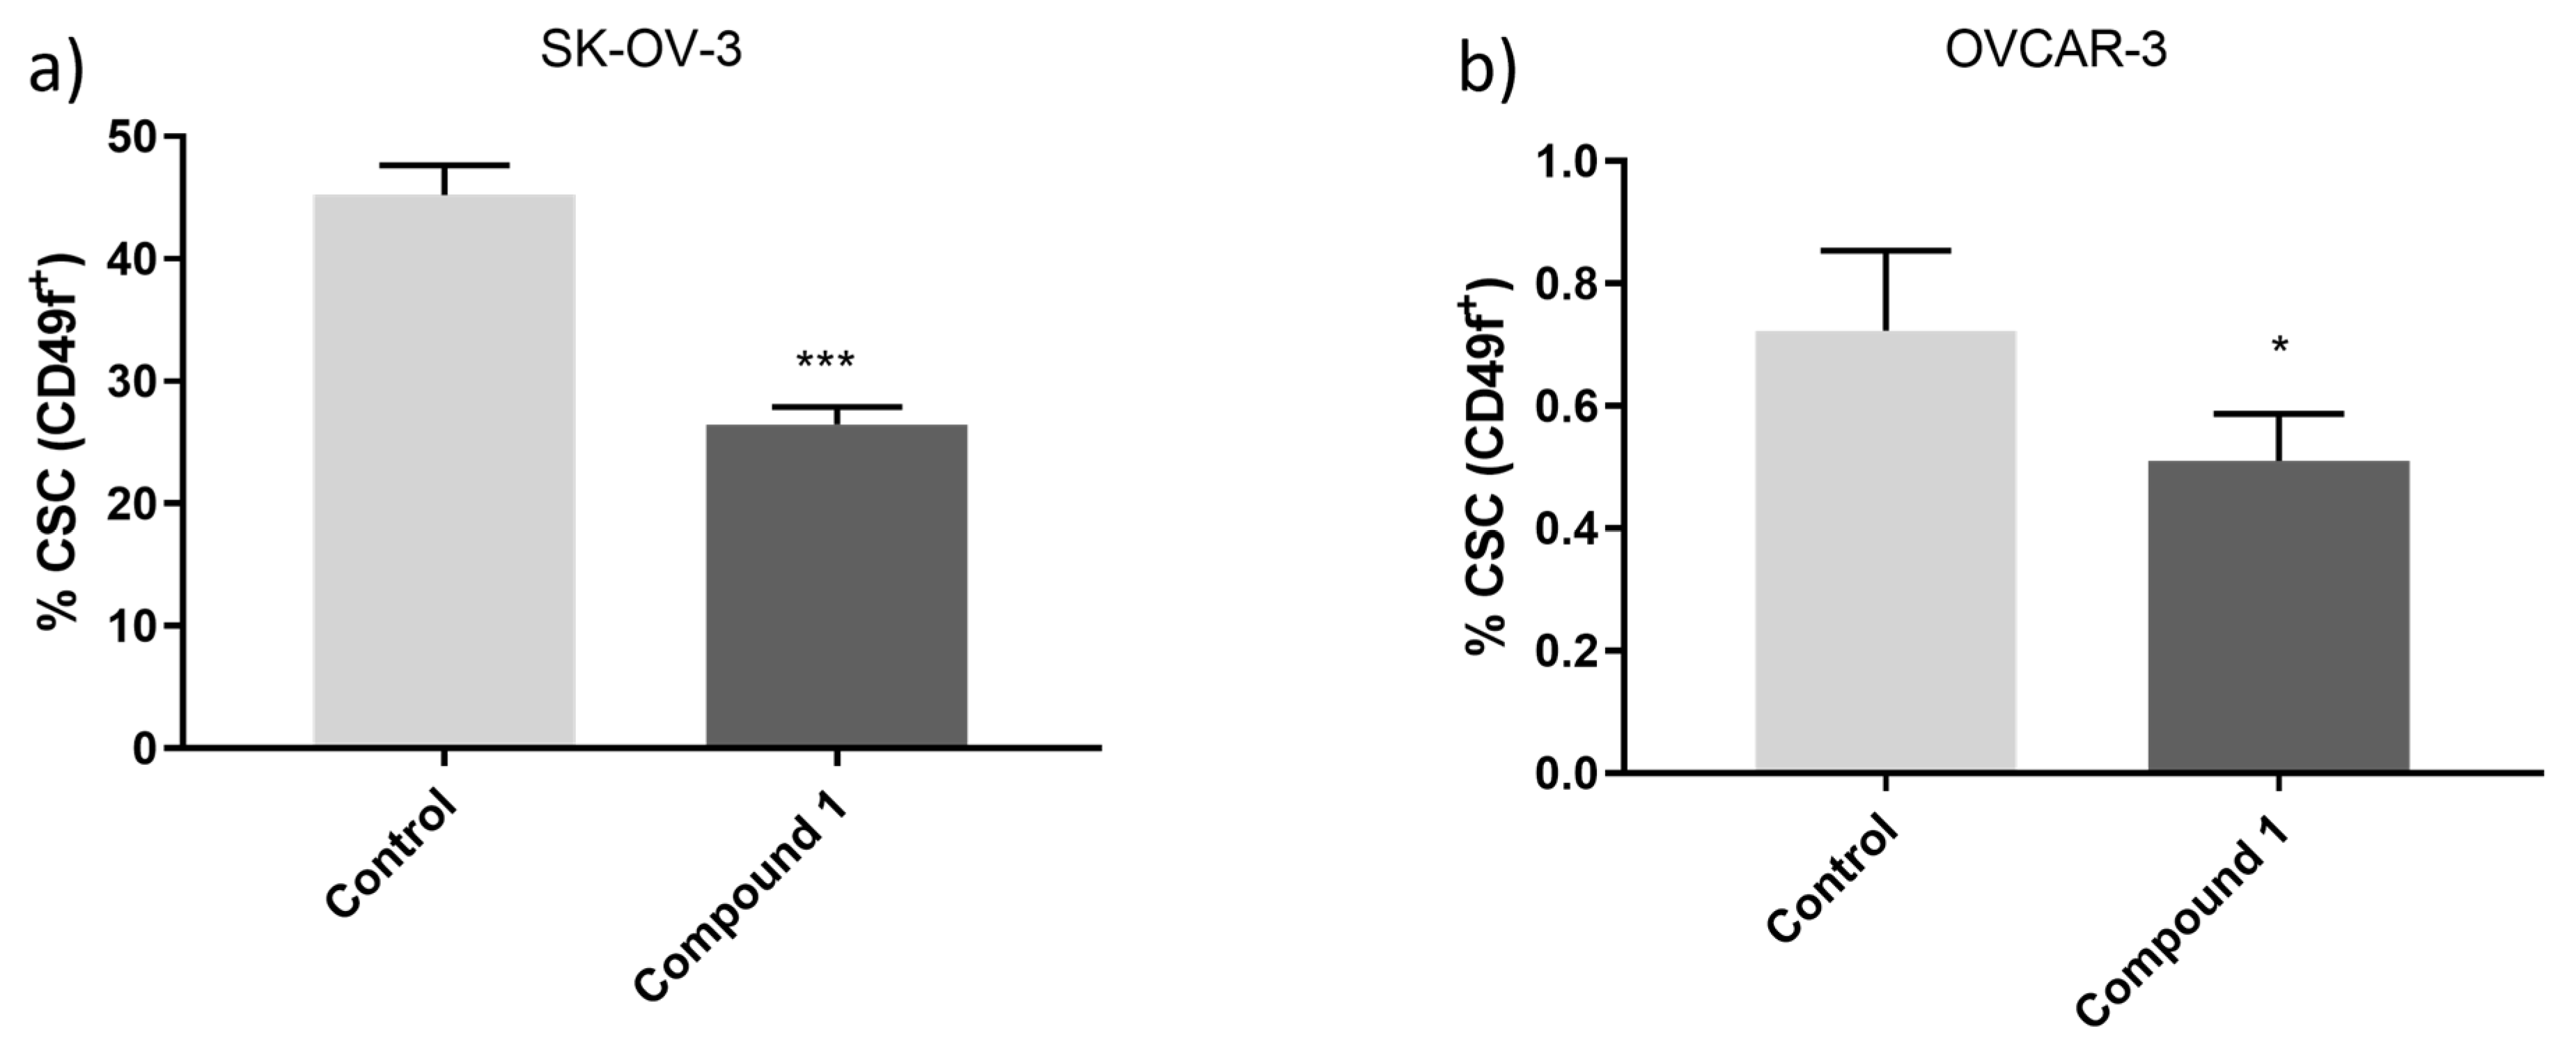
[19]. As a result, the substantial decrease in the proportion of CSCs following treatment with Compound 1, in contrast to untreated cells, is profoundly significant. While most research so far has been based on common markers of CSCs such as CD133, CD44, or ALDH, we investigated the effect on CSCs marked as CD49f
+. It is also known in the literature as integrin α-6 (ITGA6), is poorly studied concerning ovarian cancers but is known that it is overexpressed in SK-OV-3 cisplatin-resisted cells [
20]. SK-OV-3 and OVCAR-3 cell lines are both derived from ovarian tumors and both lines originate from the ascites of a woman who suffered from ovarian adenocarcinoma. OVCAR-3 cell lines are considered a high-grade serous carcinoma whilst SK-OV-3 is considered a non-serous carcinoma [
14]. OVCAR-3 has a much lower percentage of CSCs compared to SKOV-3 and is more sensitive to the cytotoxic effect of the same amount of Compound 1 after the same period. Percentages of CD49f
+ (or ITGA6) were about 30% lower in SK-OV-3, and 40% in OVCAR-3 cell lines after treatment with Compound 1. This can be explained with specific targeting of the membrane receptors of Compound 1 on cancer cells and disrupting signaling pathways important for cell functioning.
The range of changes observed in GSL expression following treatment with Compound 1 reflects the diverse outcomes documented in the existing literature. The monosialylated GSLs GM2 and GM3 reduce the malignancy of tumor cells. Hakomori
et al. showed in their research that GM3 inhibits the activation of growth factor receptors (GFRs), especially the epidermal growth factor receptor (EGFR) [
21]. On the other hand, Huang
et al. proved that overexpression of GM3 can reduce apoptosis and drug resistance in the SK-OV-3 cell line
[22]. In our research, the percentage of GM3 expression on the SK-OV-3 cell line is decreased, and on OVCAR-3 is elevated which means further research must be done to attend to this matter.
Furthermore, the percentage of cells that express ganglioside nLc
4Cer or its sialylated version IV
3Neu5Ac-nLc
4Cer on the SK-OV-3 cell line is decreased but is more expressed after Compound 1 treatment on the OVCAR-3 cell line. The change is more expressive on non-CSCs of both cell lines compared to CSCs. Sialylated glycosphingolipids presented on cell membranes can mediate the processes of metastasis. Pi-Lin Sung
et al. showed that inhibition of interactions between sialylated glycolipids and their receptors on metastatic cells could prevent or slow metastasis [
23].
Changes in the expression of GSL such as GM2, GM3, nLc
4Cer, and IV
3Neu5Ac-nLc
4Cer on CSCs after treatment with the Compound 1 may indicate downregulation of the ABCG2 (ATP-binding cassette sub-family G member 2) transporter. ABCG2 can affect the level and distribution of GSLs in cells by regulating their uptake, secretion, or recycling. For example, ABCG2 has been identified as a key factor in the regulation of ganglioside levels in cells, and mutations in
ABCG2 genes are associated with changes in membrane lipid composition and ABCG2 transporter function. The ABG2 transporter is already a target in the treatment of cancer [
24,
25].
The percentage of cells that express different
neutral GSLs with terminal GalNAc (N-Acetylgalactosamine) remnant varied for both cell lines. Namely, the Gb
4Cer expression noticeably declined after Compound 1 treatment in CSCs of both cell lines, while the percentage of Gb
4Cer
+ non-CSCs was increased after the treatment. The changes are more prominent in the SK-OV-3 cell line, where the changes are statistically significant. The research of Tanaka
et al. demonstrated that ovarian cancer cells with an elevated expression of Gb
4Cer showed greater resistance to chemotherapeutics [
26]. Comparing our results with theirs, we once again demonstrated the antitumor activity of Compound 1 and its potential use as an antitumor drug, as the expression of Gb
4Cer on CSCs was decreased after treatment with Compound 1.
After the treatment with Compound 1, we also observed changes in the Gg
3Cer expression. On the CSCs and non-CSCs of the OVCAR-3 cell line, both percentage and GMI were increased. Expression of Gg
3Cer was decreased in CSCs of the SK-OV-3 cell line and increased in non-CSCs, which is in line with the research of Marijan
et al on breast CSCs. They explained its reduction by the deletion of the lactosylceramide 4-alpha-galactosyltransferase (A4GALT) which is an essential enzyme in epithelial-to-mesenchymal transition and can increase chemoresistance [
17,
27].
The percentage of treated cells positive for GalNAc-GM1b was increased in both ovarian cancer cell lines on non-CSCs and decreased in CSCs, which has not previously been described in the literature. A decreased percentage of CSCs that express GalNAc-GM1b may indicate a slowing down of glycolysis in CSCs, which furthermore affects the differentiation of CSC and non-SCC phenotypes [
17,
25].
Expression of GD3 was increased on non-CSCs of both cell lines after the treatment as was on CSCs of the SK-OV-3 cell line. Conversely, the percentage of GD3
+ CSCs in the OVCAR-3 cell line was decreased. GD3 is GSL specific to tumorous cells and is absent in normal cells causing suppression of the immune system and making tumors immunity-evading [
28]. OVCAR-3 cell lines have a significantly lower percentage of CSCs and this may be an explanation of the results obtained.
In our research we have shown that Compound 1 had a diverse effect on the expression of metabolites after the treatment on both cell lines, changing the expression of metabolites by increasing or decreasing their concentrations, altering metabolic pathways, and affecting cell signaling.
Interestingly, the concentration of inositol was significantly reduced in the OVCAR-3 cell line, while it was statistically significantly increased in the SK-OV-3 cell line. Considering that both cell lines are ovarian tumor cells, differences in the metabolic response to thieno[2,3-b]pyridine could potentially be linked to inherent differences in the biological characteristics of these cells.
Searching the literature, we found no previous research that could be specifically compared to our metabolomics results. However, Alarcon-Zapata
et al. pointed out the diversity of behavior of SK-OV-3 and OVCAR-3 ovarian tumor cell lines in their research, where they demonstrated that the SK-OV-3 and OVCAR-3 cell lines display different features [
29]. In comparison to each other, SK-OV-3 cells demonstrate accelerated migration, increased invasiveness, and more extensive metastases
in vivo models. Both cell lines develop resistance to chemotherapeutic drugs such as Cisplatin, although SK-OV-3 exhibits a higher rate of treatment survival [
29]. This can explain why our results displayed different metabolic expressions in each cell line after the Compound 1 treatment. Pervan
et al., 2022., also confirmed changes in metabolic pathways in their research with thieno[2,3-
b]pyridine on breast tumor cells, and the concentration of various metabolites after treatment further confirmed the importance of Compound 1 in its antitumor effect [
25].
Significantly, we noted that inositol was reduced after treatment with Compound 1. Compound 1 acts on the isoform of phospholipase C (PLC), which participates in the metabolism of inositol in cells. An increased need for inositol may be present in cancer cells due to an increased need for membrane lipids and metabolic reprogramming that supports rapid tumor growth [
30]. Furthermore, the increased level of inositol can contribute to the proliferation and survival of cancer cells, which makes it a potential target for cancer therapy, and we have proven this by the effect of Compound 1 on them [
31]. Searching the literature, we did not find similar results on ovarian tumor cells.
Also, very significantly, the concentration of heptanoate was reduced as a result of the treatment with Compound 1. Since inositol is a precursor of heptanoate in some metabolic pathways, changes in inositol metabolism caused by PLC inhibition may affect the availability of heptanoate, which further affects its reduced synthesis. The role of heptanoate can be complex and can have different implications for the proliferation, survival, and metastasis of cancer cells, which also makes it a potential target in antitumor therapy [
32].
Cancer cells usually display a modified metabolic pathway referred to as the "Warburg effect," wherein they prioritize anaerobic glycolysis to produce energy, even when there is an environment with sufficient oxygen [
33,
34]. Interestingly, glucose is statistically elevated in ovarian cancer cells of the SK-OV-3 line (P < 0.05), while in the OVCAR-3 cell line, the level of glucose is statistically significantly decreased after treatment with Compound 1 (P < 0.001). Although it is to be expected that the level of glucose will be reduced in the medium around tumor cells due to increased consumption of glucose, there may be an accumulation of glucose inside tumor cells, like in the SK-OV-3 cell line, due to altered metabolism and disturbances in regulation, however, we obtained conflicting results.
4. Conclusions
The discussion reveals several important observations on the potential of thieno[2,3-b]pyridine compounds, particularly the derivative 3-amino-N-(3-chloro-2-methylphenyl)-5-oxo-5,6,7,8-tetrahydrothiene[2,3-b] quinoline -2-carboxamide (Compound 1), in the treatment of cancer cells.
First, our study showed that Compound 1 had significant cytotoxic effects on ovarian cancer cell lines SK-OV-3 and OVCAR-3, which surpass the results observed in previous studies in breast and prostate cancer cells. This high cytotoxicity, coupled with a preference for inducing apoptosis over unprogrammed cell death pathways, highlights its potential as a promising antitumor drug.
The effect of Compound 1 on CSCs labeled as CD49f+ showed that their percentage changed significantly after treatment. If we consider the role of CSCs in the cycle of tumor regrowth and the development of resistance to drugs, this could make cancer CSCs a potential target.
In addition, our study investigates in detail the changes in GSLs and metabolites after the treatment. Notably, changes in GSL expression, especially downregulation of some gangliosides associated with metastasis and chemoresistance, suggest that Compound 1 can disrupt key signaling pathways important for tumor progression and dissemination.
Furthermore, our metabolic analyses reveal significant changes in metabolic pathways, including changes in glucose metabolism and inositol levels, suggestive of pharmacokinetics factors that affect cancer cell metabolism at multiple levels. These observations provide valuable insight into the mechanism of action and potency of Compound 1.
5. Materials and Methods
5.1. Ovarian Cancer Cell Culture
Ovarian cancer cell lines SK-OV-3 (ATCC HTB-77) and OVCAR-3 (ATCC HTB-161) were purchased from ATCC® and were grown in DMEM (Dulbecco's Modified Eagle Medium, Sigma-Aldrich, Steinheim, Germany) with the addition of 10% fetal bovine serum (FBS, EuroClone, Milan, Italy) and 1% antibiotics (penicillin/streptomycin, Sigma-Aldrich, Steinheim, Germany) in an incubator at 37 °C and 5% CO2.
5.2. Compound: 3-amino-N-(3–chloro–2–methylphenyl)–5–oxo-5,6,7,8–tetrahydrothieno[2,3-b] quinoline–2–carboxamide
The compound was newly synthesized in the laboratory of Professor David Barker and Dr. Lisa I. Pilkington, School of Chemical Sciences, The University of Auckland, Auckland, New Zeeland. We tested four different thieno[2,3-b]pyridine derivatives.
5.3. Cytotoxicity
We performed the MTT (3-(4,5-dimethylthiazol-2-yl)-2,5-diphenyl tetrazolium bromide) test to measure the percentage of metabolically active ovarian cancer cells and to determine the half-maximal inhibitory concentration (IC50). The absorbances of treated cells obtained by the MTT assay were divided by the absorbances for untreated cells to obtain the percentage of metabolically active cells. Triplicates of an identical number of cells were placed on 96-well microtiter plates, and the plates were incubated for an entire night. The cells were incubated for 4, 24, 48, and 72 h after being treated with the medium (control cells) and solutions of 7 different concentrations of each derivative – 0.05 µM, 0.2 µM, 0.5 µM, 1 µM, 2.5 µM, 5 µM, and 10 µM.
Following this treatment, cells were cultured for 2 h with 0.5 mg/mL MTT solution. A microtiter plate reader (HiPo MPP-96, Biosan, Riga, Latvia) was used to measure the absorbance at 570 nm after the solution had been removed and DMSO (dimethyl sulfoxide) had been added [
17]. IC
50 was calculated using the GraphPad Prism 7.0 program (San Diego, CA, USA). Due to the highest efficiency, i.e. the lowest IC
50 value, we have chosen 3-amino-
N-(3-chloro-2-metilphenil)-5-oxo-5,6,7,8-tetrahydrothieno[2,3-
b]quinoline-2-carboxamide (in previous text Compound 1).
5.4. Flow Cytometry
Following the MTT tests, a Compound 1 concentration of 5 µM was applied to SK-OV-3 and OVCAR-3 cell lines for the analysis of apoptosis and glycophenotype of CSCs and non-CSCs. This represents the IC50 value for 48 h for both cell lines.
5.4.1. Apoptosis
An equal number of cells (1x10⁵ cells) were seeded in triplicates on microtiter plates with 6 wells and treated with a 5 µM concentration of the Compound 1 solution (treated cells), or with the complete medium (control cells) to perform the apoptosis test. Following the Compound 1 treatment, the cells underwent trypsinization, followed by a wash in phosphate buffer solution (PBS) and resuspension in 100 µL of binding buffer that contained 5 µL of either propidium iodide (PI) or Annexin-V-fluorescein isothiocyanate (FITC) dye (Annexin-V-FITC Apoptosis Detection Kit I, BD Biosciences, Franklin Lakes, New Jersey, USA). This type of specific cell surface staining uses Annexin-V, a protein dependent on Ca2+ that binds to phospholipids and serves as a marker of early apoptosis. Differentiating between early and late apoptosis was made possible by the combination of PI and Annexin-V-FITC. Based on the combination of positive and negative outcomes of these two compounds, apoptotic, necrotic, and viable cells can be distinguished. Early apoptotic cells will have a combination of Annexin-V⁺/PI⁻, late apoptotic cells will have Annexin-V⁺/PI⁺, and viable cells will have cells that are Annexin-V-/PI-. The cells were examined using a flow cytometer (BD Accuri C6, BD Biosciences, Franklin Lakes, New Jersey, USA) after being incubated for 15 min at room temperature in the dark. FlowLogic (Inivai Victoria, Australia) was used to examine the proportion of apoptotic cells and the standard deviation.
5.4.2. Determination of Glycosphingolipid Expression on Ovarian CSCs and Non-CSCs
An equal number of cells (1x10
5 cells) of both cell lines SK-OV-3 and OVCAR-3 were seeded in triplicates on 6-well microtiter plates and treated with 5 µM concentration of Compound 1 (treated cells) or complete medium (control cells) for 48 h, after which the cells of both lines were trypsinized and washed with PBS and then stained with anti-GSL antibodies. Antibodies to glycosphingolipids (GD3, nLc
4Cer, Gg
3Cer, Gb
4Cer, IV
3Neu5Ac-nLc
4Cer, GM2, GM3, and GalNAc-GM1b) were chicken polyclonal antibodies produced in the laboratory of Dr. J. Müthing [
35]. The binding of primary anti-GSL antibodies was determined using secondary antibodies conjugated with eFluor 660 fluorochrome (Abcam). The fluorescence of the stained samples was measured with a flow cytometer BD Accuri C6. Data were analyzed using the FlowLogic program. CSCs were determined on SK-OV-3 and OVCAR-3 as CD 49f
+. The non-CSCs cell lines were defined as CD49f
- on both cell lines. The expression of GSLs was determined on the same cell lines - the percentage of cells positive for GSLs above stated and the geometric mean value of fluorescence intensity (GMI). By using GMI on these images, we quantified the average brightness of the labeled GSLs on the cell surface. This information showed us the distribution and expression of GSLs on the cell surface, as well as how these lipids change in response to different treatments, in our case with Compound 1.
5.5. Sample Extraction, Derivatization, And Gas Chromatography-Mass Spectrometry (GC-MS)
Cells seeded in 6-well plates were treated with 5 µM Compound 1 (treated cells) or complete DMEM medium (control) for 48 h. After the incubation period, the cell medium was discarded and cells were thoroughly washed with buffer solution phosphate-buffered saline (PBS), followed by fixation in cold methanol, which effectively inhibits the metabolism of the cells. Without scraping the cells, cell supernatant was collected and 20 µL of ribitol (Sigma Aldrich, Steinheim, Germany) was added as an internal standard. Finally, the samples were dried under the nitrogen blowdown.
The derivatization process involved the addition of 25 μL solution consisting of 20 mg/mL metoxylamine hydrochloride in pyridine followed by constant shaking for 60 min at 50 ˚C followed by the addition of MSTFA+1%TMCS with incubation at 50 ˚C for 30 min for complete derivatization. The sample was dissolved in 100 μL pyridine.
The samples were analyzed using an Agilent 8890 GC system coupled with a triple quad spectrometer system MS 7000D GC/TQ. The column was HP-5 MS (30m x 0.25 mm x 0.25 μm, Agilent) with an oven program set on 60 ˚C maintained for 2 min, then increased to 210 ˚C at rate of 10 ˚C/min ramped to 240 ˚C at rate of 5 ˚C/min and then ramped to 315 ˚C at a rate of 25 ˚C/min and then held at 315 ˚C for 3 min.
5.5.1. GC-MS Data Preprocessing and Statistical Analysis
Agilent Mass Hunter Qualitative Analysis software was used for spectral processing (including peak picking, alignment, annotation, and integration). Metabolites were identified using the NIST library. The intensity value for each metabolite was normalized to the ribitol internal standard signal.
Only compounds listed in the Human Metabolome Database (HMDB4.0) were selected. In cell culture samples, 24 metabolites in total were found.
These two cell lines were utilized to create a panel of metabolites that were differently expressed using MetaboAnalyst, a platform for metabolomics data analysis.
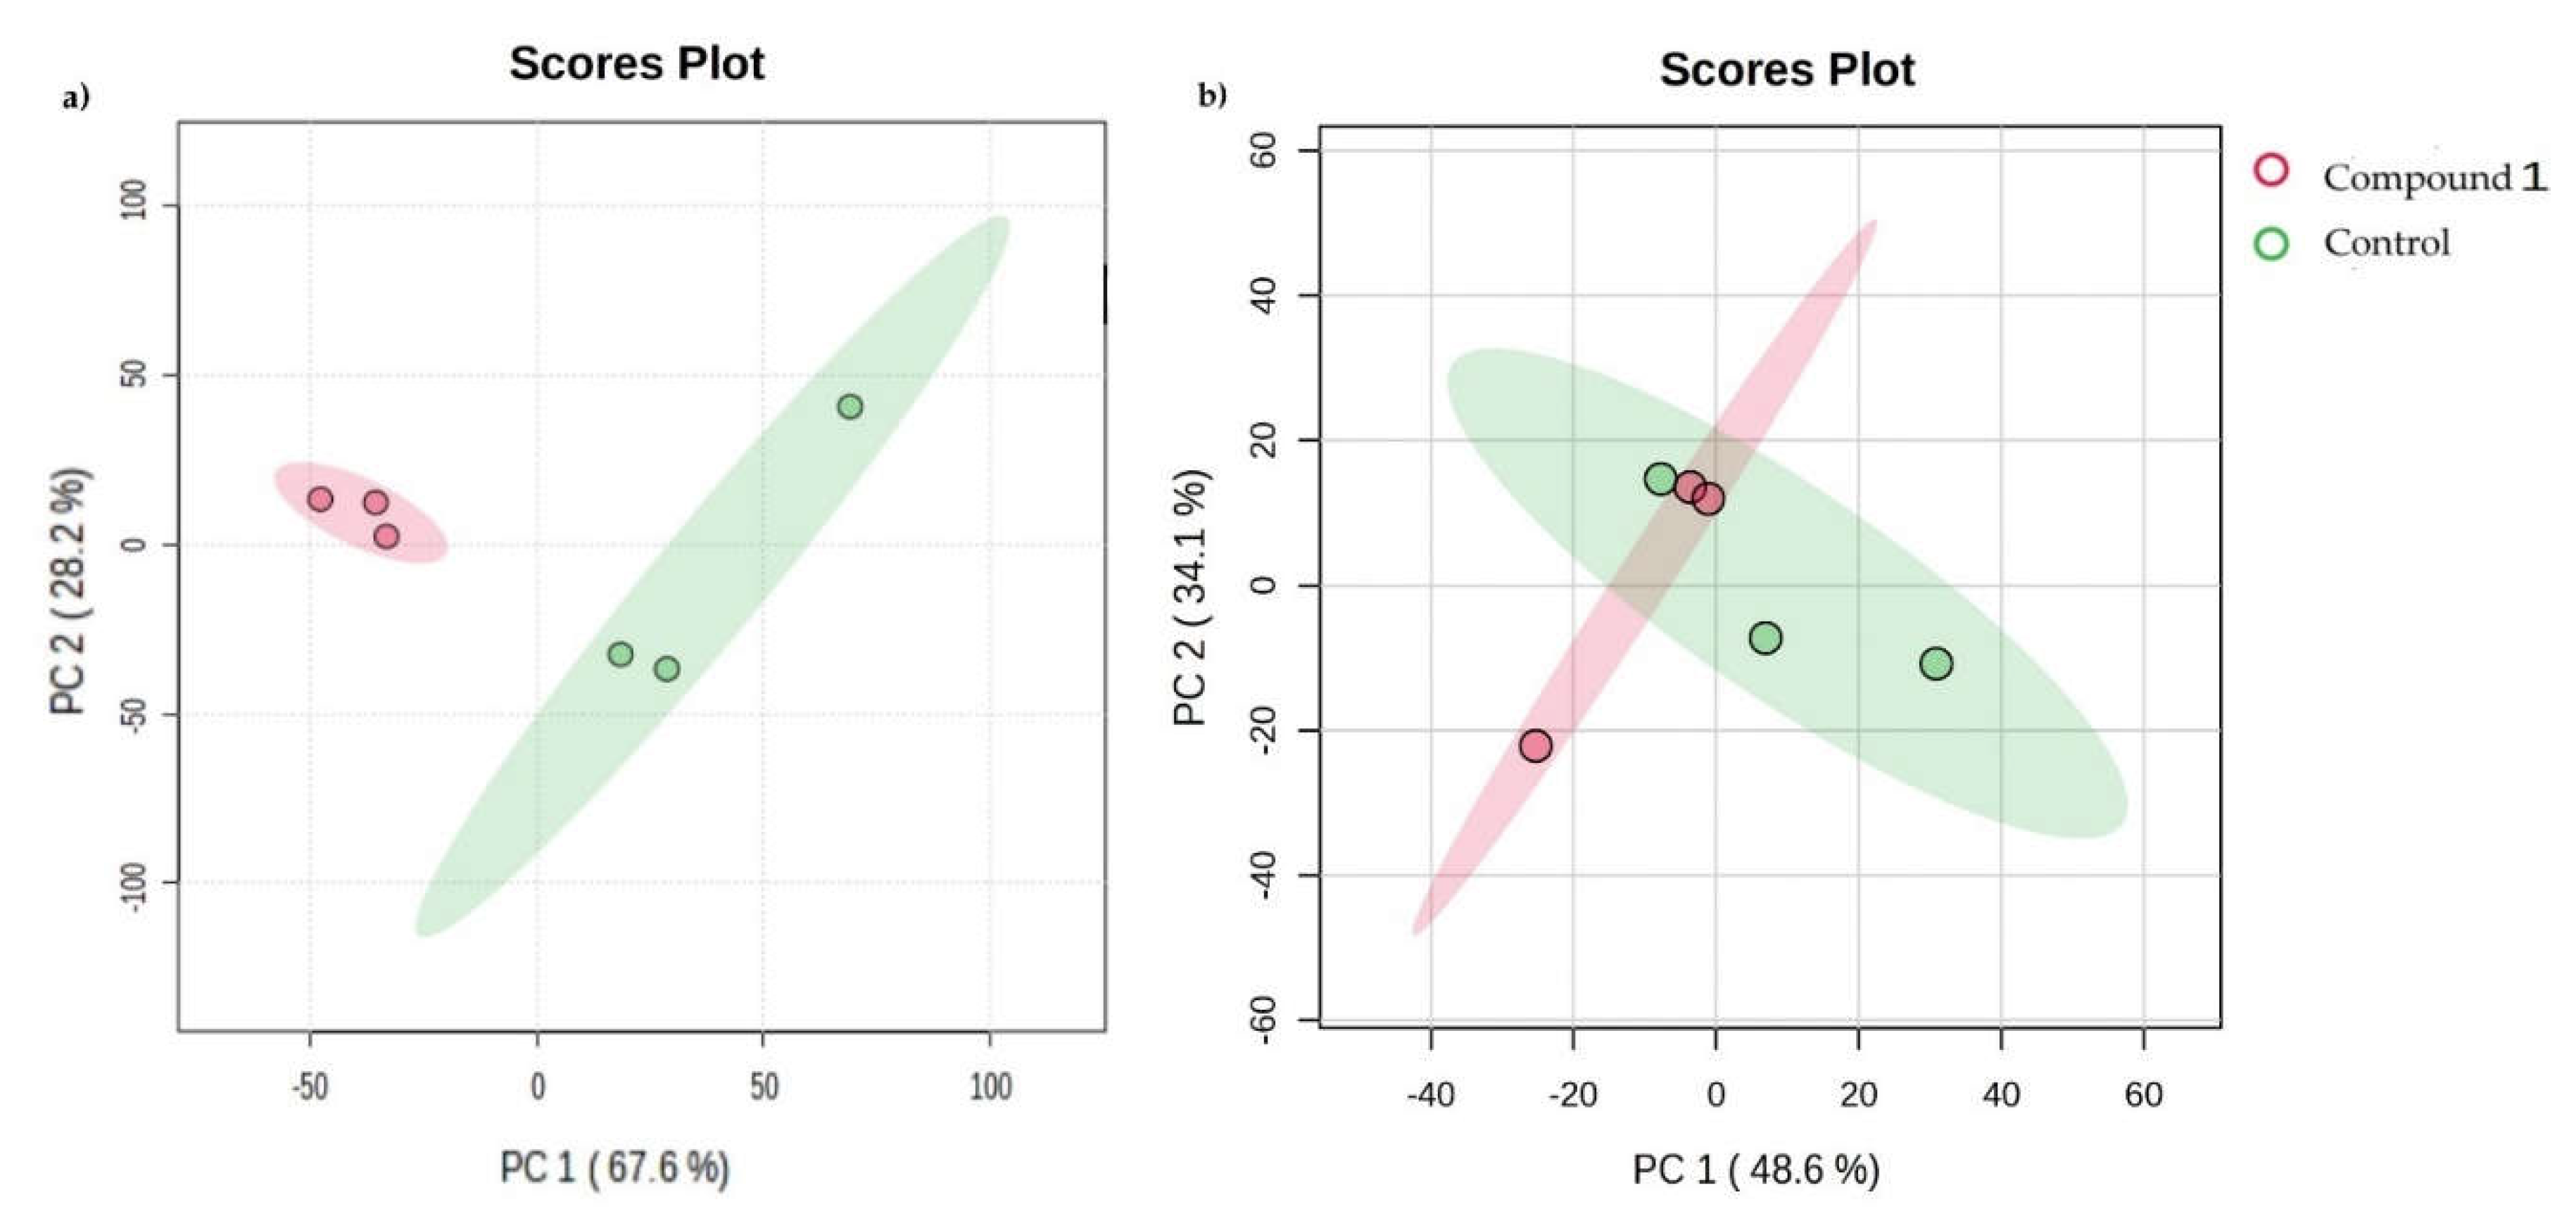
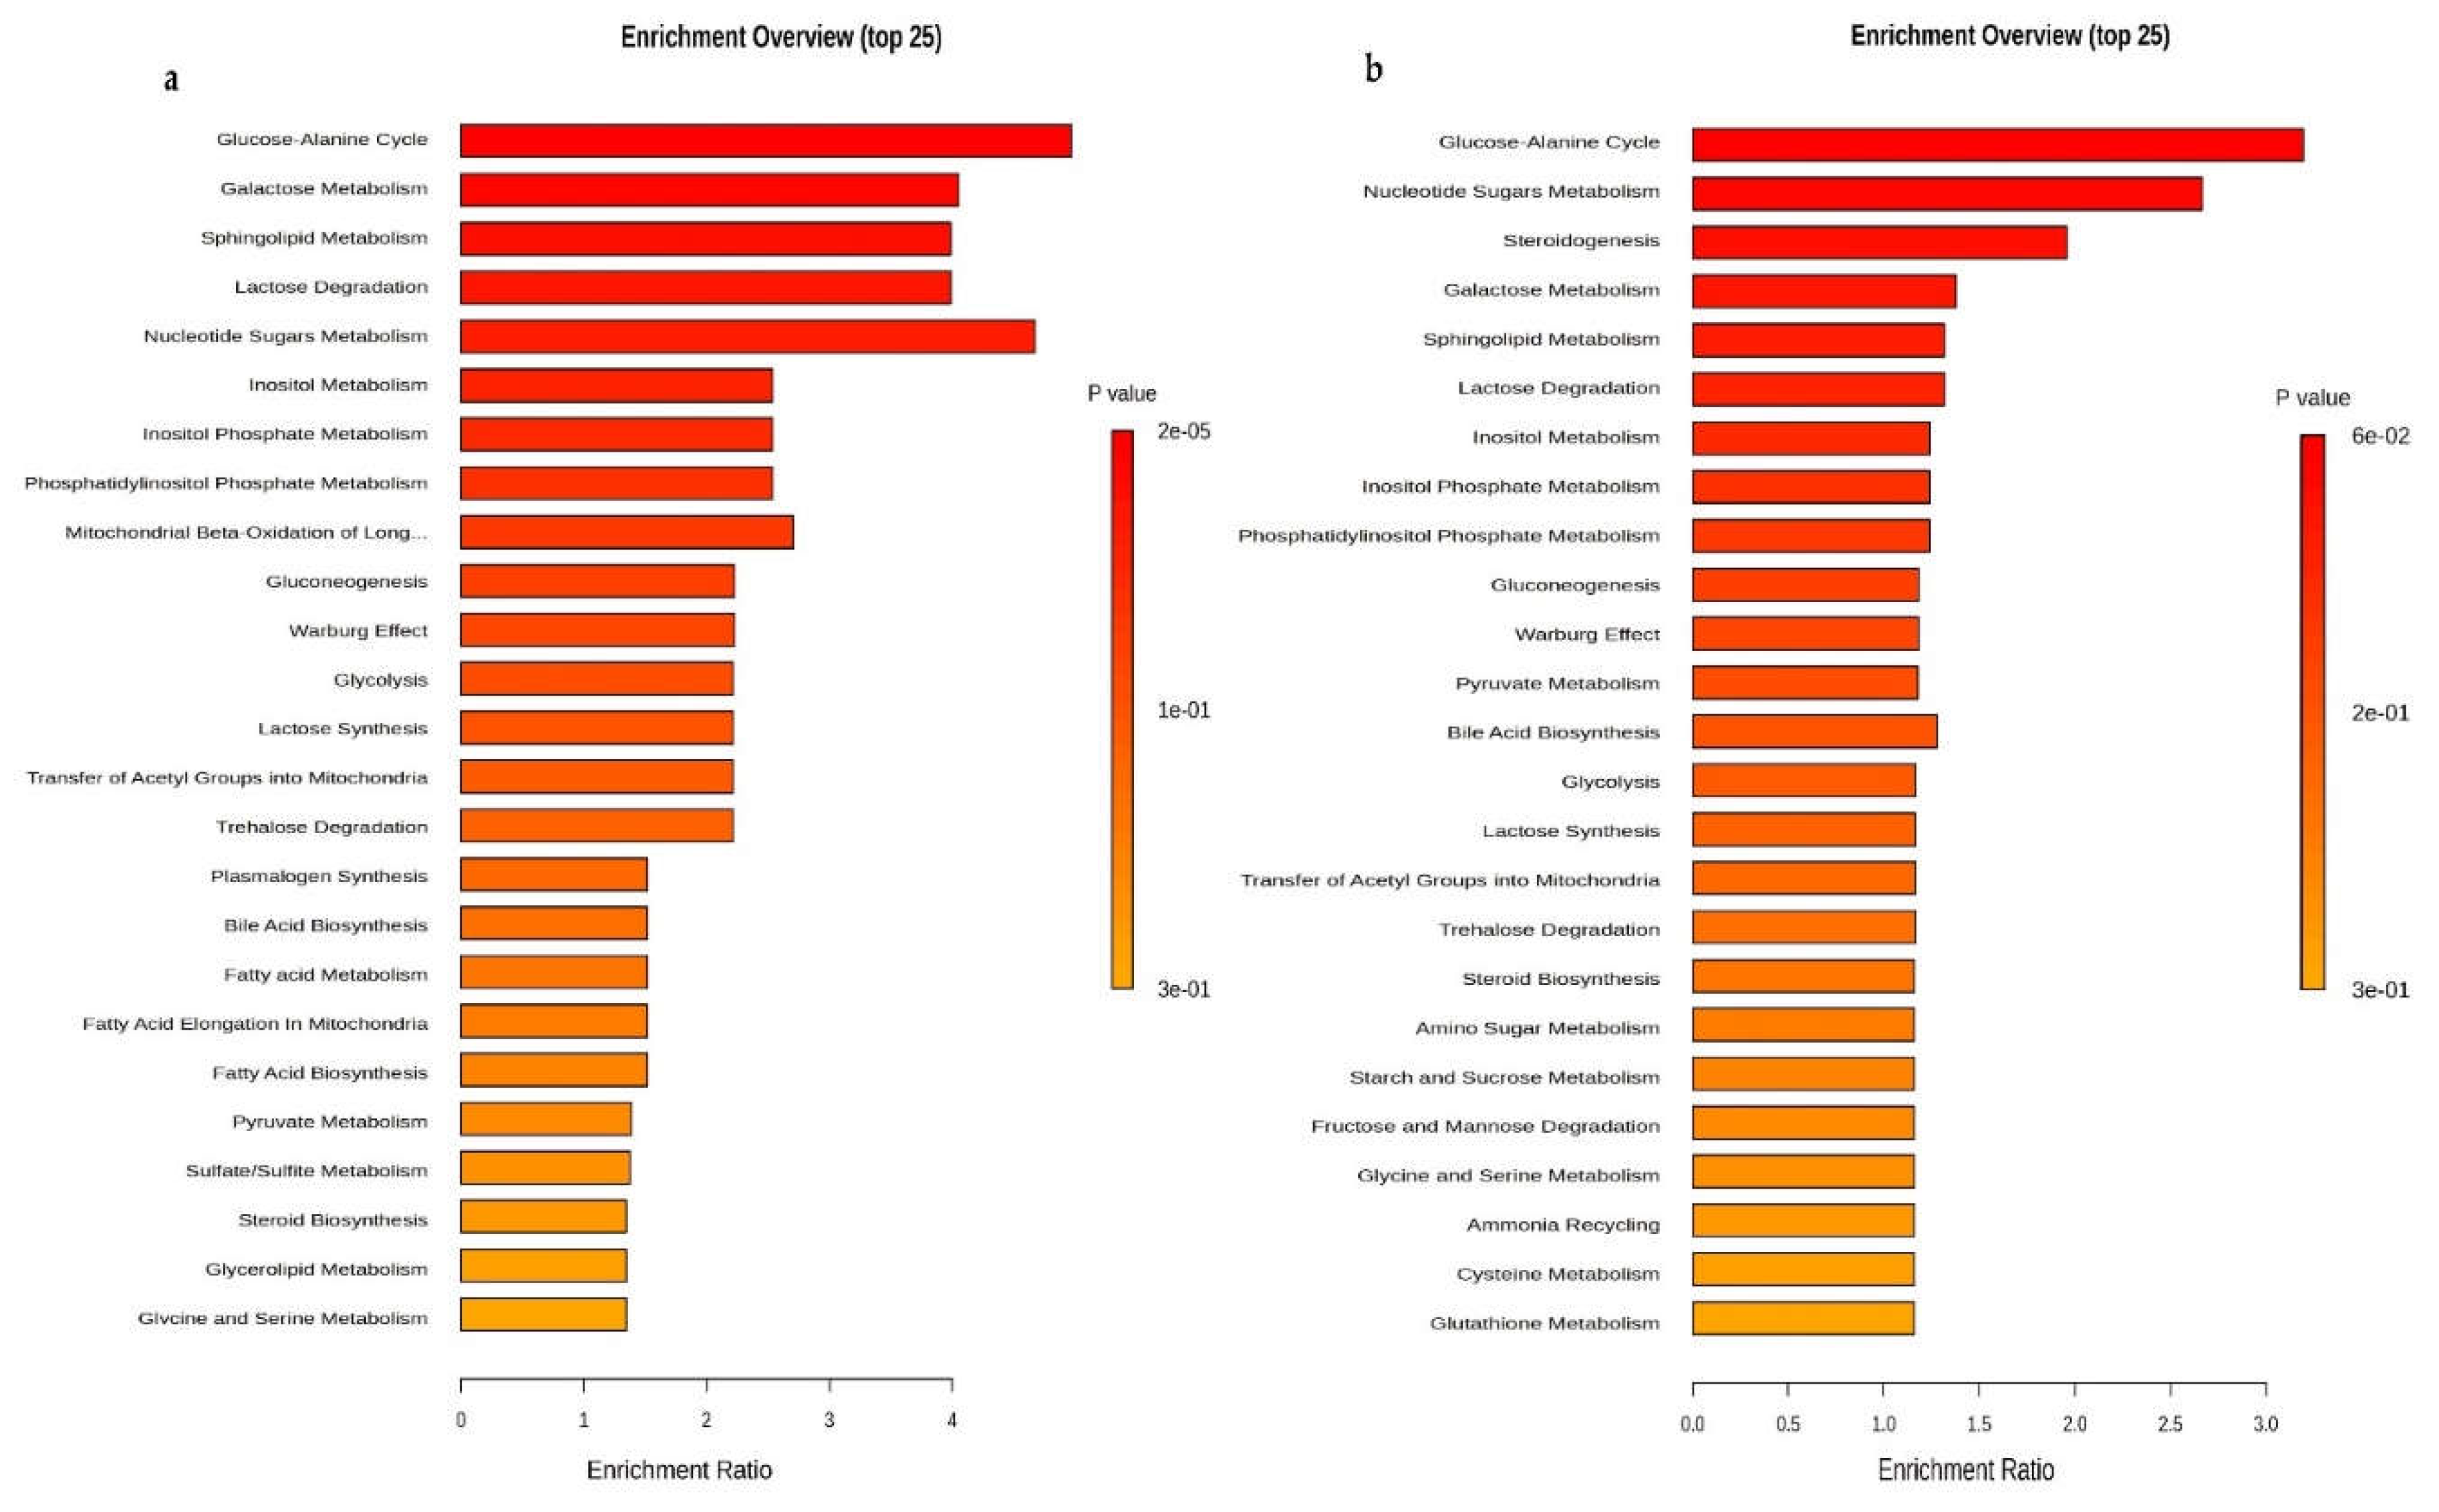
Student’s t-tests were used to determine statistical significance. One-way ANOVA was employed to examine how Compound 1 affected the two cell lines. An unsupervised clustering technique, principal component analysis (PCA), was employed to understand overall differences in the metabolic profiles. Analysis of metabolic set enrichment (MSEA) was used to understand the connection between metabolite concentration variations and metabolic fingerprints.
5.6. Statistical Analysis
All data were processed by ANOVA test and post-hoc Tukey test or Kruskal–Wallis by test in GraphPad Prism 7.0 (San Diego, CA, USA). Statistical significance was set at P < 0.05 and lower.
Author Contributions
Conceptualization, ZO, DB, JM, VČČ; Methodology, ZO, SM, MČB, VČČ; formal analysis, ZO, SM, MR; resources, DB, VČČ; data curation, MČB, SM, MR, LP, DB, VČČ.; writing—original draft preparation, ZO, writing—review and editing, SM, MR, LP, JR, VČČ; visualization, ZO, SM, VČČ; supervision, MR, VČČ. All authors have read and agreed to the published version of the manuscript.
Figure 1.
Structure of the 3-amino-N-(3-chloro-2-methylphenyl)-5-oxo-5,6,7,8-tetrahydrothieno[2,3-b]quinoline-2-carboxamide (Compound 1).
Figure 1.
Structure of the 3-amino-N-(3-chloro-2-methylphenyl)-5-oxo-5,6,7,8-tetrahydrothieno[2,3-b]quinoline-2-carboxamide (Compound 1).
Figure 2.
Viability of cells after exposure to Compound 1. The OVCAR-3 (a) and SK-OV-3 cell lines (b) were treated with varying doses of Compound 1 at various times, the 3-(4,5-dimethylthiazolyl-2)-2,5-diphenyltetrazolium bromide (MTT) assay was used to measure cells metabolic activity. Data are shown as a mean from the experiment done in triplicate ±SD. Columns, mean of viable cells; bars, SD (standard deviation); *, P<0.05; **, P<0.01; ***, P<0.001. SD standard deviation.
Figure 3.
Percentage of OVCAR-3 and SK-OV-3 cell lines in early, late, and overall apoptosis. Notes: Percentage of cells in early (a), late (c), and overall (e) apoptosis of OVCAR-3 and early (b), late (d), and overall (f) apoptosis of SK-OV-3 cell lines. The displayed data are given as a mean from the experiment performed in triplicate ±SD. Columns, mean of cells; bars, SD; *, P < 0.05, **, P < 0.01. SD standard deviation.
Figure 4.
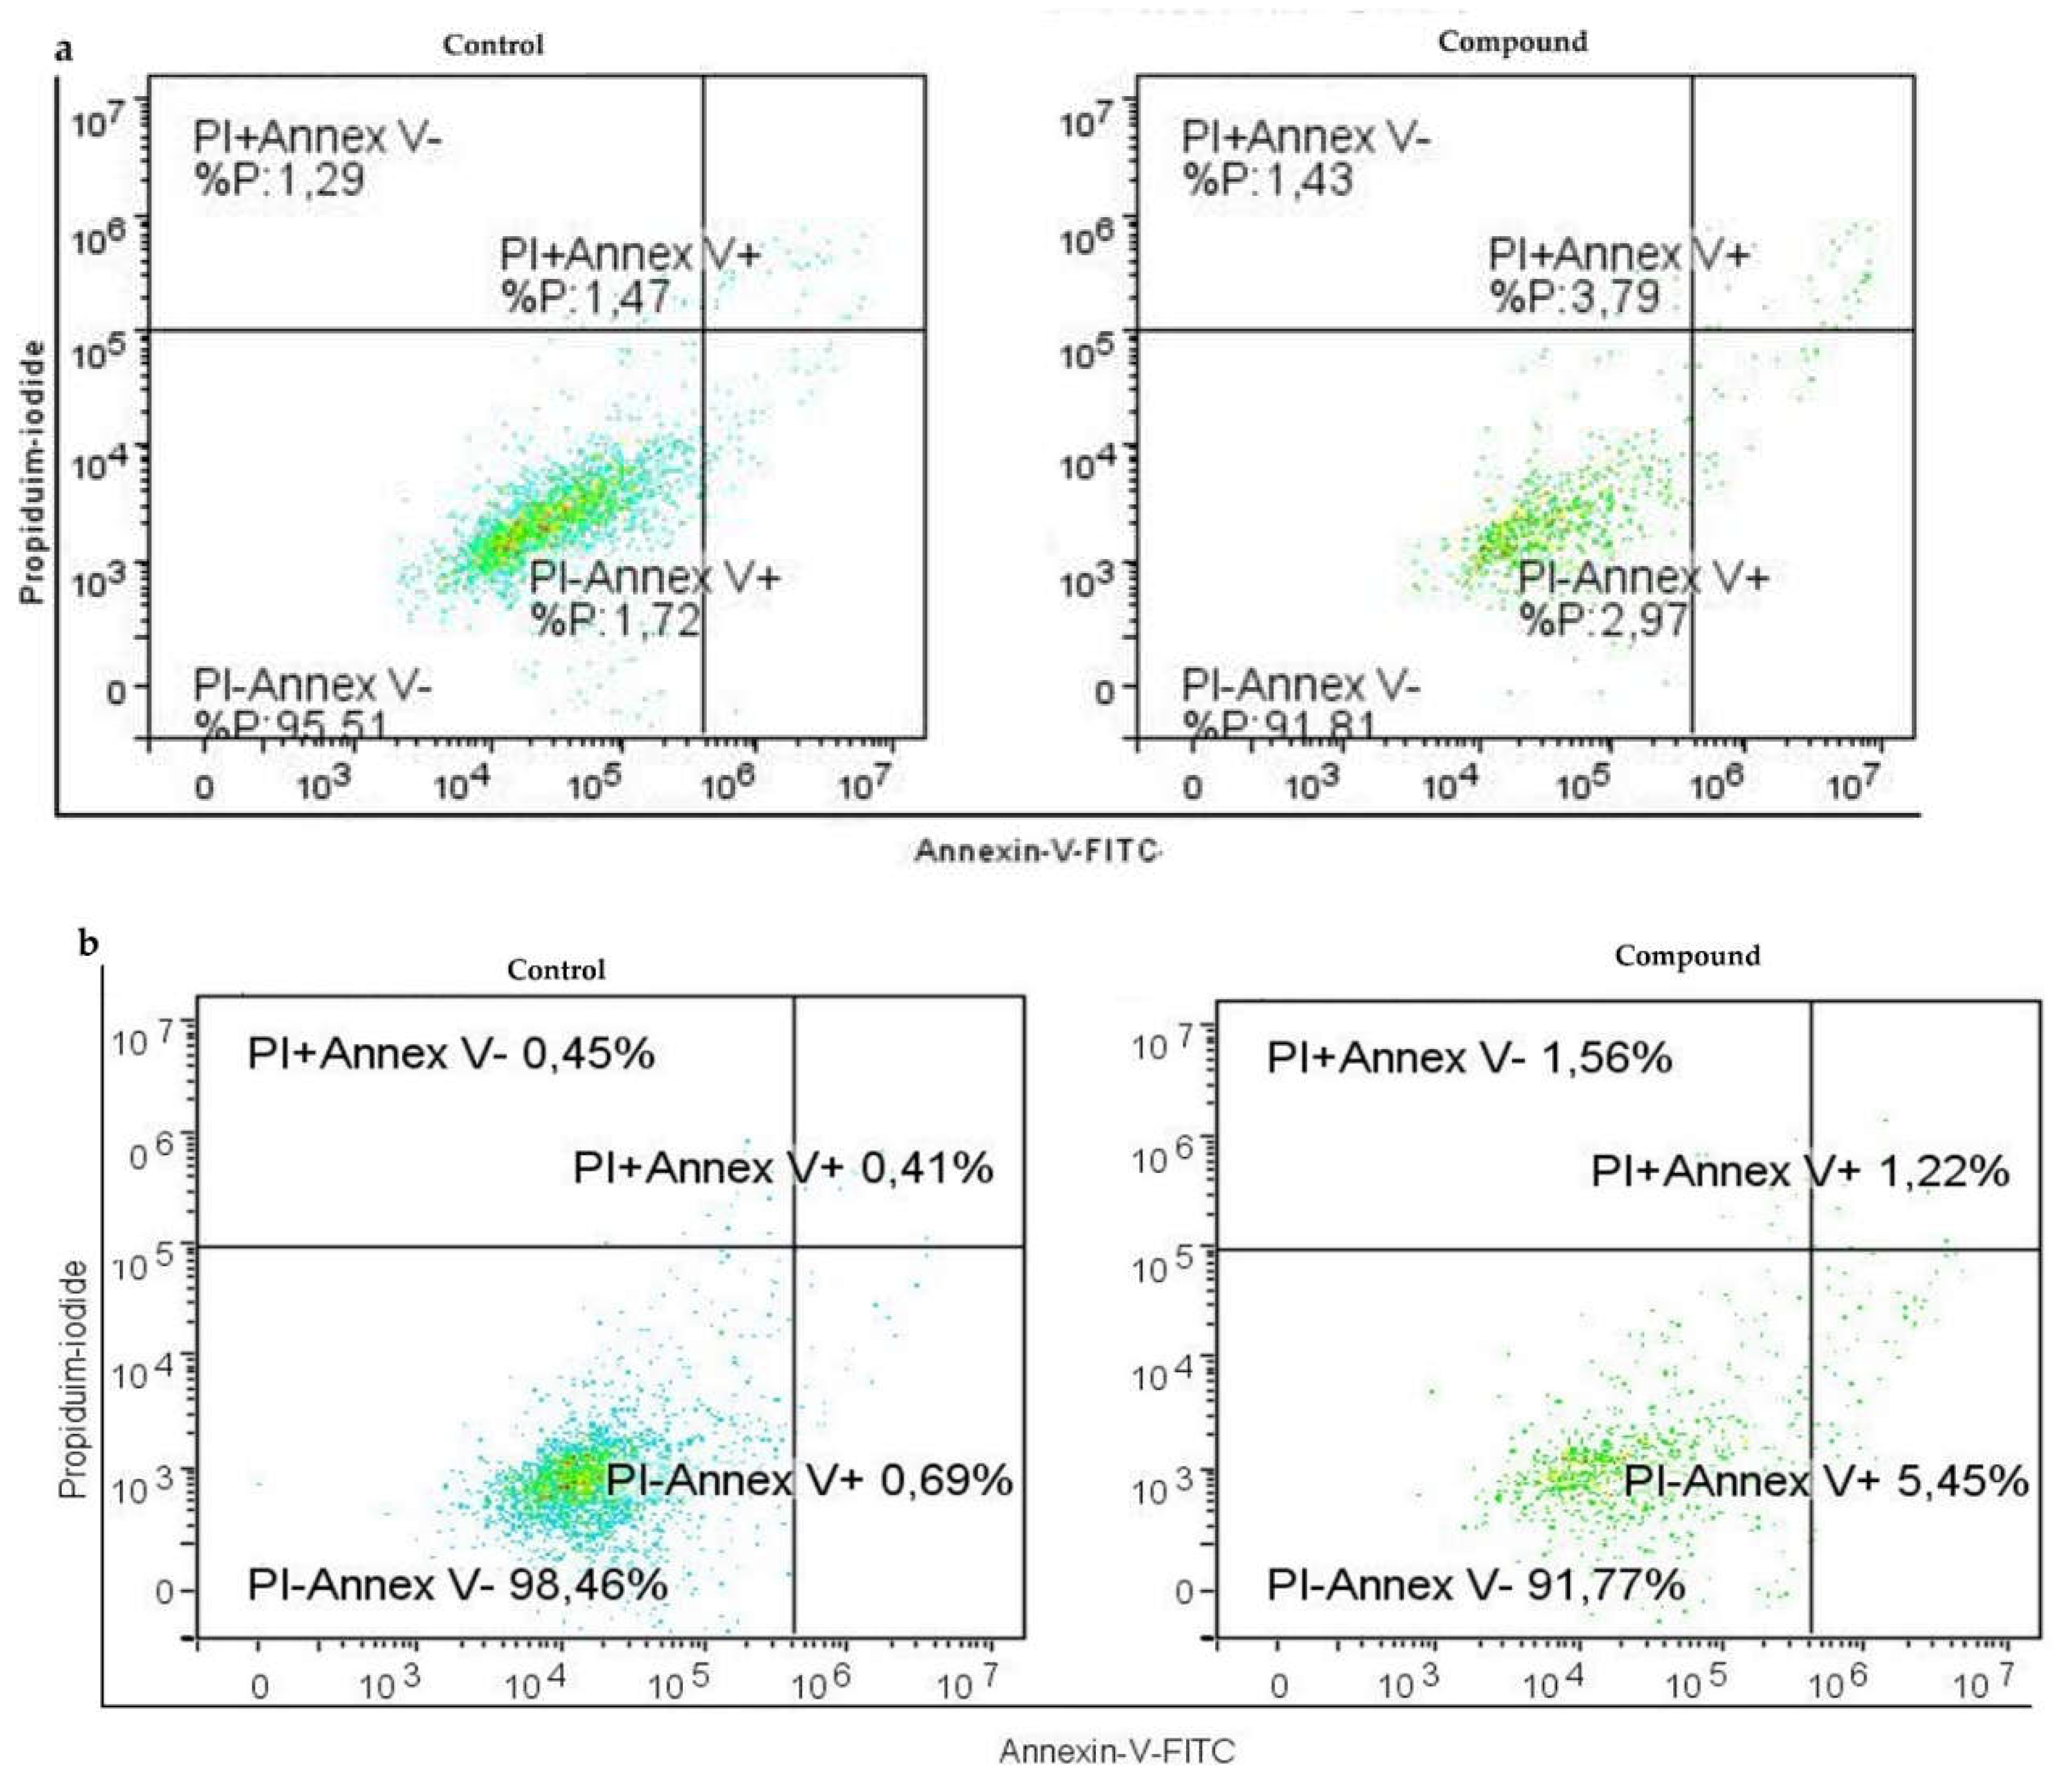
Apoptosis without or with the Compound 1 treatment. Notes: Dot graphs of apoptotic cells in both OVCAR-3 (a) and SK-OV-3 (b) cell lines before and following exposure for 48 hours. Annexin-V is shown by the x-axis, and propidium iodide (PI) is represented by the y-axis.
Figure 4.
Apoptosis without or with the Compound 1 treatment. Notes: Dot graphs of apoptotic cells in both OVCAR-3 (a) and SK-OV-3 (b) cell lines before and following exposure for 48 hours. Annexin-V is shown by the x-axis, and propidium iodide (PI) is represented by the y-axis.
Figure 5.
Shift of CSCs after exposure to Compound 1. Notes: Percentage of CD49f+ CSCs of OVCAR-3 (a) and the SK-OV-3 (b) cell line after treatment with Compound 1 in duration of 48 h. The displayed data are given as a mean from the experiment performed in triplicate ±SD. Columns, mean of cells; bars, SD; *P <0.05, ***P<0.001. CSCs cancer stem cells, SD standard deviation.
Figure 6.
Percentage and geometric mean fluorescence intensity of glycosphingolipid positive cell subpopulations in the SK-OV-3 cell line. Notes: Percentage of CSCs (a) and non-CSC (b) after treatment with Compound 1 in duration for 48 h. Geometric mean fluorescence intensity of CSCs (c) and non-CSCs (d) after treatment with Compound 1 in duration of 48 h. Data are expressed as a mean from the experiment performed in triplicate ±SD. Columns, mean of viable cells; bars, SD; * P < 0.05; ** P < 0.01, *** P < 0.001. CSC, CD49f
+; non-CSC, CD49
-; Neu5Ac, N-acetylneuraminic acid. The gangliosides' classification follows the IUPAC-IUB recommendations [
17] and the nomenclature of Svennerholm [
10]. GD3, II
3(Neu5Ac)2-LacCer; neolactotetraosylceramide or nLc
4Cer; IV
3Neu5Ac-nLc
4Cer; GalNAc-GM1b, IV
3Neu5Ac-Gg
5Cer; gangliotriaosylceramide or Gg
3Cer, GalNAcβ1-4Galβ1-4Glcβ1-1Cer; globotetraosylceramide or Gb
4Cer, GalNAcβ1-3Galα1-4Galβ1-4Glcβ1-1Cer; GM2, II
3Neu5AcGg
3Cer; GM3, II
3Neu5Ac-LacCer; GMI, geometric mean fluorescence intensity; SD, standard deviation.
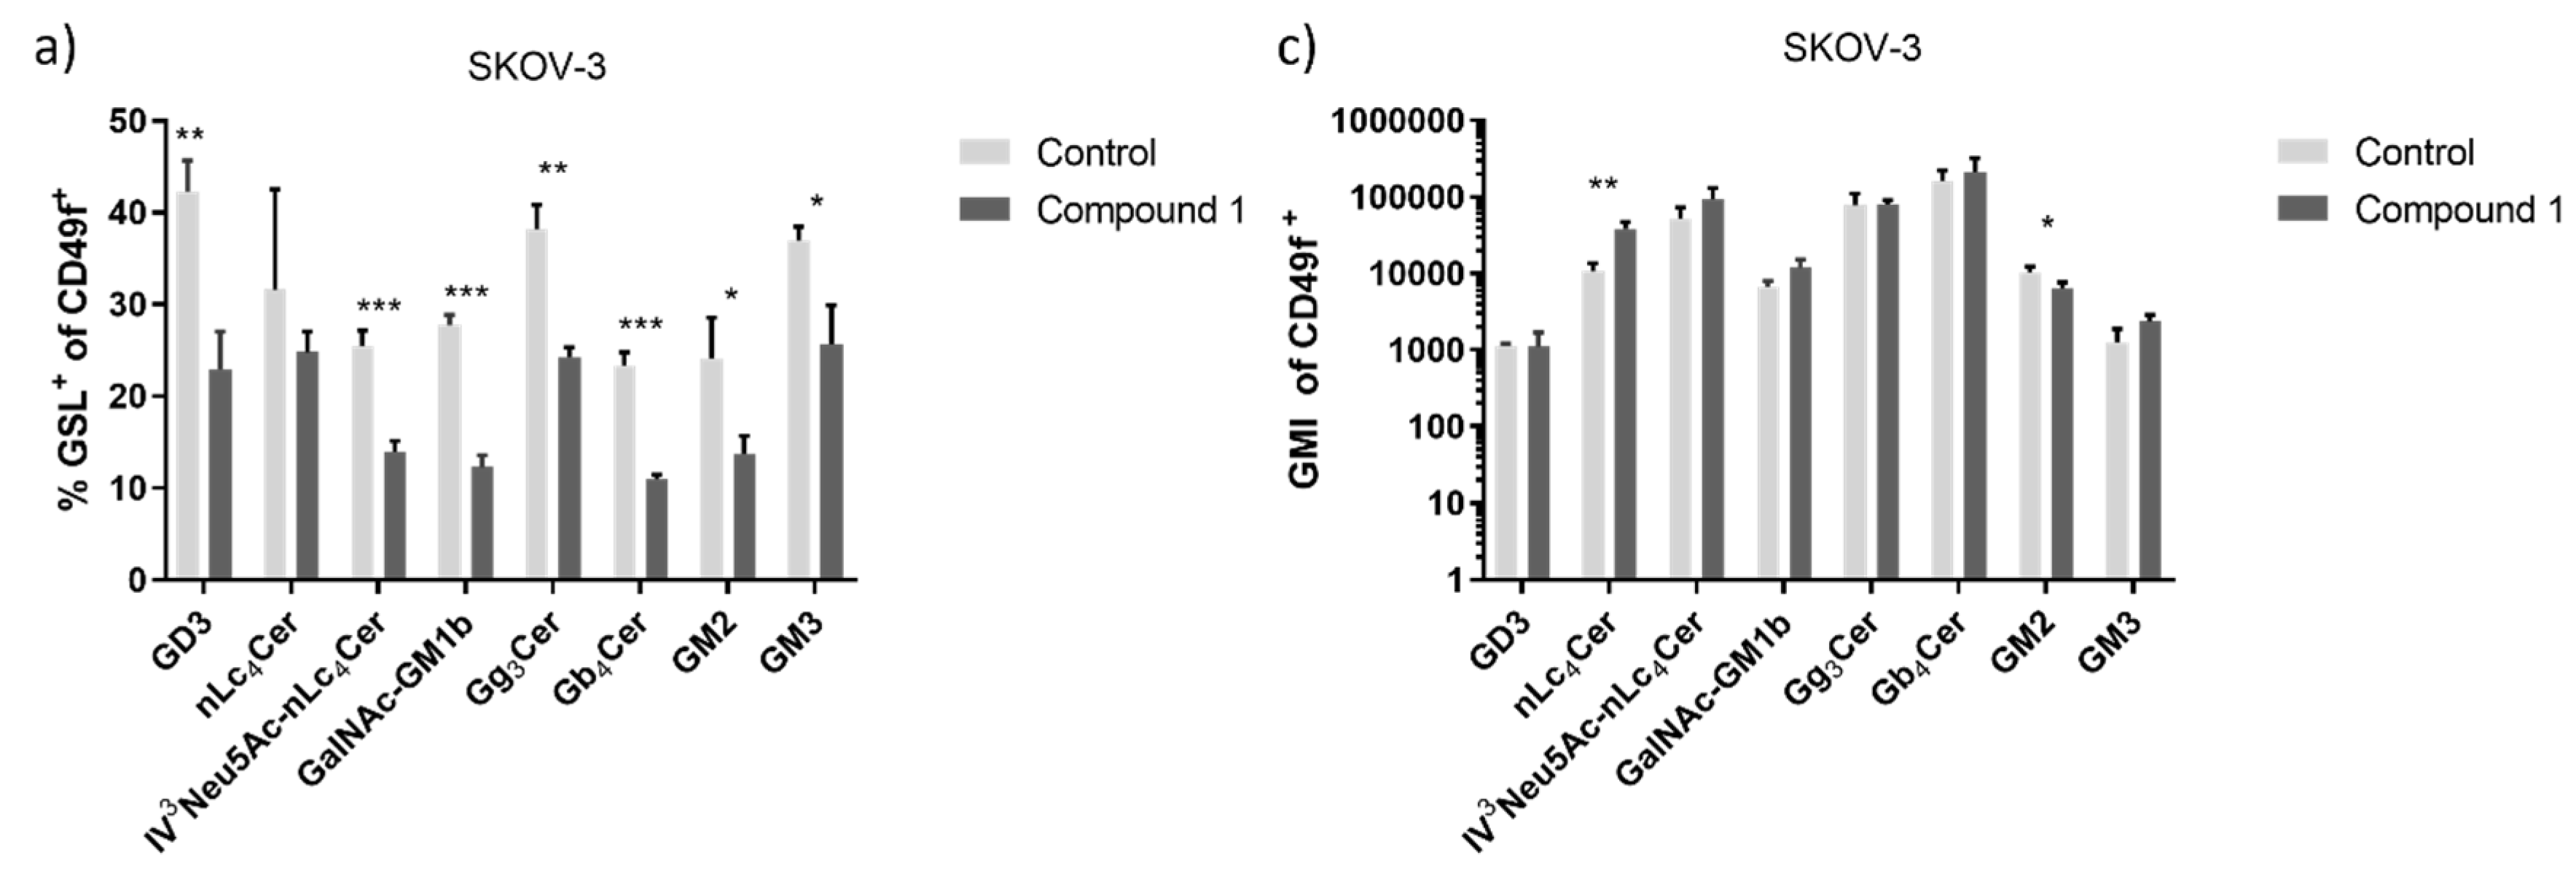
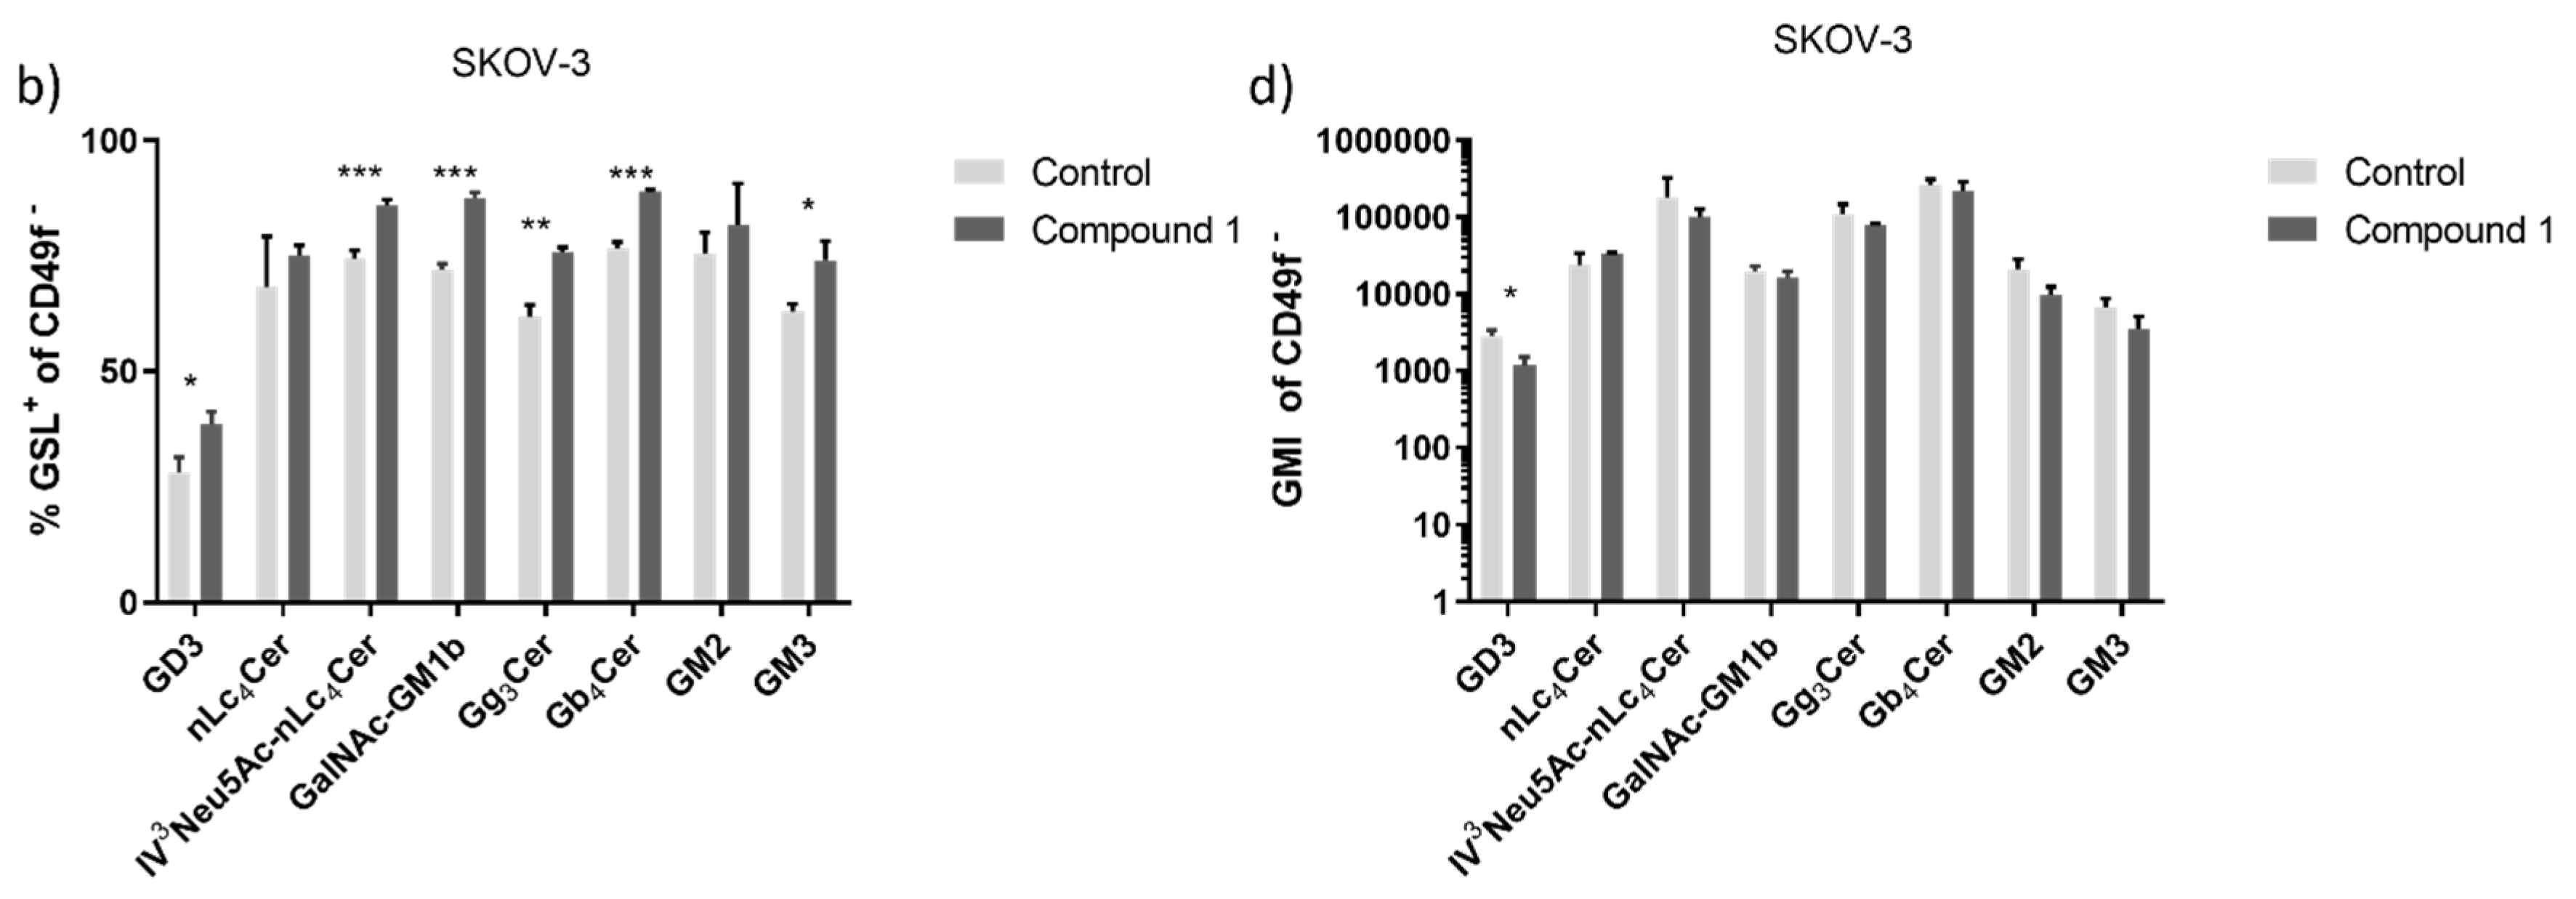
Figure 7.
Percentage and geometric mean fluorescence intensity of glycosphingolipid positive cell subpopulations in the OVCAR-3 cell line. Notes Percentage of CSCs (a) and non-CSC (b) after treatment with Compound 1 (48 h). Geometric mean fluorescence intensity of CSCs (c) and non-CSCs (d) after treatment with Compound 1 in duration of 48 h. Data are expressed as a mean from the experiment performed in triplicate ±SD. Columns, mean of viable cells; bars, SD; * P < 0.05; ** P < 0.01, *** P < 0.001. CSC, CD49f
+; non-CSC, CD49
-; Neu5Ac, N-acetylneuraminic acid. The designation of the gangliosides follows the IUPAC-IUB recommendations [
17] and the nomenclature of Svennerholm [
10]. GD3, II
3(Neu5Ac)2-LacCer; neolactotetraosylceramide or nLc
4Cer; IV
3Neu5Ac-nLc
4Cer; GalNAc-GM1b, IV
3Neu5Ac-Gg5Cer; gangliotriaosylceramide or Gg
3Cer, GalNAcβ1-4Galβ1-4Glcβ1-1Cer; globotetraosylceramide or Gb
4Cer, GalNAcβ1-3Galα1-4Galβ1-4Glcβ1-1Cer; GM2, II
3Neu5AcGg
3Cer; GM3, II
3Neu5Ac-LacCer; GMI, geometric mean fluorescence intensity; SD, standard deviation.
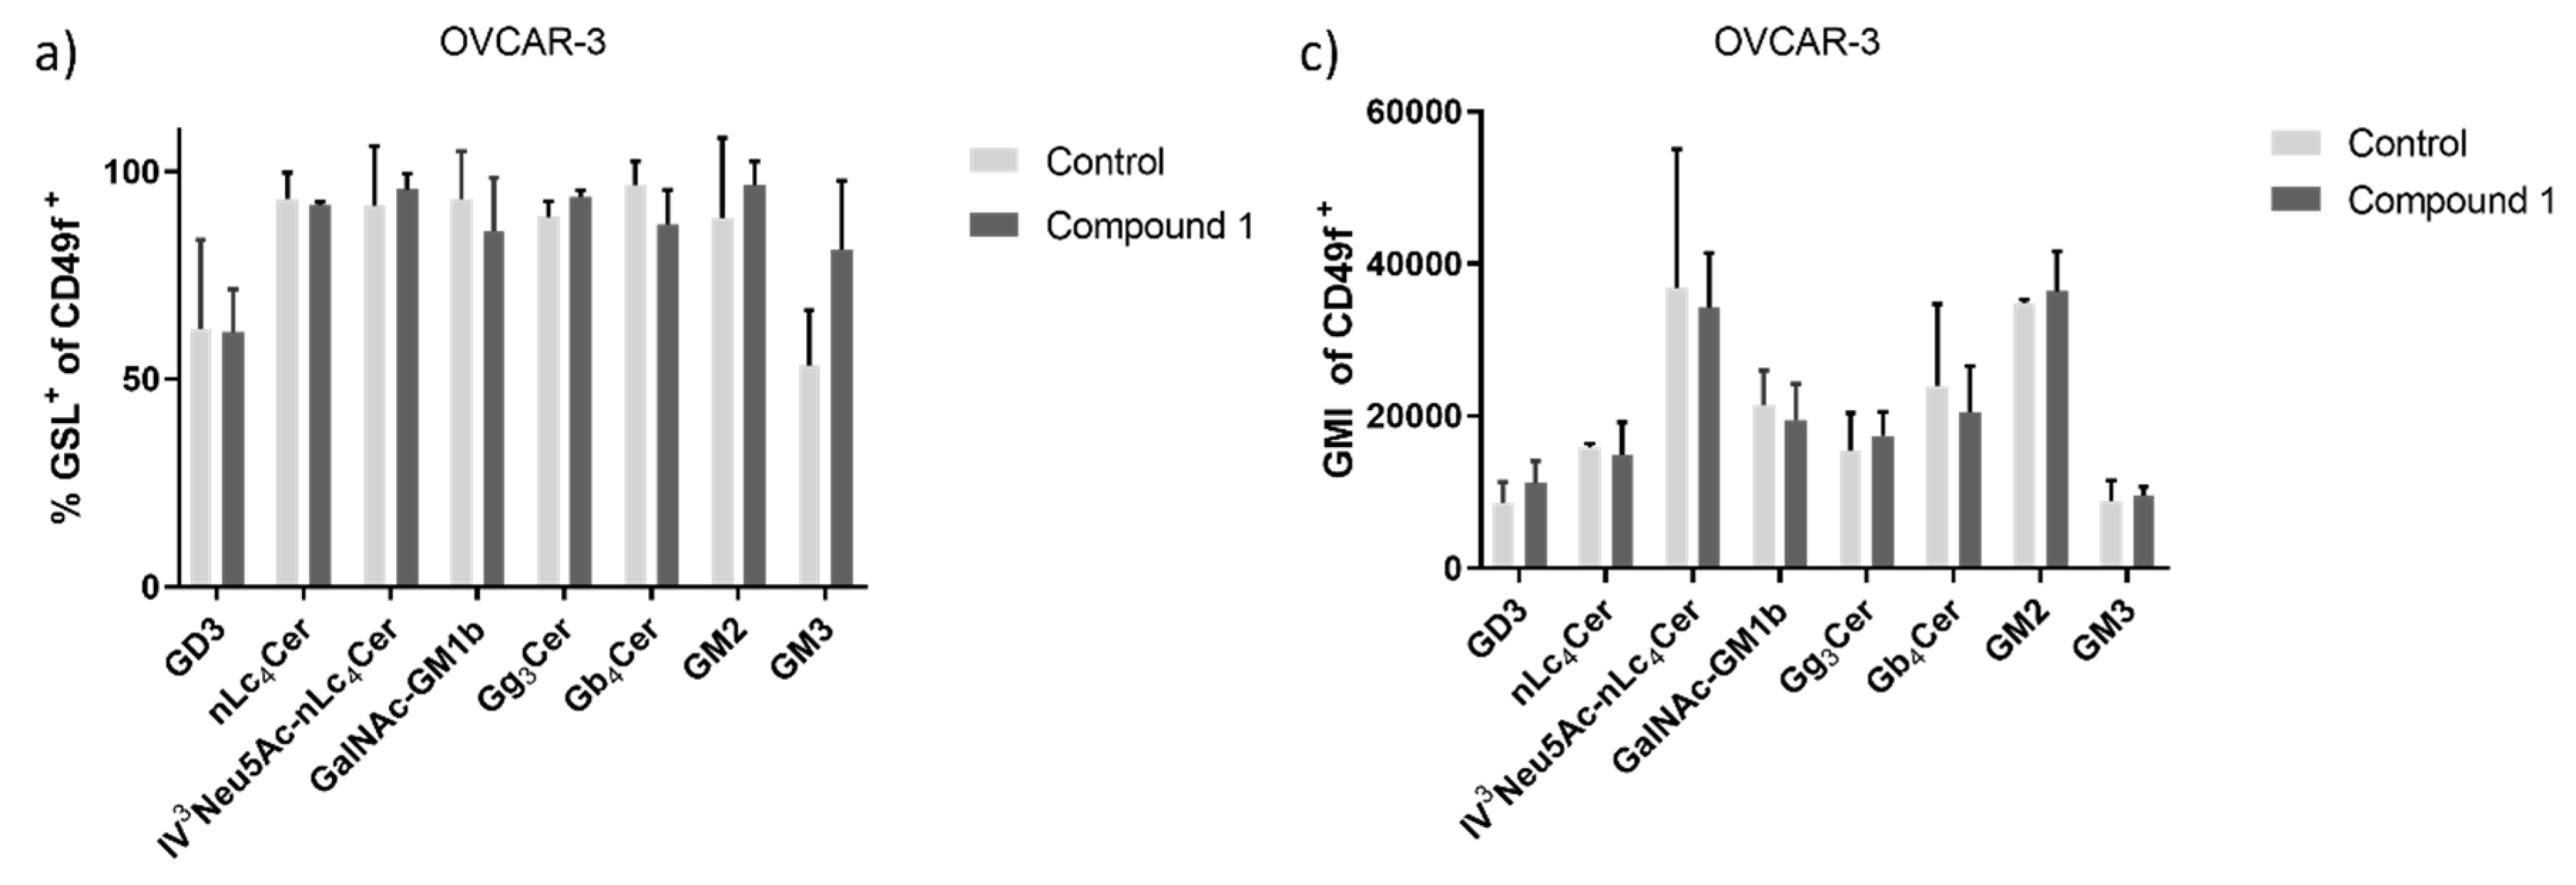
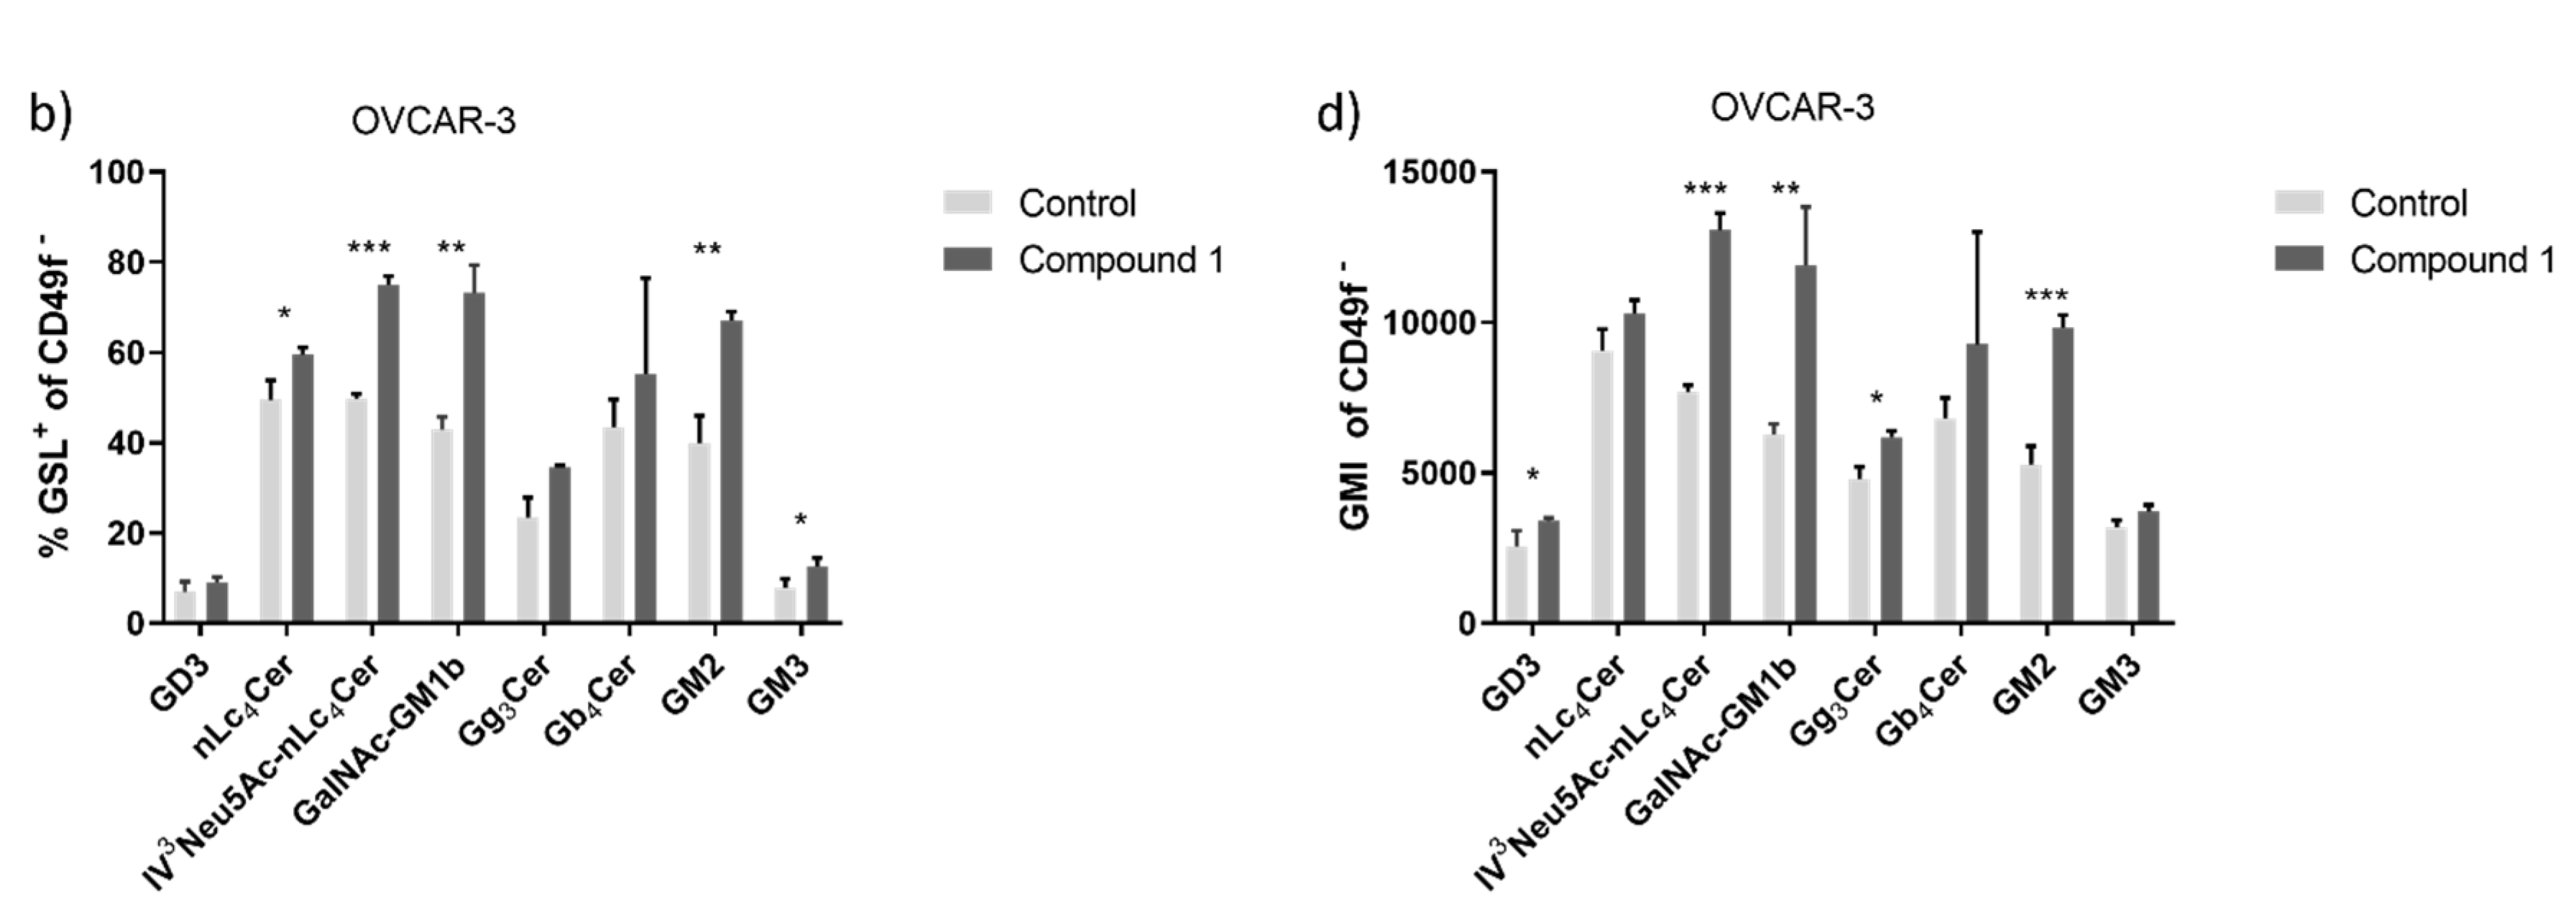
Figure 8.
Clusters of metabolites in both treated cancer cell lines. Notes: principal component analysis (PCA) of metabolic profile of OVCAR-3 (a) and SK-OV-3 (b) cancer cell line with or without treatment with Compound 1 in the duration of 48 h.
Figure 8.
Clusters of metabolites in both treated cancer cell lines. Notes: principal component analysis (PCA) of metabolic profile of OVCAR-3 (a) and SK-OV-3 (b) cancer cell line with or without treatment with Compound 1 in the duration of 48 h.
Figure 9.
Metabolites and metabolomic pathways of OVCAR-3 and SK-OV-3 cell lines after the treatment with Compound 1. Notes: metabolomic enrichment analysis of (a) OVCAR-3 and (b) SK-OV-3 cell lines after treatment with Compound 1 for 48 h.
Figure 9.
Metabolites and metabolomic pathways of OVCAR-3 and SK-OV-3 cell lines after the treatment with Compound 1. Notes: metabolomic enrichment analysis of (a) OVCAR-3 and (b) SK-OV-3 cell lines after treatment with Compound 1 for 48 h.
Figure 10.
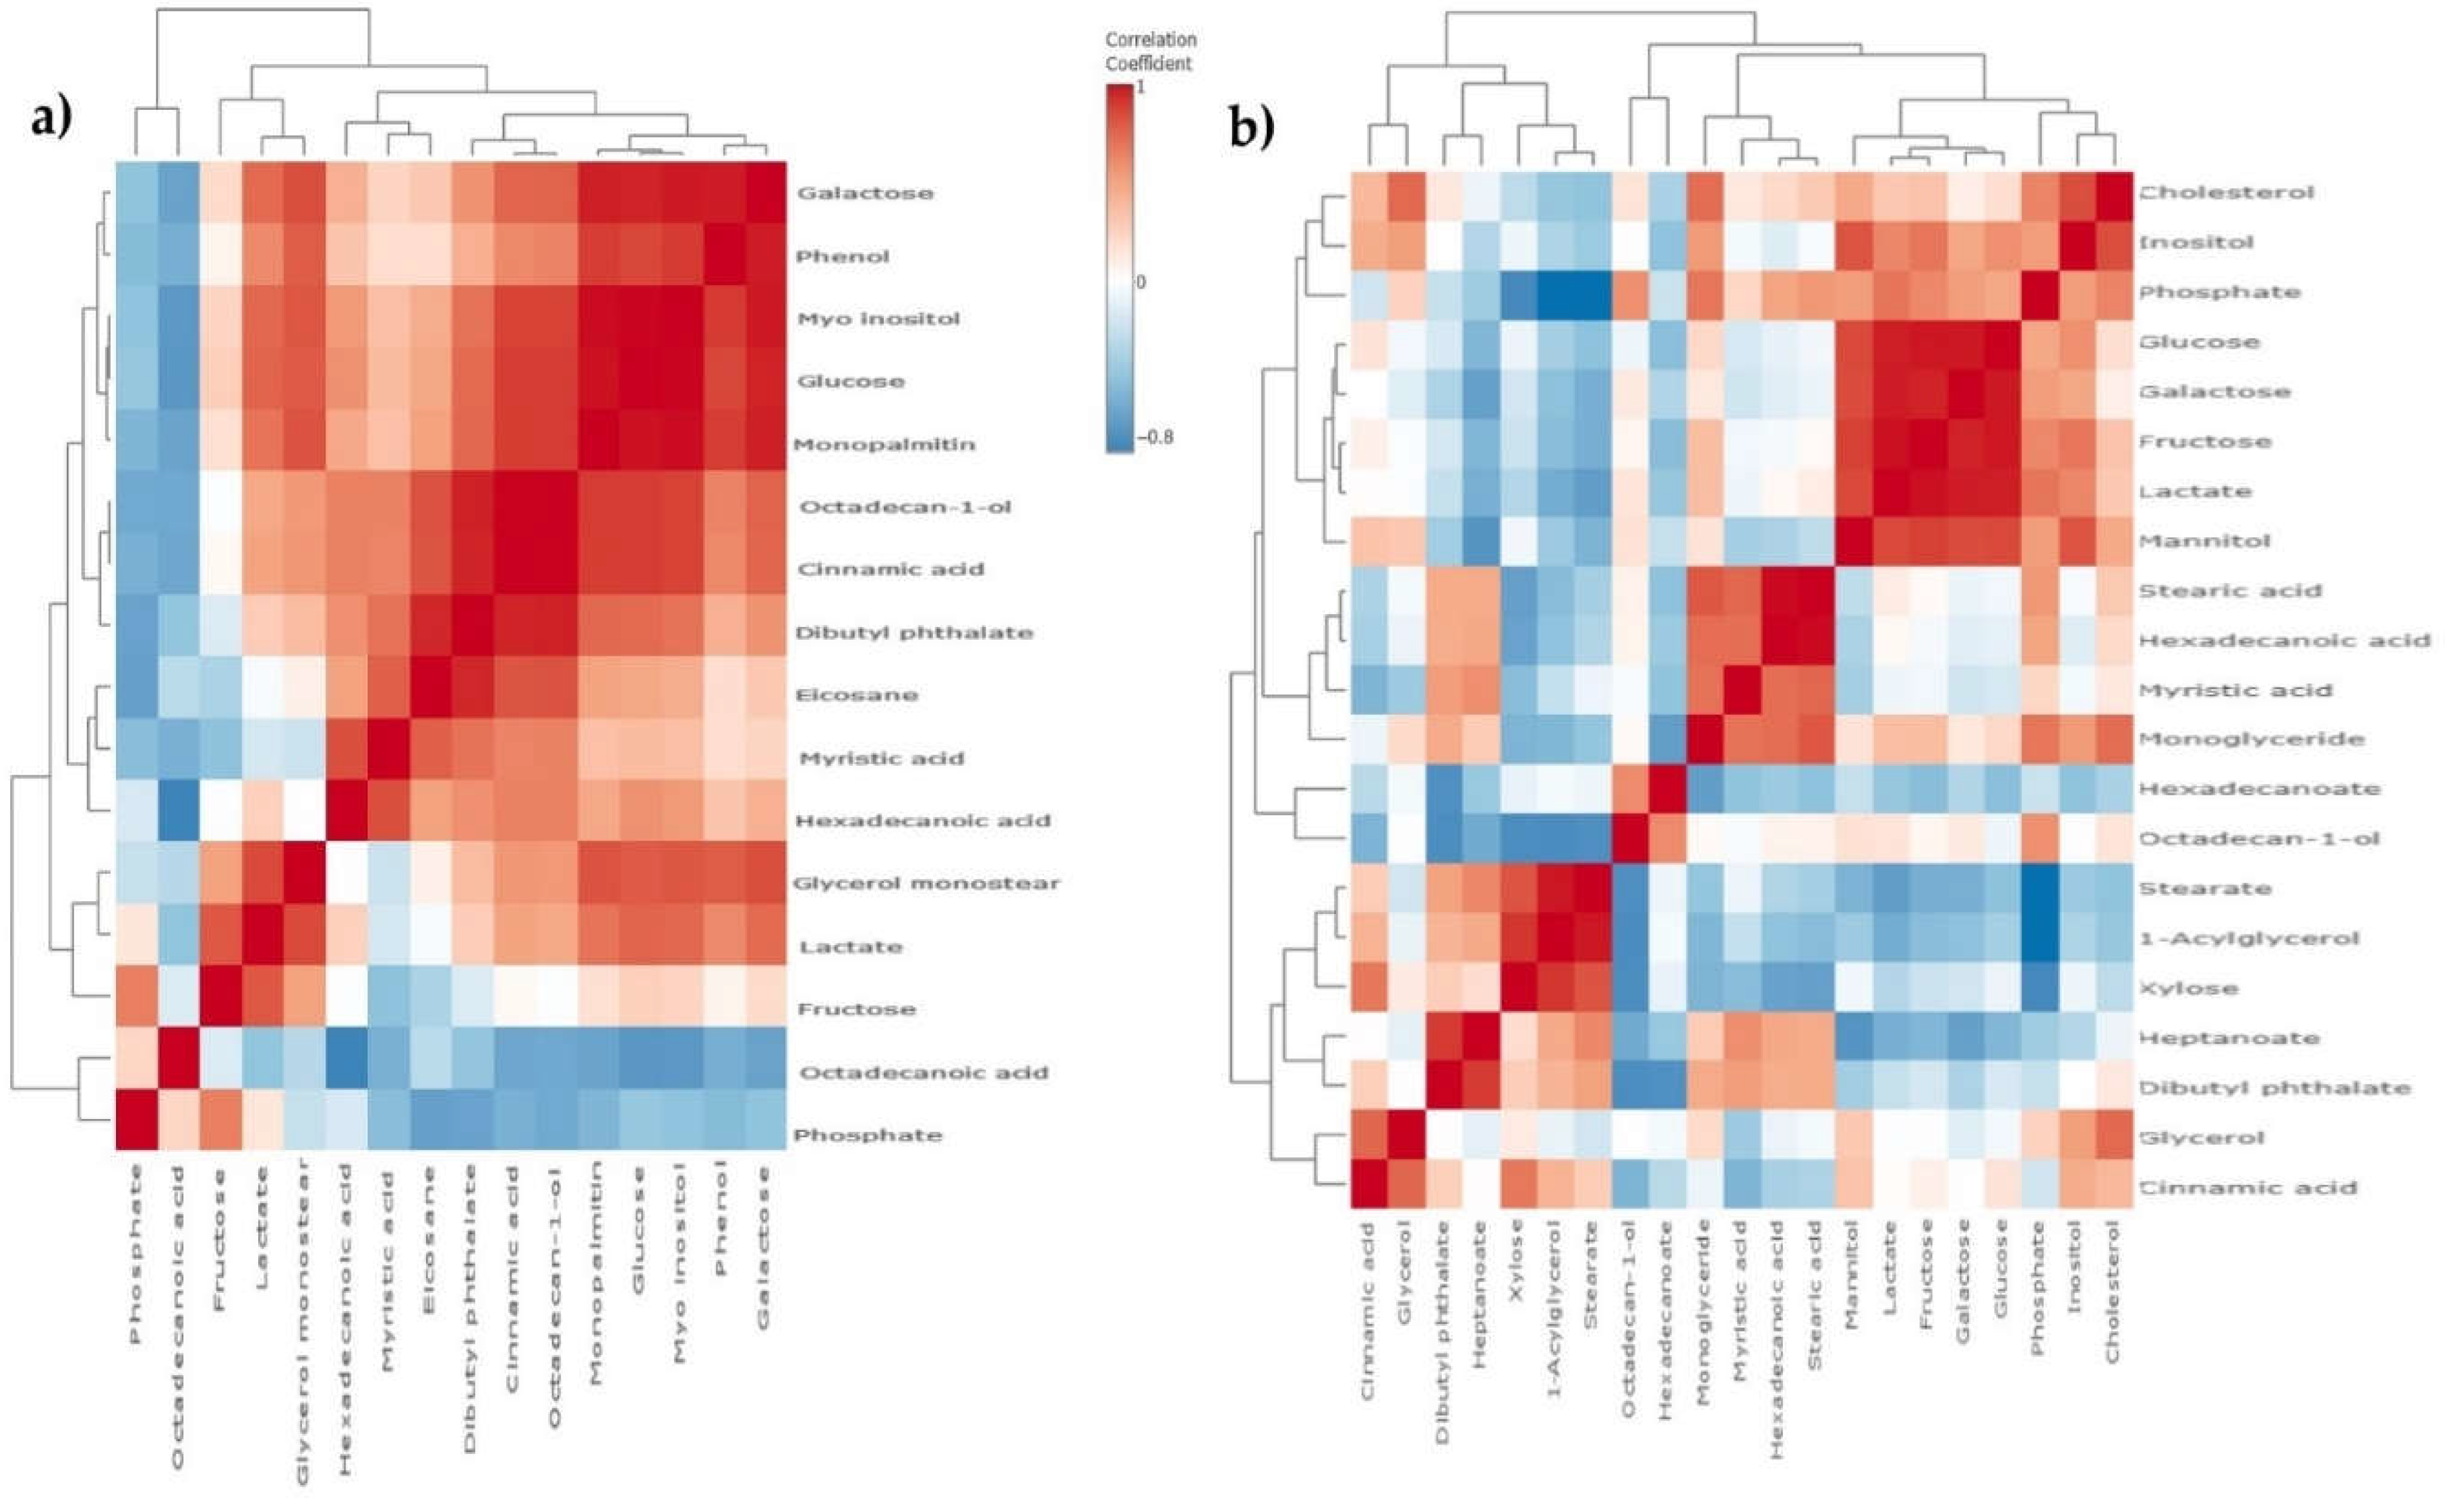
Metabolomic correlation matrix of OVCAR-3 and SK-OV-3 cell lines after the treatment with Compound 1. Notes: correlation matrix of (a) OVCAR-3 and (b) SK-OV-3 cell line metabolomics after treatment with Compound 1 for 48 h. The highest positive correlation is represented as dark red shades and the highest negative as dark blue shades. “Clusters” of substances are connected outside of the matrix.
Table 1.
List of detected metabolites in OVCAR-3 and SK-OV-3 cancer cell lines after treatment with Compound 1.
Table 1.
List of detected metabolites in OVCAR-3 and SK-OV-3 cancer cell lines after treatment with Compound 1.
| No. |
Metabolite |
OVCAR-3 |
SK-OV-3 |
| P-value |
Fold change |
P-value |
Fold change |
| 1 |
Lactate |
0.09 |
-1.13 |
0.06 |
1.43 |
| 2 |
Cinnamic acid |
0.01* |
-4.02 |
0.37 |
5.59 |
| 3 |
Phenol |
0.02* |
-3.12 |
- |
- |
| 4 |
Galactose |
0.001* |
-1.59 |
0.09 |
0.80 |
| 5 |
Glucose |
<0.001* |
-1.80 |
0.05* |
0.52 |
| 6 |
Dibutyl phthalate |
0.09 |
-3.41 |
0.80 |
-0.16 |
| 7 |
Inositol |
<0.001* |
-2.8 |
0.005* |
1.57 |
| 8 |
Octadecan-1-ol |
0.01* |
-2.69 |
0.99 |
-0.01 |
| 9 |
Octadecanoic acid |
0.09 |
2.41 |
- |
- |
| 10 |
Isopropyl myristate |
0.003* |
-2.42 |
- |
- |
| 11 |
Heptanoate |
< 0.001* |
-1.45 |
0.29 |
-0.41 |
| 12 |
Monoglyceride |
0.05* |
-0.56 |
0.50 |
0.19 |
| 13 |
Eicosane |
0.32 |
-2.98 |
- |
- |
| 14 |
Hexadecanoic acid |
0.25 |
-1.19 |
0.57 |
-0.98 |
| 15 |
Phosphate |
0.29 |
0.80 |
0.33 |
0.67 |
| 16 |
Fructose |
0.68 |
-0.59 |
0.37 |
5.59 |
| 17 |
Stearic acid |
- |
- |
0.71 |
-0.49 |
| 18 |
Mystric acid |
- |
- |
0.70 |
-0.16 |
| 19 |
Stearate |
- |
- |
0.40 |
-0.80 |
| 20 |
Mannitol |
- |
- |
0.003* |
2.55 |
| 21 |
Cholesterol |
- |
- |
0.18 |
0.85 |
| 22 |
1-Acylglycerol |
- |
- |
0.56 |
-0.68 |
| 23 |
Glycerol |
- |
- |
0.46 |
0.61 |
| 24 |
Xylose |
- |
- |
0.93 |
0.06 |
