1. Introduction
For islands such as the Maltese archipelago, protecting coastal areas from large waves in bad weather conditions has important social and environmental benefits. Floating Breakwaters (FBWs) may offer a solution to islands surrounded by deep waters given the following two advantages over seabed-mounted breakwaters (BWs): [
1]:
Additionally, the installation of multiple FBWs can support the multi-use of offshore space, which also includes offshore renewables such as floating solar PV farms and offshore energy storage systems (ESSs). However, such projects can only become a reality if they are feasible financially. Techno-economic feasibility assessments are essential for establishing the viability of new technologies under development [
2]. Gao et al. [
3] performed a techno-economic assessment of offshore hybrid wind-wave farms with integrated ESSs. The study found that reducing ESS requirements by generating energy from hybrid, offshore wind-wave farms instead of solely an offshore wind farm leads to more competitive lifecycle costs. The study also highlights that overall costs are heavily dependent on the local renewable energy resources (RESs). Similarly, Rönkkö et al. [
4] performed a case study comparing three hybrid, offshore wind-wave systems, highlighting the importance of a shared infrastructure to reap the most benefit.
The rapid increase in RES plants harvesting intermittent sources of energy, such as wind and solar , is leading to grid management problems given that the energy supply often does not match the actual demand of end consumers [
7]. Energy storage is essential for handling this challenge, and enables the integration of renewables on a wide scale within electricity supply networks [
8,
9]. There is a growing interest to combine offshore renewables with other activities within the same marine space, including aquaculture and energy storage. Apart from making more efficient use of marine areas, co-locating different activities offers opportunities for cost reduction by being able to share common infrastructure, such as moorings and power transmission infrastructure. Several studies involving the co-location of existing structures with new structures to generate and store renewable energy are being carried out. Scroggins et al. [
10] assessed the role that renewable energy plays in the aquaculture and fisheries industries, concluding that the RES provide a maximum of 5% of the energy required to maintain the said industries. The study concluded that a shift to situation-specific RES is required if international decarbonization aims are to be reached. Similarly, Lilas et al. [
11] highlighted that combining offshore wind turbines with aquaculture allows for carbon footprint reduction, while also meeting the energy demands of the aquaculture farm via a centralized, multi-use platform which also integrates ESSs. The study also emphasises that moving aquaculture further offshore reduces the negative environmental impact of fisheries. Bocci et al. [
12] investigated opportunities for the development of multi-use space based on 10 case studies across Europe, highlighting that whilst space claiming can create conflict, the advantages outweigh the disadvantages due to the common benefits for multiple parties within the multi-use space.
Dalton et al. [
13] analysed and found that combining energy, food and water in the same marine space leads to attractive system profitability. Srinivasan et al. [
14] investigated the possibility of having a floating PV setup together with a BESS to be installed and used purely for an offshore oil platform facility. The study found that the economic feasibility of the project relies heavily on the optimisation of the floating platform, specifically on the anchoring and mooring systems. Environmentally, the study found that reductions in CO
2 emissions due to the inclusion of the floating PV system were obtained. Elginoz et al. [
15] presented a multi-purpose platform accommodating both wave and wind energy generation. Their life-cycle assessment found that the primary source of pollution occurred during manufacturing of the platform and the decommissioning costs were affected depending on the recyclability of the platform parts. Abhinav et al. [
16] reviewed platforms integrating multiple renewable energy generation sources with co-located aquaculture systems. The study concluded that such systems are still at a low technology readiness level (TRL), with multi-purpose platforms still being far from common practice.
From the above published works, one can observe that co-location, i.e., locating different technologies within the same marine space, is essential for improving the economic viability of offshore projects. Additionally, the ideal approach to such projects is one which satisfies the three pillars of sustainability, namely: environmental, social and economic. This paper investigates the viability of developing an offshore project, dubbed FORTRESS (A Floating Offshore Breakwater for Supporting Marine Renewable Energy around Islands), involving the deployment of a novel, modular floating breakwater (FBW) design to create a sheltered water area in deep sea to support multiple activities. The novel FBW incorporates a long-duration energy storage (LDES) system based on the FLASC (Floating Liquid Accumulator using Seawater under Compression) technology [
17].
The proposed concept involving the deployment of multiple FBW modules, dubbed Project FORTRESS, will enable multiple revenue streams through the co-located assets, including sales of renewable energy from floating wind and solar farms, the provision of energy storage services and the provision of sheltered waters for aquaculture cages and berthing of seafaring vessels. It is assumed that investors develop the Project FORTRESS to own and operate the FBWs, with revenue being generated from two sources (1) provision of sheltered waters offshore and (2) energy storage services, in case of hybridisation. The paper assesses numerous case studies for the proposed concept applied to the Maltese deep waters, located in the Central Mediterranean Sea. The main objective of this study is to evaluate whether such revenue sources yield a sustainable business case to invest in the proposed FBW technology.
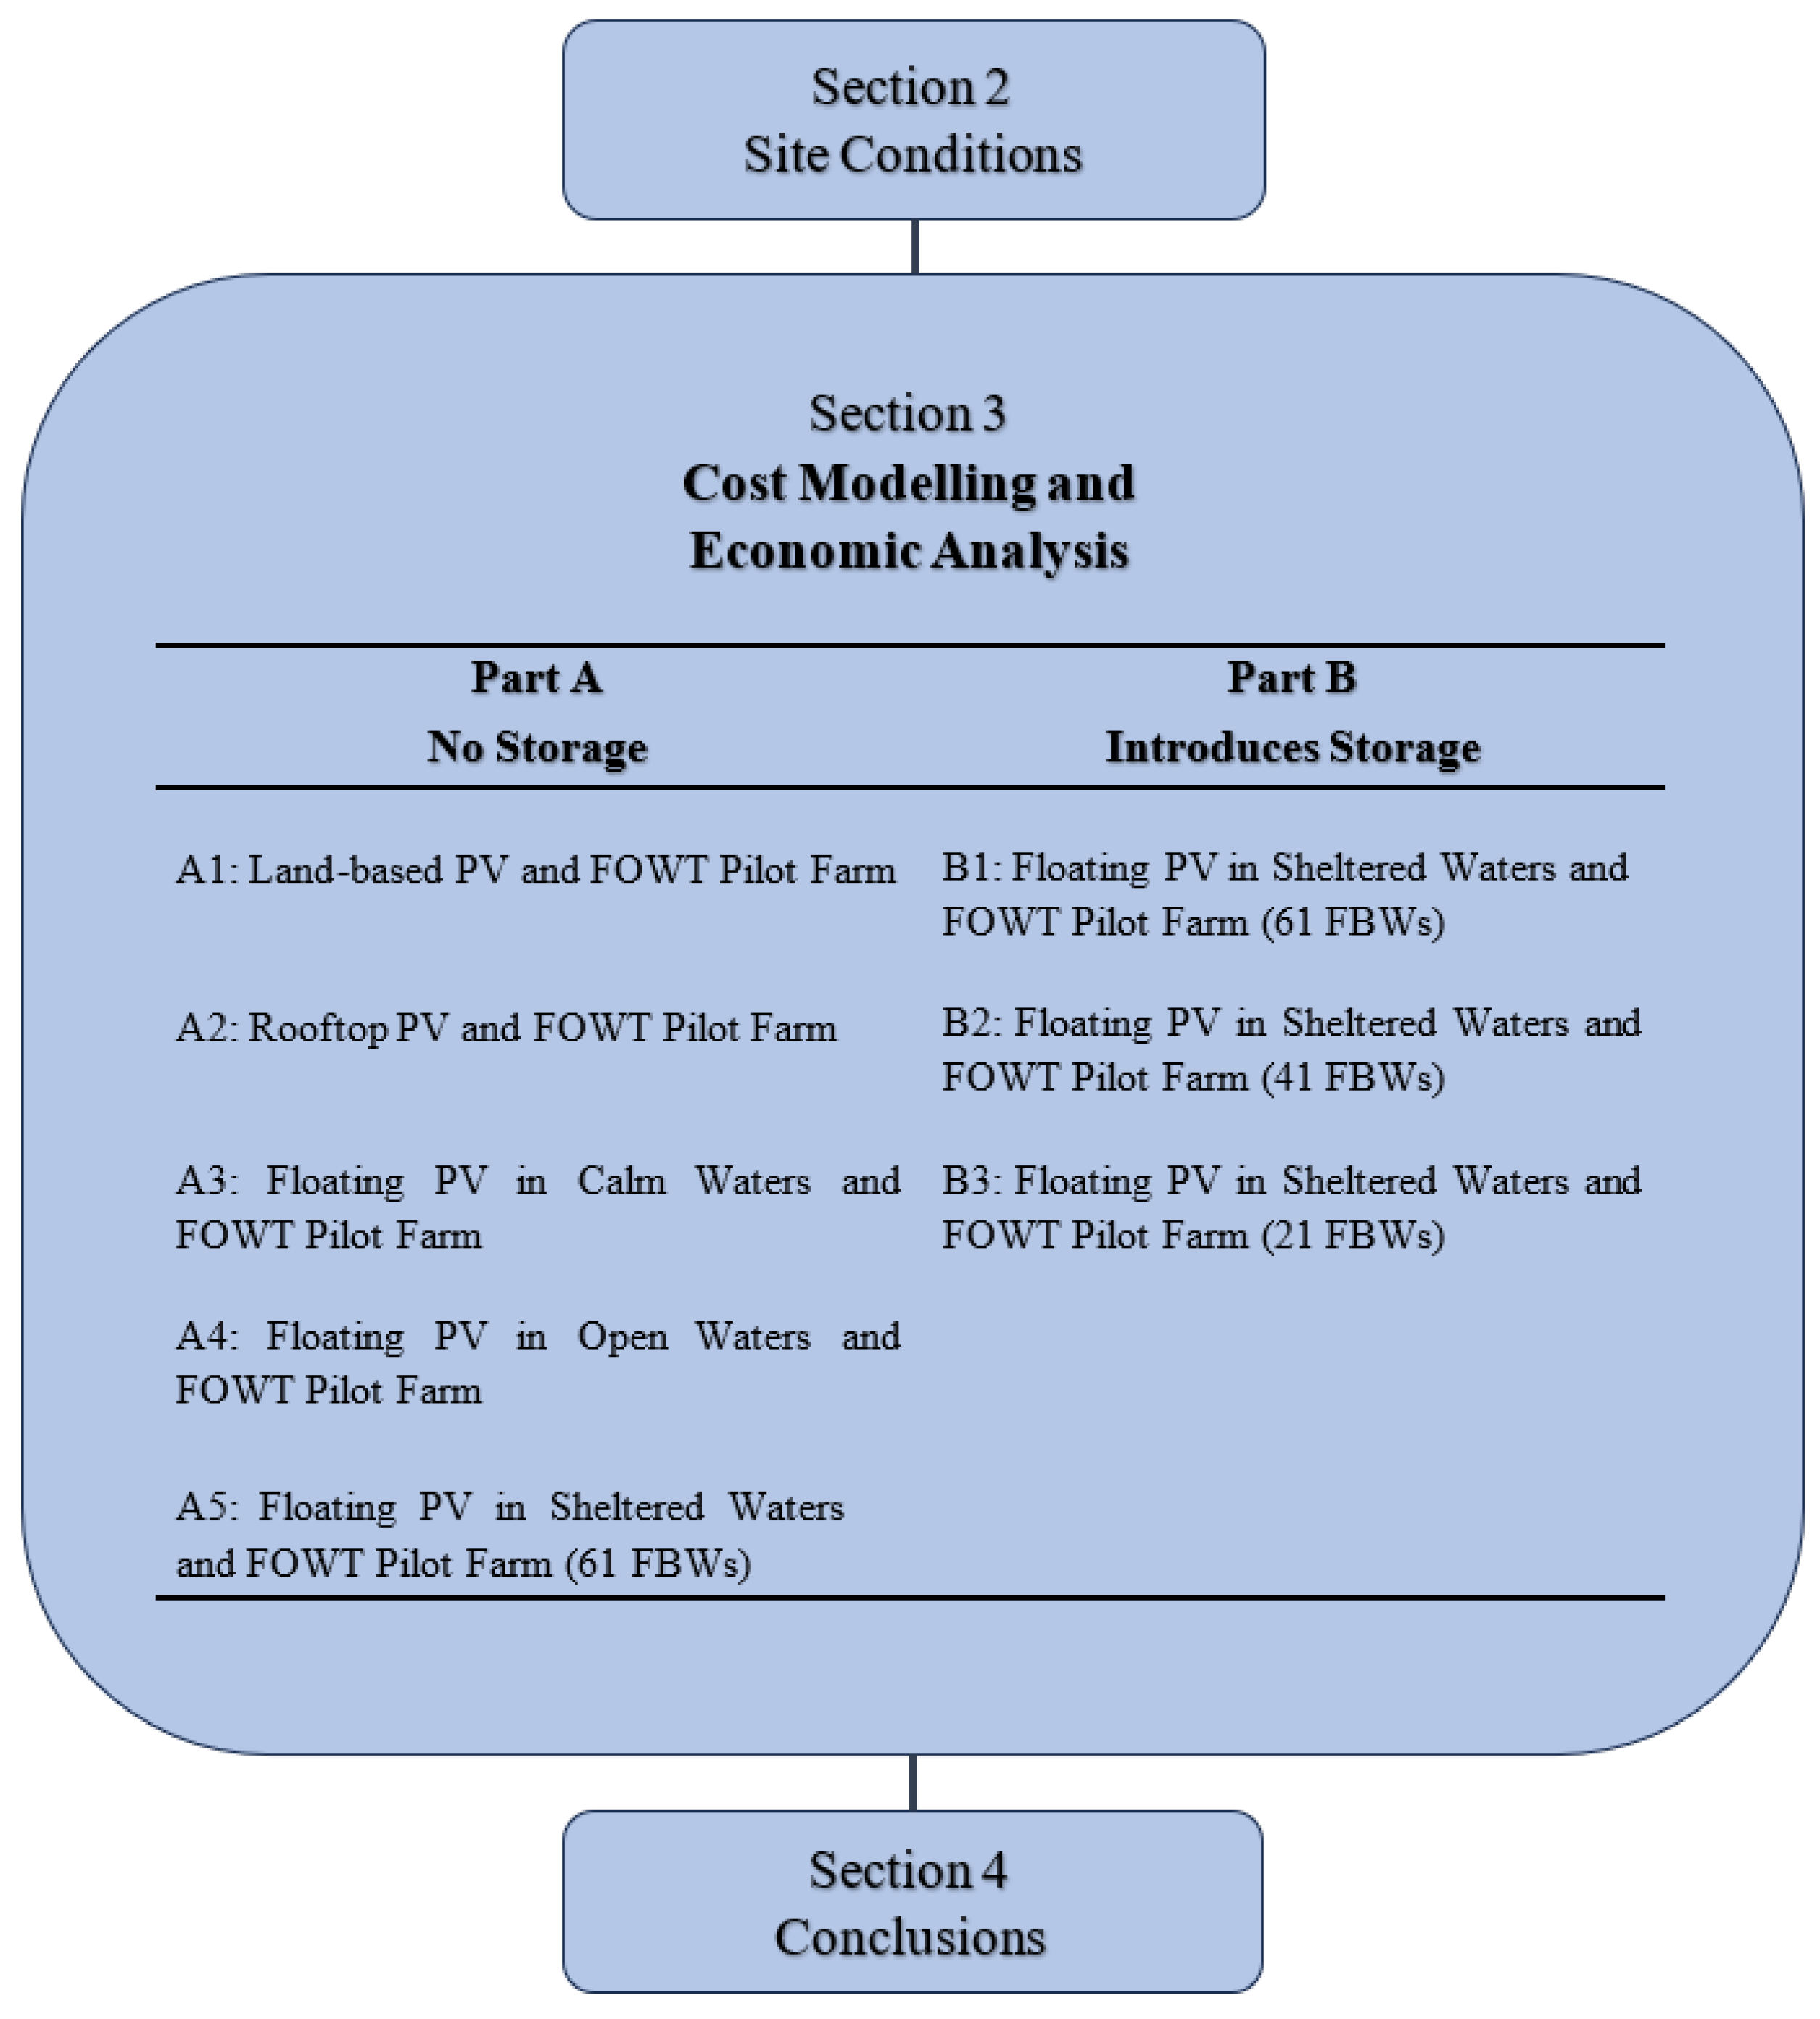
Figure 1 summarises the workflow presented within this report. The work was set up as follows:
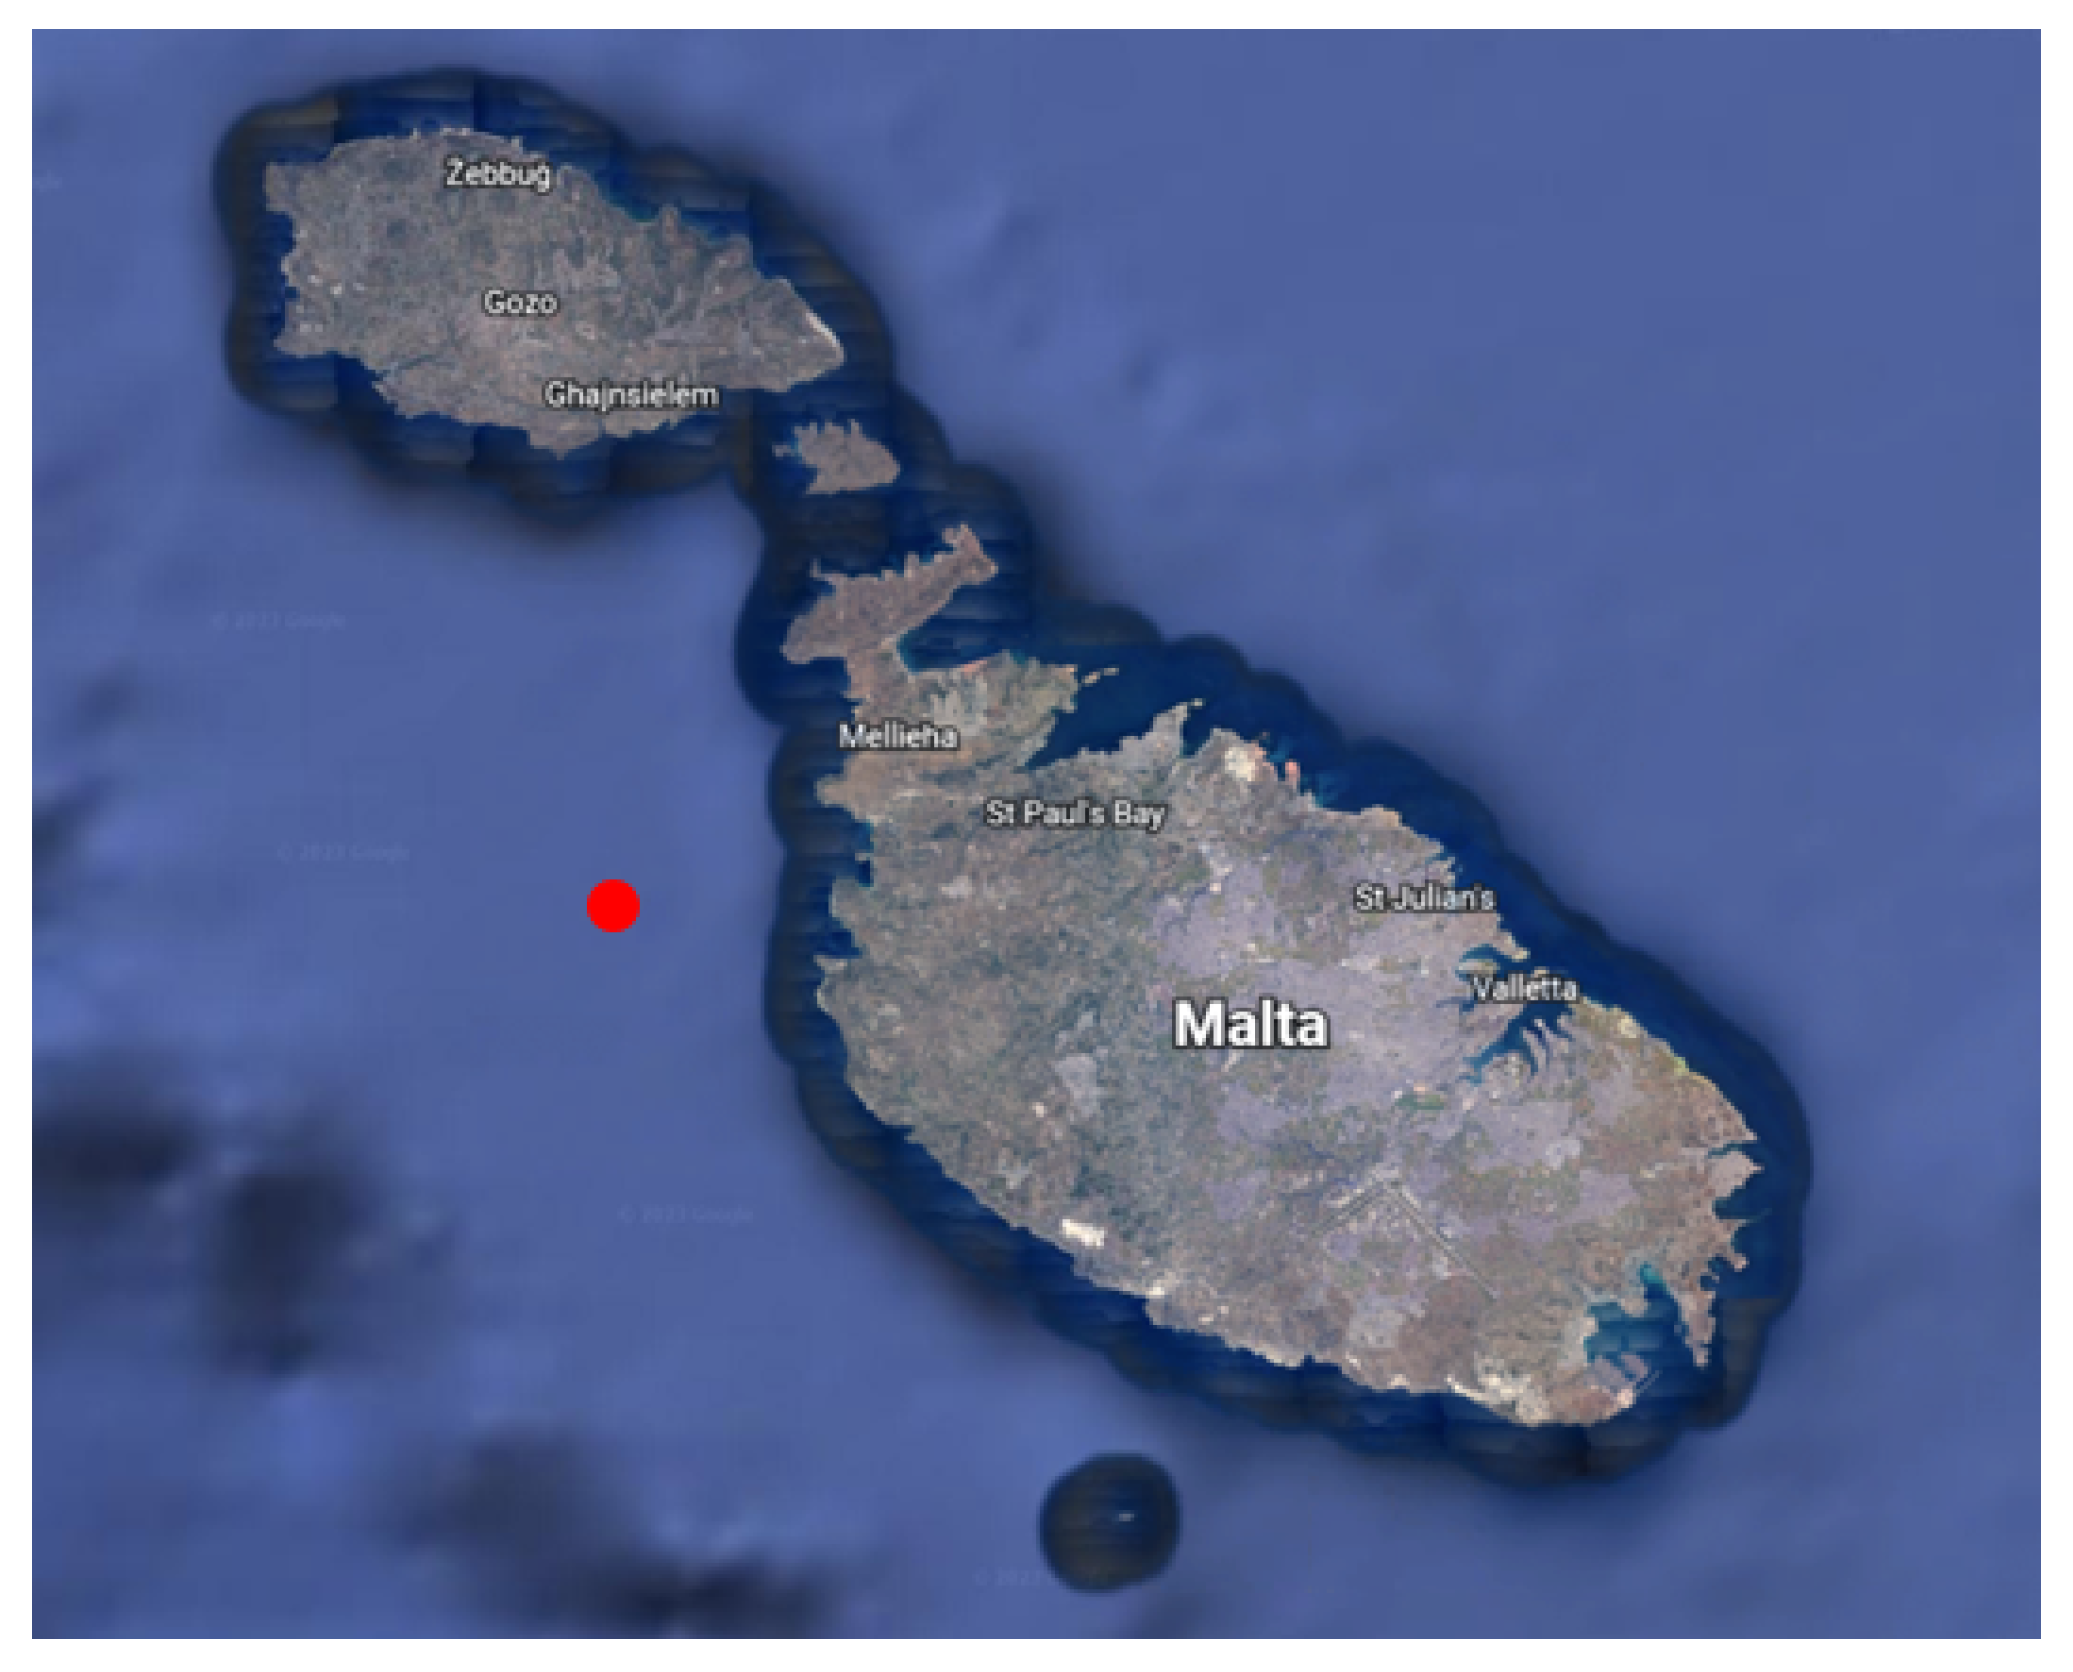
Section 2 presents the selected site within the Maltese territorial waters offering a potential for developing a multi-use offshore park integrating FBWs, offshore renewable energy and other activities. The design parameters for the technologies, which were maintained constant throughout the report, are also presented in this section.
-
Section 3 presents the case studies considered for cost modelling and economic analysis. Separate cost and revenue modelling for the Solar PVs, the Floating Offshore Wind Turbine (FOWT) Pilot Farm, FBWs as well as the Marine Park revenue streams are presented in this section. As shown in
Figure 1, the case studies are split into two main parts:
- -
Part A focuses on different Solar PV deployment technologies (land-based and rooftop PVs, floating PVs in calm waters, open seas and sheltered waters created by the FBWs) together with the Floating FOWT Pilot Farm. Part A also analyses the cost reductions in floating Solar PV infrastructure due to the introduction of the FBW structure without energy storage.
- -
Part B replicates the case study in Part A, however, it introduces hydro-pneumatic energy storage (HPES) within the FBWs. Part B also analyses the influence that sea depth and the number of FBWs have on the overall revenue generation of the multi-use marine park.
Section 4 summarises the conclusions derived from the techno-economic analyses.
Figure 1.
An overview of the work undertaken and presented in this paper.
Figure 1.
An overview of the work undertaken and presented in this paper.
Author Contributions
Conceptualization, A.B., C.C., T.S., R.N.F., and D.B.; methodology, A.B., C.C., T.S., R.N.F., and D.B.; software, A.B. and C.C.; validation, A.B. and C.C.; formal analysis, A.B. and C.C.; investigation, A.B. and C.C.; resources, A.B., C.C., T.S., R.N.F., and D.B.; data curation, A.B. and C.C.; writing—original draft preparation, A.B. and C.C.; writing—review and editing, A.B., C.C., T.S., R.N.F., and D.B.; visualization, A.B. and C.C; supervision, T.S. and D.B.; project administration, T.S. and R.N.F.; funding acquisition, T.S. All authors have read and agreed to the published version of the manuscript.
Figure 2.
The selected site for Project FORTRESS, on the west side of the main island of Malta [
25].
Figure 2.
The selected site for Project FORTRESS, on the west side of the main island of Malta [
25].
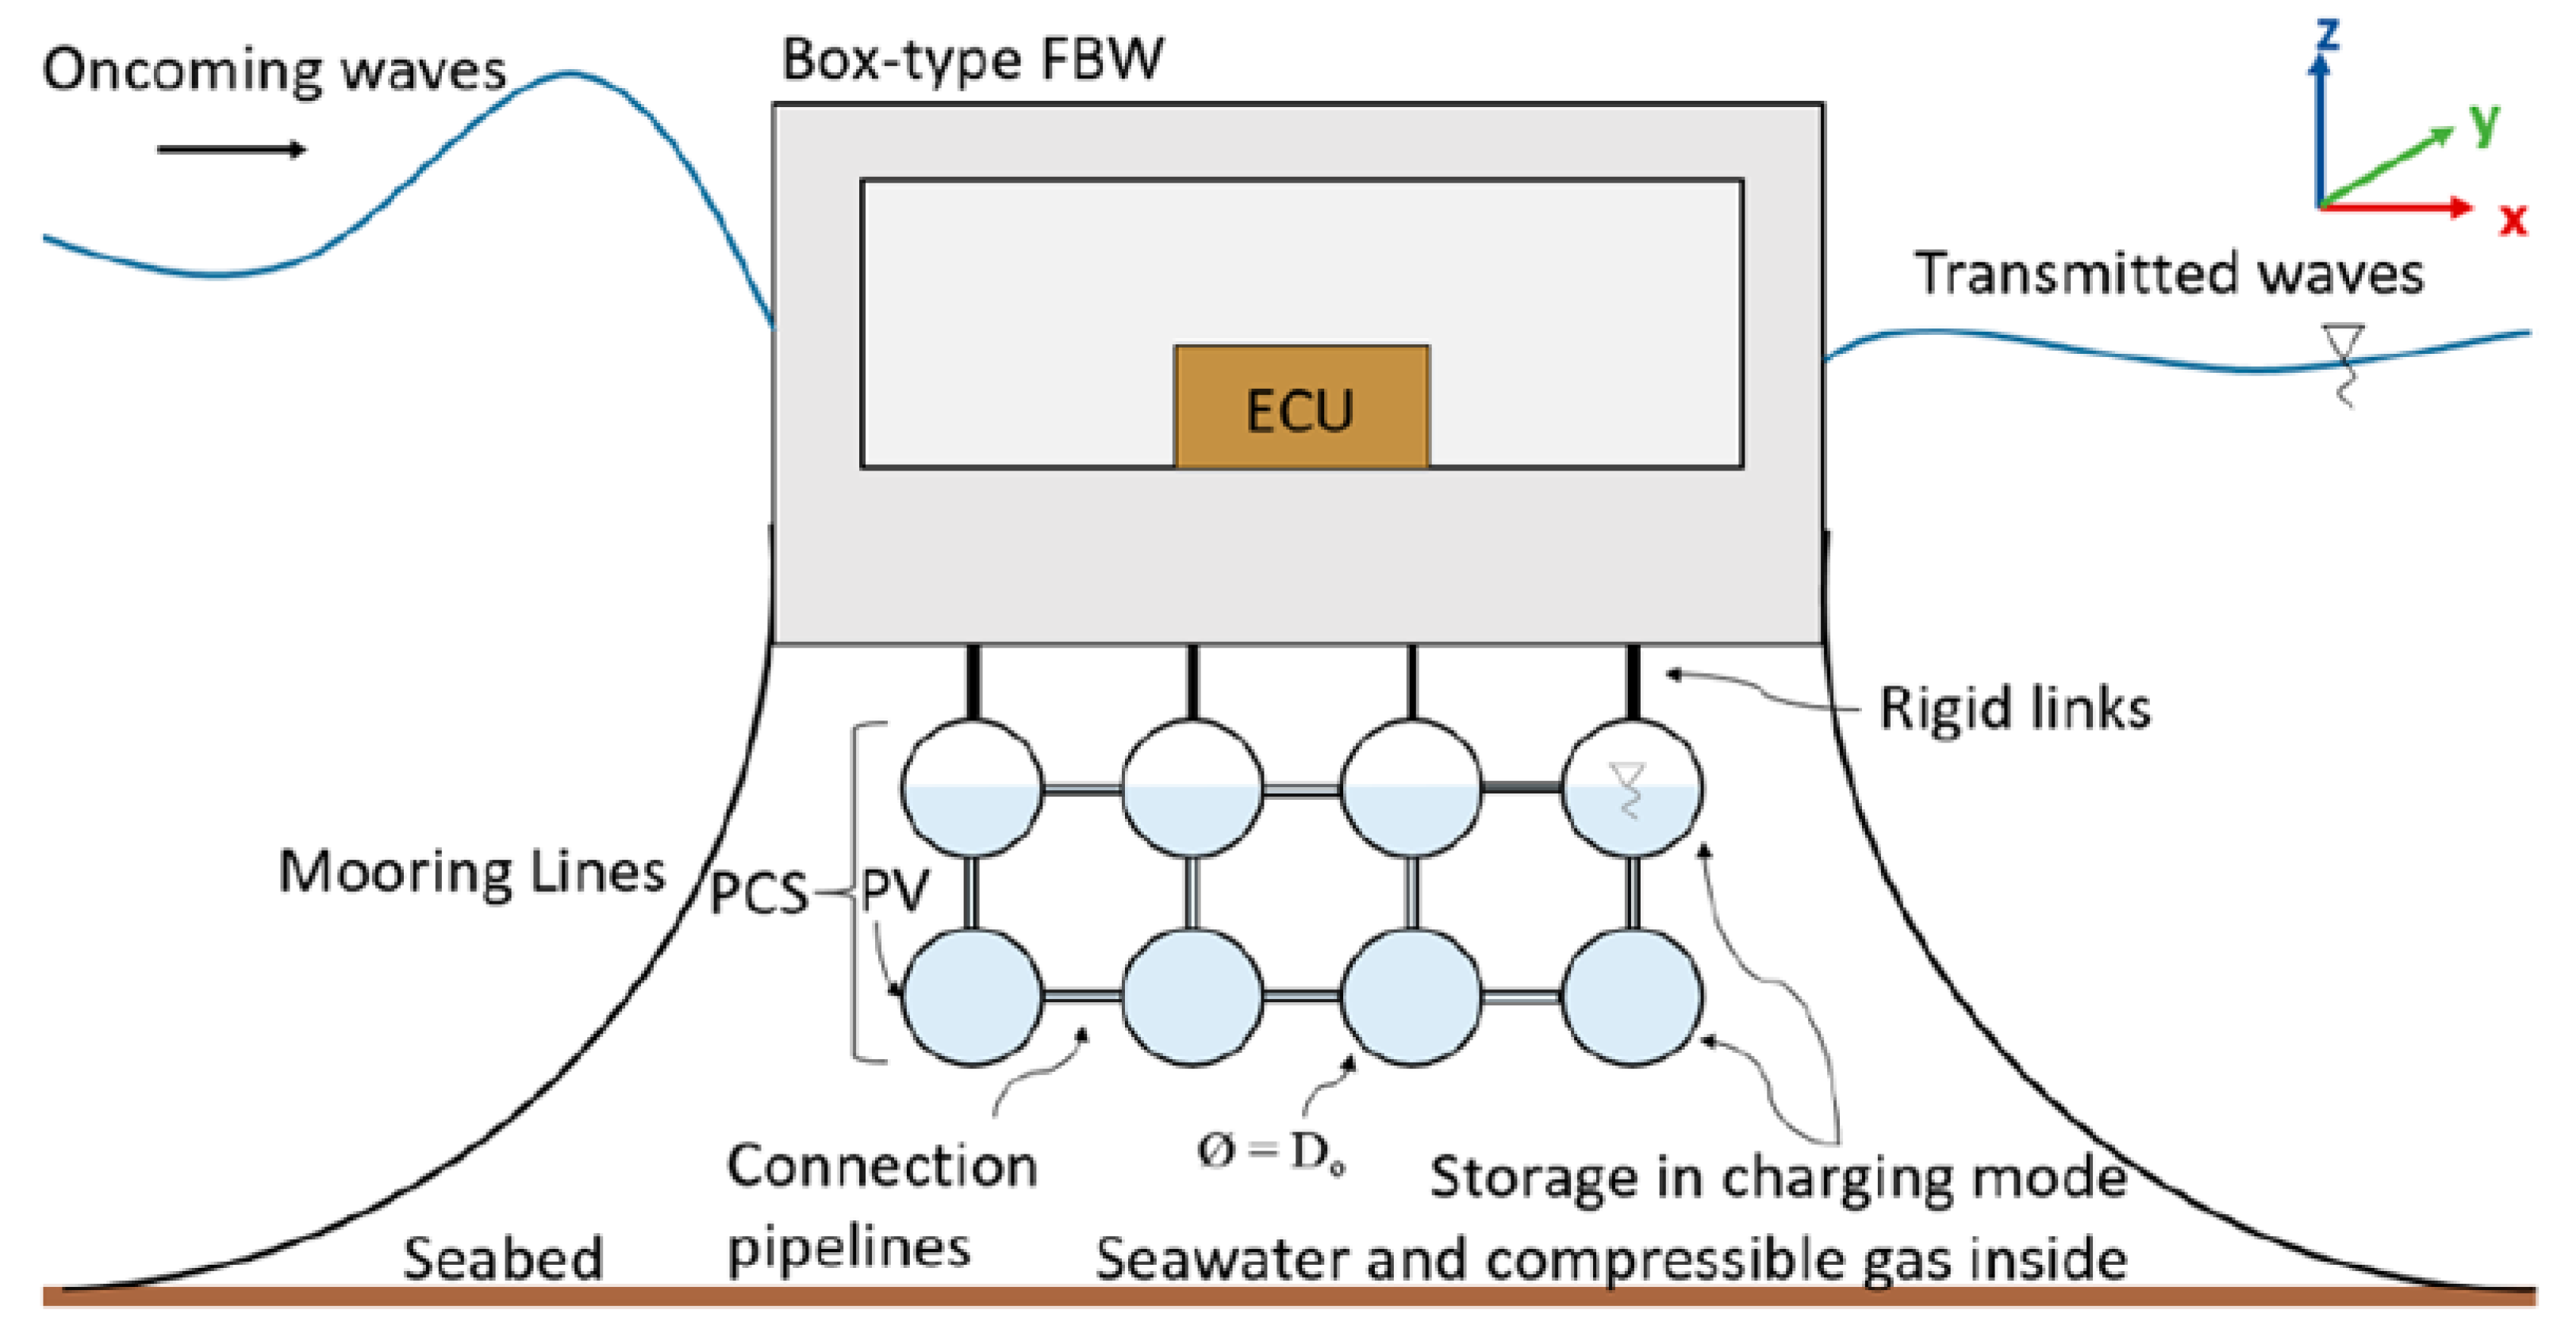
Figure 3.
Image reproduced from [
27]. A front view of the FBW with the integrated HPES system.
Figure 3.
Image reproduced from [
27]. A front view of the FBW with the integrated HPES system.
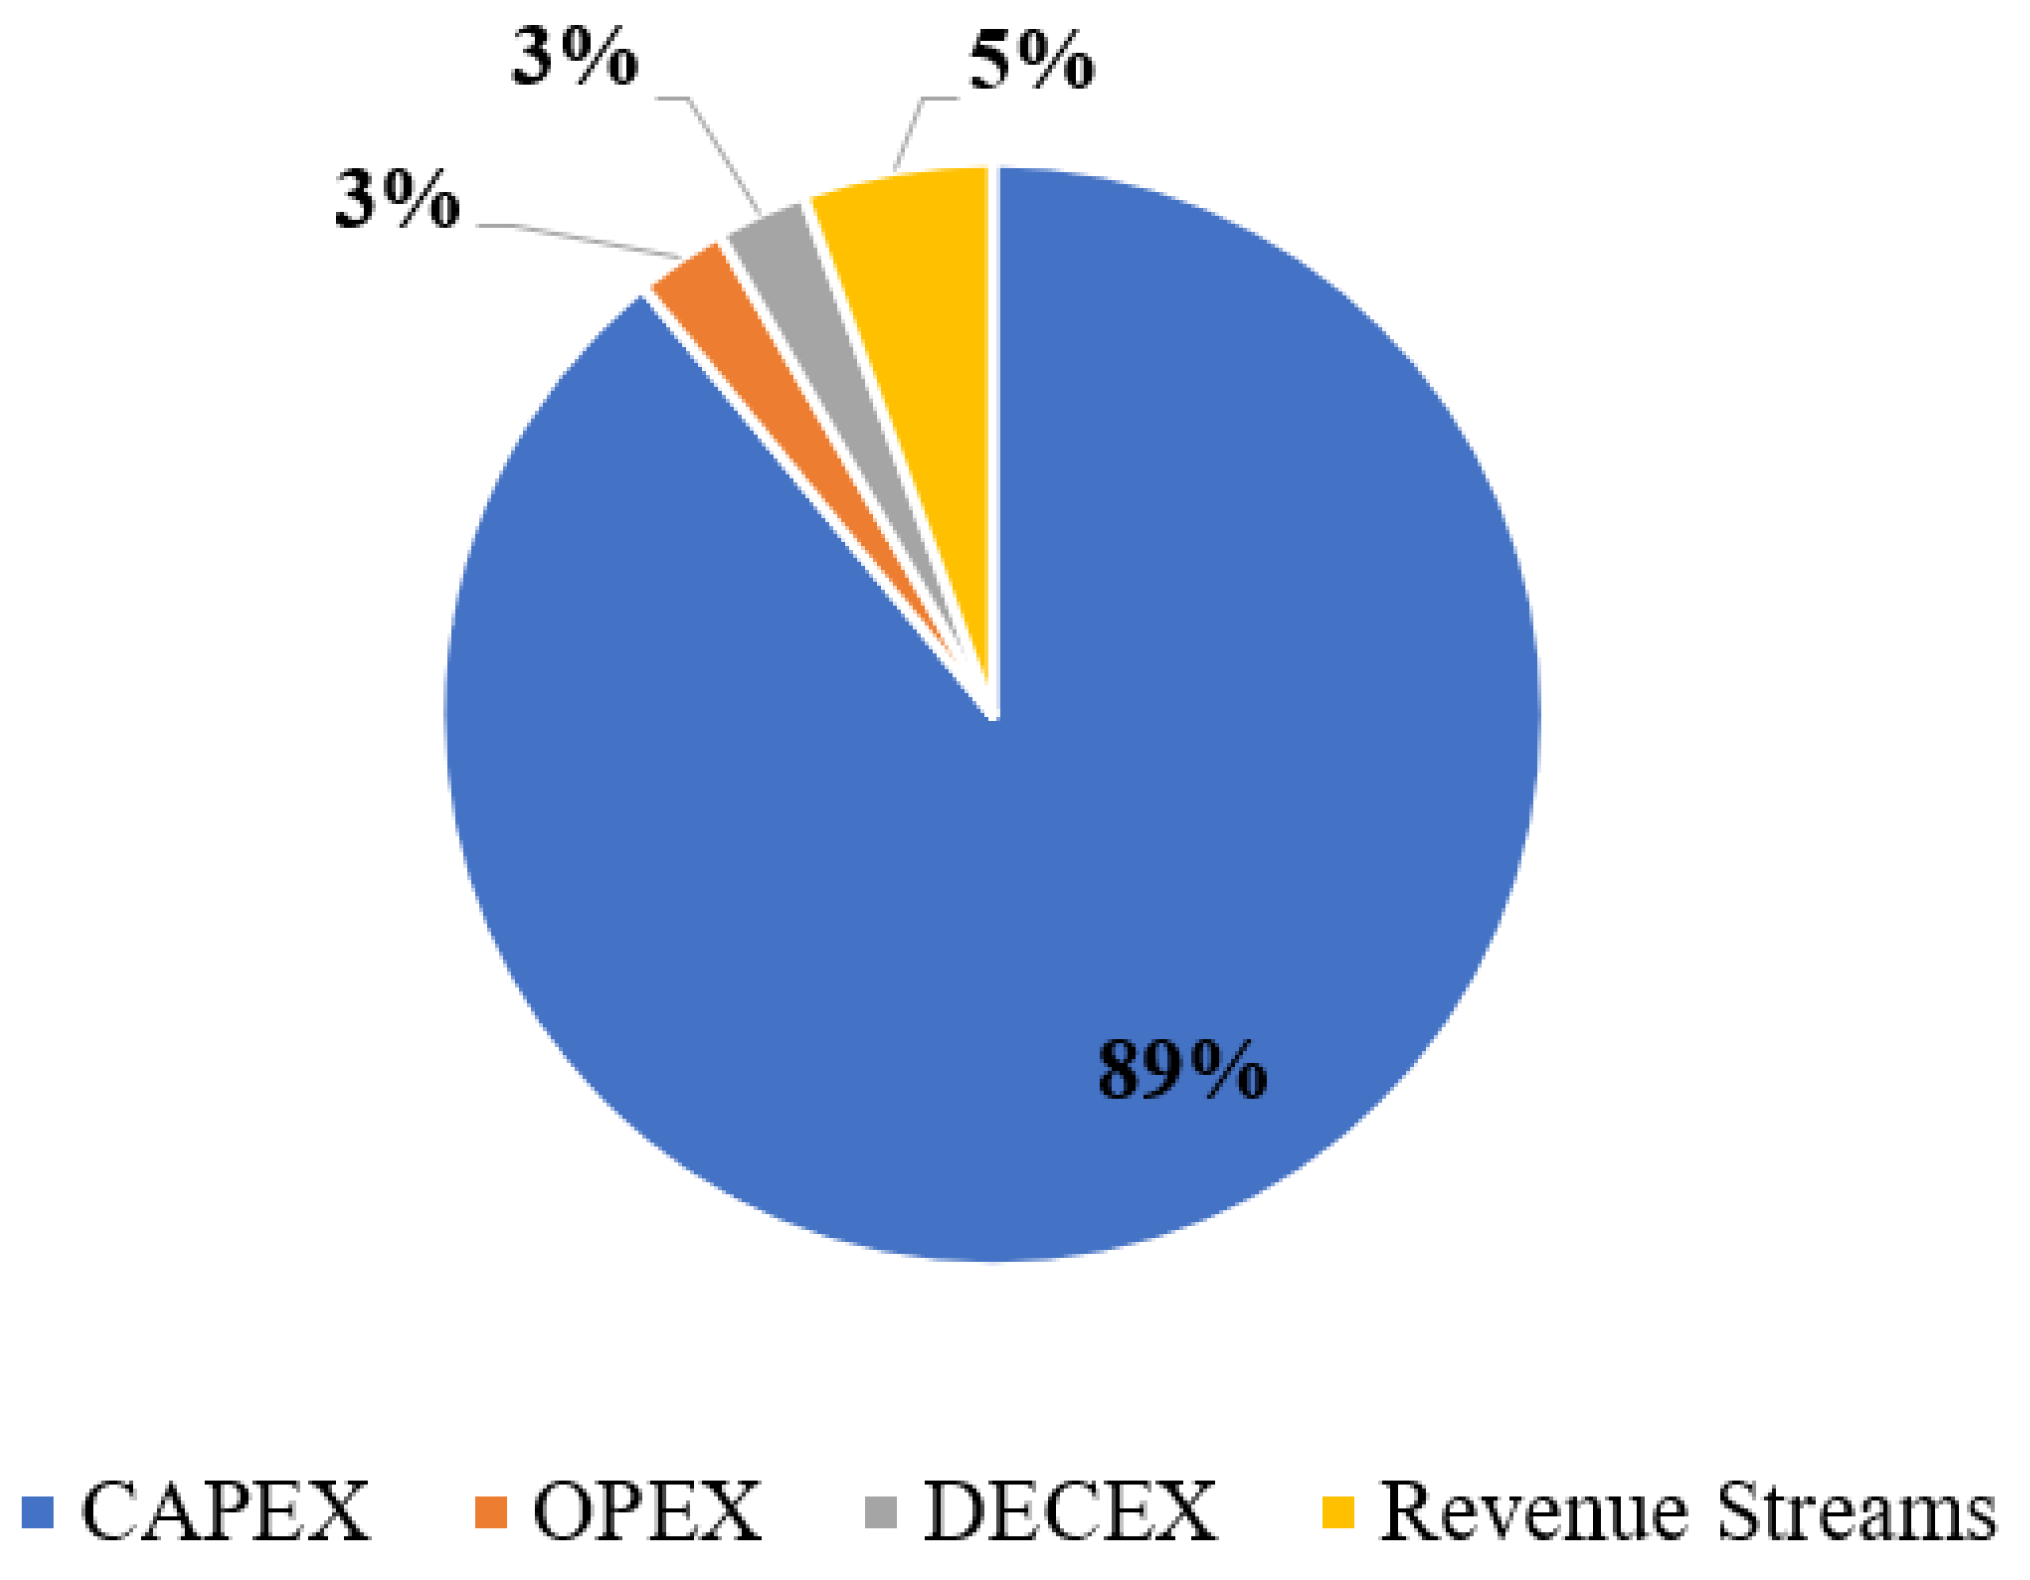
Figure 4.
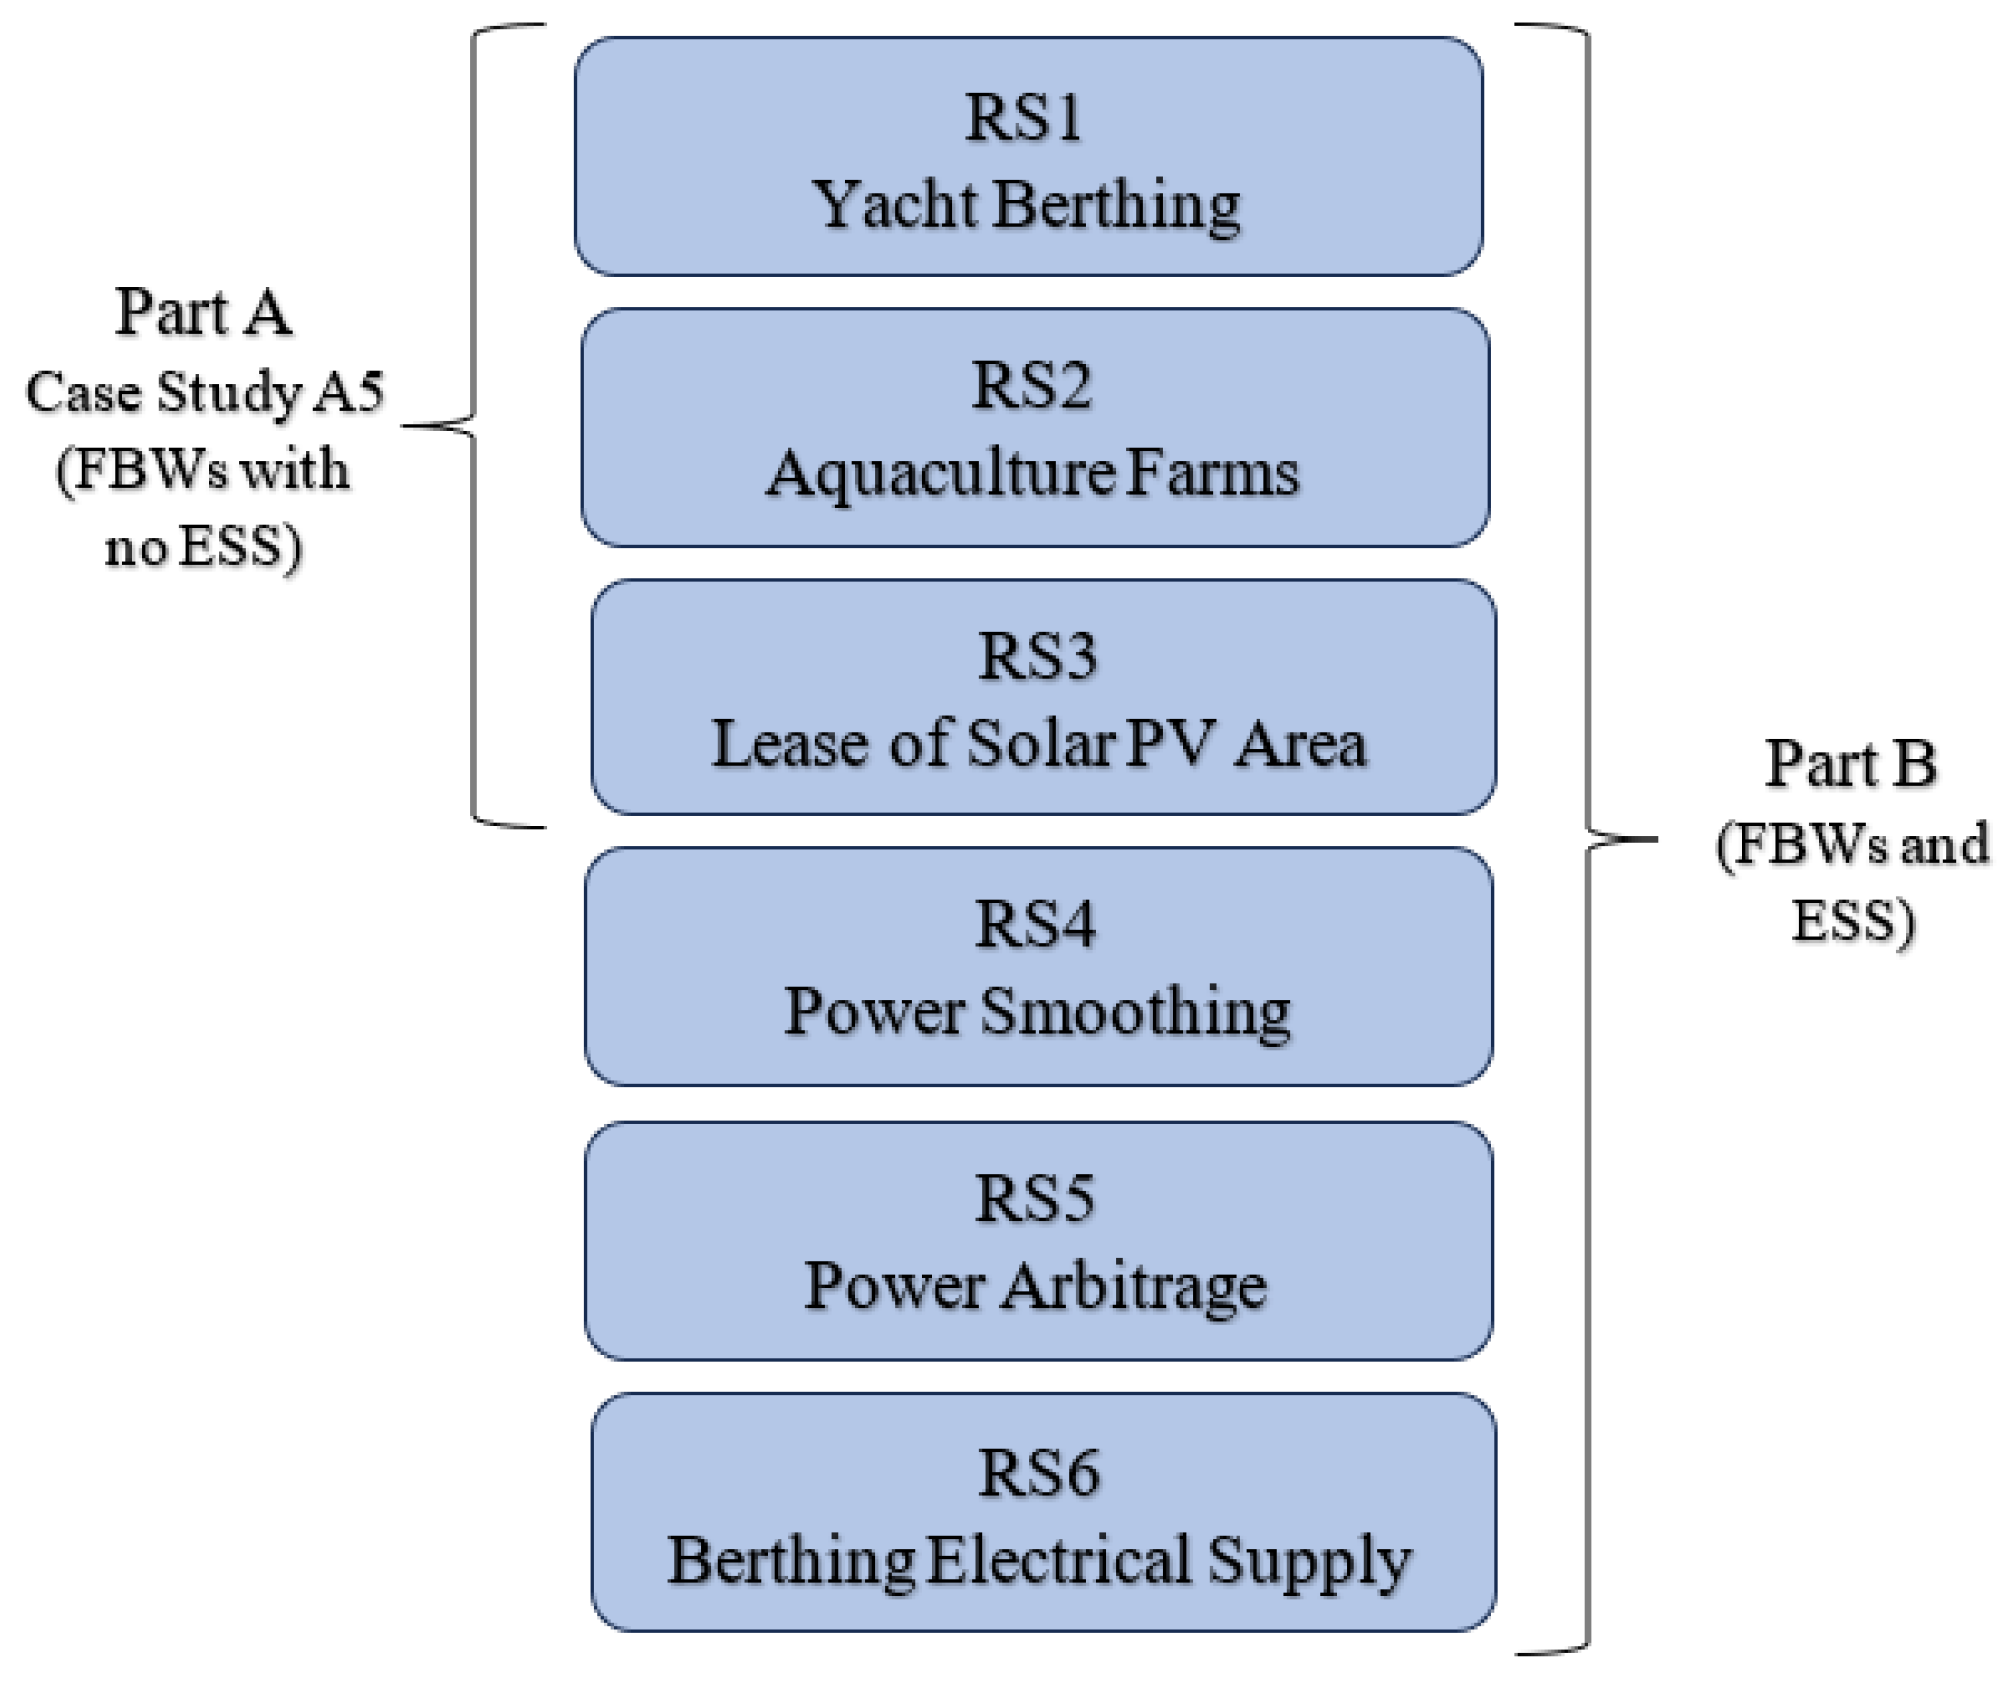
Revenue streams (RSs) considered for Parts A and B of the techno-economic assessment.
Figure 4.
Revenue streams (RSs) considered for Parts A and B of the techno-economic assessment.
Figure 5.
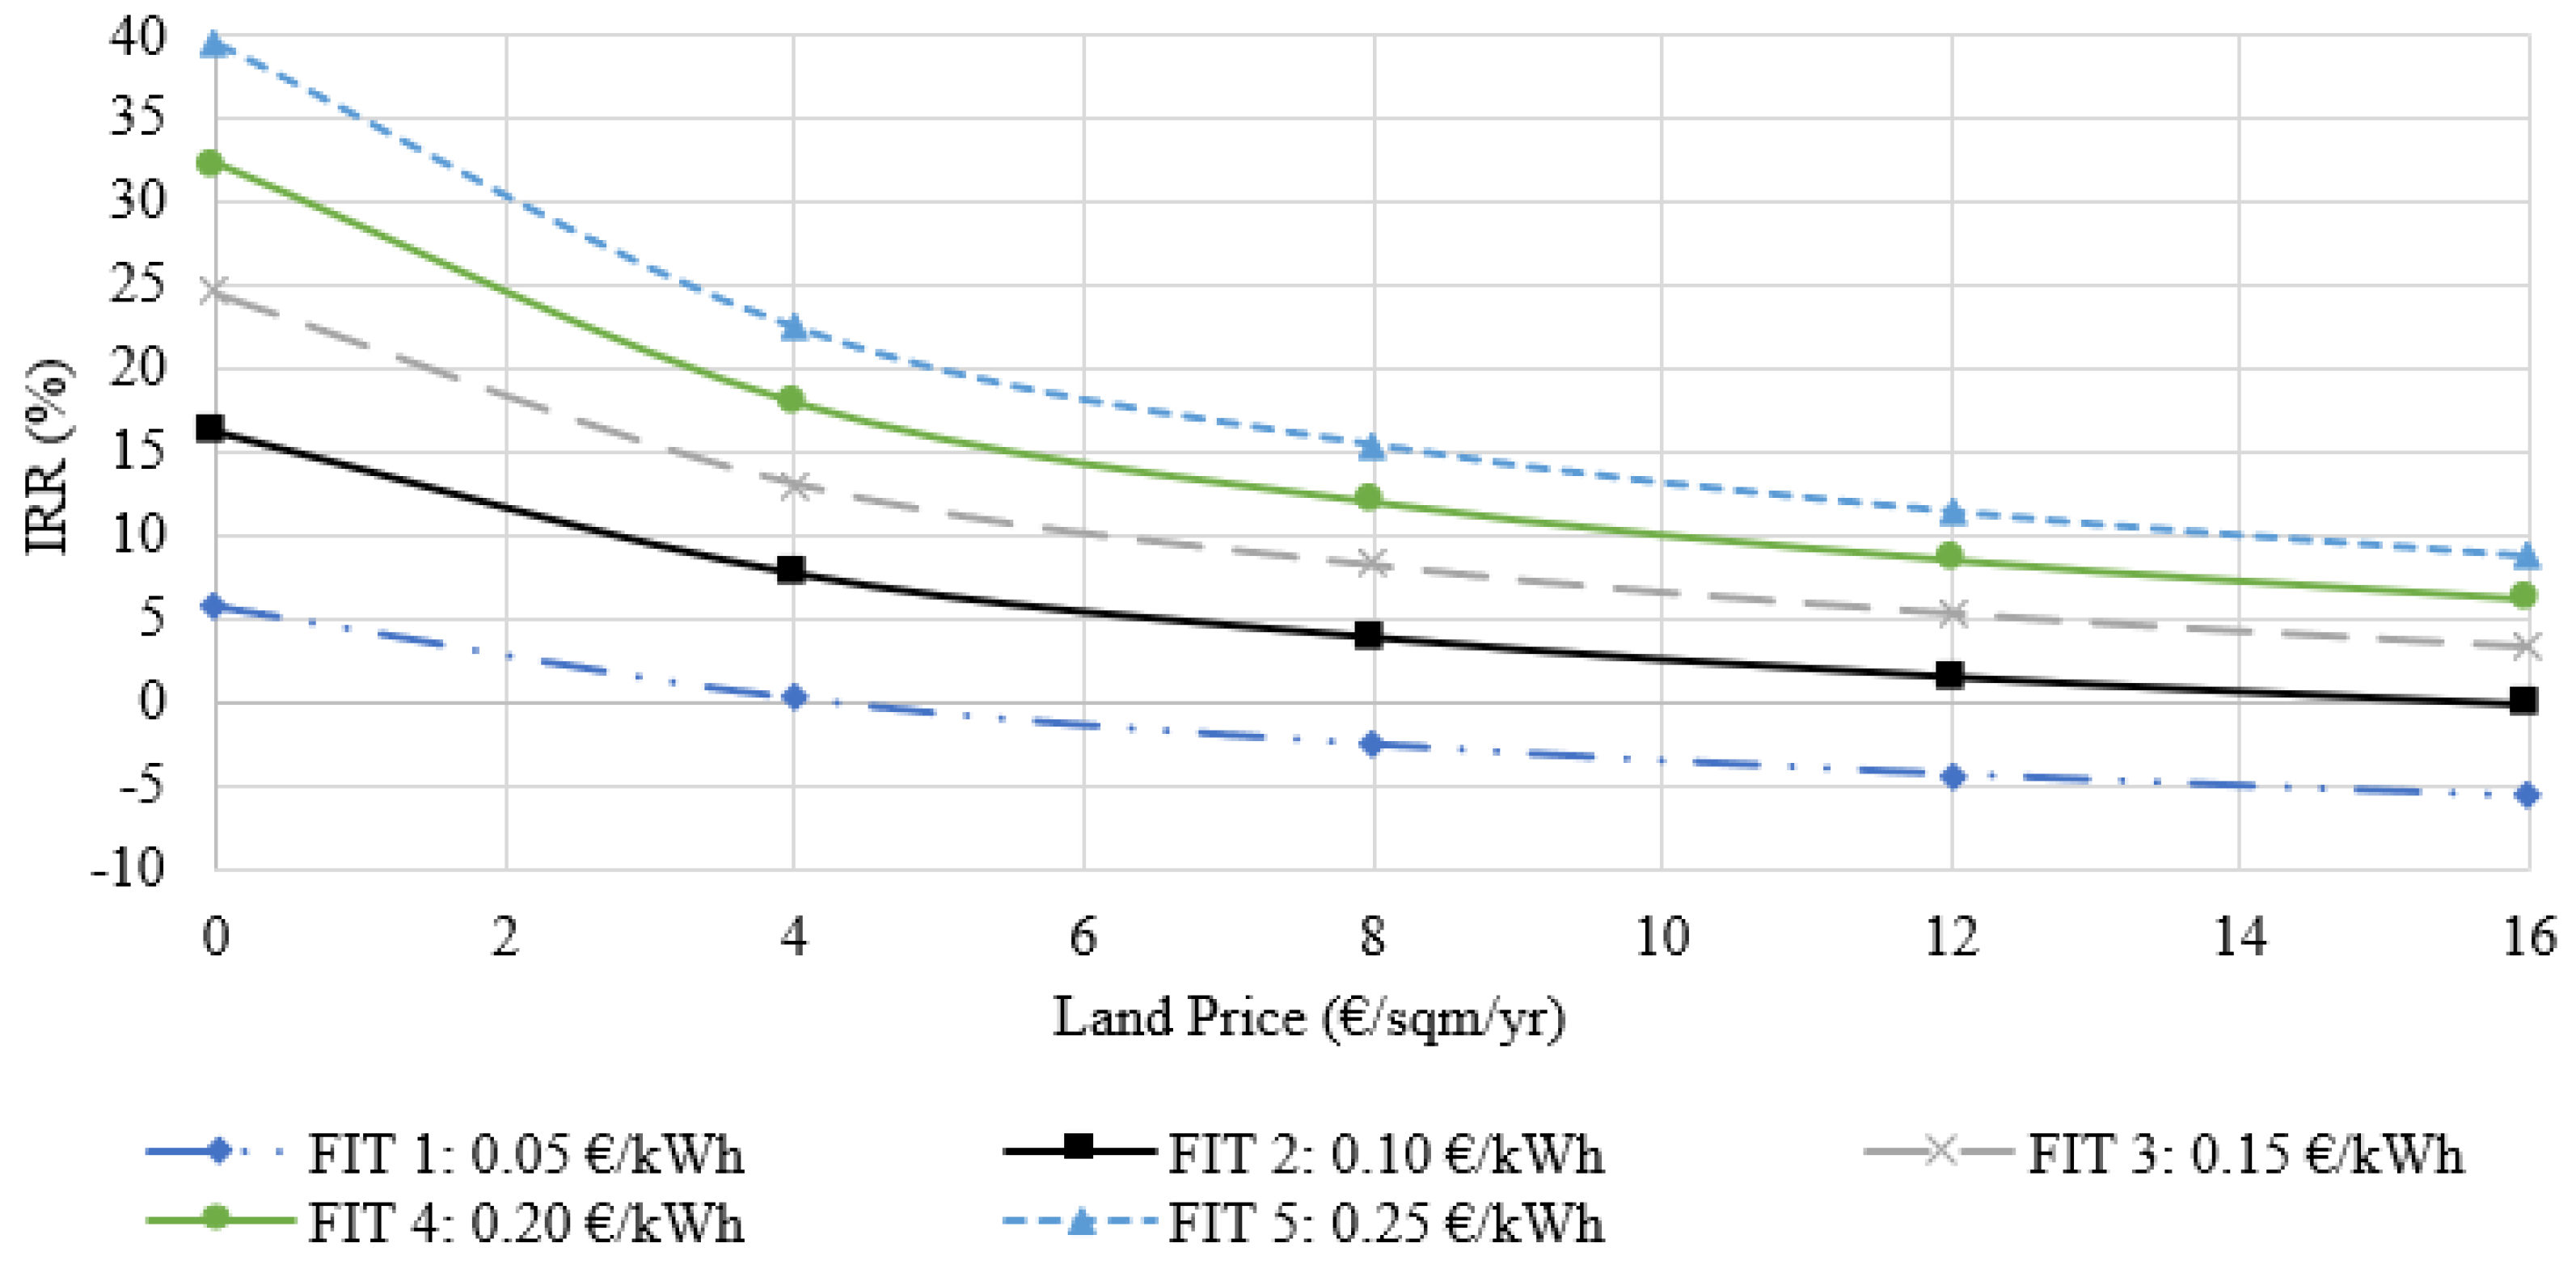
The relationship between IRR and Land Rental Price for different FITs.
Figure 5.
The relationship between IRR and Land Rental Price for different FITs.
Figure 6.
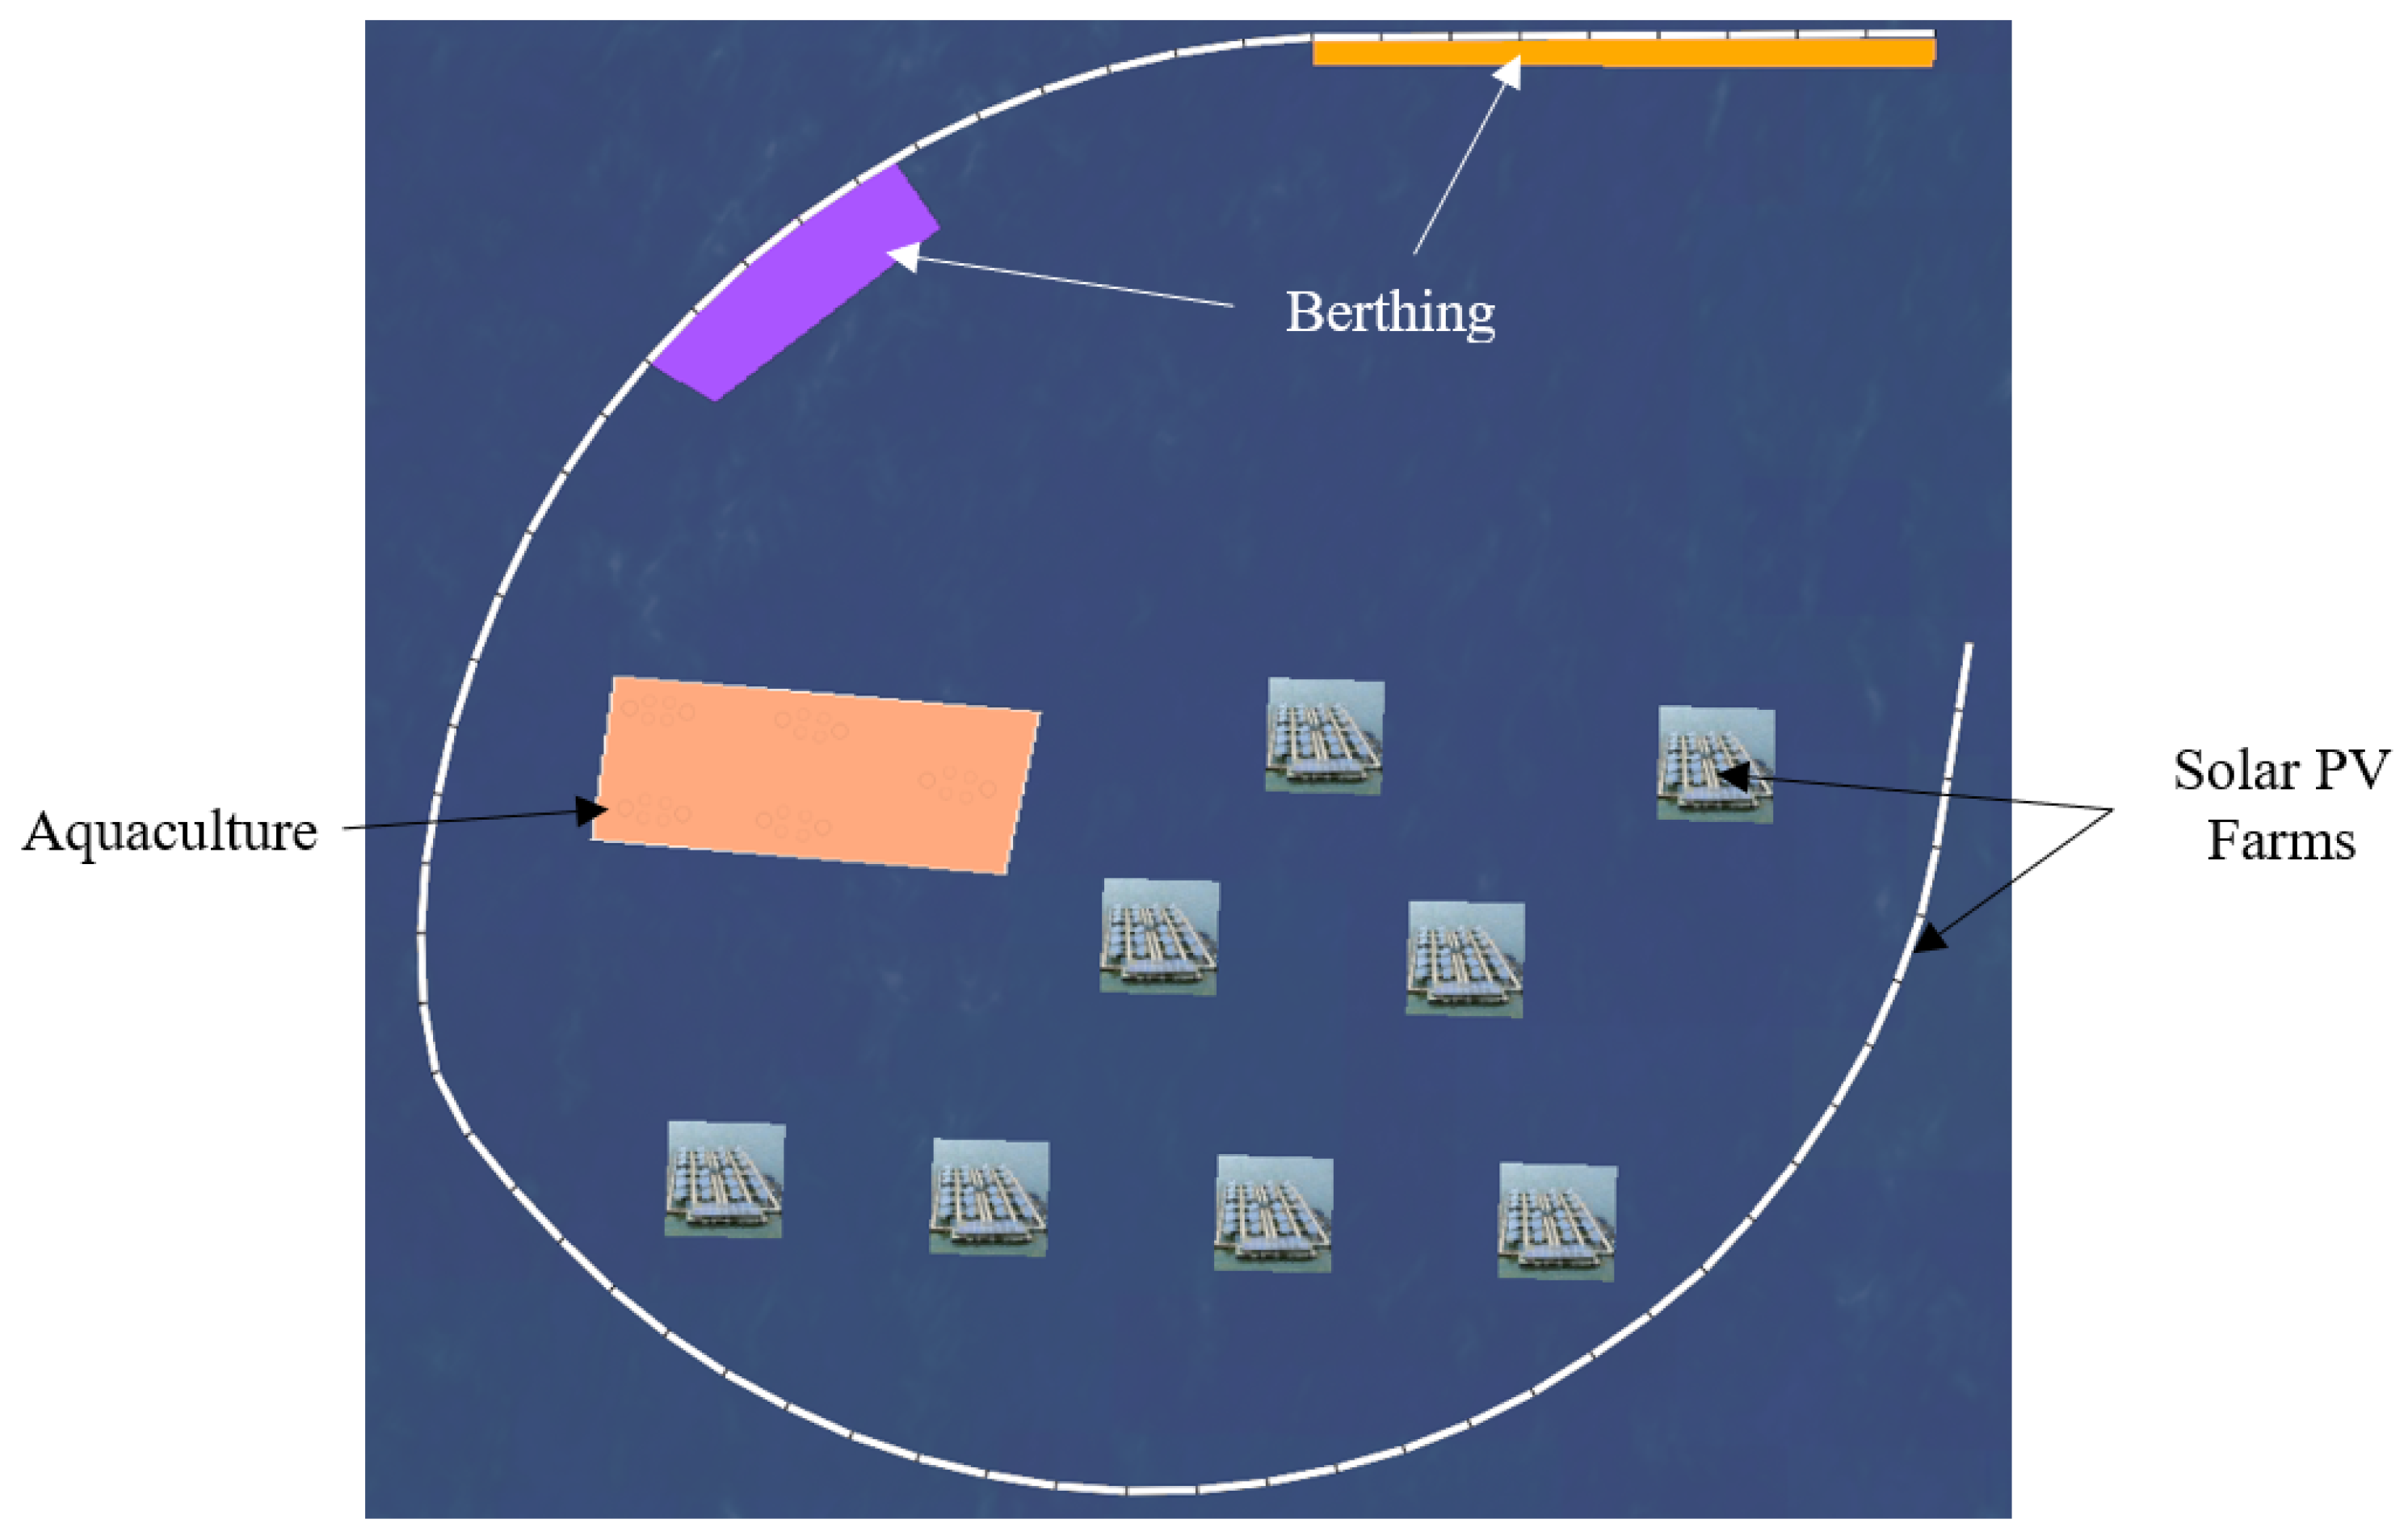
A schematic of the Project FORTRESS setup, highlighting two berthing sections (purple and orange), an aquaculture area (peach) and the 80 MWp solar PV farm all being sheltered by the FBW array.
Figure 6.
A schematic of the Project FORTRESS setup, highlighting two berthing sections (purple and orange), an aquaculture area (peach) and the 80 MWp solar PV farm all being sheltered by the FBW array.
Figure 7.
A zoomed in image of the FOWT pilot farm (3 × 10 MW WTs).
Figure 7.
A zoomed in image of the FOWT pilot farm (3 × 10 MW WTs).
Figure 8.
A zoomed in, plan view of the FBW array.
Figure 8.
A zoomed in, plan view of the FBW array.
Figure 10.
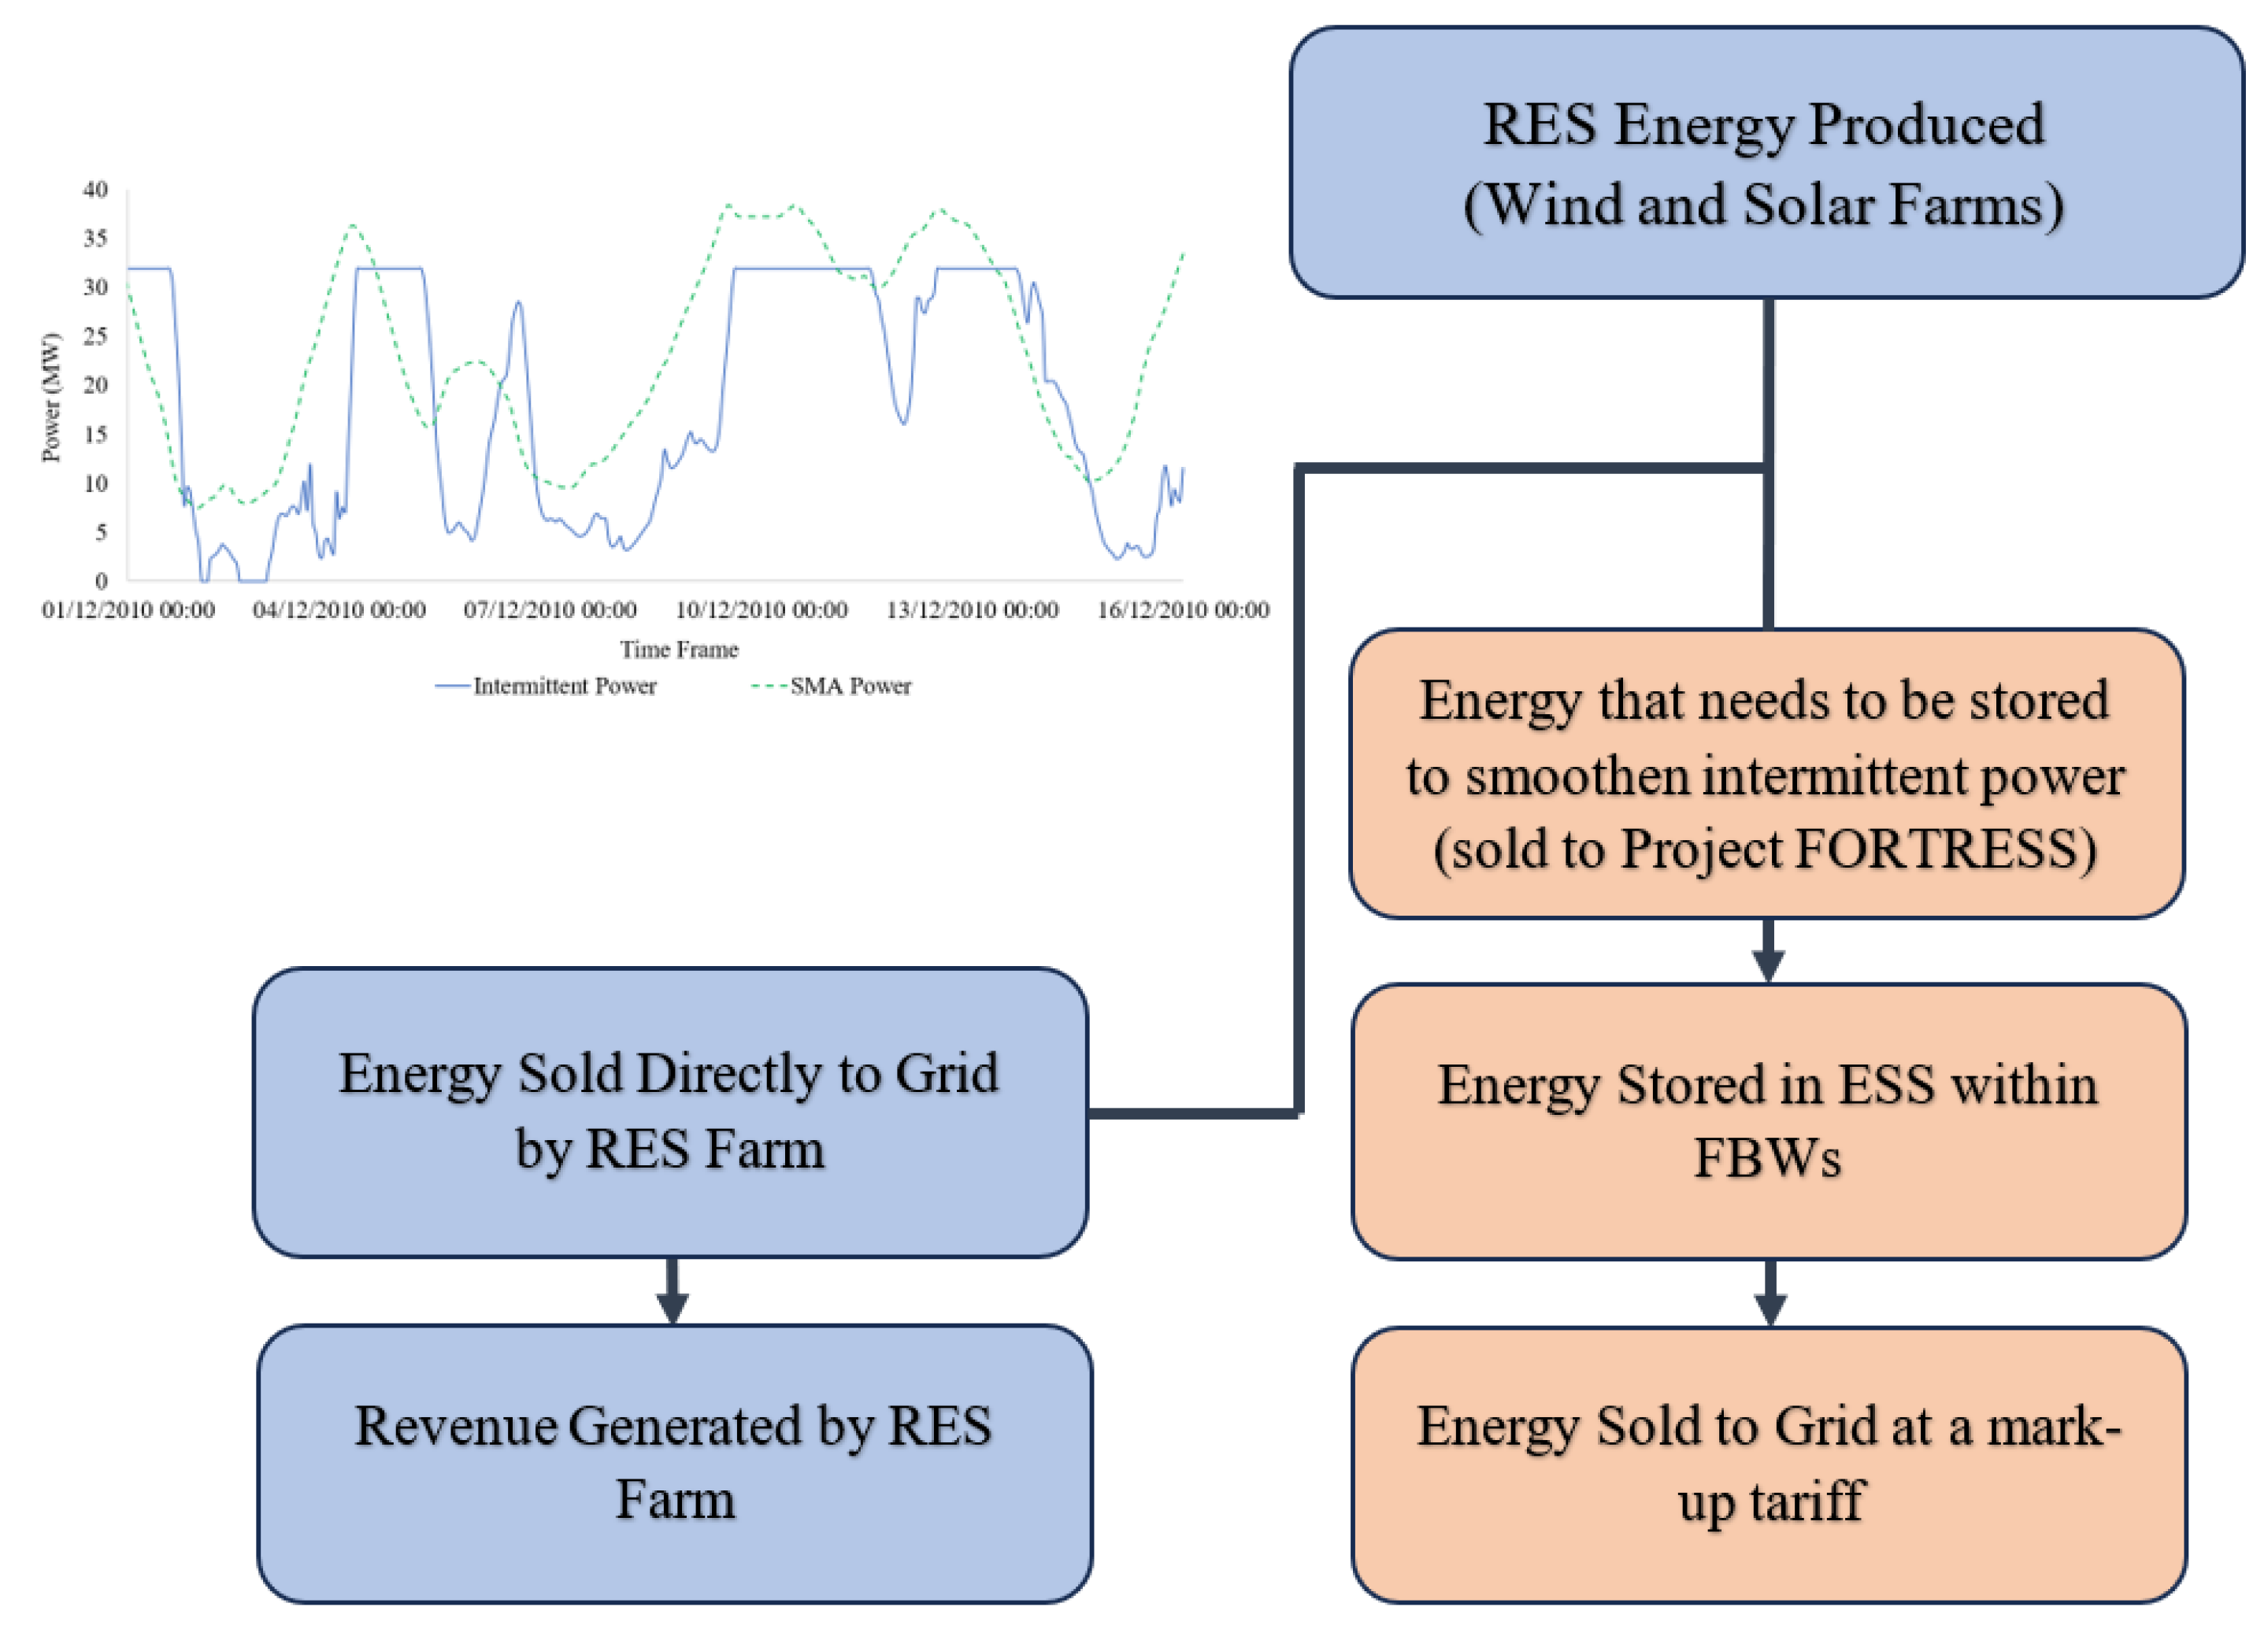
A flowchart of the revenue generation process for the Power Smoothing revenue stream.
Figure 10.
A flowchart of the revenue generation process for the Power Smoothing revenue stream.
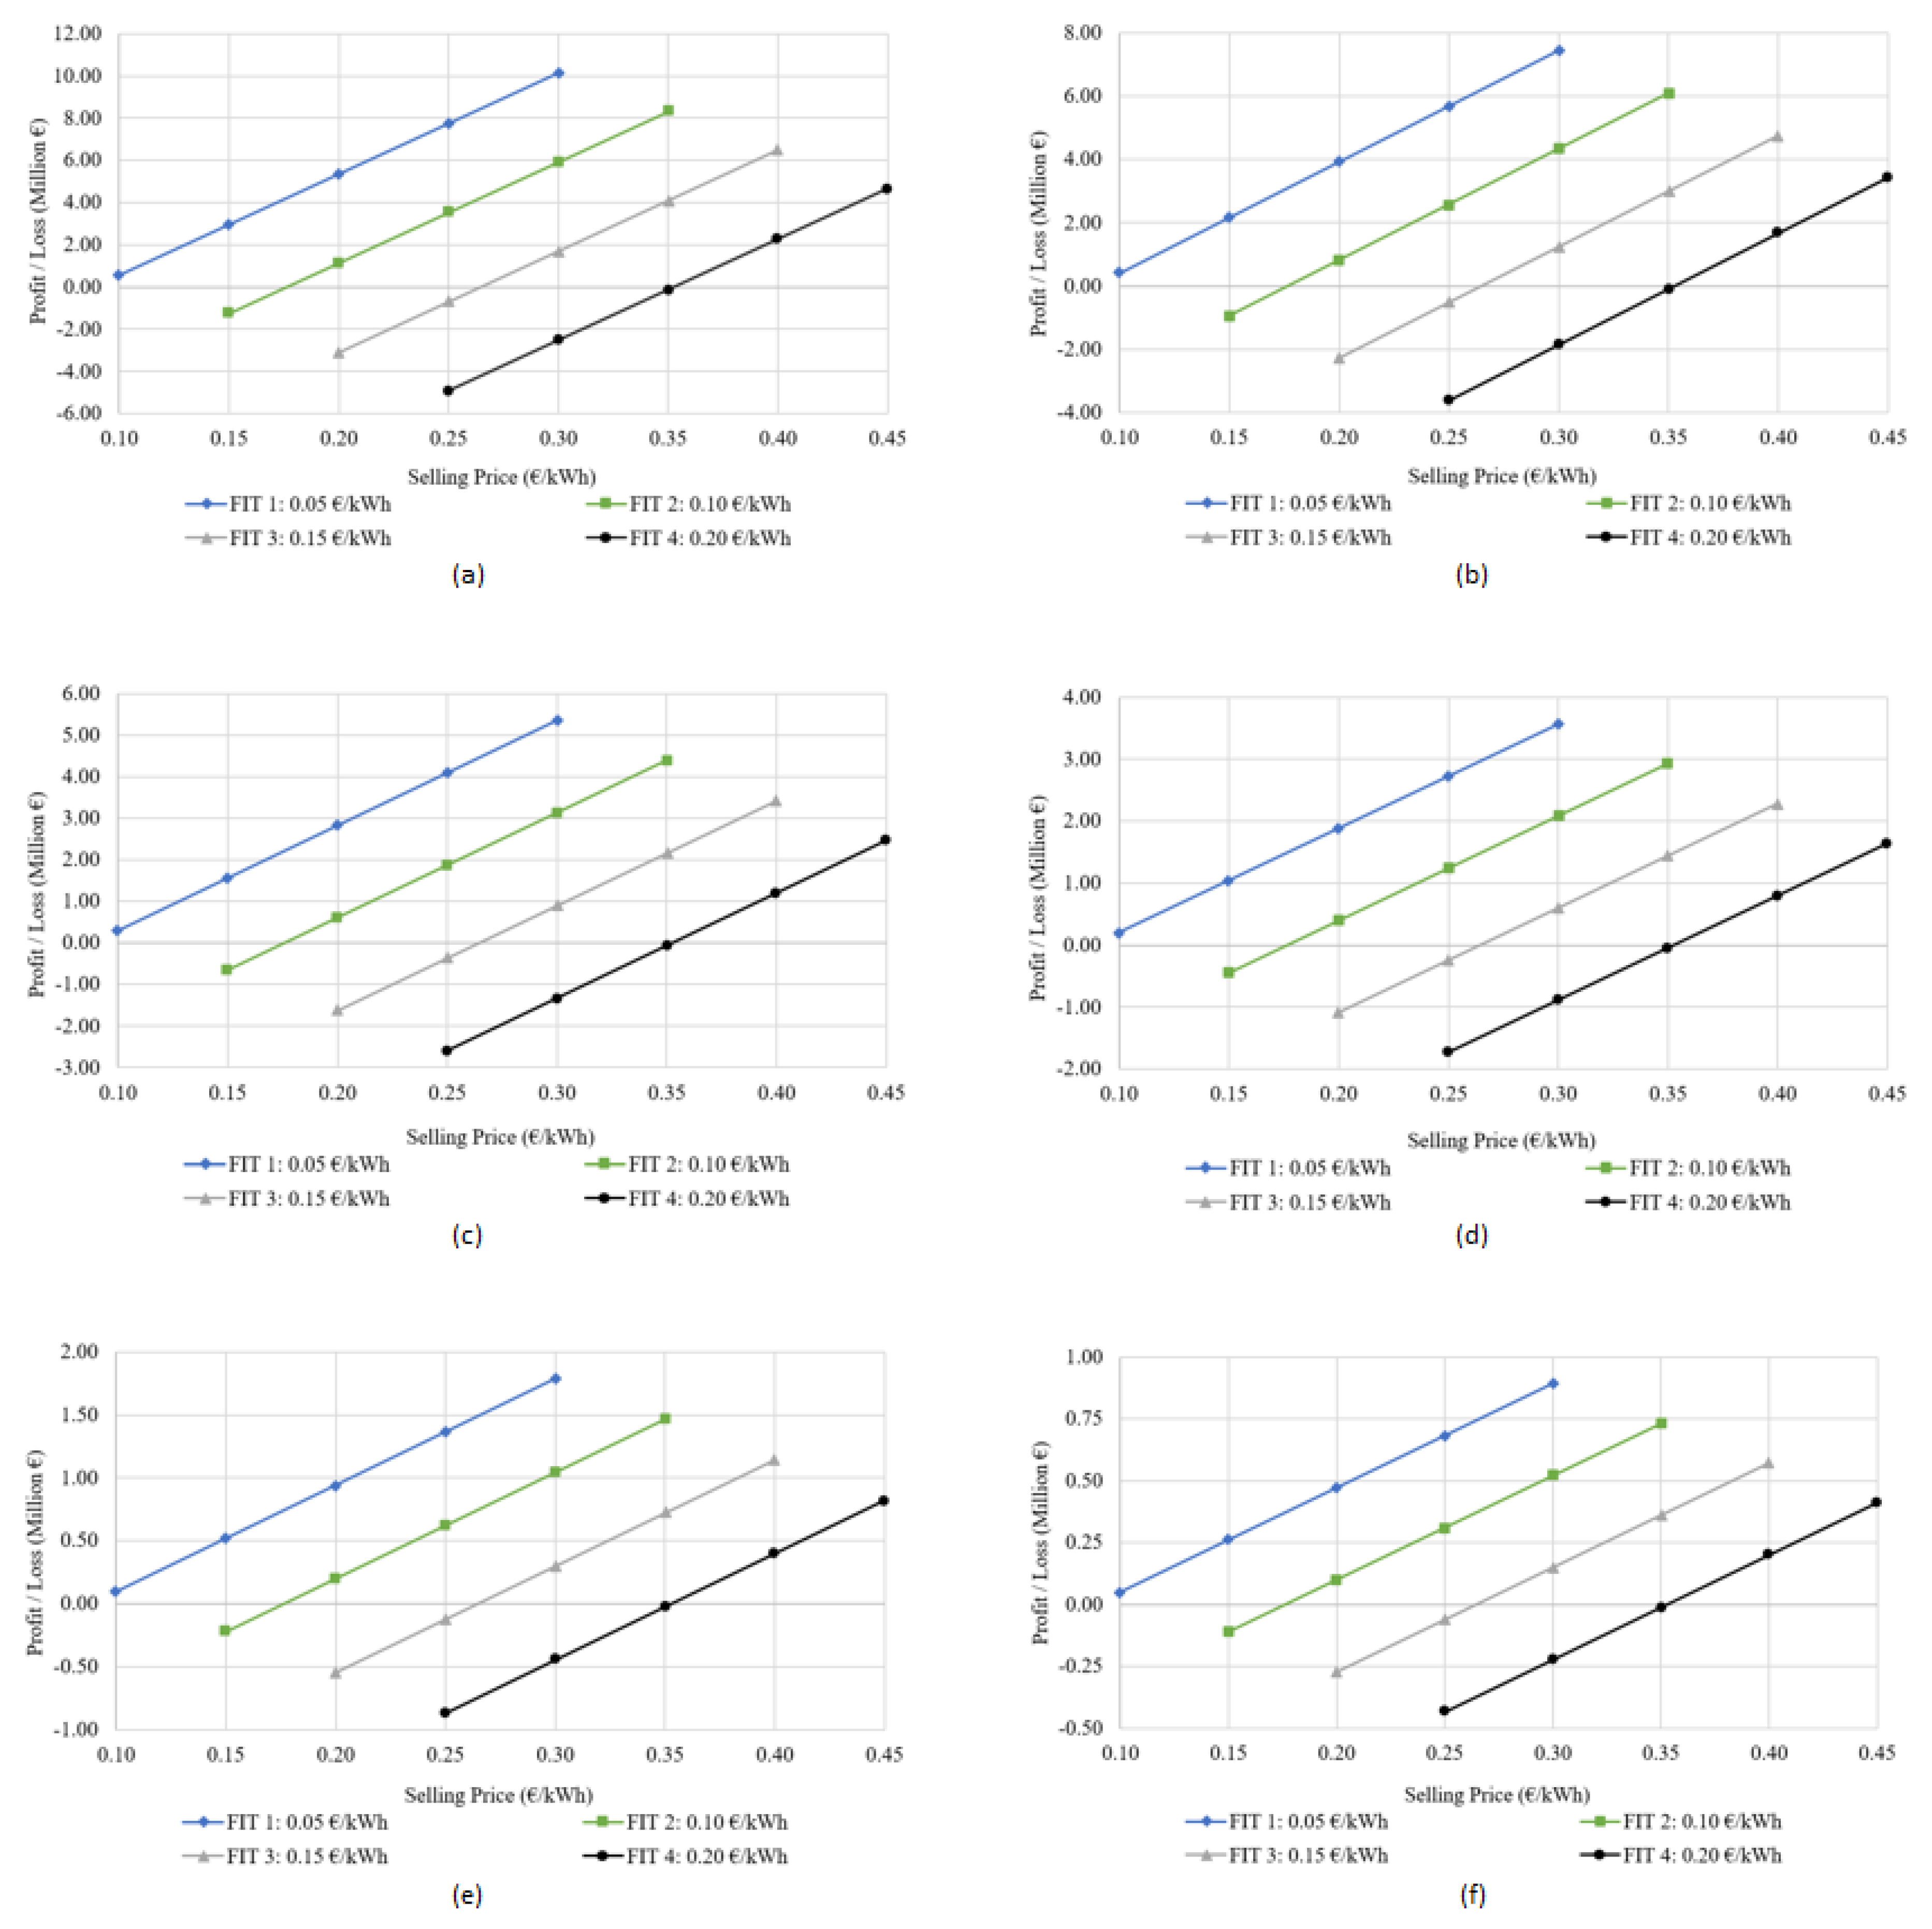
Figure 11.
The profit and loss parametric analysis based on using (a) 34 FBWs, (b) 25 FBWs, (c) 18 FBWs, (d) 12 FBWs, (e) 6 FBWs, (f) 3 FBWs, for Power Arbitrage.
Figure 11.
The profit and loss parametric analysis based on using (a) 34 FBWs, (b) 25 FBWs, (c) 18 FBWs, (d) 12 FBWs, (e) 6 FBWs, (f) 3 FBWs, for Power Arbitrage.
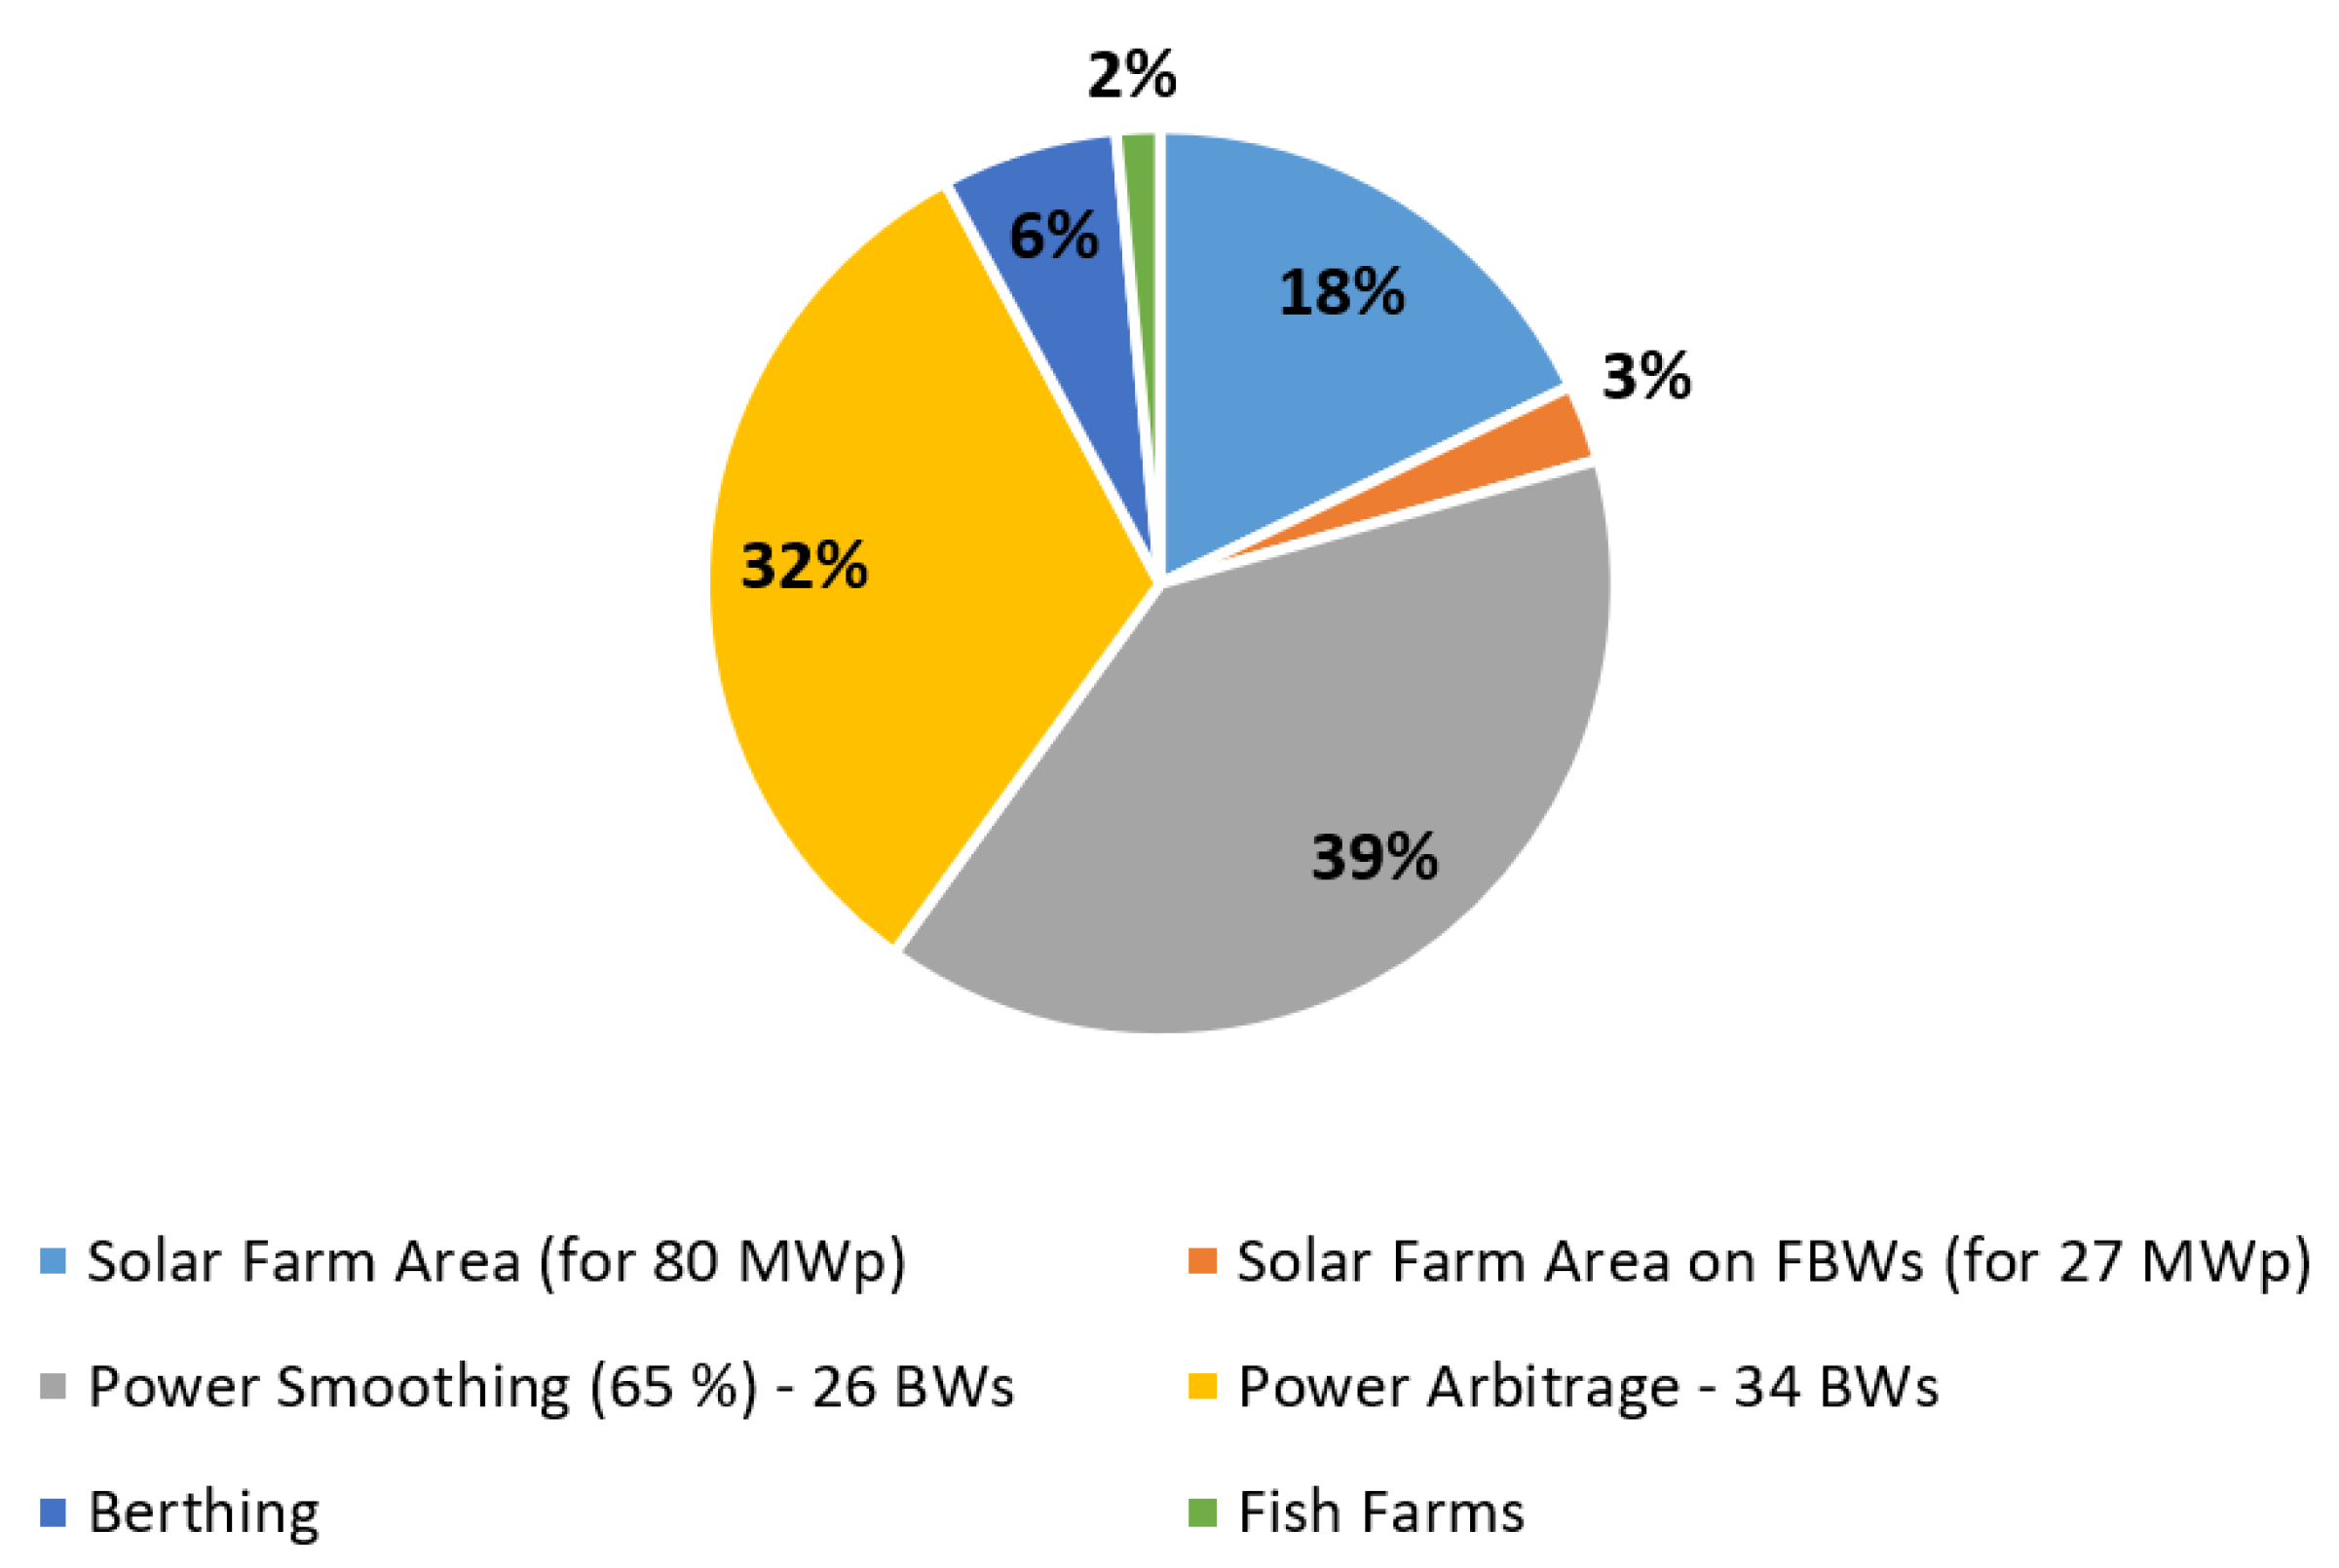
Figure 12.
The percentage contribution of each revenue stream for Case Study B1.
Figure 12.
The percentage contribution of each revenue stream for Case Study B1.
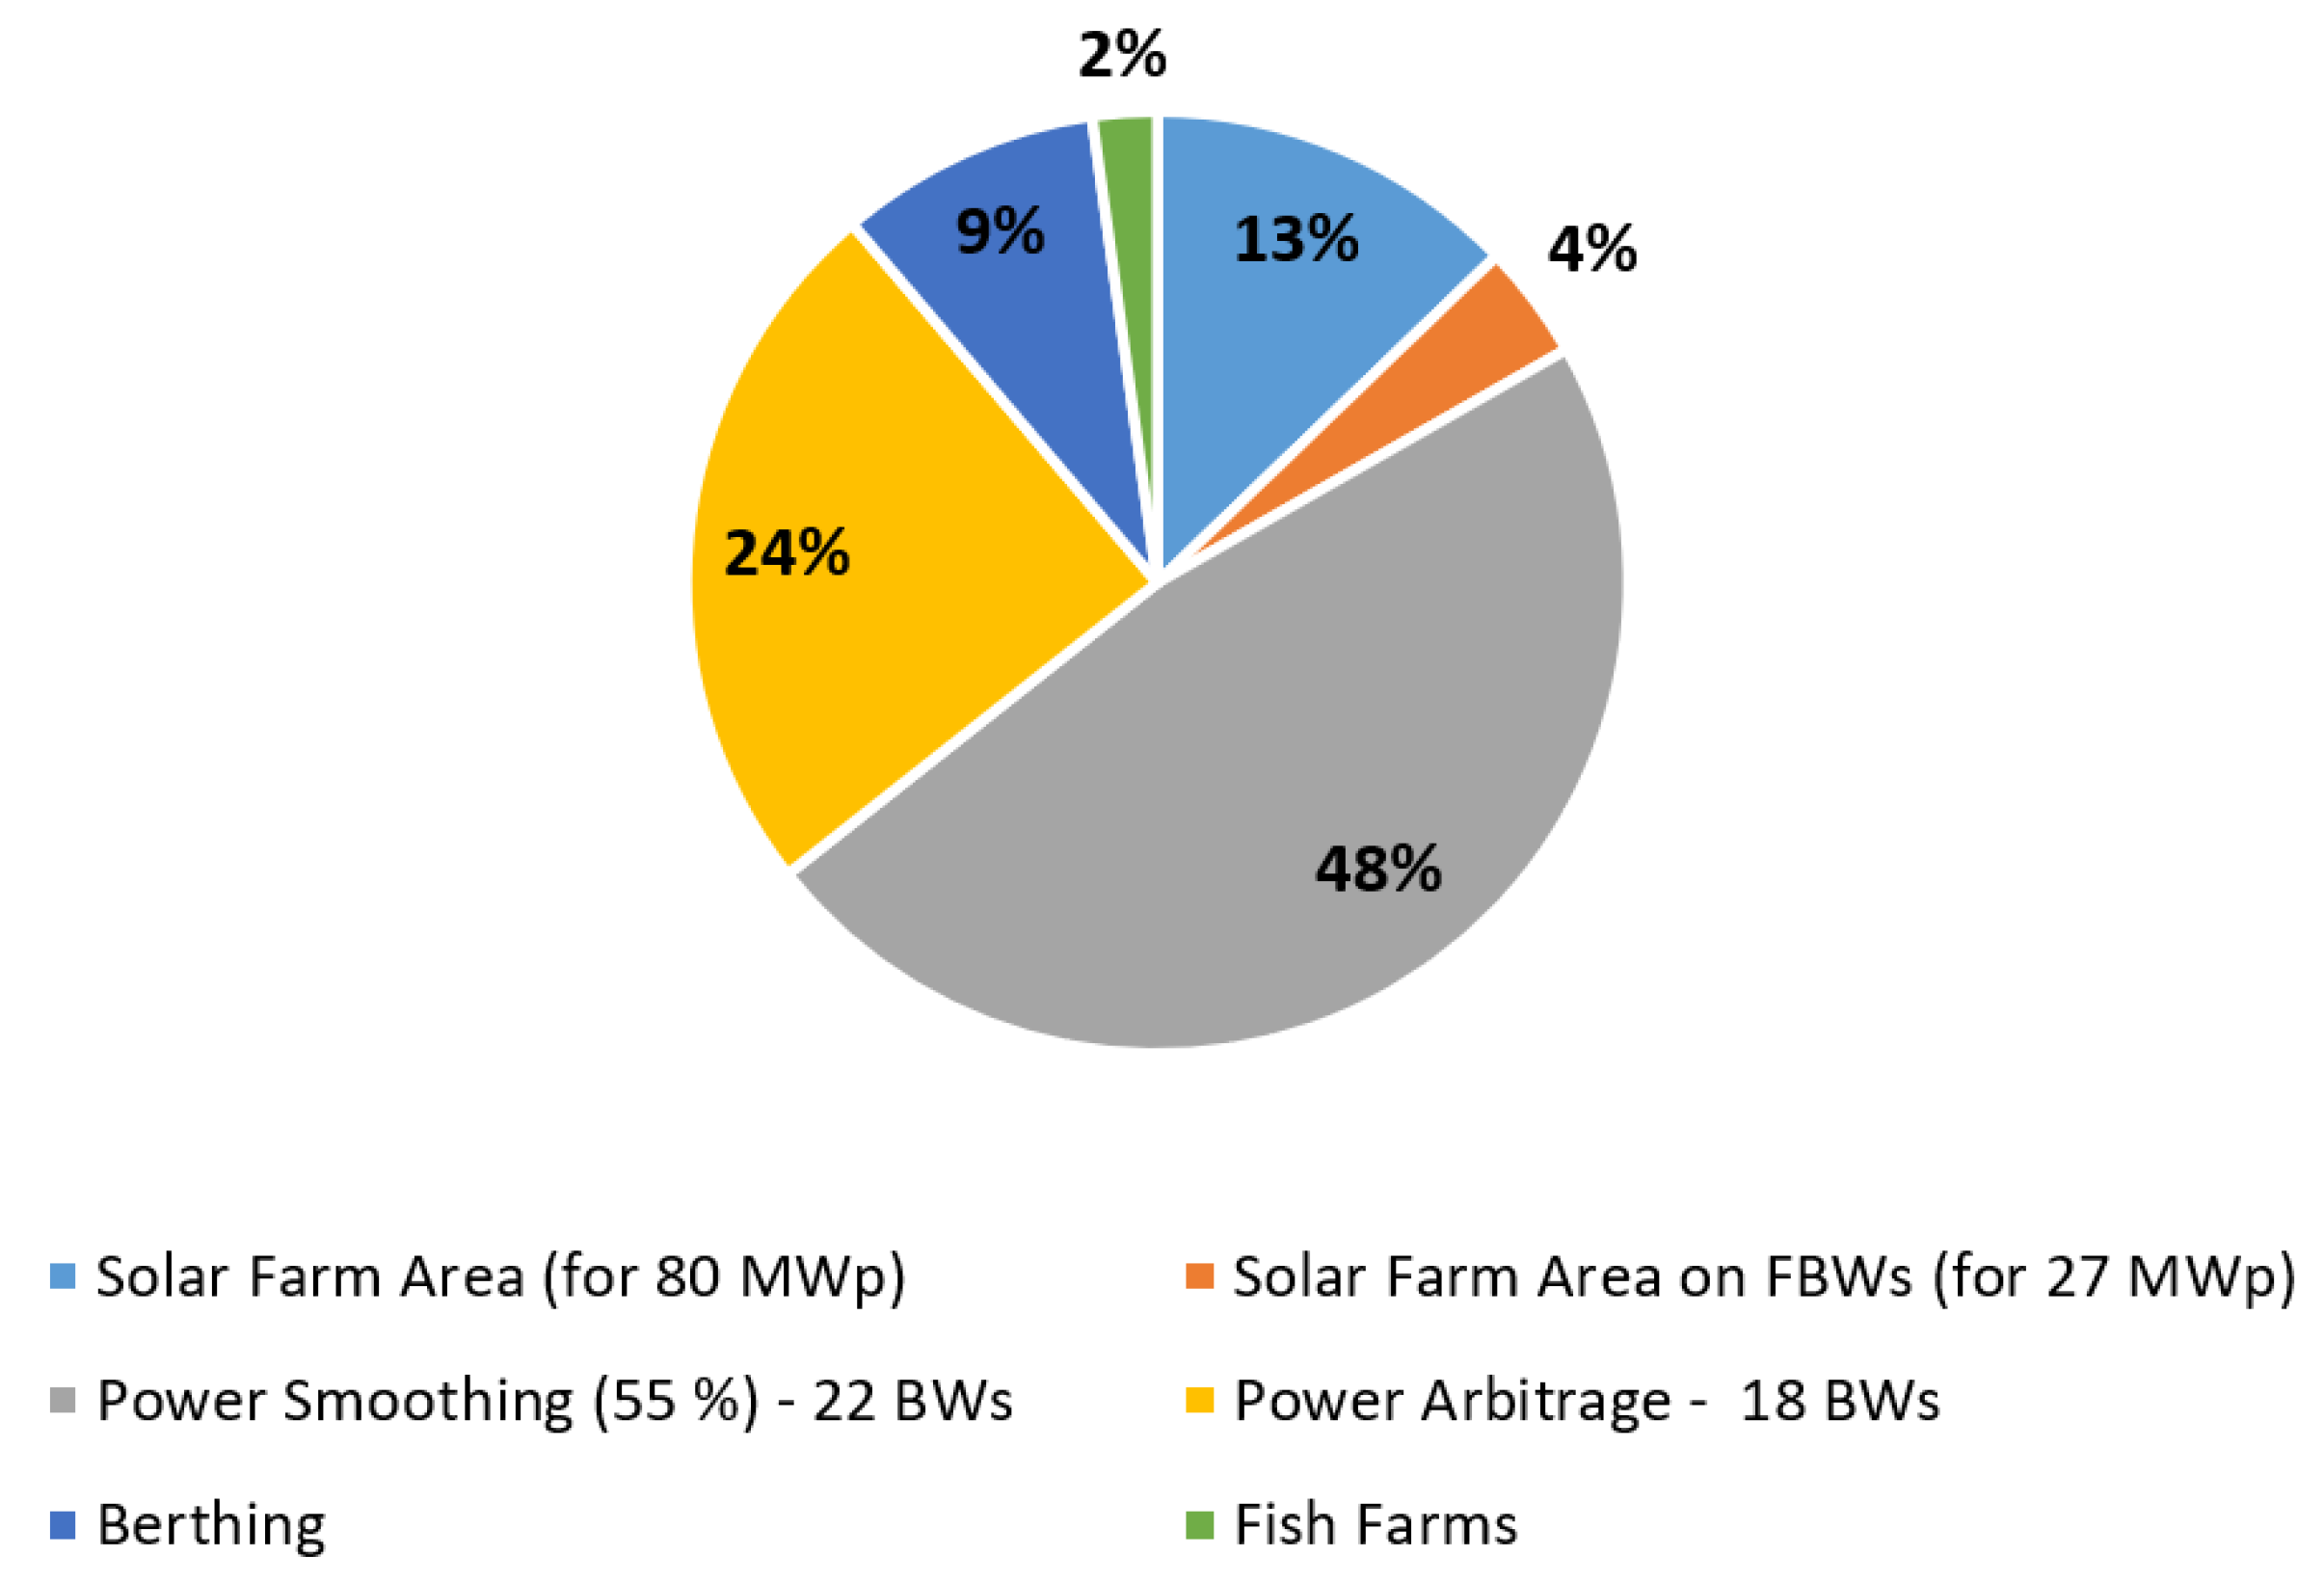
Figure 13.
The percentage contribution of each revenue stream for Case Study B2.
Figure 13.
The percentage contribution of each revenue stream for Case Study B2.
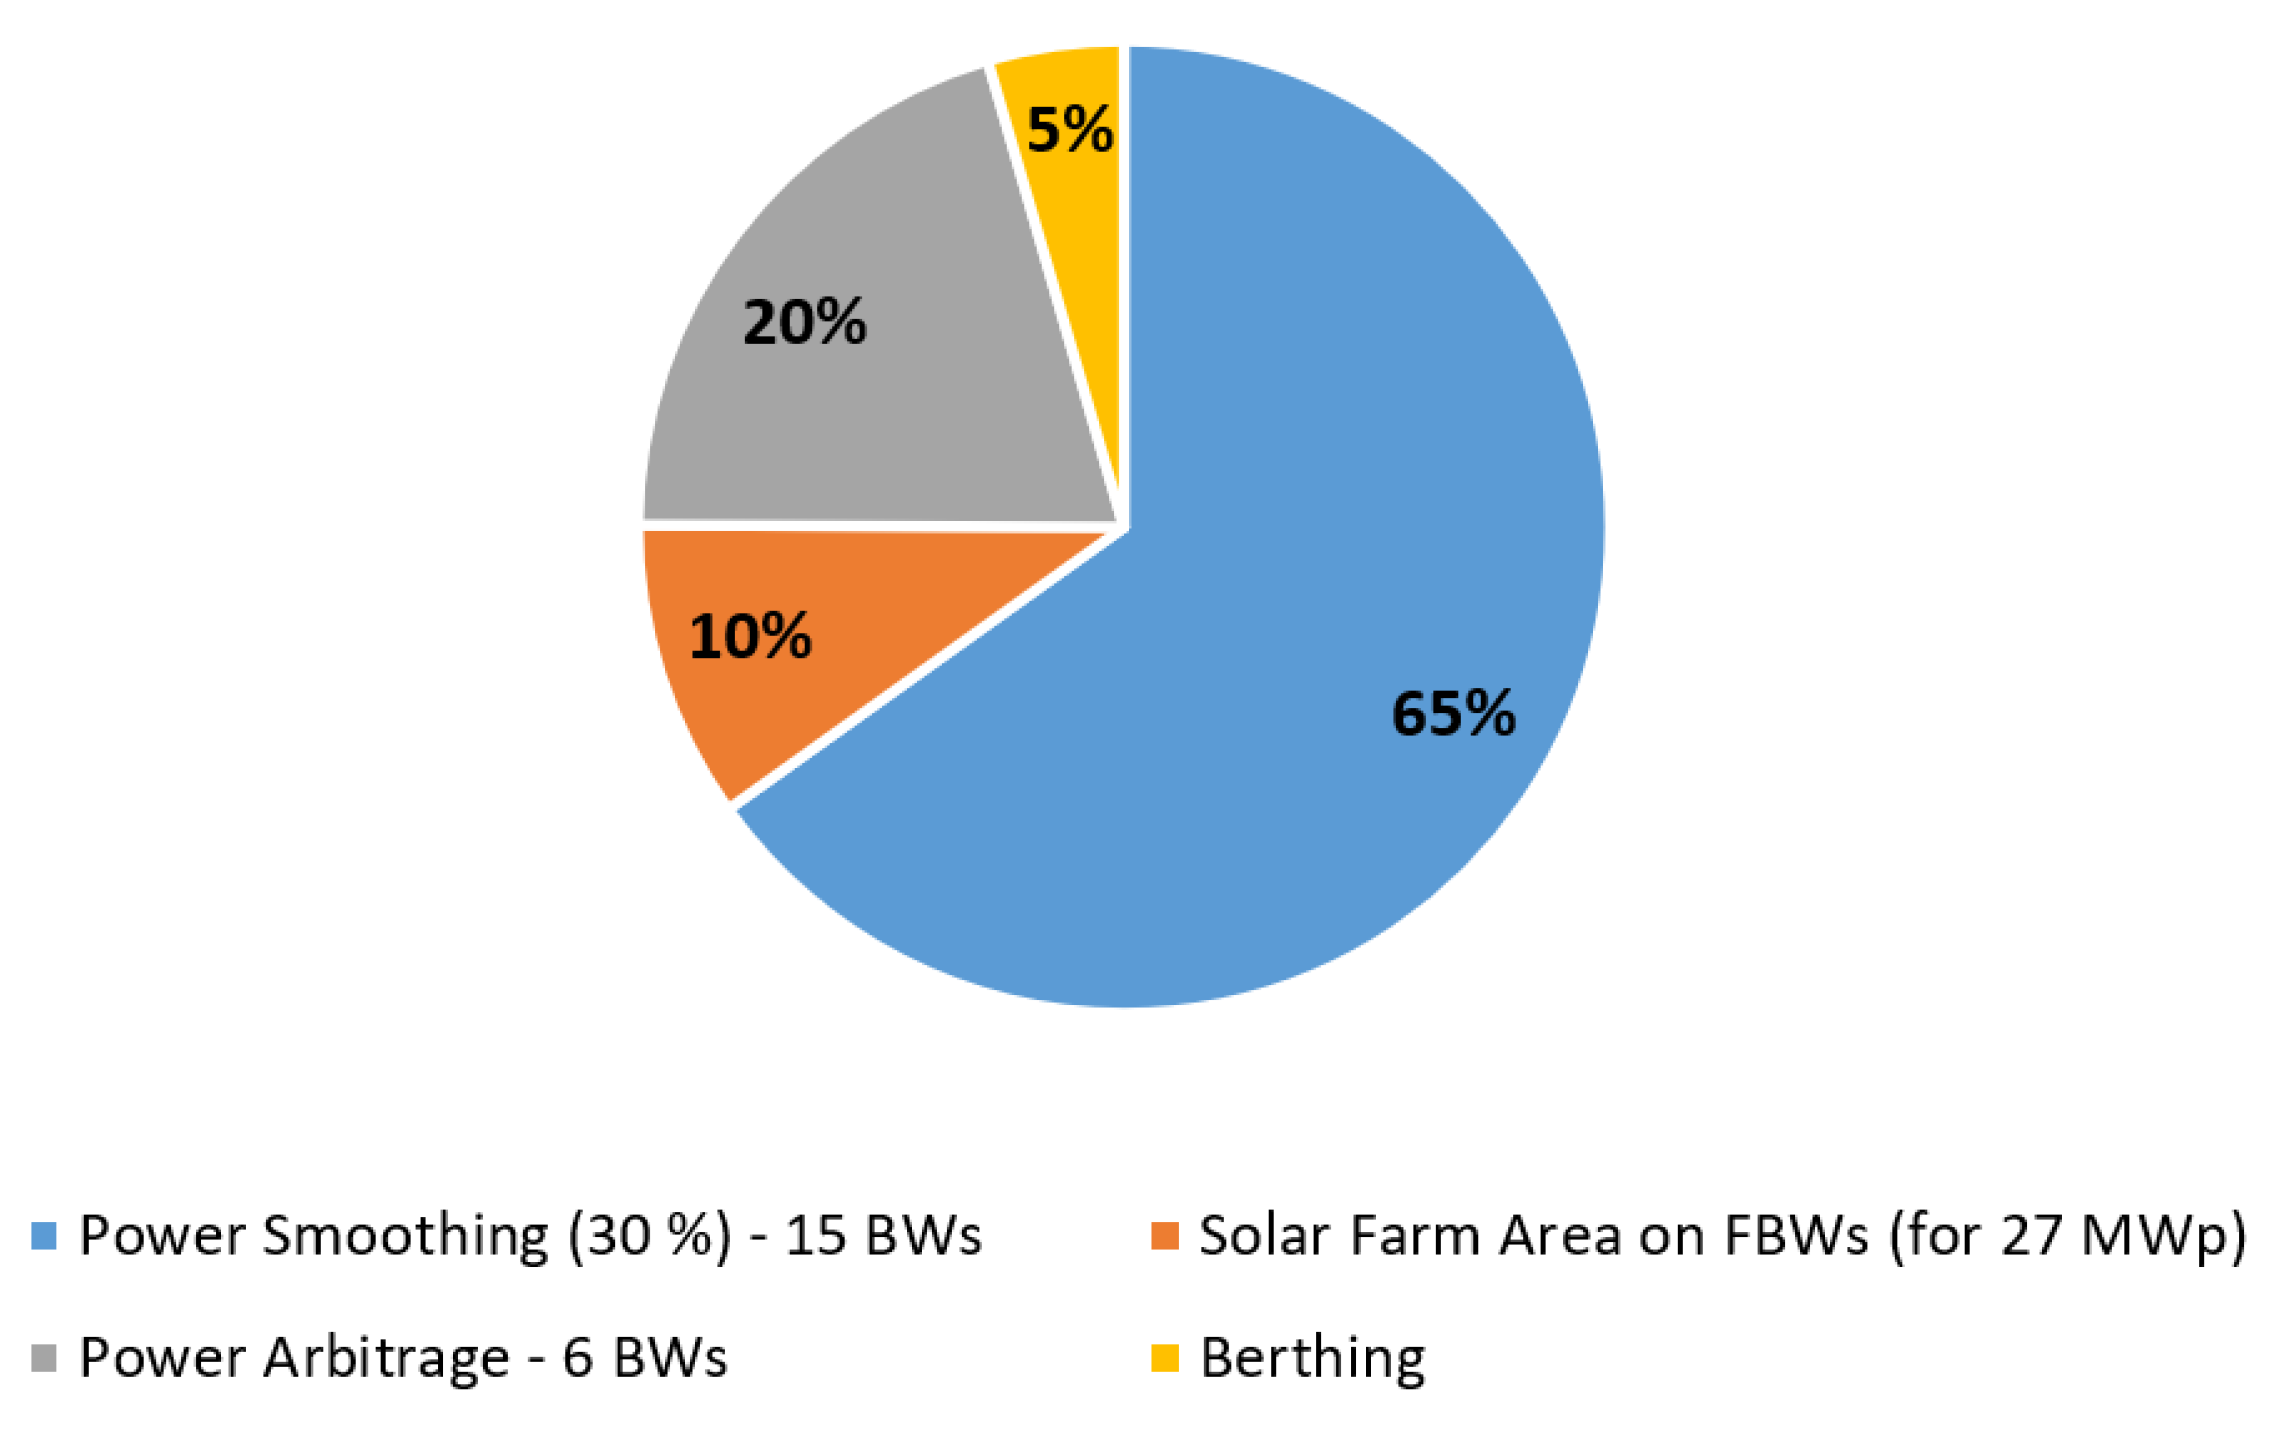
Figure 14.
The percentage contribution of each revenue stream for Case Study B3.
Figure 14.
The percentage contribution of each revenue stream for Case Study B3.
Table 1.
Main ESS parameters kept constant throughout the study.
Table 1.
Main ESS parameters kept constant throughout the study.
| ESS Parameter |
Value |
| Pump Rated Power () |
4.30 MW |
| Pump Average Hydraulic Efficiency () |
70% |
| Pelton Turbine Rated Power () |
5.00 MW |
| Pelton Turbine Average Efficiency () |
85% |
| PCS Pre-charge (Minimum) Pressure |
80 bar |
| PCS Maximum Pressure (Pressure Limit) |
200 bar |
| ESS Capacity (per BW) |
3.85 MWh |
Table 2.
Main parameters of the FOWT Pilot Farm.
Table 2.
Main parameters of the FOWT Pilot Farm.
| FOWT Pilot Farm Parameters |
Value |
Reference |
| Wind Turbine Rating |
10 MW |
[30] |
| Number of WTs |
3 |
- |
| WT Annual Energy Yield |
35.90 GWh |
- |
| WT Farm Annual Gross Energy Yield |
107.70 GWh |
- |
| Assumed Wake Losses |
10% |
[32] |
| Assumed Farm Availability |
97% |
[33] |
| Net Capacity Factor |
33% |
[34] |
Table 3.
Main parameters of the solar PV Farm.
Table 3.
Main parameters of the solar PV Farm.
| Solar PV Farm Parameters |
Value |
Reference |
| Solar Panel Nominal Power |
400 W |
|
| Solar Panel Area |
2 m2
|
[35] |
| Solar Farm Rating |
40 MWp |
|
| Annual Energy Yield |
68 GWh |
- |
Table 4.
The individual and combined spatial requirements of the RES analysed in the paper.
Table 4.
The individual and combined spatial requirements of the RES analysed in the paper.
| Spatial Requirement |
Value |
Reference |
| FOWT Pilot Farm (MW/km2) |
| Optimistic |
7.20 |
[36] |
| Conservative |
4.66 |
[37] |
| Medium |
5.93 |
- |
| Solar PV Farm (MW/km2) |
| Optimistic |
200 |
[38] |
| Conservative |
80 |
[39] |
| Medium |
140 |
- |
| Total Spatial Requirements (km2) |
| (Based on a 10 MW FOWT farm and a 40 MWp floating solar PV farm) |
| Optimistic |
4.37 |
- |
| Conservative |
6.94 |
- |
| Medium |
5.66 |
- |
Table 5.
Overall properties and parameters of the FBW [
27].
Table 5.
Overall properties and parameters of the FBW [
27].
| FBW Parameter |
Value |
| Geometric parameters |
| Length of floater (m) |
150 |
| Height of floater (m) |
11.90 |
| Width of floater (m) |
18 |
| Water plane area (m2) |
2,700 |
| Mass of concrete (t) |
17,120 |
| Total mass (t) |
21,220 |
| Longitudinal metacentric height (m) |
3.59 |
| Transverse metacentric height (m) |
244.57 |
| PCS parameters |
| Total ESS Capacity (MWh) |
3.85 |
| Total volumetric capacity of the PCS (m3) |
1,901 |
| Number of cylinders (-) |
8 |
| Length of cylinders (m) |
150 |
| Outer diameter (m) |
1.524 |
| Mooring parameters |
| Mooring Configuration (-) |
Catenary |
| Steel grade (-) |
R4 |
| Nominal chain diameter (m) |
0.171 |
| Unstretched cable length for corner lines (m) |
1419.11 |
| Unstretched cable length for middle lines (m) |
1231.08 |
Table 6.
Estimated cost breakdown of the total hardware-attributable cost.
Table 6.
Estimated cost breakdown of the total hardware-attributable cost.
| System |
Cost (€) |
Percentage (%) |
| FBW |
3,953,898 |
13.6 |
| HPES System |
3,274,197 |
11.2 |
| Moorings |
17,140,603 |
58.9 |
| Anchors |
4,737,600 |
16.3 |
| Total Hardware-attributable costs |
29,106,298 |
|
Table 7.
CAPEX breakdown for one FBW integrating HPES.
Table 7.
CAPEX breakdown for one FBW integrating HPES.
| Type of Cost |
Cost (€) |
Percentage (%) |
| Total Hardware-attributable Costs |
29,106,298 |
92.0 |
| Total Transportation and Installation (T&I) Costs |
2,377,039 |
7.50 |
| Total Insurance Costs |
139,815 |
0.50 |
| Total CAPEX |
31,623,152 |
|
Table 9.
The different Revenue Streams (RSs) considered.
Table 9.
The different Revenue Streams (RSs) considered.
| Revenue Stream (RS) |
Type |
Description |
| RS1 |
Lease of marine space |
Yacht Berthing Services |
| RS2 |
Lease of marine space |
Aquaculture Farms |
| RS3 |
Lease of marine space |
Solar PV Farms |
| RS4 |
Energy Storage |
Power Smoothing |
| RS5 |
Energy Storage |
Power Arbitrage |
| RS6 |
Energy Storage |
Berthing Electrical Supply |
Table 11.
The FOWT Pilot Farm LCOE, IRR and SPP Analysis Input parameters.
Table 11.
The FOWT Pilot Farm LCOE, IRR and SPP Analysis Input parameters.
| Economic Analysis Inputs |
Value (%) |
Reference |
| Interest Rate |
7.50 |
[19,20] |
| Inflation Rate |
2.50 |
[42] |
| Discount Rate |
4.88 |
- |
Table 12.
The FOWT Pilot Farm LCOE, IRR and SPP Analysis Output parameters.
Table 12.
The FOWT Pilot Farm LCOE, IRR and SPP Analysis Output parameters.
| Economic Analysis Outputs |
Value |
| LCOE (€c/kWh) |
13.8 |
| FIT (€c/kWh) |
17.7 |
| IRR (%) |
8.0 |
| SPP (years) |
9.88 |
| Profit (€M) |
207 |
Table 13.
Main cost parameters of the Land-based and Rooftop PV plants (related to Case Studies A1 and A2).
Table 13.
Main cost parameters of the Land-based and Rooftop PV plants (related to Case Studies A1 and A2).
| Cost Parameters |
Land-based PV Value |
Rooftop PV Value |
Reference |
| CAPEX (€/kW) |
754 |
1609 |
[45,46] |
| Land Lease (€/m2/year) |
16 |
6 |
Discussed in SubSection 3.2.3 [47] |
| OPEX (€/kW/year) |
14 |
26 |
[46] |
| DECEX (€/kW) |
30 |
30 |
[48] |
Table 14.
The Onshore Solar PV Plant (40 MWp) LCOE, IRR and SPP Analysis Input parameters.
Table 14.
The Onshore Solar PV Plant (40 MWp) LCOE, IRR and SPP Analysis Input parameters.
| Economic Analysis Inputs |
Value (%) |
Reference |
| Interest Rate (%) |
5.00 |
[20] |
| Inflation Rate (%) |
2.50 |
[42] |
| Discount Rate (%) |
2.44 |
- |
| Annual Energy Produced (GWh) |
61.30 |
- |
Table 15.
The Onshore Solar PV Plant (40 MWp) LCOE, IRR and SPP Analysis Output parameters.
Table 15.
The Onshore Solar PV Plant (40 MWp) LCOE, IRR and SPP Analysis Output parameters.
| Economic Analysis Outputs |
Land-based |
Rooftop PV |
| LCOE (€c/kWh) |
13.90 |
7.93 |
| FIT (€c/kWh) |
23.80 |
12.70 |
| IRR (%) |
8.0 |
8.0 |
| SPP (years) |
9.93 |
8.86 |
| Profit (€M) |
204 |
98 |
Table 16.
The economic results for Case Studies A1 (Land-based PV) and A2 (Rooftop PV).
Table 16.
The economic results for Case Studies A1 (Land-based PV) and A2 (Rooftop PV).
| Economic Analysis Outputs |
Land-based |
Rooftop PV |
| LCOE (€c/kWh) |
13.80 |
10.90 |
| SPP (years) |
9.87 |
9.51 |
| Profit (€M) |
406 |
300 |
Table 17.
Main cost parameters of the Floating PV plants in calm and open waters (related to Case Studies A3 and A4).
Table 17.
Main cost parameters of the Floating PV plants in calm and open waters (related to Case Studies A3 and A4).
| Cost Parameters |
FPV in Calm Waters Value |
FPV in Open Waters Value |
Reference |
| CAPEX (€/kWp) |
693 |
2047 |
[51,52] |
| Replacement Costs (€/kWp) |
109 |
109 |
[51] |
| OPEX (€/kWp/year) |
29 |
30 |
[51,52] |
| DECEX (€/kWp) |
42 |
42 |
[51,52] |
Table 18.
The Offshore Solar PV Plant (40 MWp) LCOE, IRR and SPP Analysis Input parameters.
Table 18.
The Offshore Solar PV Plant (40 MWp) LCOE, IRR and SPP Analysis Input parameters.
| Economic Analysis Inputs |
Value (%) |
Reference |
| Interest Rate (%) |
8.00 |
[47] |
| Inflation Rate (%) |
2.50 |
[20] |
| Discount Rate (%) |
5.37 |
- |
| Annual Energy Produced (GWh) |
68.0 |
- |
Table 19.
The Offshore Solar PV Plant (40 MWp) LCOE, IRR and SPP Analysis Output parameters.
Table 19.
The Offshore Solar PV Plant (40 MWp) LCOE, IRR and SPP Analysis Output parameters.
| Economic Analysis Outputs |
Calm Waters |
Open Seas |
| LCOE (€c/kWh) |
8.00 |
12.00 |
| FIT (€c/kWh) |
9.70 |
14.90 |
| IRR (%) |
8.0 |
8.0 |
| SPP (years) |
8.14 |
8.86 |
| Profit (€M) |
77 |
130 |
Table 20.
The economic results for Case Studies A3 (Calm Waters) and A4 (Open Seas).
Table 20.
The economic results for Case Studies A3 (Calm Waters) and A4 (Open Seas).
| Economic Analysis Outputs |
Calm Waters |
Open Seas |
| LCOE (€c/kWh) |
11.40 |
13.00 |
| SPP (years) |
9.31 |
9.43 |
| Profit (€M) |
279 |
332 |
Table 21.
The average rental price per year for different coastal regions in the Mediterranean Sea.
Table 21.
The average rental price per year for different coastal regions in the Mediterranean Sea.
| Region |
Value (€/m2/year) |
Population Density (pax/km2) |
Reference |
| Malta |
16.0 |
1,649 |
[53,54,55,56] |
| Sicily |
1.10 |
190 |
[57,58,59,60] |
| Spain |
1.16 |
94 |
[61,62,63,64] |
| Crete |
1.70 |
75 |
[65,66,67,68] |
Table 22.
A summary of the yacht berthing pricing and setup.
Table 22.
A summary of the yacht berthing pricing and setup.
| Berth Size |
Price per Day (€) |
Number of Berths |
Area (m2) |
| 16 to 18 metres |
38 |
568 |
115,000 |
| 18 to 20 metres |
42 |
| Up to 35 metres |
55 |
26 |
110,000 |
| Up to 50 metres |
180 |
Table 23.
The financial results related to the Yacht Berthing revenue stream financial analysis.
Table 23.
The financial results related to the Yacht Berthing revenue stream financial analysis.
| Main Financial Results |
Value |
| Revenue per day (assumed) |
€ 27,075 |
| Revenue for 5 months of non-stop operation (assumed) |
€ 4,142,475 |
| Revenue assuming 5 months (Berthing facility owner) (20% usage) |
€ 828,495 |
| Revenue assuming 5 months (Berthing facility owner) (40% usage) |
€ 1,656,990 |
| Revenue assuming 5 months (Berthing facility owner) (60% usage) |
€ 2,485,485 |
| Revenue to Project FORTRESS (FBWs owners) (10%) |
€ 165,699 |
| Revenue to Project FORTRESS (FBWs owners) (17%) |
€ 281,688 |
| Revenue to Project FORTRESS (FBWs owners) (25%) |
€414,248 |
| Price of Area (10%) |
0.74 €/m2
|
| Price of Area (17%) |
1.25 €/m2
|
| Price of Area (25%) |
1.84 €/m2
|
Table 24.
A summary of the sizing of one fish farm.
Table 24.
A summary of the sizing of one fish farm.
| Parameter |
Amount |
Area Required (m2) |
| Number of 50 metre diameter cages |
4 |
7,850 |
| Number of 60 metre diameter cages |
2 |
5,655 |
Table 25.
The financial results related to the Aquaculture revenue stream financial analysis.
Table 25.
The financial results related to the Aquaculture revenue stream financial analysis.
| Main Financial Results |
Value |
| Price of Area (10%) |
0.74 €/m2
|
| Price of Area (17%) |
1.25 €/m2
|
| Price of Area (25%) |
1.84 €/m2
|
| Revenue to Project FORTRESS (FBWs owners) (10%) |
€ 99,686 |
| Revenue to Project FORTRESS (FBWs owners) (17%) |
€ 169,466 |
| Revenue to Project FORTRESS (FBWs owners) (25%) |
€ 249,214 |
Table 26.
The FOWT Pilot Farm LCOE, IRR and SPP Analysis Output parameters.
Table 26.
The FOWT Pilot Farm LCOE, IRR and SPP Analysis Output parameters.
| Economic Analysis Outputs |
Value |
| LCOE (€c/kWh) |
11.3 |
| FIT (€c/kWh) |
13.6 |
| IRR (%) |
8.0 |
| SPP (years) |
7.75 |
| Profit (€M) |
102 |
Table 27.
A summary of the area required to accommodate the solar PV plants
Table 27.
A summary of the area required to accommodate the solar PV plants
| Solar PVs |
Power Rating (MWp) |
Number of Plants |
Area Required (m2) |
| In sheltered waters |
40 |
2 |
536,487 |
| On FBWs |
27 |
1 |
120,780 |
Table 28.
The financial results related to the Renting of Solar PV area revenue stream financial analysis.
Table 28.
The financial results related to the Renting of Solar PV area revenue stream financial analysis.
| Solar PVs |
Area price for PVs in sheltered seas (€/m2) |
Area price for PVs on FBWs (€/m2) |
Total Revenue (€) |
| Conservative |
0.74 |
1.48 |
576,000 |
| Medium |
1.25 |
2.50 |
977,000 |
| Optimistic |
1.84 |
3.68 |
1,437,000 |
Table 29.
The main cost parameters of the FBW structure.
Table 29.
The main cost parameters of the FBW structure.
| FBW Costs |
Value |
| Number of FBWs |
61 |
| FBW CAPEX (No HPES) |
€ 27.5 million |
| FBW OPEX |
3% of FBW CAPEX |
| FBW DECEX |
3% of FBW CAPEX |
| Total Cost |
€ 1.68 billion |
Table 30.
The economic results for Case Study A5.
Table 30.
The economic results for Case Study A5.
| Economic Analysis Outputs |
A5 |
| LCOE (€c/kWh) |
47.34 |
| SPP (years) |
419 years |
| Profit (€) |
- 1.41 billion |
Table 31.
A summary of the number of FBWs based on Power Smoothing Availability.
Table 31.
A summary of the number of FBWs based on Power Smoothing Availability.
| Number of FBWs for Power Smoothing |
|---|
| Power Smoothing Availability |
61 |
Power Smoothing Availability |
41 |
Power Smoothing Availability |
21 |
| 65% |
26 |
55% |
22 |
30% |
15 |
| 80% |
35 |
70% |
28 |
40% |
18 |
| 95% |
60 |
85% |
40 |
50% |
20 |
Table 32.
The financial results related to the Power Smoothing revenue stream analysis.
Table 32.
The financial results related to the Power Smoothing revenue stream analysis.
| Number of FBWs |
Mark-up Selling Price (€c/kWh) |
Profit (based on difference in selling and
purchase price)(M€) |
| |
Power Smoothing Availability |
65% |
80% |
95% |
| 61 |
Conservative |
28 |
2.98 |
3.66 |
4.35 |
| |
Medium |
31 |
4.30 |
5.29 |
6.28 |
| |
Optimistic |
34 |
5.63 |
6.92 |
8.22 |
| |
Power Smoothing Availability |
55% |
70% |
85% |
| 41 |
Conservative |
28 |
2.51 |
3.20 |
3.88 |
| |
Medium |
31 |
3.63 |
4.63 |
5.62 |
| |
Optimistic |
34 |
4.76 |
6.05 |
7.35 |
| |
Power Smoothing Availability |
30% |
40% |
50% |
| 21 |
Conservative |
28 |
1.37 |
1.83 |
2.28 |
| |
Medium |
31 |
1.98 |
2.64 |
3.30 |
| |
Optimistic |
34 |
2.59 |
3.46 |
4.32 |
Table 33.
A summary of the number of FBWs for Power Arbitrage based on Power Smoothing Availability.
Table 33.
A summary of the number of FBWs for Power Arbitrage based on Power Smoothing Availability.
| Number of FBWs for Power Arbitrage |
|---|
| Power Smoothing Availability |
61 |
Power Smoothing Availability |
41 |
Power Smoothing Availability |
21 |
| 65% |
34 |
55% |
18 |
30% |
6 |
| 80% |
25 |
70% |
12 |
40% |
3 |
| 95% |
0 |
85% |
0 |
50% |
0 |
Table 34.
A summary of the Energy Storage Capacity for Power Arbitrage based on Power Smoothing Availability.
Table 34.
A summary of the Energy Storage Capacity for Power Arbitrage based on Power Smoothing Availability.
| Energy Storage Capacity Available for Power Arbitrage (MWh) |
|---|
| Power Smoothing Availability |
61 |
Power Smoothing Availability |
41 |
Power Smoothing Availability |
21 |
| 65% |
131 |
55% |
69 |
30% |
23 |
| 80% |
96 |
70% |
46 |
40% |
12 |
| 95% |
0 |
85% |
0 |
50% |
0 |
Table 35.
The updated financial results related to the Yacht Berthing revenue stream financial analysis.
Table 35.
The updated financial results related to the Yacht Berthing revenue stream financial analysis.
| Main Financial Results |
Value |
| Assumed Electrical Needs per Year (MWh) |
1500 |
| Revenue from Electrical Services (Conservative) |
€ 303,750 |
| Revenue from Electrical Services (Medium) |
€ 405,000 |
| Revenue from Electrical Services (Optimistic) |
€ 506,250 |
| Revenue to Project FORTRESS (Conservative) |
€ 470,000 |
| Revenue to Project FORTRESS (Medium) |
€ 687,000 |
| Revenue to Project FORTRESS (Optimistic) |
€ 921,000 |
Table 36.
The main cost parameters of the FBW structure as a function of number of FBWs.
Table 36.
The main cost parameters of the FBW structure as a function of number of FBWs.
| Parameter |
Value |
| Number of FBWs |
61 |
41 |
21 |
| Number of ECUs |
7 |
5 |
3 |
| Cost of ECU (€) |
5,500,000 |
| FBW CAPEX (€) |
31,623,152 |
| FBW OPEX (€) |
3% of FBW CAPEX |
| FBW DECEX (€) |
3% of FBW CAPEX |
| Total Cost (Billion €) |
2.09 |
1.42 |
0.74 |
Table 37.
The LCOE, IRR and SPP Analysis Input parameters for Case Studies B1, B2 and B3.
Table 37.
The LCOE, IRR and SPP Analysis Input parameters for Case Studies B1, B2 and B3.
| Economic Analysis Inputs |
Value (%) |
Reference |
| Interest Rate (%) |
7.50 |
[47] |
| Inflation Rate (%) |
2.50 |
[20] |
| Discount Rate (%) |
4.88 |
- |
Table 38.
The setup of the FBW array for Case Studies B1, B2 and B3.
Table 38.
The setup of the FBW array for Case Studies B1, B2 and B3.
| Number of FBWs |
|---|
| Parameter |
B1 |
B2 |
B3 |
| Berthing Electrical Supply |
1 |
1 |
0 |
| Power Smoothing |
26 |
22 |
15 |
| Power Arbitrage |
34 |
18 |
6 |
Table 39.
The economic results for Case Studies B1, B2 and B3.
Table 39.
The economic results for Case Studies B1, B2 and B3.
| Economic Analysis Outputs |
B1 |
B2 |
B3 |
| LCOE (€c/kWh) |
72.45 |
49.78 |
26.59 |
| Profit/Loss (Billion €) - Conservative |
-2.42 |
-1.63 |
-0.90 |
| Profit/Loss (Billion €) - Medium |
-1.94 |
-1.30 |
-0.72 |
| Profit/Loss (Billion €) - Optimistic |
-1.45 |
-0.98 |
-0.54 |
Table 40.
The main cost parameters of the FBW structure at a sea depth of 50 metres.
Table 40.
The main cost parameters of the FBW structure at a sea depth of 50 metres.
| Parameter |
Value |
| Number of FBWs |
61 |
41 |
21 |
| Number of ECUs |
7 |
5 |
3 |
| Cost of ECU (€) |
5,500,000 |
| Cost of PCS (€) |
2,647,197 |
| FBW CAPEX (€) |
27,586,954 |
| FBW OPEX (€) |
3% of FBW CAPEX |
| FBW DECEX (€) |
3% of FBW CAPEX |
| Total Cost (Billion €) |
2.09 |
1.42 |
0.74 |
Table 41.
The economic results for Case Studies B1, B2 and B3 at a sea depth of 50 metres.
Table 41.
The economic results for Case Studies B1, B2 and B3 at a sea depth of 50 metres.
| Economic Analysis Outputs |
B1 |
B2 |
B3 |
| LCOE (€c/kWh) |
72.45 |
49.78 |
26.59 |
| Profit/Loss (Billion €) - Conservative |
-2.42 |
-1.63 |
-0.90 |
| Profit/Loss (Billion €) - Medium |
-1.94 |
-1.30 |
-0.72 |
| Profit/Loss (Billion €) - Optimistic |
-1.45 |
-0.98 |
-0.54 |
