1. Introduction:
Fused filament fabrication (FFF), also known as fused deposition modeling (FDM, a trade name owned by Stratasys Inc.[
1]), is one of the most widely used additive manufacturing (AM) techniques. Developed as a tool for rapid prototyping, FFF has emerged as a pivotal manufacturing process in several industries (automotive[
2], aviation [
3], medicine[
4], and construction[
5]) due to advantages like ease of material handling, low cost, and portability.
Despite the widespread use of FFF, accurately predicting the mechanical response remains a challenge to date. Numerous studies have investigated the effects of different printing parameters on the structure and mechanical properties of printed materials[
6,
7,
8,
9,
10,
11,
12]. However, the effects of the sample’s size on its mechanical response are still not well understood. Such knowledge is needed for the design process. Thus, this paper investigates the size effects in FFF.
Large variations in mechanical properties are observed in FFF due to defects formed during the printing process. Techniques like scanning electron microscopy (SEM) and micro-computed tomography (micro-CT) have been used to study material deposition and defects formed during FFF. Guessasma
et al. [
13] were among the first to employ micro-CT to examine the defects in FFF. They found that defects were formed in the samples due to incomplete sintering between deposited material (beads or raster), abrupt changes in print direction, and lack of fusion between the layers.
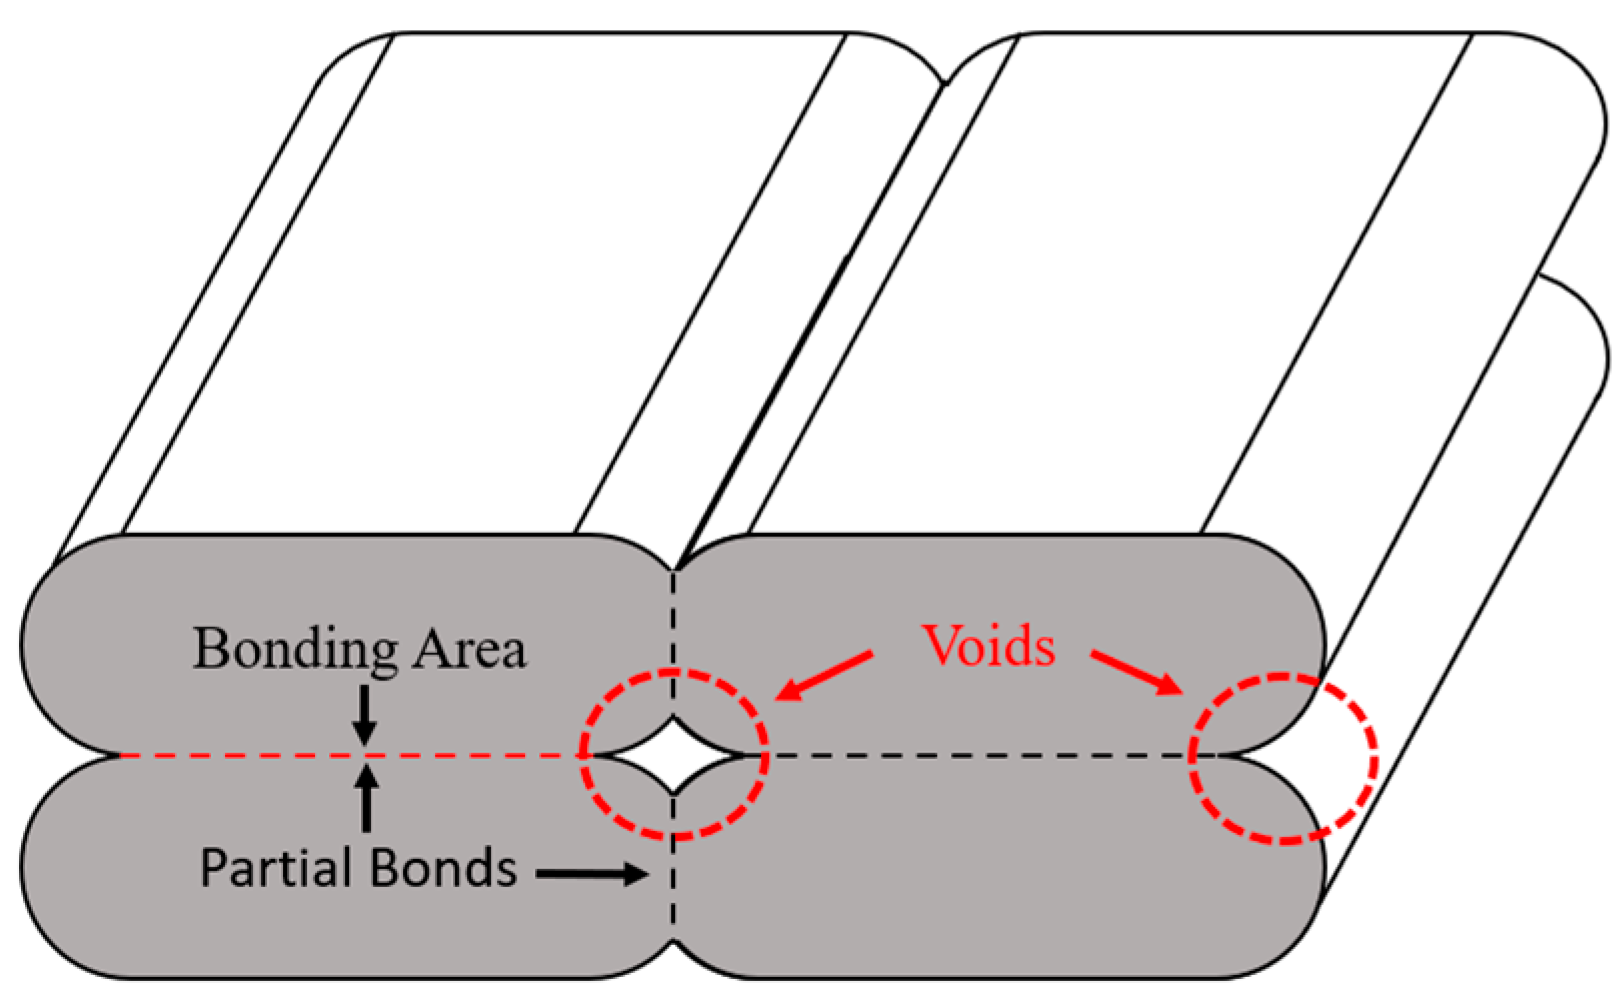
Figure 1 shows the resulting porosity formed due to incomplete sintering. The porosity forms an internal structure (mesostructure), which affects the macroscopic properties of the printed samples. Researchers have examined the effect of different printing parameters (e.g., layer height, print speed, print temperature) on the mesostructure and resulting mechanical properties [
13,
14,
15,
16]. Three-dimensional (3D) micro-CT images showed that long continuous voids are formed in the mesostructure along the bead deposition direction. Minor variations in the cross-section and oscillations were observed when focused on single voids due to irregularities such as ghosting and rippling16.
The cooling rate and deposition angle (also known as the raster angle) play critical roles in bond and void formation in FFF. Hernandez
et al.[
7] developed a two-stage thermal and sintering model to simulate bond and void formation under different temperature conditions. They demonstrated that higher substrate temperatures can reduce void volume. Conversely, lower processing temperatures can increase the number and size of voids[
17]. Layer height (LH) is another critical factor affecting the formation of voids, with conflicting reports presented in the literature. In some samples, increasing LH has been shown to reduce the number and size of the pores at the layer interfaces[
17]. In other samples, increasing LH increased the number of pores and size of voids[
18,
19]. The bead width and raster angles have also been found to influence the geometry of voids[
20,
21]. Overall, these findings highlight the complex interplay between different printing parameters and their impact on the void characteristics in FFF.
Based on the results obtained from the micro-CT, representative volume elements have been developed to understand the effects of voids on the macroscopic response of the material. Tools such as finite element analysis (FEA) [
20,
22,
23,
24,
25], fast Fourier transform (FFT)[
16], and semi-analytical techniques[
11] have been used to study the influence of the microstructure on the properties of the printed material. These studies have shown that voids reduce the elastic modulus of a material and act as sources of failure. Larger voids (resulting from parameters such as larger LH) also increase the anisotropy of the material.
Apart from printing parameters, studies have shown that the sample preparation strategies and sample geometry can significantly affect material properties[
26]. In addition, the size of the sample has also been shown to affect mechanical properties in other AM processes[
27,
28,
29,
30]. However, no studies have been published on the size effects in the FFF. Thus, the current study focused on the impact of size and LH on the compressive elastic modulus of samples printed using FFF. The LH was included in addition to the sample size because, based on the literature, LH directly affects the void volume fraction and has been shown to have conflicting effects on the materials’ mechanical properties.
This paper is structured into five sections.
Section 2 delves into the specifics of material selection, sample preparation, and experimental methods employed in the research.
Section 3 presents the findings. A discussion of these results is provided in
Section 4, followed by the conclusions, summary, and suggestions for future work in
Section 5.
2. Experimental Analysis
2.1. Sample Preparation
Cubic samples with side dimensions of 8 mm, 12 mm, and 20 mm were 3D printed using the Svol SV02 (Sovol3D, Shenzhen, China) at the layer heights of 0.1 mm, 0.2 mm, and 0.4 mm. The samples were printed based on the full factorial design of experiments (DOE), as shown in
Table 1. Two polymers, polycarbonate (PC) and thermoplastic polyurethane (TPU), were chosen for this study because of their contrasting mechanical properties. PC has a high modulus and is an amorphous material, whereas TPU is a relatively softer and semi-crystalline material. To ensure consistent printing conditions, the nozzle size, layer width, air gap, raster angle, print orientation, wall count, print speed, and nozzle/bed temperatures were held constant across all the prints. The PC samples were printed using a 0.6 mm nozzle size, nozzle temperature of 260°C, print speed of 40 mm/s, and bed temperature of 110°C. All the TPU samples were printed at a nozzle temperature of 230°C, print speed of 15 mm/s, and bed temperature of 70°C. The bead width was kept at 0.6 mm for all the samples, and the raster angles were set at +45°/-45°. Five samples were studied for each DOE point, and the weight and dimensions of each sample were recorded before testing to calculate the equivalent density (mass/volume).
2.2. Micro-CT Analysis
Micro-CT is a nondestructive imaging method that employs X-rays to generate two-dimensional (2D) trans-axial projections of specimens and subsequently reconstructs them into a comprehensive 3D representation using specialized reconstruction software. A grayscale value is assigned to each spatial position within the sample, representing the local phase density. In this study, PC and TPU samples were scanned using a Rigaku CT Lab HX 130 micro-CT machine (Rigaku, Tokyo, Japan). The samples were placed on a rotating platform situated between the X-ray source and detector screen. The voltage, current, and distance from the source were 130 kV, 60 μA, and 20 mm, respectively. 1930 2D images were captured in continuous acquisition mode over a period of 68 min, resulting in a resolution of 5.3 μm.
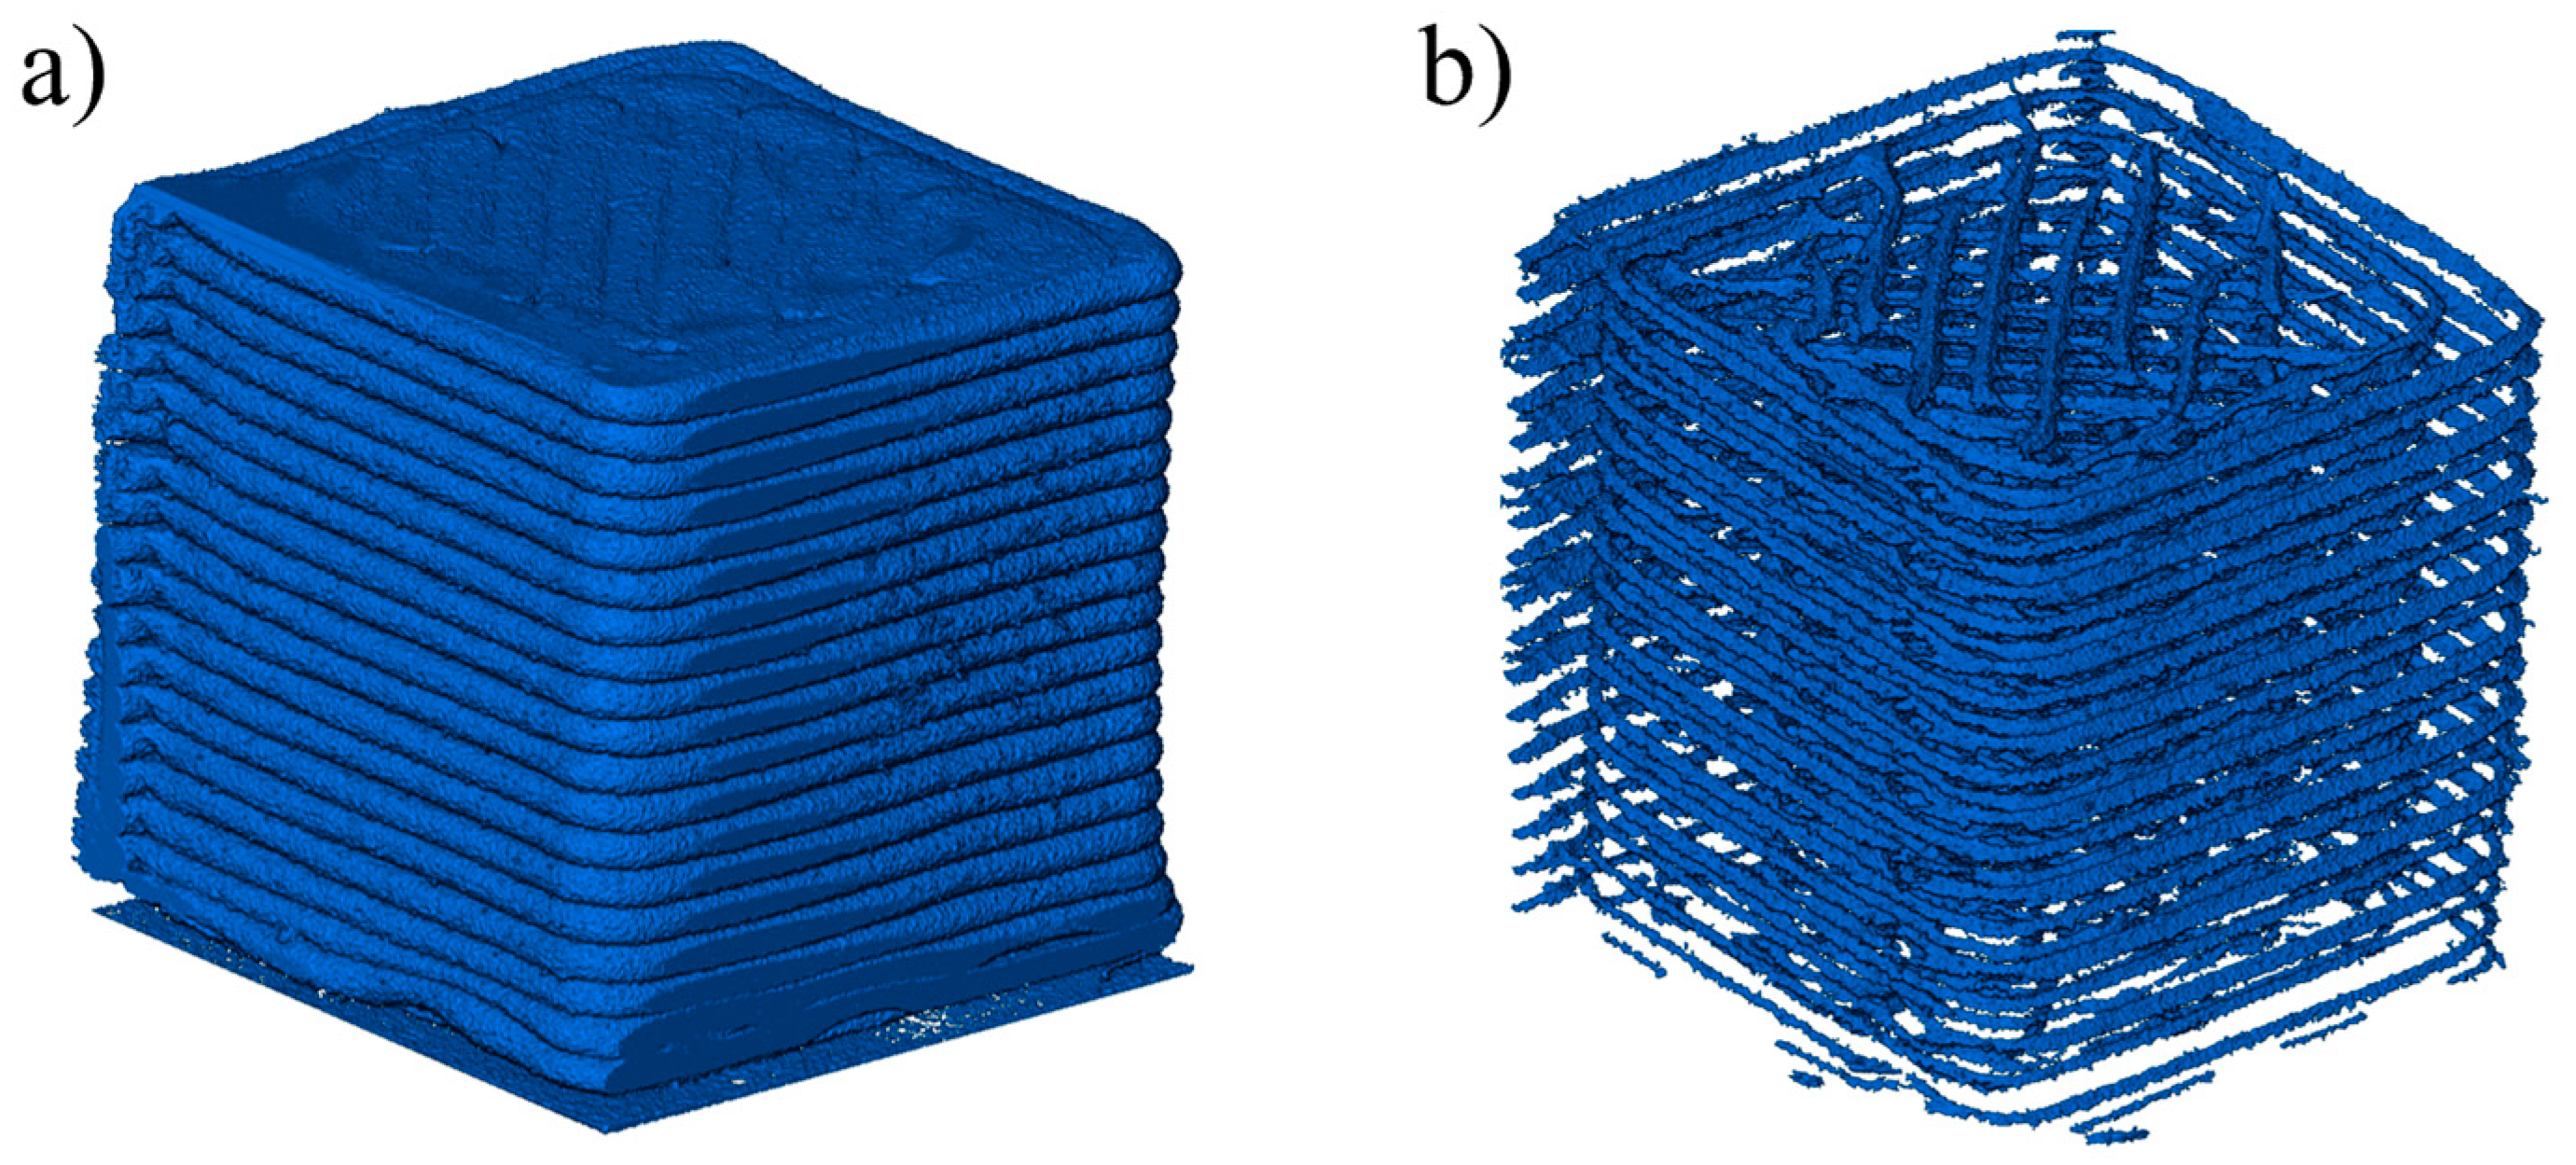
The micro-CT scans were converted into TIF images and reconstructed using Amira™ (FEI) software. The gray-level images were then converted into binary images using interactive thresholding to separate the pores from solid features. The threshold values were adjusted twice: first to visualize the deposited material and then to render a 3D image of the voids. Thresholding was followed by eliminating artifacts of less than 20-unit voxels using the “remove small spots option.”
Figure 2 shows the images obtained after the two thresholding steps for a PC sample. The segmentation process in the Amira software is described in detail in Mahrous et al.[
31]. The samples were also cropped to study the deposition of beads according to the raster angle, which allowed the identification of repeating architecture at the mesoscale. The samples were also cropped to study the deposition of beads according to the raster angle, which allowed the identification of repeating architecture at the mesoscale. Label analysis was then conducted to determine the void volume and connectivity. The void volume fraction was calculated using Equation (1).
2.3. Compression Testing
The cubic samples were subjected to compression along the print direction using an MTS Alliance RT/30 load frame (MTS Systems, Eden Prairie, MN, USA). The samples were compressed at a 0.1 mm/min rate following the ASTM D695-15 standard. Cubic samples were used instead of cuboid samples, as recommended by the standard, to prevent buckling. Load cells with capacities of 30 and 10 kN were used to obtain the load-displacement data. The stress-strain curves were then obtained from the collected data.
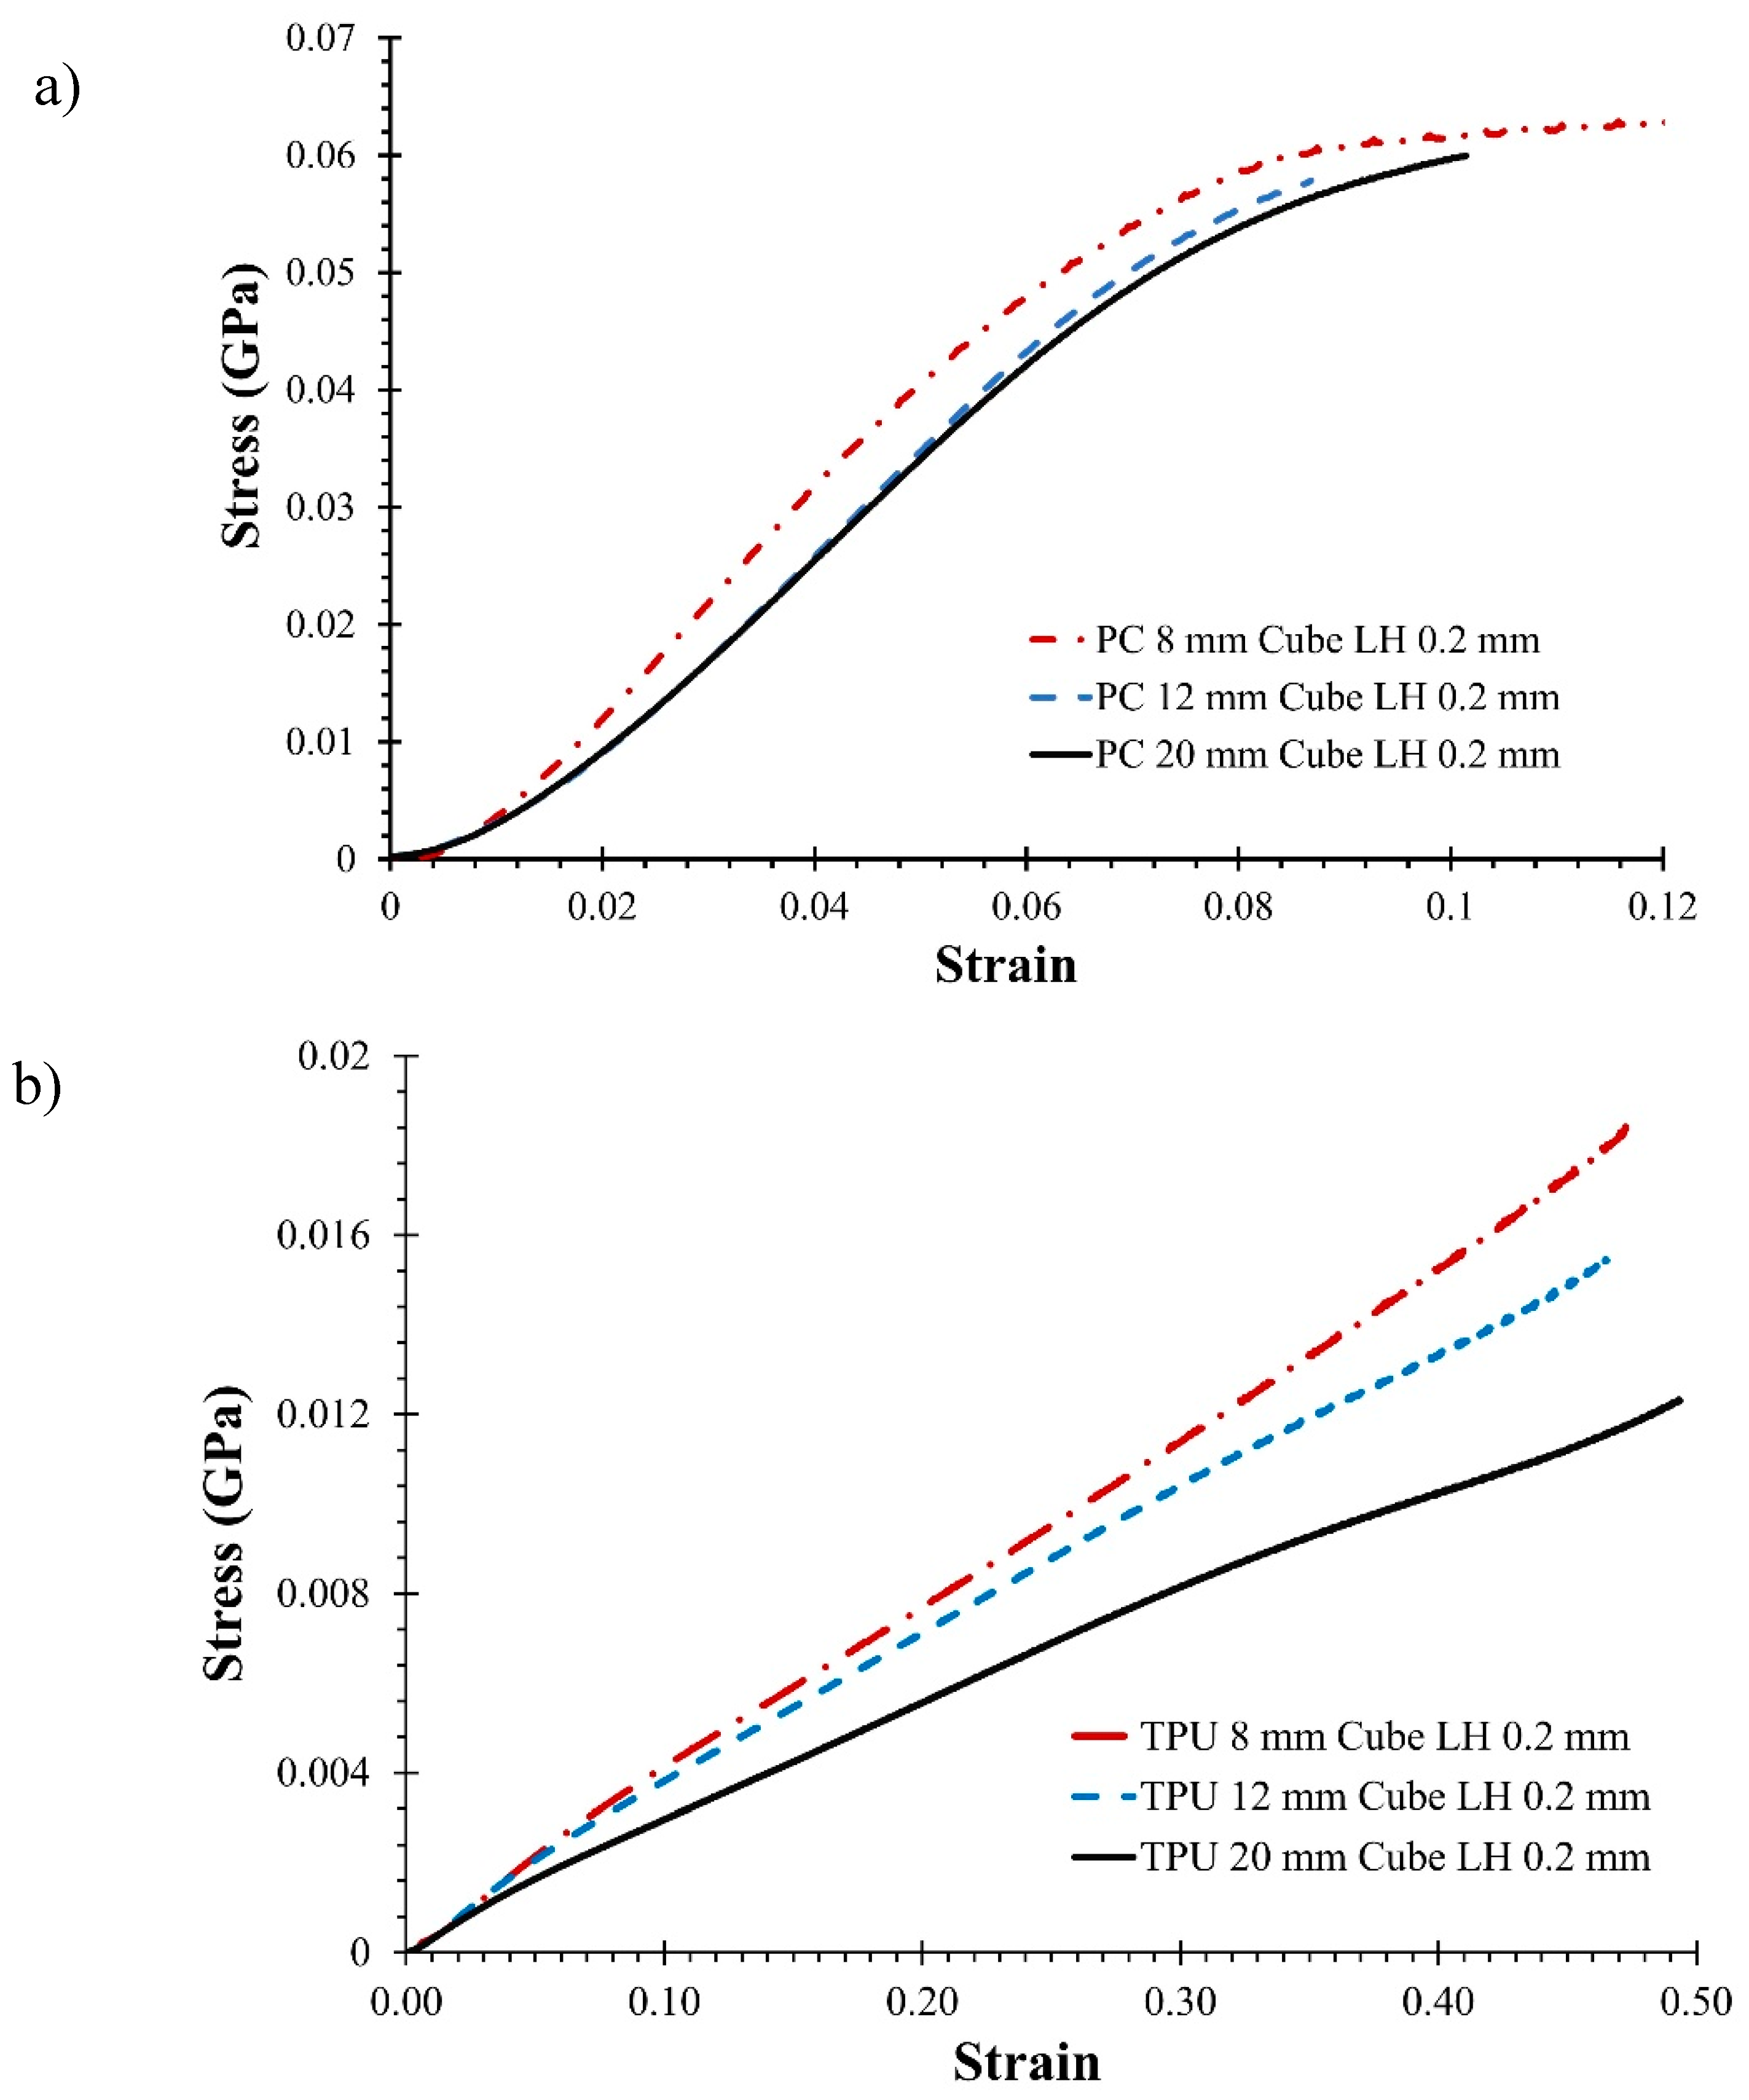
Figure 3 shows the stress-strain curves for TPU and PC for different sample sizes printed at 0.2 mm LH.
3. Results
3.1. Micro-CT Image Analysis
Micro-CT images were studied to identify variations in the mesostructure and voids formed in the samples. As discussed in
Section 1, three types of defects were observed: voids caused by abrupt changes in the printing direction, insufficient sintering, and lack of fusion between layers. Lack of fusion between layers was rarely observed in samples made from PC but was frequently noticed in the TPU samples. Voids formed due to abrupt changes in print direction tend to stack across different layer heights, creating a long continuous ‘chimney'-like structure. These defects are shown in
Figure 4.
Of the three types of defects, the majority of voids were formed due to insufficient sintering between the beads. These voids were observed between the two deposited beads along the raster angle and had a consistent cross-section along the raster angle. However, the cross-section of the voids could vary in the print direction. Smaller voids were typically found near the print bed, whereas voids with larger cross-sections were observed at the top of the samples. This variation in the cross-section was more pronounced in larger samples and samples with larger void sizes (TPU).
Furthermore, the voids resulting from inadequate sintering were not interconnected in the PC, whereas they formed a connected network in TPU. This behavior was because, due to high elasticity, the heated TPU squeezes and stretches along the raster angle when pushed through the nozzle, resulting in shrinkage of the deposited bead width when compared with the specified value[
32]. As a result, the printer must be carefully calibrated to compensate for this effect. The volume fraction of the voids observed in the PC samples was between 6\% and 8\%. In contrast, the void volume fractions of the TPU samples were significantly higher, ranging from 26\% to 34\%. It should be noted that providing an exact void volume fraction for all samples was challenging because the value depends on the thresholding process. Therefore, a range is provided.
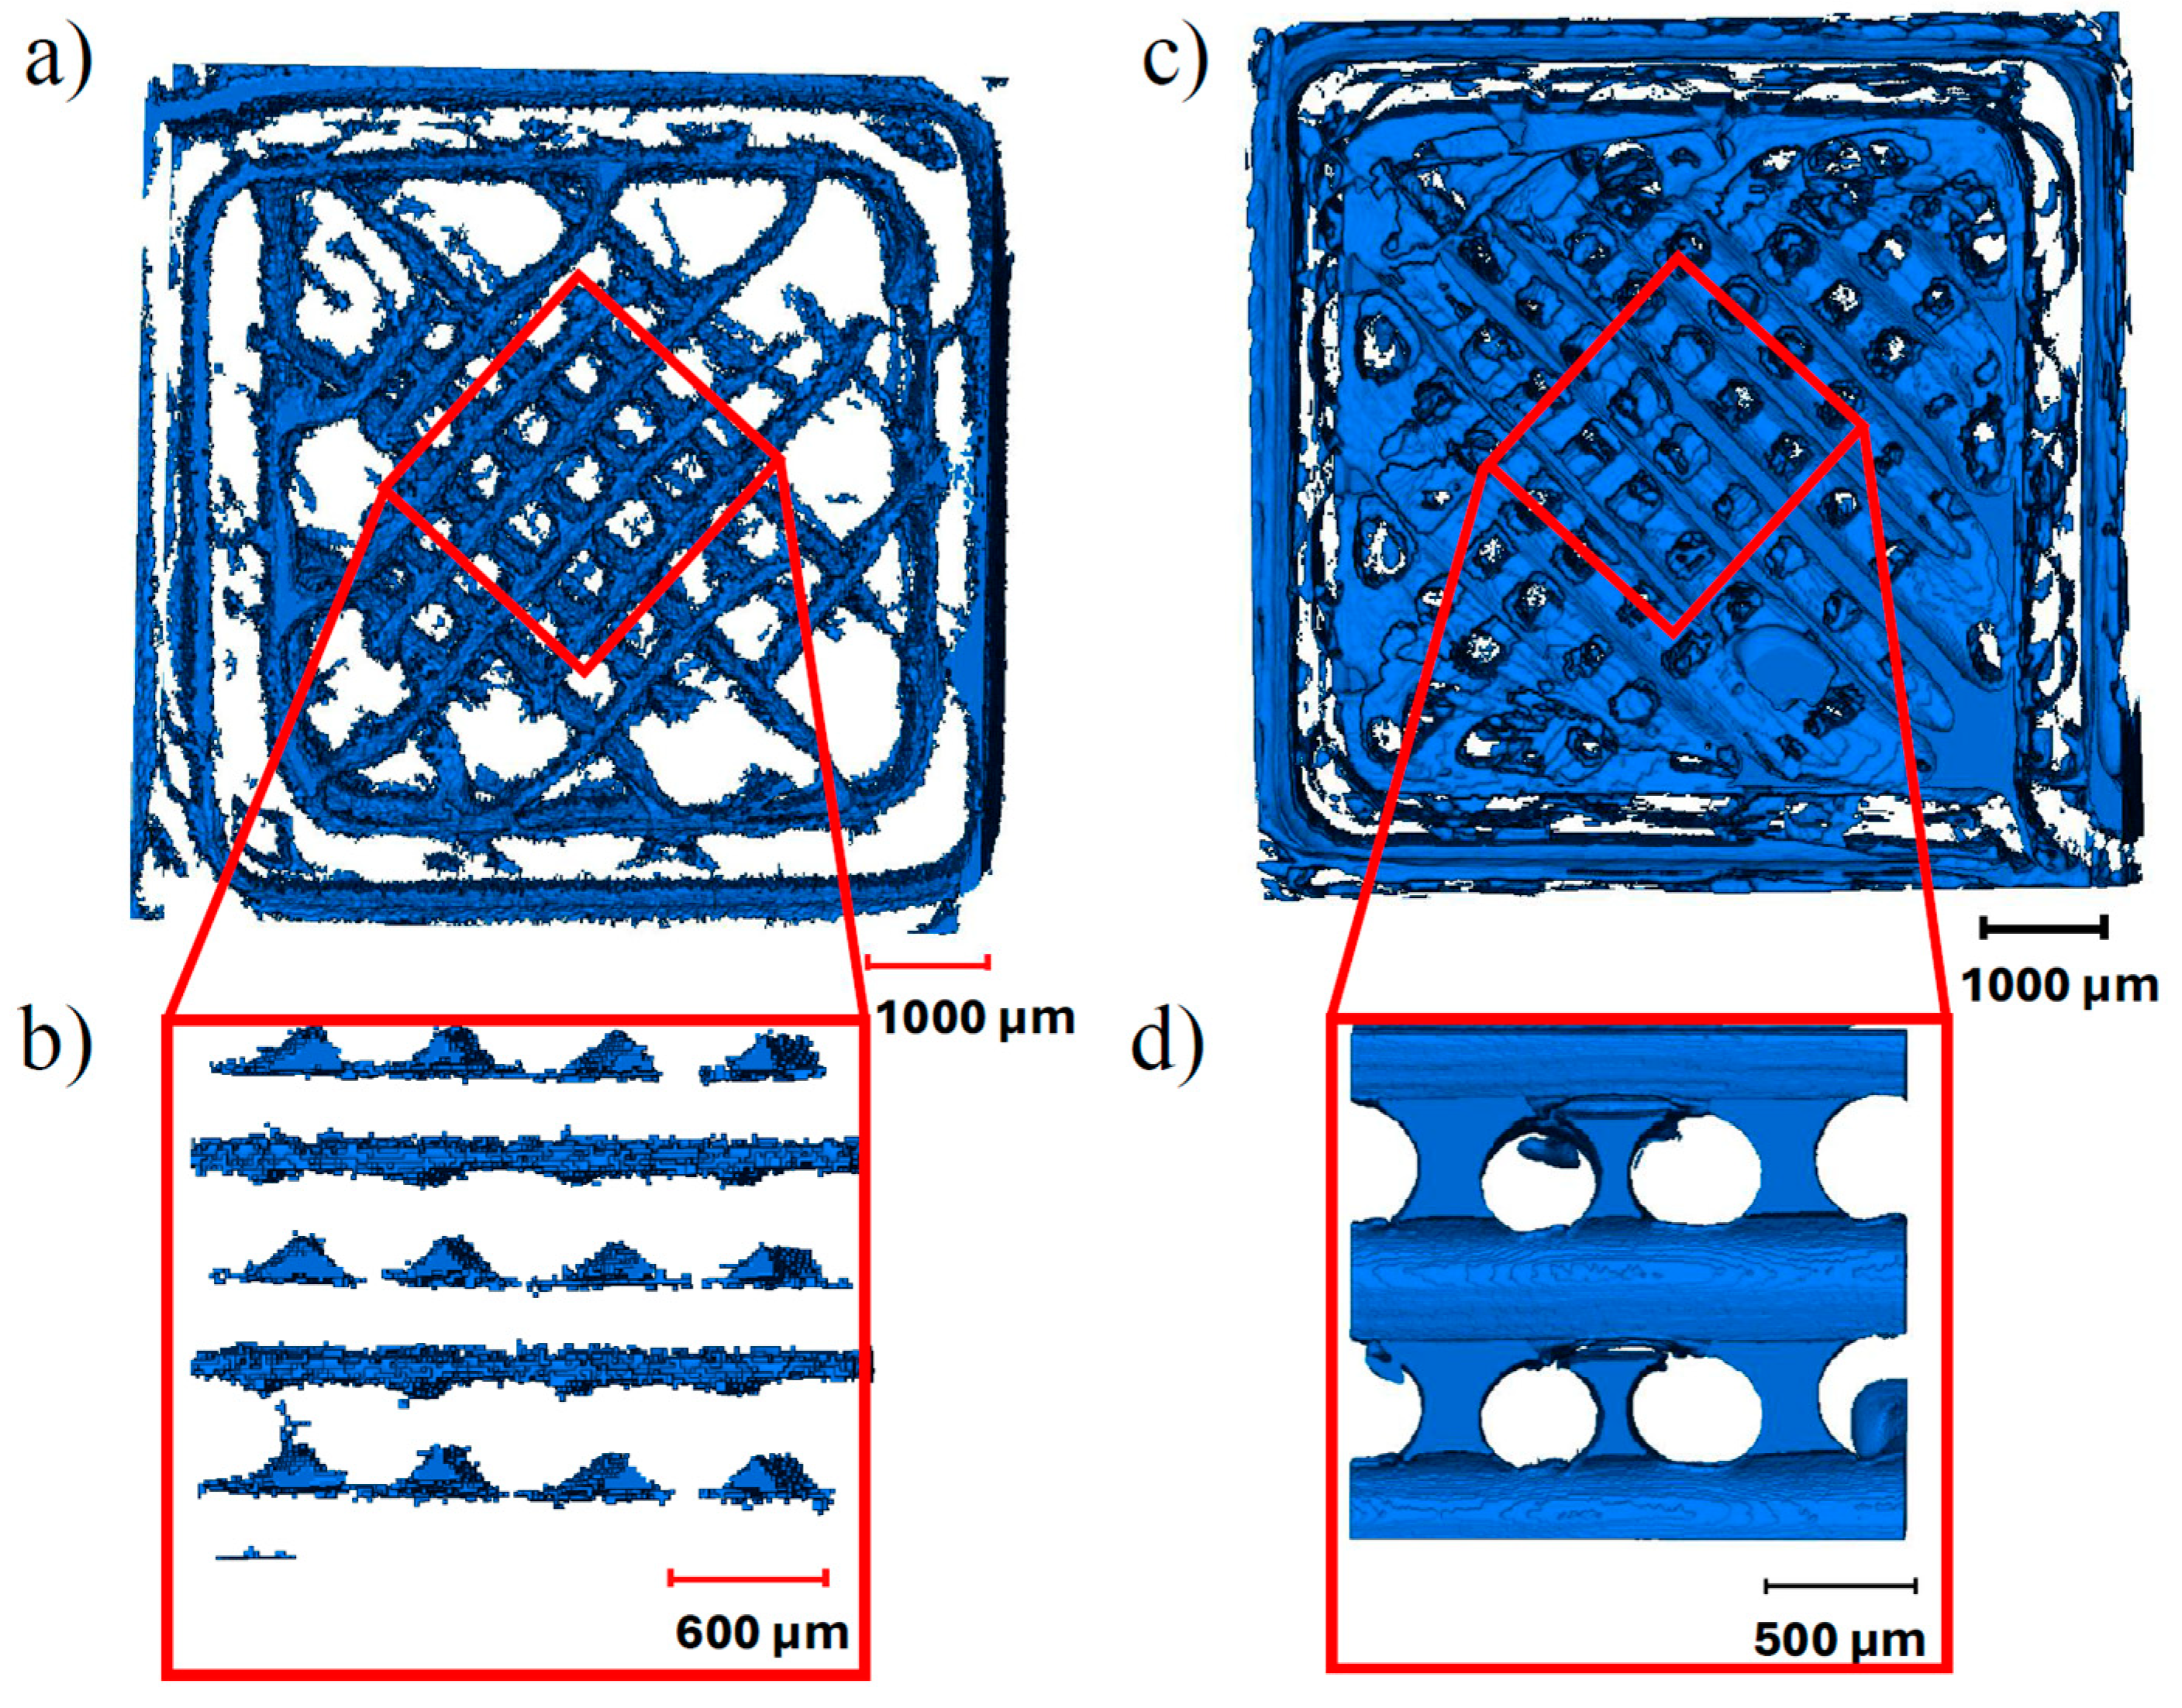
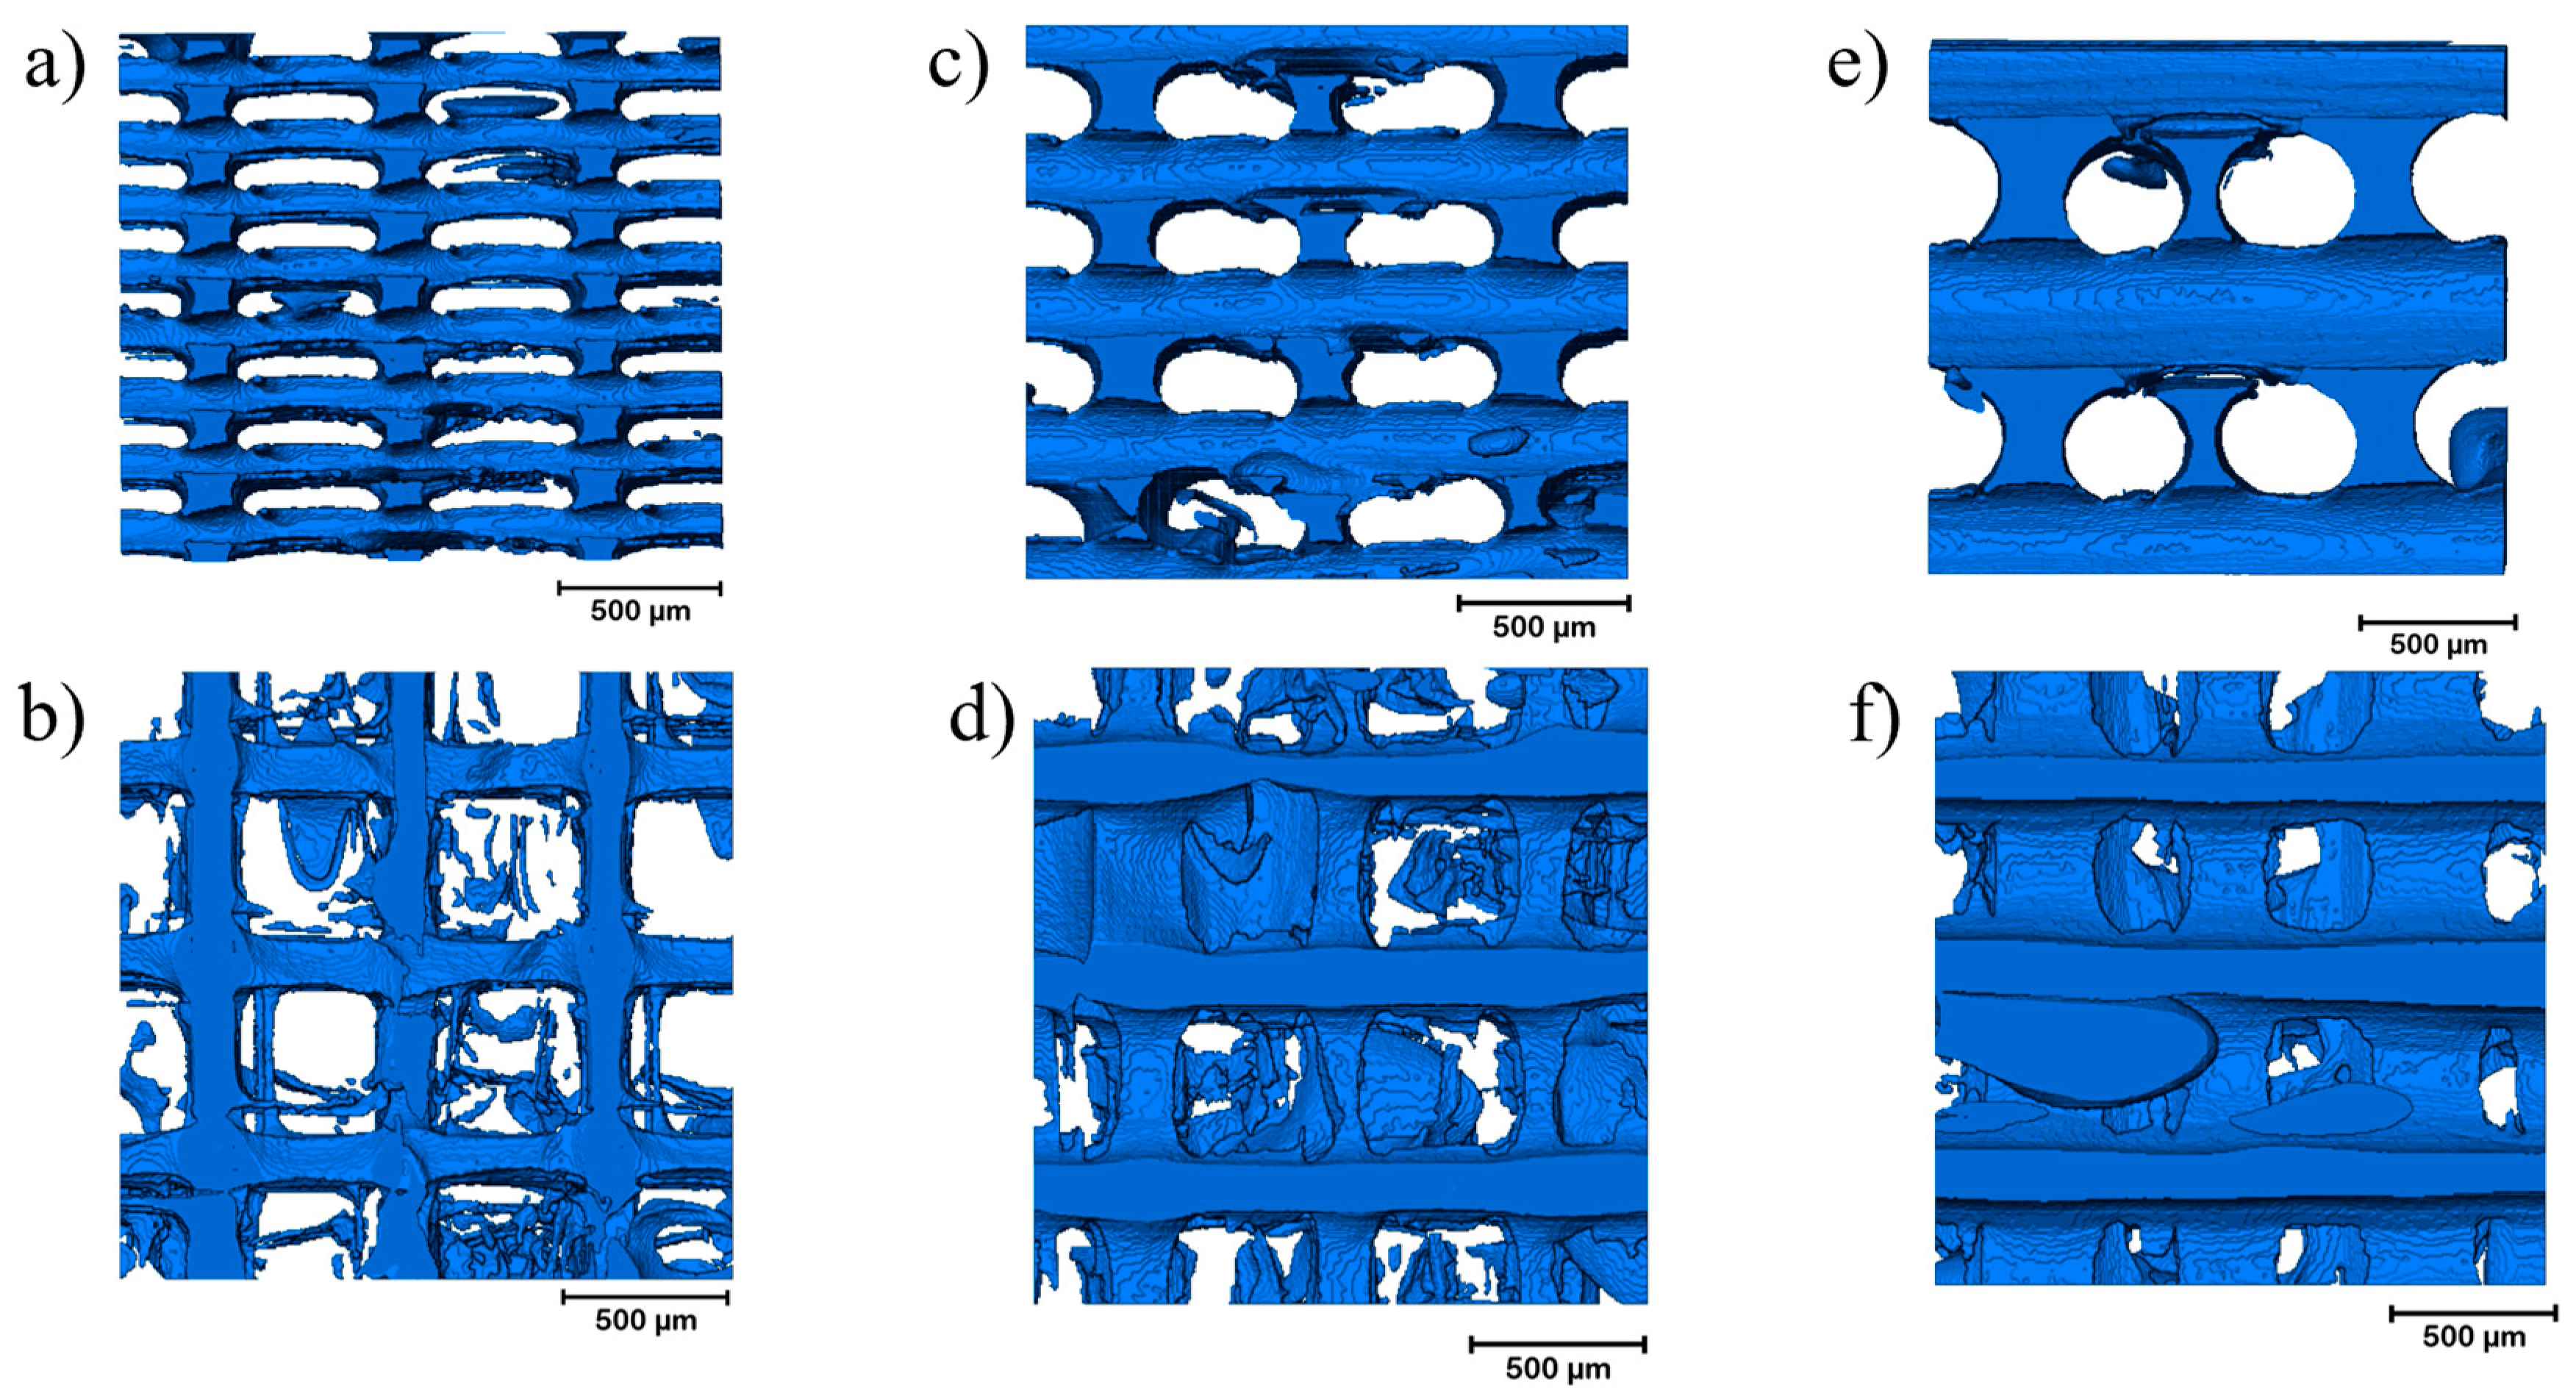
Smaller sections of the samples were cropped to study the effect of LH on the void size and connectivity. A lower LH resulted in voids with smaller cross-sections (
Figure 5). However, the frequency of voids along the printing direction increased because additional layers were required to print the same height.
Figure 5 compares the formation of voids across different LHs in the PC and TPU samples. As a result, the smallest void volume fraction was observed in samples with 0.2 mm LH compared to 0.1 mm and 0.4 mm LH.
3.2 Modulus and Specific Energy Absorption
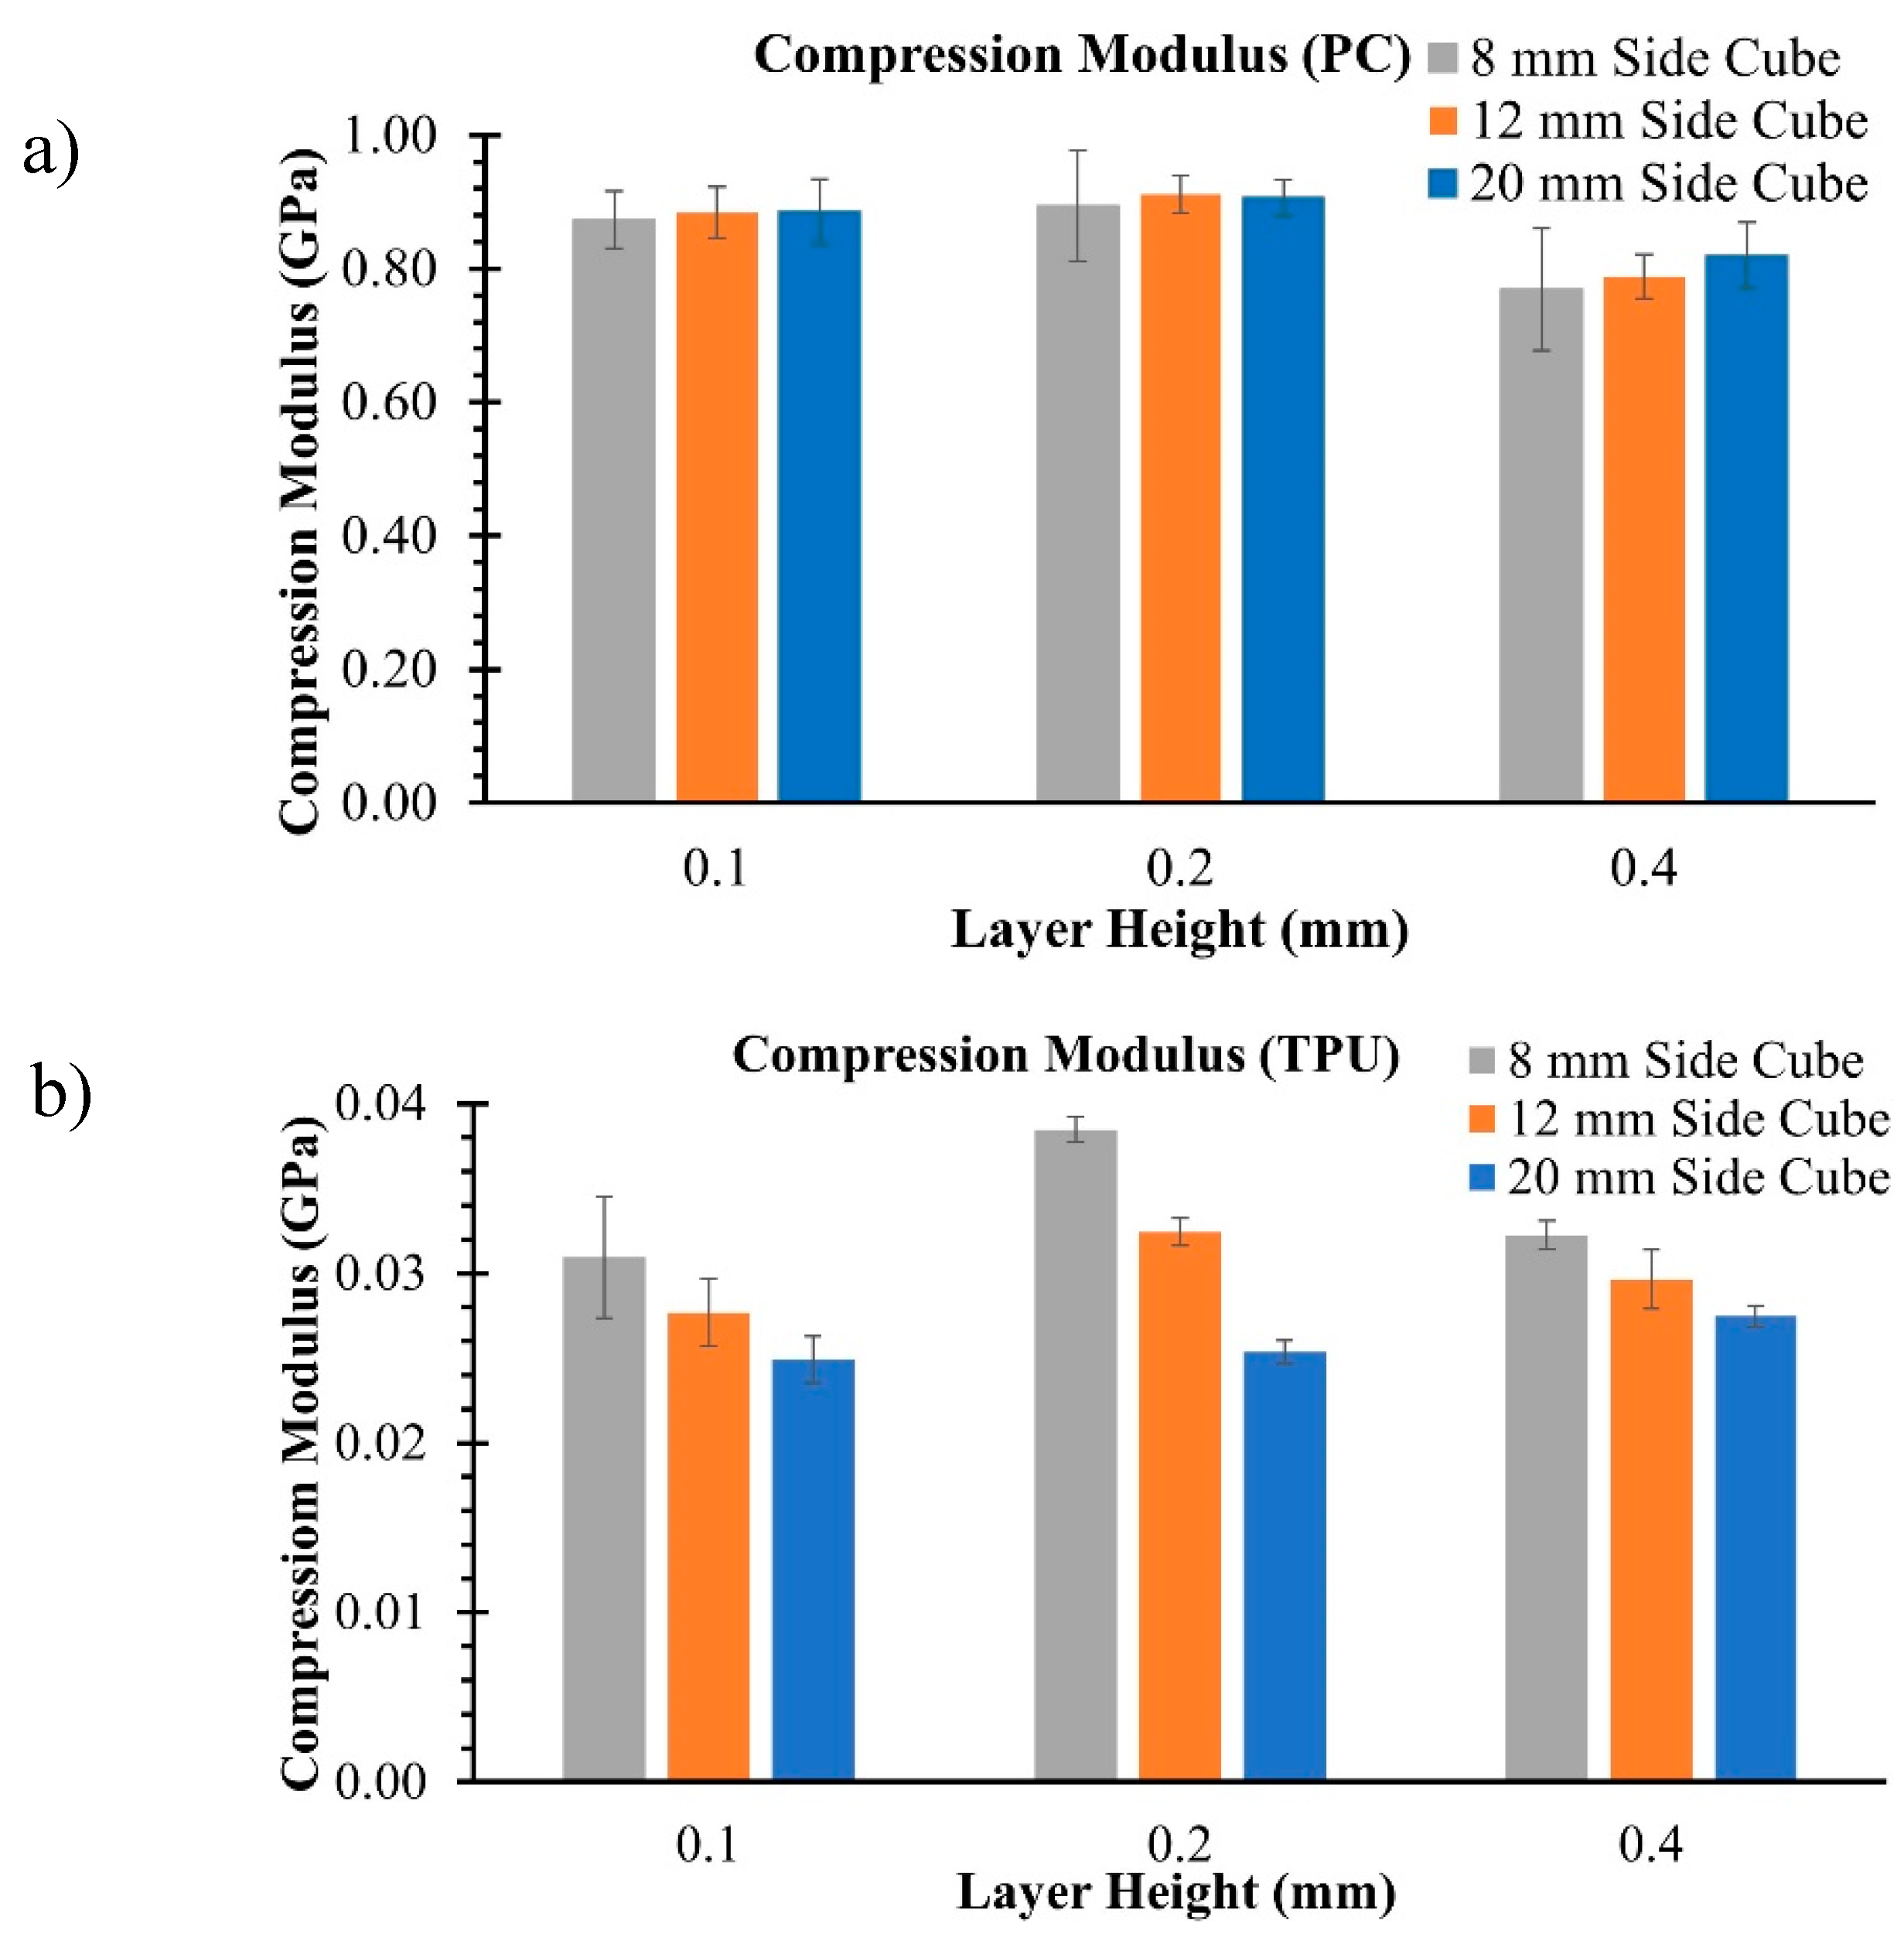
The compression modulus was calculated for the PC and TPU samples along the print direction from the linear region of the stress-strain curve.
Figure 6 compares the results. For the PC, the mean compression modulus did not vary significantly with sample size for the 0.1 mm and 0.2 mm LH, but it did vary for the 0.4 mm LH. In contrast, the compression modulus decreased with an increase in the sample size for TPU. Maximum compression modulus was observed for LH of 0.2 mm when the sample size was kept constant for both PC and TPU.
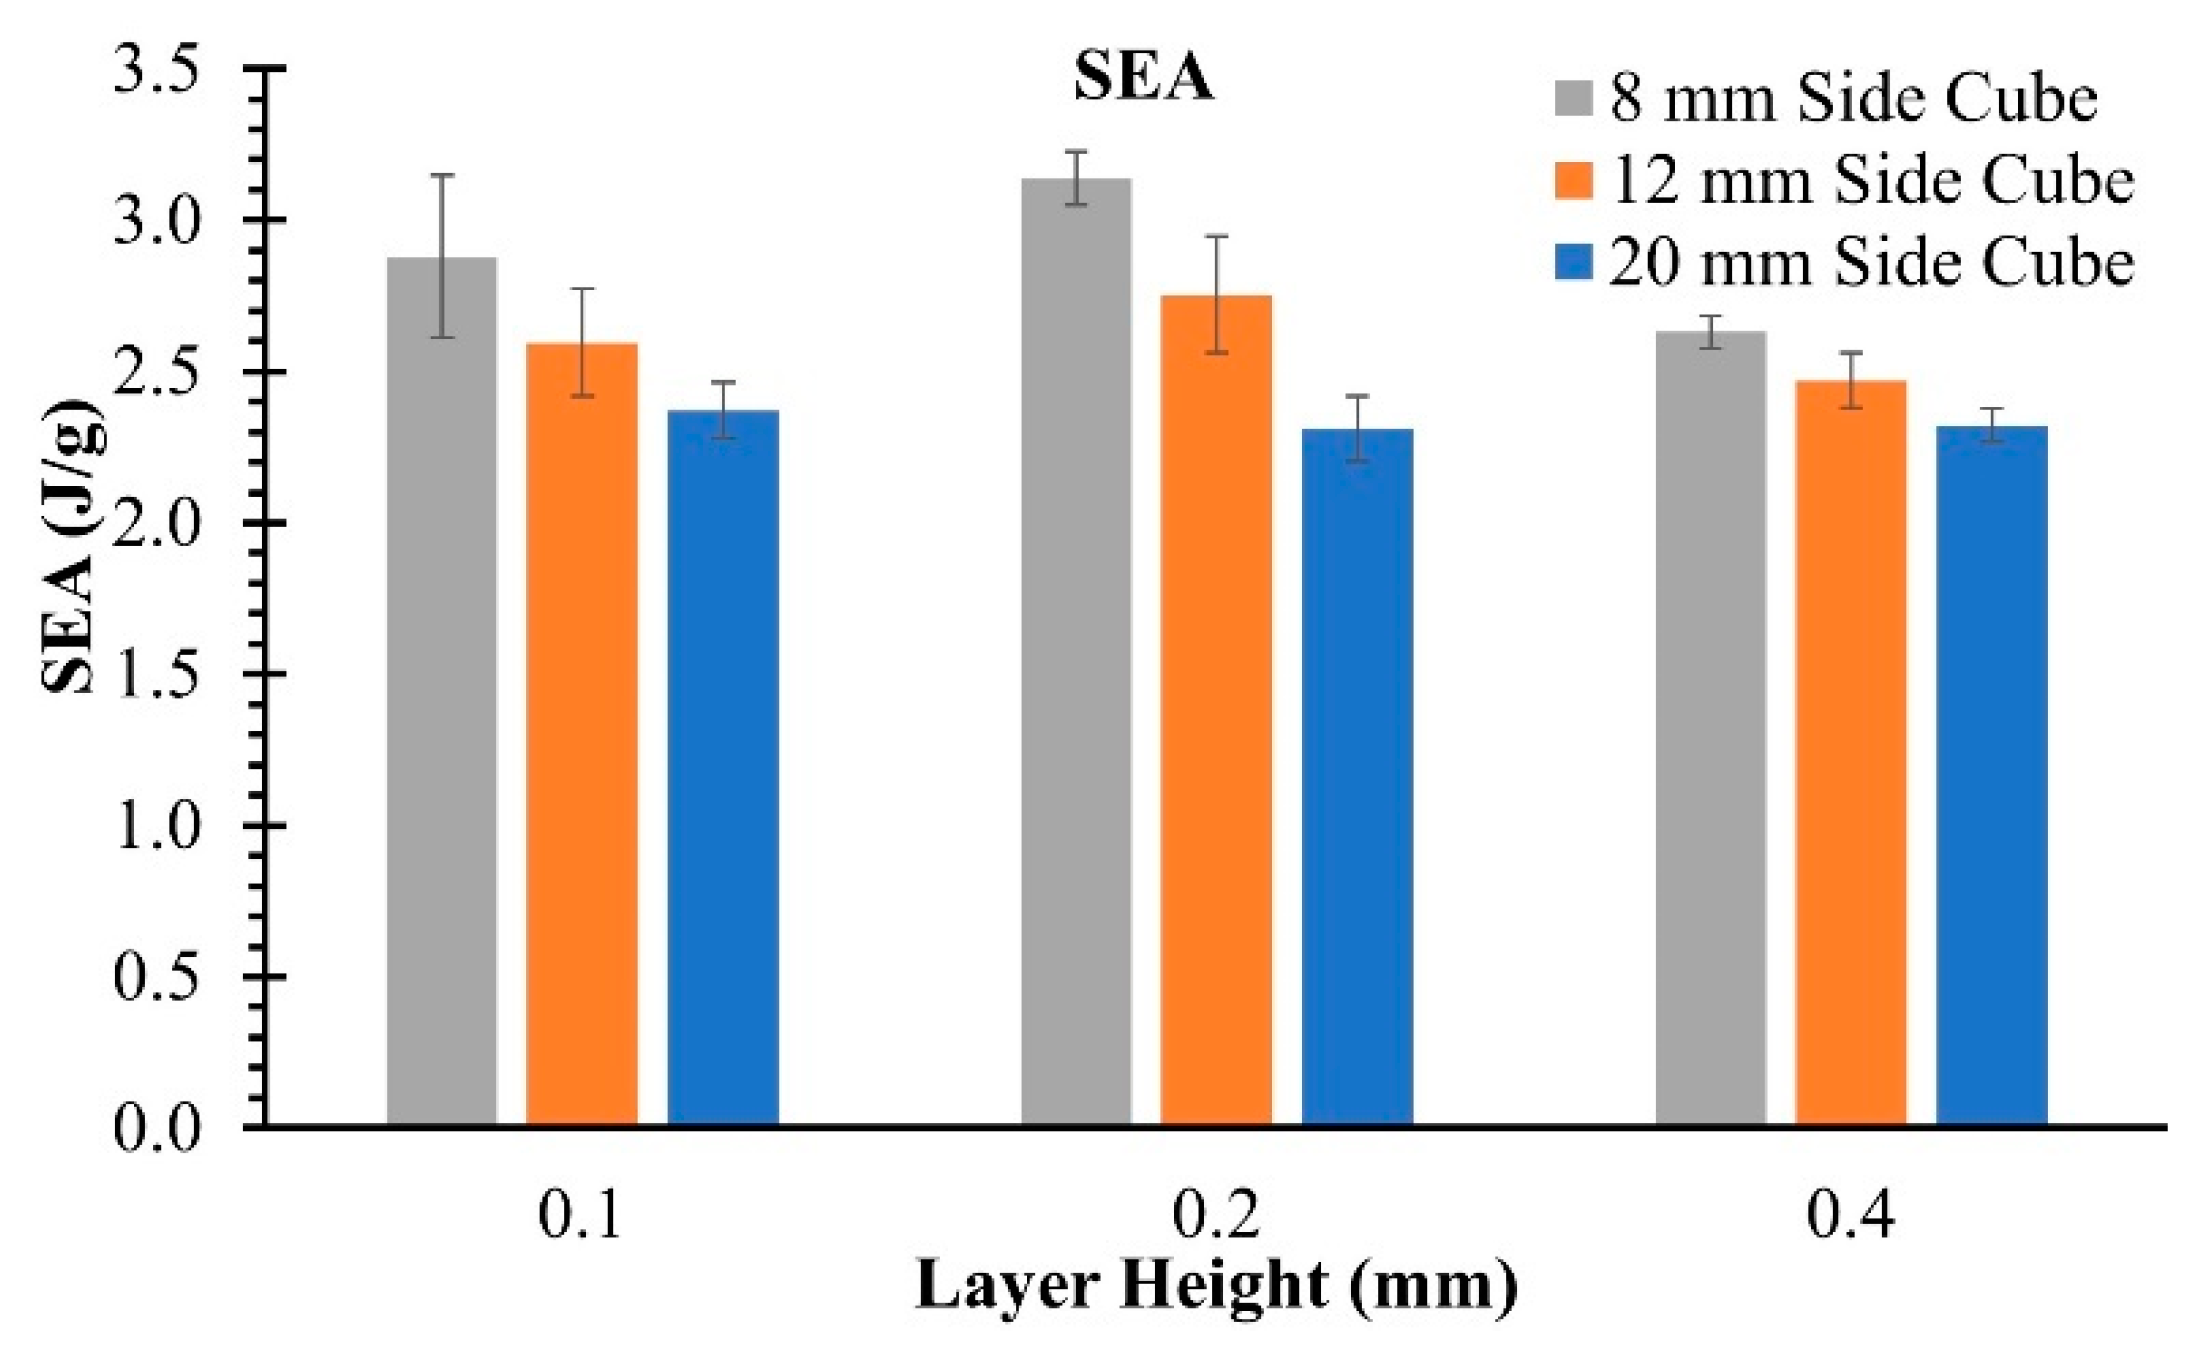
While comparing the stress-strain curves, nonlinearity was observed at small strains across all samples. The initial nonlinearity region was smaller in the PC than in the TPU. Because significant nonlinearity was observed in TPU, the specific energy absorption (SEA), as defined in Equation 2, was also calculated up to 40\% strain.
Figure 7 compares the SEA of the TPU samples. A similar SEA trend was observed in the compression modulus.
4. Discussion
The significance of layer height and sample size on compressive elastic moduli was further investigated using analysis of variance (ANOVA). Minitab software was employed to perform the ANOVA. Before conducting the ANOVA, an Anderson-Darling test was administered to assess the normality of the data. The results of the test revealed that while the compression modulus for PC was normally distributed, the compression modulus of TPU was not. Consequently, a Box–Cox transformation was applied to perform the ANOVA for TPU. The results of the ANOVA for PC and TPU are presented in
Table 2 and
Table 3, respectively. The p-values obtained from the ANOVA (
Table 2 and
Table 3) suggest that the layer height and sample size significantly influence the elastic moduli of TPU samples. However, only LH demonstrated a statistically significant impact on the elastic moduli of the PC.
Size effects are evident in TPU due to its substantial void volume fraction and low elastic modulus. When subjected to compression, the deposited material initially deformed to fill the voids before transferring the loads, resulting in noticeable nonlinearity at low strains (less than 10% strain for TPU). The moduli of the smaller TPU samples were higher due to their lower void volume fraction and higher density. Variations in void volume fraction across sample sizes were observed due to inconsistent thermal gradients across the samples. Thermal gradient in FFF can be controlled using printing parameters like print speed, print temperature, and print bed temperature. Reduced print speed and higher bed temperature can reduce the thermal gradient, promoting sintering between the deposited beads[
10,
33,
34,
35,
36,
37].
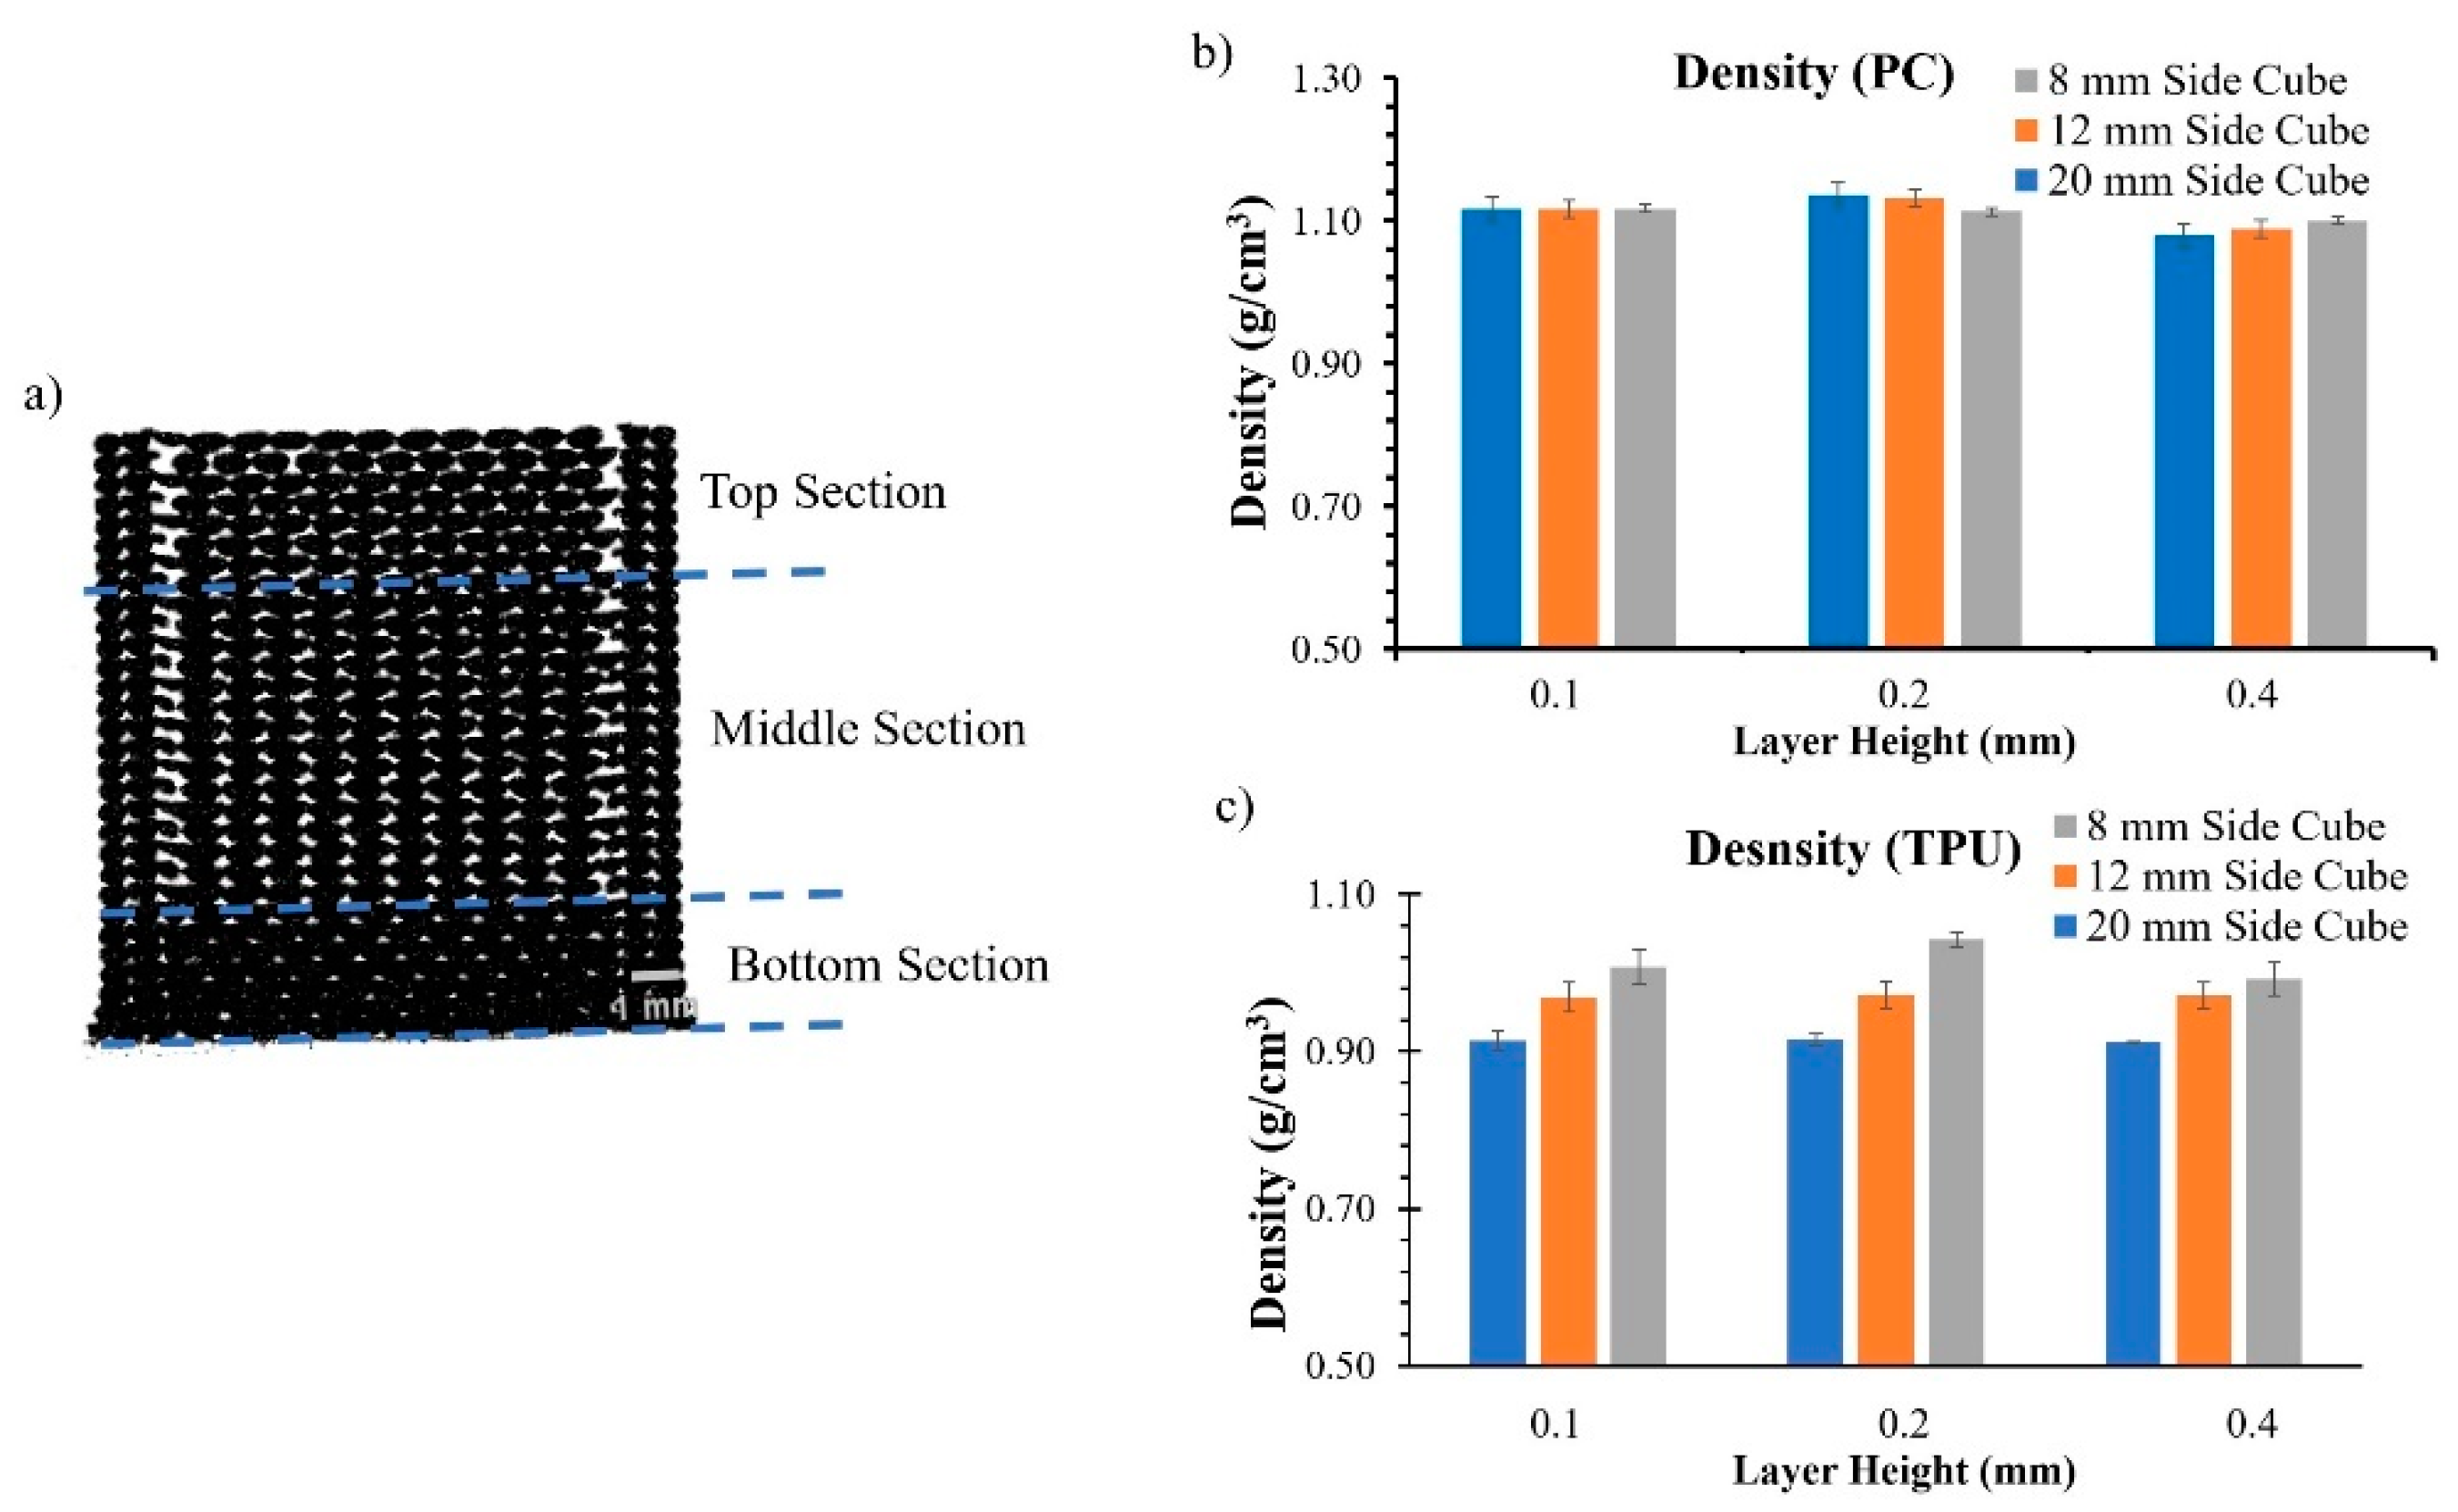
Due to variations in the thermal gradient, a sample can be divided into three distinct sections: the bottom, middle, and top (see
Figure 8a). The distinction between the three sections is more prominent in taller samples. The bottom section is closest to the print bed. The material in this section undergoes slow cooling rates due to the heated print bed, leading to higher sintered areas and denser sections. In the middle section, the effect of the heat supplied by the print bed reduces due to a considerable distance from the heat source. The cooling rate in the middle section is determined by printing parameters such as print temperature, print speed, and ambient temperature. The beads deposited in this section experience repeated heating and cooling cycles due to multiple layers being added above them. The polymers deposited in the top section had a similar cooling rate. However, the material deposited in this section experienced fewer repeated heating and cooling cycles because of the limited amount of material deposited on top, resulting in a smaller wetted area and higher void fraction.
The variation in densities among the three sections is more pronounced in materials with larger voids, such as TPU, than in materials like PC. As a result, higher density was observed in smaller TPU samples (e.g., cubes with 8 mm sides) than in larger samples (e.g., cubes with 20 mm sides). The densities of the PC and TPU samples are shown in Figures 8b and 8c, respectively. Higher densities indicate low void volume fraction, leading to an increased compression modulus. Due to significant size effects observed in TPU, variation in mechanical properties due to the sample size should be taken into account during the design process.
The current study investigated the compression modulus variations along the print direction, focusing on the size effect. Further research could explore size effects perpendicular to the print direction and for various infill densities. The size effects in these cases may differ due to the anisotropic nature of the printed material and the variations in void volume fraction. However, these factors were not addressed in the present study.
5. Conclusions
Cubic samples with varying dimensions and layer heights were printed using filaments made of PC and TPU. The internal structures and defects present in the samples were analyzed using micro-CT. The study revealed the presence of three primary types of defects in the samples due to abrupt changes in the print direction, lack of bonding between filaments, and voids resulting from the non-rectangular cross-section of the deposited filaments. The voids observed in the PC samples were aligned with the raster angle and did not connect across layers. On the other hand, voids in TPU formed an interconnected network spanning across layers. The print direction affected the frequency and cross-section of the voids observed in the samples. Samples printed at larger layer heights (LH) had fewer voids, but the present voids had a larger cross-section.
Conversely, owing to the increased number of layers, smaller LH samples had a higher number of voids, leading to a trade-off between the number of voids and void volume fraction. The presence of voids directly affected the equivalent density of the material. As a result, samples printed at 0.2 mm LH had the highest density compared to 0.1 mm and 0.4 mm LH. The samples with a higher density demonstrated a higher compression modulus. Although LH was determined to be a statistically significant factor for both PC and TPU, the size effects were not consistently observed. While changing size did not have a statistically significant impact on the compression modulus for the PC samples, smaller samples exhibited a larger compression modulus for TPU. The significant size effect observed in TPU can be attributed to the higher void volume fraction present in TPU samples. Variations in mechanical properties due to size effects should be considered during the design process to predict the behavior of the manufactured part accurately. In addition, part of the component most susceptible to failure or subjected to higher loadings should be printed near the print bed if possible due to the lower void volume fraction and higher modulus experienced while depositing material closer to the heated print bed.
Author Contributions
Conceptualization, Charul Chadha; Formal analysis, Charul Chadha; Funding acquisition, Iwona Jasiuk; Investigation, Charul Chadha, Gabriel Olaivar, Mahmoud Mahrous and Albert Patterson; Methodology, Charul Chadha and Gabriel Olaivar; Supervision, Iwona Jasiuk; Writing – original draft, Charul Chadha and Mahmoud Mahrous; Writing – review & editing, Iwona Jasiuk and Albert Patterson.
Funding
We acknowledge the funding from the National Science Foundation grant No. MOMS-1926353.
Data Availability Statement
Data is available upon reasonable request from the corresponding author.
Conflicts of Interest
The authors declare no conflict of interest.
Acknowledgments
We want to acknowledge the Materials Research Laboratory and Beckman Institute at the University of Illinois at Urbana-Champaign. The mechanical testing was carried out in part in the Materials Research Laboratory, and micro-CT imaging was carried out using equipment at the Beckman Institute.
References
- Srivatsan TS, Sudarshan TS. Additive Manufacturing. (Srivatsan TS, Sudarshan TS, eds.). CRC Press; 2015. [CrossRef]
- Chadha C, James K, Jasiuk IM, Patterson AE. Extending the Operating Life of Thermoplastic Components via On-Demand Patching and Repair Using Fused Filament Fabrication. J Manuf Mater Process. 2022;6(5):103. [CrossRef]
- Ceruti A, Marzocca P, Liverani A, Bil C. Maintenance in aeronautics in an Industry 4.0 context: The role of Augmented Reality and Additive Manufacturing. J Comput Des Eng. 2019;6(4):516-526. [CrossRef]
- Haryńska A, Carayon I, Kosmela P, et al. A comprehensive evaluation of flexible FDM/FFF 3D printing filament as a potential material in medical application. Eur Polym J. 2020;138:109958. [CrossRef]
- Volpe S, Petrella A, Sangiorgio V, Notarnicola M, Fiorito F. Preparation and characterization of novel environmentally sustainable mortars based on magnesium potassium phosphate cement for additive manufacturing. AIMS Mater Sci. 2021;8(4):640-658. [CrossRef]
- Patterson AE, Chadha C, Jasiuk IM. Identification and Mapping of Manufacturability Constraints for Extrusion-Based Additive Manufacturing. J Manuf Mater Process 2021, Vol 5, Page 33. 2021;5(2):33. [CrossRef]
- Garzon-Hernandez S, Garcia-Gonzalez D, Jérusalem A, Arias A. Design of FDM 3D printed polymers: An experimental-modelling methodology for the prediction of mechanical properties. Mater Des. 2020;188:108414. [CrossRef]
- Akhoundi B, Behravesh AH. Effect of filling pattern on the tensile and flexural mechanical properties of FDM 3D printed products. Exp Mech. 2019;59(6):883-897. [CrossRef]
- Sun Q, Rizvi GM, Bellehumeur CT, Gu P. Effect of processing conditions on the bonding quality of FDM polymer filaments. Rapid Prototyp J. 2008;14(2). [CrossRef]
- Bellehumeur C, Li L, Sun Q, Gu P. Modeling of bond formation between polymer filaments in the fused deposition modeling process. J Manuf Process. 2004;6(2):170-178. [CrossRef]
- Polyzos E, Hemelrijck D Van, Pyl L. Influence of void contour on the elastic behavior of parts produced by material extrusion. Addit Manuf. 2022;59:103138. [CrossRef]
- Li B, Zhao M, Wan X. The influence of void distribution on transverse mechanical properties of unidirectional composites. In: 2017 8th International Conference on Mechanical and Aerospace Engineering (ICMAE). IEEE; 2017:209-214. [CrossRef]
- Guessasma S, Belhabib S, Nouri H. Significance of pore percolation to drive anisotropic effects of 3D printed polymers revealed with X-ray μ-tomography and finite element computation. Polymer (Guildf). 2015;81:29-36. [CrossRef]
- Hernandez-Contreras A, Ruiz-Huerta L, Caballero-Ruiz A, Moock V, Siller HR. Extended CT void analysis in FDM additive manufacturing components. Materials (Basel). 2020;13(17):3831. [CrossRef]
- Wang, Zhao, Fuh, Lee. Effect of porosity on mechanical properties of 3D printed polymers: Experiments and micromechanical modeling based on x-ray computed tomography analysis. Polymers (Basel). 2019;11(7):1154. [CrossRef]
- Paux J, Ginoux G, Pulickan S, Allaoui S. Influence of printing irregularities on the elastic behavior and mesostructural stress concentrations in material extrusion additive manufacturing—A numerical approach based on X-ray tomography. Addit Manuf. 2023;76:103760. [CrossRef]
- Tagscherer N, Schromm T, Drechsler K. Foundational investigation on the characterization of porosity and fiber orientation using X-CT in large-scale extrusion additive manufacturing. Materials (Basel). 2022;15(6):2290. [CrossRef]
- Rajpurohit SR, Dave HK. Effect of process parameters on tensile strength of FDM printed PLA part. Rapid Prototyp J. 2018;24(8):1317-1324. [CrossRef]
- Fang L, Yan Y, Agarwal O, Seppala JE, Hemker KJ, Kang SH. Processing-structure-property relationships of bisphenol-A-polycarbonate samples prepared by fused filament fabrication. Addit Manuf. 2020;35:101285. [CrossRef]
- Lei M, Wang Y, Wei Q, Li M, Zhang J, Wang Y. Micromechanical modeling and numerical homogenization calculation of effective stiffness of 3D printing PLA/CF composites. J Manuf Process. 2023;102:37-49. [CrossRef]
- Sheikh T, Behdinan K. Geometric void-multiscale model for evaluating the effect of bead width and layer height on voids in FDM parts. Rapid Prototyp J. 2023;29(8):1565-1579. [CrossRef]
- Biswas P, Guessasma S, Li J. Numerical prediction of orthotropic elastic properties of 3D-printed materials using micro-CT and representative volume element. Acta Mech. 2020;231(2):503-516. [CrossRef]
- Yao T, Ouyang H, Dai S, Deng Z, Zhang K. Effects of manufacturing micro-structure on vibration of FFF 3D printing plates: Material characterisation, numerical analysis and experimental study. Compos Struct. 2021;268:113970. [CrossRef]
- Nouri H, Guessasma S, Belhabib S. Structural imperfections in additive manufacturing perceived from the X-ray micro-tomography perspective. J Mater Process Technol. 2016;234:113-124. [CrossRef]
- Zouaoui M, Gardan J, Lafon P, Makke A, Labergere C, Recho N. A Finite element method to predict the mechanical behavior of a pre-structured material manufactured by fused filament fabrication in 3D printing. Appl Sci. 2021;11(11):5075. [CrossRef]
- Zhang Y, Choi JP, Moon SK. Effect of geometry on the mechanical response of additively manufactured polymer. Polym Test. 2021;100:107245. [CrossRef]
- He J, Kushwaha S, Mahrous MA, Abueidda D, Faierson E, Jasiuk I. Size-dependence of AM Ti–6Al–4V: Experimental characterization and applications in thin-walled structures simulations. Thin-Walled Struct. 2023;187:110722. [CrossRef]
- Cui H, Hensleigh R, Chen H, Zheng X. Additive Manufacturing and size-dependent mechanical properties of three-dimensional microarchitected, high-temperature ceramic metamaterials. J Mater Res. 2018;33(3):360-371. [CrossRef]
- Fotovvati B, Asadi E. Size effects on geometrical accuracy for additive manufacturing of Ti-6Al-4V ELI parts. Int J Adv Manuf Technol. 2019;104(5-8):2951-2959. [CrossRef]
- Jia H, Sun H, Wang H, Wu Y, Wang H. Size effect in selective laser melting additive manufacturing of 700 mm large component. J Manuf Process. 2022;75:125-137. [CrossRef]
- Mahrous MA, Chadha C, Robins PL, et al. Multimodule imaging of the hierarchical equine hoof wall porosity and structure. J Mater Res Technol. 2023;26:5535-5548. [CrossRef]
- Lin X, Gao J, Wang J, et al. Desktop printing of 3D thermoplastic polyurethane parts with enhanced mechanical performance using filaments with varying stiffness. Addit Manuf. 2021;47:102267. [CrossRef]
- Li L, Sun Q, Bellehumeur C, Gu P. Investigation of Bond Formation in FDM Process. In: Solid Freeform Fabrication Symposiun. ; 2001:1-8.
- Coogan TJ, Kazmer DO. Prediction of interlayer strength in material extrusion additive manufacturing. Addit Manuf. 2020;35. [CrossRef]
- Seppala JE, Hoon Han S, Hillgartner KE, Davis CS, Migler KB. Weld formation during material extrusion additive manufacturing. Soft Matter. 2017;13(38). [CrossRef]
- Bhalodi D, Zalavadiya K, Gurrala PK. Influence of temperature on polymer parts manufactured by fused deposition modeling process. J Brazilian Soc Mech Sci Eng. 2019;41(3). [CrossRef]
- Polychronopoulos ND, Vlachopoulos J. The role of heating and cooling in viscous sintering of pairs of spheres and pairs of cylinders. Rapid Prototyp J. 2020;26(4):719-726. [CrossRef]
|
Disclaimer/Publisher’s Note: The statements, opinions and data contained in all publications are solely those of the individual author(s) and contributor(s) and not of MDPI and/or the editor(s). MDPI and/or the editor(s) disclaim responsibility for any injury to people or property resulting from any ideas, methods, instructions or products referred to in the content. |
© 2024 by the authors. Licensee MDPI, Basel, Switzerland. This article is an open access article distributed under the terms and conditions of the Creative Commons Attribution (CC BY) license (http://creativecommons.org/licenses/by/4.0/).
