Preprint
Article

The Evolution and Impact of Glacier Avalanches in Tibet Based on the Sentinel-2 Time-Series Images

Altmetrics

Downloads

170

Views

100

Comments

0

This version is not peer-reviewed

Submitted:

25 April 2024

Posted:

25 April 2024

You are already at the latest version

Alerts
Abstract
Catastrophic mass flows originating from the high mountain cryosphere often cause hazard cascades. With increasing human activities in the alpine region and the sensitivity of glaciers, snow and permafrost to climate warming, the cryospheric hazard risks tend to be more active in the Tibetan Plateau(TP). The remoteness and inaccessibility of high mountain regions make the remote sensing technology the most effective approach for monitoring and investigating the cryospheric hazards. Exploring the evolution process and impact of ice avalanches and subsequent hazards are crucial to understand drivers and nature of mass flow process chain in order to prevent and mitigate potential hazard consequences. In this study, the glacier and ice-rock avalanches occurred in Arutso and Sedongpu basins in Tibet were investigated on the basis of Sentinel-2 time-series images and in-situ investigation, the evolution process of these events were reconstructed, and impacts and driving factors were analyzed. The massive Chamoli rock-ice avalanche occurred in February 2021 in the western Himalayas was also reviewed using using same methods. The study shows that Arutso glacier No. 53 (Arutso-53) avalanche completely melted away in July 2018 after two years from occurrence to final disappearance, while Arutso glacier No. 50 (Arutso-50) avalanche completely melted by the end of August 2023 after lasting for seven years. Four large-scale ice-rock avalanche and debris flow events in the Sedongpu basin in 2017 and 2018 not only had significant impacts on the river flow, landscape and geomorphologic shape in the basin, but also caused serious disasters in the basin and downstream. In March 2021, a small-scale ice-rock avalanche and debris flow event occurred again in the Sedongpu basin. The glacier and ice-rock avalanches occurred in Tibet area were mainly induced by climate warming, heavy precipitation and seismic activity, which acting on specific topographic and geomorphic structure of glacier properties in the high mountain regions. Catastrophic hazard events originating from the high-elevation glacier and ice-rock collapses in the mountain cryosphere and subsequent hazard cascades in the TP and Himalayas highlight the importance of mountain hazard monitoring, early warning systems and sustainable mountain development.
Keywords: 
Subject: Environmental and Earth Sciences  -   Remote Sensing

1. Introduction

The increasing interaction between human activities and mountain cryosphere intensifies the risk of cryospheric hazards, including glacier avalanche, ice-rock collapse, glacier surging, avalanche and glacial lake outburst etc. The sensitivity of glaciers, snow and permafrost to climate warming is enhancing these mass movements and hazard cascades [1]. The steep slopes, high topographical setting and seismic activity make mountain regions prone to highly destructive mass movements [2,3,4]. The Tibetan Plateau (TP) and surrounding areas have the largest glacier resources on the world after two polar regions, which is often named “Third Pole of the World” [5,6]. The intense tectonic activities and high topographic relief have made the Tibetan Plateau highly vulnerable to mountain hazards. As an important part of Asian water tower [7,8,9,10], the glaciers on the TP and surroundings are of great significance for water resources, ecological security, and economic and social development in Asia, especially in the western China and Himalayan regions [11,12].With continuous warming of global climate and increasing of human activities, glaciers in the TP are undergoing rapid shrinking, which not only affects the water resources functioning of glaciers, but also enhance the glacier instability and related hazard risk [12,13,14,15,16].
Under global climate warming, the glaciers in the TP that used to be relatively stable have become unstable, and some of them are undergoing strong ablation and mass movement, which often bring about various glacier-related geohazards [12]. In 2016 and 2018, the large-scale glacier and ice-rock avalanches occurred in Ngari in the northwestern Tibet and Nyingchi in the southeastern Tibet successively. The continuous collapses of two different types of glaciers in Tibet area likely indicates that the glaciers in the TP are in an unstable state in general, and the potentials of related hazards tend to be increasing [11,12]. Glacial hazards occurred in the high-altitude mountains often induce secondary hazards, resulting in mountain hazard chain that starts from the cryosphere and then subsequently affecting lithosphere, hydrosphere, biosphere and anthroposphere, which extends and amplifies the consequences of hazard chains [15,17].
With rapid glacier melting and the increasing risk of cryospheric hazards in the high-mountain environment, timely and effective monitoring and understanding of the location, scale and dynamic changes of cryospheric hazards have become crucial for decision making on response measures in disaster prevention and mitigation. However, cryospheric hazards often occur in cold, remote and inaccessible mountain regions, where are generally underdeveloped, poor in infrastructure, weak in capability to resist and cope with natural hazards, so that it is difficult to be carried monitoring and investigating based on the conventional ground-based observations. For example, most of cryospheric hazards in the TP occurs in high mountain regions above 4000 m, making the remote sensing technology the most effective approach for monitoring and investigating cryospheric hazards. In particular, observation methods based on satellite remote sensing have been widely used in monitoring, emergency response and risk assessment of cryospheric hazards, such as glacier collapse, ice-rock avalanche, glacier surge and avalanches.
The geohazards occurred in the Sedongpu basin in the southeastern Tibet were analyzed through field investigation, multi-temporal remote sensing images and InSAR radar data, and results showed that material source of two disaster events in 2018 originated from one high-position rockfall and three high-position glacier collapses [18]. Chai et al. evaluated the risk of glacial lake outburst of Jialong Tso, Nyalam County, Tibet, using GF satellite data, Google Earth images, and numerical models, and results showed that glacier collapse and snow avalanche are important triggering factors for glacial lake outburst in the high mountain regions and there is high possibility of glacier collapse above Jialong Tso [19]. Tang et al. used Google Earth and high-resolution satellite images from GF-2 and ZY-3 to investigate the numbers, types, development and risks of potential glacier avalanches in the TP to provide scientific support and guideline for the hazard prevention and mitigation [20]. QuickBird satelite images were used to avalanche mapping, analysis of flow dynamics, and hazard assessment for Kolka glacier collapse in the Caucasus Mountains occurred in September 2002, as the largest glacier collapse event so far, with a volume of 130×106m3 and more than 130 people deaths [21]. Kääb et al. analyzed the Kolka glacier collapse and reconstructed its dynamic process using ASTER satellite images and digital elevation model extracted from ASTER data [22]. Based on the high-resolution satellite data freely accessible through Google Earth, the first comprehensive rock glacier inventory of western Himalaya was presented and the inventory reported 516 rock glaciers with 353 km2 in area, of which 59% have glacier origin and 41% have talus origin [23]. More studies focus on the analysis of glacier surging in Central Asia based on Landsat and other satellite images, so as to provide important support for monitoring and prevention of glacier surging hazards [24,25,26,27,28,29]. Kääb et al. suggested that various remote sensing technologies and data source should be integrated to evaluate the potential risks of cryospheric hazard processes, so as to minimize damage caused by glacier hazards [30].
Under global warming, there are increasing trends in cryospheric hazards in the TP and surrounding areas and the affected areas are projected to spatially tend to expand [5,7,11,12]. The studies showed that Tibet area has the largest number of potential ice and glacial avalanches in the TP, accounting for about 60% of the entire TP, and most of them are in the Himalayan mountains in the south and Nyainqentanglha mountain in the southeastern Tibet [20]. These regions also have the highest risk level of glacial lake outburst flood in the Third Pole [31]. Therefore, it is important to improve our capacity and response measures for hazard monitoring and mitigation. To prevent and reduce hazard losses, it is crucial to implement targeted dynamic monitoring in the high risk areas of ice and glacier avalanches, risk assessment and early warning system building based on the high-resolution satellite images and ground observations. Compared with Landsat and other satellite data, Sentinel-2 has made a revolutionary in terms of spatial resolution, revisiting cycle and imaging swath. As a high-resolution satellite that is freely available for everyone, Sentinel-2 has short-wave infrared band for snow and ice detection and cloud and snow discrimination, which makes Sentinel-2 has unparalleled advantages in monitoring snow, ice and cryospheric hazards.
In this study, the occurrence and evolution process of glacier collapse and ice-rock avalanche in Arutso basin in 2016 and Sedongpu basin in 2017 and 2018 in Tibet were investigated based on the Sentinel-2 time-series images and in-situ investigation. Main drivers and triggering forces of these hazard events were also discussed based on the field investigation, comprehensive data analysis and existing literatures. The massive Chamoli rock-ice avalanche occurred in February 2021 in the western Himalayas was also reviewed using using same methods. The study is of great significance and references for cryospheric hazard monitoring and emergency response and services in the global mountain environment.

2. Materials and Methods

2.1. Study Area

Tibet also refers to the Tibet Autonomous Region(TAR) administratively in China and is the short name for TAR, located in the southwestern part of the TP, while the TP is a vast region that covers most of high mountain regions in the western China, including whole TAR and Qinghai province [14], as shown in Figure 1. Tibet is dominated by westerlies in winter and by Indian monsoon in summer. Spring and autumn are transition seasons between winter and summer atmospheric circulations [16]. Climate in Tibet is generally characterized by alpine climate with pronounced regional differences. Annual mean temperature is −2.2–12.2℃ and decreases from south to north. Annual precipitation ranges from 70 to less than 900 mm with a decreasing pattern from southeast to northwest.
As shown in Figure 1, Arutso glacier avalanche site is located in northwestern Tibet. Climate in this region is cold and dry in most of the year, belonging to arid sub-frigid continental plateau climate regime. Mean annual precipitation in the Arutso basin was 333 mm between October 2016 and September 2019 [32], which is much higher than mean annual precipitation of 70mm at Shiquanhe meteorological station located 270km to the southwest, and also higher than mean annual precipitation of 184 mm at the Gaize meteorological station located approximately 290km away to the southeast. Annual mean temperature was -4.1°C, with the lowest mean temperature of -13.7°C in January and the highest mean temperature of 7.7°C in August. Mean temperature was above 0°C from June to September, while it was below 0°C in other months. According to the second Chinese glacier inventory [33], there are 105 glaciers in the basin and cover a total area of 184 km2. Glaciers in the basin are extreme continental type glaciers and have been very stable over the last four decades, and over recent decades the glaciers in this region have experienced less retreat than those in the Himalayas [34,35].
Sedongpu basin is located in the southeastern Tibet and is in the left bank of Yarlung Zangbo river and nearby the Mt. Gyala Peri in Nyingchi, Tibet, belonging to southeastern alpine-gorge area in Tibet. The basin covers an area of 67 km2, developing nearly from north to south directions, with broad and steep terrain in the upstream and glacial development, and narrow terrain in the middle and downstream. The basin forms a stepped V-shape and ranges from a maximum elevation of 7294m at Mt. Gyala Peri peak to a minimum of 2750m at the confluence of the Yarlung Zangbo river [18,36]. The basin is around 7.6 km long and river is 230 m wide at the confluence. Climate in this region presents temperate monsoon humid type and the data from nearby Miling meteorological station shows that mean temperature is 8.8°C, with mean minmum temperature of 4.3°C and mean maximum temperature of 15.7°C, and mean annual precipitation is 691 mm. There were 16 glaciers distributed in the Sedongpu basin and glacial area shows significant retreat over the last 40 years, with a retreat rate of 45.5% [37,38].
The Chamoli rock-ice avalanche site lies in Western Himalayas within a transitional zone between the wetter Southern Himalayan ranges and the cold arid Tibetan Plateau in the north [39]. The main precipitation source is Indian summer monsoons during the warmer months,whearas the region also receives considerable precipitation from mid-latitude westerlies in the form of winter snowfall between December and March. Mean annual precipitation is around 1100 mm with sub-zero winter temperature and summer temperature ranging from 5℃to 29℃. The rugged topography of this region lies between 2000 and 7800 m asl [40]. The region is prone to high-velocity mass movement events due to high peaks, narrow river valleys, and deep gorges. The Chamoli rock-ice collapse site is situated in around 40km southwest from the border of Tsada County, Ngari Prefecture, TAR,China(Figure 1).

2.2. Satellite Data

Global Monitoring for Environment and Security (GMES) is a joint initiative of European Commission (EC) and European Space Agency (ESA), designed to establish a European capacity for the provision and use of operational monitoring information for environment and security applications [41]. The main goal of the programme is through coordinating management and integration of European present and future planning satellites and the field observation data to realize real-time monitoring of environment and security, provide data for decision makers in order to support formulating environmental act, response to emergency such as natural hazards and humanitarian crisis to ensure Europe’s sustainable development and enhance international competitiveness. The programme is renamed Copernicus in 2012. Copernicus is the most ambitious Earth observation programme to date. It provides accurate, timely and easily accessible information to improve the management of environment, understand and mitigate the effects of climate change and ensure civil security.
Sentinel series is the core component of Copernicus programme, which implements continuous monitoring for land and marine environmental changes and supports early warning for natural disasters and post-disaster emergency response [42,43,44]. Sentinel-2 is a polar-orbit multispectral high-resolution optical imaging mission. It is the only optical remote sensing satellite in the world with the highest spatial and spectral resolution, shortest revisit cycle, and largest swath that can be obtained for free so far. At present, Sentinel-2 consists of two near-polar orbiting satellites A and B, which were launched on June 23, 2015 and March 7, 2017 respectively. Sentinel-2 A and B are located in the sun synchronous orbit and 786 km above the ground, 180° apart from each other. Sentinel-2 A and B satellites comprise a constellation for collaborative observation, which greatly improves the period of satellite Earth observation. Sentinel-2 provides land surface imaging data from 56 º S to 83 º N every 5 days. After satellites C and D are put into operation successively in the future, satellite revisit period will be doubled, and its response time and timeliness in environmental and disaster monitoring, emergency management will be doubled. Sentinel-2 has become the most widely used satellites in the Copernicus satellite series, and 60% of data downloaded are from Sentinel-2. At present, Sentinel-2 is one of the most important data sources for remote sensing monitoring and application research, and has been widely used in monitoring natural disasters, such as floods, forest fires, landslides, volcanic eruptions, and emergency response and humanitarian crises.
The spectral band configuration of Sentinel-2 arose as a result of extensive consultation with the user community during the design phase and was developed based on the wavelengths of Landsat and SPOT satellite sensors [45,46,47]. The satellite is equipped with a multispectral imager (MSI) with push broom imaging mode, which is a new generation of multispectral optical imager. There are 13 bands in total, of which the ground resolution of band 4 (red), 3 (green), 2 (blue) and near-infrared band 8 is 10m, the ground resolution of three vegetation red edge bands 5, 6, 7, two shortwave infrared bands 11, 12 and narrow near-infrared band 8a is 20m, and the ground resolution of other bands 1, 9 and 10 is 60m, as shown in Table 1 for details.
The UTM projection is used in Sentinel-2 satellite images to be consistent with Landsat-8 images, and there are L1C and L2A two products. L1C is the top of atmosphere (TOA) reflectance product through radiometric calibration and geometric correction, and L2A is the standard surface reflectance product through atmospheric correction and cloud detection. Users can download Sentinel-2 atmospheric correction plug-in software Sen2Cor from ESA official website to conduct atmospheric correction for L1C products and generate L2A products. Sentinel-2 L1C products are segmented according to U.S. Military Grid Reference System (MGRS) on the basis of UTM projection, and each UTM projection belt is subdivided into 20 regions in the north-south direction, and then further divided into 109.8km×109.8km grid. Users can visit the official website of Copernicus (https://dataspace.copernicus.eu/) and download L1C and L2A products for free. ESA also provided SNAP, a satellite remote sensing data processing and analysis tool, to help users to display and process satellite remote sensing data, such as Sentinel and Landsat series.

2.3. Methods

The NDSI (Normalized Difference Snow Index) is an effective way to distinguish snow and ice from many other surface features and is useful for separating snow/ice and most cumulus clouds. The NDSI is insensitive to a wide range of illumination conditions, is partially normalized for atmospheric effects, and does not depend on reflectance in a single band [48]. As the main algorithm for detecting ice and snow cover from satellite remote sensing, Sentinel-2 NDSI can be calculated using following equation:
NDSI= [Band3–Band11] / [Band3+Band11]
when NDSI is greater than or equal to 0.40, snow cover on the surface can be well identified and most of clouds also can be distinguished from snow [44,49]. Furthermore, based on the spectral signature of low reflectance of water body in near-infrared band and high reflectance of snow in this band, the reflectance of near-infrared band greater than 0.11 can be used to eliminate the influence of water body on snow identification since snow and water body have similar NDSI values [50]. ESA Sen2Cor software includes snow detection algorithm [44]. In this algorithm, the lower limit of NDSI threshold is set to 0.2; at the same time, if the reflectance of near-infrared band 8a is greater than 0.15, the pixel is identified as snow cover.
In addition to NDSI used for identifying Arutso glacier and ice avalanche debris in ENVI 5.6.1 software, the single band threshold setting for visible bands and visual interpretation were also used to map the area of the glacier and ice avalanche in Arutso basin, whereas the visual interpretation is main method to identify the affected area of glacier-related geohazard chains in the Sedongpu basin in the southeastern Tibet.
The study workflow includes downloading L1C or L2A images for the study area from Copernicus website first. For visual interpretation, it is enough to download 10m-resolution L1C data. For quantitative analysis, such as computing NDSI, L2A products need to be downloaded, but the image resolution will be reduced to 20m. Second, downloaded L1C products can be atmospherically corrected and directly converted to L2A products using Sen2Cor tool. Third, downloaded L1C images can be opened in ESA SNAP software, and MSI band4-3-2 true color composite and image enhancement can be performed in order to achieve the optimal display effect. Finally, the exported results or images can be directly visually interpreted and mapped in Arc GIS 10.0 software.

3. Results

3.1. Arutso Glacier Avalanche

3.1.1. Satellite Observation

On July 17, 2016, a massive volume of glacier ice suddenly detached from the lower part of Arutso glacier No. 53 (Arutso-53) in Arutso lake basin, Rutok County, Ngari Prefecture, TAR. The glacier detachments with a large amount of debris flow slid around 7km to the eastward and rushed into Arutso lake, which generated 20m high tsunami-like waves and caused lake level to increase by 9m [51]. Lake shoreline was pushed offshore by around 240m in opposite bank. This ice collapse buried 9 local herdsmen and hundreds of livestock, and destroyed a large area of grasslands [51]. On September 21, in the same glacier group, Arutso glacier No. 50 (Arutso-50) also unexpectedly collapsed [11,12,52]. It is very rare that such large-scale glacier collapse events occurred continuously in the interior region of the TP, where the glacier activities have been rather stable in the past four decades before the two ice avalanches [51,53]. Arutso and Meima Tso are located in inland basin in the western TP and are two lakes downstream of glacier collapses. After two glacier collapses, the melting of ice avalanches made the terminal lake Meima Tso in the downstream expanded more rapidly. From 2016 to 2019, lake level and water volume of Meima Tso increased by 3m and 0.52 Gt, respectively, while the total melting of ice avalanches contributed to about 23.3% of the increase in lake storage [32].
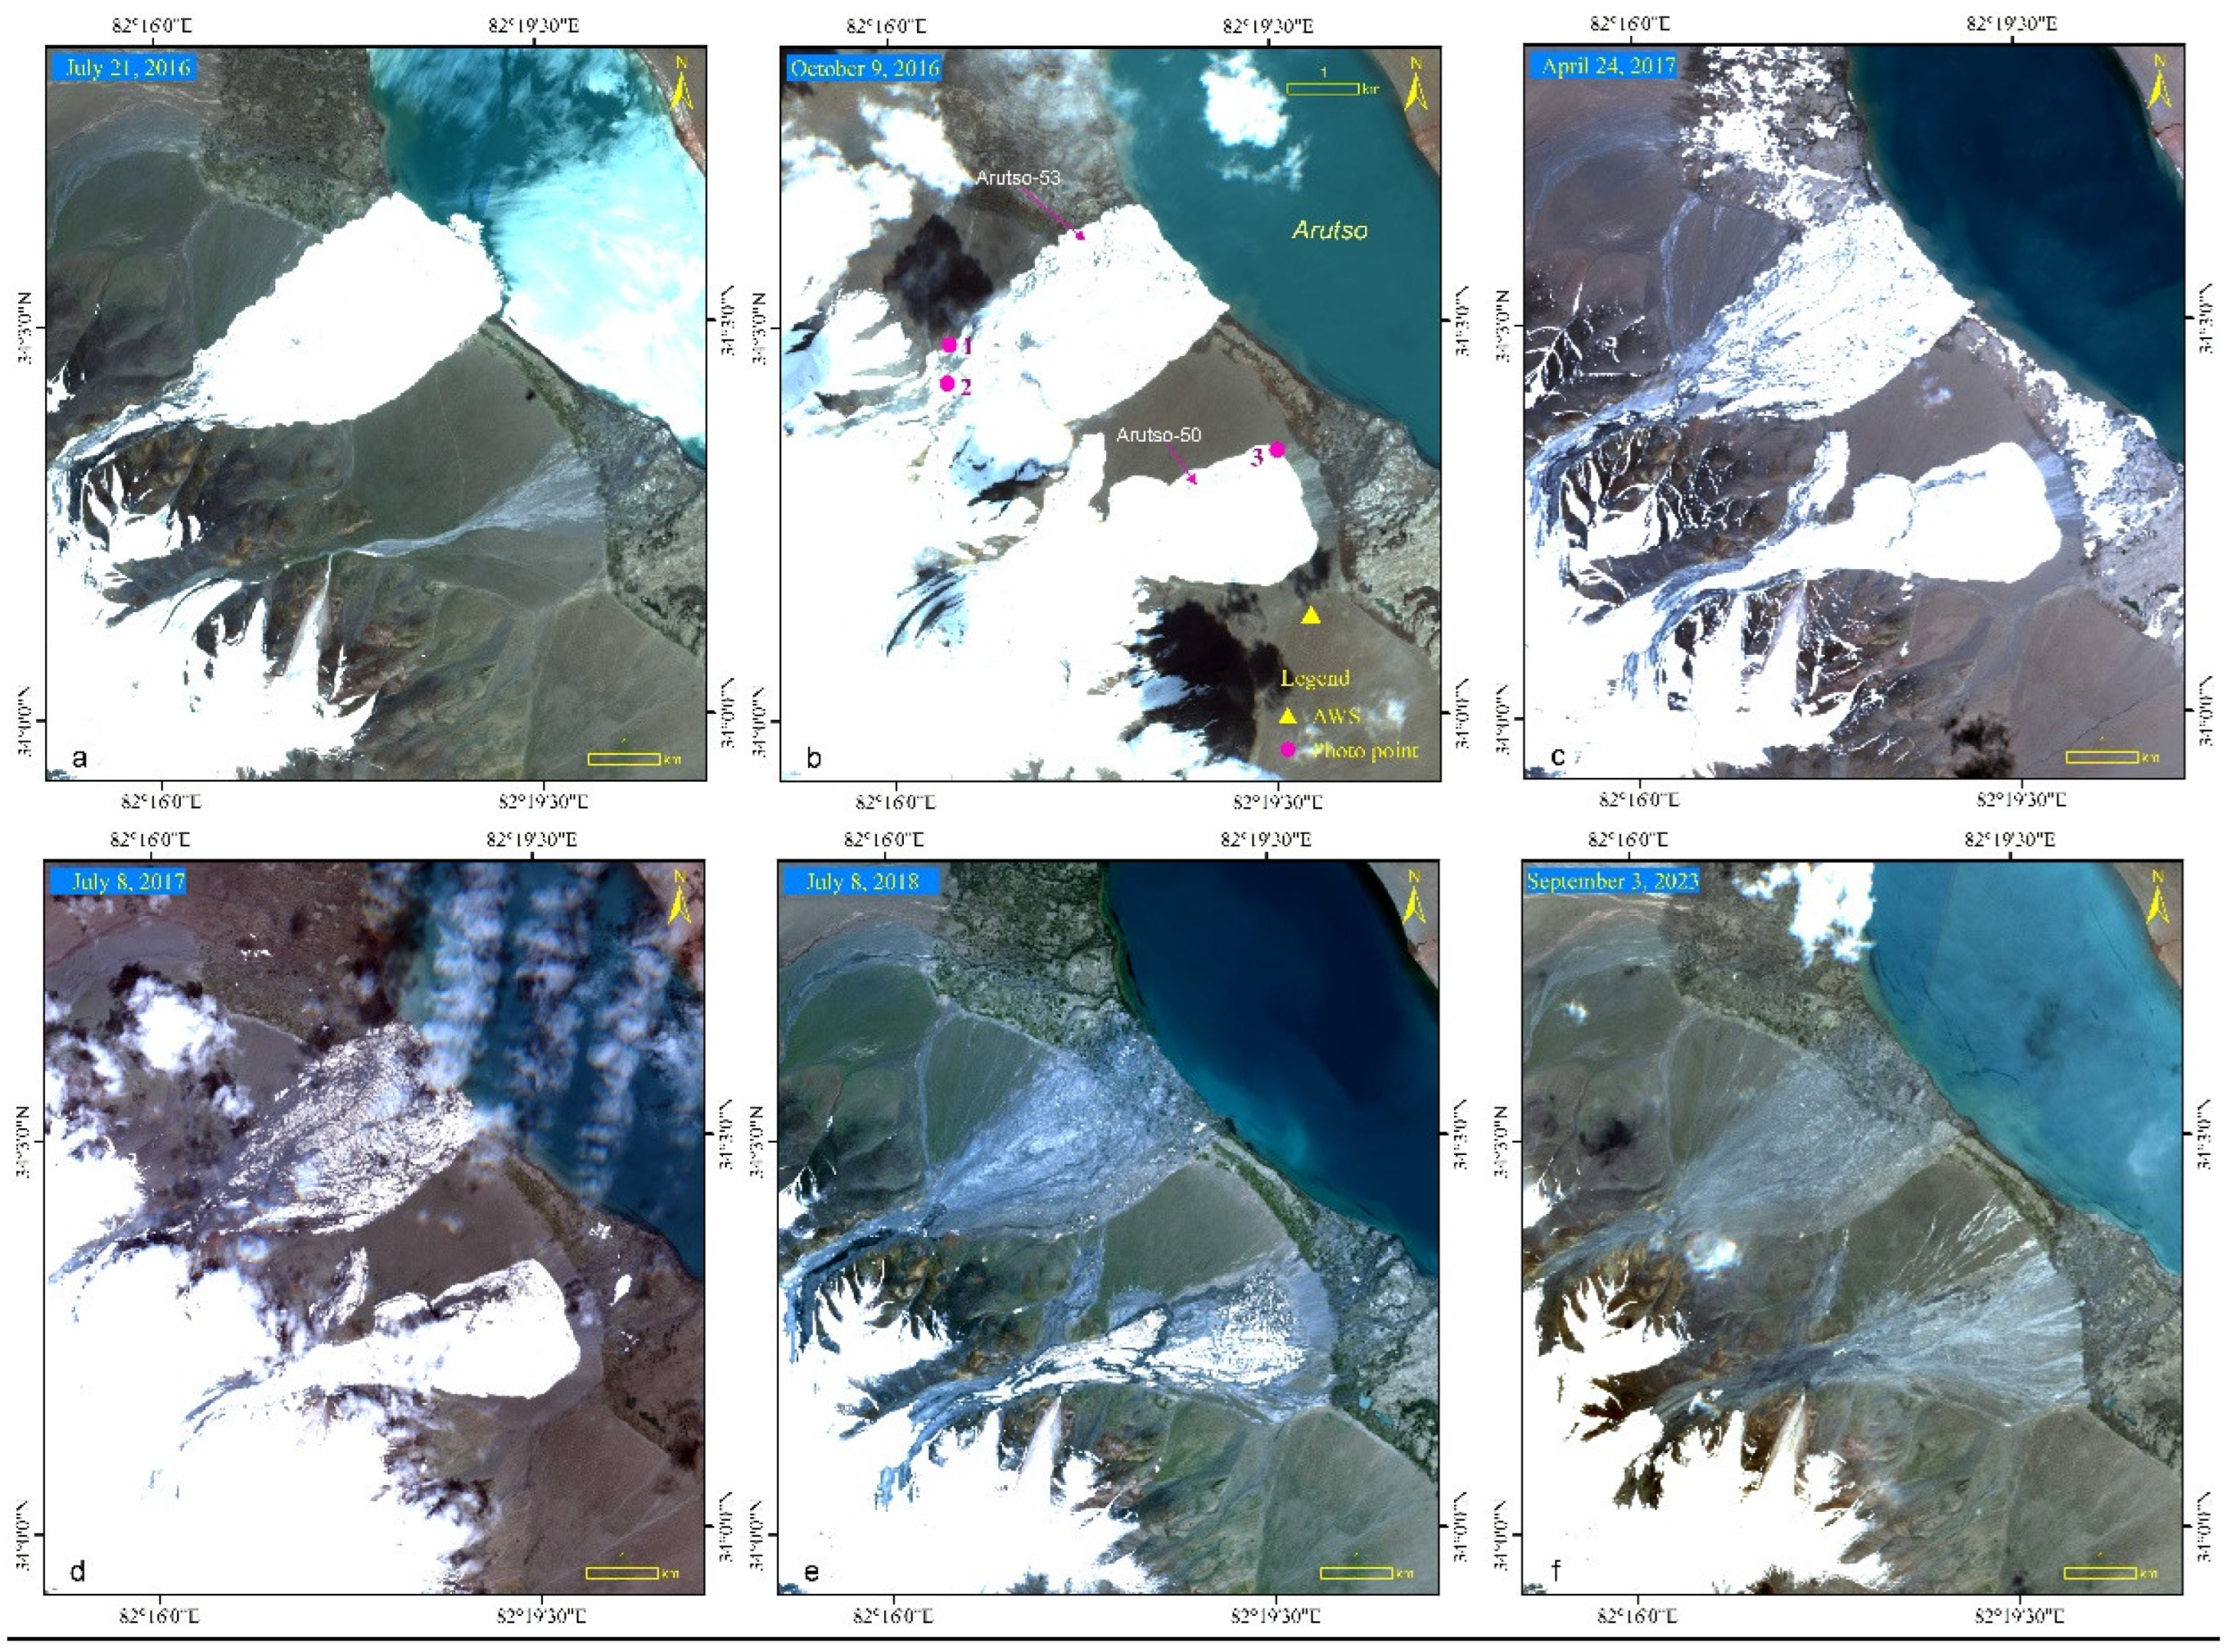
Two glacier collapses in Arutso basin were well documented by Sentinel-2 satellite images in terms of areal change and melting process of ice avalanches, downstream lake expansion and lake morphology, as shown in Figure 2. The most recent Sentinel-2 image was acquired on July 21, 2016 in the fourth day after Arutso-53 collapsed, which is shown in Figure 2a. According to measurements from this image, avalanche deposit of Arutso-53 is 6.80km long, 2.45km wide, and covers an area of 9.67 km2. Average thickness of Arutso-53 deposit is 7.5m and total volume is estimated to be at least 70×106m3 [51]. The longest distance of intruding ice into Arutso lake reached 675m and the area of intruding ice was 0.75km2. Affected by lake water, the intruding ice in the lake melted out in 3 months as observed from Sentinel-2 image on 9 October 20(Figure 2b).
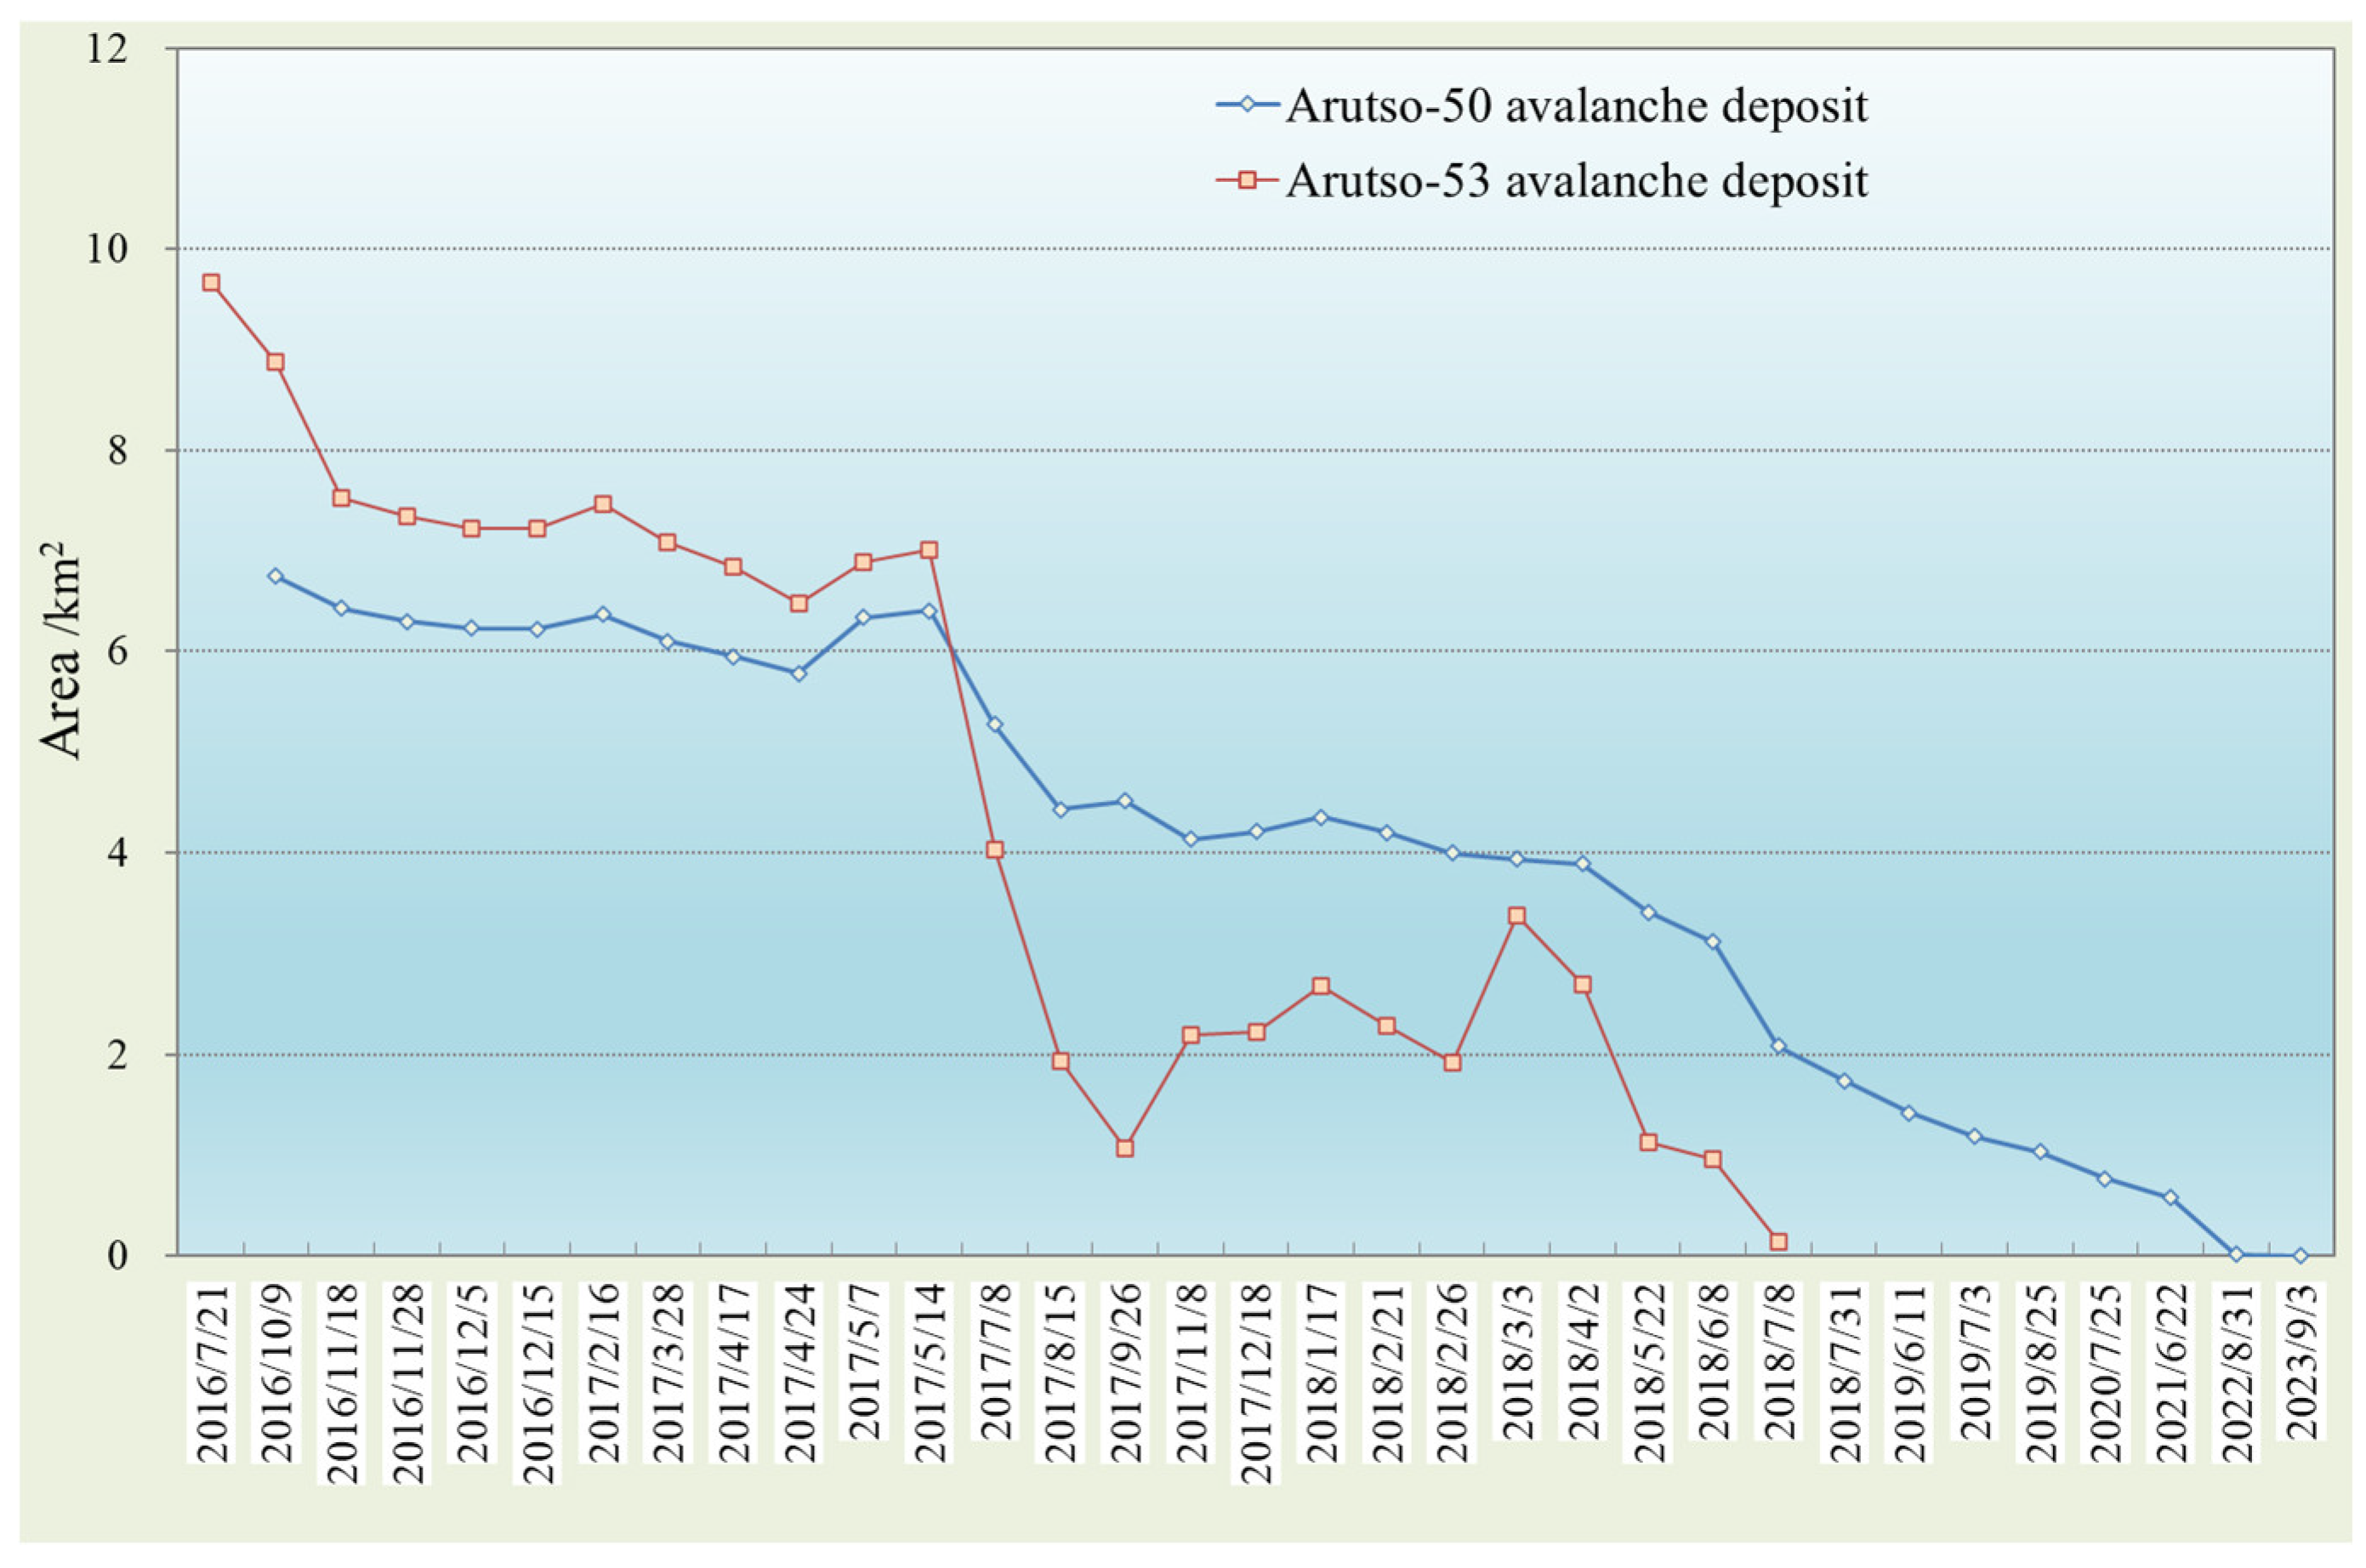
From July 21, 2016 to next year’s spring, the melting speed of Arutso-53 deposit was slow due to cold seasons and low temperature in the study area (Figure 3). On May 14, 2017, the total area of ice avalanche deposit was 7.01 km2 and decreased by 27.5% from initial area. Some fluctuations of ice avalanche area during this period were attributed to snow cover on the surface after spring snowfall. The study found that melting process of collapsed ice volume is not gradually shrinking and melting process from outside to inside like glacier retreating, but it is a fragmented process in different parts of ice avalanche deposits (Figure 2d). From May 14 to September 26, 2017, ice avalanches underwent rapid melting due to warm seasons in the study area. In detail, from May 14 to July 8, 2017, the melted area reached 2.98km2 (Figure 2d), with 0.54km2/10 days. From July 8 to August 15, the avalanche area decreased by 2.10km2, with melting area reaching 0.55km2/10 days. From August to September, the melting rate decreased significantly, which was 0.21km2/10days, less than half of melting rate from July to August. On September 26, 2017, the area of deposited ice volume was smallest since glacier collapsed, with only 1.06 km2 left. Sentinel-2 image shows that the remaining ice always existed and its area fluctuated slightly due to snow cover after snowfall (Figure 3). On June 8, 2018, the area of collapsed ice volume fell below 1.0 km2, which was 0.95 km2, while only 0.14 km2 remained on July 8, 2018 (Figure 2e). As indicated by Sentinel-2 images, it is clear that the remaining ice of Arutso-53 completely melted out in July 2018 after lasting for two years from the glacier collapses to final complete melting.
Likewise, the neighboring Arutso-50 also unexpectedly collapsed on September 21, 2016, and the most recent cloud-free Sentinel-2 image in Arutso basin was acquired on October 9, 2016 (Figure 2b). This image shows that ice avalanche of Arutso-50 is 5.80 km long, 1.90km wide, and covers 6.75 km2, with an average thickness of around 30mand estimated ice volume of around 83×106m3 [52]. Most of ice avalanche slid towards Arutso lake in the east, but didn’t arrive at lake shore. The shortest distance to the lake shore is around 1km. A small part of ice volume slid to the northeast, with an area of 0.84 km2, accounting for 12% of total area of ice avalanche.
After Arutso-50 collapses, its deposit had experienced melting process and decreasing in area and volume (Figure 3). By April 24, 2017, total area of ice avalanches decreased to 5.78 km2. During this period, the decrease in area of ice avalanches was slow due to cold seasons and low temperature in the basin, which is not favorable for ice ablation (Figure 2c). On 2 images of May 2017, there was a slight increase in area of ice deposit due to snow cover. As shown in Figure 3, the melting speed of ice deposit obviously accelerated from mid-May to mid-August, but melting speed was slow compared to Arutso-53. The main reason is that detached ice volume of Arutso-50 was much thicker than that of Arutso-53 and it takes longer time to melt away. If ice volume is thin, temperature rising makes the ice avalanches fragmented and accelerates its ablation. After November, the ablation rate decreased significantly until the next spring, and the area of collapsed ice volume did not reduce much during this period. On November 8, 2017, the ice volume had an area of 4.13 km2. On July 31, 2018, it had an area of 1.74 km2. Since then, the ice ablation was very slow. On July 3, 2019 and July 25, 2020, the area of remaining ice was 1.18 km2 and 0.76 km2, respectively. The remaining ice volume primarily was in the upper part of the ice avalanches, where the fragmented ice was much thicker. By June 22, 2021, the total area of ice remains of Arutso-50 was 0.58 km2. On August 31, 2022, the area of ice avalanche was 0.01 km2. The entire collapsed ice mass of Arutso-50 melted away by the end of August 2023 after lasting for 7 years, as shown in Figure 2f and Figure 3.

3.1.2. Field Investigation

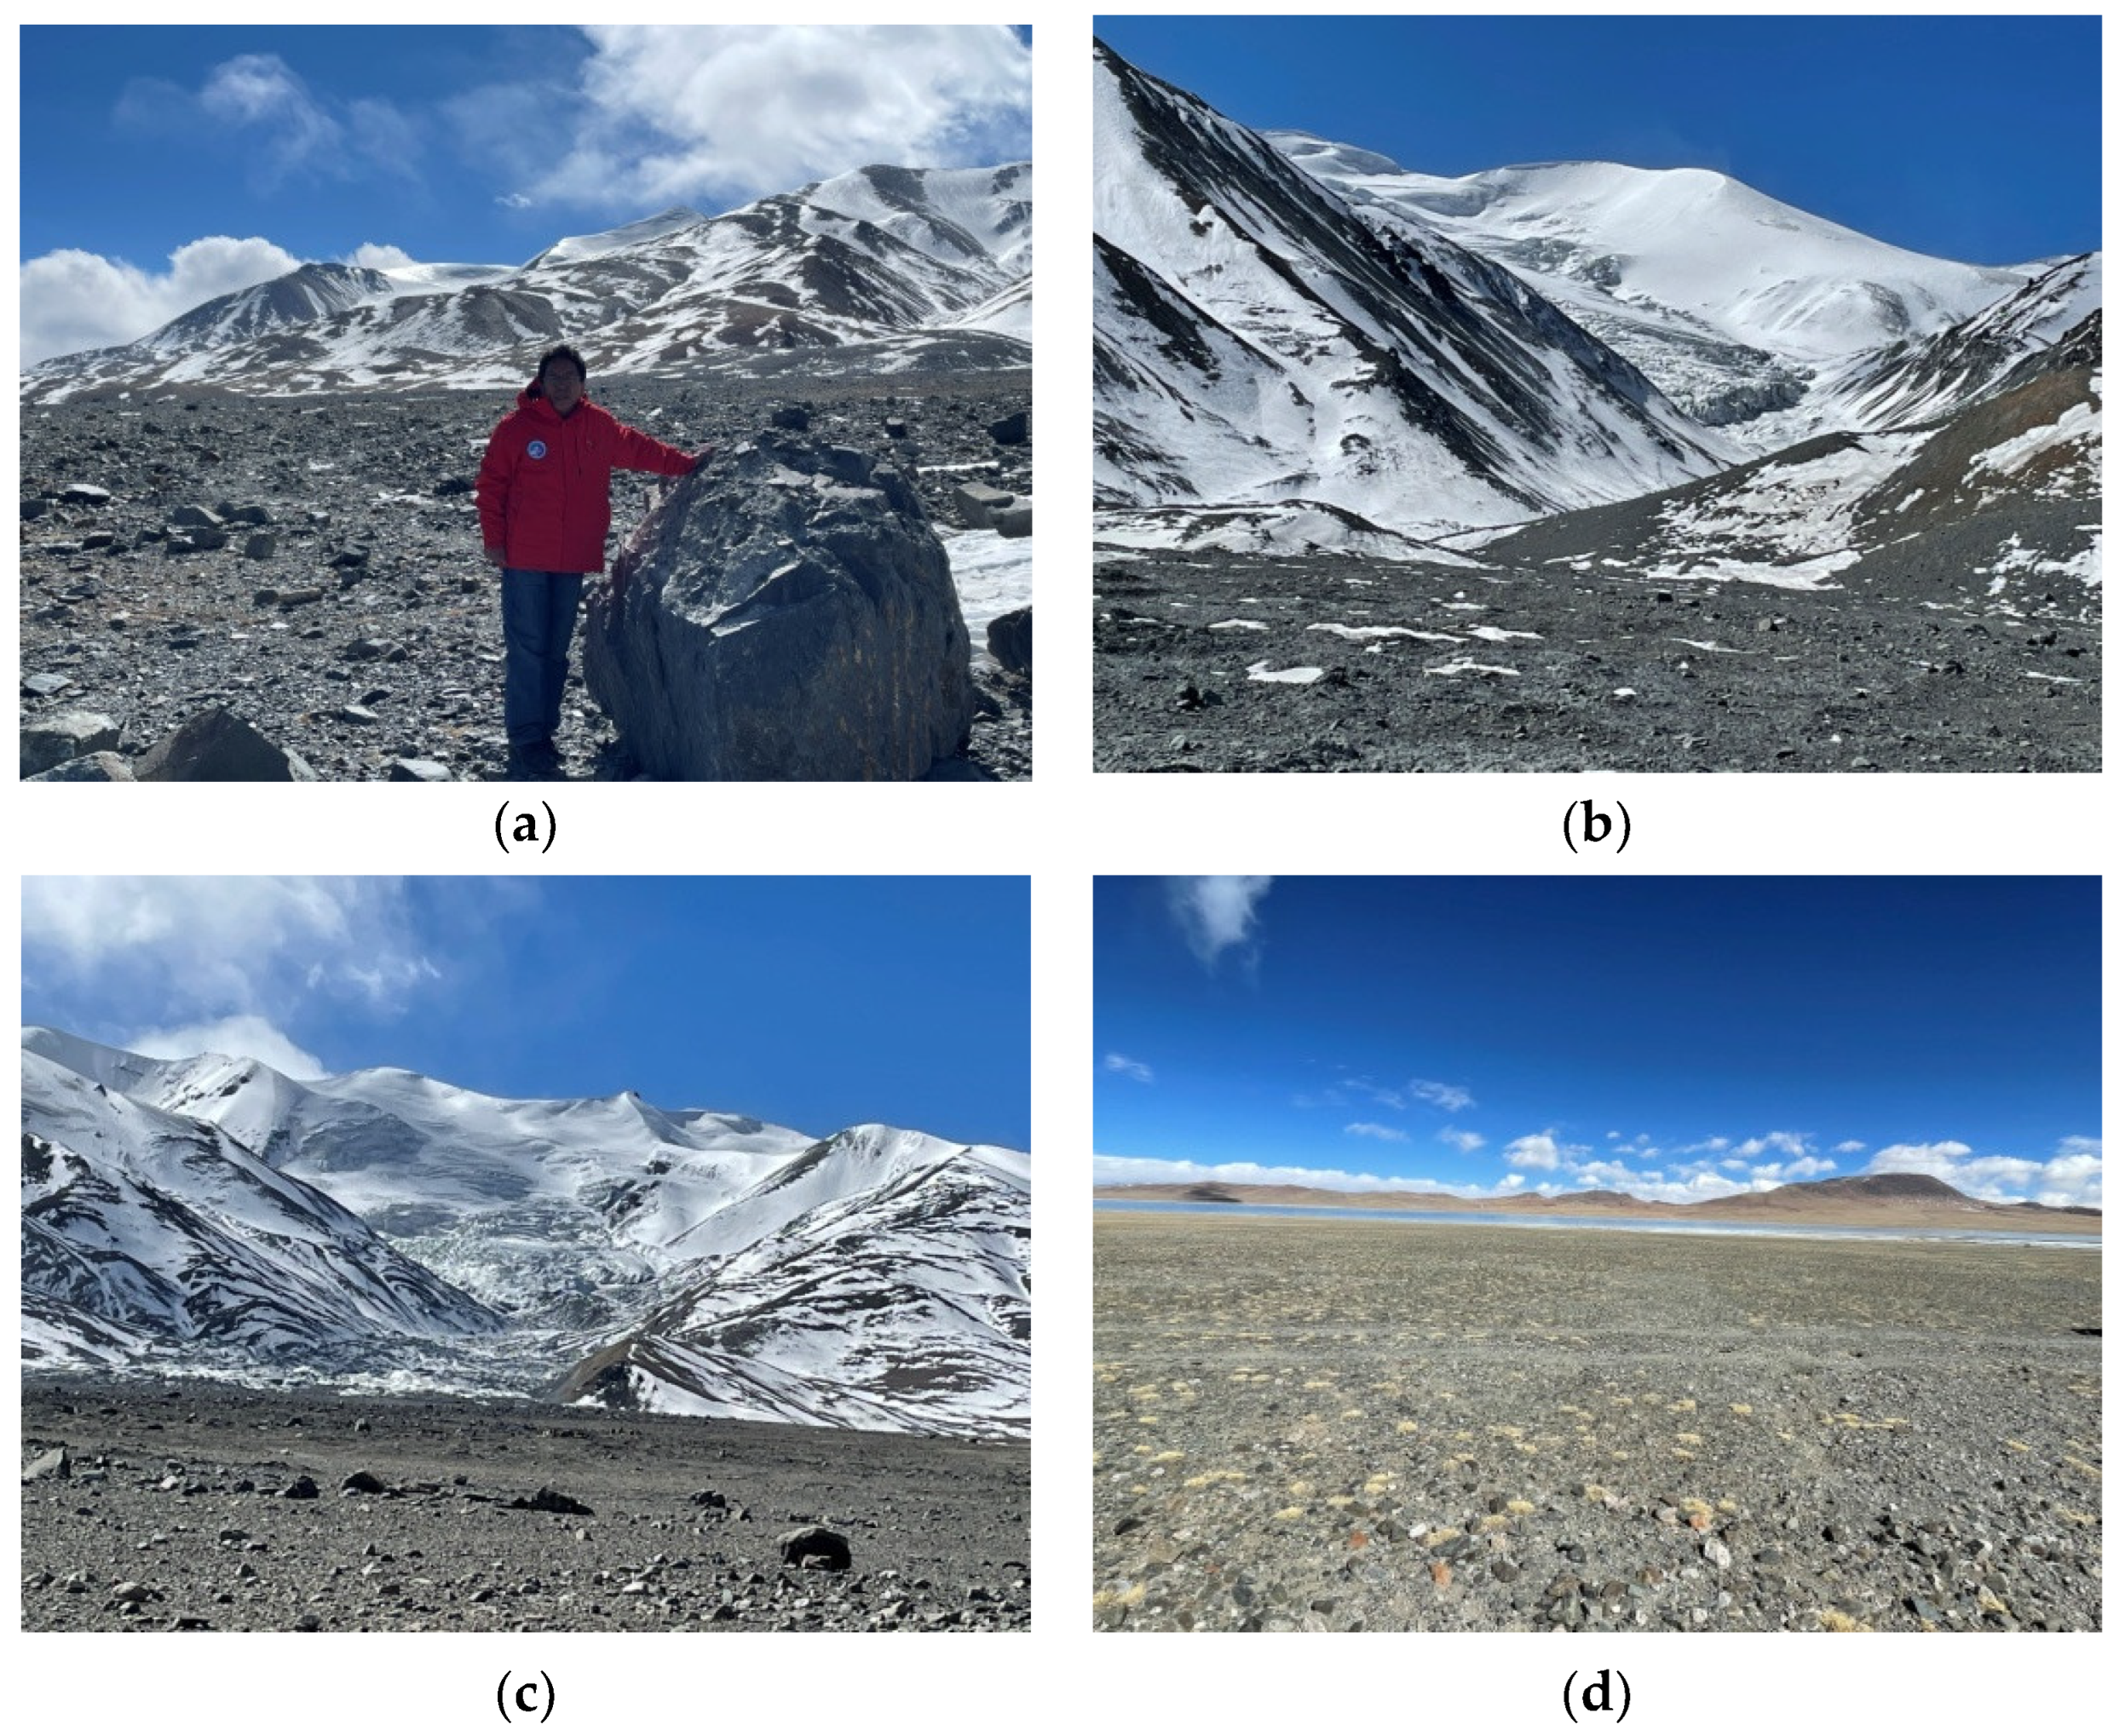
On February 16, 2022, the field investigation was conducted in two glacier collapsed sites in the Arutso basin. It shows that ice remains of Arutso-53 had completely melted out and the site was rock debris covered. The size of some boulders was more than 1m in diameter (Figure 4a). The field investigation also shows that Arutso-53 collapsed after lower part of glacier detached on the mountain slope under the force of gravity. Due to higher mountain slope, the glacier broke off and rushed down eastward to Arutso lake, sliding into the lake after running out about 7km. It was found that upper part of Arutso-53 remained in the mountain valley and potentials to collapse again in the future with glacier mass accumulation cannot be ruled out(Figure 4b).
The collapsed site of Arutso-50 is similar to Arutso-53. The ice deposit has almost melted away and site surface is composed of gravel, sand, finer soil, clasts, and some large boulders with more than 1m in diameter. The remaining ice mass was in the upper part of ice avalanches.
The field campaign shows that Arutso-50 collapsed after its lower part detached from the mountain slope, which is a typical low-angle glacier detachments in the mountain region (Figure 4c).Because the mountain slope of Arutso-50 is less than that of Arutso-53, Arutso-50 broke down and rushed out eastward, but moving speed is less than that of Arutso-53, so that ice avalanches did not reach the lakeshore finally. It was calculated that area of Arutso-50 avalanche is smaller 2.92 km2 than that of Arutso-53, while estimated ice volume is 13×106m3 larger than that of Arutso-53, indicating that its thickness is much higher than that of Arutso-53, so that there was still ice mass remained in the upper part of the ice avalanches.

3.1.3. Analysis on Driving Factors

Arutso glacier collapse events occurred in 2016 attracted many well-known scientists in the world to study the drivers and mechanisms behind twin glacier collapses [11,52]. The study shows that glacier avalanche is a form of glacier instability and driving forces include climate, topography, thermal conditions of ice body, bedrock instability and seismic activity etc [12]. In recent years, global warming has been found to be main underlying cause of glacier collapses [12]. Through satellite remote sensing, numerical simulation and field investigation, Kääb et al. conducted a systematic study on the driving factors of Arutso glacier avalanches, and results showed that there was no single triggering factor for two Arutso glacier collapses, which were caused by climate-and weather-driven external forcing, acting on specific polythermal and soft-bed glacier properties and was large catastrophic instabilities of low-angle glaciers rarely seen in the history [52].

3.2. Sedongpu Ice-Rock Avalanches

3.2.1. Satellite Observation

Sedongpu basin lies in alpine-gorge regions in the southeastern Tibet and is seismically active. The basin is prone to geohazards due to heavy precipitation, snow and ice cover, temperature raising, earthquake, special terrain and geomorphologic conditions. Many high-position geohazards have frequently occurred in the history, making the Yarlung Zangbo was temporally blocked for many times. As the first high-resolution satellite that are available to the public for free so far, since its launch, Sentinel-2 has well recorded the occurrence and evolution of geohazards and risk cascades in the basin in terms of landscape change, land surface modification, river diversion, geomorphological reworking etc.
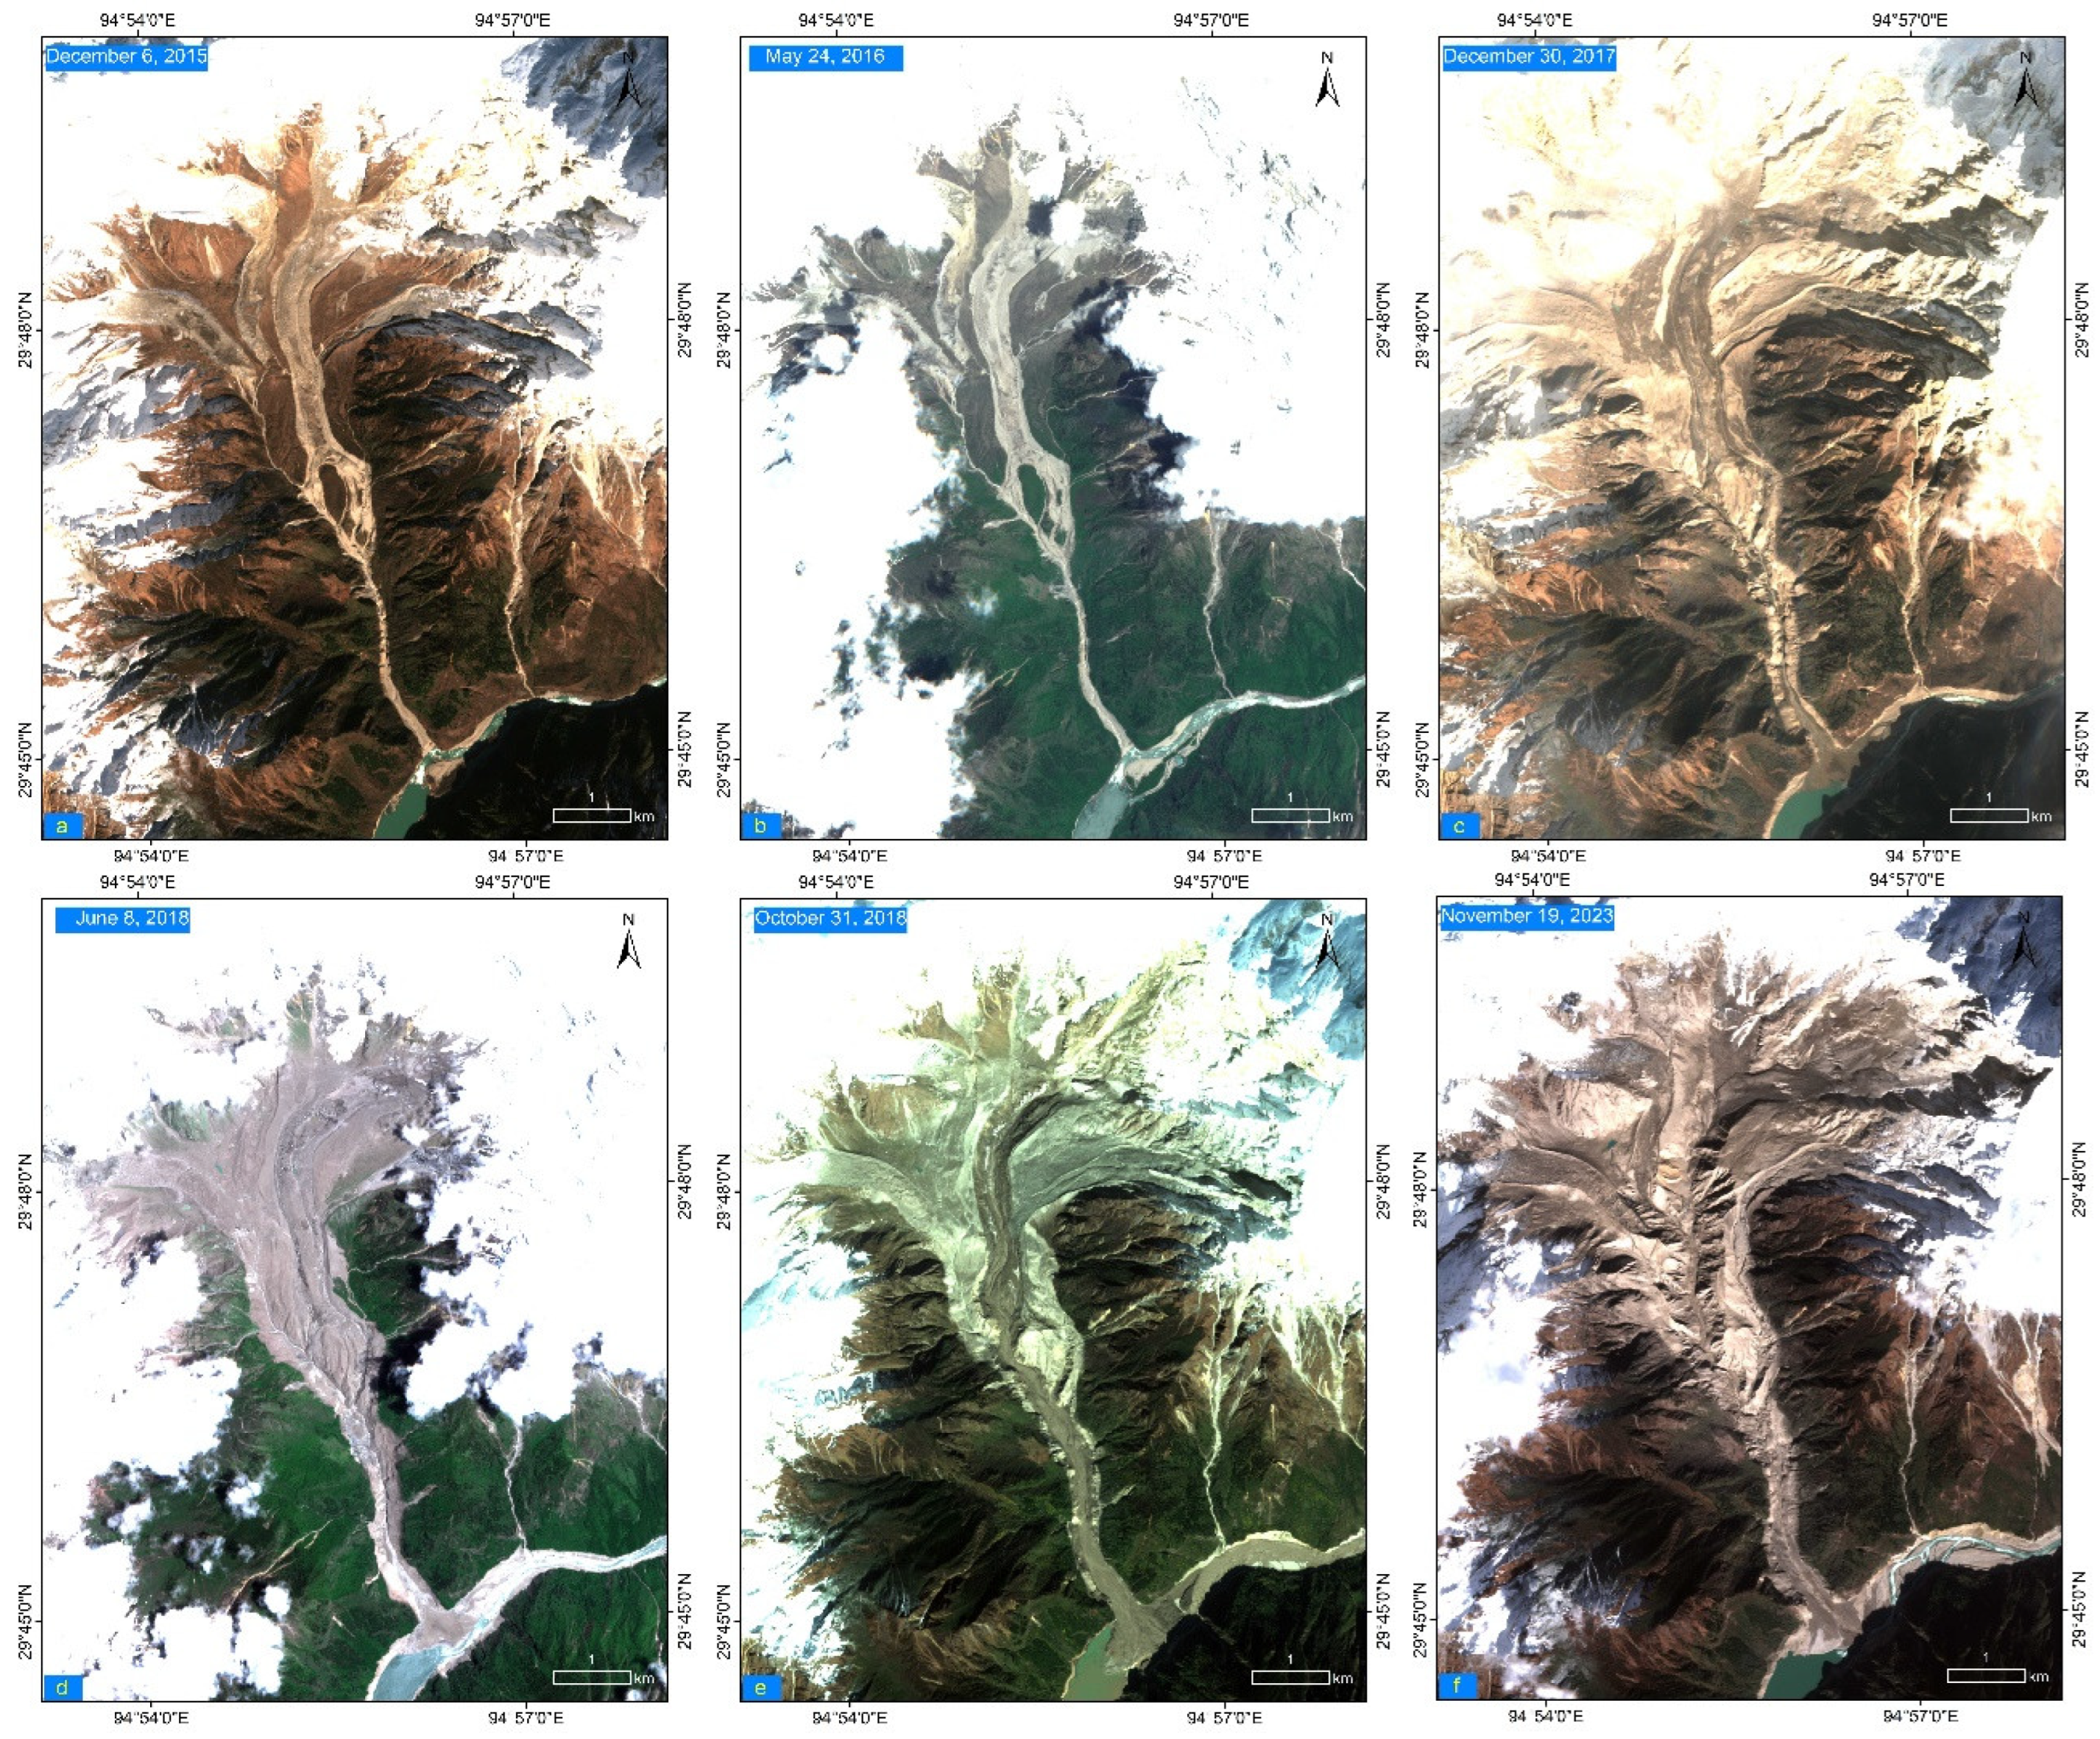
The first cloud-free Sentinel-2 image for the Sedongpu basin was acquired on December 6, 2015 (Figure 5a). This image shows that the vegetation grew well in the basin except valley bottom, flow path, moraine deposit, and snow and ice covered area. It is also clear that the vegetation grew on the highland of the terrace in the middle of the basin and river flew through both sides of the highland. It indicates that Sedongpu basin had been relatively stable for a long time in the past and no large debris flow events occurred. Due to river blocking in the past, the debris deposit was in the Yarlung Zangbo river as residual dam, which has an area of 39.3×10⁴m2 with around 1.7 km long and 439 m wide and is covered by vegetation. At the confluence, river channel is 646m wide and 68.0% of river channel was blocked. The river mainly flows on the left side of deposition fan. According to previous records and satellite image interpretation, it showed that a large-scale debris flow and river blocking events occurred in 1974 and waterflow naturally overflowed from the left side of deposition fan [36,54]. Sedongpu basin was relatively stable from 1975 to 2013 and no large-scale river blocking event occurred. In 2014, an ice-rock avalanche in the basin caused a large-scale river blocking event and partially destroyed vegetation on the deposition fan, while waterflow still naturally overflowed from the left side of the deposition fan.
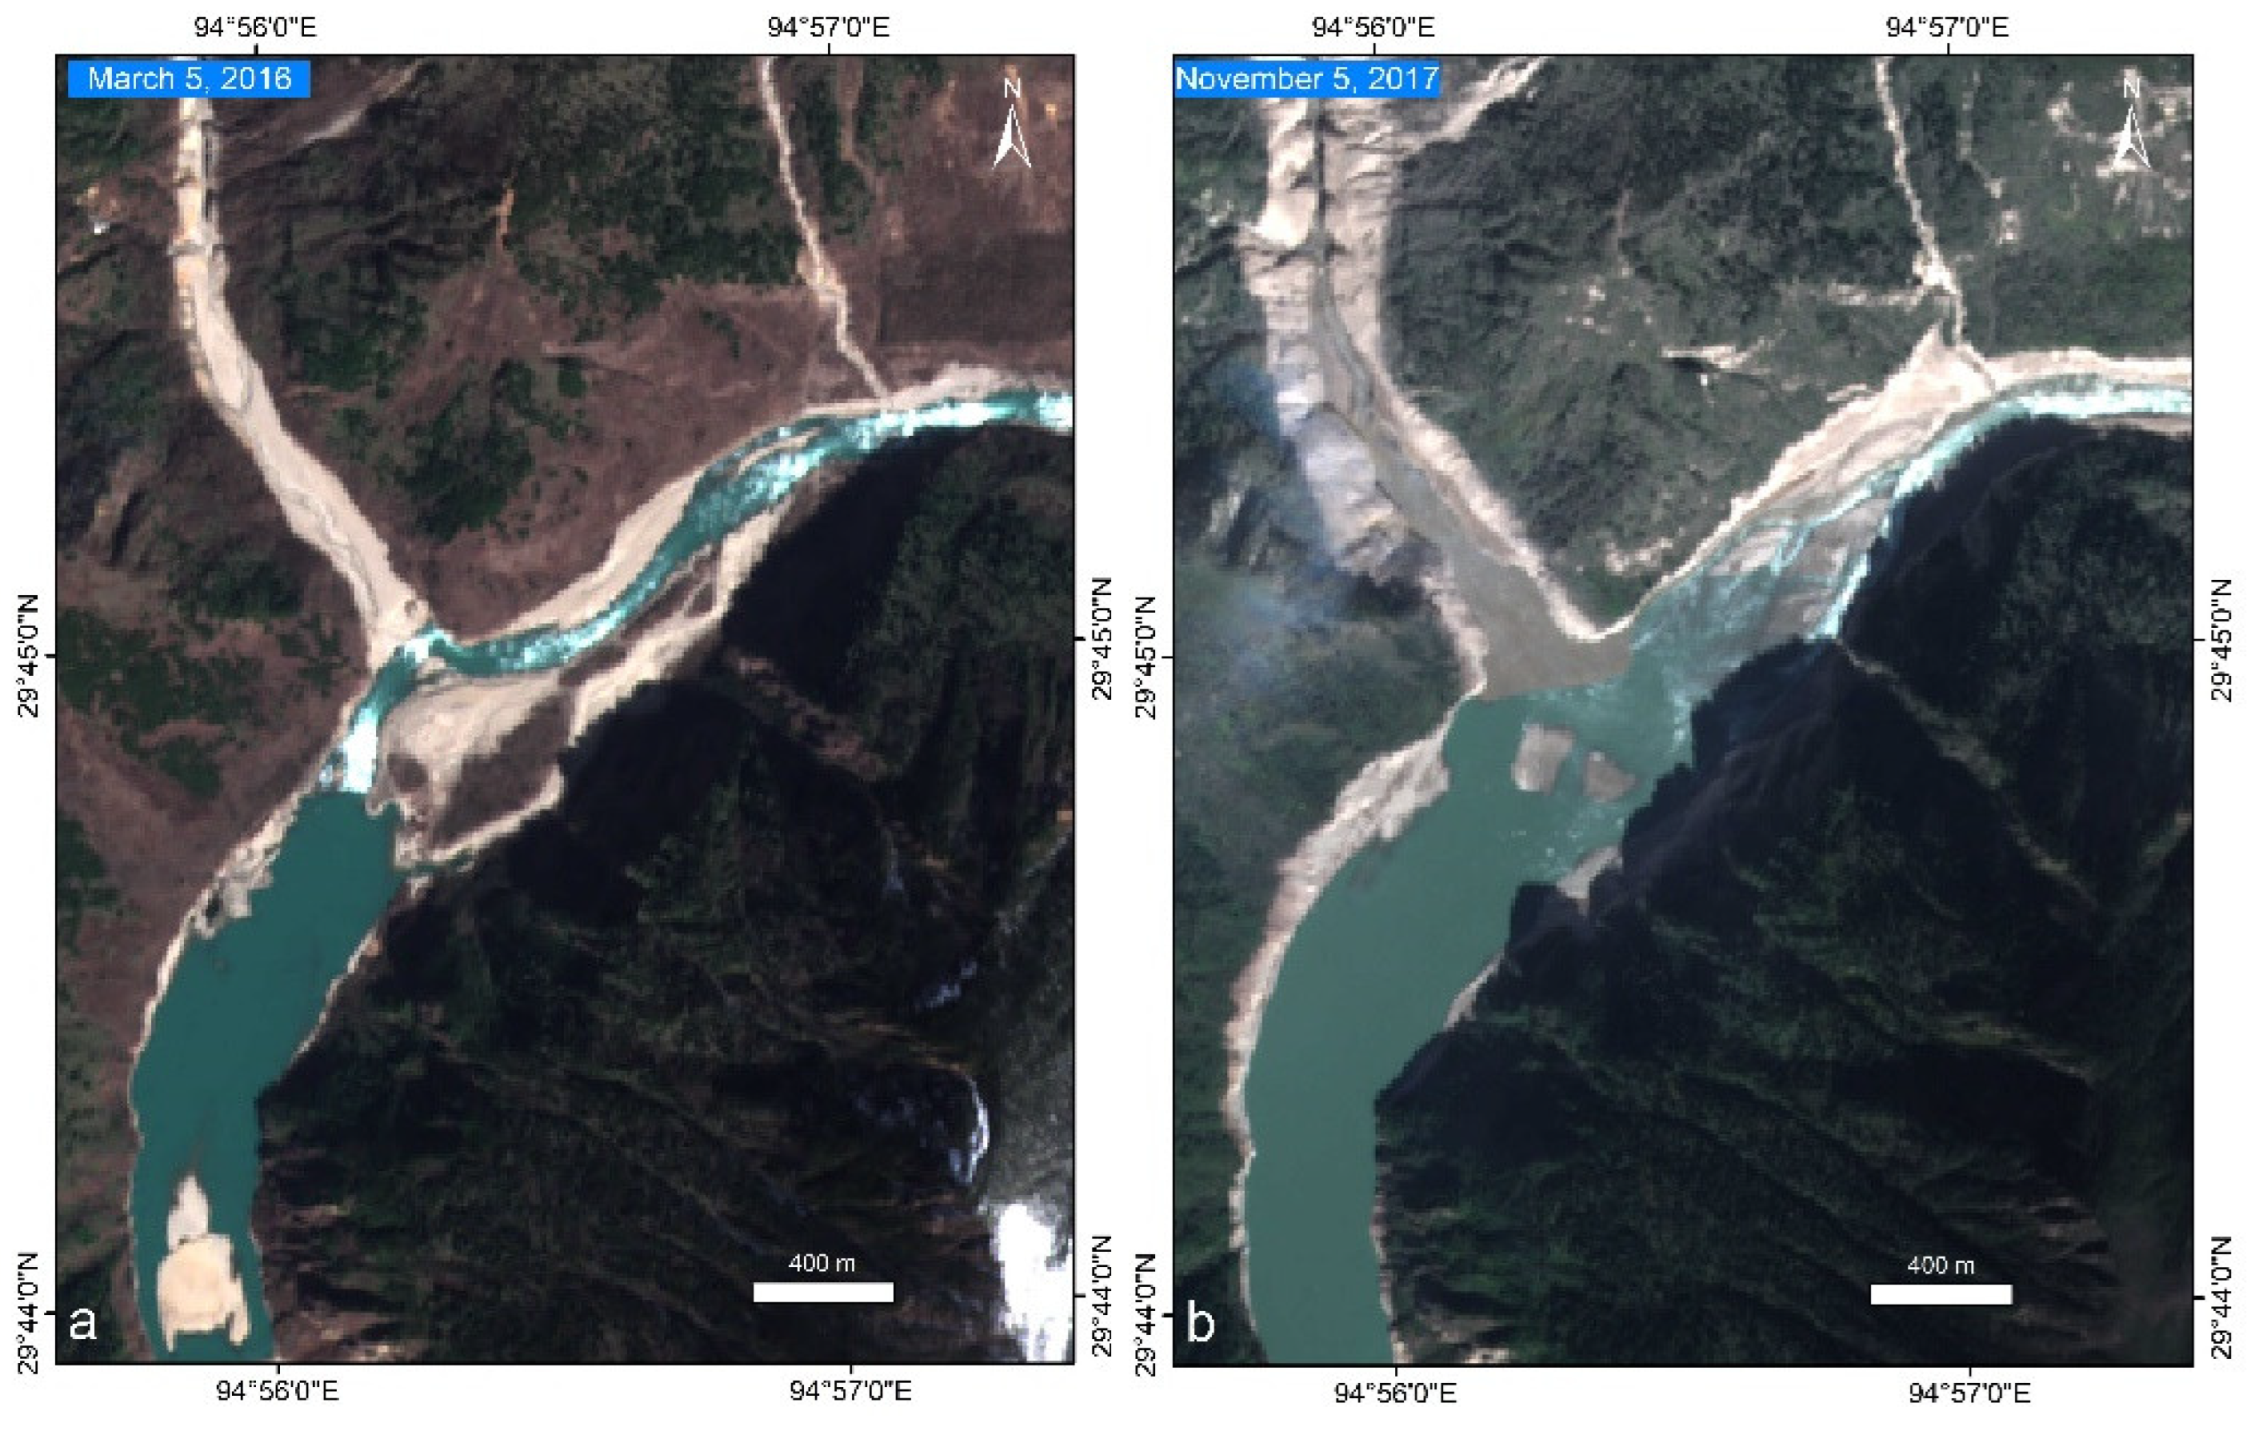
Sentinel-2 image on March 5, 2016 in Figure 6a showed that overall shape and flow conditions of river channel were largely same as on December 6, 2015, but the area of debris deposit at the confluence slightly increased due to water level lowering (Figure 5a). On May 24, 2016, overall river status, area of debris deposit and waterflow conditions were largely in accord with those on December 6, 2015, as shown in Figure 5b, showing that Sedongppu basin was relatively stable from 2015 to 2016, and there was no large-scale debris flow and river blocking events occurred.
Sentinel-2 image on November 5, 2017 showed that previous debris deposit in the river was largely inundated, exposing two smaller deposits in the river with total area of only 3.9×10⁴ m2. Meanwhile, there was fresh deposit fan of 5.2×10⁴m2 appeared at the basin outlet, indicating a large debris flow event occurred in the basin (Figure 6b). According to literature records, on October 22, 2017, an ice-rock avalanche and subsequent debris flow occurred in Sedongpu basin and blocked Yarlung Zangbo at the confluence. The impact of debris flow caused strong ground vibration. The dam body outbroke naturally after water level rose about 30m. It was a typical hazard cascades originating from ice-rock avalanche, through debris flow, river blockage to outburst flood finally [36,38,54].
Sentinel-2 image on December 30, 2017 showed a large deposit fan of 56.4×10⁴ m2 appeared at the basin outlet and water flows from the right side of the dam instead of previous left side (Figure 5c). It indicated that a large-scale debris flow event occurred in the Sedongpu basin previously. According to the literatures, an ice avalanche event occurred in the Sedongpu basin on December 21, 2017, which led to ice-rock avalanche, debris flow, blocking Yarlung Zangbo river again and forming a barrier lake. After 72 hours of river blocking, the barrier outburst naturally, and the river passed through the right side of the river channel. Comparison of Sentinel-2 images before and after the event showed that a high-position glacier collapse was the main triggering factor for this event, which also was a typical cascading hazard. This ice-rock collapse and its aftermath were closely related to a 6.5-magnitude Nyingchi earthquake on November 18, 2017. The earthquake caused serious disturbance in the basin, such as destroying the integrity and stability of glaciers, rocks and moraine deposits in the basin and making land surface looser, providing favorable environmental conditions and rich materials for the subsequent ice-rock collapse and debris flow [38]. Sentinel-2 image on June 8, 2018 in summer provided a clearer picture of the panorama of Sedongpu basin and river blockage after multiple glacial and rock avalanches, debris flows and two river blocking events in late 2017 (Figure 5d). The whole valley from snow and ice covered origin to basin outlet was tremendously eroded by ice-rock avalanche and debris flow, and deep scraped imprint and water erosion in the flow path can be seen clearly. All vegetation on the previous deposits disappeared and became bare surface. The bare-land area on both sides of the river in the basin increased significantly after land surface was scraped and scoured two times by the highly mobile debris flows. Compared with the end of 2017, the area of deposit fan at the basin outlet reduced to 43.6×10⁴ m2, and river channel has obviously widened and water flows more smoothly in June of 2018.
On October 17, 2018, a high-position ice-rock avalanche occurred in the Sedongpu basin and the avalanche transformed into a highly mobile mass flow to rush out of the basin outlet and blocked the Yarlung Zangbo River, forming the barrier lake in the river. After 56 hours, the barrier dam outburst and water flowed from the right side of barrier body. It caused serious damages to roads, bridges, cultivated land, and power and communication facilities. The study on evolution process of this event showed that the ice-rock avalanche originated from near the mountain ridge with an altitude of around 6000m in the western flank of Mt. Gyala Peri. The detached ice-rock avalanche slid along steep slopes to the southwest direction under the force of gravity. Through further collapse and disintegration under the way, the ice-rock avalanche transformed into highly mobile debris flows and scoured valley. It disintegrated further, moved fast and scraped bottom and both sides of valley along the flow path, and finally broke out of basin outlet and blocked Yarlung Zangbo river, forming the barrier lake [36]. The length from the highest point of ice-rock fall to basin outlet is 10.2 km. On October 29, another ice-rock avalanche and debris flow occurred in the Sedongpu basin again, which broke out of basin outlet and covered the previous deposit, resulting in blocking Yarlung Zangbo river again. After 24 hours, the river naturally overflowed the barrier body [18,38]. In view of the fact that the hazard affected area is in high mountains and deep valleys, along with sparse population and difficult access, the countermeasures of adaption to nature, full avoidance and appropriate guidance were proposed for disaster prevention and mitigation [36]. Two massive ice-rock avalanches and river blockages caused over 20 villages flooded and nearly 6, 000 people affected. The rapid rise in upstream water level damaged and threatened roads, power lines, hydropower stations, and other riverside infrastructure [55]. The events were well recorded in Sentinel-2 satellite images acquired on 31 October 2018 in terms of changes in land surface, river flow and basin condition. The previous deposit fan at basin outlet was covered by fresh debris and Yarlung Zangbo river was completely blocked, and total area of deposit fan was 72.4×10⁴ m2. The waterbody area at the confluence increased significantly due to river blockage. The glacial-rock detached area and scar were very obvious on the western flank of mountain ridge in the west of Mt. Gyala Peri (Figure 5e).
Sentinel-2 image on 30 November 2018 presented a clear picture at the confluence a month after barrier lake outburst (not shown). After water level lowered considerably, a large area of deposit fan appeared, with an area of 95.2×10⁴ m2, and the river flows through the right side of large deposit fan. The river channel was badly blocked and is less than 50m wide at narrowest point. By comparing two satellite images acquired on December 6, 2015 and June 8, 2018 (Figure 5a and Figure 5d), it was found that vegetation in the middle and upper parts of Sedongpu basin almost disappeared, the scraped and scoured area on both sides of valley considerably increased, and a large area of deposit fans appeared at basin outlet. The remaining deposit fan in 2015 on the opposite side of basin outlet was completely submerged and disappeared, and waterflow changed from the previous left side to the right side of river channel. The two large-scale ice-rock avalanche and subsequent massive debris flows on October 17 and 29, 2018 further enhanced the deep-cutting erosions in the basin and debris deposits at basin outlet, which intensified river blockage at confluence and narrowed waterflow channel.
Four ice-rock avalanche and debris flow events in 2017 and 2018 not only caused hazard chains in the region, but also had a significant impact on the river flow regime and geomorphological features in the Sedongpu basin. Particularly, the ice-rock avalanche and follow-up debris flow on December 21, 2017 that occurred after 6.5 Nyingchi earthquake on November 18, 2017 brought about the most devastating disasters in the basin. The massive volume of debris flow deposited at the confluence made the Yarlung Zangbo river dammed for 72 hours and changed waterflow from the left side of the channel where river had flowed for a long time to the right side, while the Yarlung Zangbo river channel was badly blocked, with the narrowest point being less than 50m. After four events in 2017 and 2018, Sentinel-2 images showed that no large ice-rock avalanches happened for the period from 2019 to 2020. On 22 March 2021, it was reported that around 50×106 m3 ice-rock avalanche originated from the western flank of Mt. Gyala Peri occurred in the Sedongpu basin and subsequent huge debris flow temporarily blocked the Yarlung Zangbo river [56]. More recent Sentinel-2 image acquired on November 19, 2023 for this study is shown in Figure 5f. The basin outlet and river condition at the confluence did not change much due to ice-rock avalanche and debris flow on March 22, 2021, generally consistent with status at the end of 2018, except that the area of deposit fan at basin outlet reduced obviously. The river still flows through the right side of the channel. As shown in Figure 5f, in five years from the end of 2018 to 2023, vegetation did not regrow on the land surface in the basin. After four large-scale ice avalanche and debris flow events in 2017 and 2018, land surface in the basin became loose and was frequently eroded and scoured by small-scale debris flow, which further reduced the surface stability in the basin and made it difficult for the surface vegetation to recover in time.

3.2.2. Field Investigation

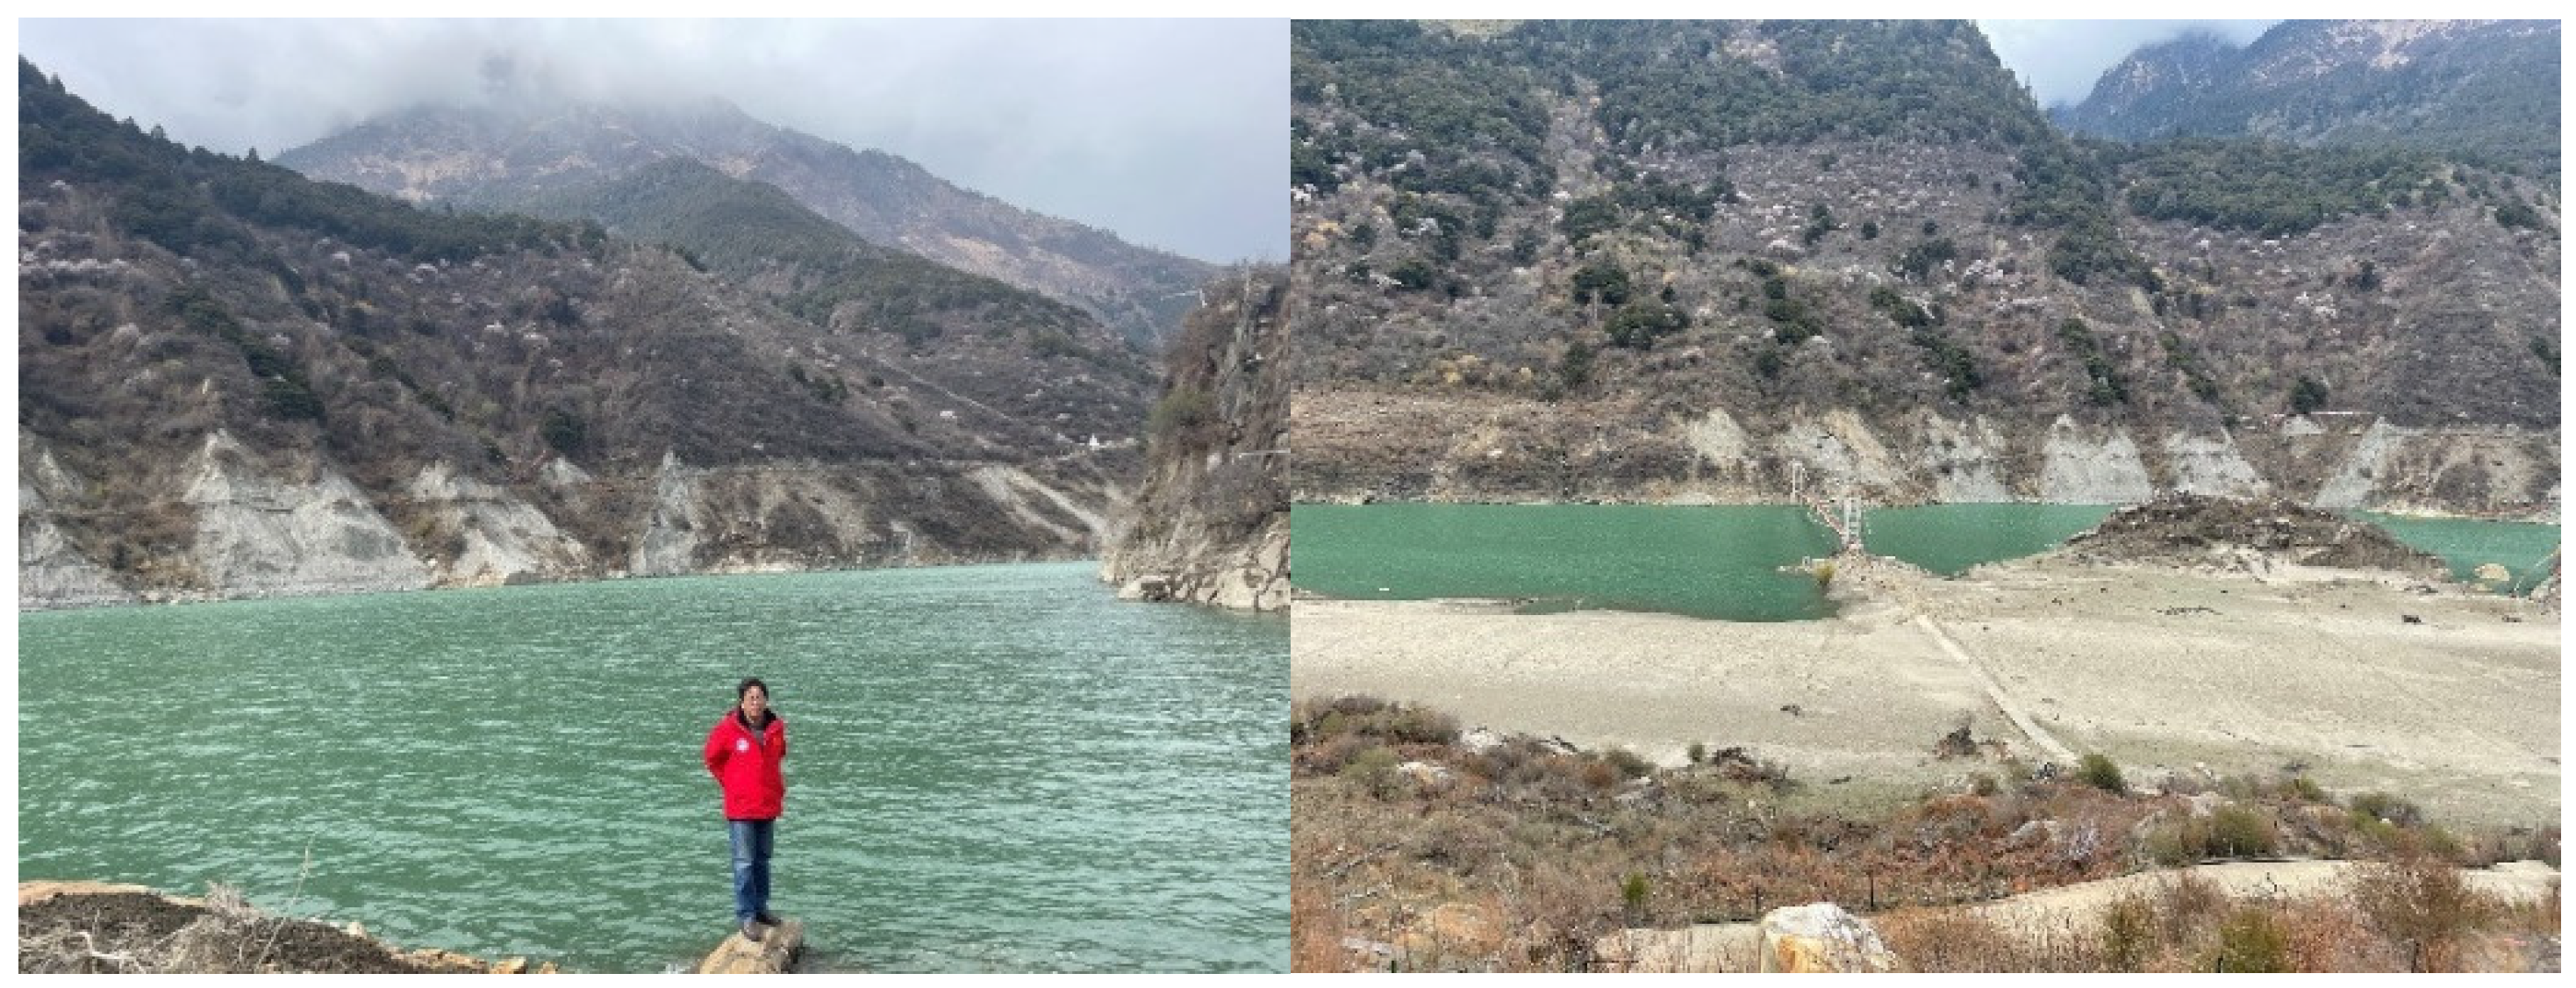
On April 11, 2023, the field investigation was conducted at Pai, Zhibai and Gyala villages in the Yarlung Zangbo Grand Canyon region (Figure 7). Gyala is the closest village to Setonpu basin and the farthest place to the Grand Canyon region from Miling County town by vehicle. The investigation found that Yarlung Zangbo river bridge in Gyala village has become dangerous and was marked as a sign of “No Passing”. The water level of Yarlung Zangbo river during the field survey was low, and a large area of flood land appeared on the south side of the river. The flood imprint left by water level surging after the Yarlung Zangbo river was blocked by ice-rock avalanche debris flow in the Sedongpu basin were clearly visible, including floating branches, trees and some shrubs remaining on the flood land and near the bridge, and some branches were still hung on the ropes of suspension bridge. The cement road to suspension bridge also exhibited uneven and fractured surfaces after being soaked in water.
According to measurements, elevation difference between Gyala village and water surface of river is 60m, so that the impact of water level increasing of Yarlung Zangbo River on the village is limited. The distance between Gyala village to Sedongpu outlet is around 6.8km and it will take at least two days to visit Sedongpu basin. It was found the road of middle section between Zhibai and Gyala villages is not much higher than the river surface, so that road to Gyala village will be largely interrupted due to the inundation of these roads after river blockage.

3.2.3. Analysis on Possible Drivers

Glaciers in the Sedongpu basin are maritime type glaciers. Their mass accumulation and ablation are more drastic than that of continental type glaciers. Ice and snow melting under warming climate, along with local heavy precipitation, temperature anomaly and seismic activity often result in ice avalanche and related hazard chains in the Sedongpu basin under the favorable terrain and geomorphologic conditions of mountain region [57]. The high-elevation ice-rock avalanche and follow-up large scale debris flow often occurs in the Sedongpu basin, causing related geohazard chains in the basin. On the other hand, Sedongpu basin is located in alpine-gorge area in the TP. High diurnal temperature range in the region makes strong freeze-thaw erosion in snow and ice-covered high mountains, and the fragmented and loose rock mass is widely distributed, and rockfalls often occur in the basin [55]. Particularly, the funnel-shaped valley amplifies the mass flow and rainfall concentration on the deposition in the valley, which intensifies the formation, development, movement and late evolution of debris flows in the basin [58]. Therefore, under the combined effect of temperature rising, heavy precipitation, seismic activity, freeze-thaw effect in the high mountain cryosphere, in combination with favorable terrain and geomorphic conditions of Sedongpu basin, the ice-rock avalanche and debris flow in the basin shows increasing trends and still will continue to occur in the future [56].

3.3. Chamoli Rock-Ice Avalanche

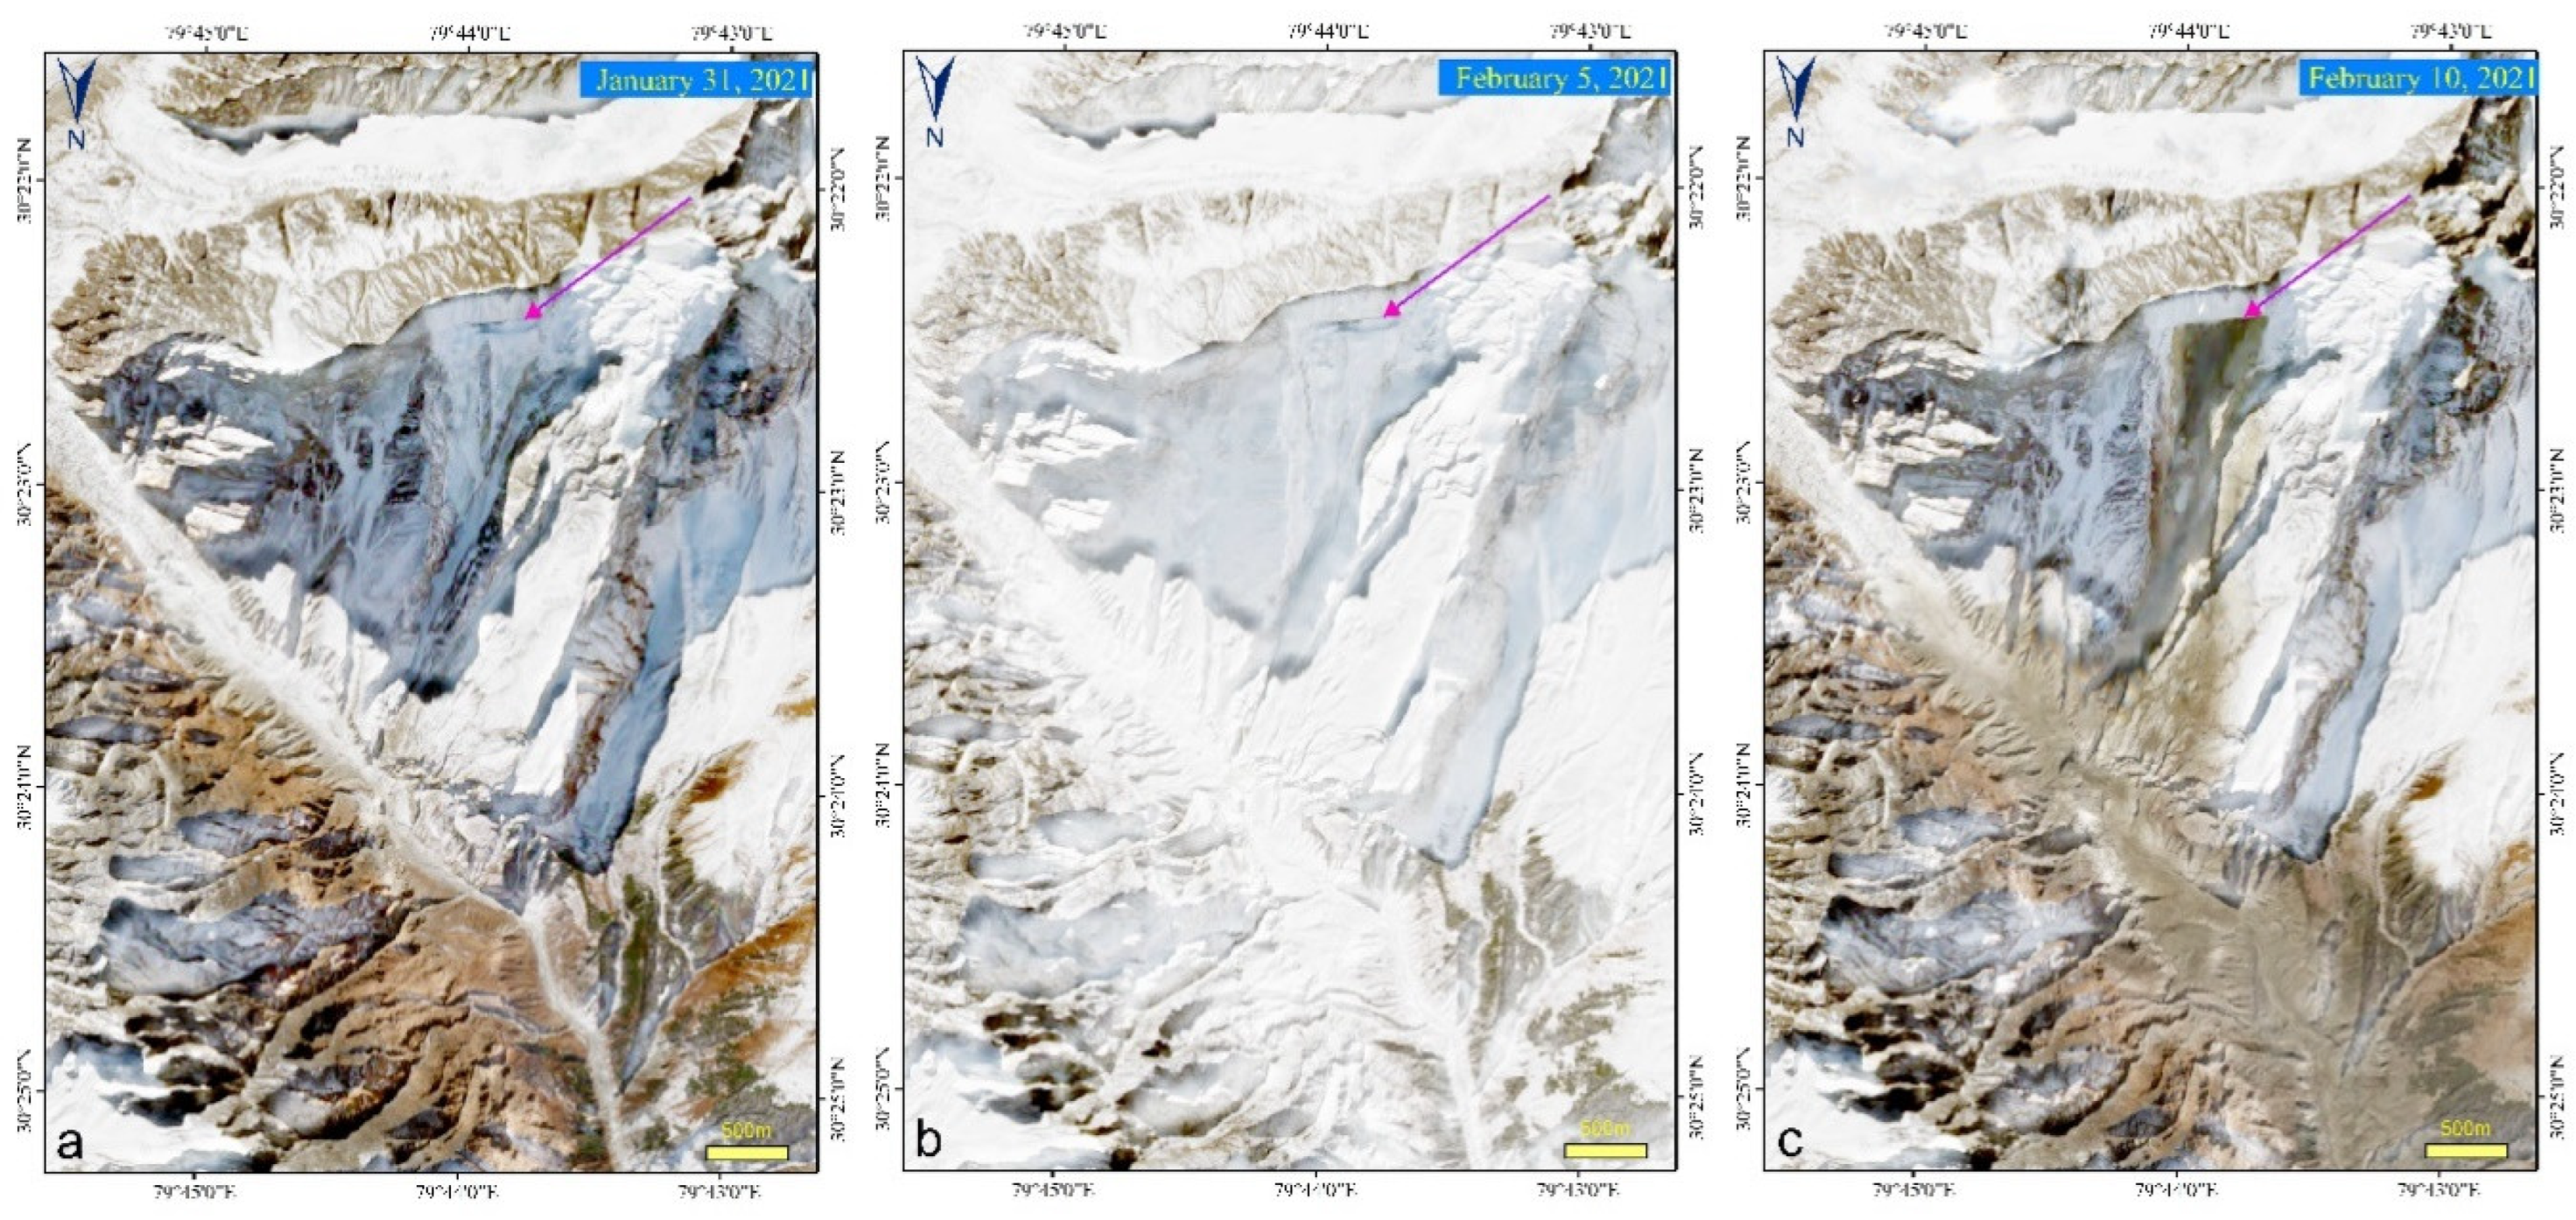
In addition to the ice-rock avalanche events above in the eastern Himalayas, on February 7, 2021, a catastrophic large rock-ice avalanche occurred in the Chamori region of the western Himalayas, which caused more than 200 people death or missing and the destruction of two hydropower plants [1,39]. Figure 8 shows the Sentinel-2 images before and after occurrence of this massive rock-ice avalanche in the western Himalayas. On two pre-event satellite images, there were obvious cracks in the upper part of the mountain, with a width of about 580m and a height of 50-60m. It was found that there had been cracks in this mountain in previous Sentinel-2 images and can be detected as early as 2016. The image of February 5th, two days before the collapse, was covered with snow, indicating that there was a heavy snowfall in the region prior to the ice-rockfall. On February 7, 2021, a massive rock and ice detached from the steep north face of Ronti Peak at an altitude of about 5551m and impacted the Ronti Gad valley floor about 1800 m below. Figure 8c shows the first Sentinel-2 satellite image acquired on February 10th after the disaster occurred. The collapsed area is very obvious in this image, forming an inverted triangular shape, with a maximum depth of 180m, average depth of 80m [1]. The total volume of detached rock and ice is 27×106m3, with rock and ice accounting for approximately 80% and 20% of whole volume, respectively [1].
As mentioned above, it is clear that whether in the TP interior or in the Himalayan region, the high-elevation ice and rock collapses in the mountain cryosphere are direct origin of these disaster events. In the southern Himalayas, the population density is high and many hydropower plants were constructed, resulting in more serious damage to infrastructure and human lives and property at the end of hazard chains [59,60,61,62,63,64]. Comparatively, damage and losses in the Sedongpu basin are quite limited since there is no large infrastructure nearby, such as hydropower plants, along with less human habitation and activities. Therefore, cascading hazards initially caused by the high-elevation rock-ice collapse in the mountain cryosphere highlight the importance of adequate monitoring and early warning systems as well as sustainable mountain development in the Tibetan Plateau, Himalaya and other high-mountain environment in the world.

4. Discussions

Glacier avalanche refers to the glacier mass rapidly moving down the slope of mountain or glacier collapse after detaching from the mountain bedrock and is the expression of instability of mountain glacier. Climate warming and glacier retreat promote the occurrence of glacier-related slope failures in the mountain region. Glacier thinning and changes in thermal conditions can destabilize glaciers, while the surrounding rock slopes can become more prone to collapse due to reducing stress and permafrost degradation.Tibet’s glacier is important part of glaciers in the TP and High Mountain Asia [11,12]. Arutso twin glacier collapses are highly concerned by international scientific community [51,52,67]. Glacier detachment events seem very rare in the mountain region, especially in the interior of the TP. However, there were many records about glacier avalanche or detachments in Tibet in the history. In 1940, the glacier in upper Kangbu region in Yatung county in the southern Tibet collapsed; in 1954, the glacier above Sangwang Tso in the upper reaches of Niangchu River collapsed, causing over 400 people death as by far deadliest known cryospheric disaster in in Tibetan history; in July 1963, September 1975 and August 1978, massive ice mass fell from Karuola hanging glacier due to heavy rainfall and large amount of ice slid onto the road [65]. Zelongnong glacier lies in Zelongnong valley on the west slope of Mount Namjagbarwa. The glacier head is at the summit of Mount Namjagbarwa. In August 1950, massive ice collapses occurred in Zelongnong glacier in Mount Namchabarwa triggered by the earthquake in southeastern Tibet, making the Yarlung Zangbo was blocked temporarily [65]. The glacier avalanche inundated Zhibai village, resulting 97 people death and only one survivor left in the village [66]. These glacier collapses had caused glacier floods, debris flow, road blockage, and damage to infrastructure, and great loss of life and property. However, the tongue of these glaciers was located in a very steep terrain, and catastrophic glacier collapses occurred almost in the case of hanging glaciers.
Sudden mass failures of glaciers on the mountain slope have been observed over a wide range of magnitudes, from ice falls at steep glacier fronts to large ice avalanches when hanging glaciers, typically steeper than 30° [52,67]. On the contrary, Arutso glacier collapses were rare and are large-scale catastrophic collapse events of low-angle mountain glacier, with a total volume of 153×106 m3. Previously, Kolka ice collapse in the Caucasus Mountains, combining the large volume of surges and mobility of ice avalanches, was considered to be the only catastrophic glacier collapse event in the world, with a volume of 130×106 m3 [67]. Whether it is low-angle mountain glacier or hanging glacier, glacier collapses usually occur in the hot and rainy seasons, especially in mid-summer season. Kaab suggested that once the Arutso avalanche deposits have melted, their geomorphic and lithologic imprint should be investigated and the wider region be searched for signs of potential previous glacier collapses [52]. Our field investigation and remote sensing interpretation in the study largely answered these scientific questions. Arutso twin avalanche remains have melted away after surviving 2 and 7 years, respectively. The sites were composed of gravel, sand, finer soil, clasts, and some large boulders with more than 1m in diameter. Searching for the signs of potential previous glacier collapses is also under way.
The southeastern Tibet contains high topographic relief conducive for the development of hazard cascades, and the region has experienced a series of high-altitude ice-rock avalanches, glacier detachments, and glacial lake outburst floods in recent decades [8,38,67]. Massive rock-ice avalanches and debris fows frequently occurred and triggered secondary geohazard chains in the Yarlung Zangbo river downstream, which significantly prolong and amplify the impacts of the hazard and pose a serious threat to local residents and infrastructure [37,68]. In the TP area, Himalayan mountains in the south and Nyainqentanglha mountain in the southeastern Tibet have the highest risk level of glacial mass movement related geohazards [19,31]. The main cause of these hazard events in southeastern Tibet can be linked to combined effect of the glacier dynamics, climate warming, heavy precipitation, seismic activity, and high topographic relief. With accelerating climate warming in the TP, such hazard chains will continue in the future.
A catastrophic rock-ice avalanche in Chamoli in western Himalayas on February 2021 damaged two hydropower plants, and more than 200 people were killed or are missing. Shugar et al. analysed causes and process of this disaster event [1]. A massive rock and ice avalanche collapsed down a Himalayan valley, turning into a deadly debris flow upstream from the first hydropower plant. The sequence of events highlights the increasing risk in the Himalayas caused by increased warming and development [1,39]. Shugar et al. also pointed out that considering the repeated slope failures in the same place in the past two decades in the Himalayas the public education and raising people’s awareness and preparedness of hazard prevention would be very beneficial [1]. Making a holistic assessment of hazards in Tibet and Himalayas is also particularly important. The study highlights the importance of adequate monitoring, early warning systems and sustainable development in the Himalaya and other high-mountain environment.

5. Conclusions and Recommendations

In this study, the evolution process of glacier and ice-rock avalanches in Tibet and Himalayan region was reconstructed using Sentinel-2 remote sensing data, its potentials in monitoring of ice-rock avalanche and cascading hazard in the TP and surroundings were demonstrated, which has great significance and implications for cryospheric hazard monitoring in the global mountain regions. The main conclusions and recommendations are briefly summarized as follows:
(1) Arutso-53 and Arutso-50 glacier avalanches occurred after the lower part of glaciers detached on the slope of mountain,which are typical low-angle glacier detachments in the high mountain region. With mass accumulation and development, Arutso-53 is likely to occur again in the future.
(2) Sentinel-2 images showed that Arutso-53 avalanche completely melted away in July 2018, while on June 22, 2021, there was still 0.58 km2 of ice deposit left for Arutso-50. It melted out by the end of August 2023 after lasting for seven years. In 2017 and 2018, four large-scale ice-rock avalanches and debris flow in the Sedongpu basin have caused disaster chains in the basin and downstream, resulting in a significant impact on the terrain and geomorphological structure for the basin and watercourse.
(3) The occurrence of cryospheric hazard events in the high mountain environment in Tibet and Himalayan ranges provides us an excellent opportunity to understand the evolution process and mechanism of glacier mass movement related hazard cascades in order to cope with disasters and enhance regional disaster prevention and mitigation.
(4) Under global climate warming, in association with overall warming and wetting environment of the TP and Himalayas, the cryospheric hazards tend to be active. Timely monitoring and understanding the nature and evolution process of these hazard chains and related mass flow are crucial to hazard prevention and mitigation. Catastrophic hazard events caused by the high-elevation glacier and ice-rock collapses in the interior of TP and Himalayan range highlight the importance of mountain hazard monitoring, early warning systems and sustainable mountain development, which would benefit the most remote and vulnerable communities through advances in science and technology.
(5) It is recommended to carry out comprehensive hazard risk surveys in the high mountain regions in the TP and Himalayas, strengthen transboundary cooperation and enhance remote sensing and ground-based observations, and build adequate monitoring and early warning systems. In the future, the high mountain regions in the southeastern Tibet and southern Himalayas remain the primary focus for cryospheric hazards, such as ice-rock avalanches, avalanches and glacial lake outburst, which should be a priority for the research community. Monitoring, investigating, early warning and prediction for cryospheric hazards in these regions should be particularly emphasized, so as to reduce hazard risks and enhance our capability for sustainable mountain development.
(5) In the global environmental and hazard monitoring and emergency response, in addition to Sentinel-2 high-resolution data, the application of commercial satellite data is an important option. Among these, U.S. Planet Company has the world’s largest commercial fleet of Earth observation satellites, providing users with rapidly updated, customized high-resolution commercial satellite imagery. Planet Company came up with “using space to help life on Earth” and its mission is to “image the entire Earth every day, and make global change visible, accessible, and actionable”. Planet Company first successfully developed microsatellite swarm technology in the world, and has more than 200 satellites in the orbit, with only satellite system at globally high resolution, high frequency, and full coverage capability. They form constellation of satellites to ensure imaging land area of the world with a resolution of 3-5m once a day. This has unparalleled advantages in hazard monitoring and assessment, emergency relief management and so on.

Author Contributions

D.C. processed the data and wrote the manuscript; D.L.,Y.N and Z.Z. reviewed and edited the manuscript. All authors have read and agreed to the published version of the manuscript.

Funding

This research work was financially supported by the Second Tibetan Plateau Scientific Expedition and Research (STEP) Program (2019QZKK010312;2019QZKK0603), the Key Science and Technology Project of Tibet Autonomous Region (XZ202201ZD0005G01), and the National Natural Science Foundation of China (41561017).

Acknowledgments

The authors would like to acknowledge the ESA for providing Sentinel-2 data via Copernicus Data Space Ecosystem.

References

  1. Shugar, D.H.; Jacquemart, M.; Shean, D.; Bhushan, S.; Upadhyay, K.; Sattar, A.; Schwanghart, W.; McBride, S.; de Vries, M.V.W.; Mergili, M.; et al. A massive rock and ice avalanche caused the 2021 disaster at Chamoli, Indian Himalaya. Science 2021, 373, 300–306. [CrossRef]
  2. Kargel, J.S.; Leonard, G.J.; Shugar, D.H.; Haritashya, U.K.; Bevington, A.; Fielding, E.J.; Fujita, K.; Geertsema, M.; Miles, E.S.; Steiner, J.; et al. Geomorphic and geologic controls of geohazards induced by Nepals 2015 Gorkha earthquake. Science 2015, 351, aac8353. [CrossRef]
  3. Fischer, L.; Purves, R.S.; Huggel, C.; Noetzli, J.; Haeberli, W. On the influence of topographic, geological and cryospheric factors on rock avalanches and rockfalls in high-mountain areas. Nat. Hazards Earth Syst. Sci. 2012, 12, 241–254. [CrossRef]
  4. Hock, R.; Rasul,G., Adler, C.; et al. High Mountain Areas. In: IPCC Special Report on the Ocean and Cryosphere in a Changing Climate. Cambridge University Press, Cambridge, UK and New York, NY, USA, 2019, 131–202.
  5. Yao, T.; Xue, Y.; Chen, D.; Chen, F.; Thompson, L.; Cui, P.; Koike, T.; Lau, W.K.-M.; Lettenmaier, D.; Mosbrugger, V.; et al. Recent Third Pole’s Rapid Warming Accompanies Cryospheric Melt and Water Cycle Intensification and Interactions between Monsoon and Environment: Multidisciplinary Approach with Observations, Modeling, and Analysis. Bull. Am. Meteorol. Soc. 2019, 100, 423–444. [CrossRef]
  6. Immerzeel, W.W.; Van Beek, L.P.H.; Bierkens, M.F.P. Climate change will affect the Asian Water Towers. Science 2010, 328, 1382–1385.
  7. Mukherji, A.; Sinisalo, A.; Nüsser, M.; Garrard, R.; Eriksson, M. Contributions of the cryosphere to mountain communities in the Hindu Kush Himalaya: a review. Reg. Environ. Chang. 2019, 19, 1311–1326. [CrossRef]
  8. Zheng, G.; Allen, S.K.; Bao, A.; Ballesteros-Cánovas, J.A.; Huss, M.; Zhang, G.; Li, J.; Yuan, Y.; Jiang, L.; Yu, T.; et al. Increasing risk of glacial lake outburst floods from future Third Pole deglaciation. Nat. Clim. Chang. 2021, 11, 411–417. [CrossRef]
  9. Yao, T.; Bolch, T.; Chen, D.; Gao, J.; Immerzeel, W.; Piao, S.; Su, F.; Thompson, L.; Wada, Y.; Wang, L.; et al. The imbalance of the Asian water tower. Nat. Rev. Earth Environ. 2022, 3, 618–632. [CrossRef]
  10. Li, W.; Guo, W.; Qiu, B.; Xue, Y.; Hsu, P.-C.; Wei, J. Influence of Tibetan Plateau snow cover on East Asian atmospheric circulation at medium-range time scales. Nat. Commun. 2018, 9, 4243. [CrossRef]
  11. Li, S.; Zhao, H.; Yu, W.; Yao, T.; Liu, S.; Wang, N.; Yang, W.; You, C.; Wang, W.; Wu, G.; et al. Glacier anomalies and relevant disaster risks on the Tibetan Plateau and surroundings. Chin. Sci. Bull. 2019, 64, 2770–2782. [CrossRef]
  12. Wu, G.; Yao, T.; Wang, W.; et al. Glacial hazards on Tibetan Plateau and surrounding alpines. Bull. Chin. Acad. Sci. 2019,34(11),1285–1292. (In Chinese).
  13. Lutz, A.F.; Immerzeel, W.W.; Shrestha, A.B.; Bierkens, M.F.P. Consistent increase in High Asia's runoff due to increasing glacier melt and precipitation. Nat. Clim. Chang. 2014, 4, 587–592. [CrossRef]
  14. Chu, D.; Liu, L.; Wang, Z. Snow Cover on the Tibetan Plateau and Topographic Controls. Remote. Sens. 2023, 15, 4044. [CrossRef]
  15. Nazir A.; Cui, P.; Paul A. C.; et al. Increasing glacial lake outburst flood hazard in response to surge glaciers in the Karakoram. Earth Sci. Rev. 2020, 212,103432.
  16. Chu, D. Remote Sensing of Land Use and Land Cover in Mountain Region; Springer Nature, Singapore. 2020.
  17. Wang, S.; Xiao, C. Global cryospheric disaster at high risk areas: Impacts and trend. Chin. Sci. Bull. 2019, 64, 891–901. [CrossRef]
  18. Li, Z.; Li, B.; Gao, Y.; et al. Remote sensing interpretation of development characteristics of high-position geological hazards in Sedongpu gully, downstream of Yarlung Zangbo River. Chin. J. Geol. Haz. Control. 2021, 32(3),33–41. (In Chinese).
  19. Chai, B.; Tao, Y., Du, J.; et al. Hazard assessment of debris flow triggered by outburst of Jialong glacial lake in Nyalam County, Tibet. Earth Sci. 2020, 45(12), 4630–4639. (In Chinese).
  20. Tang, M.; Wang, L.; Wang, X.; et al. Distribution and risk of ice avalanche hazards in Tibetan Plateau. Earth Sci. 2022, 47(12),4447–4462. (In Chinese).
  21. Huggel, C.; Zgraggen-Oswald, S.; Haeberli, W.; et al. The 2002 rock/ice avalanche at Kolka /Karmadon, Russian Caucasus: assessment of extraordinary avalanche formation and mobility, and application of QuickBird satellite imagery. Nat. Hazards Earth Syst. Sci. 2005, 5(2),173–187.
  22. Kääb, A.; Wessels, R.; Haeberli, W.; et al. Rapid imaging facilitates timely assessment of glacier hazards and disasters. Eos Trans. Amer. Geophys. Union. 2003, 84(13),117–124.
  23. Pandey, P. Inventory of rock glaciers in Himachal Himalaya, India using high-resolution Google Earth imagery. Geomorphology 2019, 340, 103–115. [CrossRef]
  24. Bhambri, R.; Hewitt, K.; Kawishwar, P.; Pratap, B. Surge-type and surge-modified glaciers in the Karakoram. Sci. Rep. 2017, 7, 15391. [CrossRef]
  25. Farinotti, D.; Immerzeel, W.W.; de Kok, R.J.; Quincey, D.J.; Dehecq, A. Manifestations and mechanisms of the Karakoram glacier Anomaly. Nat. Geosci. 2020, 13, 8–16. [CrossRef]
  26. Goerlich, F.; Bolch, T.; Paul, F. More dynamic than expected: an updated survey of surging glaciers in the Pamir. Earth Syst. Sci. Data 2020, 12, 3161–3176. [CrossRef]
  27. Bhambri, R.; Watson, C.S.; Hewitt, K.; et al. The hazardous 2017–2019 surge and river damming by Shispare Glacier, Karakoram. Sci. Rep. 2020,10, 4685.
  28. Lhakpa, D.; Fan, Y.; Cai, Y. Continuous Karakoram Glacier Anomaly and Its Response to Climate Change during 2000–2021. Remote. Sens. 2022, 14, 6281. [CrossRef]
  29. Bazai, N.A.; Cui, P.; Carling, P.A.; Wang, H.; Hassan, J.; Liu, D.; Zhang, G.; Jin, W. Increasing glacial lake outburst flood hazard in response to surge glaciers in the Karakoram. Earth-Science Rev. 2021, 212, 103432. [CrossRef]
  30. Kääb, A. Monitoring high-mountain terrain deformation from repeated air- and spaceborne optical data: examples using digital aerial imagery and ASTER data. ISPRS J. Photogramm. Remote. Sens. 2002, 57, 39–52. [CrossRef]
  31. Zhang, T.; Wang, W.; An, B.; Wei, L. Enhanced glacial lake activity threatens numerous communities and infrastructure in the Third Pole. Nat. Commun. 2023, 14, 8250. [CrossRef]
  32. Lei, Y.; Yao, T.; Tian, L.; Sheng, Y.; Liao, J.; Zhao, H.; Yang, W.; Yang, K.; Berthier, E.; Brun, F.; et al. Response of downstream lakes to Aru glacier collapses on the western Tibetan Plateau. Cryosphere 2021, 15, 199–214. [CrossRef]
  33. Guo, W.; Liu, S.; Xu, J.; Wu, L.; Shangguan, D.; Yao, X.; Wei, J.; Bao, W.; Yu, P.; Liu, Q.; et al. The second Chinese glacier inventory: data, methods and results. J. Glaciol. 2015, 61, 357–372. [CrossRef]
  34. Bolch, T.; Kulkarni, A.; Kääb A.; et al. The state and fate of Himalayan Glaciers. Science 2012,336(6079), 310–314.
  35. Yao, T.D.; Thompson, L.; Yang, W.; Yu, W.S.; Gao, Y.; Guo, X.J.; Yang, X.X.; Duan, K.Q.; Zhao, H.B.; Xu, B.Q.; et al. Different glacier status with atmospheric circulations in Tibetan Plateau and surroundings. Nat. Clim. Chang. 2012, 2, 663–667. [CrossRef]
  36. Liu, C.; Lü, J.; Tong, L.; et al. Research on glacial/rock fall-landslide-debris flows in Sedongpu basin along Yarlung Zangbo River in Tibet. Geol. Chin. 2019, 46(2),219–234.
  37. An, B.; Wang, W.; Yang, W.; Wu, G.; Guo, Y.; Zhu, H.; Gao, Y.; Bai, L.; Zhang, F.; Zeng, C.; et al. Process, mechanisms, and early warning of glacier collapse-induced river blocking disasters in the Yarlung Tsangpo Grand Canyon, southeastern Tibetan Plateau. Sci. Total. Environ. 2021, 816, 151652. [CrossRef]
  38. Tong, L.; Tu, J.; Pei, L.; et al. Preliminary discussion of the frequently debris flow events in Sedongpu Basin at Gyalaperi peak,Yarlung Zangbo River. J. Eng. Geol. 2018, 26(6),1552–1561.
  39. Bhardwaj, A.; Sam, L. Reconstruction and Characterisation of Past and the Most Recent Slope Failure Events at the 2021 Rock-Ice Avalanche Site in Chamoli, Indian Himalaya. Remote. Sens. 2022, 14, 949. [CrossRef]
  40. Kumar, V.; Mehta, M.; Mishra, A.; Trivedi, A. Temporal fluctuations and frontal area change of Bangni and Dunagiri glaciers from 1962 to 2013, Dhauliganga Basin, central Himalaya, India. Geomorphology 2017, 284, 88–98. [CrossRef]
  41. Drusch, M.; Del Bello, U.; Carlier, S.; Colin, O.; Fernandez, V.; Gascon, F.; Hoersch, B.; Isola, C.; Laberinti, P.; Martimort, P.; et al. Sentinel-2: ESA's Optical High-Resolution Mission for GMES Operational Services. Remote Sens. Environ. 2012, 120, 25–36. [CrossRef]
  42. Aschbacher, J.; Milagro-Pérez, M.P. The European Earth monitoring (GMES) programme: Status and perspectives. Remote. Sens. Environ. 2012, 120, 3–8. [CrossRef]
  43. Baetens, L.; Desjardins, C.; Hagolle, O. Validation of Copernicus Sentinel-2 Cloud Masks Obtained from MAJA, Sen2Cor, and FMask Processors Using Reference Cloud Masks Generated with a Supervised Active Learning Procedure. Remote Sens. 2019, 11, 433. [CrossRef]
  44. Richter, R.; Louis, J.; Berthelot, B. Sentinel-2 MSI–Level 2A Products Algorithm Theoretical Basis Document. VEGA Space GmbH, 2011, 1.8.
  45. Berger, M.; Moreno, J.; Johannessen, J.A.; Levelt, P.F.; Hanssen, R.F. ESA's sentinel missions in support of Earth system science. Remote. Sens. Environ. 2012, 120, 84–90. [CrossRef]
  46. Hagolle, O.; Huc, M.; Pascual, D.V.; Dedieu, G. A multi-temporal method for cloud detection, applied to FORMOSAT-2, VENµS, LANDSAT and SENTINEL-2 images. Remote. Sens. Environ. 2010, 114, 1747–1755. [CrossRef]
  47. Zhu, Z.; Wang, S.; Woodcock, C.E. Improvement and expansion of the Fmask algorithm: cloud, cloud shadow, and snow detection for Landsats 4–7, 8, and Sentinel 2 images. Remote. Sens. Environ. 2015, 159, 269–277. [CrossRef]
  48. Hall, D. K.; Riggs, G. A.; Salomonson, V. V. Theoretical Basic Document (ATBD) for the MODIS Snow and Sea Ice-Mapping Algorithms, 2001, NASA.
  49. Hall, D.K.; Riggs, G.A.; Salomonson, V.V. Development of methods for mapping global snow cover using moderate resolution imaging spectroradiometer data. Remote. Sens. Environ. 1995, 54, 127–140. [CrossRef]
  50. Hall, D.K.; Riggs, G.A.; Salomonson, V.V.; DiGirolamo, N.E.; Bayr, K.J. MODIS snow-cover products. Remote Sens. Environ. 2002, 83, 181–194. [CrossRef]
  51. Tian, L.; Yao, T.; Gao, Y.; Thompson, L.; Mosley-Thompson, E.; Muhammad, S.; Zong, J.; Wang, C.; Jin, S.; Li, Z. Two glaciers collapse in western Tibet. J. Glaciol. 2017, 63, 194–197. [CrossRef]
  52. Kääb, A.; Leinss, S.; Gilbert, A.; Bühler, Y.; Gascoin, S.; Evans, S.G.; Bartelt, P.; Berthier, E.; Brun, F.; Chao, W.-A.; et al. Massive collapse of two glaciers in western Tibet in 2016 after surge-like instability. Nat. Geosci. 2018, 11, 114–120. [CrossRef]
  53. Zhang, Z.; Liu, S.; Zhang, Y.; et al. Glacier variations at Arutso in western Tibet from 1971 to 2016 derived from remote-sensing data. J. Glaciol. 2018,64, 397–406.
  54. Li, W.; Zhao, B.; Xu, Q.; Scaringi, G.; Lu, H.; Huang, R. More frequent glacier-rock avalanches in Sedongpu gully are blocking the Yarlung Zangbo River in eastern Tibet. Landslides 2022, 19, 589–601. [CrossRef]
  55. Chen, C.; Zhang, L.; Xiao, T.; He, J. Barrier lake bursting and flood routing in the Yarlung Tsangpo Grand Canyon in October 2018. J. Hydrol. 2020, 583, 124603. [CrossRef]
  56. Zhao, C.; Yang, W.; Westoby, M.; et al. An approximately 50 M m3 ice-rock avalanche on 22 March 2021 in the Sedongpu valley, southeastern Tibetan Plateau. Cryosphere, 2022,16, 1333–1340.
  57. Wang, W.; Yang, J.; Wang, Y. Dynamic processes of 2018 Sedongpu landslide in Namcha Barwa–Gyala Peri massif revealed by broadband seismic records. Landslides 2020, 17, 409–418. [CrossRef]
  58. Zhao, Y. Study on the barrier lake event for landslide⁃river blocking of Sedongpu valley on Yarlung Zangbo River in Tibet of China. J. Hebei Geo Univ. 2020, 43(3),31–37.
  59. Nie, Y.; Pritchard, H.D.; Liu, Q.; Hennig, T.; Wang, W.; Wang, X.; Liu, S.; Nepal, S.; Samyn, D.; Hewitt, K.; et al. Glacial change and hydrological implications in the Himalaya and Karakoram. Nat. Rev. Earth Environ. 2021, 2, 91–106. [CrossRef]
  60. Delaney, K.B.; Evans, S.G. The 2000 Yigong landslide (Tibetan Plateau), rockslide-dammed lake and outburst flood: Review, remote sensing analysis, and process modelling. Geomorphology 2015, 246, 377–393. [CrossRef]
  61. Armstrong, R.L.; Rittger, K.; Brodzik, M.J.; Racoviteanu, A.; Barrett, A.P.; Khalsa, S.-J.S.; Raup, B.; Hill, A.F.; Khan, A.L.; Wilson, A.M.; et al. Runoff from glacier ice and seasonal snow in High Asia: separating melt water sources in river flow. Reg. Environ. Chang. 2018, 19, 1249–1261. [CrossRef]
  62. Muhammad, S.; Tian, L. Changes in the ablation zones of glaciers in the western Himalaya and the Karakoram between 1972 and 2015. Remote. Sens. Environ. 2016, 187, 505–512. [CrossRef]
  63. Kraaijenbrink, P.D.A.; Stigter, E.E.; Yao, T.; Immerzeel, W.W. Climate change decisive for Asia’s snow meltwater supply. Nat. Clim. Chang. 2021, 11, 591–597. [CrossRef]
  64. Liu, J.; Wu, Y.; Gao, X. Increase in occurrence of large glacier-related landslides in the high mountains of Asia. Sci. Rep. 2021, 11, 1635. [CrossRef]
  65. Li, J.; Zheng, B.; Yang, X.; et al. Glaciers in Tibet. Beijing: Science Press, 1986. (In Chinese).
  66. Zhang, W. J. Identification of glaciers with surge characteristics on the Tibetan Plateau, Ann. Glaciol. 1992, 16, 168–172.
  67. Kääb, A.; Jacquemart, M.; Gilbert, A.; et al. Sudden large-volume detachments of low-angle mountain glaciers–more frequent than thought? Cryosphere, 2021,15, 1751–1785.
  68. Zhang, T.; Li, B.; Gao, Y.; Gao, H.; Yin, Y. Massive glacier-related geohazard chains and dynamics analysis at the Yarlung Zangbo River downstream of southeastern Tibetan Plateau. Bull. Eng. Geol. Environ. 2023, 82, 426. [CrossRef]
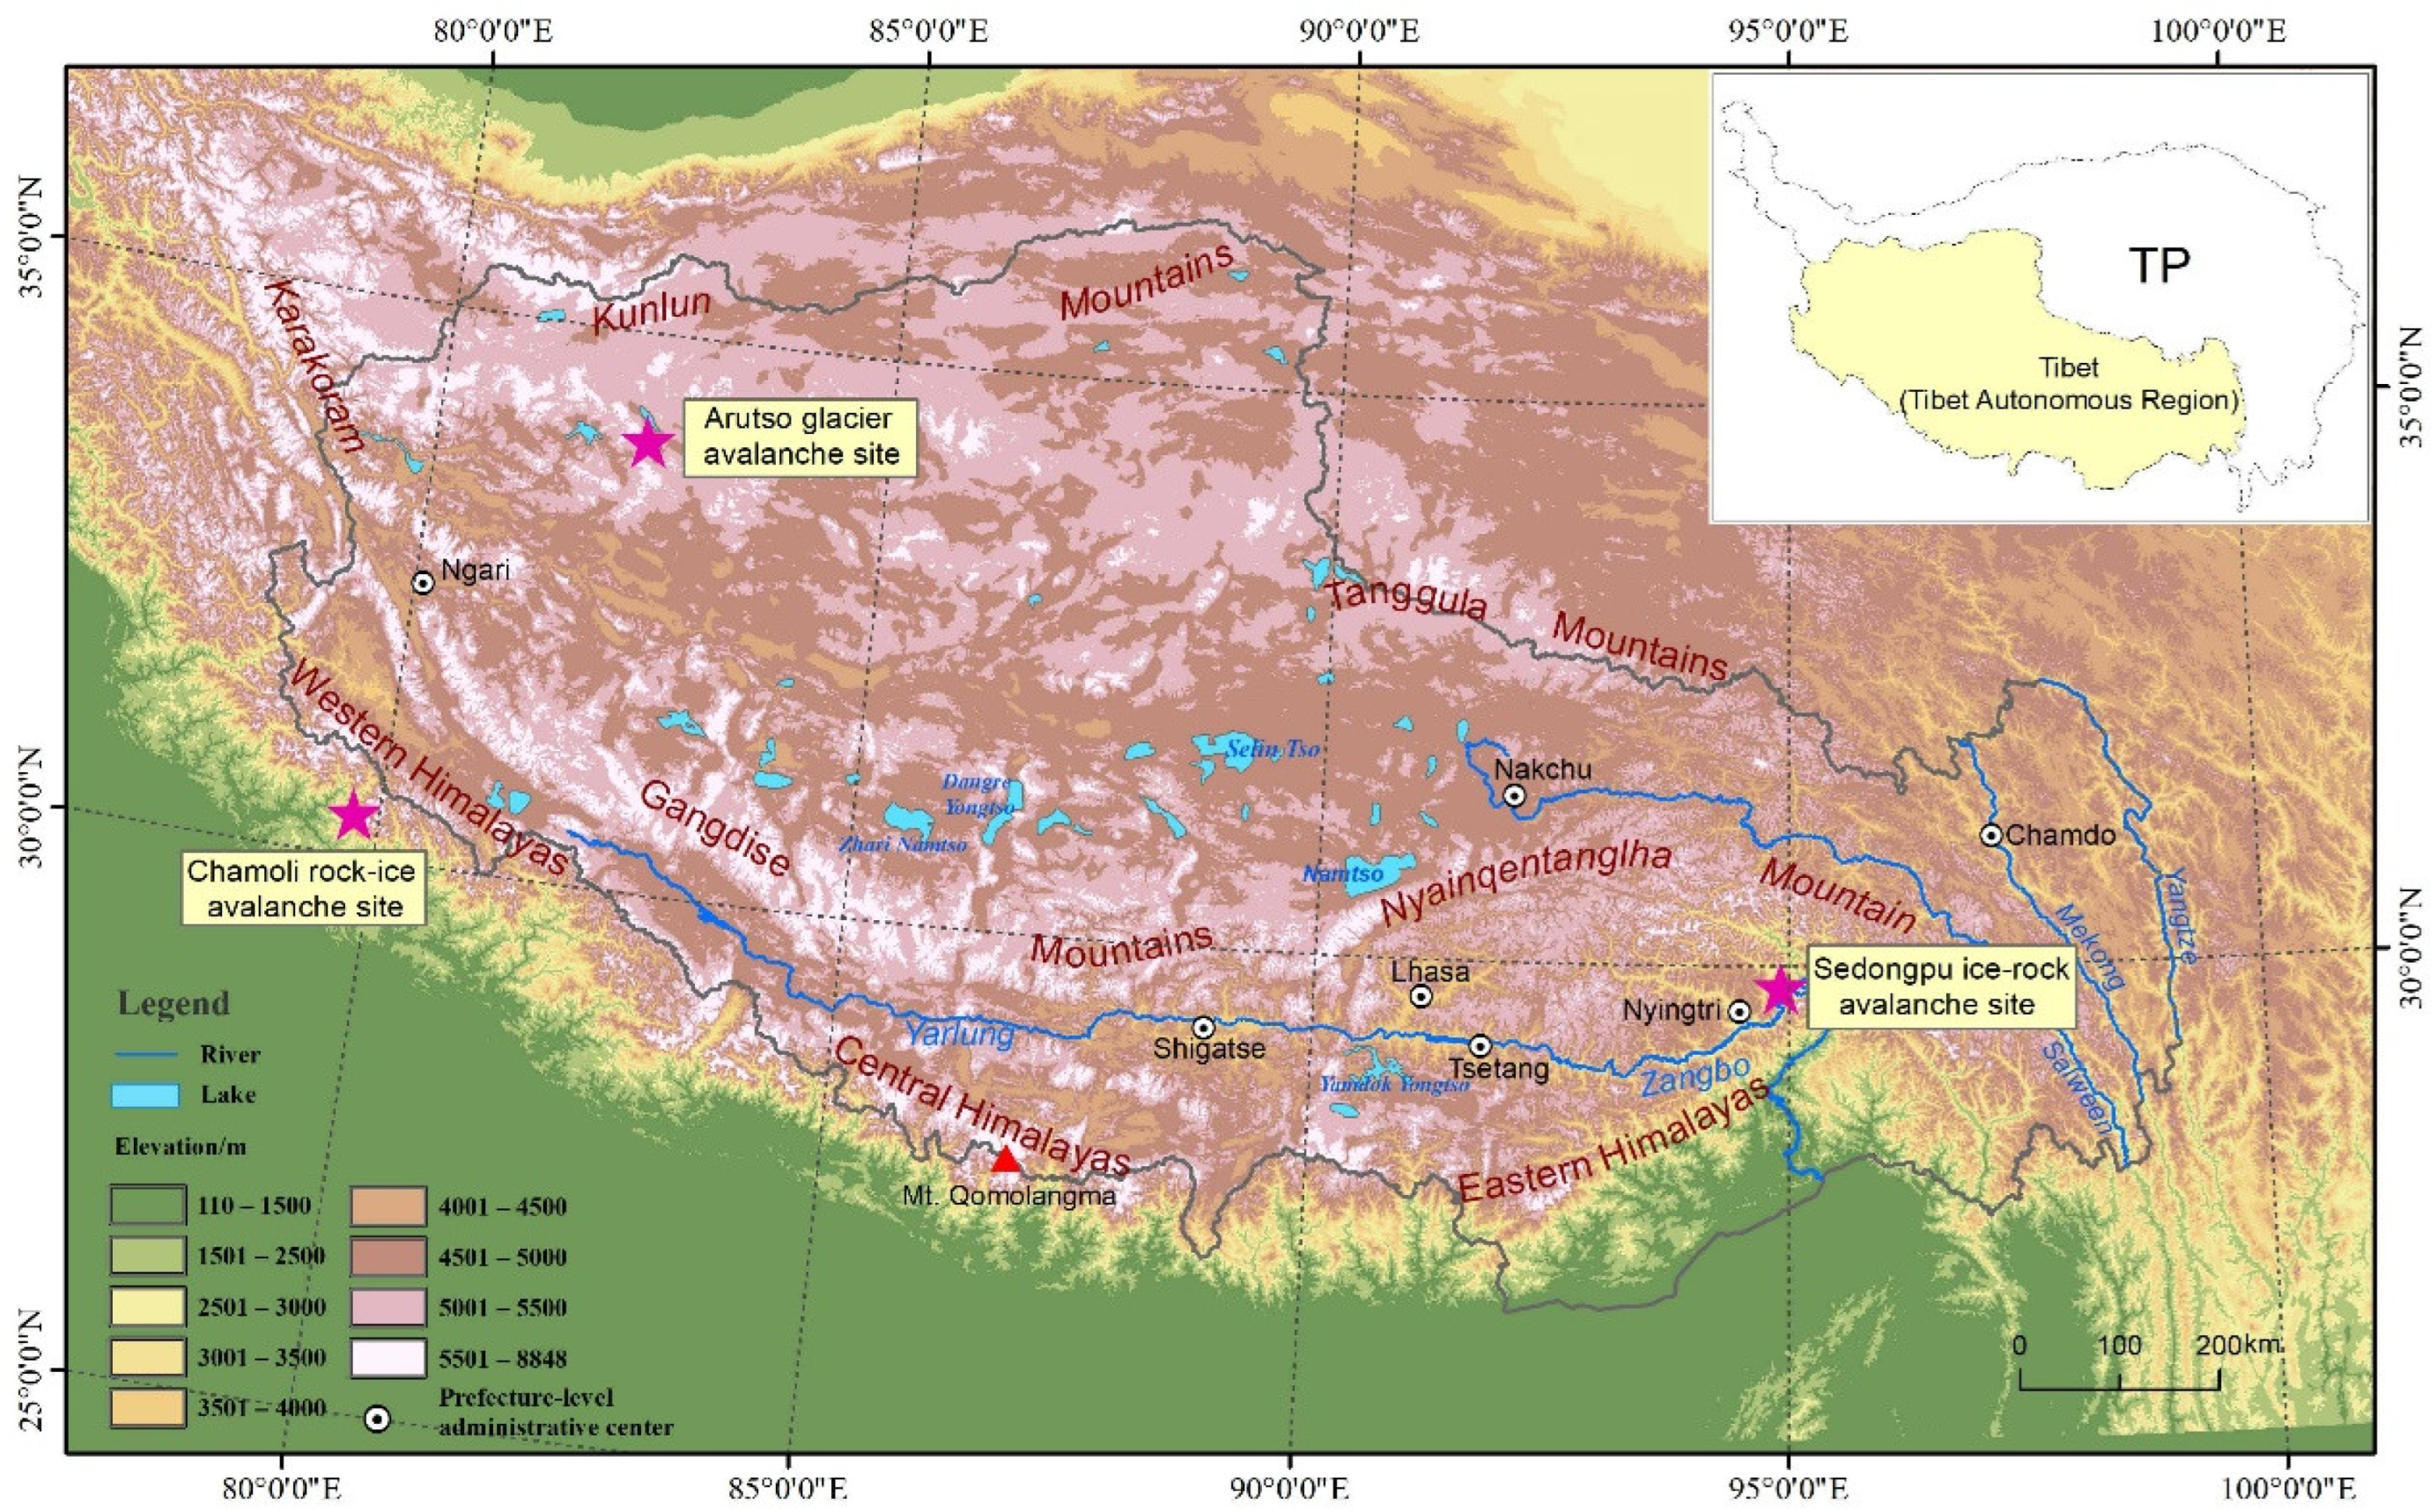
Figure 1. Study area and the locations of three ice-rock avalanche sites in Tibet and western Himalayas.
Preprints 104802 g001
Figure 2. Melting process and area change of ice avalanches of Arutso twin glaciers observed from Sentinel-2 images.
Preprints 104802 g002
Figure 3. Area change of avalanche deposit of Arutso twin glaciers observed from Sentinel-2 images.
Preprints 104802 g003
Figure 4. Field photos taken on February 16, 2022 in glacier avalanche sites (a: photo point 1 towards Arutso-53; b: photo point 2 towards Arutso-53; c: photo point 3 towards Arutso-50; d: photo point 3 towards Arutso lake; the location of photo points is shown in Figure 2b).
Preprints 104802 g004
Figure 5. Sentinel-2 images of ice-rock avalanches in the Sedongpu basin.
Preprints 104802 g005
Figure 6. Sentinel-2 images of basin outlet and river confluence.
Preprints 104802 g006
Figure 7. Field investigation in Gyala village: (left) Yarlung Zangbo river, (right) looking at Yarlung Zangbo river bridge from Gyala village.
Preprints 104802 g007
Figure 8. Sentinel-2 images of rock-ice collapse event in Chamoli area in the western Himalayas: (a-b) before and (c) after hazard chain event.
Preprints 104802 g008
Table 1. MSI sensors.
Band number Central wavelength /nm Bandwidth /nm Spatial resolution /m Main applications
Band 1-Coastal and aerosol 443 20 60 Atmospheric correction
Band 2-Blue 490 65 10 Sensitive to vegetation and aerosol scattering
Band 3-Green 560 35 10 Green peak, sensitive to total chlorophyll in vegetation
Band 4-Red 665 30 10 Max chlorophyll absorption
Band 5-Vegetation red edge 1 705 15 20 Vegetation detection
Band 6-Vegetation red edge 2 740 15 20 Vegetation detection
Band 7-Vegetation red edge 3 783 20 20 Vegetation detection
Band 8-NIR 842 115 10 Leaf Area Index (LAI)
Band 8a-Narrow NIR 865 20 20 Used for water vapour absorption reference
Band 9-Water vapour 940 20 60 Water vapour absorption atmospheric correction
Band 10 SWIR-cirrus 1375 30 60 Detection of thin cirrus for atmospheric correction
Band 11 SWIR1 1610 90 20 Snow and cloud detection
Band 12 SWIR2 2190 180 20 AOT(aerosol optical thickness) determination
Disclaimer/Publisher’s Note: The statements, opinions and data contained in all publications are solely those of the individual author(s) and contributor(s) and not of MDPI and/or the editor(s). MDPI and/or the editor(s) disclaim responsibility for any injury to people or property resulting from any ideas, methods, instructions or products referred to in the content.
Copyright: This open access article is published under a Creative Commons CC BY 4.0 license, which permit the free download, distribution, and reuse, provided that the author and preprint are cited in any reuse.
Prerpints.org logo

Preprints.org is a free preprint server supported by MDPI in Basel, Switzerland.

Subscribe

© 2024 MDPI (Basel, Switzerland) unless otherwise stated