1. Introduction
Infection by the rubella virus is typically mild [
1] with symptoms that are often sub-clinical or absent [
2]. However, infection in early pregnancy can cause miscarriage, stillbirth, or congenital rubella syndrome (CRS) [
3]. Only individuals that are still susceptible to rubella infection during child-bearing age are vulnerable to this burden.
A single dose of rubella containing vaccine (RCV) induces high seroconversion rates (≥95%) and provides long-term immunity, like that produced by natural infection. In most countries, RCV is administered along with measles vaccine and follows the two-dose schedule for measles. Rubella control efforts benefit from established measles control programs; RCV introduction is typically achieved by switching from monovalent measles containing vaccine (MCV) to bivalent measles-rubella (MR) vaccine. This switch leverages established delivery modes and avoids many logistical challenges associated with new vaccine introduction. Switching to a bivalent vaccine leads to around a two-fold increase in its cost, but the vaccine cost is a minority component in the cost of total delivery [
4].
Global incidence of rubella and the burden of CRS has decreased significantly since the introduction of a rubella containing vaccine in 1969. A majority of remaining burden is in countries that do not routinely vaccinate for rubella [
5,
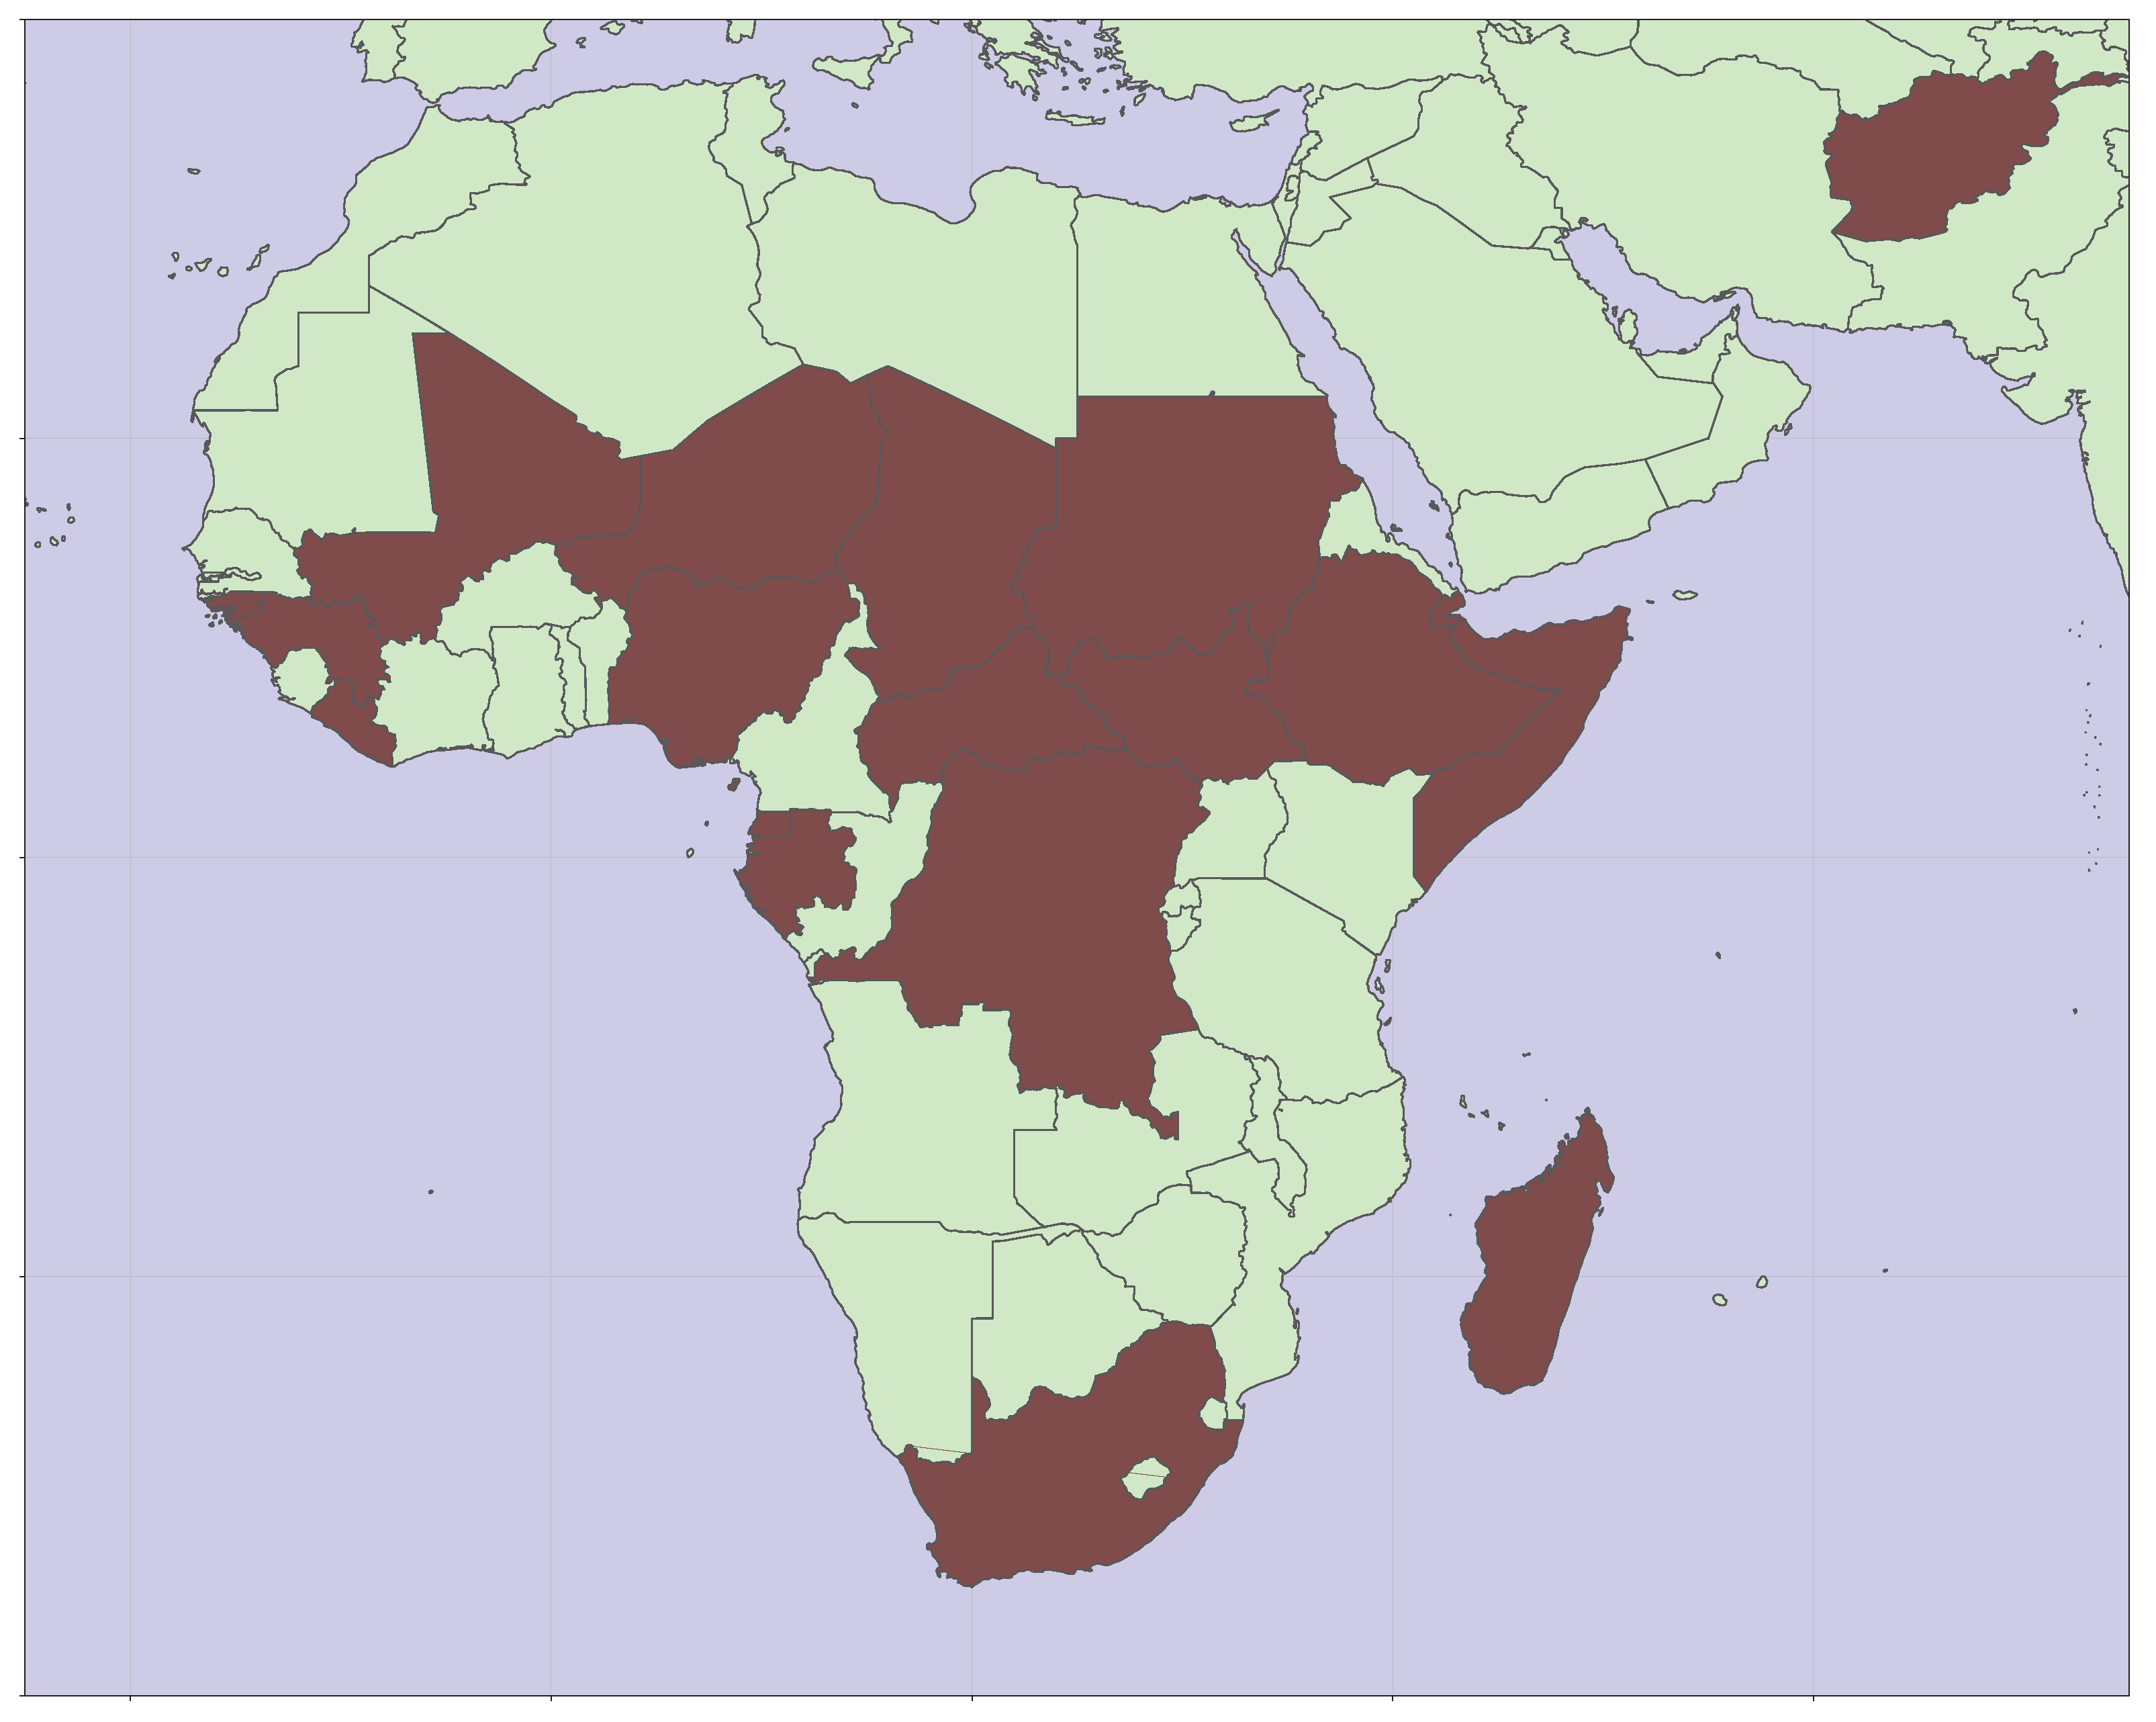
6]. As of 2024, nineteen countries have yet to introduce RCV into their recommended schedule for vaccination. As shown in
Figure 1, these countries are predominantly in sub-Saharan Africa.
Average age-at-infection increases with increasing vaccination coverage, which can potentially lead to increased disease burden if rubella infection risk during child-bearing age increases. The primary consideration when deciding to introduce RCV is ensuring that the burden of disease does not increase. Current guidance suggests that countries planning to introduce RCV should have at least
coverage with first dose of measles vaccine [
7]. This level of coverage was established to support control of rubella in very high transmission settings [
8] and is sufficient for elimination in nearly all contexts.
Figure 1.
Map showing the locations of nineteen countries yet to introduce RCV [
9].
Figure 1.
Map showing the locations of nineteen countries yet to introduce RCV [
9].
Sustained rubella transmission tends to occur only in large populations, with interruption of transmission occurring during epidemic troughs in smaller communities [
10]. Local extinction will tend to increase average age-at-infection by allowing individuals to remain susceptible for longer, possibly extending into child-bearing age. Outbreaks following re-introduction of the pathogen have the potential for elevated burden because of this accumulation of susceptibility.
Any approach to vaccination that ensures immunity before child-bearing age will lead to reduced burden. Historically, two primary approaches were considered: selective vaccination of girls and young women, and universal vaccination of infants [
11]. Selective vaccination aims to reduce burden without interrupting transmission, but can still result in an accumulation of susceptibility leading to severe outbreaks [
12]. Universal vaccination leading to the interruption of transmission is the preferred strategy for controlling rubella burden [
7], although selective vaccination can be a useful supplement when infant vaccination rates are low.
After RCV introduction, population immunity for rubella continues to be supported through supplemental immunization activities (SIA)s, although the schedule for these activities is dictated by needs for measles control [
13].
2. Materials and Methods
Dynamics of rubella transmission were explored using EMOD, a software tool for building stochastic, agent-based infection models [
14]. Details of the rubella model have been described previously [
15]. The model has been generalized by applying population and fertility estimates for sub-Saharan Africa from the United Nations World Population Prospects (WPP) [
16]. Use of a stochastic, agent-based model allows for exploring dynamics of interruption and re-introduction.
Simulations are initialized in 2000; outcomes from the first 20 years are ignored as endemic pathogen transmission is established. Results for the subsequent 40 years, from 2020 to 2060, are depicted for a variety of scenarios. In each scenario, RCV is introduced in 2025 at several levels of coverage. All scenarios include coverage as a reference to illustrate continued endemic transmission without vaccination.
Rubella burden includes miscarriage, stillbirth, and CRS. This study groups those outcomes together. The likelihood of burden associated with a rubella infection was approximated as
if infection occurs during the first trimester of pregnancy, and
if infection occurs in the four weeks prior to conception or in the first four weeks of the second trimester of pregnancy [
15].
Infectivity has been assumed to be uniform over all age groups. Other investigators [
6,
17,
18] include age-structure in force-of infection to more closely match observed serological profiles for rubella seronegativity (e.g., <13yrs, and 13+yrs; <3yrs, 3-15yrs, and 15+yrs). These age-structured estimates identify equal or lower infectivity in child-bearing age adults relative to younger age cohorts. Assuming no age structure to the infectivity is a simplifying assumption as well as a conservative one from the perspective of vaccine-associated risks. Reduced infectivity in child-bearing age adults leads to lower rubella burden.
3. Results
Modeled results depict an expected infection rate and burden for the various scenarios; each trajectory is averaged over ten-thousand stochastic outcomes. Individual timeseries are highly variable and include both outbreaks and periods of elimination. Persistent importation of rubella virus ensures that elimination only occurs when simulated immunity levels exceed the threshold for herd immunity (i.e., ). Above this threshold, infections still occur because of the importations, but they do not lead to sustained chains of transmission.
3.1. Representative Timeseries for Rubella Burden
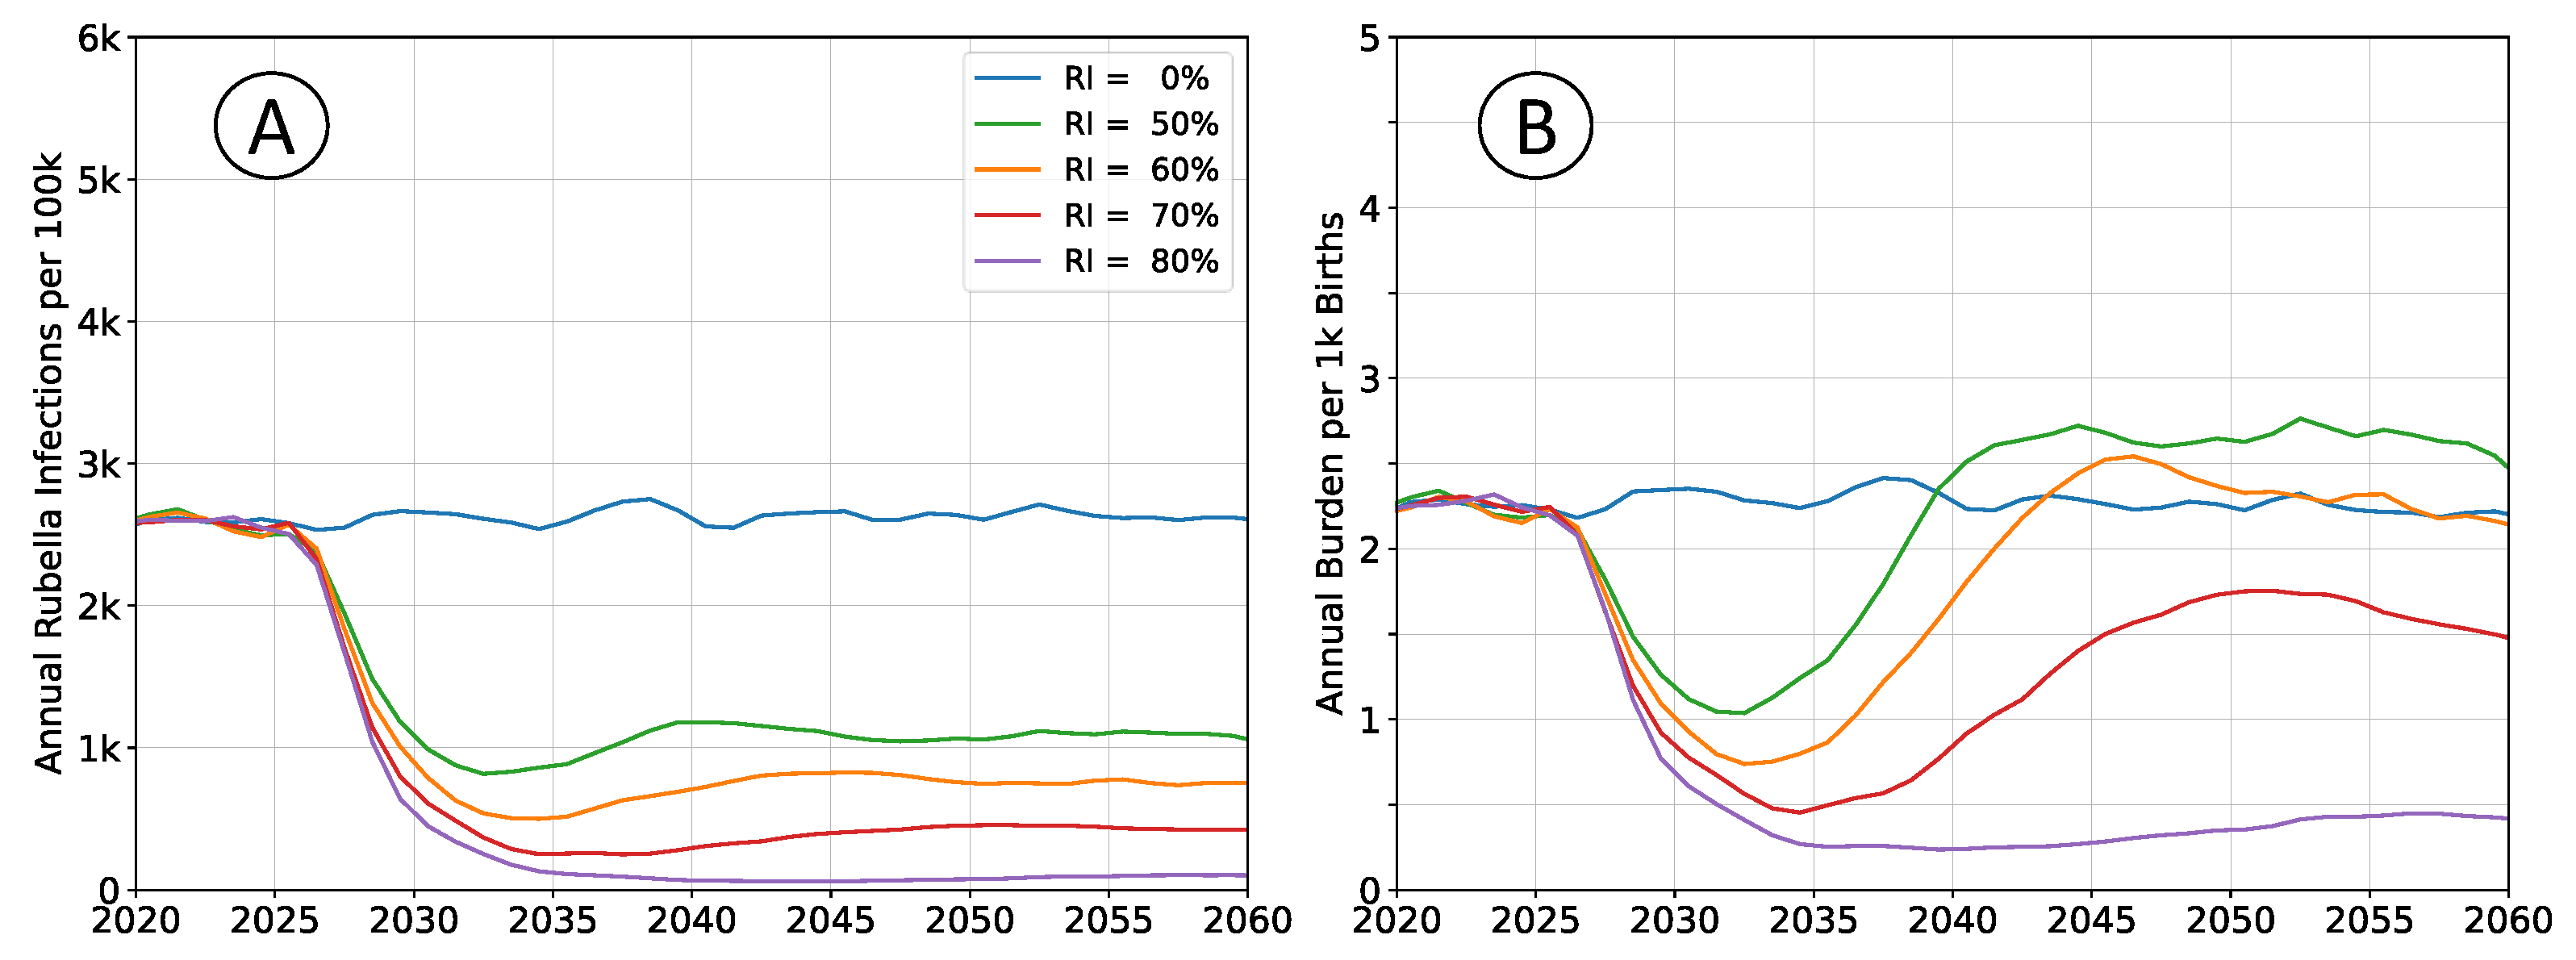
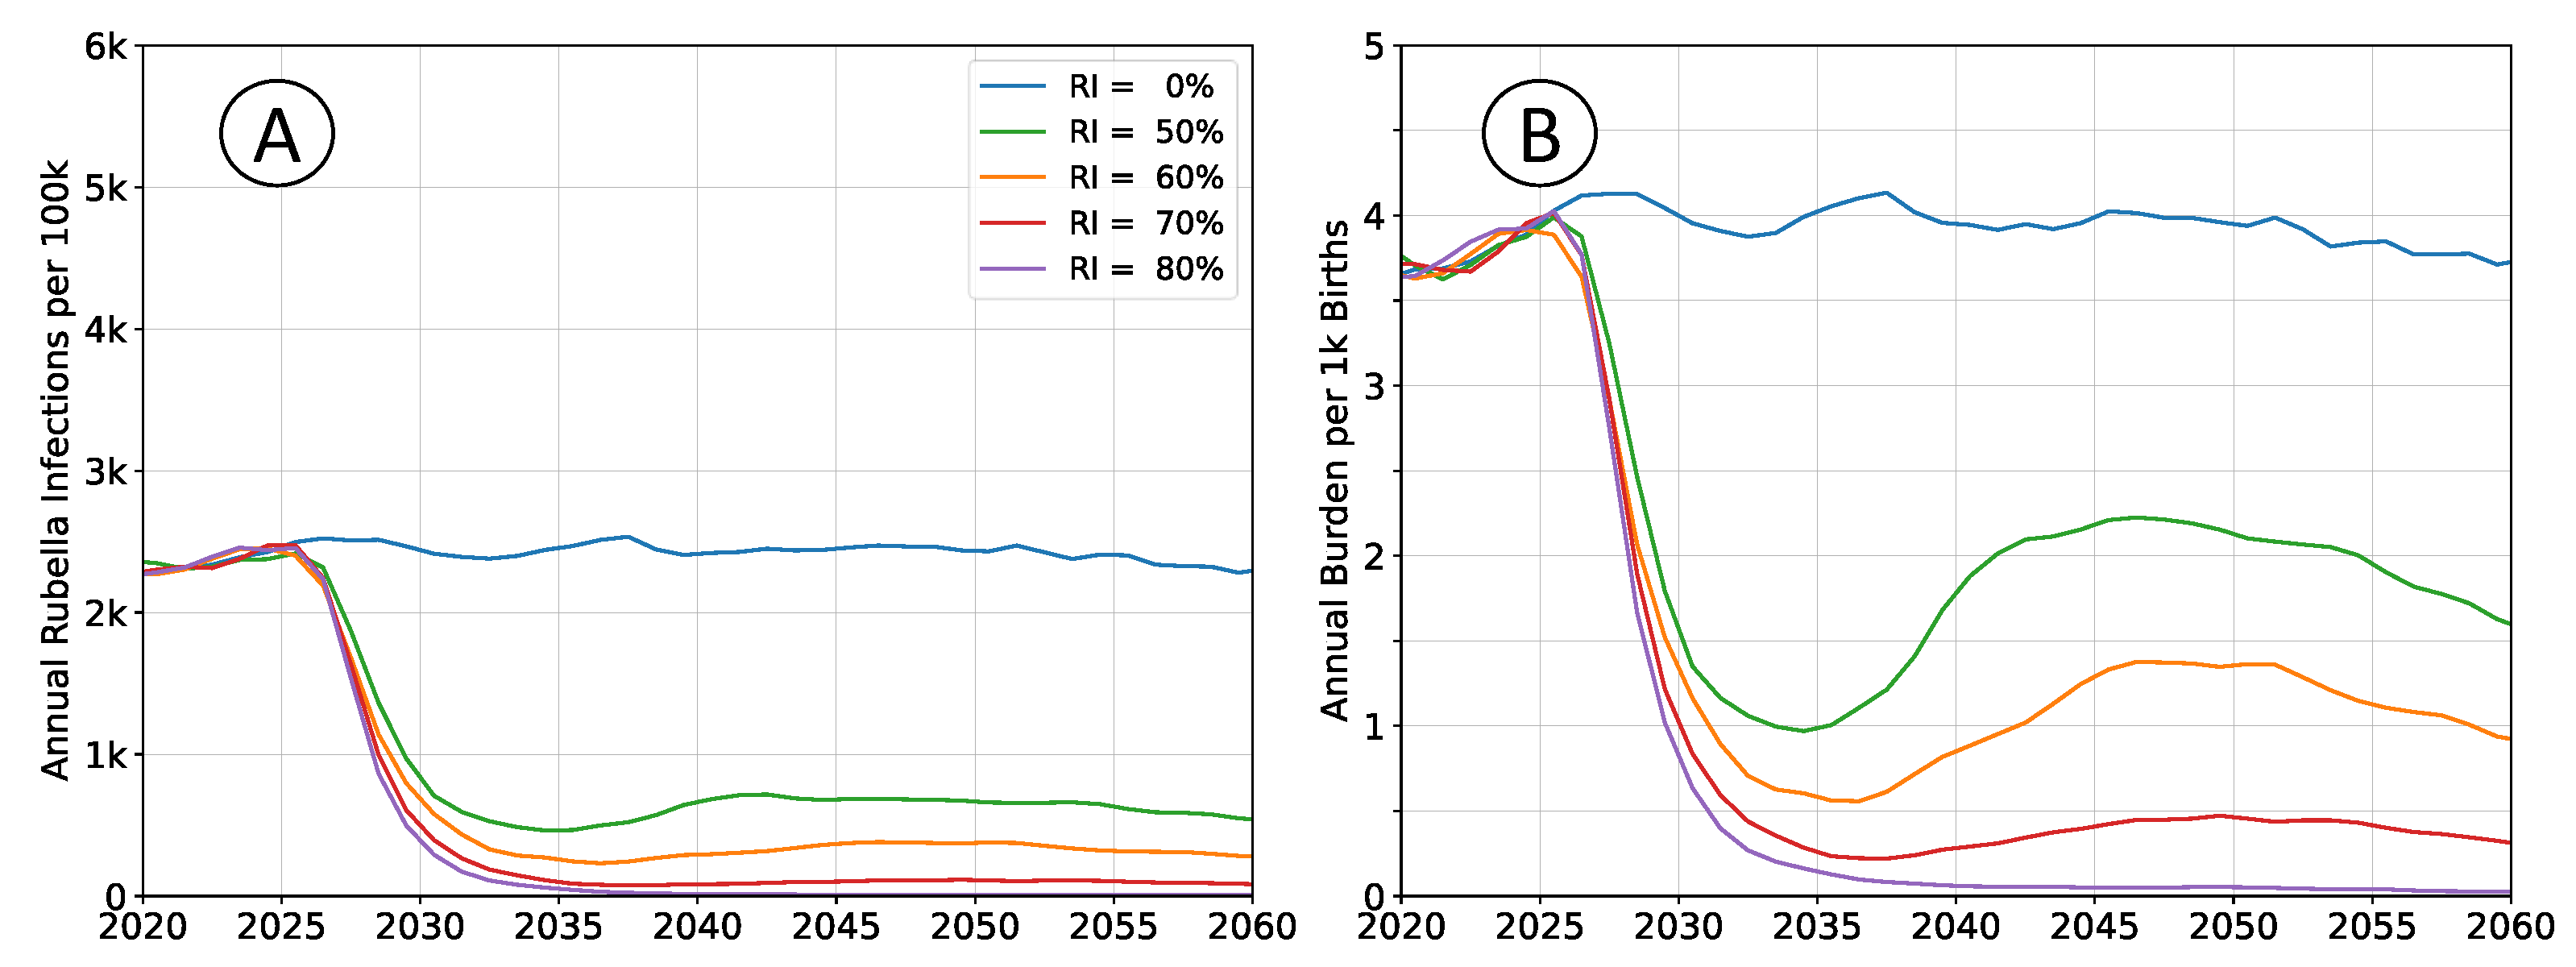
Outcomes depicted in
Figure 2 are of RCV introduction in 2025 through the routine immunization system only. Recommended vaccine introduction strategy is to simultaneously implement a wide age range (9mo - 15yrs) vaccination campaign as well [
7]. That approach leads to a step-change decrease in both infections and burden, with probable (although potentially impermanent) elimination of the pathogen. The catch-up campaign has been omitted in these scenarios to more clearly illustrate the dynamics of infection and burden. The age structure of the population is held constant at 2020 levels so that clearly defined equilibrium rates exists.
Following vaccine introduction, a new equilibrium infection rate will be established within a period of about 5 years. However, the rate of disease burden equilibrates over a period of 15 to 20 years. Time scales for infection are more rapid because they depend only on pathogen transmission. The burden of rubella infection depends on age-structured susceptibility, which is a demographic process that changes more slowly.
All rates of vaccination will initially reduce burden. Absence of a wide age range vaccine introduction campaign, or mediocre rates of vaccination cannot lead to an immediate burden increase. The potential for increased burden exists only around 15 years post vaccine introduction as a new, potentially susceptible cohort of individuals reaches child-bearing age.
3.2. Impact of a Demographic Transition
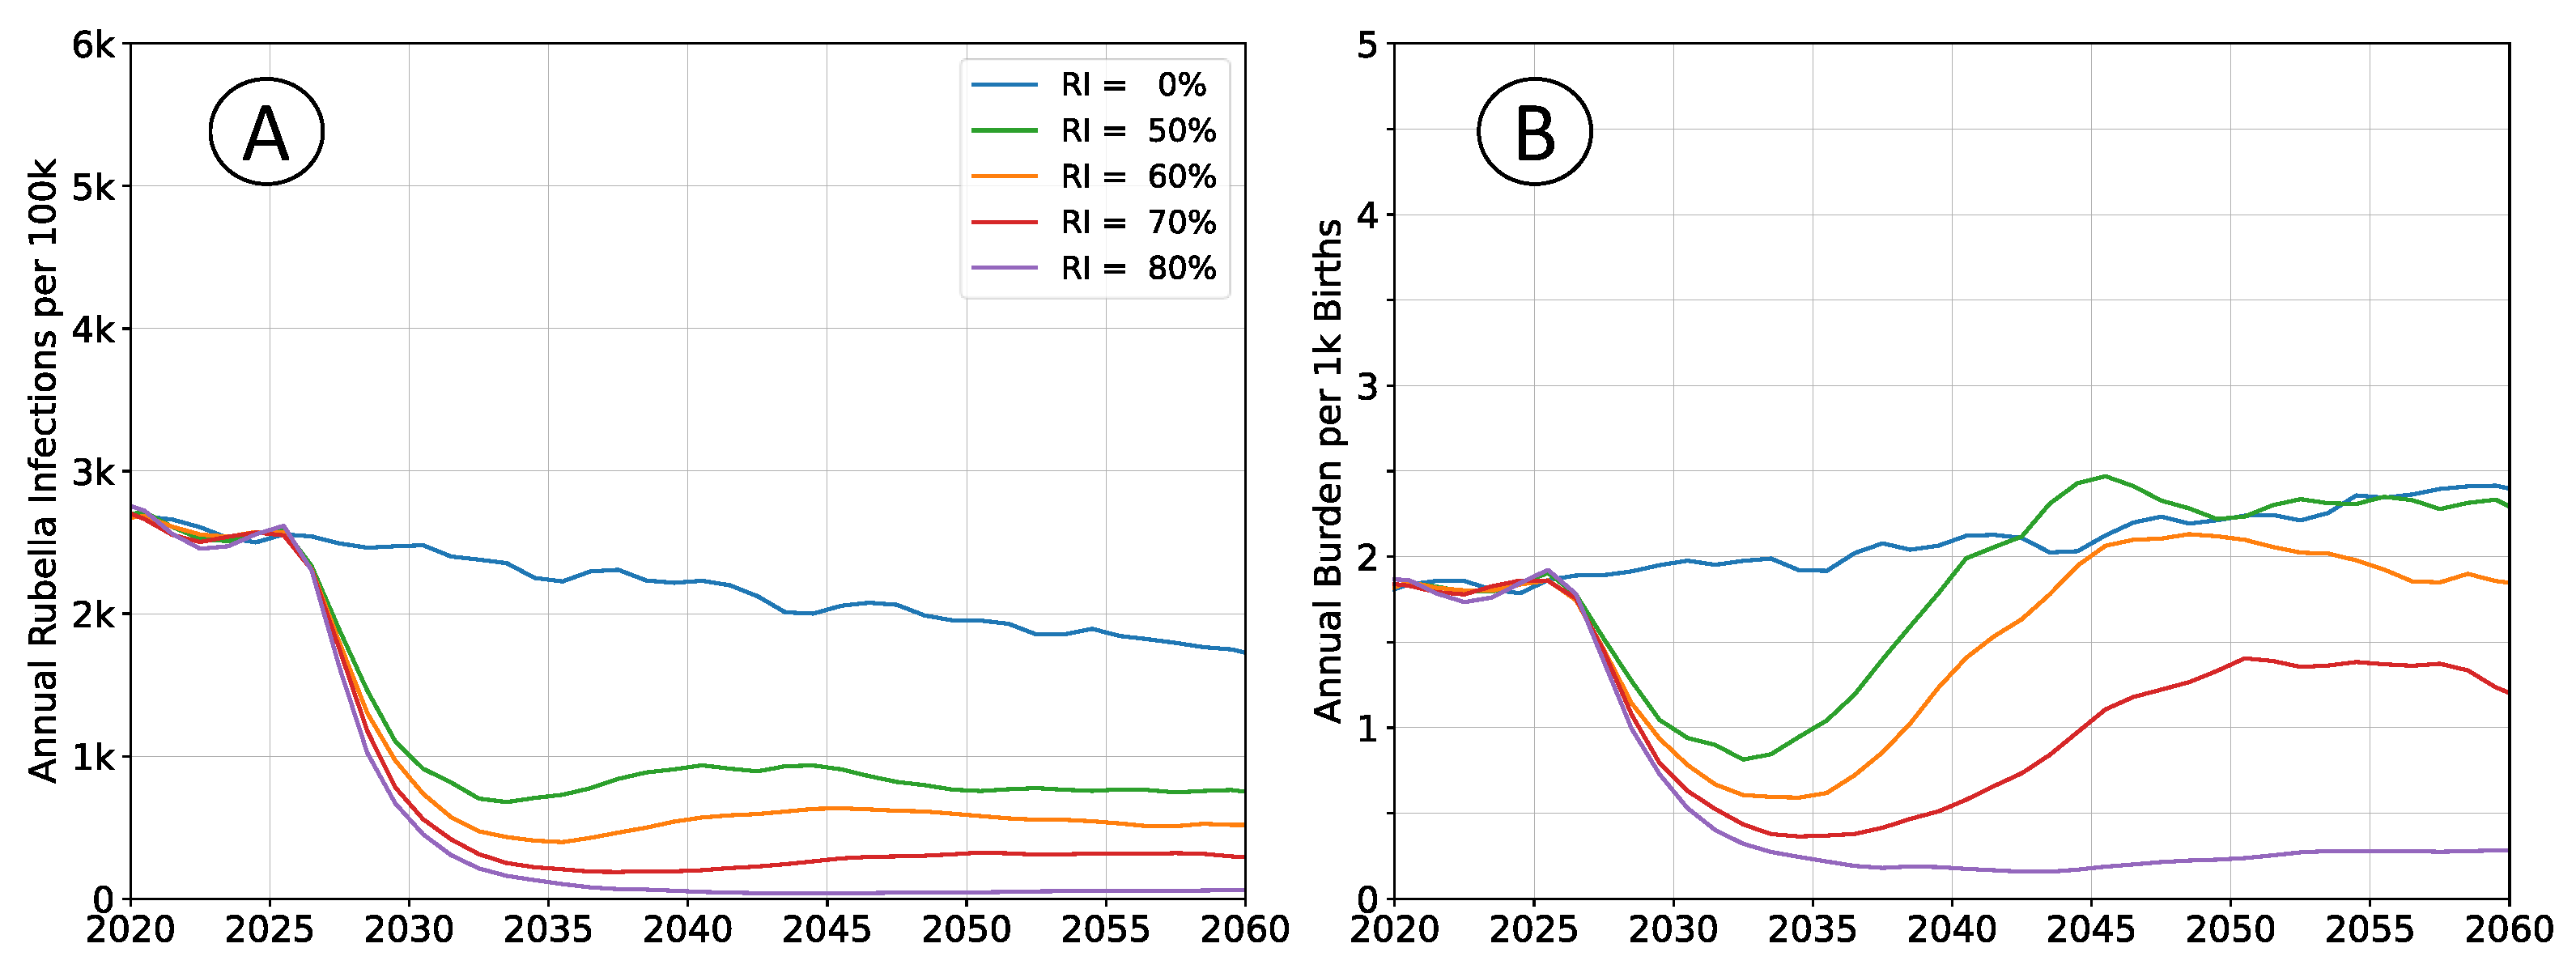
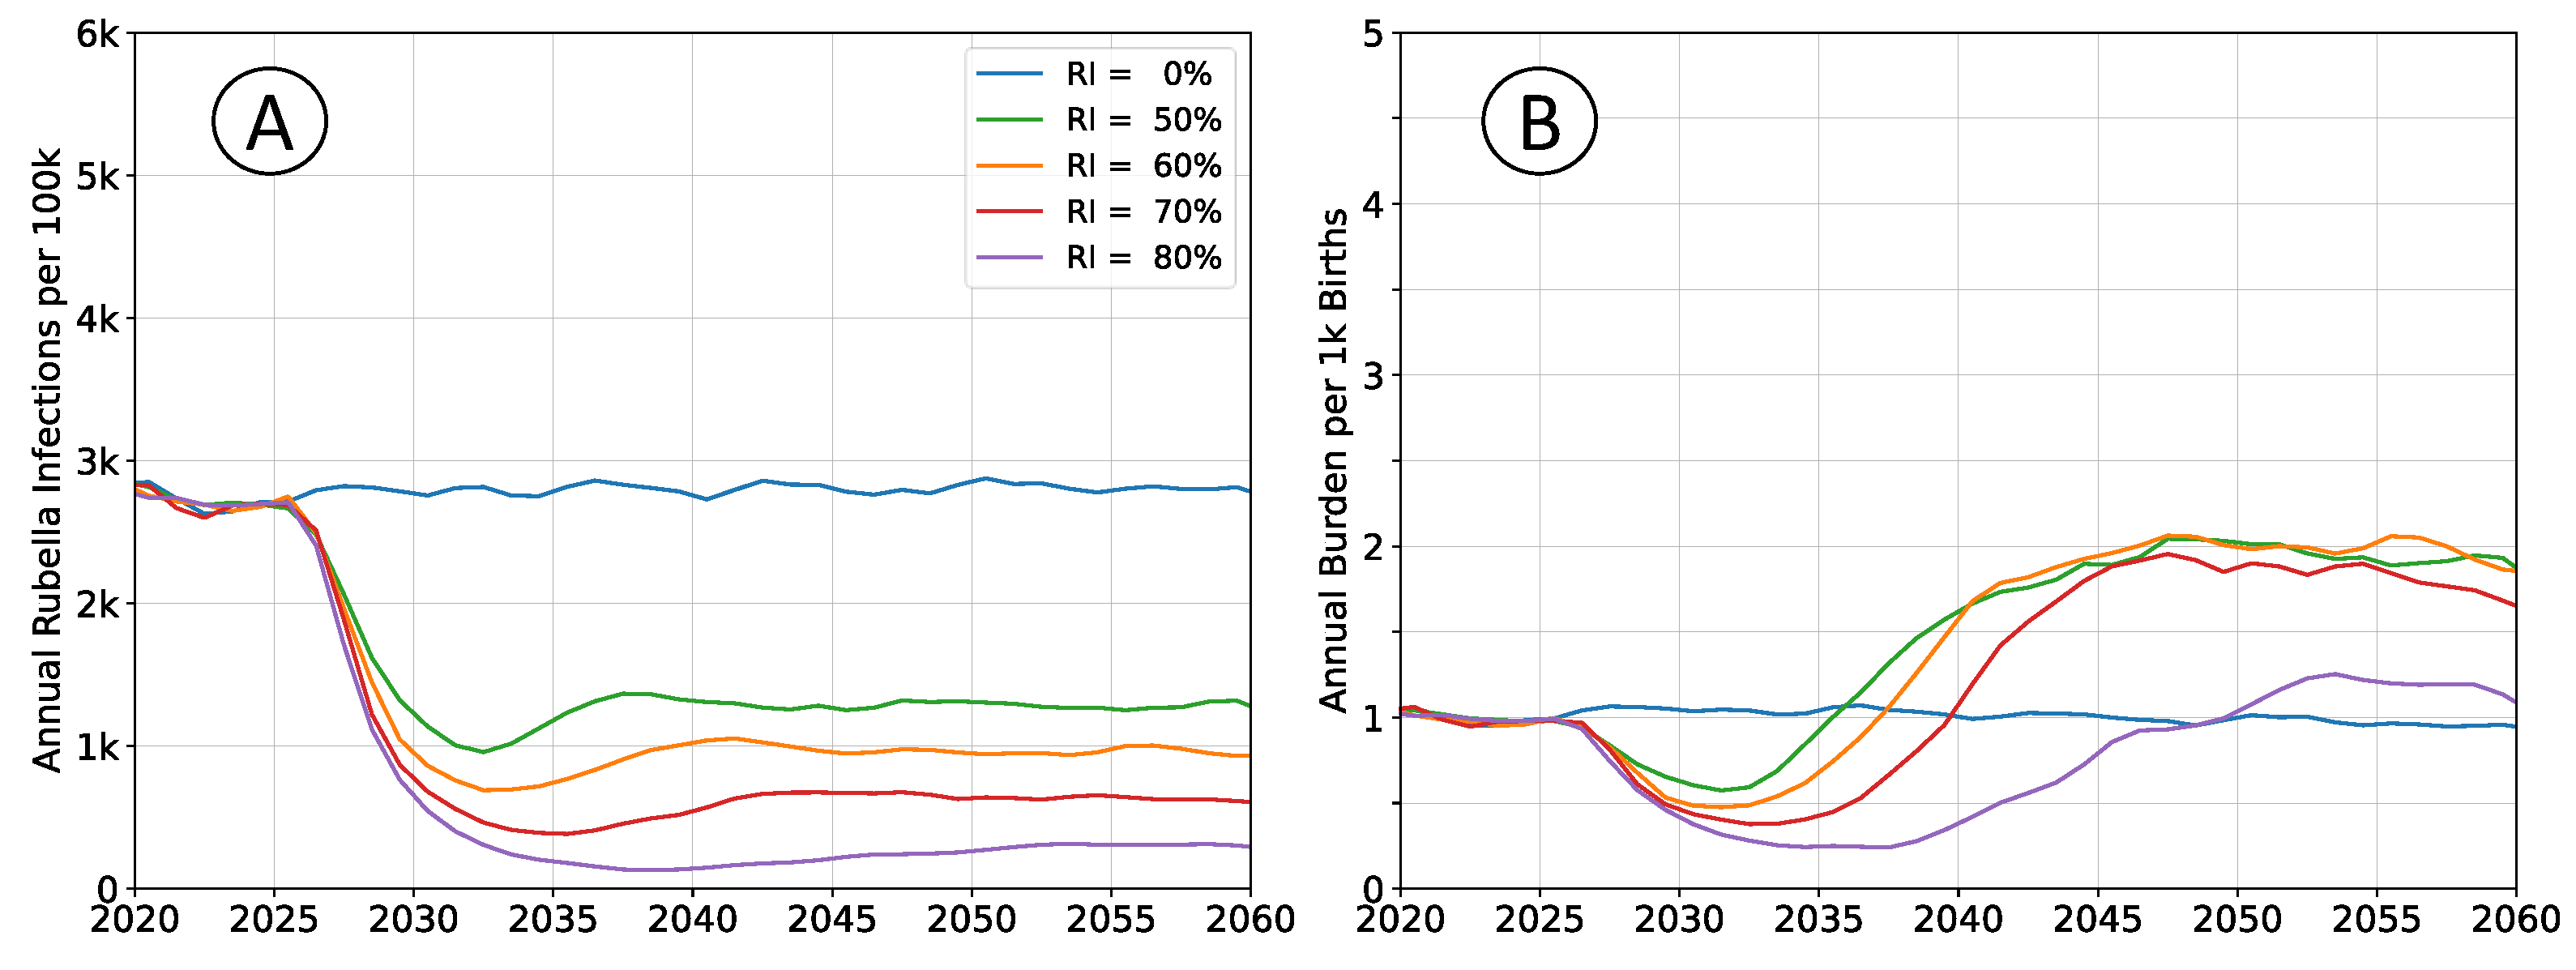
Outcomes depicted in
Figure 3 reproduce those in
Figure 2, but do not enforce a constant population pyramid. The age structure of the population evolves as described by medium forward projections from the UN WPP for sub-Saharan Africa. Declining fertility affects infection rates in a manner that is analogous to moderately increasing rates of vaccination.
Absent of vaccination, rubella incidence will trend downward, and burden will trend upward. Post-vaccine introduction, any non-zero rate of RCV use will lead to greater reductions in burden than would be estimated by assuming a steady-state population structure.
3.3. Population Connectivity Considerations
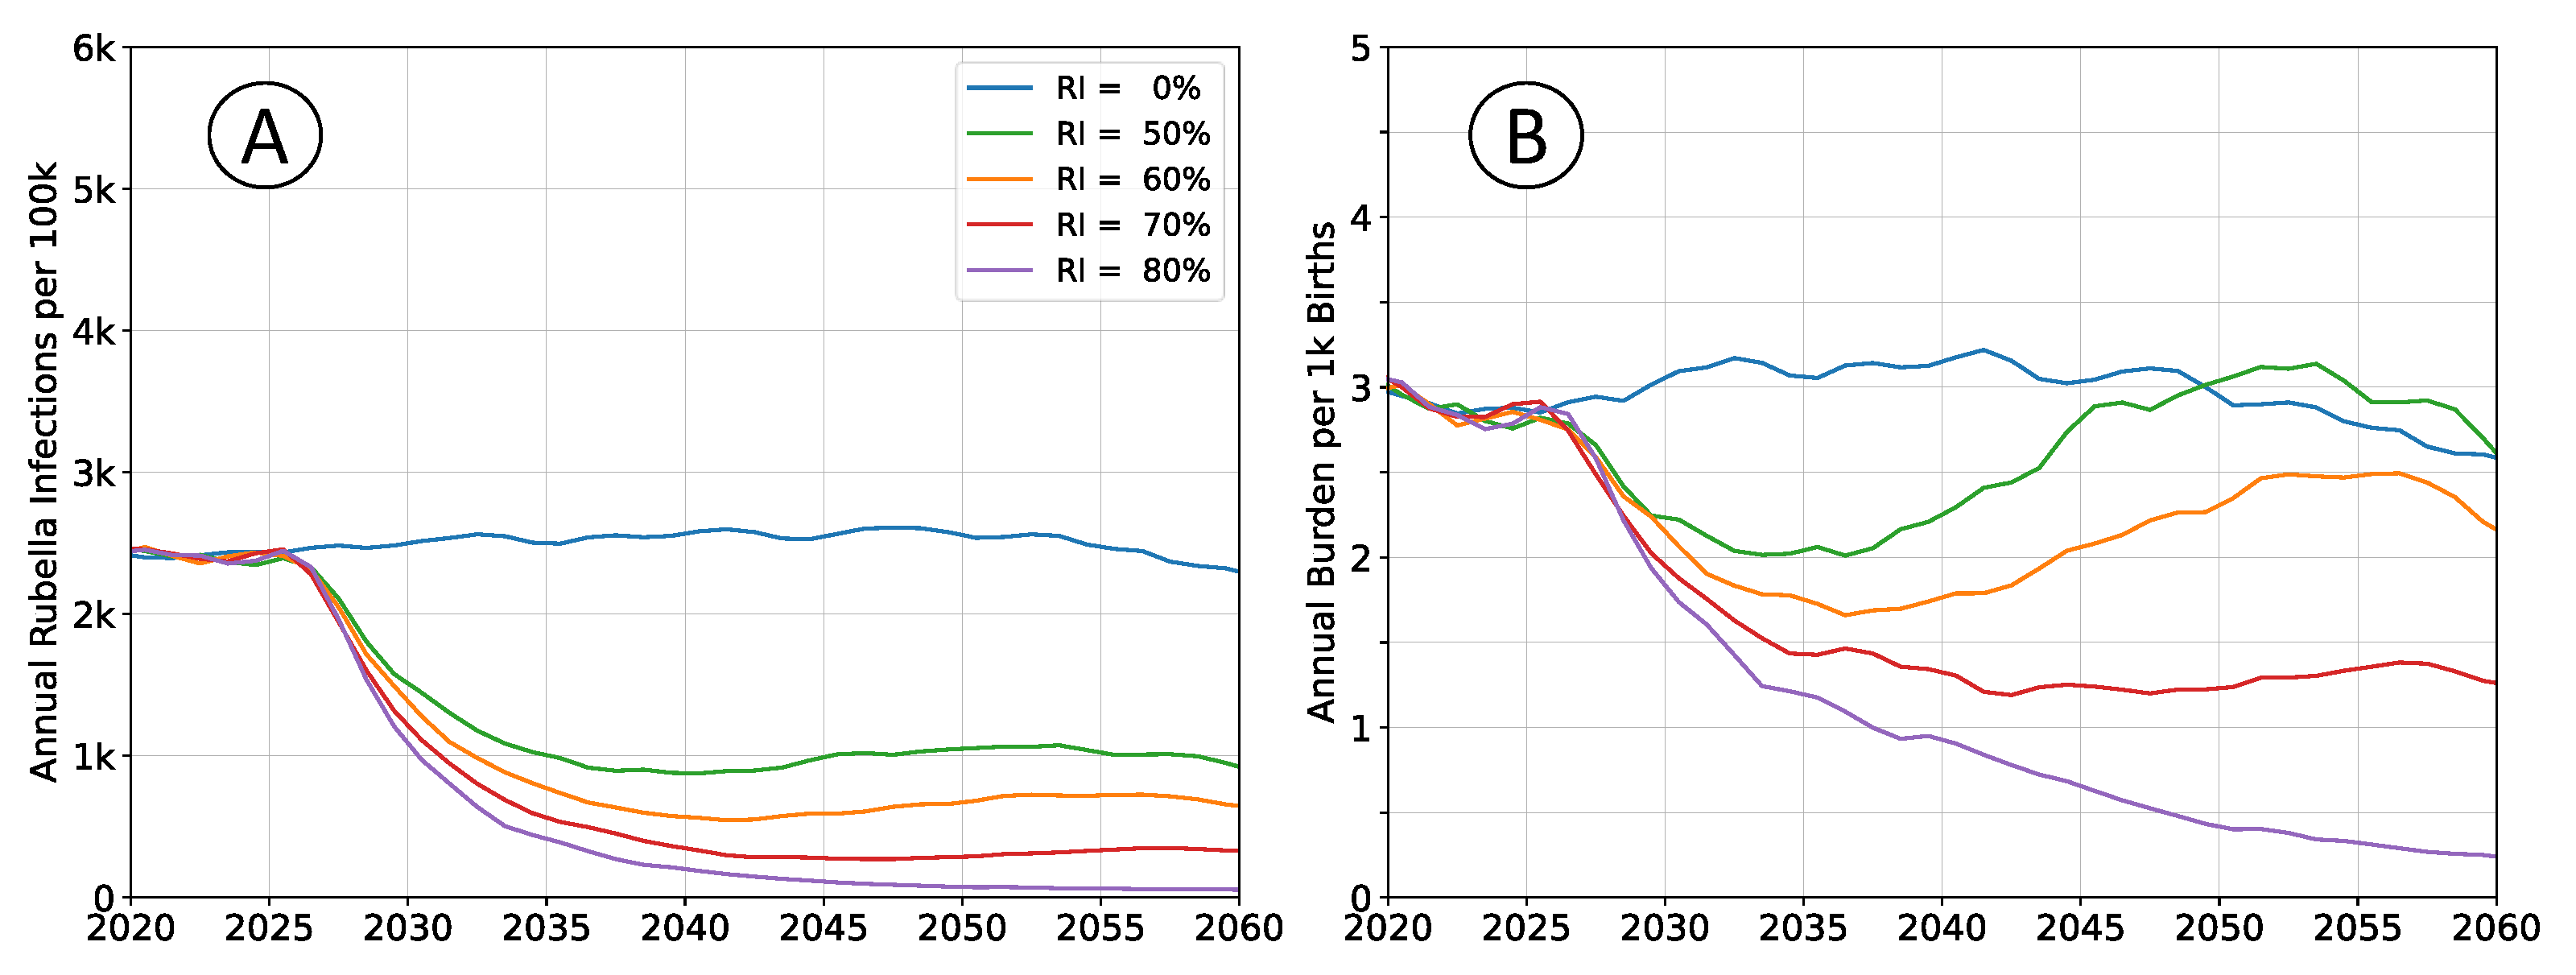
Outcomes depicted in
Figure 4 reproduce those in
Figure 2, but subdivide the population into four non-interacting, but otherwise identical sub-populations. Total simulated population remains unchanged, and the rate of pathogen importation events also remains unchanged.
Equilibrium infection rates are similar to simulations with a well-mixed population, although the time scale for attaining that equilibrium increased. Birth rates and vaccination rates are the same in both scenarios; outbreaks are limited by the size of sub-population leading to overall slower dynamics and accumulation of susceptible agents. Equilibrium burden is elevated, around , compared to between and in well-connected simulations, which aligns with the accumulation of susceptibility and an increased average age-at-infection.
3.4. Variability of Transmission Intensity
Assumptions regarding the intensity of pathogen transmission have the largest effect on estimated rubella burden. Simulations examining demographics and connectivity assumed transmission intensity such that the mean
value was
, near the middle of the typical range of
to
[
19]. Outcomes for when assuming
is
are presented in in
Figure 5; outcomes for when assuming
is
are presented in in
Figure 6.
Infection rates absent vaccination are roughly equivalent in both scenarios. Rubella infection provides lifelong immunity, and almost all susceptible individuals will eventually be infected, even at lower transmission intensity. However, an individual’s expected age-at-infection increases in the low transmission scenarios, leading to elevated burden. This effect is non-linear over the range illustrated. Increasing from to halves burden in the no vaccine scenarios, while reducing from to nearly doubles burden.
Vaccine effectiveness trends are similar to burden trends. Vaccination at lower transmission intensity is much more effective, and decreases rubella burden relative to baseline at all levels of coverage. At higher transmission intensities, intermediate levels of vaccination have elevated levels of equilibrium burden, and higher coverage is required to ensure a decrease in burden.
4. Discussion
All outcomes are presented using mean trajectories, which does not highlight important differences in the distribution of burden. As vaccination coverage increases, the variability of outbreaks also increases [
20]. The likelihood of interruption increases with increasing vaccination, with more frequent periods of zero infection. Endemic transmission at low vaccination coverages transitions into long periods of interruption, where importation can lead to a large outbreak. At intermediate vaccination coverages, where long-term average rubella burden may appear comparable to scenarios without vaccination, the median burden will still have decreased. With increasing vaccination coverage, total burden is concentrated into fewer, larger outbreaks.
Baseline scenarios depict a setting where a rate of vaccination is sufficient to avoid a long-term increase in burden. Accurately incorporating the expected demographic transition for those scenarios reduces that rate to . All simulations leverage demographics for sub-Saharan Africa, which are generally appropriate for all countries that have not yet introduced the vaccine, but not specific to any individual country. Above average fertility rates would be expected to decline more rapidly, and below average rates would be expected to decline more slowly. Both variations, either fertility declining more rapidly than average, or starting at a lower level than average, reduce the likelihood of increased burden due to vaccination.
Disconnected sub-populations result in slower dynamics than the well-mixed populations of the baseline scenario. These outcomes emphasize the value of implementing wide-age range vaccination campaigns concurrent to vaccine introduction through the routine immunization system. Vaccination campaigns lead to step-change decreases in both infection rate and burden, which provide the greatest benefit to disconnected sub-populations, such as those that may be geographically remote or rural locations. Reduced connectivity also elevates burden with respect to the baseline scenario, which again corresponds to greater vaccine effectiveness.
Rubella infectivity is uncertain for most settings, and sub-national variation is expected for large, heterogeneous countries such as Nigeria [
18] or the Democratic Republic of the Congo [
15]. Neglecting demographic and connectivity effects, demonstration outcomes suggest a vaccination rate of
would decrease the equilibrium rate of burden for
(from 4 to 2), increase the equilibrium rate of burden for
(from 1 to 2), and not change the equilibrium rate for
. Even when all levels of infectivity are equally likely, the net effect of this vaccination rate would be to lower burden. However, not all levels of rubella infectivity are equally likely, with values
more probable [
19,
21].
Outcomes presented here are not intended to identify appropriate vaccination thresholds for RCV introduction, they emphasize a fixed, generally applicable threshold is inappropriate. The risk for increased rubella burden exists only decades in the future for settings with persistently high fertility, high connectivity, and high infectivity. It is not a hypothetical risk [
8], but it is a sufficiently unlikely risk that a policy focused on mitigating it neglects most contexts. Locations without the risk of increased burden are also those experiencing the highest current levels of burden, and where vaccination would be most effective.
Funding
This work is based on research conducted by Institute for Disease Modeling, a research group within, and solely funded by, the Bill and Melinda Gates Foundation.
Data Availability Statement
Acknowledgments
Many thanks to Kari Hanson and the Xplore research program at Stanford’s Institute for Computational & Mathematical Engineering. Development of these scenarios was supported by several student research groups: Fan Liu, Helen Gu, and Xiaoying Shi (demographic trends); Weian Yin (immunization trends); Nina Cruz (immunization disruptions); Benson Zu and Maximilian Sabayev (connectivity and population size effects).
Conflicts of Interest
The funders had no role in the analysis, or interpretation of the data; the preparation, review, or approval of the report; or the decision to submit the manuscript for publication. All authors are employees of the Bill and Melinda Gates Foundation, however, this study does not necessarily represent the views of the Bill and Melinda Gates Foundation.
References
- Lambert, N.; Strebel, P.; Orenstein, W.; Icenogle, J.; Poland, G.A. Rubella. The Lancet 2015, 385, 2297–2307. [Google Scholar] [CrossRef]
- Centers for Disease Control and Prevention. Epidemiology and Prevention of Vaccine-Preventable Diseases; Public Health Foundation: Washington, DC, USA, 2021. [Google Scholar]
- Boshoff, L.; Tooke, L. Congenital rubella - is it nearly time to take action? South African Journal of Child Health 2012, 6. [Google Scholar] [CrossRef]
- Zimmermann, M.; Frey, K.; Hagedorn, B.; Oteri, A.J.; Yahya, A.; Hamisu, M.; Mogekwu, F.; Shuaib, F.; McCarthy, K.A.; Chabot-Couture, G. Optimization of frequency and targeting of measles supplemental immunization activities in Nigeria: A cost-effectiveness analysis. Vaccine 2019, 37, 6039–6047. [Google Scholar] [CrossRef] [PubMed]
- Vynnycky, E.; Knapp, J.K.; Papadopoulos, T.; Cutts, F.T.; Hachiya, M.; Miyano, S.; Reef, S.E. Estimates of the global burden of Congenital Rubella Syndrome, 1996-2019. International Journal of Infectious Diseases 2023, 137, 149–156. [Google Scholar] [CrossRef] [PubMed]
- Vynnycky, E.; Adams, E.J.; Cutts, F.T.; Reef, S.E.; Navar, A.M.; Simons, E.; Yoshida, L.M.; Brown, D.W.J.; Jackson, C.; Strebel, P.M.; et al. Using Seroprevalence and Immunisation Coverage Data to Estimate the Global Burden of Congenital Rubella Syndrome, 1996-2010: A Systematic Review. PLOS ONE 2016, 11, 1–20. [Google Scholar] [CrossRef]
- World Health Organization. Rubella vaccines: WHO position paper – July 2020. Weekly Epidemiological Record 2020, 95, 306–324. [Google Scholar]
- Cutts, F.T.; Abebe, A.; Messele, T.; Dejene, A.; Enquselassie, F.; Nigatu, W.; Nokes, D.J. Sero-epidemiology of rubella in the urban population of Addis Ababa, Ethiopia. Epidemiology and Infection 2000, 124, 467–479. [Google Scholar] [CrossRef] [PubMed]
- ESRI. World Countries - Generalized.
- Rozhnova, G.; Metcalf, C.J.E.; Grenfell, B.T. Characterizing the dynamics of rubella relative to measles: the role of stochasticity. Journal of the Royal Society Interface 2013, 10, 20130643. [Google Scholar] [CrossRef] [PubMed]
- Knox, E.G. Strategy for Rubella Vaccination. International Journal of Epidemiology 1980, 9, 13–23. [Google Scholar] [CrossRef] [PubMed]
- Ujiie, M.; Nabae, K.; Shobayashi, T. Rubella outbreak in Japan. The Lancet 2014, 383, 1460–1461. [Google Scholar] [CrossRef]
- Cutts, F.T.; Danovaro-Holliday, M.C.; Rhoda, D.A. Challenges in measuring supplemental immunization activity coverage among measles zero-dose children. Vaccine 2021, 39, 1359–1363. [Google Scholar] [CrossRef] [PubMed]
- Bershteyn, A.; Gerardin, J.; Bridenbecker, D.; Lorton, C.W.; Bloedow, J.; Baker, R.S.; Chabot-Couture, G.; Chen, Y.; Fischle, T.; Frey, K.; et al. Implementation and applications of EMOD, an individual-based multi-disease modeling platform. Pathogens and Disease 2018, 76, fty059. [Google Scholar] [CrossRef] [PubMed]
- Cheng, A.; Frey, K.; Mwamba, G.N.; McCarthy, K.A.; Hoff, N.A.; Rimoin, A.W. Examination of scenarios introducing rubella vaccine in the Democratic Republic of the Congo. Vaccine: X 2021, 9, 100127. [Google Scholar] [CrossRef] [PubMed]
- United Nations Department of Economic and Social Affairs, Population Division. World Population Prospects 2022: Summary of Results.
- Rodriguez-Cartes, S.A.; Zhang, Y.; Mayorga, M.E.; Swann, J.L.; Allaire, B.T. Evaluating the potential impact of rubella-containing vaccine introduction on congenital rubella syndrome in Afghanistan, Dem. Republic of Congo, Ethiopia, Nigeria, and Pakistan: A mathematical modeling study. PLOS Global Public Health 2024, 4, 1–14. [Google Scholar] [CrossRef]
- Nakase, T.; Brownwright, T.; Okunromade, O.; Egwuenu, A.; Ogunbode, O.; Lawal, B.; Akanbi, K.; Grant, G.; Bassey, O.O.; Coughlin, M.M.; et al. The impact of sub-national heterogeneities in demography and epidemiology on the introduction of rubella vaccination programs in Nigeria. medRxiv 2024. [Google Scholar] [CrossRef]
- Edmunds, W.J.; Gay, N.J.; Kretzschmar, M.; Pebody, R.G.; Wachmann, H. The pre-vaccination epidemiology of measles, mumps and rubella in Europe: implications for modelling studies. Epidemiology and Infection 2000, 125, 635–650. [Google Scholar] [CrossRef] [PubMed]
- Graham, M.; Winter, A.K.; Ferrari, M.; Grenfell, B.; Moss, W.J.; Azman, A.S.; Metcalf, C.J.E.; Lessler, J. Measles and the canonical path to elimination. Science 2019, 364, 584–587. [Google Scholar] [CrossRef] [PubMed]
- Papadopoulos, T.; Vynnycky, E. Estimates of the basic reproduction number for rubella using seroprevalence data and indicator-based approaches. PLOS Computational Biology 2022, 18, 1–21. [Google Scholar] [CrossRef]
|
Disclaimer/Publisher’s Note: The statements, opinions and data contained in all publications are solely those of the individual author(s) and contributor(s) and not of MDPI and/or the editor(s). MDPI and/or the editor(s) disclaim responsibility for any injury to people or property resulting from any ideas, methods, instructions or products referred to in the content. |
© 2024 by the authors. Licensee MDPI, Basel, Switzerland. This article is an open access article distributed under the terms and conditions of the Creative Commons Attribution (CC BY) license (http://creativecommons.org/licenses/by/4.0/).
