Submitted:
24 April 2024
Posted:
25 April 2024
You are already at the latest version
Abstract
Keywords:
1. Introduction
1.1. Effect of Integrated ES on Plant Flexibility
2. Technical Approach
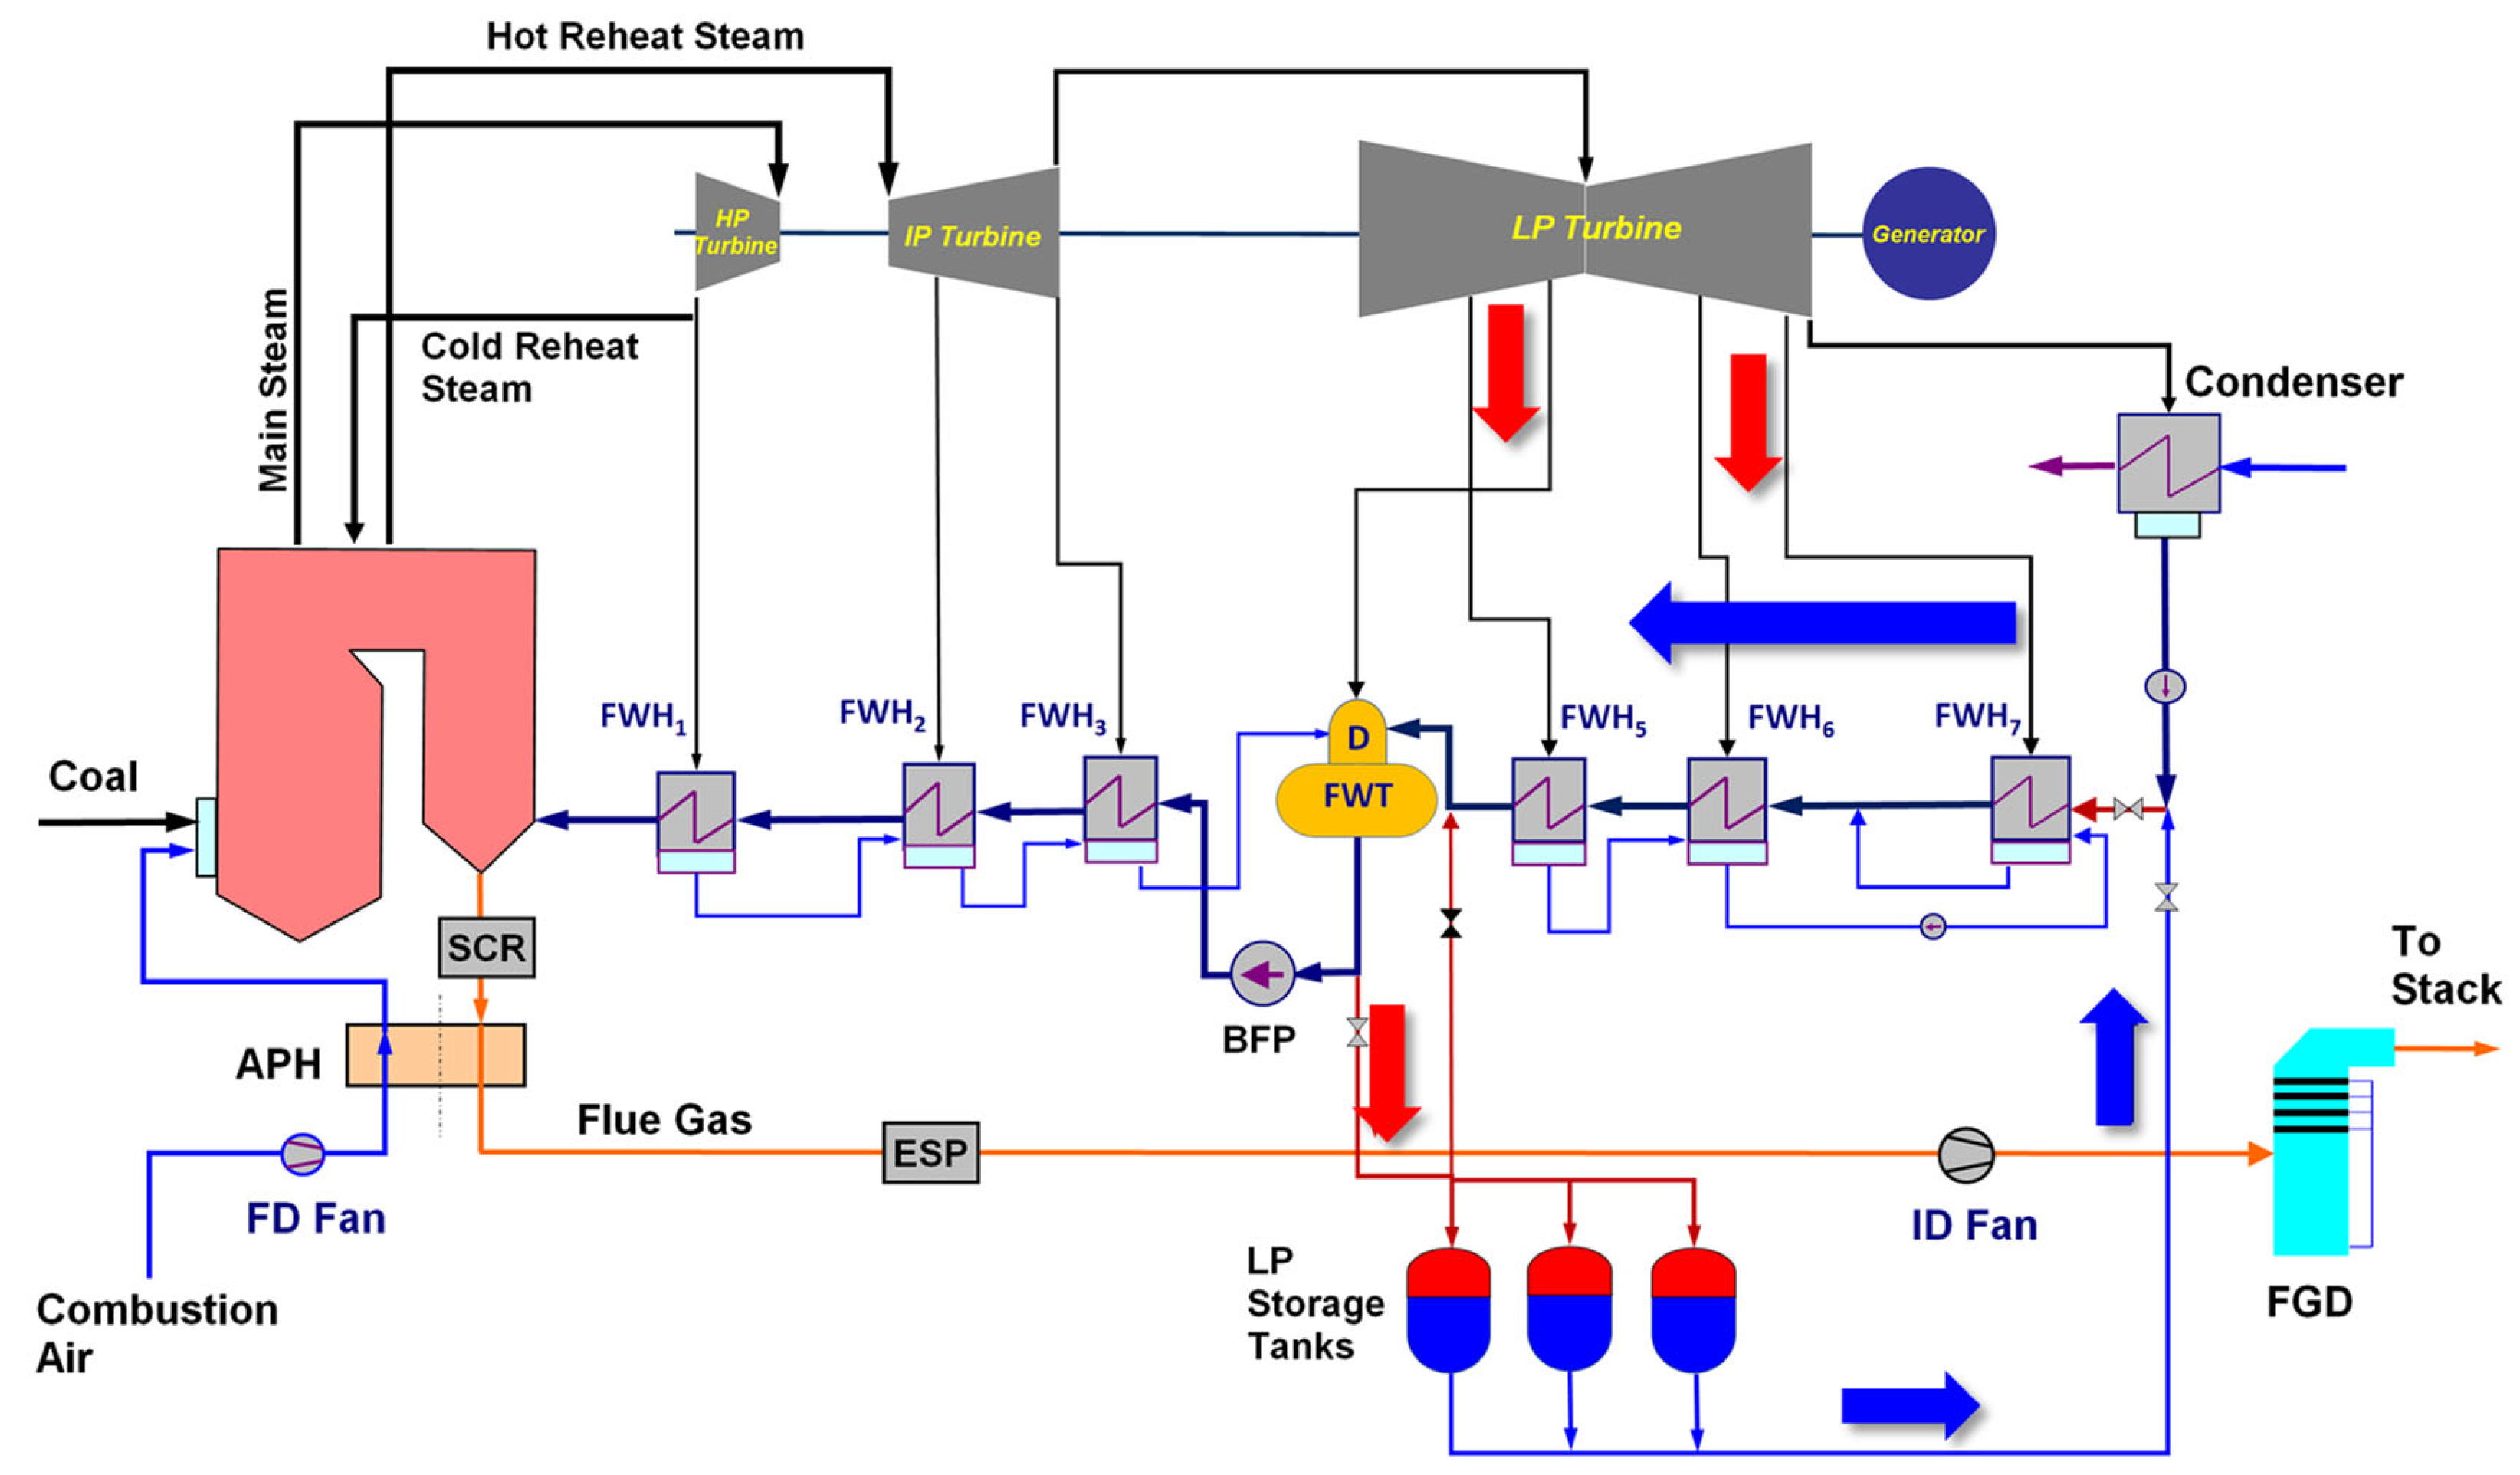
2.1. Low-Pressure (LP) Condensate Thermal Energy Storage
2.2. Two-Tank Molten Solar Salt Thermal Energy Storage
2.3. Fixed Bed Thermal Energy Storage
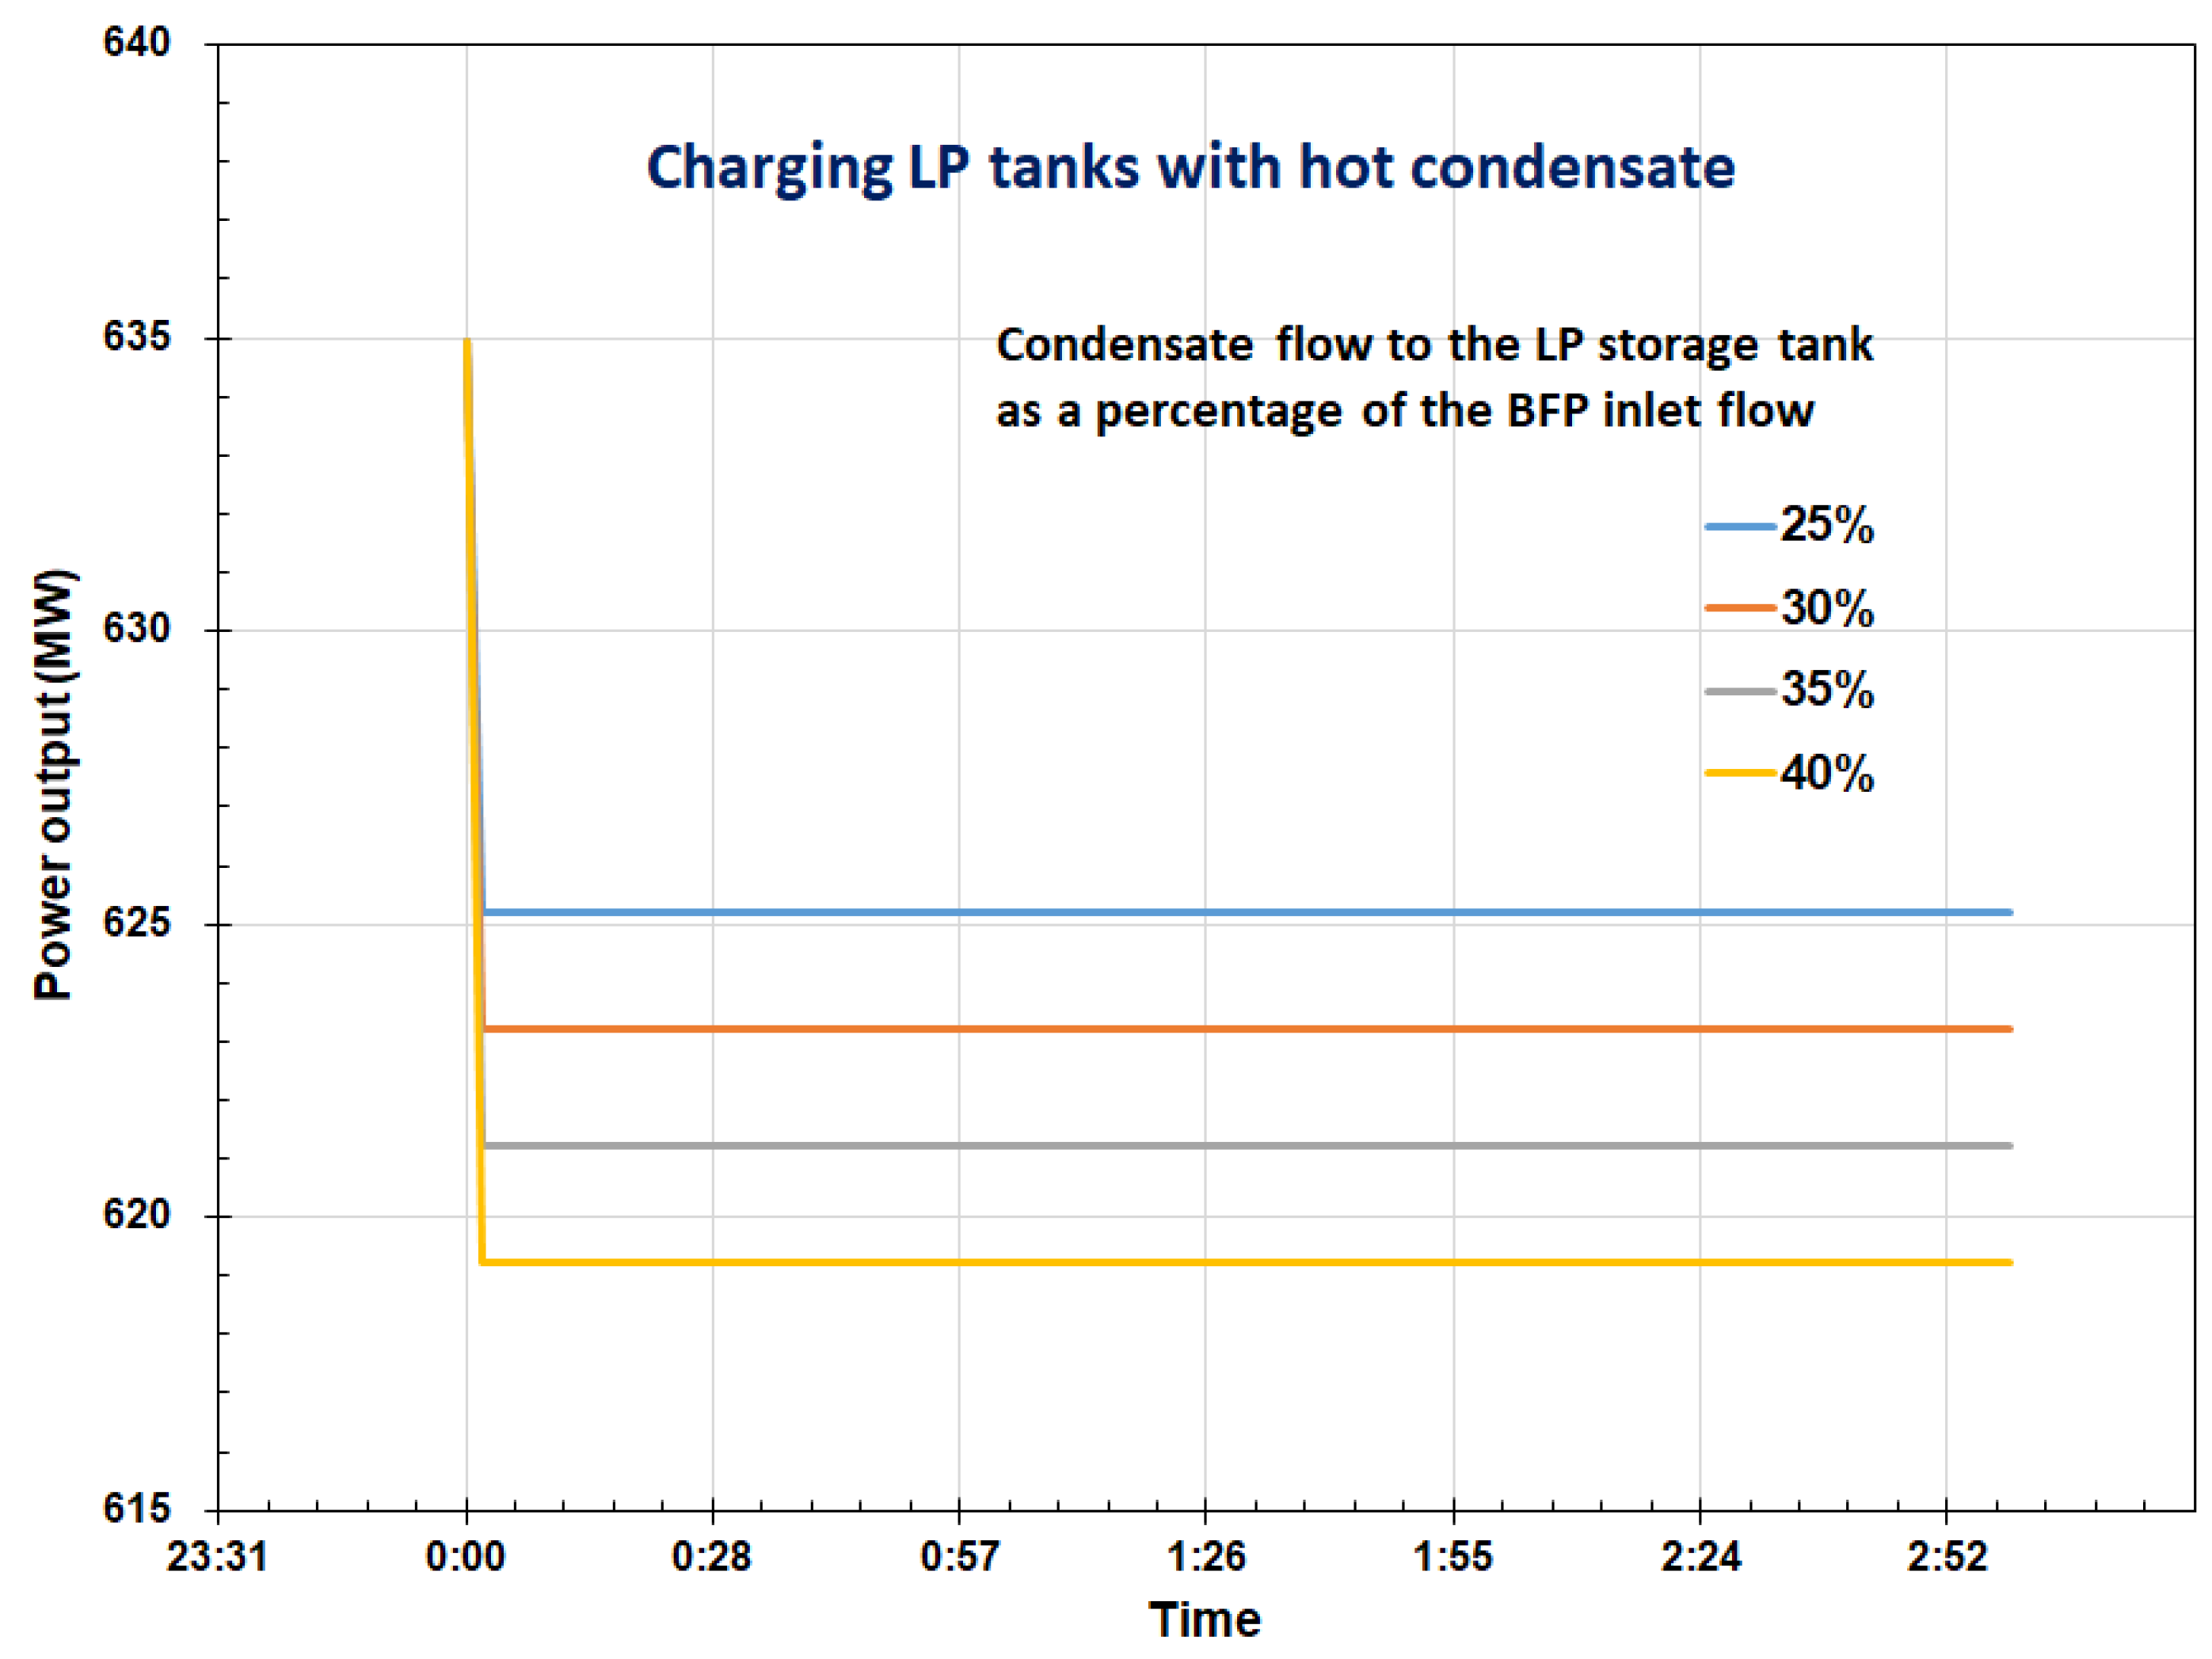
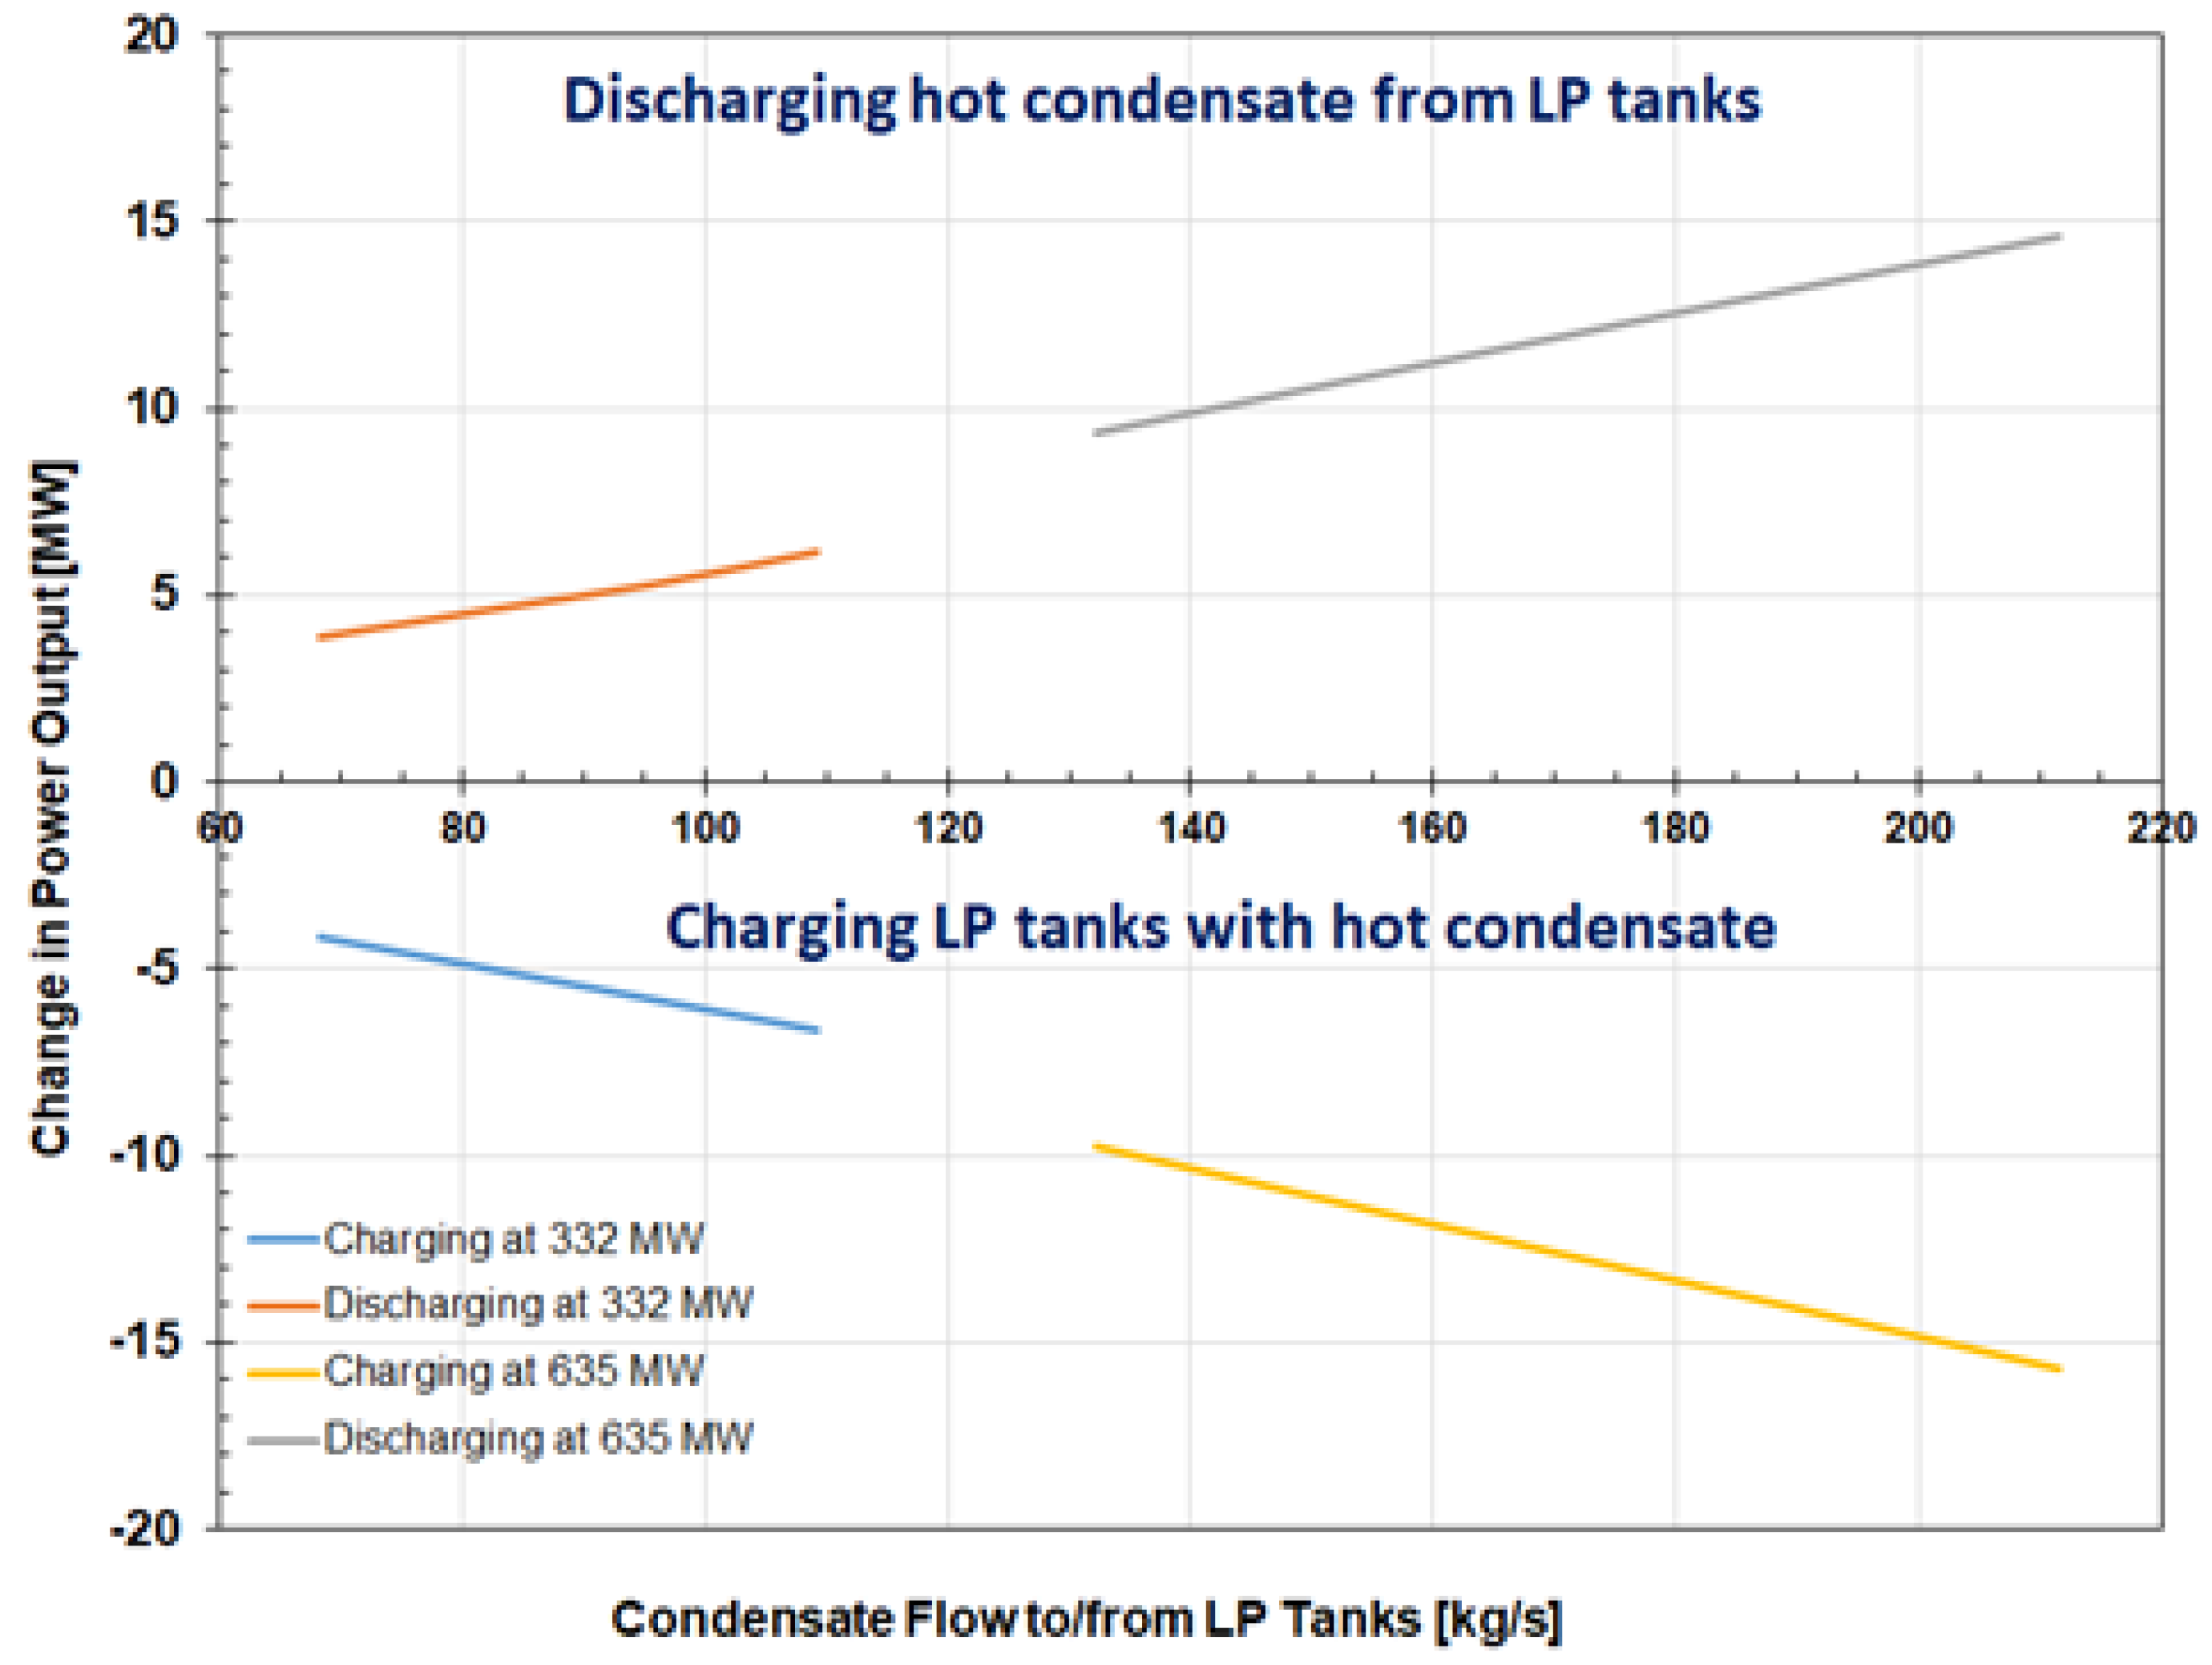
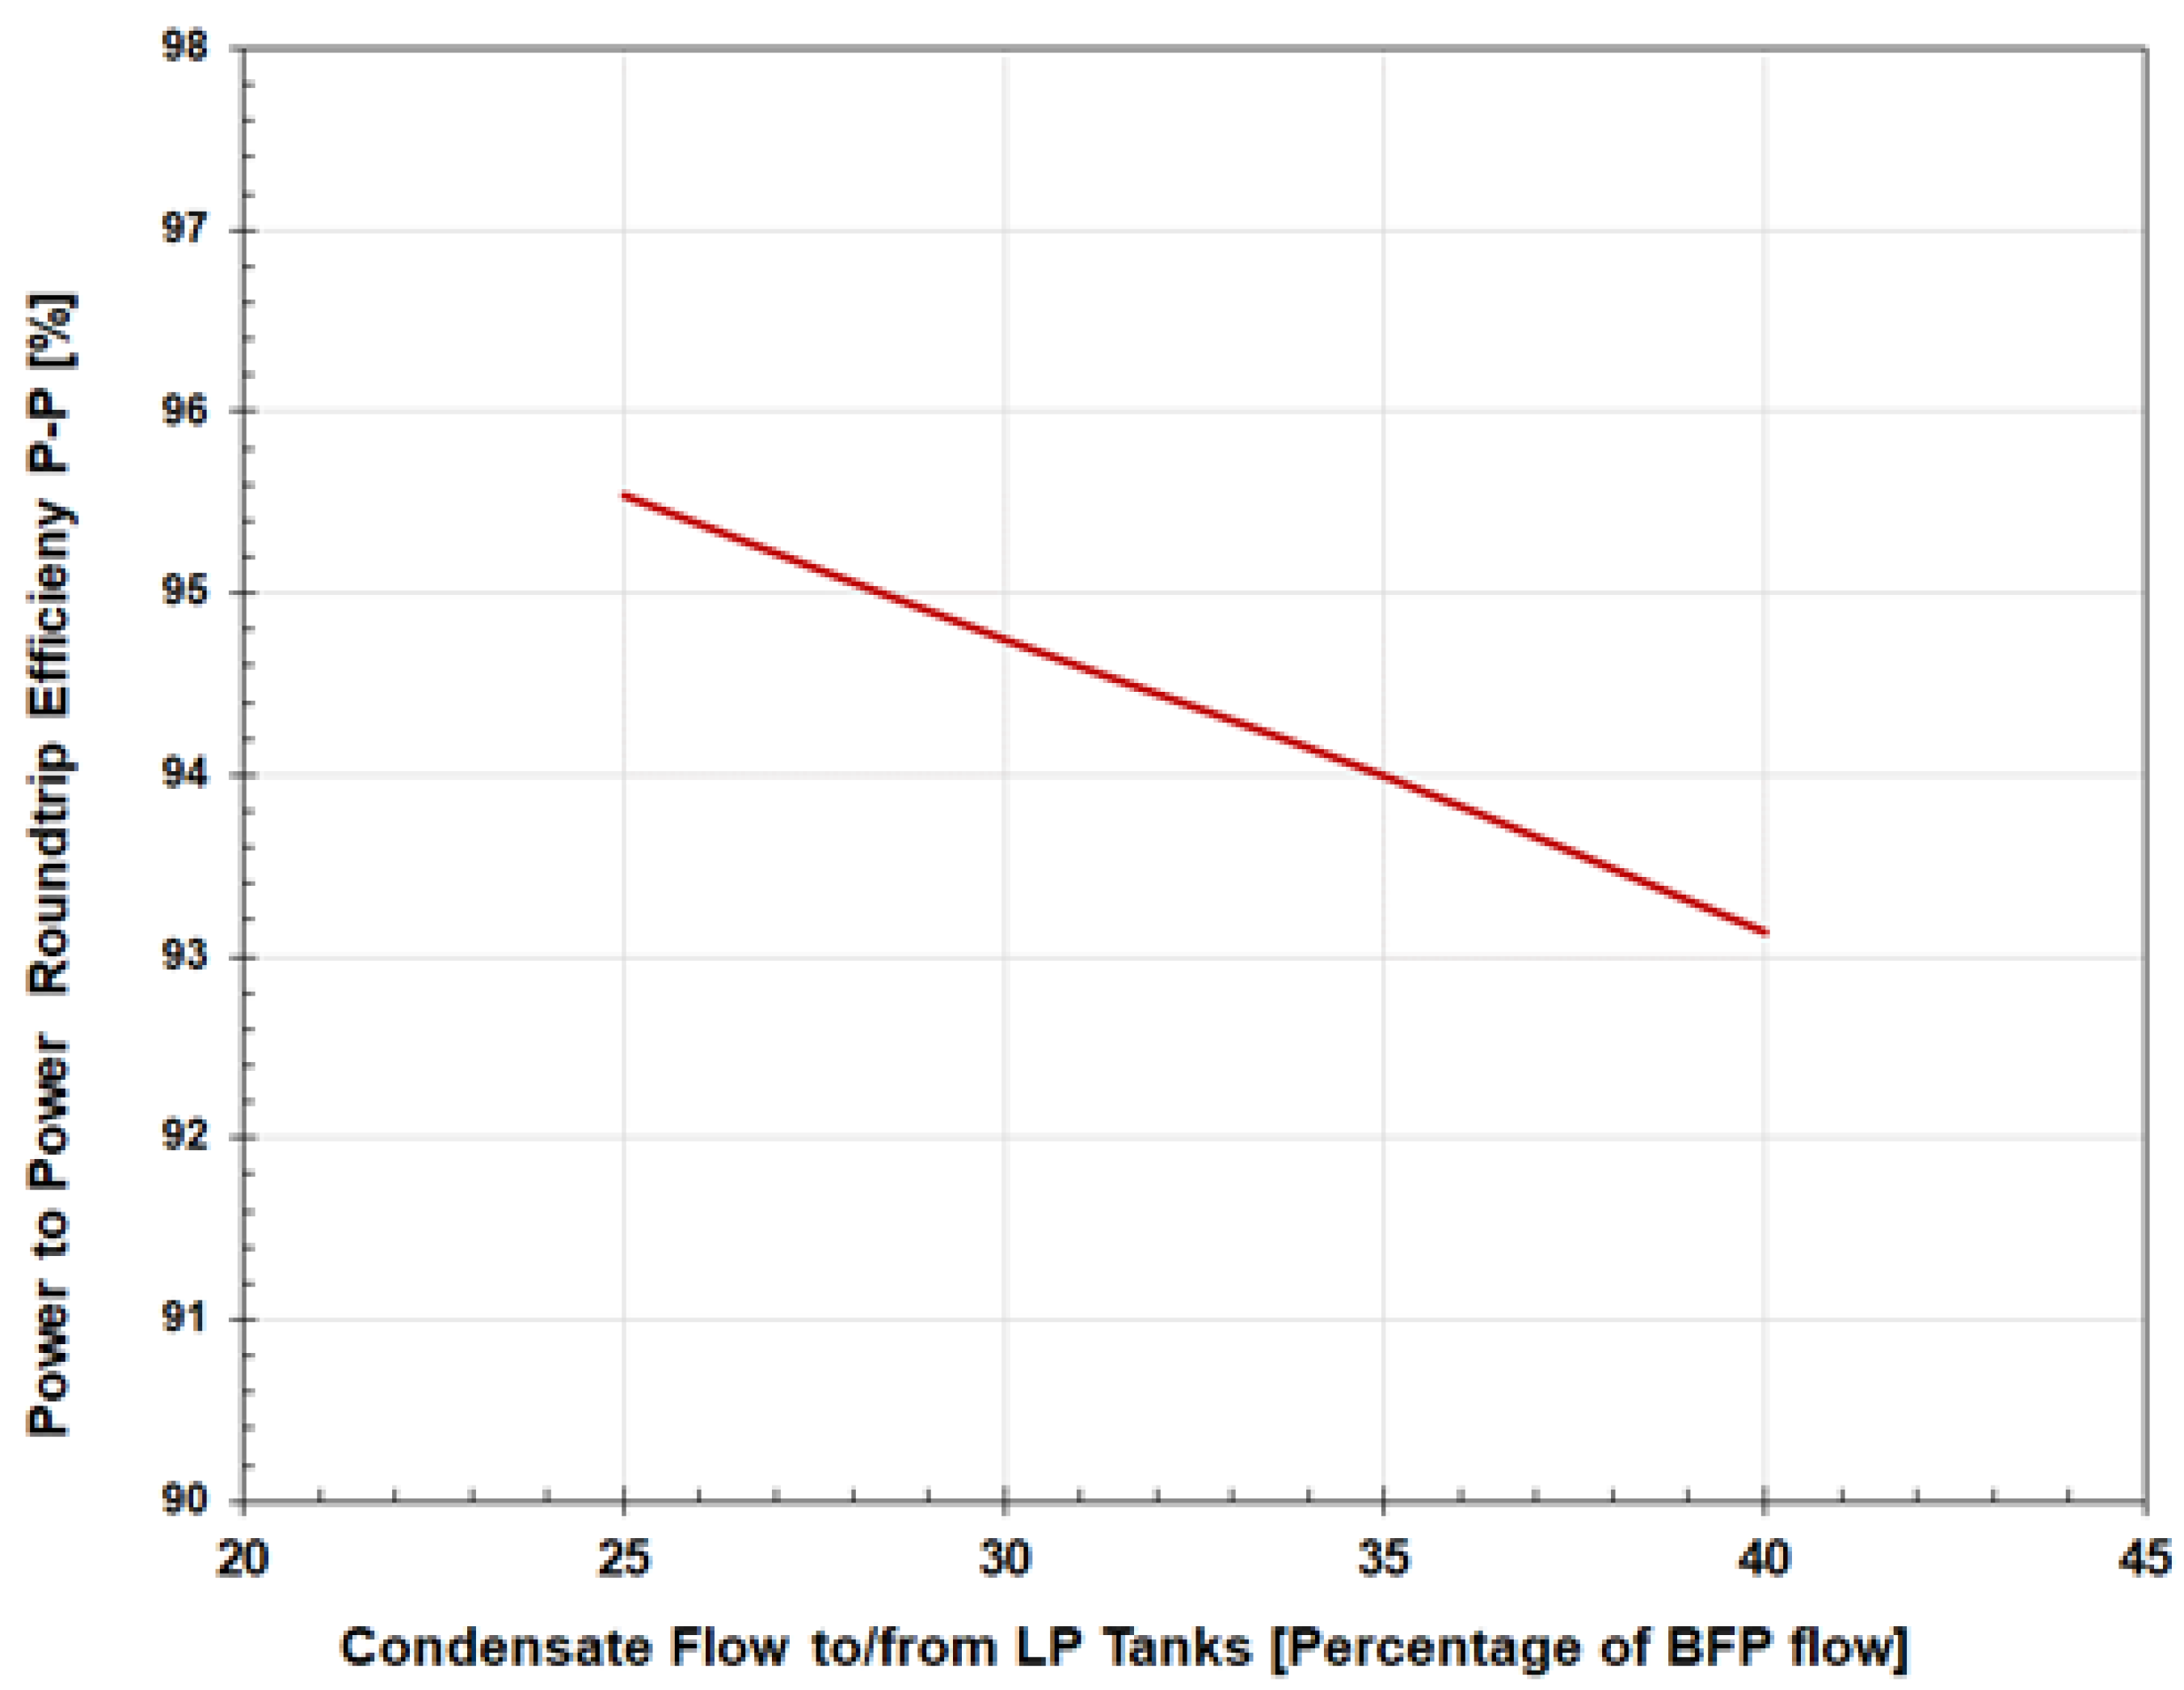
3. Performance of the Analyzed TES Systems
4. Economic Performance
5. Conclusions
Acknowledgments
Conflicts of Interest
References
- Clemens Schneider, Sebastian Braun, Torsten Klette, Steffen Härtelt, Alexander Kratzsch, University of applied Sciences, Zittau/Goerlitz, Zittau, Germany, “DEVELOPMENT OF INTEGRATION METHODS FOR THERMAL ENERGY STORAGES INTO POWER PLANT PROCESSES, Proceedings of the ASME POWER & ENERGY Conference 2016, ASME Energy Storage Forum 2016, June 26-30, 2016, Charlotte, North Carolina, USA.
- Jaquelin Cochran, Flexible Coal: An Example Evolution from Baseload to Peaking Plant, NREL/PR-6A20-62172, COAL-GEN, August 2014, Nashville Tennessee. Cochran, Flexible Coal.
- S. Venkataraman, G. S. Venkataraman, G. Jordan, and M. O’Connor, N. Kumar and S. Lefton, D. Lew, G. Brinkman, D. Palchak, and J. Cochran, Cost-Benefit Analysis of Flexibility Retrofits for Coal and Gas-Fueled Power Plants, NREL Subcontract Report NREL/SR-6A20-60862, 13, Contract No. DE-AC36-08GO28308. 20 December.
- Shifei Zhao, Zhihua Gea, Jian Suna, Yulong Ding, Yongping Yanga, “Comparative study of flexibility enhancement technologies for the coal-fired combined heat and power plant”, Energy Conversion and Management 184, 2029, 15-23. [CrossRef]
- VGB PowerTech e.V., “FLEXIBILITY TOOLBOX—Compilation of Measures for the Flexible Operation of Coal-Fired Power Plants”, VGB-B-033, March 2018.
- Volker Dreißigacker, Fachtagung für Energiespeicherung, Deutsches Zentrum für Luft- u. Raumfahrt e.V. (DLR) Institut für Technische Thermodynamik, “Kraftwerksflexibilisierung mit thermischen Energiespeichern”, Dresden, 07.03. 2019.
- Decai Li, Wenbin Zhang and Jihong Wang, “Flexible Operation of Supercritical Power Plant via Integration of Thermal Energy Storage”, Edited by Tolga Taner, Power Plants in the Industry, Chapter 7. [CrossRef]
- Thomas Loeper, Michael Kruger, Marcel Richter, Freerk Klassig, Philip Knodler, “Potenziale der Integration thermicher Energiespeaicher in Dampkraftwerke”, VGB PowerTech 4. 2019.
- 9. Miguel Angel Gonzales-Salazar, Trevor Kirsten, Lubos Prchlik, “Review of the operational flexibility and emissions of gas- and coal-fired power plants in a future with growing renewables”, Renewable and Sustainable Energy Reviews 82, 2018, 1497-1513.
- Debra Lew, Greg Brinkman, Michael Milligan NREL Steve Lefton, IntertekAPTECH, Dick Piwko, GE, “How Does Wind Affect Coal? Cycling, Emissions, and Costs”, NREL/PR-5500-51579, WindPower 2011, Anaheim, California, May 25, 2011.
- D. Lew and G. Brinkman, N. Kumar, P. Besuner, D. Agan, and S. Lefton, “Impacts of Wind and Solar on Fossil-Fueled Generators”, Presented at IEEE Power and Energy Society General Meeting, San Diego, California, July 22–26, 2012, NREL/CP-5500-53504.
- Thermal Energy Storage, IEA-ETSAP and IRENA© Technology Brief E17—January 2013, www.irena.org/Publication, www.etsap.org.
- Beyond Renewable Integration: The Energy Storage Value Proposition, ACORE (AMERICAN COUNCIL ON RENEWABLE ENERGY) and Scott Madded, Inc, November 2016.
- R. James, S. Hessler, J. Bistline, FOSSIL FLEET TRANSITION WITH FUEL CHANGES AND LARGE SCALE VARIABLE RENEWABLE INTEGRATION, Final Technical Report, September 2015, DOE Award DE-OE00006.
- Mathieu Lucquiaud, Eva Sanchez Fernandez, Hannah Chalmers, Niall Mac Dowell, Jon Gibbins, “Enhanced operating flexibility and optimized off-design operation of coal plants with post-combustion capture”, Energy Procedia 63 ( 2014 ) 7494—7507. [CrossRef]
- DOE Energy Storage Database-- http://www.energystorageexchange.
- Paul, J. Mitchell, John E. Waters, Energy Storage Roadmap Report, ESN (Energy Systems Network), 2017, www. Energysytemsnetwork.
- S. Lefton, “Power Plant Cycling Costs Incurred as Result of Wind/Solar Integration”, Scientech’s 2010 Symposium Fleet Asset Management and Optimization Solutions August 17-20, 2010.
- Richter, F. Möllenbruck, F. Obermüller, A. Knaut, F. Weiser, H. Lens, D. Lehmann, “Flexibilization of steam power plants as partners for renewable energy systems”, Downloaded on July 15,2020 at 17:27:14 UTC from IEEE Xplore. Restrictions apply.
- Joint EASE/EERA recommendations for a EUROPEAN ENERGY STORAGE TECHNOLOGY DEVELOPMENT ROADMAP—2017 Update.
- Kenneth Van den Bergh, Erik Delarue, “Cycling of conventional power plants: Technical limits and actual costs”, Energy Conversion and Management 97, 2015, 70-77.
- P. Keatley, A. Shibli, N.J. Hewitt, “Estimating power plant start costs in cyclic operation”, Applied Energy 111, 2013, 550-557. [CrossRef]
- Debra Lew, Greg Brinkman, Nikhil Kumar, Steve Lefton, Gary Jordan, and Sundar Venkataraman, “Finding Flexibility—Cycling the Conventional Fleet”, IEEE power & energy magazine 20, November/December 2013.
- Oliver Garbrecht, Malte Bieber, Reinhold Kneer, “Increasing fossil power plant flexibility by integrating molten-salt thermal storage”, Energy 118, 2017, 876-883. [CrossRef]
- N. Kumar, P. Besuner, S. Lefton, D. Agan, D. Hilleman and D. Lew, “Power Plant Cycling Costs”, NREL/SR-5500-55433, July 2012.
- Andeas Feldmuller, “Flexibility of coal and gas fired power plants”, International Agency Advanced Power Plant Flexibility Campaign, Paris, September 18, 2017.
- Patrick Eser, Antriksh Singh, Ndaona Chokani, Reza S. Abhari, “Effect of increased renewables generation on operation of thermal power plants”, Applied Energy 164, 2016, 723-732. [CrossRef]
- EPRI, “Electric Power System Flexibility- CHALLENGES AND OPPORTUNITIES”, 3002007374, February 2016.
- Dimitri Pescia, “Enhancing the flexibility of existing coal power plants Technical, economics and climate Considerations”, Agora Energiewende, 06.06.2018, WARSAW.
- “Flexibility in thermal power plants—With a focus on existing coal-fired power plants”, Agora Energiewende (2017).
- Yongliang Zhao, Ming Liu, Chaoyang Wang, Xin Li, Daotong Chong, Junjie Yan, “Increasing operational flexibility of supercritical coal-fired power plants by regulating thermal system configuration during transient processes”.
- Alireza Akrami, Meysam Doostizadeh, Farrokh AMINIFAR, “Power system flexibility: an overview of emergence to evolution”, J. Mod. Power Syst. 9: Clean Energy (2019) 7(5), 2019.
- Babatunde, J.L. Munda, Y. Hamam, “Power system flexibility: A review”, Energy Reports 6, 2020, 101-106. [CrossRef]
- M: Witkowski, Paul Haering, Stephan Seidelt, Nicole Pini, “Role of thermal technologies for enhancing flexibility in multi-energy systems through sector coupling: technical suitability and expected developments”, IET Energy Systems Integration, Special Issue, 2020.
- Shunchao Wang, Laust Riemann, “Thermal Power Plant Flexibility”, A Publication Under The Clean Energy Ministerial Campaign, 2018.
- Agus Praditya Tampubolon, “Understanding flexibility of thermal power plants : Flexible coal power generation in the power system with higher renewable energy penetration”, IESR (2020), Institute for Essential Services Reform (IESR), Jakarta, 2020.
- International Energy Agency. Status of power system transformation 2018: Advanced power plant flexibility [Internet] Paris: IEA, 2018, Available from: https://www.oecd-ilibrary.org/energy/status-of-power-system-transformation-2018_9789264302006-en.
- “FLEXIBILITY TOOLBOX—Compilation of Measures for the Flexible Operation of Coal-Fired Power Plants”, VGB PowerTech e.V. 20 March.
- N. Sarunac, “Techno-Economic and Deployment Analysis of Fossil Fuel-Based Power Generation with Integrated Energy Storage”, Final Report to DOE Number DOE-UNCC-FE0031903: https://www.osti. 1909.
- Michael Krüger, Volker Dreißigacker, Freerk Klasing, Philipp Knödler, Michael Krüger, Christian Odenthal, Stefan Zunft, Thomas Hofbauer, Eren Cam, Max Gierkink, Dietmar Lindenberger, Alexander Polisadov, Norbert Jentsch, Selman Muslubas, Gerd Oeljeklaus, Marcel Richter Michaelis Agraniotis, Alexander Deierling, Vladimir Danov, Heiko Grootens, Thomas Loeper, Christoph Guder, Daniel Lehmann Sabine Polenz, and Guido Schwabe, “FLEXI-TES Kraftwerksflexibilisierung durch Thermische Energiespeicher”—Öffentlicher Schlussbericht, Gefördert vom Bundesministerium für Wirtschaft und Energie aufgrund eines Beschlusses des Deutschen Bundestages, (FLEXI-TES—power plant flexibilization through thermal energy storage: final public report), German Aerospace Center (DLR), Stuttgart, 2020, Document location: TIB—Leibniz Information Center for Technology and Natural Sciences and University Library supplies science, research, industry and business with literature and information.
- Marcel Richter, Gerd Oeljeklaus, Klaus Görner, Improving the load flexibility of coal-fired power plants by the integration of a thermal energy storage, Applied Energy 236, 2019, 607-621.
- Marcel Richter, Gerd Oekjeklaus and Klaus Gorner, “Dynamic simulation of flexibility measures for coal-fired power plants”, Supported by the Federal Ministry for Economic Affair and Energy, VGB PowerTech 4|2020, 53-60,VGB Powertech Service GmbH.
- Michael Krüger , Selman Muslubas, Thomas Loeper, Freerk Klasing, Philipp Knödler and Christian Mielke, “Potentials of Thermal Energy Storage Integrated into Steam Power Plants”, Energies 2020, 13,226. 2020; 13. [CrossRef]
- Jacek, D. Wojcik and Jihong Wang, “Technical Feasibility Study of Thermal Energy Storage Integration into the Conventional Power Plant Cycle”, Energies, 2017.
- Vladimir, D.Stevanovic, Milan M. Petrovic, Sanja Milivojevic, Milica Ilic, “Upgrade of the thermal power plant flexibility by the steam accumulator”, Energy Conversion and Management 223, 2020, 113271. [CrossRef]
- EBSILONR Professional, The Planning Tool for the Power Plant Process, STEAG Energy Services GmbH, System Technologies, www.ebsilon.com, www.steag-systemtechnologies.
- B. E. Heni and D. Bouskela. “Steam Turbine Modeling”, Springer Online, 2019. 2019.
- R.C. Spencer, K.C. R.C. Spencer, K.C. Cotton, and C.N. Cannon, “A Method for Predicting Performance of Steam Turbine Generators 16,500 KW and Larger, ASME Paper No. 62-WA-209, Power Division of the American Society of Mechanical Engineers—Inter Annual Meeting, New York City, N.Y., 1962.
- David H. Cooke, Modeling of Off-Design Multistage turbine pressures by Stodola’s Ellipse , Energy Incorporated PEPSE User’s Group Meeting, Richmond, VA, November 1983.
- Shuele, V. et al., “Hybrid or Flexible—Integrated Approach for Renewables integration”, Alstom Power GmbH, Power Plant Symposium, 31/10/2012.
- Trojan, M. et al., “The use of pressure hot water storage tanks to improve the energy flexibility of the steam power unit”, Energy 173, 926-936, 2019.
- Kezhen Zhang, Ming Liu, Yongliang Zhao, Shunqi Zhang, Hui Yan, Junjie Yan, “Thermo-economic optimization of the thermal energy storage system extracting heat from the reheat steam for coal-fired power plants”, Applied Thermal Engineering 215, 2022. 11 9008. [CrossRef]
- Haihua Luo, Qiang Shen, Yunfei Chen, Shien Sun, Junguang Lin, and Houlei Zhang, “Thermodynamic Performance of Molten Salt Heat Storage System Used for Regulating Load and Supplying High Temperature Steam in Coal-Fired Cogeneration Power Plants”, E3S Web of Conferences 194, 01034 (2020), ICAEER 2020.
- Oliver Garbrecht, Malte Bieber, Reinhold Kneer, “Increasing fossil power plant flexibility by integrating molten-salt thermal storage”, Energy 118, 2017, 876-883. [CrossRef]
- Seppo A. Korpela, “On the calculation of the temperature distribution in a packed bed for solar energy applications”, Article in Solar Energy, December 1979.
- Ioan Sarbuand Calin Sebarchievici, “A Comprehensive Review of Thermal Energy Storage”, Sustainability, January 2018.
- Jakub Ochmann, Krzysztof Rusin, Sebastian Rulik, Sebastian Waniczek, Łukasz Bartela, “Experimental and computational analysis of packed-bed thermal energy storage tank designed for adiabatic compressed air energy storage system”, Applied Thermal Engineering 213, 2022, 118750. [CrossRef]
- Meier, A. , Winkler, C. and Wuillemin, D., 1991. Experiment for modelling high temperature rock bed storage. Solar energy materials, 24(1-4), pp.255-264.
- M. Quintard, “Introduction to Heat and Mass Transport in Porous Media”, STO-EN-AVT-261, Public Release, NATO|OTAN, Publication date not given.
- Thibaut Esence, Arnaud Bruch, Sophie Molina, Benoit Stutz, Jean-Francois Fourmigue, “A review on experience feedback on numerical modeling of packed-bed thermal energy storage systems”. Solar Energy, Elsevier, 2017, 153, 628–654. [CrossRef]
- Hänchen, M., Brückner, S., & Steinfeld, A. (2011). High-temperature thermal storage using a packed bed of rocks–heat transfer analysis and experimental validation. Applied Thermal Engineering, 31(10), 1798-1806. [CrossRef]
- Kai Knobloch, Thomas Ulrich, Christian Bahl, Kurt Engelbrecht, “Degradation of a rock bed thermal energy storage system”, Applied Thermal Engineering 214, 2022, 118823. [CrossRef]
- .E. Pacheo et al., “Development of a Molten-Salt Thermocline Thermal Storage System for Parabolic Trough Plants”, Proceedings of Solar Forum 2001 Solar Energy: The Power to Choose, April 21-25, 2001, Washington, DC.
- Energy Storage Technology and Cost Characterization Report, Pacific Northwest National Laboratory. 2019.
- Dominik Kryzia, Michał Kopacz and Katarzyna Kryzia, “The Valuation of the Operational Flexibility of the Energy Investment Project Based on a Gas-Fired Power Plant”, Energies, March 2020. [CrossRef]
- Rahul Walawalkara, Jay Apta, Rick Mancini, “Economics of electric energy storage for energy arbitrage and regulation in New York”, Energy Policy 35 (2007) 2558–2568. [CrossRef]
- Ecofys, Energy Storage Opportunities and Challenges-A West Coast Perspective White Paper, Performed by Ecofys under contract to EDF Renewable Energy with feedback from Advisory Panel members. April 2014, www.ecofys.com/com/publications.
- Julia Hentschel, Ugljesa Babić, Hartmut Spliethoff, “A parametric approach for the valuation of power plant flexibility options”,.
- Çam, Eren (2020) : “Optimal dispatch of a coal-fired power plant with integrated thermal energy storage”, EWI Working Paper, No. 20/05, Institute of Energy Economics at the University of Cologne (EWI), Cologne, EWI Working Paper, No. 20/05, http://hdl.handle.net/10419/227509.
- Nicholas DiOrio, Aron Dobos, and Steven Janzou, “Economic Analysis Case Studies of Battery Energy Storage with SAM (System Advisor Model)”, NREL/TP-6A20-64987, November 2015.


 |
Disclaimer/Publisher’s Note: The statements, opinions and data contained in all publications are solely those of the individual author(s) and contributor(s) and not of MDPI and/or the editor(s). MDPI and/or the editor(s) disclaim responsibility for any injury to people or property resulting from any ideas, methods, instructions or products referred to in the content. |
© 2024 by the authors. Licensee MDPI, Basel, Switzerland. This article is an open access article distributed under the terms and conditions of the Creative Commons Attribution (CC BY) license (https://creativecommons.org/licenses/by/4.0/).


