Preprint
Article

Risk of Blood Clots After COVID-19 Vaccination and Infection: A Risk-Benefit Analysis

Altmetrics

Downloads

189

Views

154

Comments

0

Submitted:

25 April 2024

Posted:

26 April 2024

You are already at the latest version

Alerts
Abstract
We estimated the risk of blood clots after COVID-19 vaccination accounting for the roles of vaccination in reducing the infection rate, and indirectly lowering the risk of blood clots caused by infection. A self-controlled case series method was used to examine the association between blood clots and COVID-19 vaccination. To deal with the bias due to under-reported infection among non-hospitalized subjects, a case-control study was used to compare the risk of blood clots in infected subjects to control subjects who were hospitalized due to physical injury. We found increased risks of blood clots after vaccination (incidence rate ratio is 1.13, 95% confidence interval (CI): [1.03, 1.24] after the first dose and 1.23, 95% CI: [1.13,1.34] after the second dose). Furthermore, vaccination attenuated the increased risk of blood clots associated with infection (odds ratio (OR) = 2.16, 95% CI: [1.93, 2.42] in unvaccinated versus OR=1.46, 95% CI: [1.25, 1.70] in vaccinated). A causal model was used to explain and weigh up possible risk factors for blood clots after COVID-19 vaccination. After accounting for vaccine efficacy against infection and the protection against infection-associated blood clots, receiving the COVID-19 vaccines decreases the risk of blood clots, especially during high infection rate period.
Keywords: 
Subject: Public Health and Healthcare  -   Public Health and Health Services

INTRODUCTION

The Coronavirus Disease 2019 (COVID-19) pandemic prompted a race to develop and distribute effective vaccines. Approximately 81.4% of the US population has been vaccinated with at least one dose and 69.5% have completed a primary series of COVID-19 vaccination [1]. While the benefits of vaccination are widely acknowledged, concerns have emerged regarding to the development of blood clots after vaccination [2]. More specifically, cases of venous thromboembolism following a mRNA-based (mRNA-1273 or BNT162b2) vaccination were reported in 2022 [3,4,5,6], drawing attention to the potential risk of blood clots after the first dose of vaccination. One study confirmed an increased risk of thromboembolism, ischemic stroke and cerebral venous sinus thrombosis after the first dose of BNT162b2 [7], and another retrospective cohort study found an increased risk of cerebral venous thrombosis and portal vein thrombosis after any mRNA-based vaccination [8]. Moreover, a recent systematic review [9] has shown that thromboembolism is the most frequent adverse event following a mRNA-based vaccination. Despite those findings, vaccination is still recommended to reduce the likelihood of COVID-19 infection, hospitalization, and mortality [7,10]. Furthermore, COVID-19 itself substantially increases the risk of blood clots [11,12,13], implying a higher risk of mortality [14]. Therefore, studying the risk of thromboembolic events after COVID-19 vaccination should incorporate the protective effect of vaccines against infection-associated blood clots.
The self-controlled case series (SCCS) studies conducted using various data sources have reported positive correlation between blood clots and mRNA-based vaccines, with reported incidence rate ratios (IRRs) between 1.04 - 1.22 [7,15,16,17,18]. The same design was also used to evaluate the risk of blood clots after COVID-19 infection, with reported IRRs between 6.18 - 63.52 [7,10,13]. However, since a blood clot event typically requires hospitalization, subjects with blood clots are subject to a higher rate of COVID-19 testing and so at a lower likelihood of misclassification as uninfected compared to subjects without an event. Hence the SCCS design is subject to some risk of bias [19], which we would expect to inflate the estimated relative risk of blood clots after COVID-19 infection.
The objective of this study is to evaluate whether the overall effect of COVID-19 vaccination is to increase or decrease the risk of thromboembolic events (blood clots). To do so, we first quantified the risk of blood clots after a mRNA-based vaccine using the SCCS method. Secondly, we evaluated the association between blood clots and COVID-19infection using a case-control study, avoiding the misclassification bias associated with the SCCS method. Finally, we conducted a risk-benefit analysis by comparing the magnitude of the increased risk through the direct effect of COVID-19 vaccination with the reduced risk through the indirect pathway via protection against infection-associated blood clots.

MATERIALS AND METHOD

Data

Our studies used electronic health record (EHR) data from the Corewell Health East (CHE, formerly known as Beaumont Health) and Corewell Health West (CHW, formerly known as Spectrum Health) healthcare systems, which includes demographics, mortality, hospital admissions, and COVID-19 infection. We obtained accurate COVID-19 vaccination records (vaccine type, date, and doses) by linking EHR data at Corewell Health with the Michigan Care Improvement Registry (MCIR), resulting in a more complete identification for individuals who received the COVID-19 vaccine outside the healthcare system. We included all patients aged ≥ 18 years old and were registered with a primary care physician within 18 months before Jan 1st, 2021.
We identified thromboembolic events by a hospital admission associated with ICD-10 (International Classification of Diseases version 10) diagnosis codes for venous thromboembolism, arterial thrombosis, cerebral venous sinus thrombosis, ischemic stroke, and myocardial infarction (Table S1). We also included patients with physical injury requiring hospitalization (list of ICD-10 codes in Table S2) as a negative control outcome to detect possible biases occurring in our studies, and further leveraged them as a control group to derive a more accurate analysis for the COVID-19 infection exposure.

Statistical Method

We used the SCCS design to examine the association of blood clots and the first two doses of mRNA-based COVID-19 vaccines (mRNA-1273 or BNT162b2) from December 1st, 2020, to August 31st, 2022. The SCCS method compares the incidence rate of blood clots before and after vaccination. In this method, subjects are under their own control, and comparisons are made within subjects, thus avoiding any time-invariant confounding. We included subjects who had a blood clot and at least one dose of the primary series of mRNA-based vaccine in the study period. The control period was defined from December 1st, 2020, to 28 days before the first dose of vaccination, excluding the period of 28 days prior to vaccination to avoid bias due to contra-indications [20]. Two separate risk periods for the first and second doses were defined until 28 days after vaccination, death, or August 31st, 2022, whichever occurred first (Figure S1). We also excluded subjects who had COVID-19 infection within 90 days before a thromboembolic event to remove the confounding effect of infection on that event. To ensure the independence between recurrent events, we considered only events that occurred at least one year after the previous event. We removed individuals who had incomplete covariate data and used conditional Poisson regression including an offset for the length of the risk period to obtain the IRR of blood clots after and before a COVID-19 vaccination.
In an initial analysis of the association between blood clots and COVID-19 infection, we used the same SCCS design and included patients who had at least one positive PCR or antigen test and a thromboembolic event during the period from Dec 1st, 2020, to August 31st, 2022. However, due to the missing infection data in patients who were not hospitalized for thromboembolic events or other reasons, the SCCS design results in a biased estimate of the association between blood clots and COVID-19 infection. Patients were admitted to the hospital, almost always received a COVID-19 (PCR or antigen) test, especially early in the pandemic, while patients who did not visit the hospital were subject to under-reporting of infections. This under-reporting (or misclassification of infected as uninfected) leads to an inflated IRR of blood clots after COVID-19 infection.
We proposed a simple and efficient method to quantify the association between blood clots and COVID-19 infection while dealing with the misclassification issue. The main idea is to select a subject of control (i.e., subjects without thromboembolic events) who were hospitalized for reasons independent of COVID-19 infection and therefore have complete infection data. To this end, we used patients hospitalized for physical injury as the control group, since we would not expect any causal association between physical injury and COVID-19 infection. We used a case-control design, in which an event of a blood clot is classified into the cases group, and a hospitalized injury event is considered as control group. If an individual had multiple admissions for blood clots and injury, we considered only the first admission. We determined COVID-19 infection status based on the test results during the period of 28 days prior to the date of the event (Figure S2). If an individual had a positive test result, this subject was classified as COVID-19 infected (exposed). We compared the odds of infection (exposed) vs. no infection (unexposed) in the cases (blood clots) vs. controls (physical injury) using a logistic regression model adjusted for age, race, gender, Charlson comorbidity index (CCI), number of visits, and prior vaccination status (Yes/No). Patients who had any COVID-19 vaccine between the date of positive COVID-19 test and the date event were removed. The number of visits was fit with a natural spline with three degrees of freedom. The CCI was obtained using the R package comorbidity and categorized into 4 categories, ‘0’, ‘1-2’, ‘3-4’, and ‘≥5’ [21,22].
Statistical analyses were performed in R 4.3.0. We reported OR and IRR with 95% CIs and p-values.

RESULTS

Study Population

Overall Population: During the study period from December 1st, 2020, to August 31st, 2022, there were 747,070 subjects at Corewell Health who received mRNA-based vaccines, among which 279,229 (37.38%) had the primary series of mRNA-1273 and 467,841 (62.62%) took BNT162b2. Overall, the number of fully vaccinated patients was 711,460 (95.23%), and 35,610 (4.77%) patients received only one dose. The median age was 57 (with interquartile range [IQR]: 40 - 69), and 59.81% of patients were female. There were 367,105 patients taking at least one COVID-19 test (antigen or PCR), among which 78,568 (21.4%) patients received positive results. The median age was 52 (with interquartile range [IQR]: 34 - 67), and 61.44% of patients were female.
SCCS Cohort to Study Vaccination Exposure: In the study cohort of vaccination exposure, there were 18,466 patients who had at least one blood clot event and had the first dose of either mRNA-1273 or BNT162b2 vaccine. Patient demographics are presented in Table 1. We identified 3,031 events in the control period, 763 events within 28 days after the first dose, and 894 events within 28 days after the second dose. Hence, there were 4,092 patients with a total of 4,688 blood clot events considered in our conditional Poisson regression.
Case-control Cohort to Study Infection Exposure: 49,247 patients had a hospital admission related to either blood clots or physical injury during the observational period. There were 28,304 (57.47%) patients experiencing a blood clot and 2,537 (5.15%) patients having a positive COVID-19 test result within 28 days prior to the date of the hospital admission of either blood clots or injury. Demographics of patients are presented in Table 2.

Association Studies

Blood clots and mRNA-vaccination. Based on the SCCS analysis, we found an increased risk of blood clots after the first dose (IRR: 1.13, 95% CI: [1.03, 1.24], p-value = 0.007), and after the second dose (IRR: 1.23, 95% CI: [1.13, 1.34], p-value < 0.001) of the mRNA-based vaccines.
Blood clots and COVID-19 exposure. Naïve SCCS analysis showed a very large increased risk of blood clots associated with COVID-19 infection (IRR was 19.13, 95% CI: [17.55, 20.84], p-value < 0.001). This result agrees with published IRR estimates of 6.18 - 63.52 [7,10,13]. However, a similar analysis using the hospitalized physical injury as an event also derived a large increased risk (IRR was 11.15, 95% CI: [10.13, 12.27], p-value < 0.001), indicating misclassification bias as COVID-19 infection should not substantially increase the risk of physical injury. In the case-control analysis with subjects hospitalized for physical injury as controls, we found that COVID-19 infection increased the risk of blood clots but with a much smaller magnitude than the risk in the SCCS analysis (although it is still larger than the vaccination exposure). Moreover, the degree of the increased risk was modified by vaccination status (Figure 1). The reported odds ratio (OR) for the unvaccinated group was 2.16 (95% CI: [1.93, 2.42], p-value < 0.001) compared to 1.46 (95% CI: [1.25, 1.70], p-value < 0.001) for the vaccinated group. We observed increased risks of blood clots after COVID-19 infection in both groups, but vaccination appears to confer some protection against infection-associated thromboembolic events, given the lower OR.
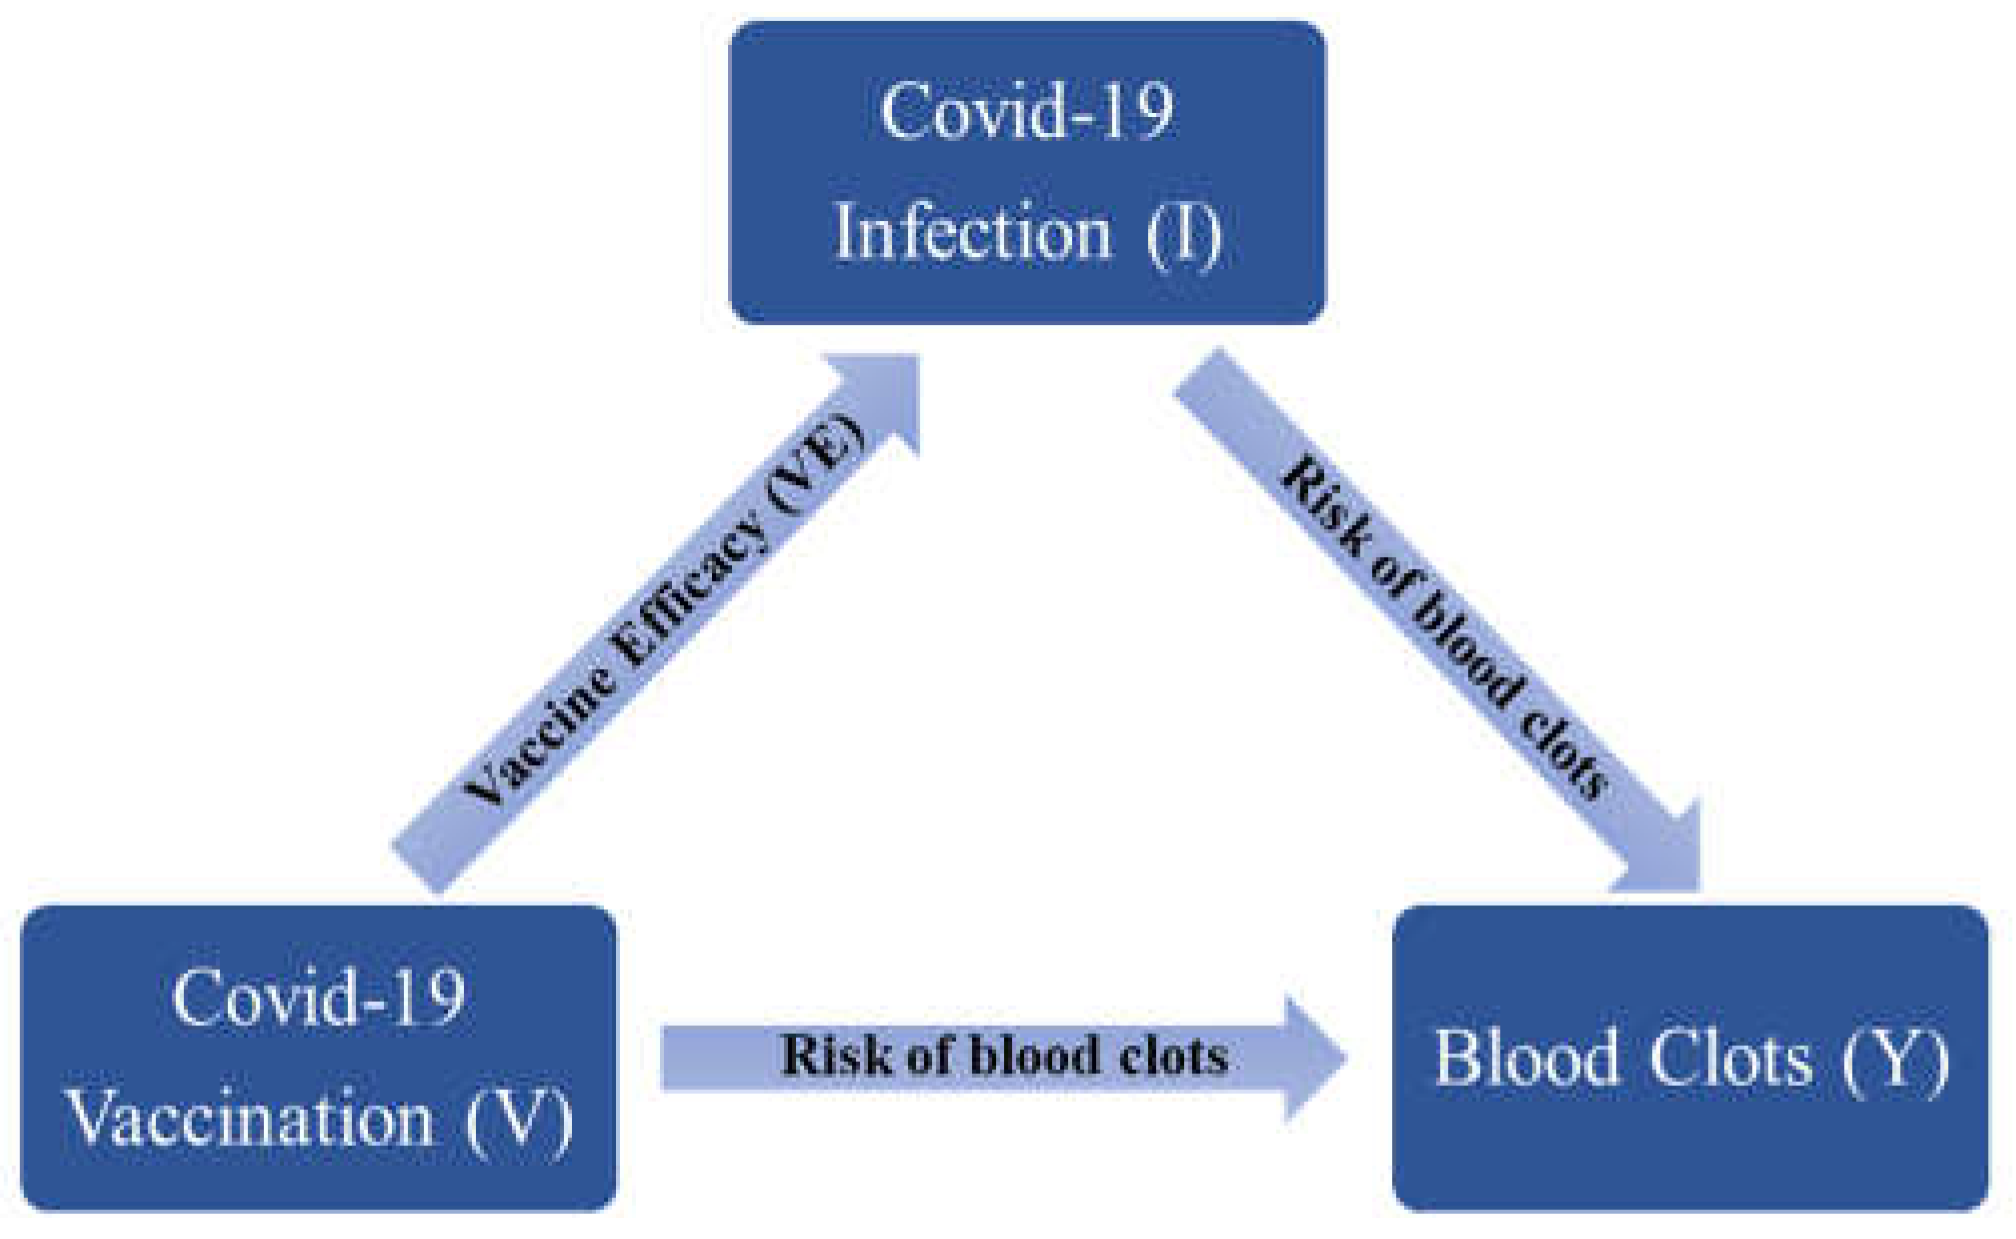
Estimate the overall (net) effect of COVID-19 vaccination on the thromboembolic events while considering COVID-19 infection. We extended our investigation to evaluate the overall influence of COVID-19 vaccination on the occurrence of blood clots. COVID-19 vaccines are protective against COVID-19 infection and COVID-19 severity [23,24,25], and so can indirectly decrease the likelihood of experiencing a blood clot event. Figure 2 illustrates the direct and indirect effect of the COVID-19 vaccination on the occurrence of blood clots while considering vaccine efficacy (VE). As presented in the diagram, the association between blood clots and COVID-19 vaccination is described by two paths, the direct association between blood clots and vaccination, and the indirect association between blood clots and vaccination via potential reduction in the risk of blood clots through decreasing the risk of COVID-19 infection. We estimated the overall influence of vaccination on the occurrence of blood clots by considering both direct and indirect paths.
For a vaccinated subject, the total risk is P Y V , I ¯ + P I V × P Y I , V , where P Y V , I ¯ is the direct risk of blood clots after vaccination given that infection has not yet occurred, and P I V × P Y I , V is the indirect risk calculated by multiplying the risk of COVID-19 infection of a vaccinated subject, P I V , and the risk of blood clots given a COVID-19 infection in the vaccinated group, P Y I , V . Similarly, the overall risk of blood clots for an unvaccinated subject is given by P Y V ¯ , I ¯ + P I V ¯ × P Y I , V ¯ . Hence the net relative risk ( R R N e t ) of blood clots for a vaccinated subject compared to an unvaccinated subject is
R R N e t = P Y V , I ¯ + P I V × P Y I , V P Y V ¯ , I ¯ + P I V ¯ × P Y I , V ¯
= P Y V , I ¯ P Y V ¯ , I ¯ + P I V × P Y I , V P Y I ¯ , V ¯ 1 + P I V ¯ × P Y I , V ¯ P Y I ¯ , V ¯
= R R V + P ( I | V ) × R R I V 1 + P ( I | V ¯ ) × R R I | V ¯
The terms R R V is the relative risk of blood clots associated with COVID-19 vaccination, and R R I | V ¯ is the relative risk of blood clots after a COVID-19 infection in the unvaccinated group. The term R R I V is the relative risk of blood clots in the group of subjects who have both vaccination and infection, compared to the group of subjects who do not have any exposures. Our analysis in the previous section gave an IRR of 1.23 as the measure of the association between blood clots events and the second dose of COVID-19 vaccination, therefore, we set R R V = 1.23. We also obtained an odd ratio O R I | V ¯ = 2.16 and O R I V = 1.49 from the analysis using the case-control design. Since relative risk (RR) is very close to OR when the event is rare, we therefore set R R I | V ¯ = 2.16 and R R I V = 1.49 as the blood clots is a rare event [26]. Hence, the above R R N e t becomes
R R N e t = 1.23 + 1.49 × P ( I | V ) 1 + 2.16 × P ( I | V ¯ )
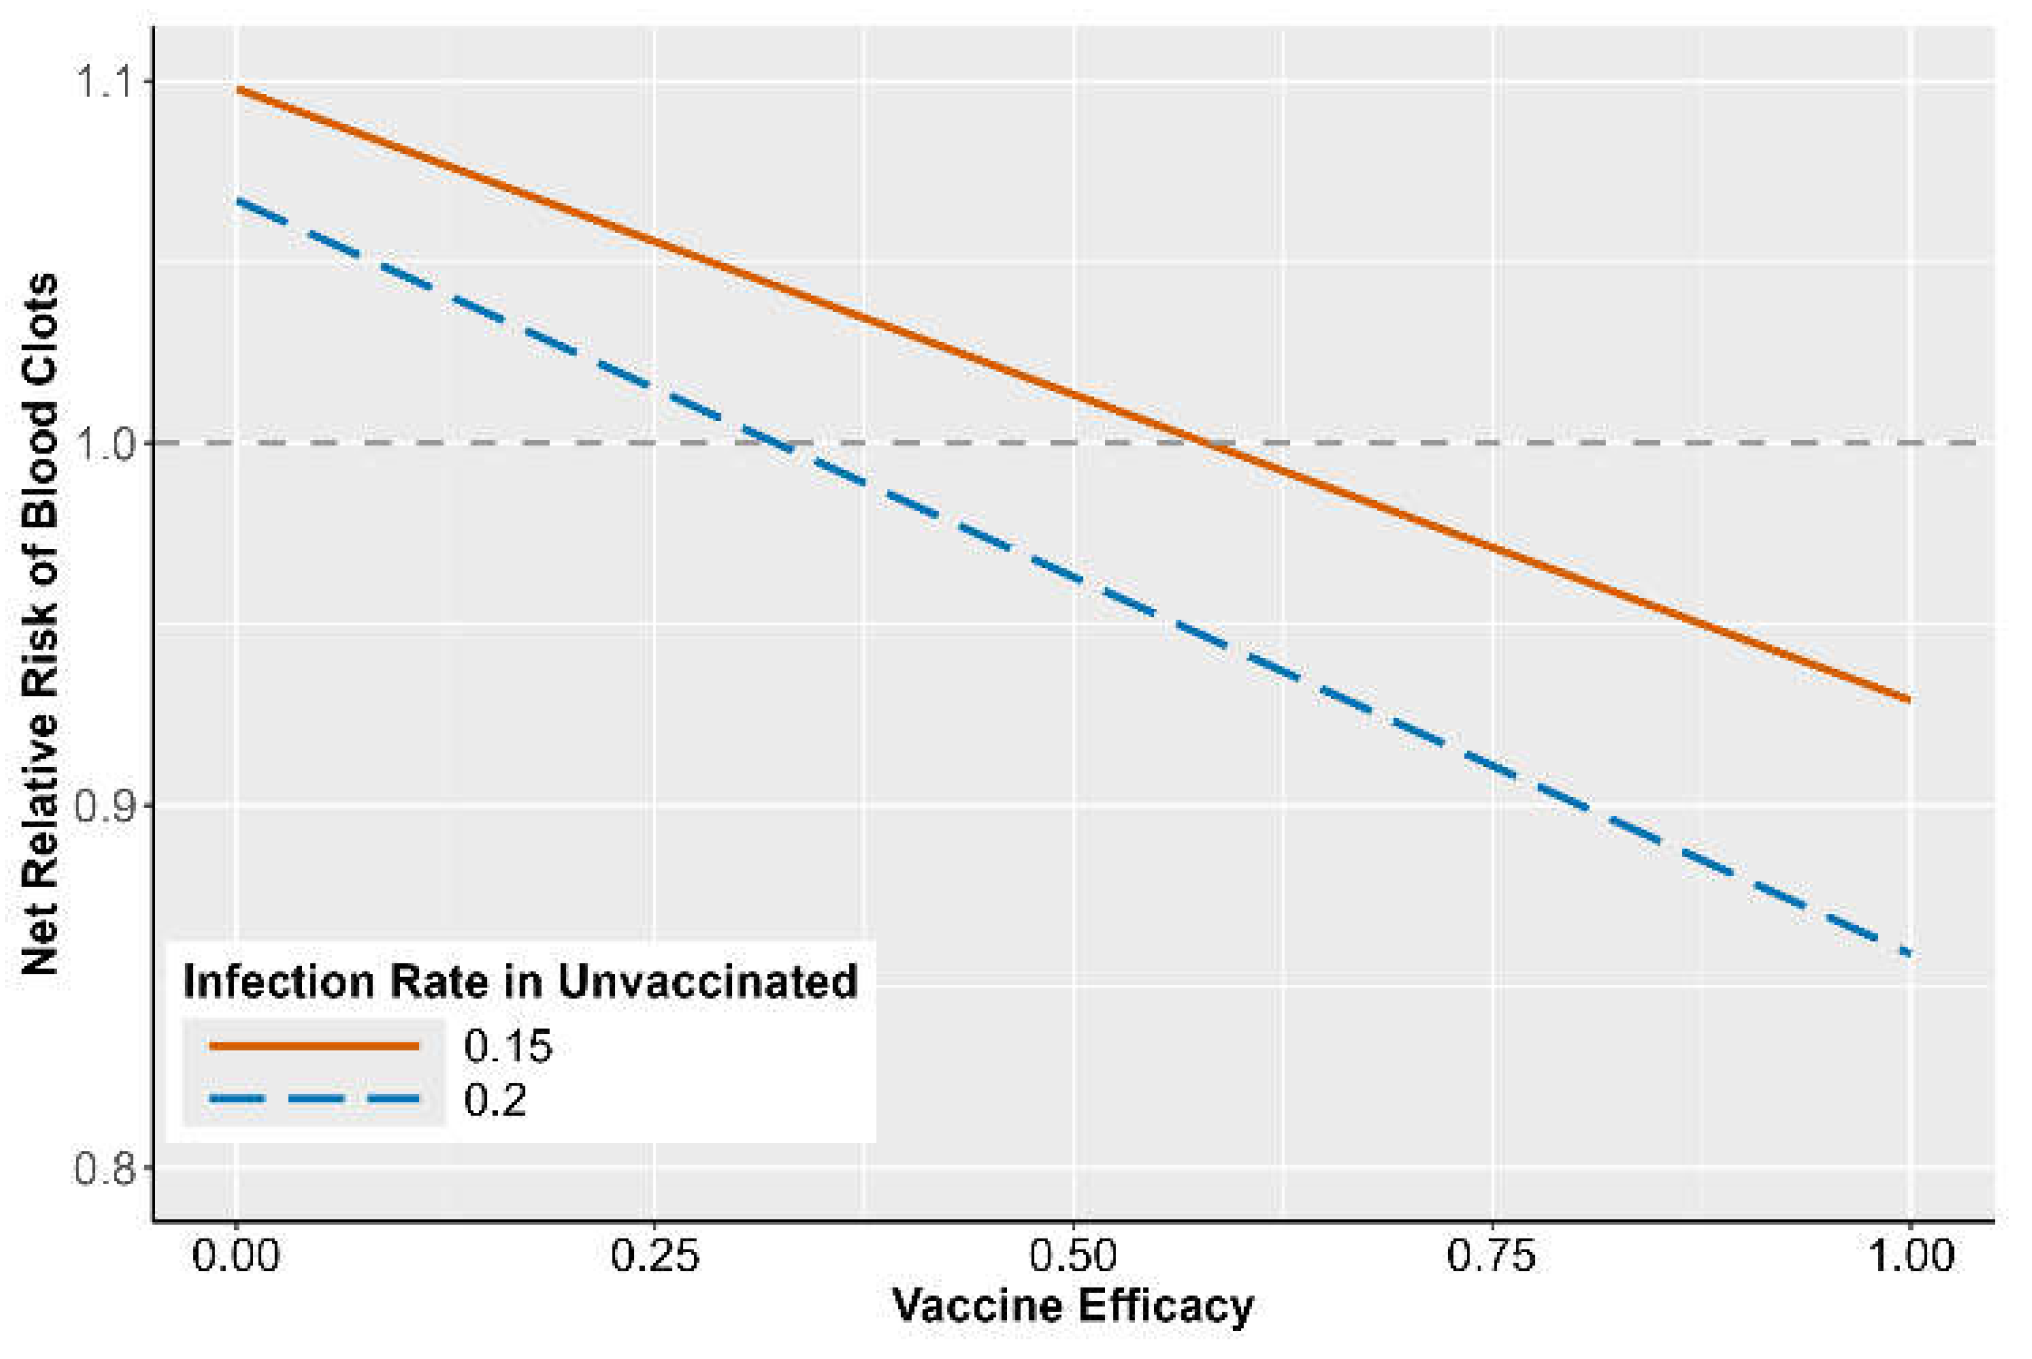
The net relative risk of blood clots after a COVID-19 vaccination depends on the infection rate for both vaccinated and unvaccinated subjects. We defined vaccine efficacy V E = 1 P ( I | V ) / P ( I | V ¯ ) , then with a given infection rate for an unvaccinated subject, P I V ¯ , we derived the risk of infection for a vaccinated subject as P I V = ( 1 V E ) P I V ¯ , and obtained the net risk, R R N e t , as a function of VE.
Figure 3 illustrates the R R N e t of blood clots after a COVID-19 vaccination as a function of VE. If R R N e t is larger than one, COVID-19 vaccination increases the risk of blood blots; if R R N e t is smaller than one, COVID-19 offers protection against blood clots. As VE increases from 0 to 1, R R N e t decreases and reaches a point where vaccine benefits outweigh harms. In addition to VE, the infection rate in the unvaccinated population, P I V ¯ , also affects the R R N e t . During the periods with a higher infection rate, the benefit of vaccination is stronger. More specifically, given P I V ¯ = 0.2 (a conservative estimate for early pandemic), vaccination offers protection against blood clots if VE is larger than 35%. With a VE of 80% (an estimate based on published work [27,28,29]), the net risk of blood clots after vaccination is reduced by 9.94% and 3.72% for P I V ¯ = 0.2 and P I V ¯ = 0.15, respectively.

DISCUSSION

We found that both COVID-19 vaccination and COVID-19 infection increase the risk of blood clots. However, evidence implies that the likelihood of experiencing a thromboembolic event after COVID-19 infection is much higher than after vaccination. Our analysis agrees with previous research, indicating that COVID-19 infection is a more dangerous risk factor for blood clots than vaccination [7,11,12,13].
Different from existing work, we evaluated the association between blood clots and COVID-19 infection using a case-control study, avoiding the misclassification issue associated with the SCCS design. We also studied the effect of prior vaccination on reducing infection-associated blood clots. Moreover, we included both COVID-19 vaccination and COVID-19 infection in the analysis of the risk of blood clots and conducted a risk-benefit analysis by comparing the magnitude of the increased risk through the direct effect of COVID-19 vaccination with the reduced risk through the indirect pathway via protection against severe disease. Our analysis provides evidence that COVID-19 vaccination directly increases the risk of blood clots, but indirectly reduces the risk of infection-associated events. Results show that the indirect benefit of preventing infection-associated blood clots outweighs the direct harm if the vaccine efficacy and infection rate reach a certain level. Moreover, COVID-19 vaccination may have additional benefits in preventing blood clots associated with COVID-19 infection, as a higher rate of vaccination increases the overall level of immunity in the population, reducing the spread of the virus and conferring collective protection against infection-associated blood clots and other health risks associated with COVID-19.
Our risk-benefit analysis was conducted on the population level. This analysis can also be stratified by patient groups of interest. For example, the risk-benefit of vaccination might be different between older and younger populations.
There are several limitations to this study, mostly related to the use of EHR data from a single state. Corewell Health has 22 hospitals and the catchment area for these hospitals across many counties, hence patients may seek care at other facilities outside the Corewell Health system, leading to missing data such as infection data. To deal with the missing infection data, we used the case-control study. Moreover, the use of a prior number of hospital visits as covariates in the regression model mitigates the bias due to differing degrees of interaction with the Corewell Health system between infected and control subjects. However, our case-control design may be subjected to selection bias as subjects hospitalized with physical injury are only a subset of the control cohort and may be unrepresentative of the wider population.
Despite these limitations, our study fills an important gap in quantifying the net risk of blood clots associated with COVID-19 vaccination by considering both the direct effect of vaccination and the indirect effect through protection against COVID-19 infection and severe disease. Moreover, our work emphasizes the importance of having both indirect benefits and direct harms in consideration when studying adverse events associated with any class of vaccine. The mechanism of vaccination is to simulate the immune response the body has against infection using a dead/attenuated virus or mRNA. So, we would expect a vaccine to be associated with some side effects held in common with the virus but in a less severe form (e.g., blood clots, myocarditis [30], acute kidney injury [31,32]). Therefore, studying both indirect benefits and direct harms provides a comprehensive analysis of vaccination safety.

Supplementary Materials

The following supporting information can be downloaded at the website of this paper posted on Preprints.org.

Author Contributions

H.T.: Manuscript writing, study design, statistical analysis, data preparation; M.R. Manuscript writing, study design; G.B. Clinical advice and study design; L.Z. Manuscript writing, study design, statistical analysis.

Institutional Review Board Statement

We used de-identified EHR data, the use of which was approved by the Institutional Review Board (IRB) of Corewell Health

Funding

Research reported in this publication was supported by the National Institute of Allergy and Infectious Diseases of the National Institutes of Health under Award Number R01AI158543. The content is solely the responsibility of the authors and does not necessarily represent the official views of the National Institutes of Health.

Data Availability Statement

Data is unavailable due to privacy or ethical restrictions.

Acknowledgments

We thank Kevin Heinrich at Quire for querying the data from Corewell Health Epic system.

Conflicts of Interest

The authors declare no conflicts of interest.

References

  1. Centers for Disease Control and Prevention. COVID Data Tracker. U.S. Department of Health and Human Services, CDC: Atlanta, GA, USA, 17 November 2023. https://covid.cdc.gov/covid-data-tracker.
  2. Avinash Mani, Vineeta Ojha. Thromboembolism after COVID-19 Vaccination: A Systematic Review of Such Events in 286 Patients. Annals of Vascular Surgery 2022, 84, 12–20.e1. [CrossRef] [PubMed]
  3. Leonor Dias, Ricardo Soares-dos-Reis, Meira Joao, et al. Cerebral venous thrombosis after BNT162b2 mRNA SARS-CoV-2 vaccine. Journal of Stroke and Cerebrovascular Diseases 2021, 30, 105906. [CrossRef] [PubMed]
  4. Elizabeth A. Andraska, Rohan Kulkarni, Mirnal Chaudhary M, Ulka Sachdev. Three cases of acute venous thromboembolism in females following vaccination for COVID-19. Journal of Vascular Surgery: Venous and Lymphatic Disorders 2021, 10, 14–17. [CrossRef] [PubMed]
  5. Giuseppe Carli, Ilaria Nichele, Marco Ruggeri, Salvatore Barra, Alberto Tosetto. Deep vein thrombosis (DVT) occurring shortly after the second dose of mRNA SARS-CoV-2 vaccine. Intern Emerg Med 2021, 16, 803–804. [CrossRef]
  6. Zaitun Zakaria, Nur Asma Sapiai, Abdul Rahman Izaini Ghani. Cerebral venous sinus thrombosis 2 weeks after the first dose of mRNA SARS-CoV-2 vaccine. Acta Neurochir 2021, 163, 2359–2362. [CrossRef] [PubMed]
  7. Julia Hippisley-Cox, Martina Patone, Xu W Mei, et al. Risk of thrombocytopenia and thromboembolism after covid-19 vaccination and SARS-CoV-2 positive testing: self-controlled case series study. BMJ 2021, 374, n1931. [CrossRef]
  8. Maxime Taquet, Masud Husain, John R Geddes, Sierra Luciano, Paul J Harrison. Cerebral venous thrombosis and portal vein thrombosis: A retrospective cohort study of 537,913 COVID-19 cases. eClinicalMedicine 2021, 39, 101061. [CrossRef]
  9. Farah Yasmin, Hala Najeeb, Unaiza Naeem, et al. Adverse events following COVID-19 mRNA vaccines: A systematic review of cardiovascular complication, thrombosis, and thrombocytopenia. Immunity, Inflammation and Disease 2023, 11, e807. [CrossRef]
  10. Frederick K. Ho, Kenneth K.C. Man, Mark Toshner, et al. Thromboembolic Risk in Hospitalized and Nonhospitalized COVID-19 Patients: A Self-Controlled Case Series Analysis of a Nationwide Cohort. Mayo Clinic Proceedings 2021, 96, 2587–2597. [CrossRef]
  11. Xiaoming Xiong, Jianhua Chi, and Qinglei Gao. Prevalence and risk factors of thrombotic events on patients with COVID-19: a systematic review and meta-analysis. Thrombosis Journal 2021, 19, 1–9. [CrossRef]
  12. Sam Schulman, Yu Hu, and Stavros Konstantinides. Venous Thromboembolism in COVID-19. Thrombosis and Haemostasis 2020, 120, 1642–1653. [CrossRef] [PubMed]
  13. Katsoularis I, Fonseca-Rodríguez O, Farrington P, et al. Risk of acute myocardial infarction and ischaemic stroke following COVID-19 in Sweden: a self-controlled case series and matched cohort study. The Lancet 2021, 398, 599–607. [CrossRef] [PubMed]
  14. Mahmoud B. Malas, Isaac N. Naazie, Nadin Elsayed, et al. Thromboembolism risk of COVID-19 is high and associated with a higher risk of mortality: A systematic review and meta-analysis. eClinicalMedicine 2020, 29, 100639. [CrossRef]
  15. C. R. Simpson, T. Shi, E. Vasileiou, et al. First-dose ChAdOx1 and BNT162b2 COVID-19 vaccines and thrombocytopenic, thromboembolic and hemorrhagic events in Scotland. Natural Medicine 2021, 29, 1290–1297. [CrossRef] [PubMed]
  16. Marie Joelle Jabagi, Jérémie Botton, Marion Bertrand, et al. Myocardial Infarction, Stroke, and Pulmonary Embolism After BNT162b2 mRNA COVID-19 Vaccine in People Aged 75 Years or Older. JAMA 2022, 327, 80–82. [CrossRef]
  17. Jacob Dag Berild, Vilde Bergstad Larsen, Emilia Myrup Thiesson, et al. Analysis of Thromboembolic and Thrombocytopenic Events After the AZD1222, BNT162b2, and MRNA-1273 COVID-19 Vaccines in 3 Nordic Countries. JAMA Netw Open 2022, 5, e2217375. [CrossRef]
  18. Chui Celine Sze Ling, Min Fan, Eric Yuk Fai Wan, et al. Thromboembolic events and hemorrhagic stroke after mRNA (BNT162b2) and inactivated (CoronaVac) covid-19 vaccination: A self-controlled case series study. eClinicalMedicine 2022, 50, 101504. [CrossRef] [PubMed]
  19. Gareth J. Griffith, Tim T. Morris, Matthew J. Tudball, et al. Collider bias undermines our understanding of COVID-19 disease risk and severity. Nature communications 2020, 11, 1–12. [CrossRef]
  20. Bu Fan, Martijn J. Schuemie, Akihiko Nishimura, et al. Bayesian safety surveillance with adaptive bias correction. Statistics in Medicine 2023, 43, 395–418. [CrossRef]
  21. Charlson, M.E.; Pompei, P.; Ales, K.L.; MacKenzie, C.R. A new method of classifying prognostic comorbidity in longitudinal studies: development and validation. Journal of Chronic Diseases 1987, 40, 373–383. [Google Scholar] [CrossRef]
  22. Gasparini, Alessandro. An R package for computing comorbidity scores. Journal of Open Source Software 2018, 3, 648. [CrossRef]
  23. Fleming-Dutra, K.E.; Britton, A.; Shang, N.; et al. Association of Prior BNT162b2 COVID-19 Vaccination With Symptomatic SARS-CoV-2 Infection in Children and Adolescents During Omicron Predominance. JAMA 2022, 327, 2210–2219. [Google Scholar] [CrossRef] [PubMed]
  24. Katherine E. Fleming-Dutra, Allison Avrich Ciesla, Lauren E. Roper, et al. Preliminary Estimates of Effectiveness of Monovalent mRNA Vaccines in Preventing Symptomatic SARS-CoV-2 Infection Among Children Aged 3–5 Years—Increasing Community Access to Testing Program, United States, July 2022–February 2023. Morbidity and Mortality Weekly Report 2023, 72, 177–182. [CrossRef] [PubMed]
  25. Kelly M Hatfield, James Baggs, Hannah Wolford, et al. Effectiveness of Coronavirus Disease 2019 (COVID-19) Vaccination Against Severe Acute Respiratory Syndrome Coronavirus 2 (SARS-CoV-2) Infection Among Residents of US Nursing Homes Before and During the Delta Variant Predominance. Clinical Infectious Diseases 2022, 75 (Suppl. 2), S147–S154. [CrossRef]
  26. Silverstein, M.D.; Heit, J.A.; Mohr, D.N.; Petterson, T.M.; O'Fallon, W.M.; Melton, L.J., 3rd. Trends in the incidence of deep vein thrombosis and pulmonary embolism: a 25-year population-based study. Arch Intern Med 1999, 158, 585–593. [Google Scholar] [CrossRef] [PubMed]
  27. Chen Shen, Malcolm Risk, Elena Schiopu, et al. Efficacy of COVID-19 vaccines in patients taking immunosuppressants. Ann Rheum Dis 2022, 81, 875–880. [CrossRef] [PubMed]
  28. Malcolm Risk, Chen Shen, Salim S Hayek, et al. Comparative Effectiveness of Coronavirus Disease 2019 (COVID-19) Vaccines Against the Delta Variant. Clin Infect Dis 2022, 75, e623–e629. [CrossRef] [PubMed]
  29. Malcolm Risk, Salim S Hayek, Elena Schiopu, et al. COVID-19 vaccine effectiveness against omicron (B.1.1.529) variant infection and hospitalisation in patients taking immunosuppressive medications: a retrospective cohort study. The Lancet Rheumatology 2022, 4, e775–e784. [CrossRef] [PubMed]
  30. Martian Patone, Xu W Mei, Lahiru Handunnetthi, et al. Risk of Myocarditis After Sequential Doses of COVID-19 Vaccine and SARS-CoV-2 Infection by Age and Sex. Circulation 2022, 146, 743–754. [CrossRef]
  31. Huiting Luo, Xiaolin Li, Qidong Ren, et al. Acute kidney injury after COVID-19 vaccines: a real-world study. Renal Failure 2022, 44, 958–965. [CrossRef]
  32. Fabrizi Fabrizio, Carlo M. Alfieri, Roberta Cerutti, et al. COVID-19 and Acute Kidney Injury: A Systematic Review and Meta-Analysis. Pathogens 2020, 9, 1052. [CrossRef] [PubMed]
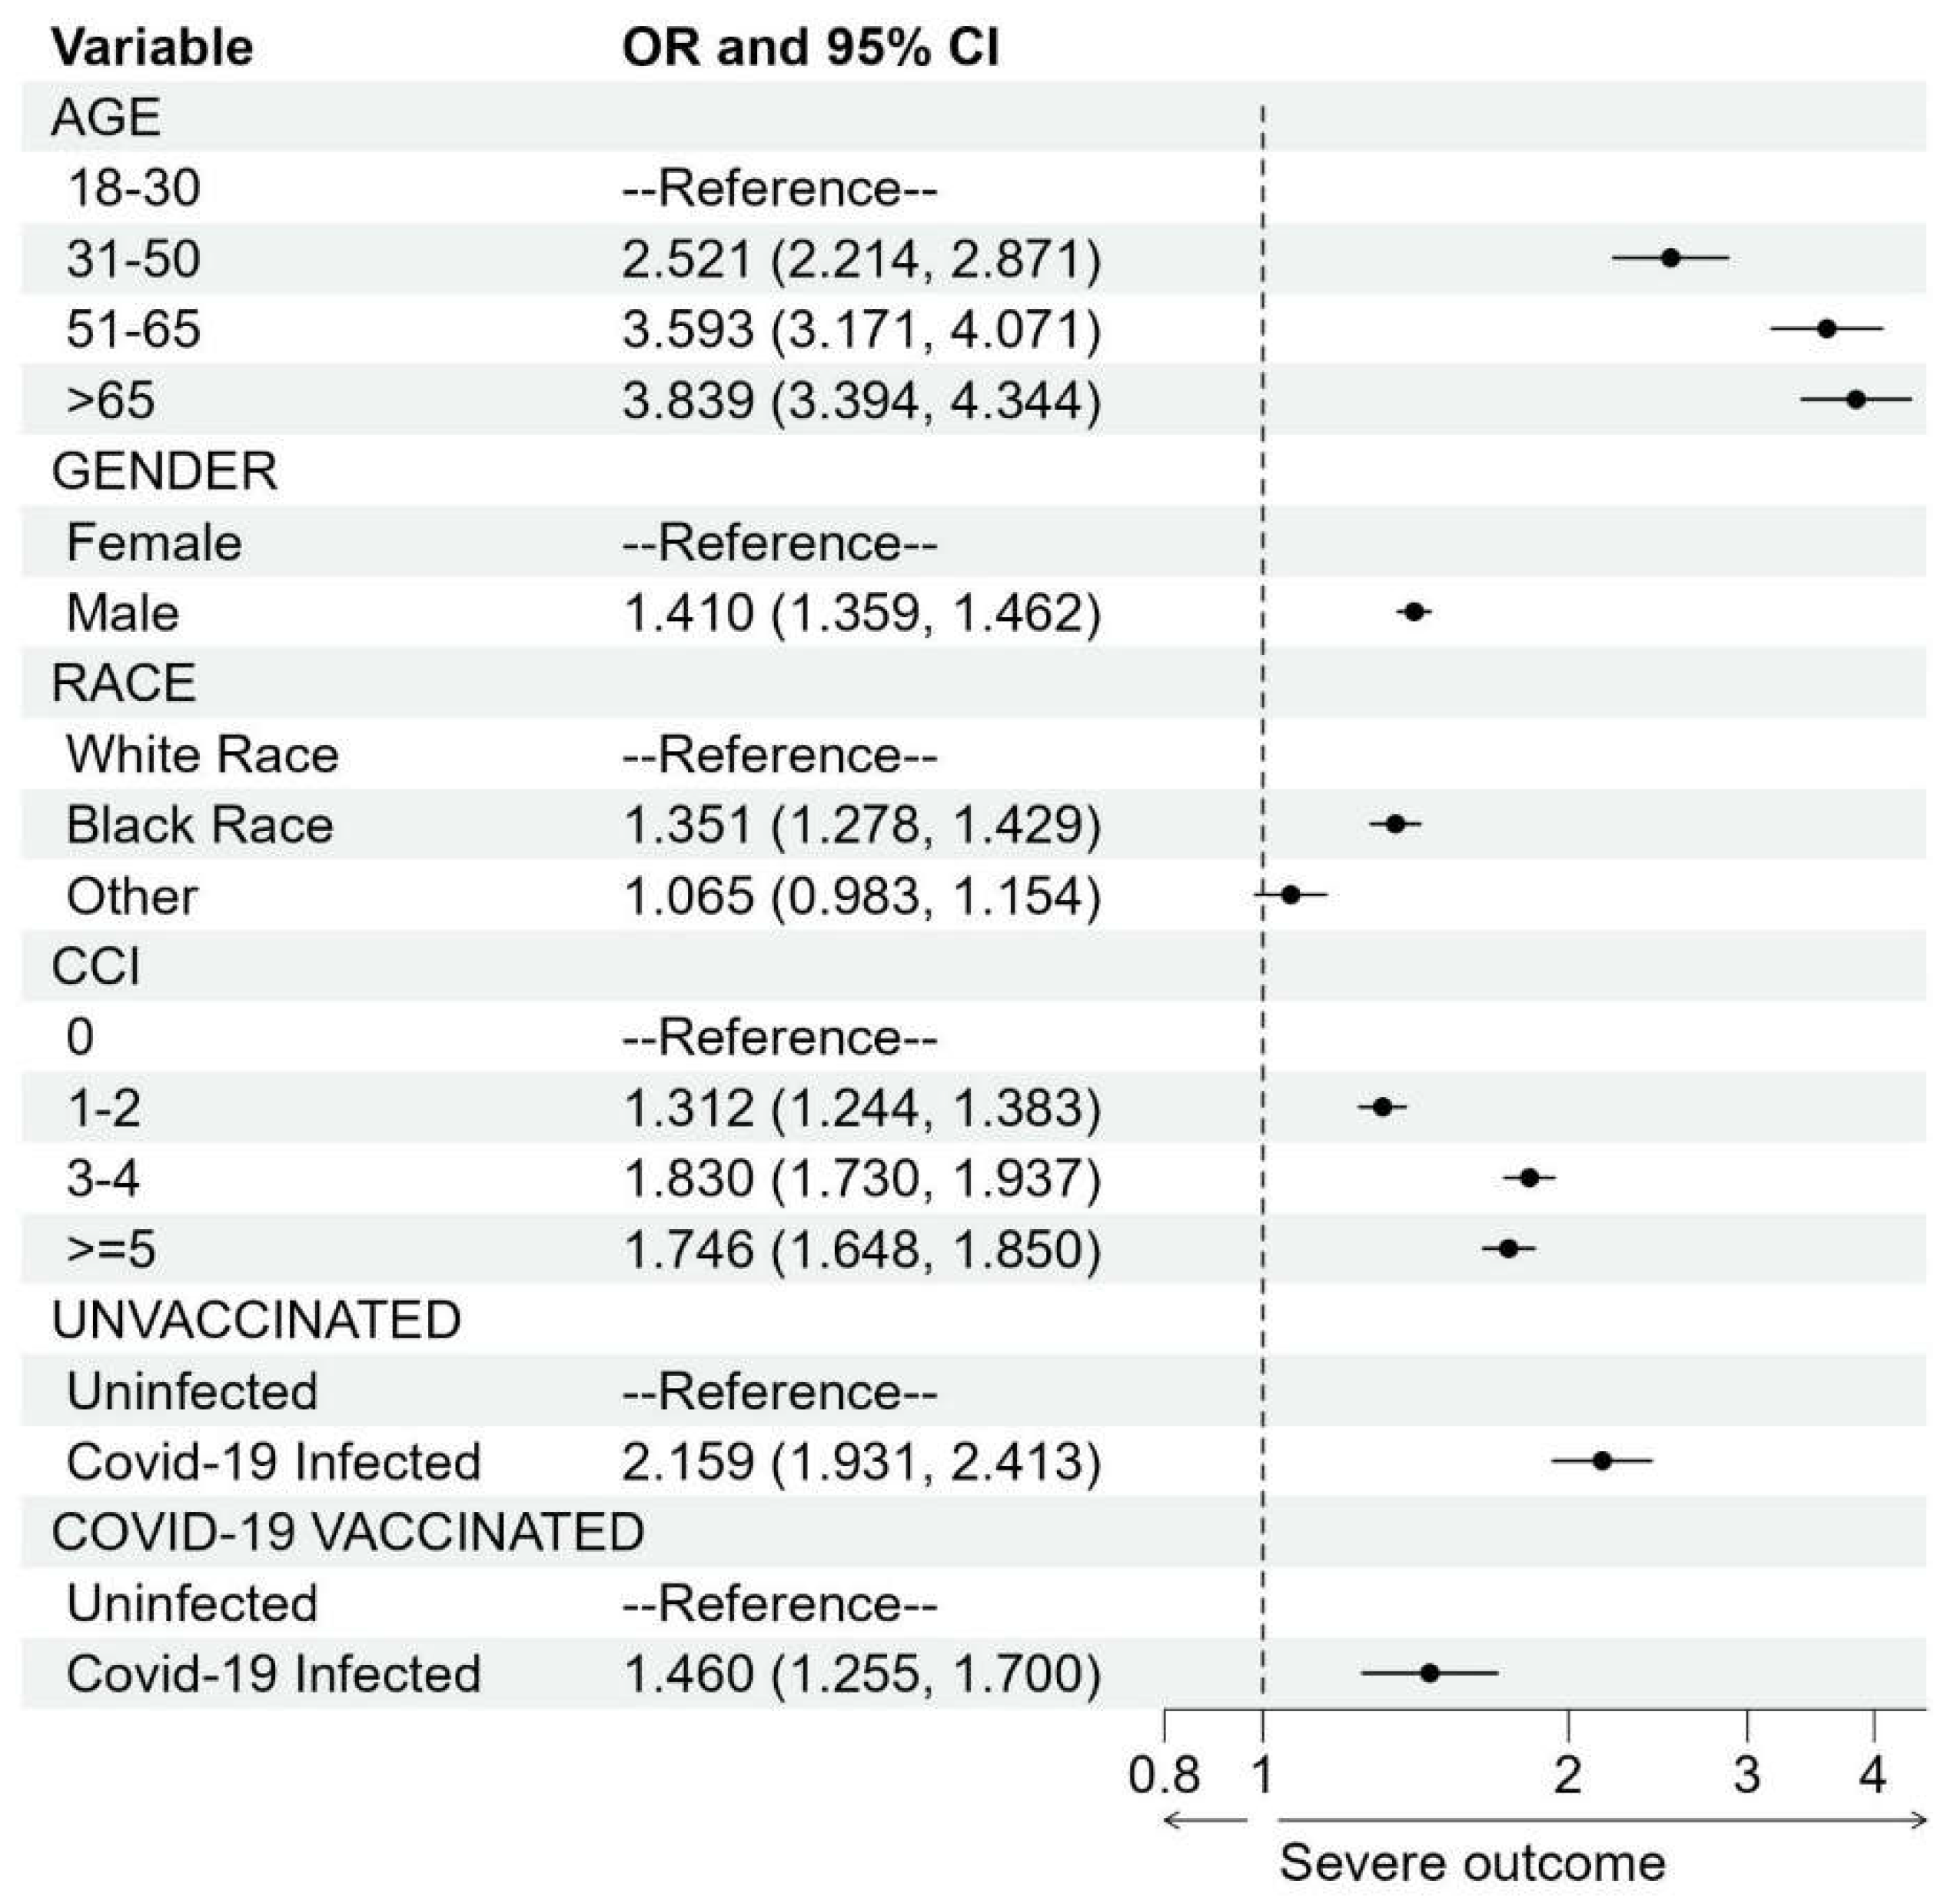
Figure 1. Forest plot for the case-control study to study the association between blood clots and COVID-19 infection. Odds ratio (OR) is denoted by a solid circle and 95% confidence interval (CI) is represented by a line. The x-axis is plotted on the natural log scale. CCI, Charlson Comorbidity Index.
Preprints 104850 g001
Figure 2. Direct and indirect associations between blood clots and mRNA-vaccines.
Preprints 104850 g002
Figure 3. Net relative risk of blood clots comparing vaccinated and unvaccinated subjects. Infection rate 0.15 and 0.2 is the probability of COVID-19 infection before vaccination [27]. The x-axis is vaccine efficacy, and the y-axis is the net relative risk of blood clots.
Preprints 104850 g003
Table 1. SCCS cohort to study COVID-19 vaccination exposure on blood clots. Characteristics of patients who experienced at least one blood clot event and had at least one dose of mRNA-based vaccination from Dec 1st, 2020, to August 31st, 2022.
Patient Characteristics in SCCS Study
Dose 1
(N = 18,466)
Dose 2
(N = 17,523)
AGE
18-30 161 (0.87%) 142 (0.81%)
31-50 1,416 (7.67%) 1,304 (7.44%)
51-65 4,422 (23.95%) 4,166 (23.77%)
>65 12,467 (67.51%) 11,911 (68.97%)
GENDER
Female 8,691 (47.06%) 8,247 (47.06%)
Male 9,775 (52.94%) 9,276 (52.94%)
RACE
White Race 14,803 (80.16%) 14,089 (80.40%)
Black Race 2,697 (14.61%) 2,514 (14.35%)
Other 966 (5.23%) 920 (5.25%)
CHARLSON COMORBIDITY INDEX (CCI)
0 2,938 (15.91%) 2,801 (15.98%)
1-2 5,153 (27.91%) 4,910 (28.02%)
3-4 5,326 (28.84%) 5,061 (28.88%)
>=5 5,049 (27.34%) 4,751 (27.11%)
NUM. BLOOD CLOTS IN RISK PERIODS
763 894
Table 2. Case-control cohort to study COVID-19 infection exposure on blood clots Characteristics of patients who experienced a blood clot or hospitalized injury event from Dec 1st, 2020, to August 31st, 2022.
Patient Characteristics in Case-control Study
Blood clots
N = 28,304 (57.47%)
Physical injury
N = 20,943 (42.53%)
Overall
N = 49,247
AGE
18-30 378 (1.34%) 1,118 (5.33%) 1,496 (3.04%)
31-50 2,686 (9.49%) 2,902 (13.86%) 5,588 (11.35%)
51-65 7,280 (25.72%) 5,184 (24.75%) 12,464 (25.31%)
>65 17,960 (63.45%) 11,739 (56.05%) 29,699 (60.31%)
GENDER
Female 13,207 (46.66%) 11,588 (55.34%) 24,795 (50.35%)
Male 15,097 (53.34%) 9,355 (44.67%) 24,452 (49.65%)
RACE
White Race 22,568 (79.73%) 17,135 (81.8%) 39,703 (80.62%)
Black Race 4,175 (14.75%) 2,577 (12.30%) 6,752 (13.71%)
Other 1,561 (5.52%) 1,231 (5.88%) 2,792 (5.67%)
CHARLSON COMORBIDITY INDEX (CCI)
0 4,722 (16.68%) 5,389 (25.73%) 10,111 (20.53%)
1-2 7,957 (28.11%) 6,469 (30.89%) 14,426 (29.29%)
3-4 8,047 (28.43%) 4,535 (21.65%) 12,582 (25.55%)
>=5 7,578 (26.77%) 4,550 (21.73%) 12,128 (24.63%)
COVID-19 VACCINATION BEFORE INFECTION
NO 12,313 (43.50%) 9,341 (44.60%) 21,654 (43.97%)
YES 15,991 (56.50%) 11,602 (55.40%) 27,593 (56.03%)
INFECTION WITHIN 28 DAYS PRIOR TO AT THE DATE OF EVENT
NO 26,510 (93.66%) 20,200 (96.45%) 46,710 (94.85%)
YES 1,794 (6.34%) 743 (3.55%) 2,537 (5.15%)
Disclaimer/Publisher’s Note: The statements, opinions and data contained in all publications are solely those of the individual author(s) and contributor(s) and not of MDPI and/or the editor(s). MDPI and/or the editor(s) disclaim responsibility for any injury to people or property resulting from any ideas, methods, instructions or products referred to in the content.
Copyright: This open access article is published under a Creative Commons CC BY 4.0 license, which permit the free download, distribution, and reuse, provided that the author and preprint are cited in any reuse.
Prerpints.org logo

Preprints.org is a free preprint server supported by MDPI in Basel, Switzerland.

Subscribe

© 2024 MDPI (Basel, Switzerland) unless otherwise stated