1. Introduction
Hypertension is a prevalent condition, impacting three out of every ten adults [
1]. Hypertension is dangerous because it leads to complications like arteriosclerosis, stroke, and heart failure. Heart failure (HF) is a disease in which the body is not supplied with the amount of blood required due to impaired diastolic or systolic function of the heart. On average, HF patients have a one-year mortality rate of 33%, indicating a very poor prognosis [
2]. Crucially, the incidence of HF is about three times higher in hypertensive patients than in non-hypertensive populations [
3]. Therefore, patients with hypertension need to be especially careful to avoid developing HF. We believe that identifying predictive factors for HF progression in hypertensive patients would be of great benefit.
The purpose of this study is to identify predictive factors for heart failure progression in hypertensive patients, and for this purpose, it was decided to use diagnosed medical conditions. Genetic data such as gene expression and DNA sequences can also be used to identify the predictive factors; however, genetic data on patients with hypertension and HF are not sufficient to build analytical models. Furthermore, even if analytical models are successfully constructed using genetic data, hypertension patients will need to obtain their genetic information in order to utilize the models. Predictive factors based on medical conditions, which are easily accessible to most hypertension patients, are expected to be highly useful.
Importantly, only medical history recorded prior to the time of hypertension diagnosis were employed in this study. This will make it possible to predict heart failure at the exact point of hypertension diagnosis based on previous medical conditions. The reason for establishing this strategy is because preliminary analysis confirmed that most patients develop heart failure within a year after being diagnosed with hypertension, which represents a very rapid progression (
Figure 3e).
There are many well-known predictive factors for heart failure derived from medical conditions, which can be broadly divided into two categories, i.e., cardiac dysfunctions and adult diseases [
4]. Coronary artery disease and valvular heart disease can be included in cardiac dysfunctions [
5,
6], and type 2 diabetes and obesity are associated with adult diseases [
7,
8]. Hypertension, known as a representative adult disease, is also one of the well-known predictive factors for HF [
9]. However, to our knowledge, this study is the first to identify predictors of HF in the setting of diagnosed hypertension. We hope that the results of this study will be of great help to hypertensive patients.
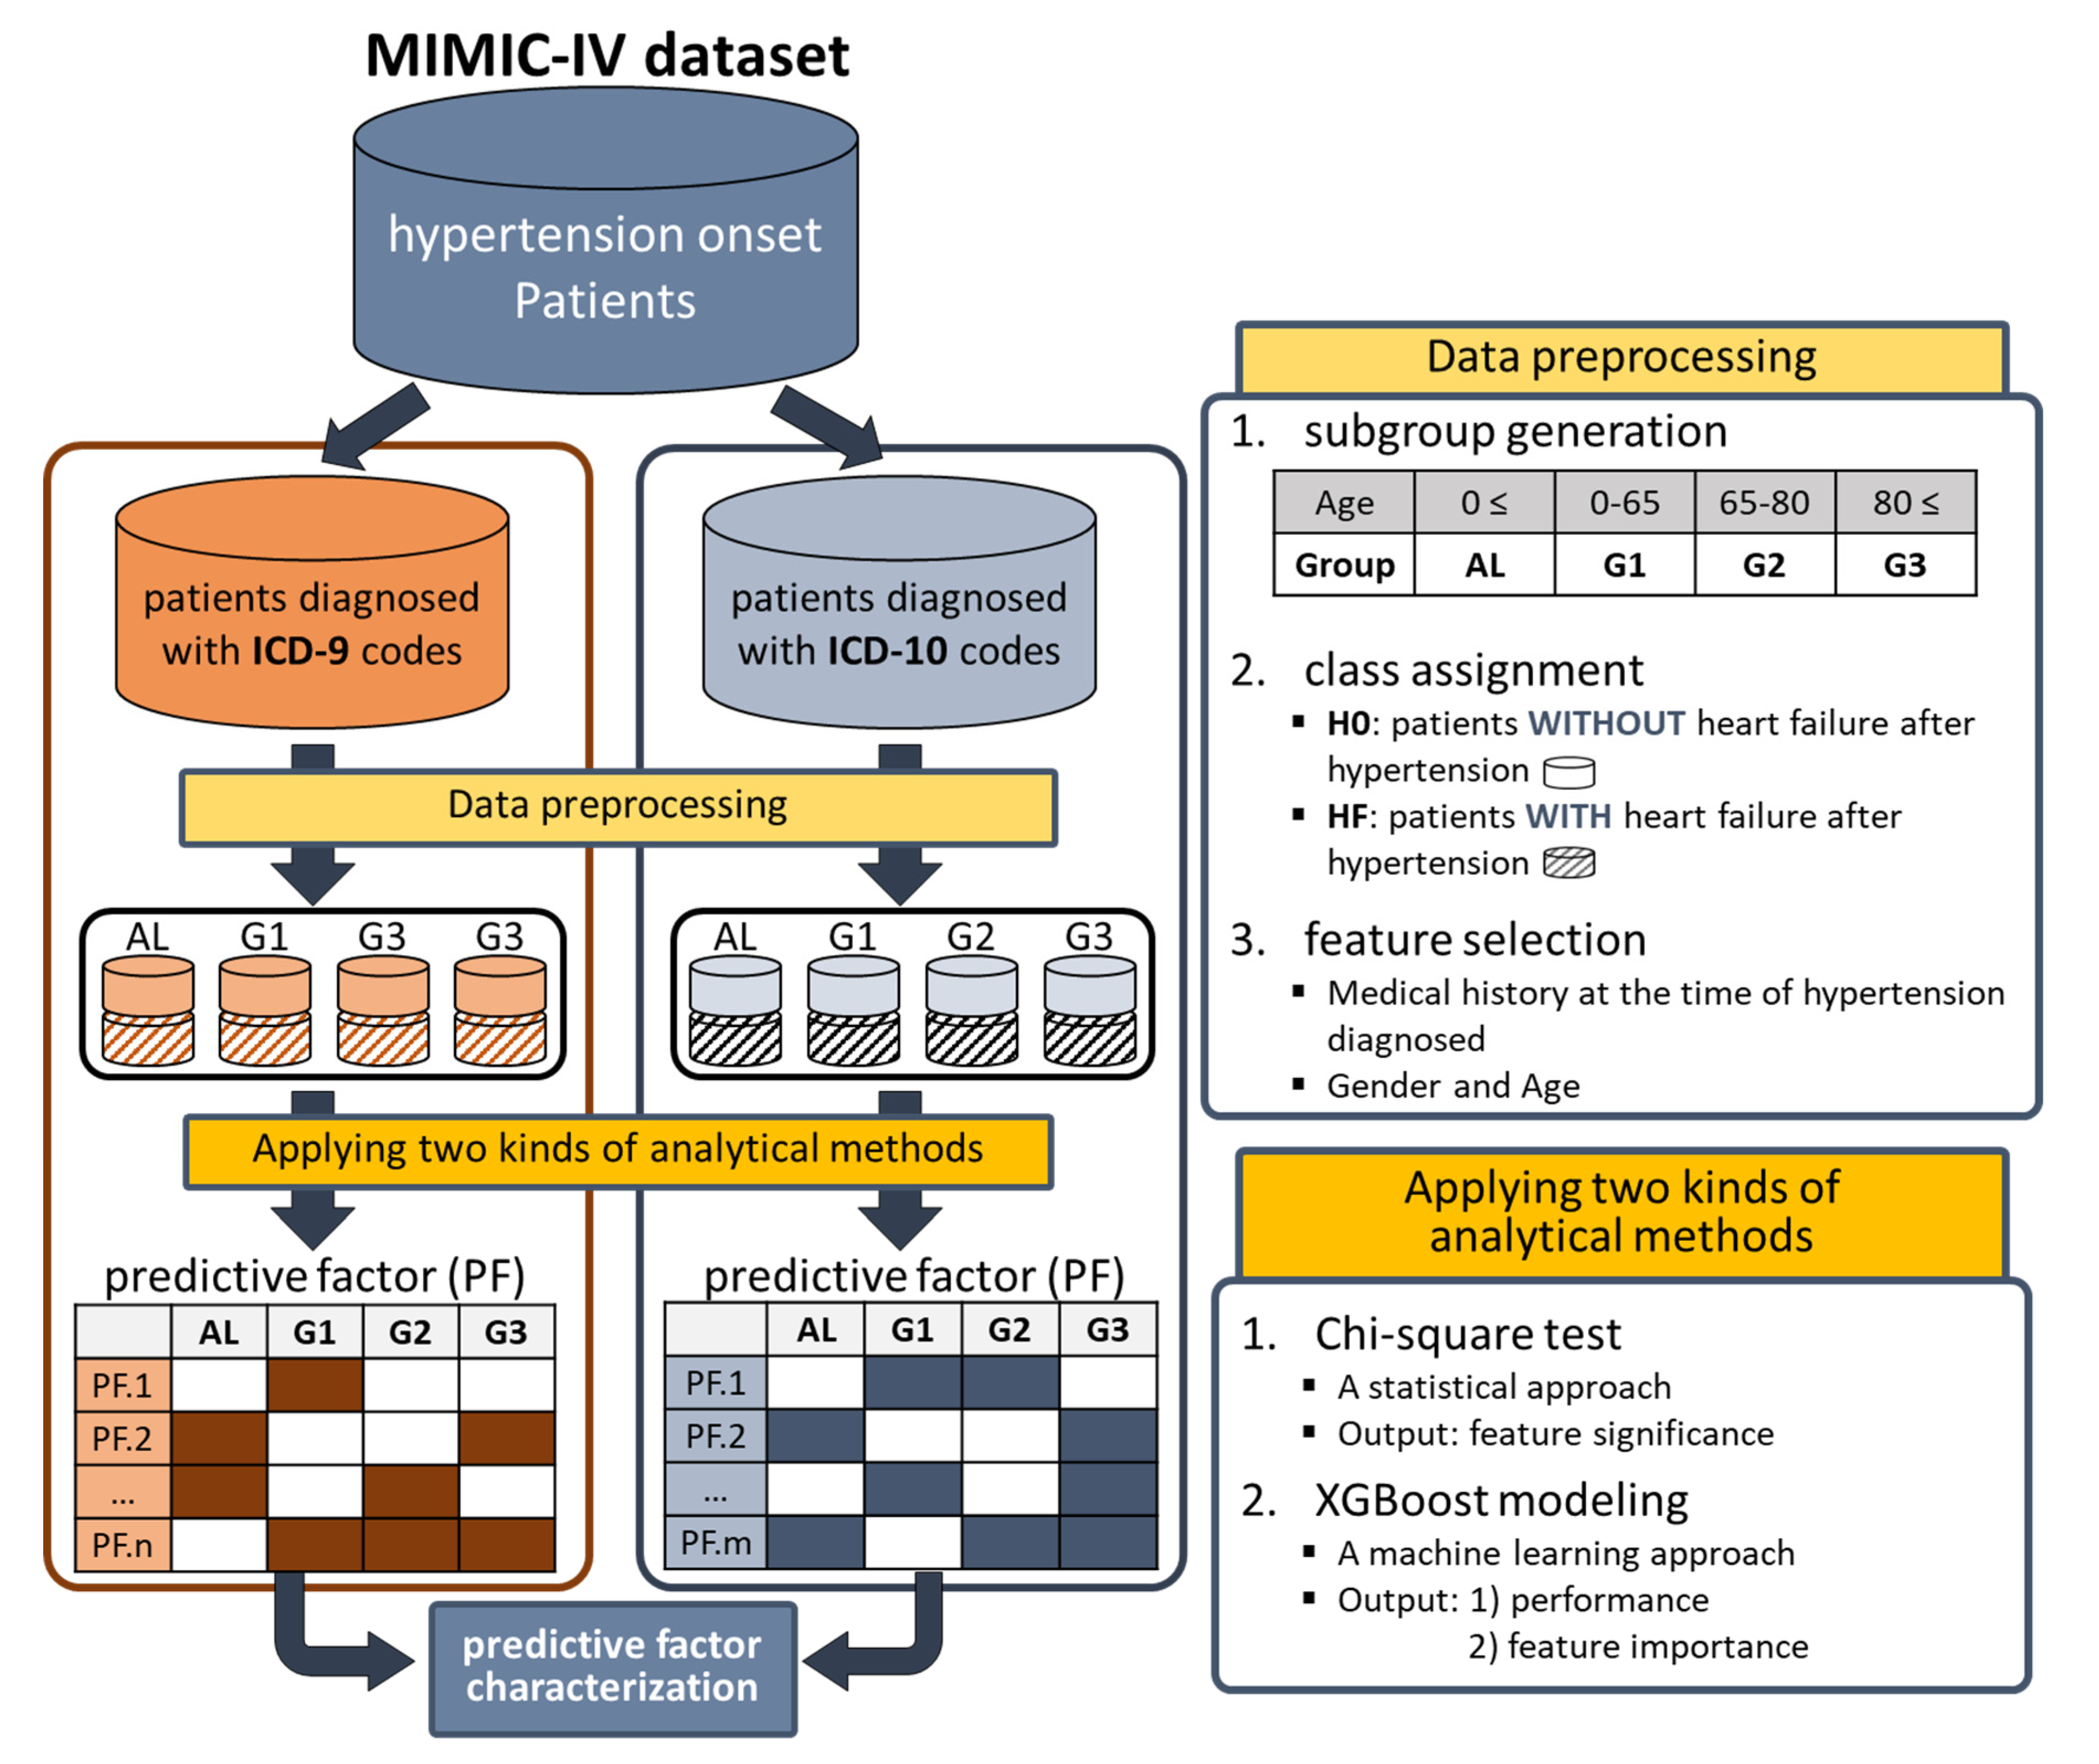
For the purpose of this study, we decided to use the MIMIC-IV database, containing various kinds of clinical data such as diagnosed diseases and demographic information. Patients diagnosed with hypertension were selected from the MIMIC-IV dataset and divided into two groups: those who later developed HF and those who did not. For each patient, medical history prior to the point of hypertension diagnosis was processed and obtained, and age and gender information were added as well. Then, two analysis methods were applied to the preprocessed data, i.e., the chi-square test and XGBoost modeling. In the chi-square test, statistically significant medical conditions were characterized as predictive factors. By training XGBoost models, the feature importance scores of the trained models were employed to reveal predictive factors (
Figure 1). We also prepared a detailed strategy overview for this study, shown in
Figure 2; the prepared hypertensive patients were divided into two groups according to the ICD systems used (9 and 10), because both ICD systems were used simultaneously in the MIMIC-IV database. Furthermore, each of the two groups was further divided into four subgroups according to age, which were eventually used as inputs of the two analysis methods (
Figure 2). As a result, 21 predictive factors were characterized, including atrial fibrillation, the use of anticoagulants, kidney failure, pneumonia, and anemia.
2. Materials and Methods
2.1. MIMIC-IV Dataset
In this study, we decided to use the MIMIC-IV (Medical Information Mart for Intensive Care IV) dataset, which is a comprehensive and widely utilized resource in the field of healthcare research [
10,
11]. The MIMIC-IV dataset contains de-identified electronic health records from patients admitted to the Beth Israel Deaconess Medical Center in Boston. It provides a rich and diverse collection of clinical data, including diagnosed diseases, laboratory results, medications, and demographic information, spanning over a decade [
12,
13]. Researchers can leverage this dataset to handle various medical issues, such as predicting patient outcomes and understanding disease trajectories [
14,
15]. Among all patients in MIMIC-IV, only data on patients diagnosed with hypertension (code 4019 for ICD9 and I10 for ICD10) were collected. As two types of ICD systems (9 and 10) were used for diagnosis in the MIMIC-IV database, we classified the patients into two groups based on the ICD systems used (
top of Figure 2). During this process, patients using both ICD systems were excluded.
2.2. Data Preprocessing
The three steps of data preprocessing were performed sequentially on the prepared data
(top right side of Figure 2): 1) subgroup generation, 2) class assignment, and 3) feature selection. Firstly, subgroups were generated based on age at the first diagnosis of hypertension (FDH), allowing four kinds of subgroups, i.e., AL (0≤age, entire data), G1 (0 ≤ age < 65), G2 (65 ≤ age < 80), and G3 (80 ≤ age). Secondly, patients in each subgroup were divided into two classes (H0 and HF). Class H0 was assigned to patients without heart failure after the FDH, and class HF was assigned to patients diagnosed with heart failure after the FDH. The ICD codes in
Table S1 were used to determine which patients were diagnosed with HF. During this process, patients diagnosed with HF before the FDH were excluded. The number of patients in H0 and HF classes for each subgroup is summarized in
Table 1. Thirdly, features used in analytical methods were selected. Medical conditions diagnosed before FDH (i.e., the previous medical history at the time of FDH) were considered to be candidate features. We noticed that the number of medical conditions diagnosed before FDH was very large: more than 5,000 in ICD9 and more than 8,000 in ICD10. Therefore, for each group, only frequently diagnosed medical history data in patients of class HF (≥ 5%) were selected as the features for analytical methods. Additionally, two pieces of personal information, gender and age, were added.
The basic statistics for the data prepared through the preprocessing stage are shown in
Figure 3 for ICD9 and
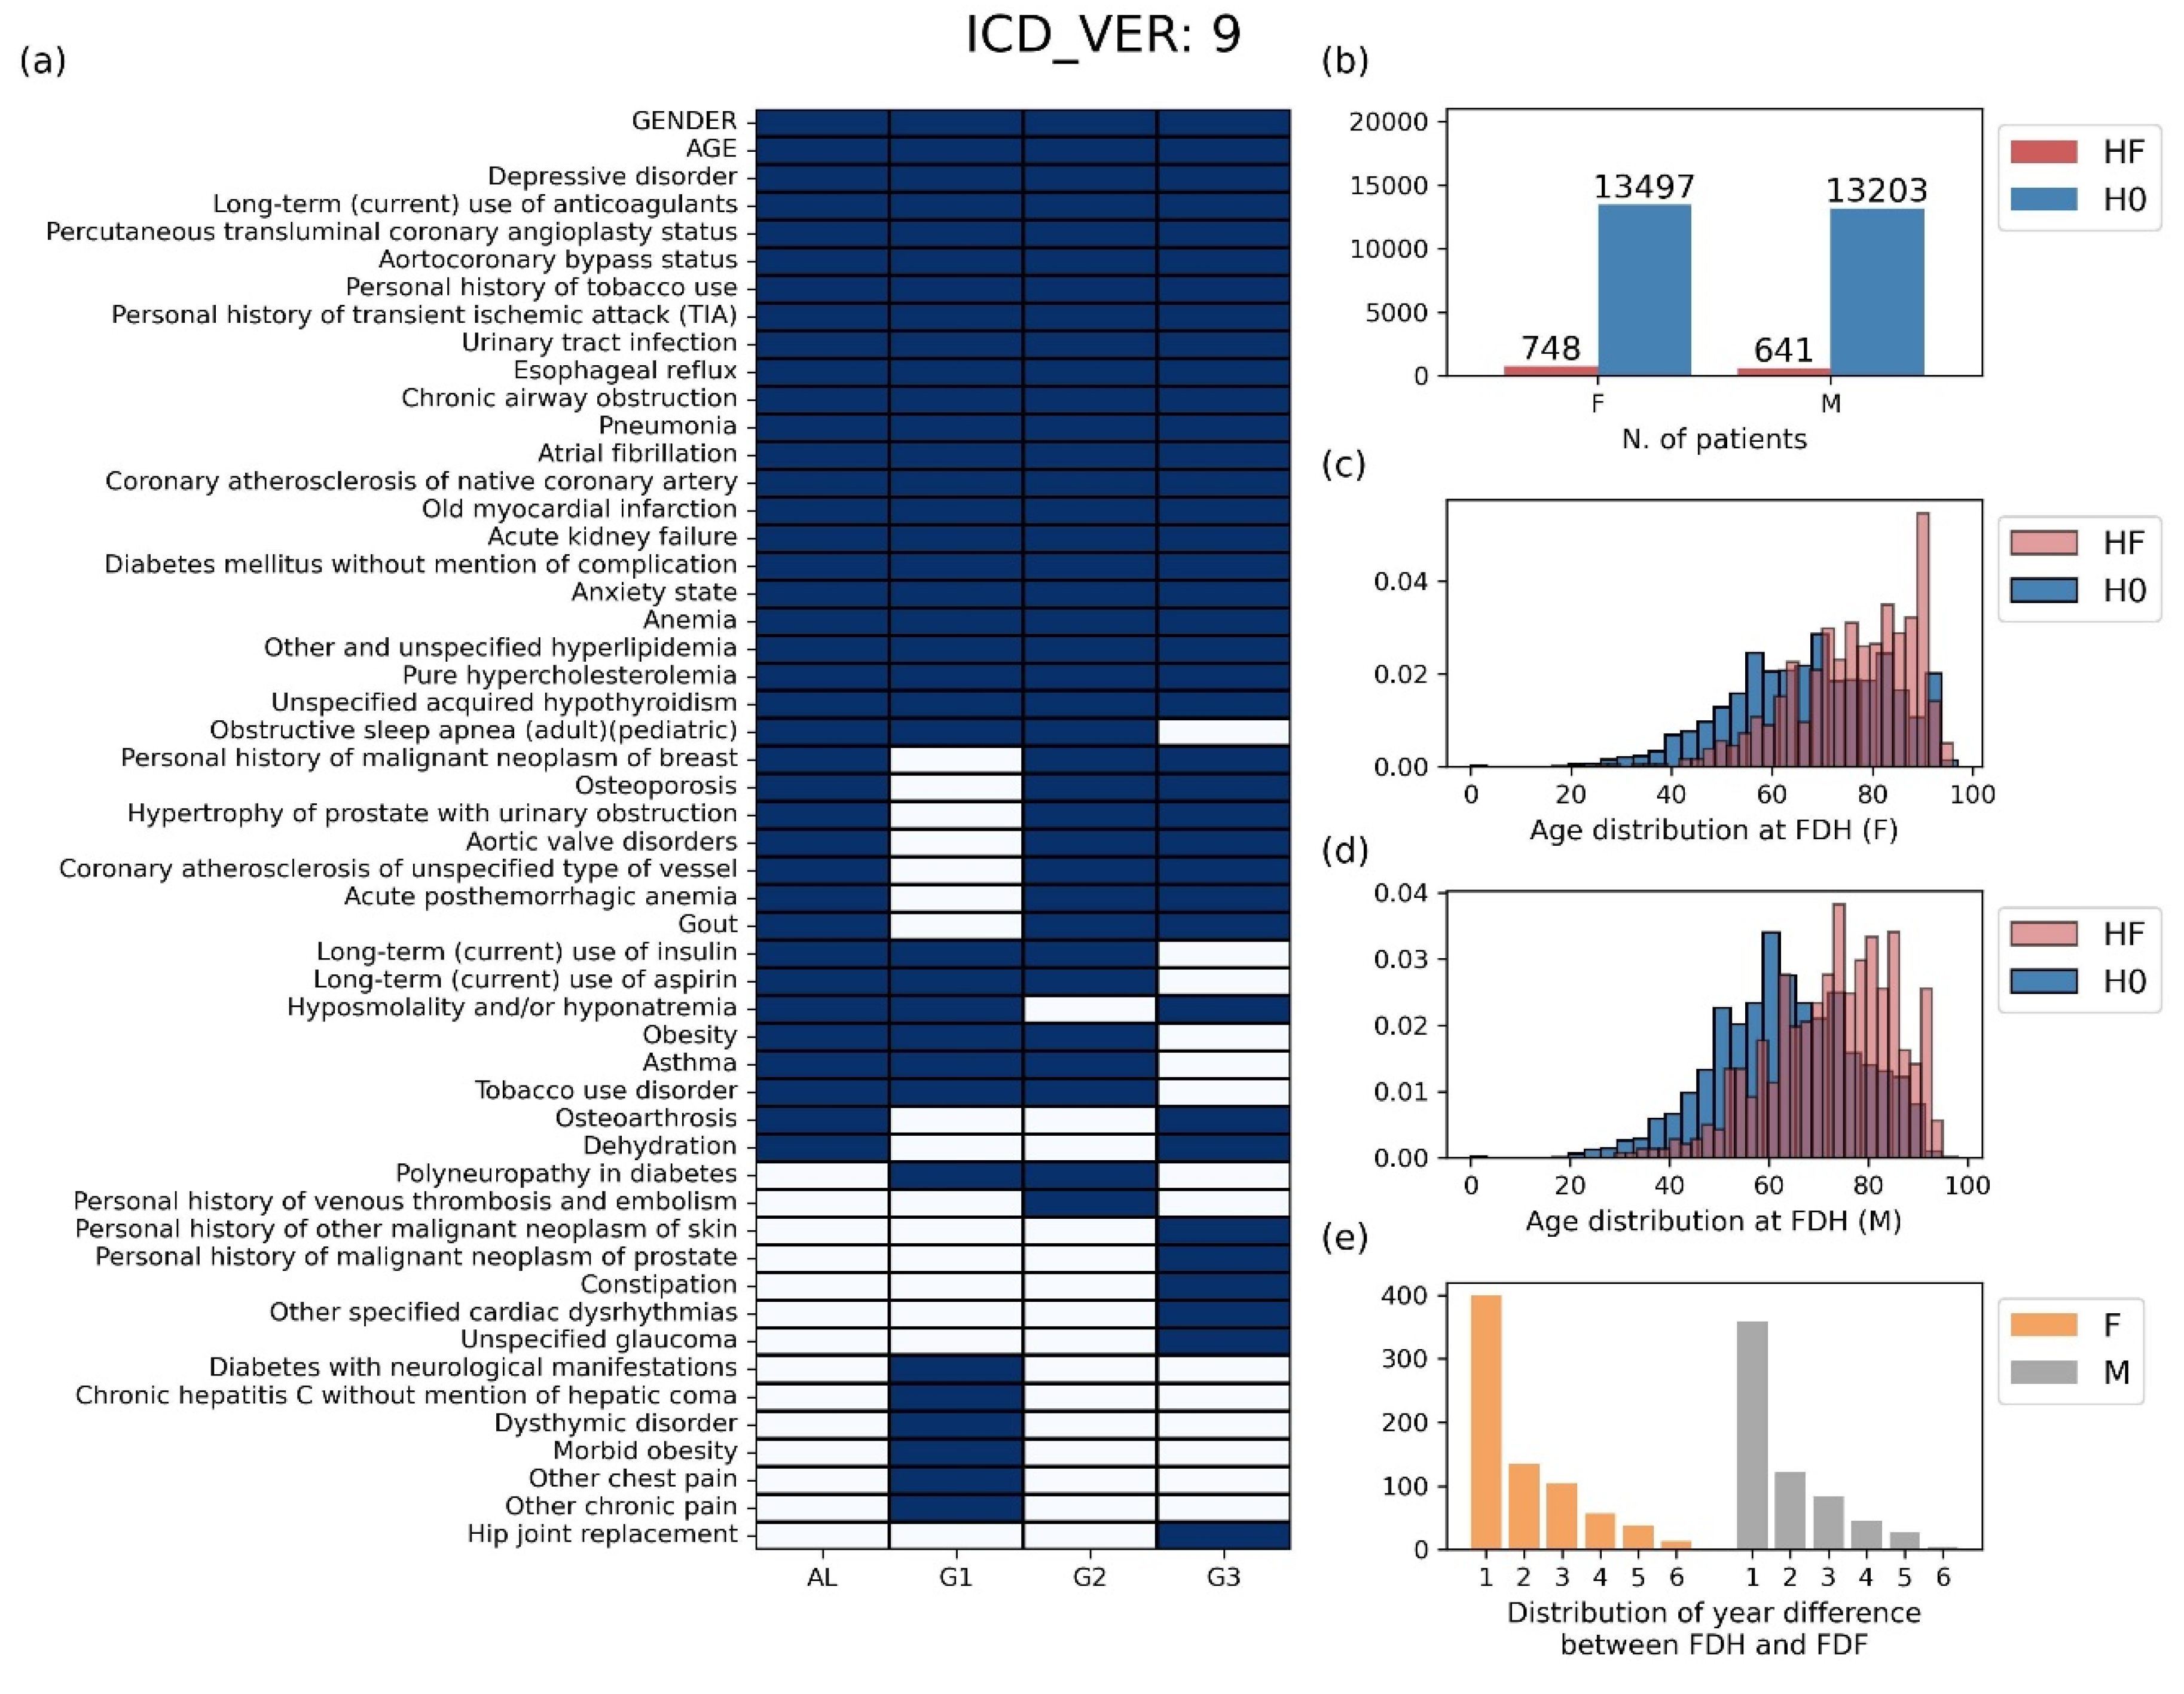
Figure S1 for ICD10. In the ICD9 case, the number of features selected in at least one group was 52, and the number of features selected in all four groups was 22 (
Figure 3a). The selected ICD codes and their full names are displayed in
Table S2. Patients belonging to class HF account for 5.25% in the female group, 4.63% in the male group (
Figure 3b). In both genders, the FDH distribution of class HF was more skewed to the right compared to that of class H0, indicating that the older the age of FDH presentation, the more likely patients are to develop heart failure later in life (
Figure 3c,d). We also found that the first diagnosis of heart failure (FDF) most frequently occurred within one year after FDH (
Figure 3e). The same kind of information corresponding to ICD10 is provided in
Figure S1 and
Table S3.
Figure 3.
Basic statistics of the preprocessing data for patients using the ICD 9 system. (a) The selected features of each group for the analysis process. (b) The number of patients by gender. (c-d) The distribution of ages at the first diagnosis of hypertension (FDH) for (c) male patients and (d) female patients. (e) The distribution of year difference between FDH and FDF. HF: group of patients diagnosed with heart failure after hypertension, H0: group of patients without heart failure after hypertension, FDH: age at the first diagnosis of hypertension, FDF: age at the first diagnosis of heart failure.
2.3. Analytical Methods
2.3.1. Chi-Square Test
Two kinds of analysis methods were used in this study: the chi-square test and XGBoost modeling. Chi-squared is a statistical test used to assess the association between categorical variables. It compares the observed distribution of data with the expected distribution, assuming that there is no significant relationship between the variables. Chi-squared tests are commonly employed in various fields, including biology and medical science, to examine the dependence of categorical variables [
16]. When using the chi2_contingency function in the Python
scipy package (
https://docs.scipy.org/doc/scipy/reference/generated/scipy.stats.chi2_contingency.html), the chi-square test is applied between the class features, consisting of HF and H0, and each of the selected medical histories.
2.3.2. XGBoost Modeling
XGBoost, or eXtreme Gradient Boosting, is an ensemble learning method that combines multiple decision trees to create a robust and accurate predictive model. It is a powerful and versatile machine learning algorithm that has gained widespread popularity for its exceptional performance across various predictive modeling tasks [
17]. In particular, XGBoost modeling has been used widely in recent biomedical research. For example, several cancer marker genes were identified based on XGBoost models trained with gene expression profiles [
18,
19], and it was also used to characterize risk factors of several medical problems [
20,
21].
In this study, XGBoost models that classified the class feature consisting of HF and H0 were trained based on gender, age, and the medical history selected in each group, implemented using the Python xgboost package with default parameters (
https://xgboost.readthedocs.io/en/stable/python/). For each of the four groups, the XGBoost models were generated 1,000 times with randomly sampled balanced datasets. In more detail, to build a single XGBoost model, a merged dataset was prepared by concatenating all patients in class HF and a portion of patients in class H0 that were randomly sampled as many as the patients in class HF. Then, 80% of the merged data were used for training, and the remained data were used for testing.
In this study, two types of outputs were extracted from the trained XGBoost models, i.e., area under the ROC curve (AUC) and feature importance (FI). AUC is one of the most frequently used performance metrics in machine learning modeling, and has a higher value when a model predicts test samples more accurately. FI was assigned to each feature during the model training process, which indicates the extent of performance reduction when a certain feature is perturbed. A feature exhibiting a high FI suggests its critical role in class discrimination [
19]. To determine significant predictive factors by FI, we computed empirical p-values for FIs because there is not a conventional cutoff for determining significance. To this end, we constructed a background distribution of FIs and decided to use 0.0251 as the significance cutoff, with an empirical p-value of 0.01.
3. Results
3.1. Chi-Squared Test
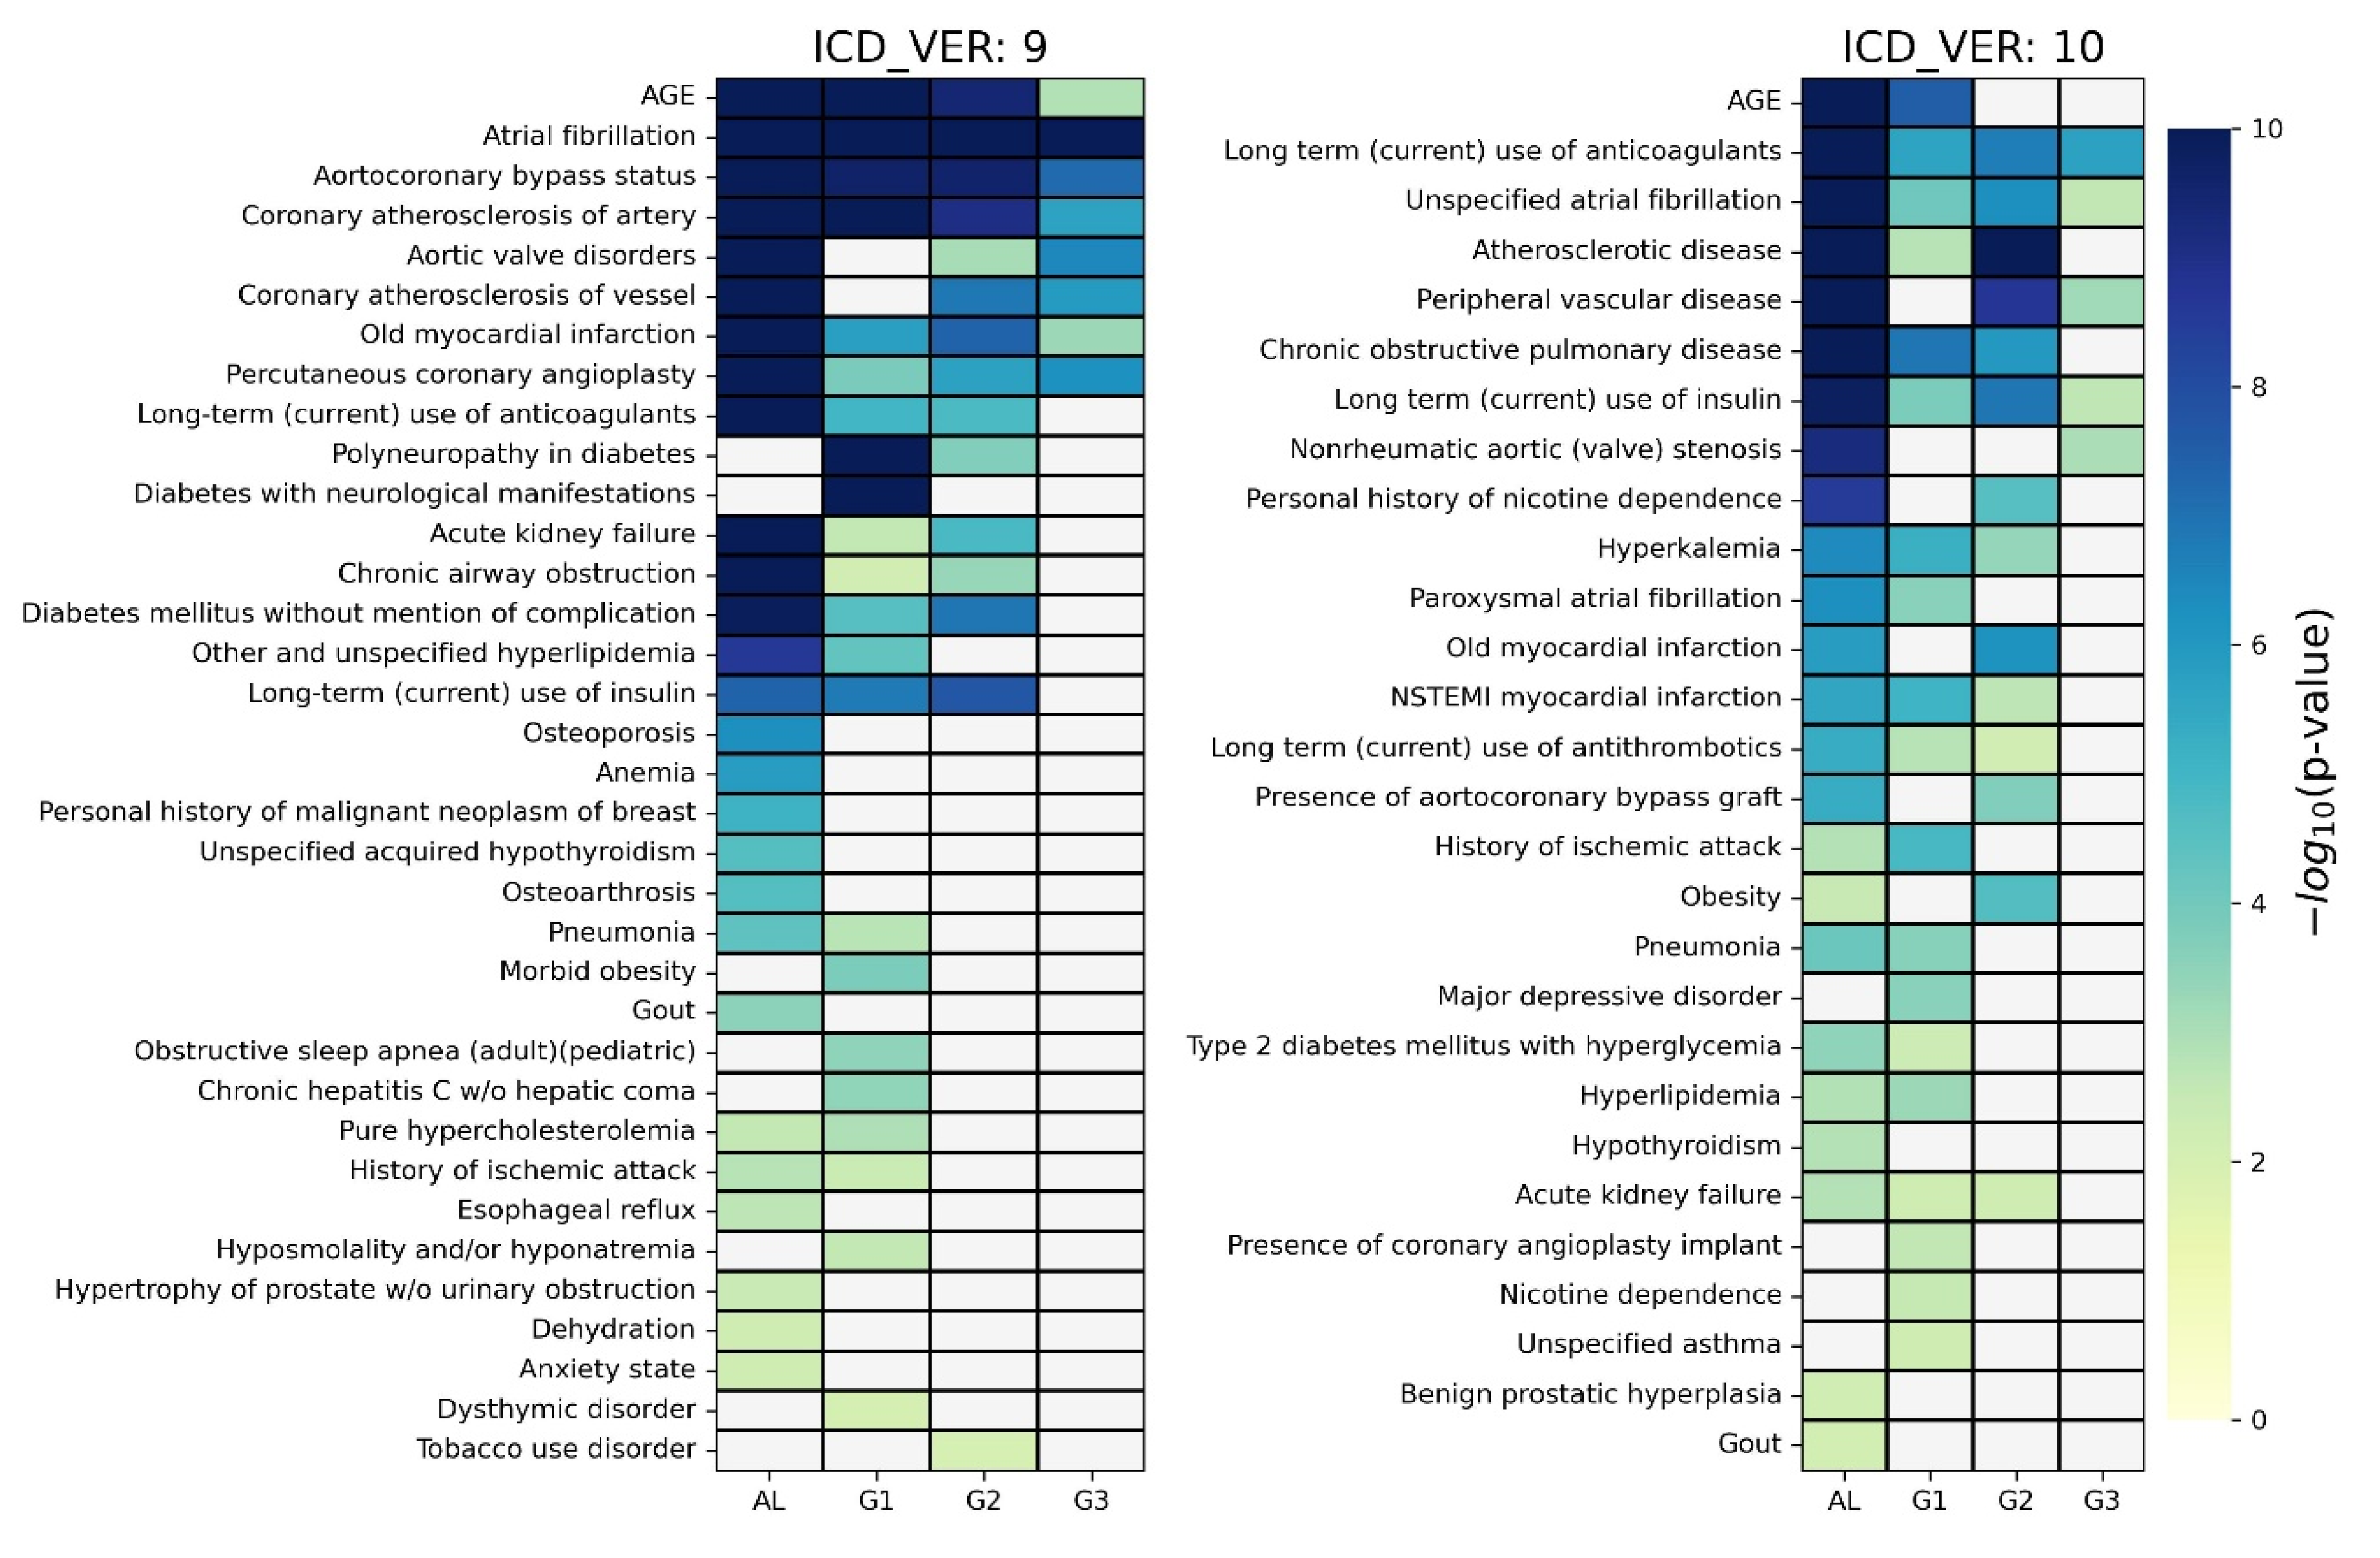
For each of the four groups, a chi-square test was applied between the class feature and each piece of medical history information considered in the corresponding group. The significant predictive factors (p-value < 0.01) are depicted in a heatmap for each ICD system in
Figure 4, where non-significant factors have been grayed out. As shown on the
left side of Figure 4, for the case of ICD9, 35 predictive factors were identified as significant in at least one group, and 6 predictive factors were identified in all four groups (i.e., age, atrial fibrillation, aortocoronary bypass status, coronary atherosclerosis of artery, old myocardial infarction, and percutaneous coronary angioplasty). A total of 27, 22, 15, and 8 predictive factors were determined in AL, G1, G2, and G3 groups, respectively. We noticed that there were several group-specific predictive factors in each group, e.g., anemia for AL, obstructive sleep apnea for G1, and tobacco use disorder for G2. Detailed results are shown in
Table S4.
As shown on the
right side of Figure 4, for the case of ICD10, 28 predictive factors were identified as significant in at least one group. In addition, three predictive factors were identified in all four groups (i.e., long-term use of anticoagulants, unspecified atrial fibrillation, and long-term use of insulin). Overall, 24, 19, 14, and 5 predictive factors were determined in AL, G1, G2, and G3 groups, respectively. We also noticed that there were several group-specific predictive factors in each group, e.g., hypothyroidism for AL and major depressive disorder for G1. Detailed results are presented in
Table S5.
3.2. XGBoost Modeling
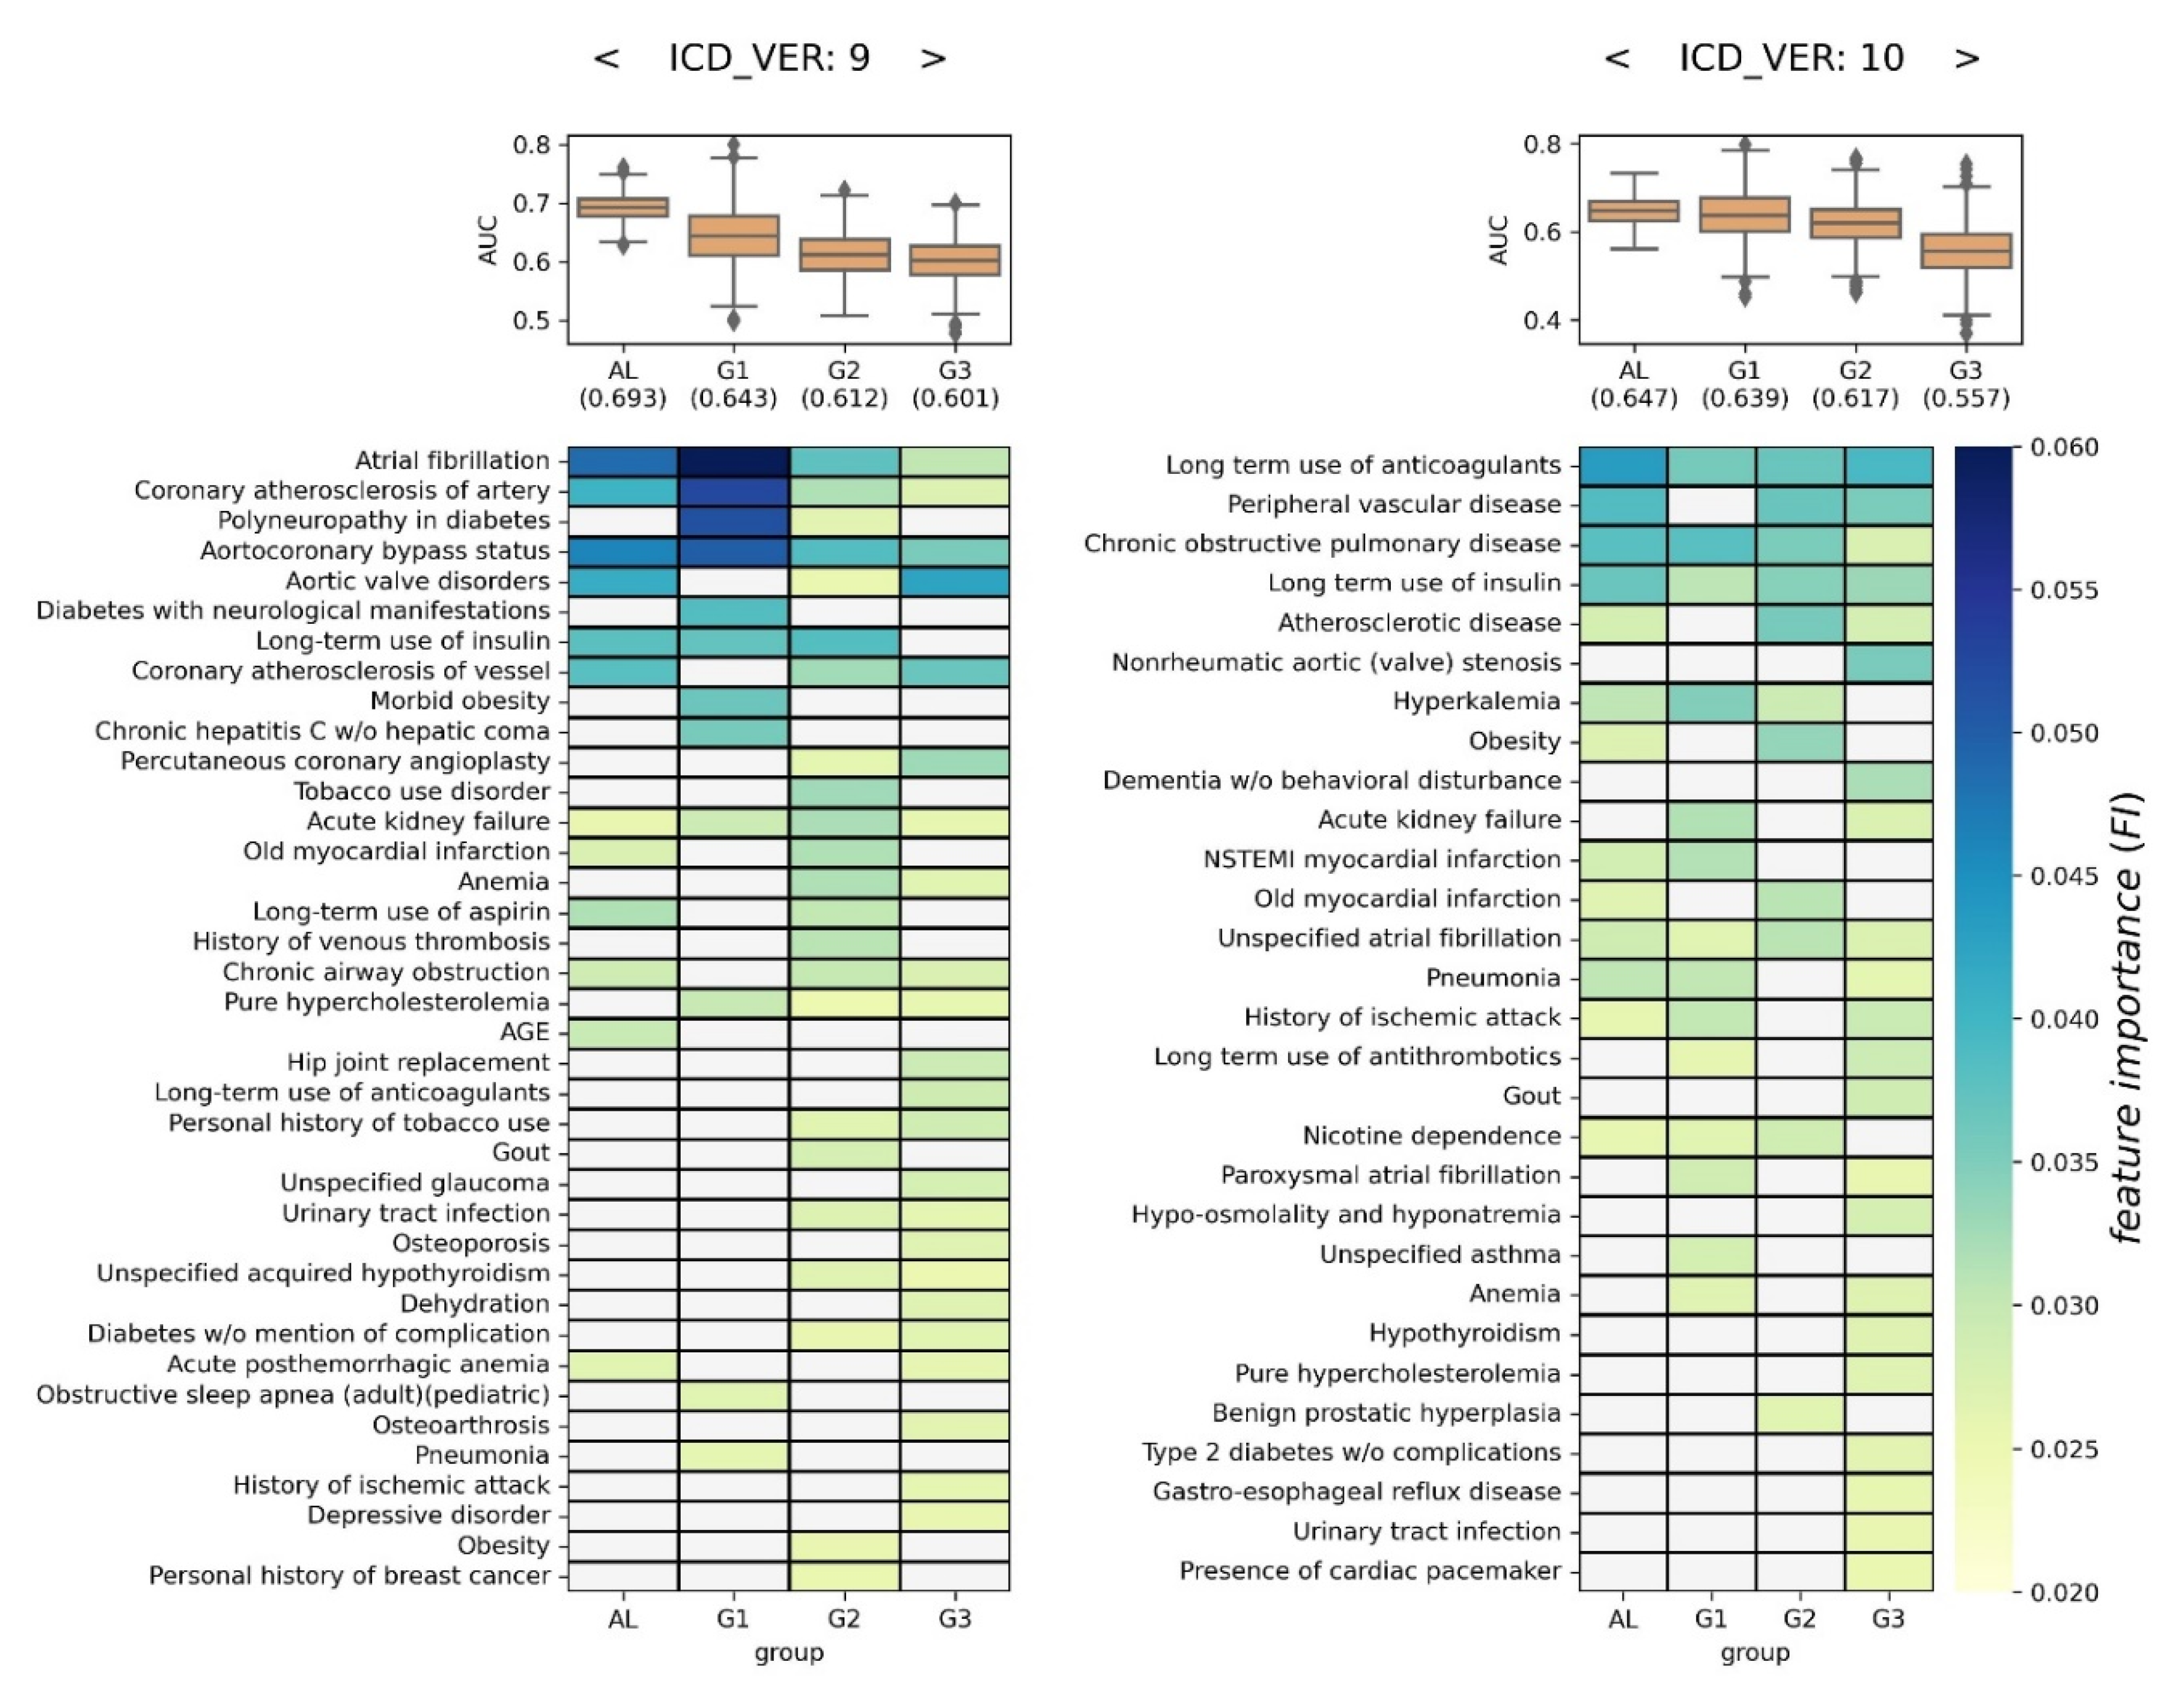
For each of the four groups, 1,000 XGBoost models were generated. Then, their AUCs and FIs were depicted as boxplots and heatmaps, respectively (
Figure 5). Each cell in the heatmap represents the averaged FI (Ave.FI) of the 1,000 XGBoost models, and Ave.FI is colored based on the color bar if significant (>0.0251); otherwise, it is grayed out (refer to
Section 2.3.2 for more details).
In the case of ICD9, the average of 1,000 AUC was highest in the AL group at 0.693, and lowest in the G3 group at 0.601. From a volatility perspective, the models in the AL group were the most stable, and those in the G1 group were associated with the largest variation. Using FI, 38 predictive factors were identified as significant in at least one group, and 4 predictive factors were identified in all four groups (i.e., atrial fibrillation, coronary atherosclerosis of artery, aortocoronary bypass status, and acute kidney failure). Overall, 12, 12, 23, and 23 predictive factors were determined in AL, G1, G2, and G3 groups, respectively. We noticed that there were several group-specific predictive factors in each group, e.g., age for AL, obesity for G1, gout for G2, and long-term use of anticoagulants for G3 (
left side of Figure 5).
In the case of ICD10, the average of 1,000 AUC was highest in the AL group, at 0.647, and lowest in the G3 group at 0.557. From a volatility perspective, the models in the AL group were the most stable, and those in the G1 and G3 groups were associated with the largest variation. Using FI, 25 predictive factors were identified as significant in at least one group, and 4 predictive factors were identified in all four groups (i.e., long-term use of anticoagulants, chronic obstructive pulmonary disease, long-term use of insulin, and unspecified atrial fibrillation). Overall, 13, 14, 11, and 22 predictive factors were determined in AL, G1, G2, and G3 groups, respectively. We noticed that there were several group-specific predictive factors in each group, e.g., asthma for G1, benign prostatic hyperplasia for G2, and dementia without behavioral disturbance for G3 (
right side of Figure 5).
3.3. Overall Predictive Factor Characterization
For each analytical method, predictive factors consistently characterized across both ICD systems were determined as overall predictive factors. This approach will help to reduce false positives and increase accuracy. Hence, each of the four subgroups possessed two sets of the overall predictive factors derived from chi-squared test and XGBoost modeling. To this end, the ICD9 codes were converted to ICD10 codes with the help of an online conversion program (
https://www.icd10data.com/Convert).
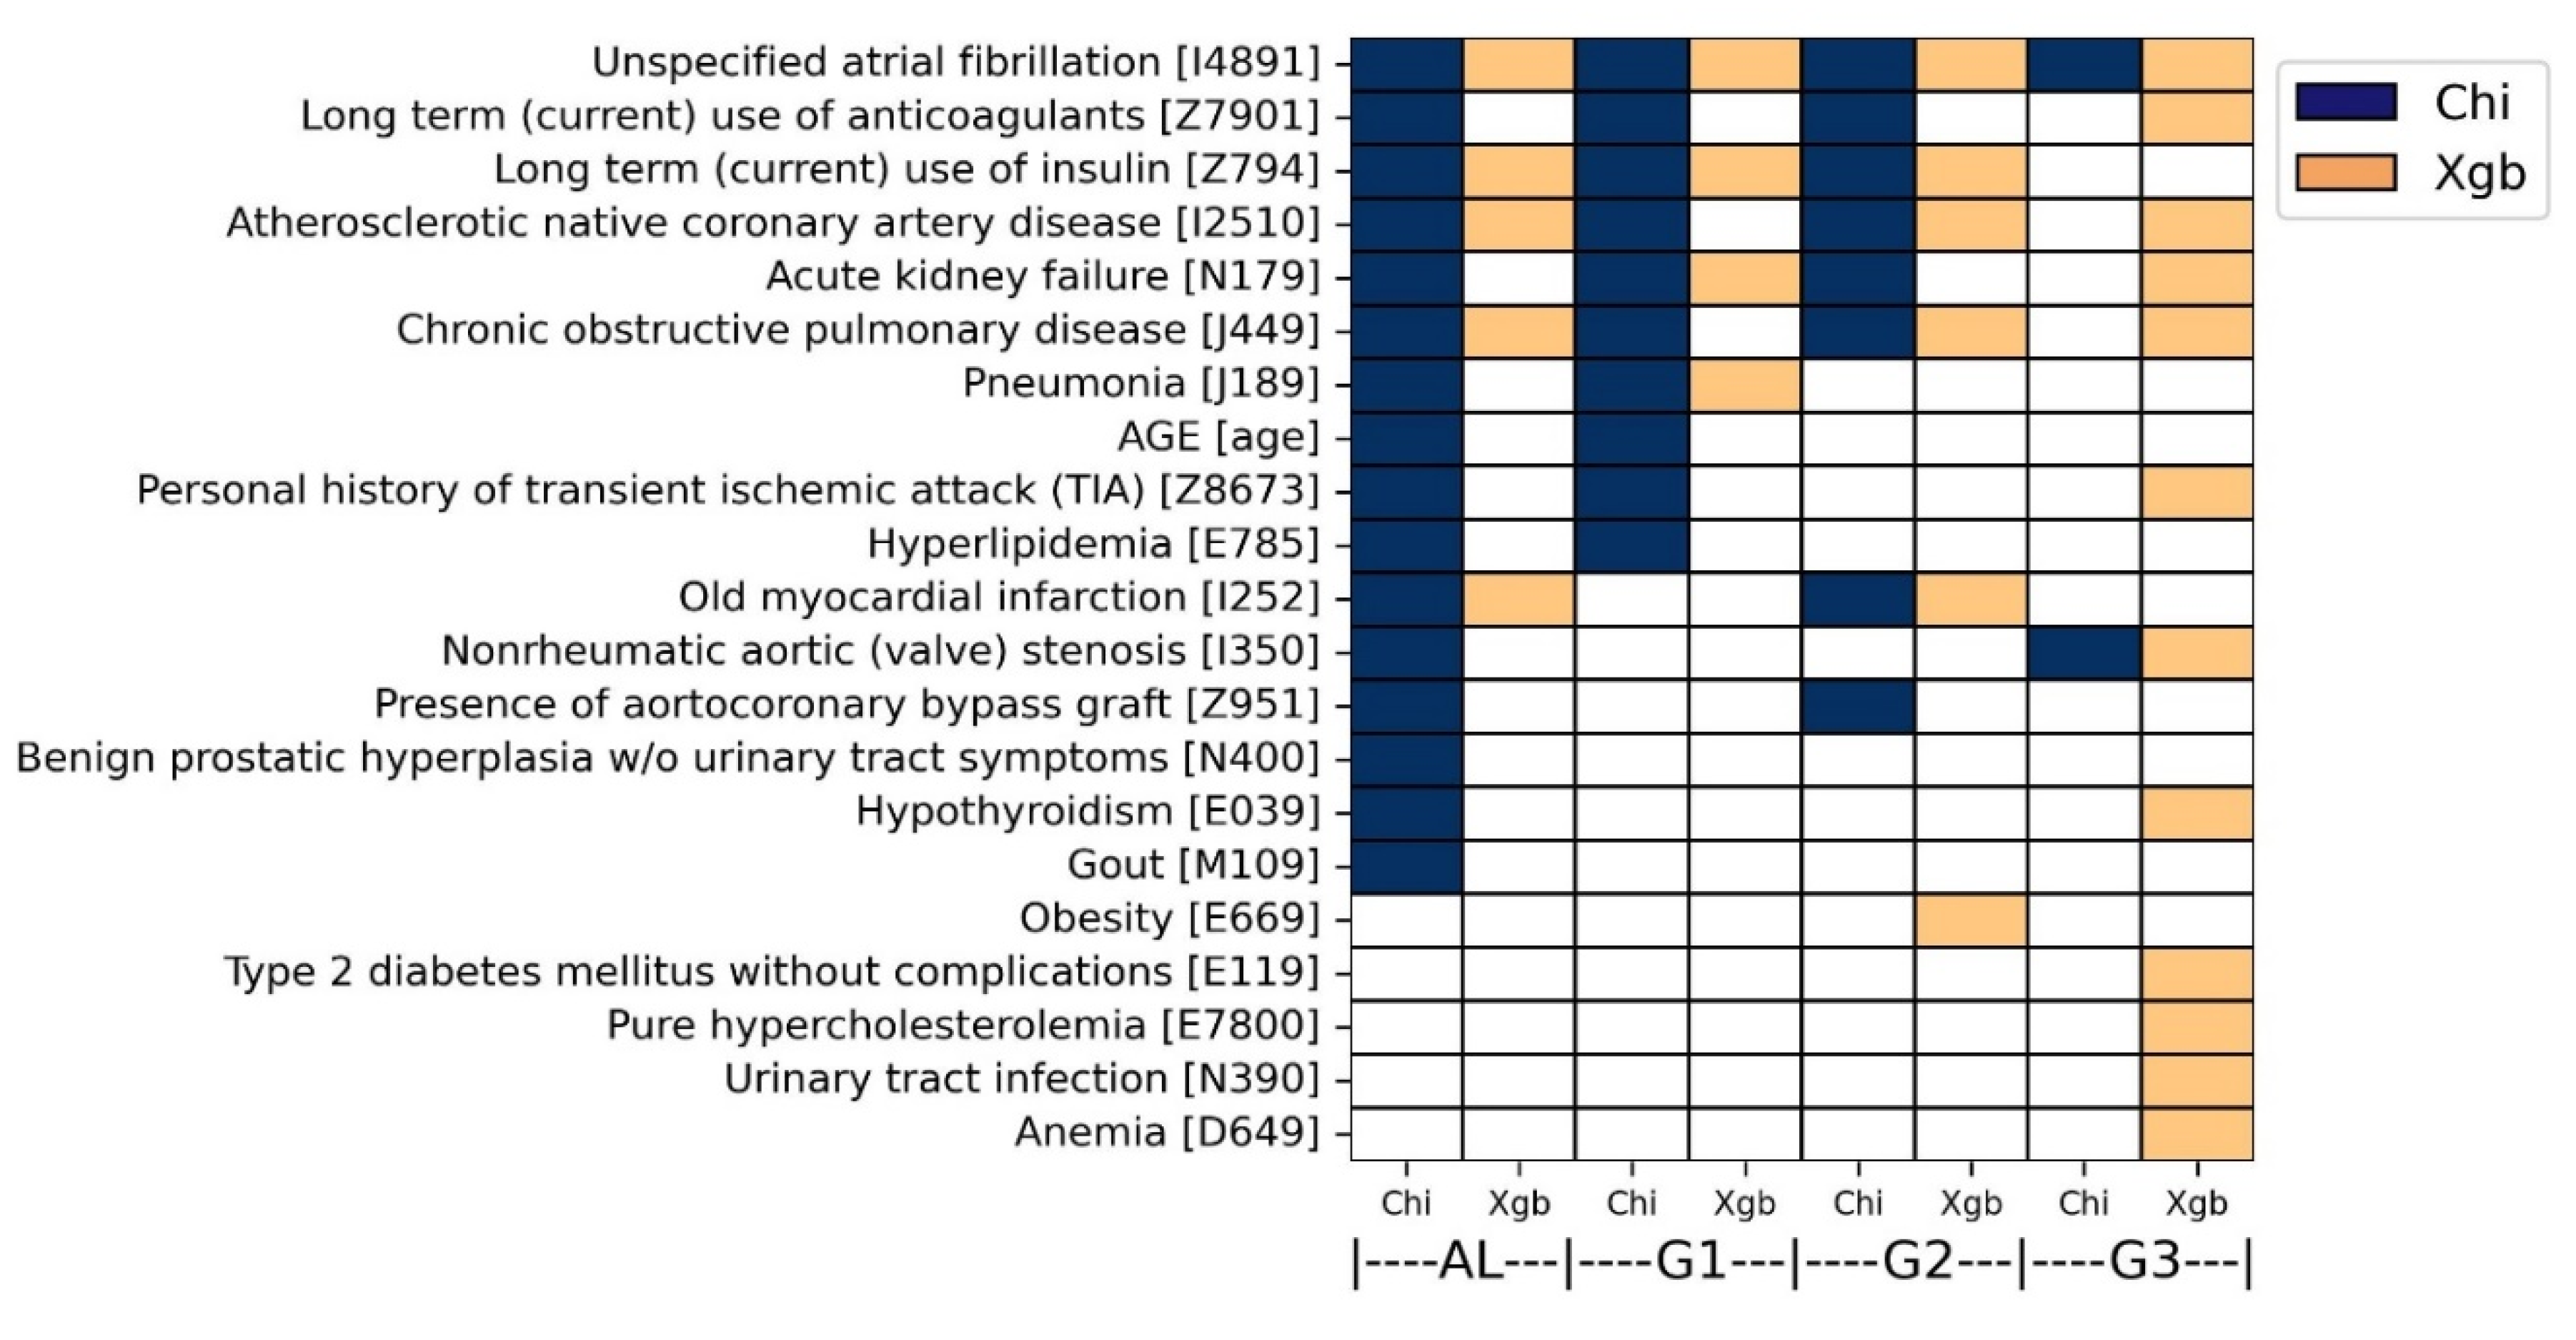
As a result, 21 overall predictive factors were finally characterized by both analyses. More specifically, in the chi-square analysis, 16, 10, 8, and 2 predictive factors were commonly identified in AL, G1, G2, and G3 groups, respectively (colored dark blue in
Figure 6). Atrial fibrillation (ICD10: I4891) was determined by both ICD systems in all four groups. In addition, five diseases were determined by both ICD systems in three groups, including acute kidney failure (ICD10: N179), atherosclerotic native coronary artery disease (ICD10: I2510), long-term use of anticoagulants (ICD10: Z7901), long-term use of insulin (ICD10: Z794), and chronic obstructive pulmonary disease (ICD10: J449).
In the XGBoost analysis, 5, 4, 6, and 12 predictive factors were commonly identified in AL, G1, G2, and G3 groups, respectively (colored orange in
Figure 6). Atrial fibrillation (ICD10: I4891) was determined by both ICD systems in all four groups. In addition, three diseases were determined by both ICD systems in three groups: chronic obstructive pulmonary disease (ICD10: J449), atherosclerotic native coronary artery disease (ICD10: I2510), and long-term use of insulin (ICD10: Z794). The overall predictive factors were also described in
Table S8.
4. Evaluation
The overall predictive factors were assessed by exploring the literature evidence. Firstly, atrial fibrillation, selected from all four groups, is known to be one of the diseases that promotes the formation of blood clots in the atria [
22], which is a well-known factor that contributes to HF by impairing blood flow [
23]. The use of anticoagulants is part of the treatment to reduce blood clots, rather than a cause of HF. Transient ischemic attack can also occur due to blood clot formation, similar to HF, rather than being a predictive factor for heart failure [
24].
Similar to blood clots, elevated levels of lipids or glucose in the bloodstream can cause arteries to narrow and harden, impairing blood flow to the heart muscles [
25]. Among the overall predictive factors associated with this phenomenon are hyperlipidemia, hypercholesterolemia, diabetes, and the use of insulin.
Several medical conditions related to weakened heart function have been identified as predictive factors, including coronary artery disease (CAD), coronary bypass graft surgery, and aortic valve stenosis. Coronary arteries are blood vessels that supply oxygen and nutrients to the heart muscles, and CAD is a disease that causes a narrowing of the coronary arteries. Thus, CAD can weaken the heart muscles, which may lead to HF [
26]. One of the ways of treating blocked or narrowed arteries is to bypass the blockage using a piece of healthy blood vessel from somewhere else in the body, which is called coronary artery bypass graft surgery [
27]. In addition, aortic value stenosis is a disease in which the opening of the aortic valve narrows, restricting blood flow from the left ventricle to the aorta. It causes the heart’s left ventricle to pump harder to push blood through the narrowed aortic valve, which may lead to HF if not treated properly [
28].
We also found evidence in the literature claiming that kidney failure causes HF. Dhingra’s group revealed that kidney disease puts men at a higher risk of developing HF, even without diabetes or high blood pressure [
29]. Hyperuricemia (although not included in the list of the overall predictive factors) is one of the links between kidney failure and HF. Reduced uric acid excretion due to kidney disease can lead to hyperuricemia, which is an elevated level of uric acid in the blood [
30]. Subsequently, elevated uric acid levels are known to be one of the risk factors for HF [
31,
32]. Gout, identified as one of the overall predictive factors, also represents a prominent symptom associated with elevated levels of uric acid [
33].
Evidence in the literature for other risk factors such as pneumonia and anemia was also available. Regarding the relationship between pneumonia and HF, Eurich et al.’s group showed that pneumonia significantly increases the risk of HF across a range of ages and severity of cases, which is the same consequence as that found in this study [
34]. We also found research papers reporting the relationship between anemia and HF. It is known that anemia is one of the common comorbidities that often coexists in patients with heart failure, and is associated with poor clinical outcomes. Despite many studies on the relationship between HF and anemia, it is not entirely clear whether anemia is merely an indicator of HF severity or a mediator of HF progression [
35,
36]. The results of this study allow us to consider the possibility that anemia acts as one of the causes of HF.
5. Discussion and Conclusions
The objective of this study was to identify medical histories that could predict the progression of heart failure in patients with hypertension. However, upon analysis, it was observed that many direct predictive factors for heart failure, independent of hypertension, were prominently identified, such as coronary artery disease, kidney failure, hyperlipidemia, and atrial fibrillation. Nevertheless, factors with a less direct association with heart failure, such as pneumonia, hyperthyroidism, and anemia, were also extracted, prompting a consideration of whether these factors elevate the risk of developing heart failure due to hypertension.
The basic strategy was to identify items in a medical history that can predict the progression of disease B in the presence of disease A. In this study, for the purpose of ensuring a stable and robust analysis, disease A was defined as hypertension and disease B was selected as heart failure, given its substantial patient population. However, as hypertension and heart failure are extensively studied diseases, the analysis predominantly revealed well-established results. With the acquisition of more medical data, it would be useful to apply the analysis designed here to other diseases that are less well explored and hence more intriguing.
When examining the AUCs of XGBoost models, it can be observed that the overall performance was not strong. One possible reason for the low AUC may be the omission of medical conditions occurring after hypertension, which may potentially be crucial information for the onset of heart failure. Only medical history recorded before hypertension diagnosis was utilized for the purpose of this study, which is to identify predictive factors for the subsequent onset of heart failure in hypertensive patients at the point of hypertension diagnosis. Furthermore, the absence of dietary and lifestyle habit data in the study may have contributed to the lower AUC. It is anticipated that the inclusion of such information, once available, could lead to improved performance.
In this investigation, we uncovered predictive factors of heart failure progression in hypertensive patients, utilizing medical diagnosis data from the MIMIC-IV database. Employing two analytical methodologies, chi-squared tests and XGBoost modeling, we generated age-specific and ICD system-specific predictive factors. Ultimately, our investigation unveiled 21 overall predictive factors. We anticipate that these findings will provide valuable insights for the risk assessment of heart failure in hypertensive patients.
Appendix A. Supplementary data
The following supporting information can be downloaded at the website of this paper posted on Preprints.org. Supplementary Tables 1–8 and Supplementary Figure 1 of this article can be found online xxx.
Author Contributions
Jinmyung Jung: Conceptualization, Supervision, Investigation, Methodology, Writing (original draft), Writing (review and editing), Funding acquisition; Doyoon Kim: Data curation, Resources, Software, Literature search; Inkyung Hwang: Data curation, Visualization, Software, Literature search.
Funding
This work was supported by a National Research Foundation of Korea (NRF) grant funded by the Korean government (MSIT) (NRF-2022R1C1C1008823), and by the research grant of The University of Suwon in 2023.
Code Availability Statement
Declaration of competing interest
The authors declare that they have no known competing financial interests or personal relationships that might affect the research reported in this paper.
References
- Mills, K.T., A. Stefanescu, and J. He, The global epidemiology of hypertension. Nature Reviews Nephrology, 2020. 16(4): p. 223-237.
- Emmons-Bell, S., C. Johnson, and G. Roth, Prevalence, incidence and survival of heart failure: a systematic review. Heart, 2022. 108(17): p. 1351-1360.
- Messerli, F.H., S.F. Rimoldi, and S. Bangalore, The transition from hypertension to heart failure: contemporary update. JACC: Heart Failure, 2017. 5(8): p. 543-551.
- Khatibzadeh, S., et al., Worldwide risk factors for heart failure: a systematic review and pooled analysis. International journal of cardiology, 2013. 168(2): p. 1186-1194.
- Update, A.S., Heart disease and stroke statistics–2017 update. Circulation, 2017. 135: p. e146-603.
- Nkomo, V.T., et al., Burden of valvular heart diseases: a population-based study. The lancet, 2006. 368(9540): p. 1005-1011.
- UKPDS, U., The incidence of congestive heart failure in type 2 diabetes. Diabetes Care, 2004. 27(8): p. 1879-1884.
- Kenchaiah, S., et al., Obesity and the risk of heart failure. New England Journal of Medicine, 2002. 347(5): p. 305-313.
- UK, N.A.-A., et al., 2016 ESC Guidelines for the diagnosis and treatment of acute and chronic heart failure. European Heart Journal, 2016. 37: p. 2129-2200.
- Meng, C., et al., Interpretability and fairness evaluation of deep learning models on MIMIC-IV dataset. Scientific Reports, 2022. 12(1): p. 7166.
- Liu, W., et al., A simple weaning model based on interpretable machine learning algorithm for patients with sepsis: a research of MIMIC-IV and eICU databases. Frontiers in Medicine, 2022. 8: p. 814566.
- Johnson, A., et al., Mimic-iv. PhysioNet. Available online at: https://physionet. org/content/mimiciv/1.0/(accessed August 23, 2021), 2020.
- Johnson, A.E., et al., MIMIC-IV, a freely accessible electronic health record dataset. Scientific data, 2023. 10(1): p. 1.
- Sun, Y., et al., Prediction model of in-hospital mortality in intensive care unit patients with cardiac arrest: a retrospective analysis of MIMIC-IV database based on machine learning. BMC anesthesiology, 2023. 23(1): p. 1-17.
- Pang, K., et al., Establishment of ICU Mortality Risk Prediction Models with Machine Learning Algorithm Using MIMIC-IV Database. Diagnostics, 2022. 12(5): p. 1068.
- !!! INVALID CITATION !!! [7–9].
- Chen, T. and C. Guestrin. Xgboost: A scalable tree boosting system. in Proceedings of the 22nd acm sigkdd international conference on knowledge discovery and data mining. 2016.
- Li, Q., et al., XGBoost-based and tumor-immune characterized gene signature for the prediction of metastatic status in breast cancer. Journal of Translational Medicine, 2022. 20(1): p. 177.
- Jung, J. and S. Yoo, Identification of Breast Cancer Metastasis Markers from Gene Expression Profiles Using Machine Learning Approaches. Genes, 2023. 14(9): p. 1820.
- Liu, Q., et al., Predicting the risk of incident type 2 diabetes mellitus in chinese elderly using machine learning techniques. Journal of Personalized Medicine, 2022. 12(6): p. 905.
- Noh, B., et al., XGBoost based machine learning approach to predict the risk of fall in older adults using gait outcomes. Scientific reports, 2021. 11(1): p. 12183.
- Ames, A. and W.G. Stevenson, Catheter ablation of atrial fibrillation. Circulation, 2006. 113(13): p. e666-e668.
- Goh, F.Q., et al., Cognitive impairment in heart failure—a review. Biology, 2022. 11(2): p. 179.
- Tutwiler, V., et al., Contraction of blood clots is impaired in acute ischemic stroke. Arteriosclerosis, thrombosis, and vascular biology, 2017. 37(2): p. 271-279.
- Velagaleti, R.S., et al., Relations of lipid concentrations to heart failure incidence: the Framingham Heart Study. Circulation, 2009. 120(23): p. 2345-2351.
- Velagaleti, R.S. and R.S. Vasan, Heart failure in the twenty-first century: is it a coronary artery disease or hypertension problem? Cardiology clinics, 2007. 25(4): p. 487-495.
- Abu-Omar, Y. and D.P. Taggart, Coronary artery bypass surgery. Medicine, 2014. 42(9): p. 527-531.
- Lindman, B.R. and J. Lindenfeld, Prevention and mitigation of heart failure in the treatment of calcific aortic stenosis: a unifying therapeutic principle. JAMA cardiology, 2021. 6(9): p. 993-994.
- Dhingra, R., J.M. Gaziano, and L. Djoussé, Chronic kidney disease and the risk of heart failure in men. Circulation: Heart Failure, 2011. 4(2): p. 138-144.
- Johnson, R.J., et al., Uric acid and chronic kidney disease: still more to do. Kidney International Reports, 2023. 8(2): p. 229-239.
- Huang, H., et al., Uric acid and risk of heart failure: a systematic review and meta-analysis. European journal of heart failure, 2014. 16(1): p. 15-24.
- Wei, X., et al., Hyperuricemia: A key contributor to endothelial dysfunction in cardiovascular diseases. The FASEB Journal, 2023. 37(7): p. e23012.
- Kutzing, M.K. and B.L. Firestein, Altered uric acid levels and disease states. Journal of Pharmacology and Experimental Therapeutics, 2008. 324(1): p. 1-7.
- Eurich, D.T., et al., Risk of heart failure after community acquired pneumonia: prospective controlled study with 10 years of follow-up. bmj, 2017. 356.
- Anand, I.S. and P. Gupta, Anemia and iron deficiency in heart failure: current concepts and emerging therapies. Circulation, 2018. 138(1): p. 80-98.
- Grote Beverborg, N., D.J. van Veldhuisen, and P. van der Meer, Anemia in heart failure: still relevant? JACC: Heart Failure, 2018. 6(3): p. 201-208.
|
Disclaimer/Publisher’s Note: The statements, opinions and data contained in all publications are solely those of the individual author(s) and contributor(s) and not of MDPI and/or the editor(s). MDPI and/or the editor(s) disclaim responsibility for any injury to people or property resulting from any ideas, methods, instructions or products referred to in the content. |
© 2024 by the authors. Licensee MDPI, Basel, Switzerland. This article is an open access article distributed under the terms and conditions of the Creative Commons Attribution (CC BY) license (http://creativecommons.org/licenses/by/4.0/).
