Submitted:
26 April 2024
Posted:
28 April 2024
You are already at the latest version
Abstract
Keywords:
1. Introduction
2. Materials and Methods
2.1. Ethical Approval
2.2. Collection, Processing and Transportation of Sample
2.3. Isolation and Purification of E. coli
2.4. MALDI-TOF
2.5. VAGs-Based Detection
2.6. Antibiotic Susceptibility Testing
2.7. Phenotypic Confirmation of Colistin Resistance
2.8. CarbaNPCLSI Test
2.9. Molecular Characterization of ARGs
2.10. O Typing
2.11. Statistical Analysis
3. Results
3.1.1. Distribution of E. coli from Various Food Origin
3.1.2. Distribution of NON-O157 STEC among Various Sample Sources
3.1.3. Distribution of Non-O157 STEC Co-Harboring blaNMD-1-1 & mcr-1 among Various Sample Sources
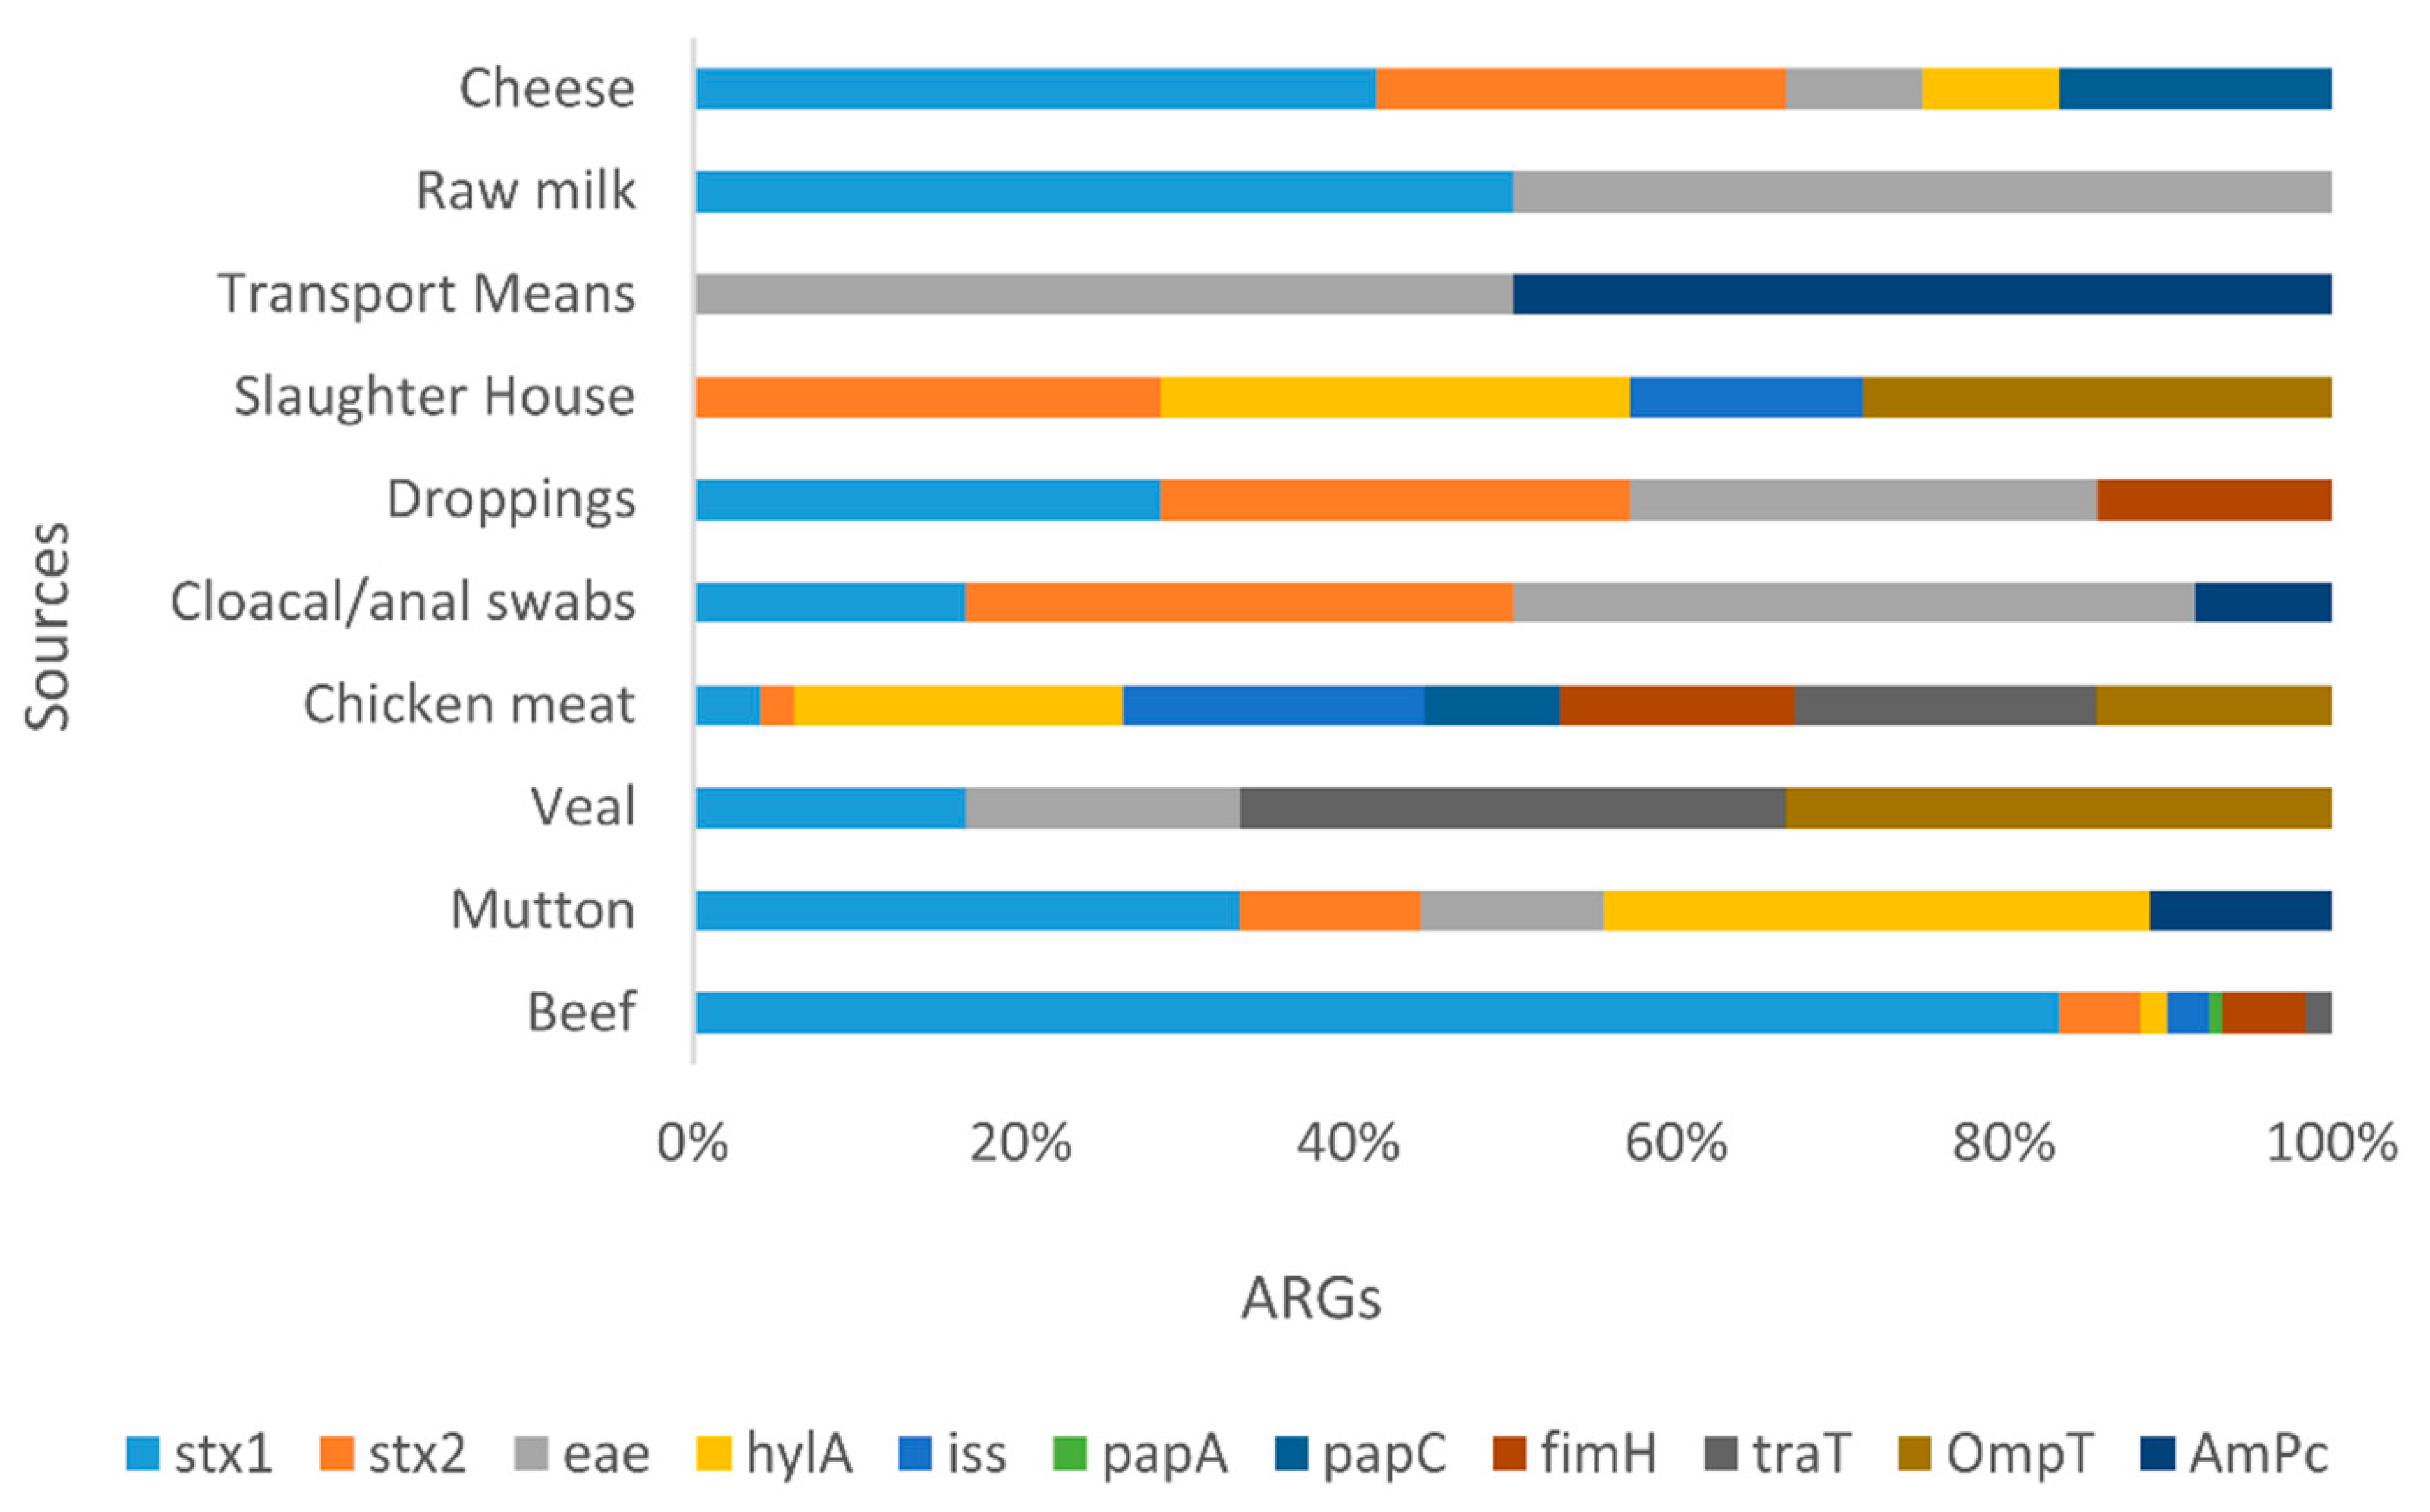
3.1.4. VAGs Detection
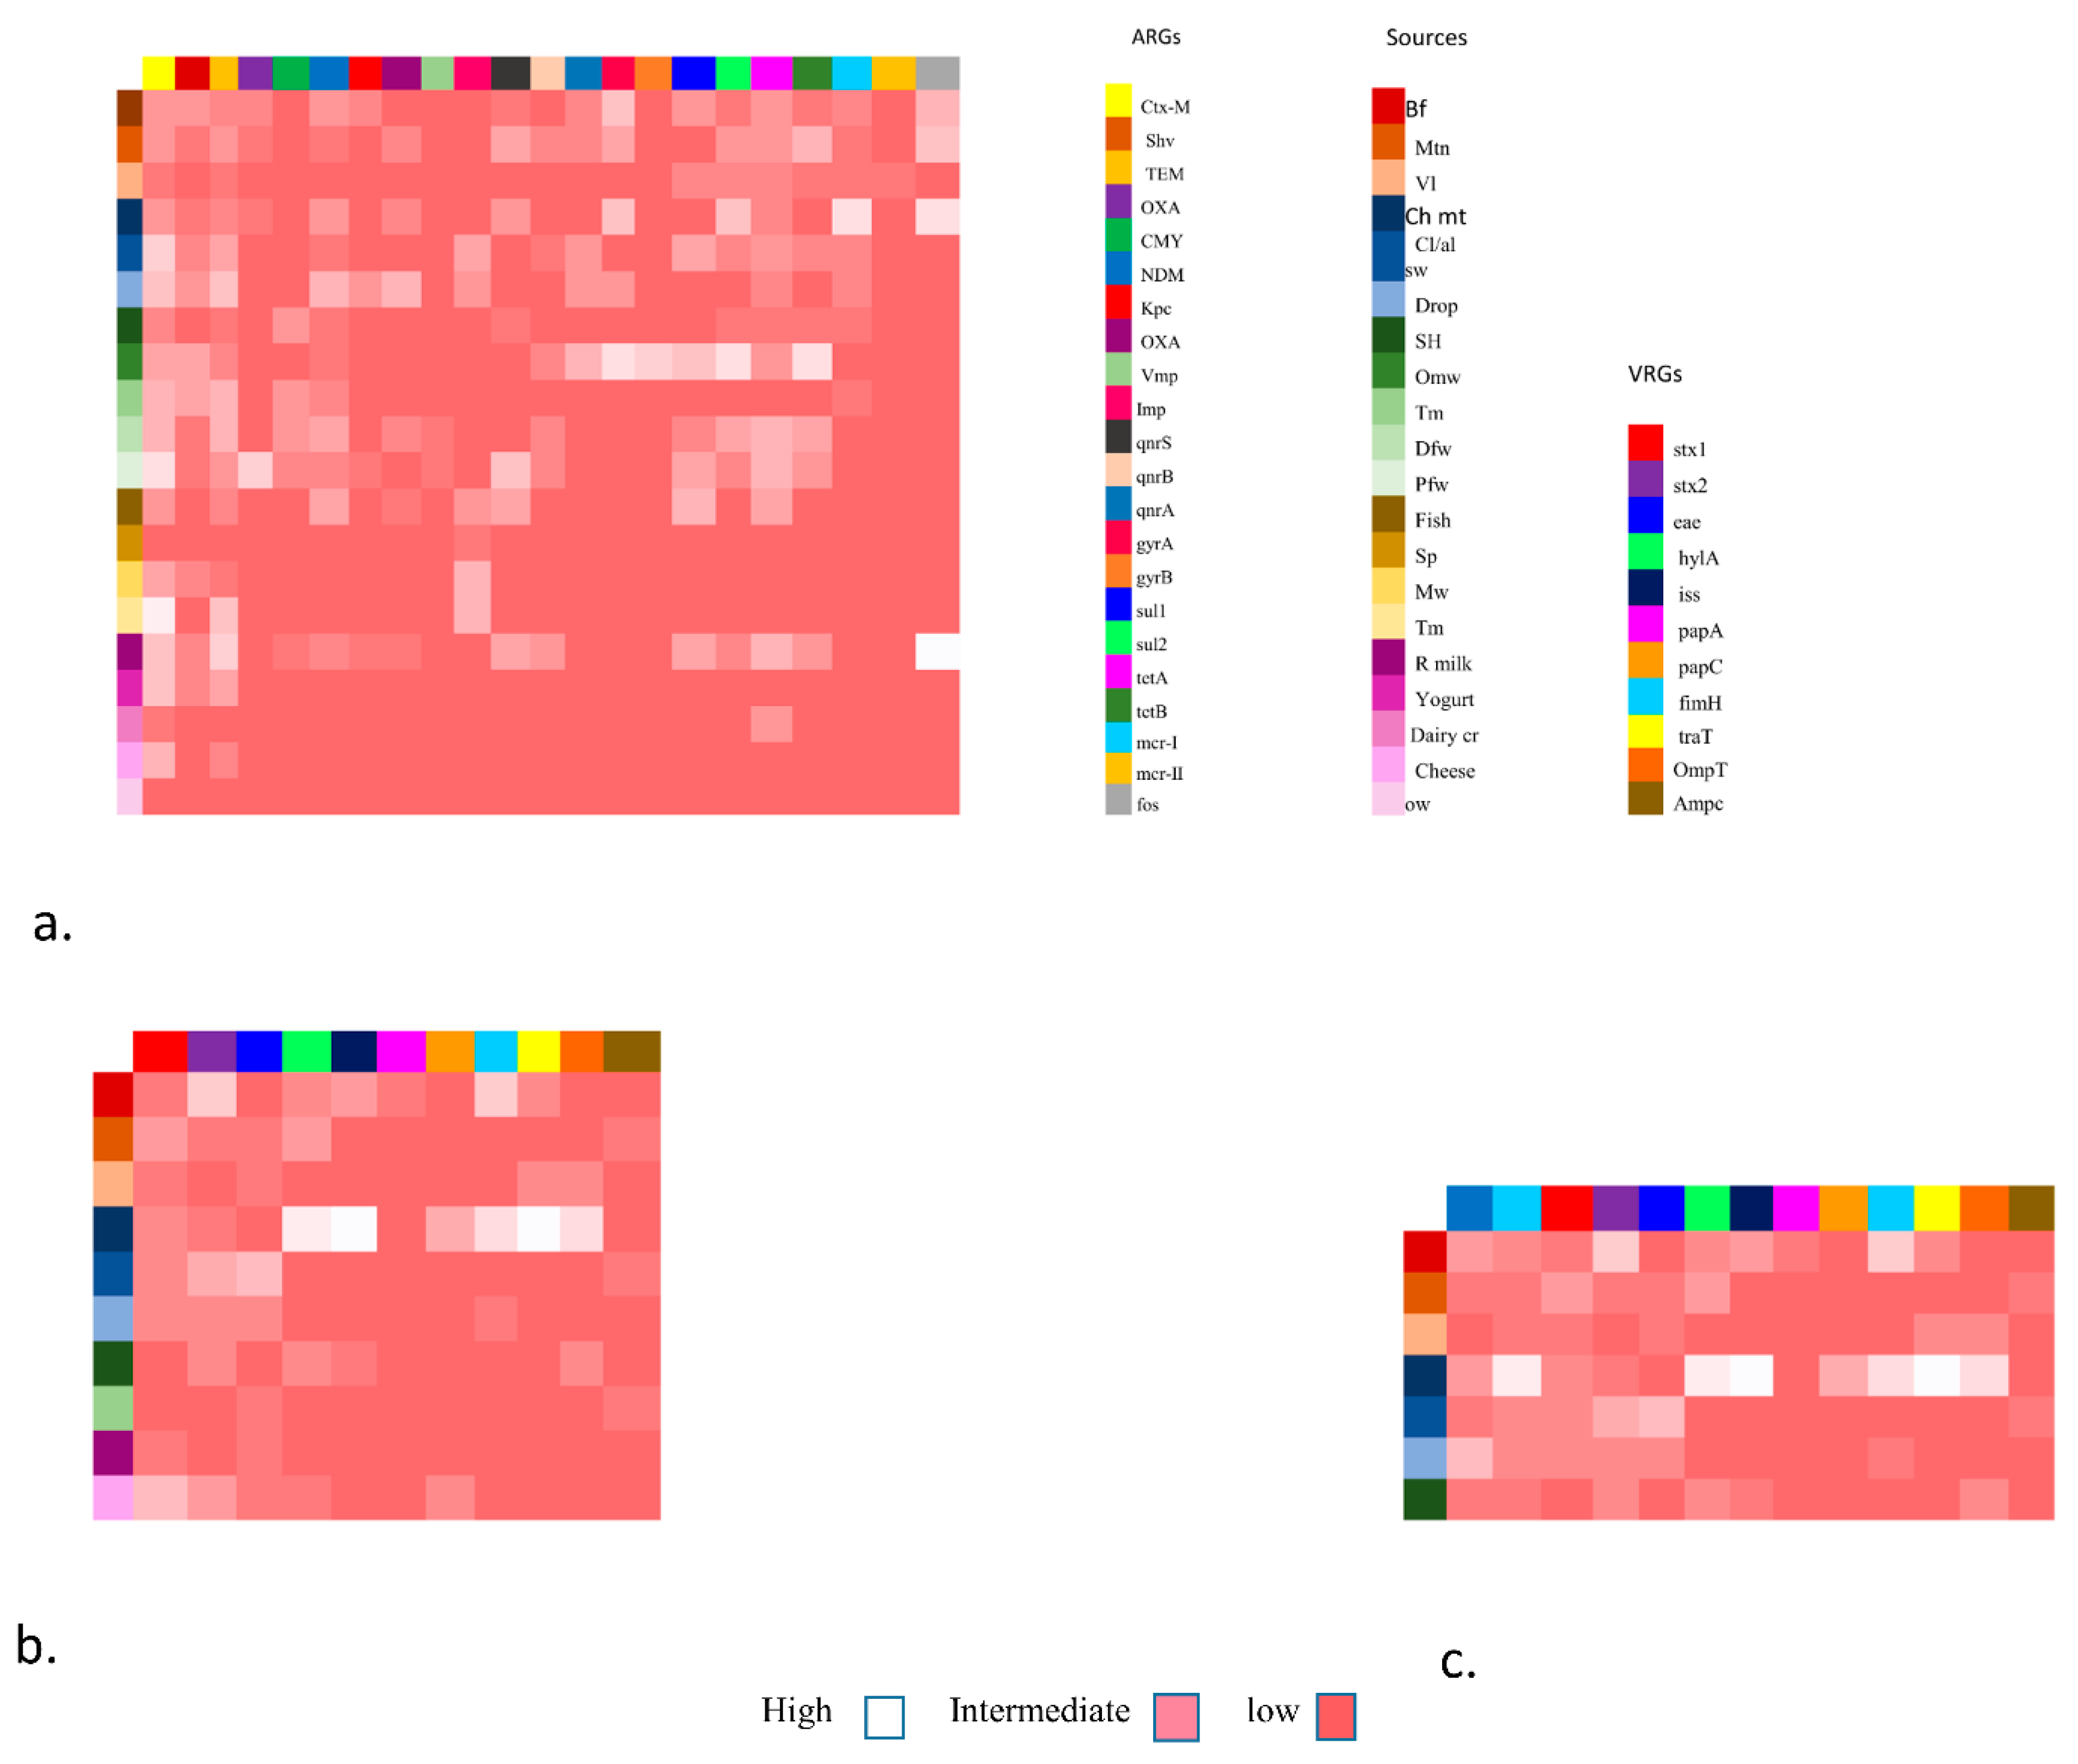
- (a)
- Heat map showing the distribution of five major categories of food specimen from various food origin showing in coloured boxes on the right side, along with Antibiotic resistance genes including ESBLs, MBLs, qnrs, sul, tet, mcr (1,11) and fos showing in colored boxes on right size. These genes were grouped as low, intermediate and high frequency.
- (b)
- Heat map showing the placement of virulence genes associated with Fimbrae, mobility, toxin and iron uptake etc. in E. coli isolates from various food groups mainly livestock (mutton, beef, veal), poultry (chicken meat, cloacal/nasal swabs & dropping), environment (slaughter house & transport means), and from dairy (raw milk & cheese) shown as low, intermediate and high on the right side.
- (c)
- Heat map showing Co-existence of NDM and mcr-1 with VRGs based E. coli detection as in this case VRGs detected mainly from livestock (mutton, beef, veal), poultry (chicken meat, cloacal/nasal swabs & dropping) and one from environmental sample (slaughter house) show high, low and intermediate values along with co-occurrence of ARGs (NDM & mcr-1).
3.1.5. Resistance Profiling of the Isolates
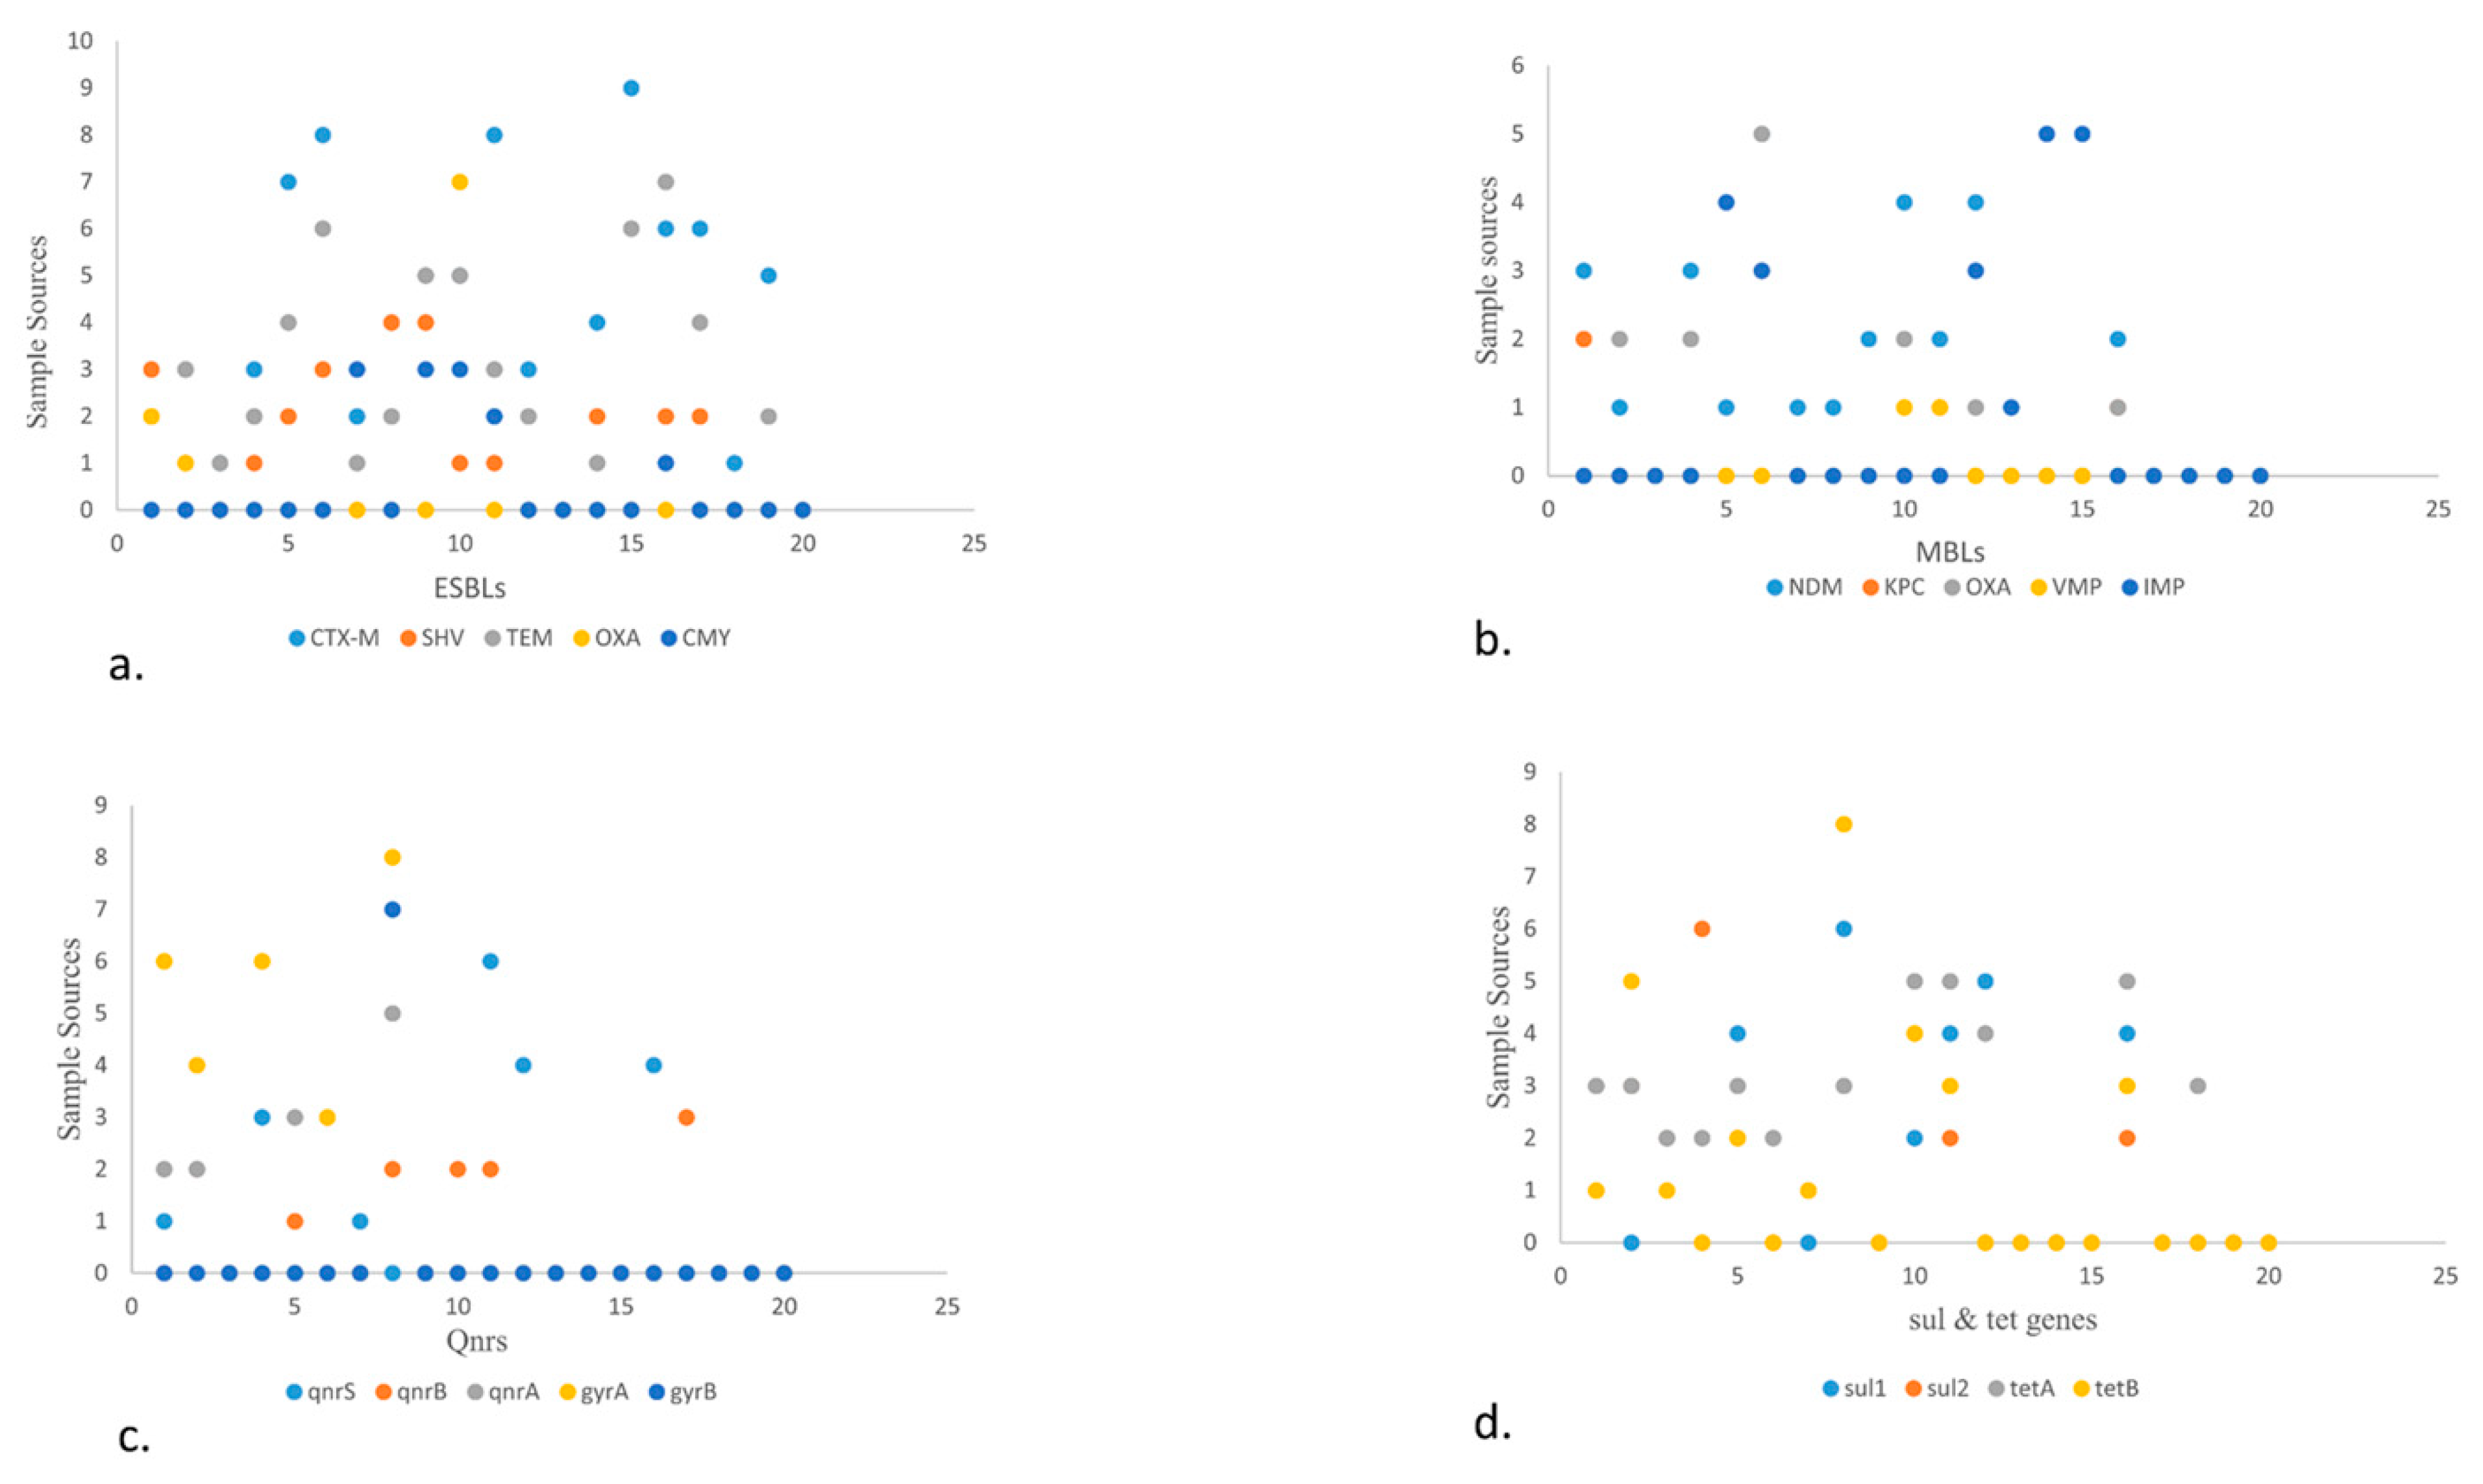
- (a)
- Scatter plot showing the presence of ESBLs genes in various food sources. The high number of blaCTX-M was detected in fisheries via transport means whereas blaSHV is more in beef. Among blaTEM, blaOXA, blaCMY highest prevalence observed in raw milk, poultry waste and slaughter housing sample respectively.
- (b)
- Scatter plot in MBLs showcasing highest prevalence of blaNDM-1 and blaOXA in poultry droppings and lowest in poultry farm waste while blaIMP in fisheries market waste.
- (c)
- Scatter plot describing qnrs, among which qnrS was highest in poultry farm waste followed by qnrA which is more in open market waste. Along with qnrB which is more in raw milk. Between gyrs, gyrA is more prevalent than gyrB and detected more in open market waste.
- (d)
- Scatter plot elaborating sul and tet genes. Here sul1 and sul2 are more prevalent in environmental waste samples while tetA is more in number in dairy waste as compared to tetB that is more in open market waste.
3.1.6. ARGs
4. Discussion
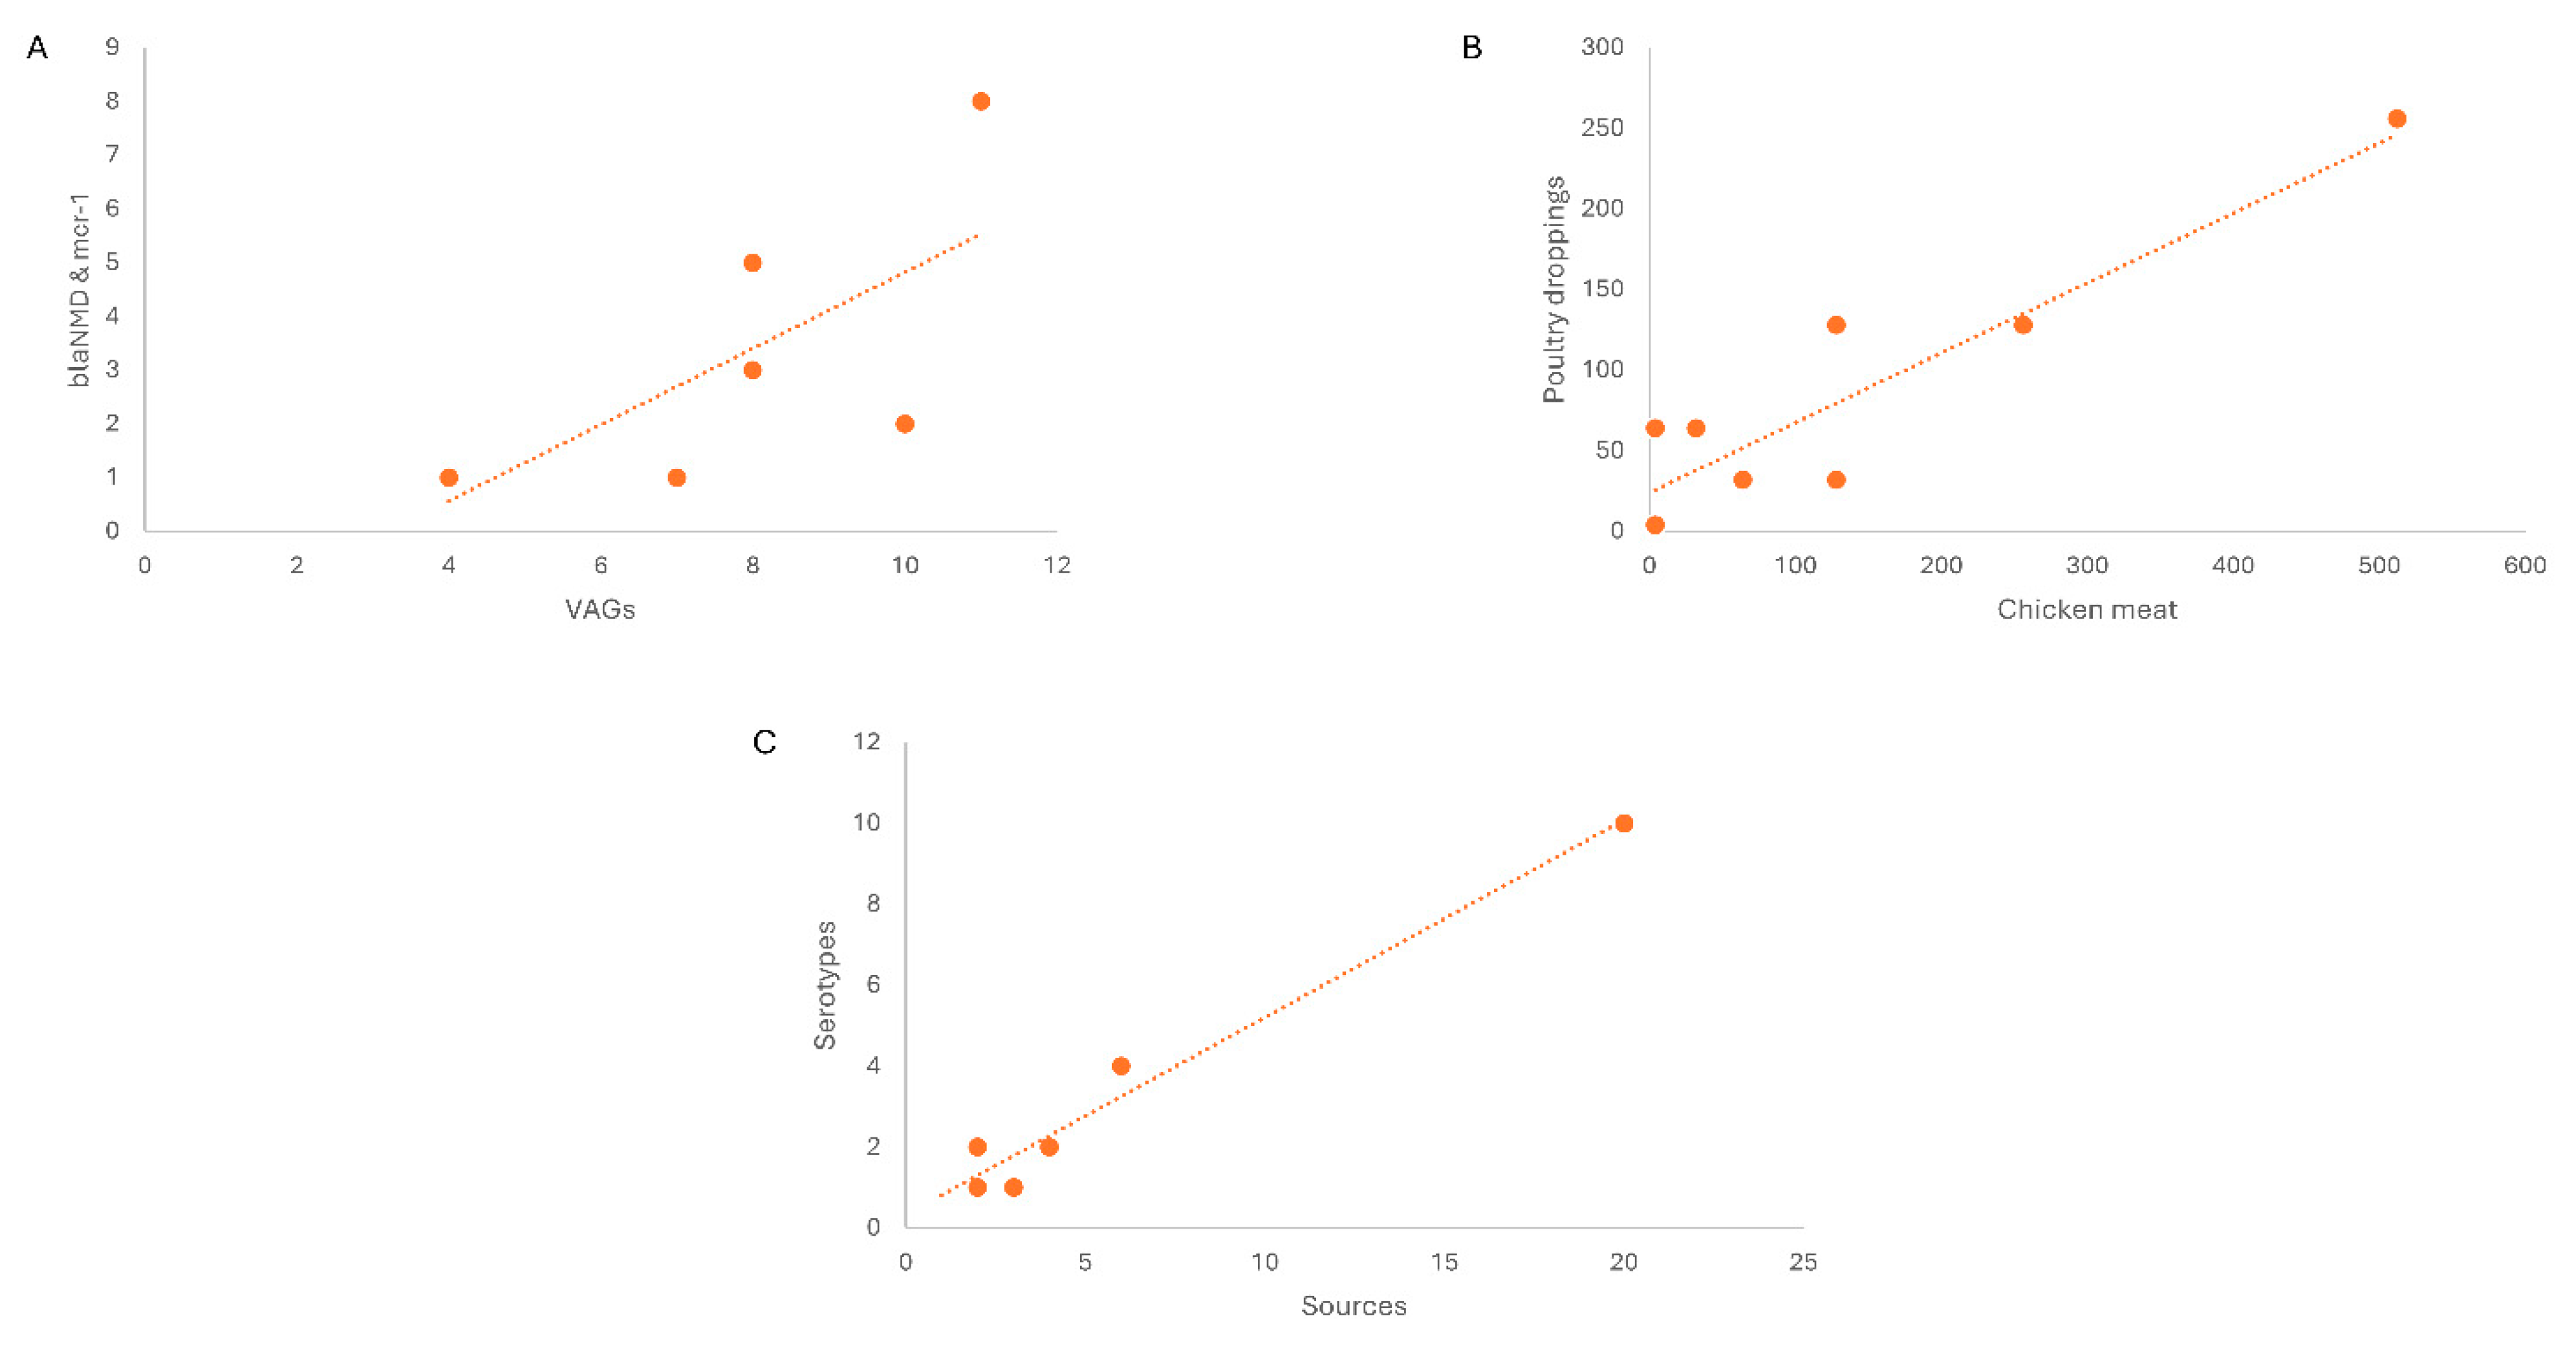
- (a)
- Linear regression/correlation (multiple R = 0.72) showed the co-existence of blaNDM-1 and mcr-1 in VRGs based confirmed E. coli. Here in chicken meat showing the highest percentage in marker VAGs (stx1, stx2, eae, hylA, fimH) along with blaNDM-1 and mcr-1 co harboring E. coli followed by beef, mutton, poultry droppings and cloacal /anal swabs. As same increase pattern was observed in both cases.
- (b)
- Linear regression of Non O157, blaNDM-1 and mcr-1 harboring STEC isolates revealed the correlation among MICs of the isolates from chicken meat and chicken droppings.
- (c)
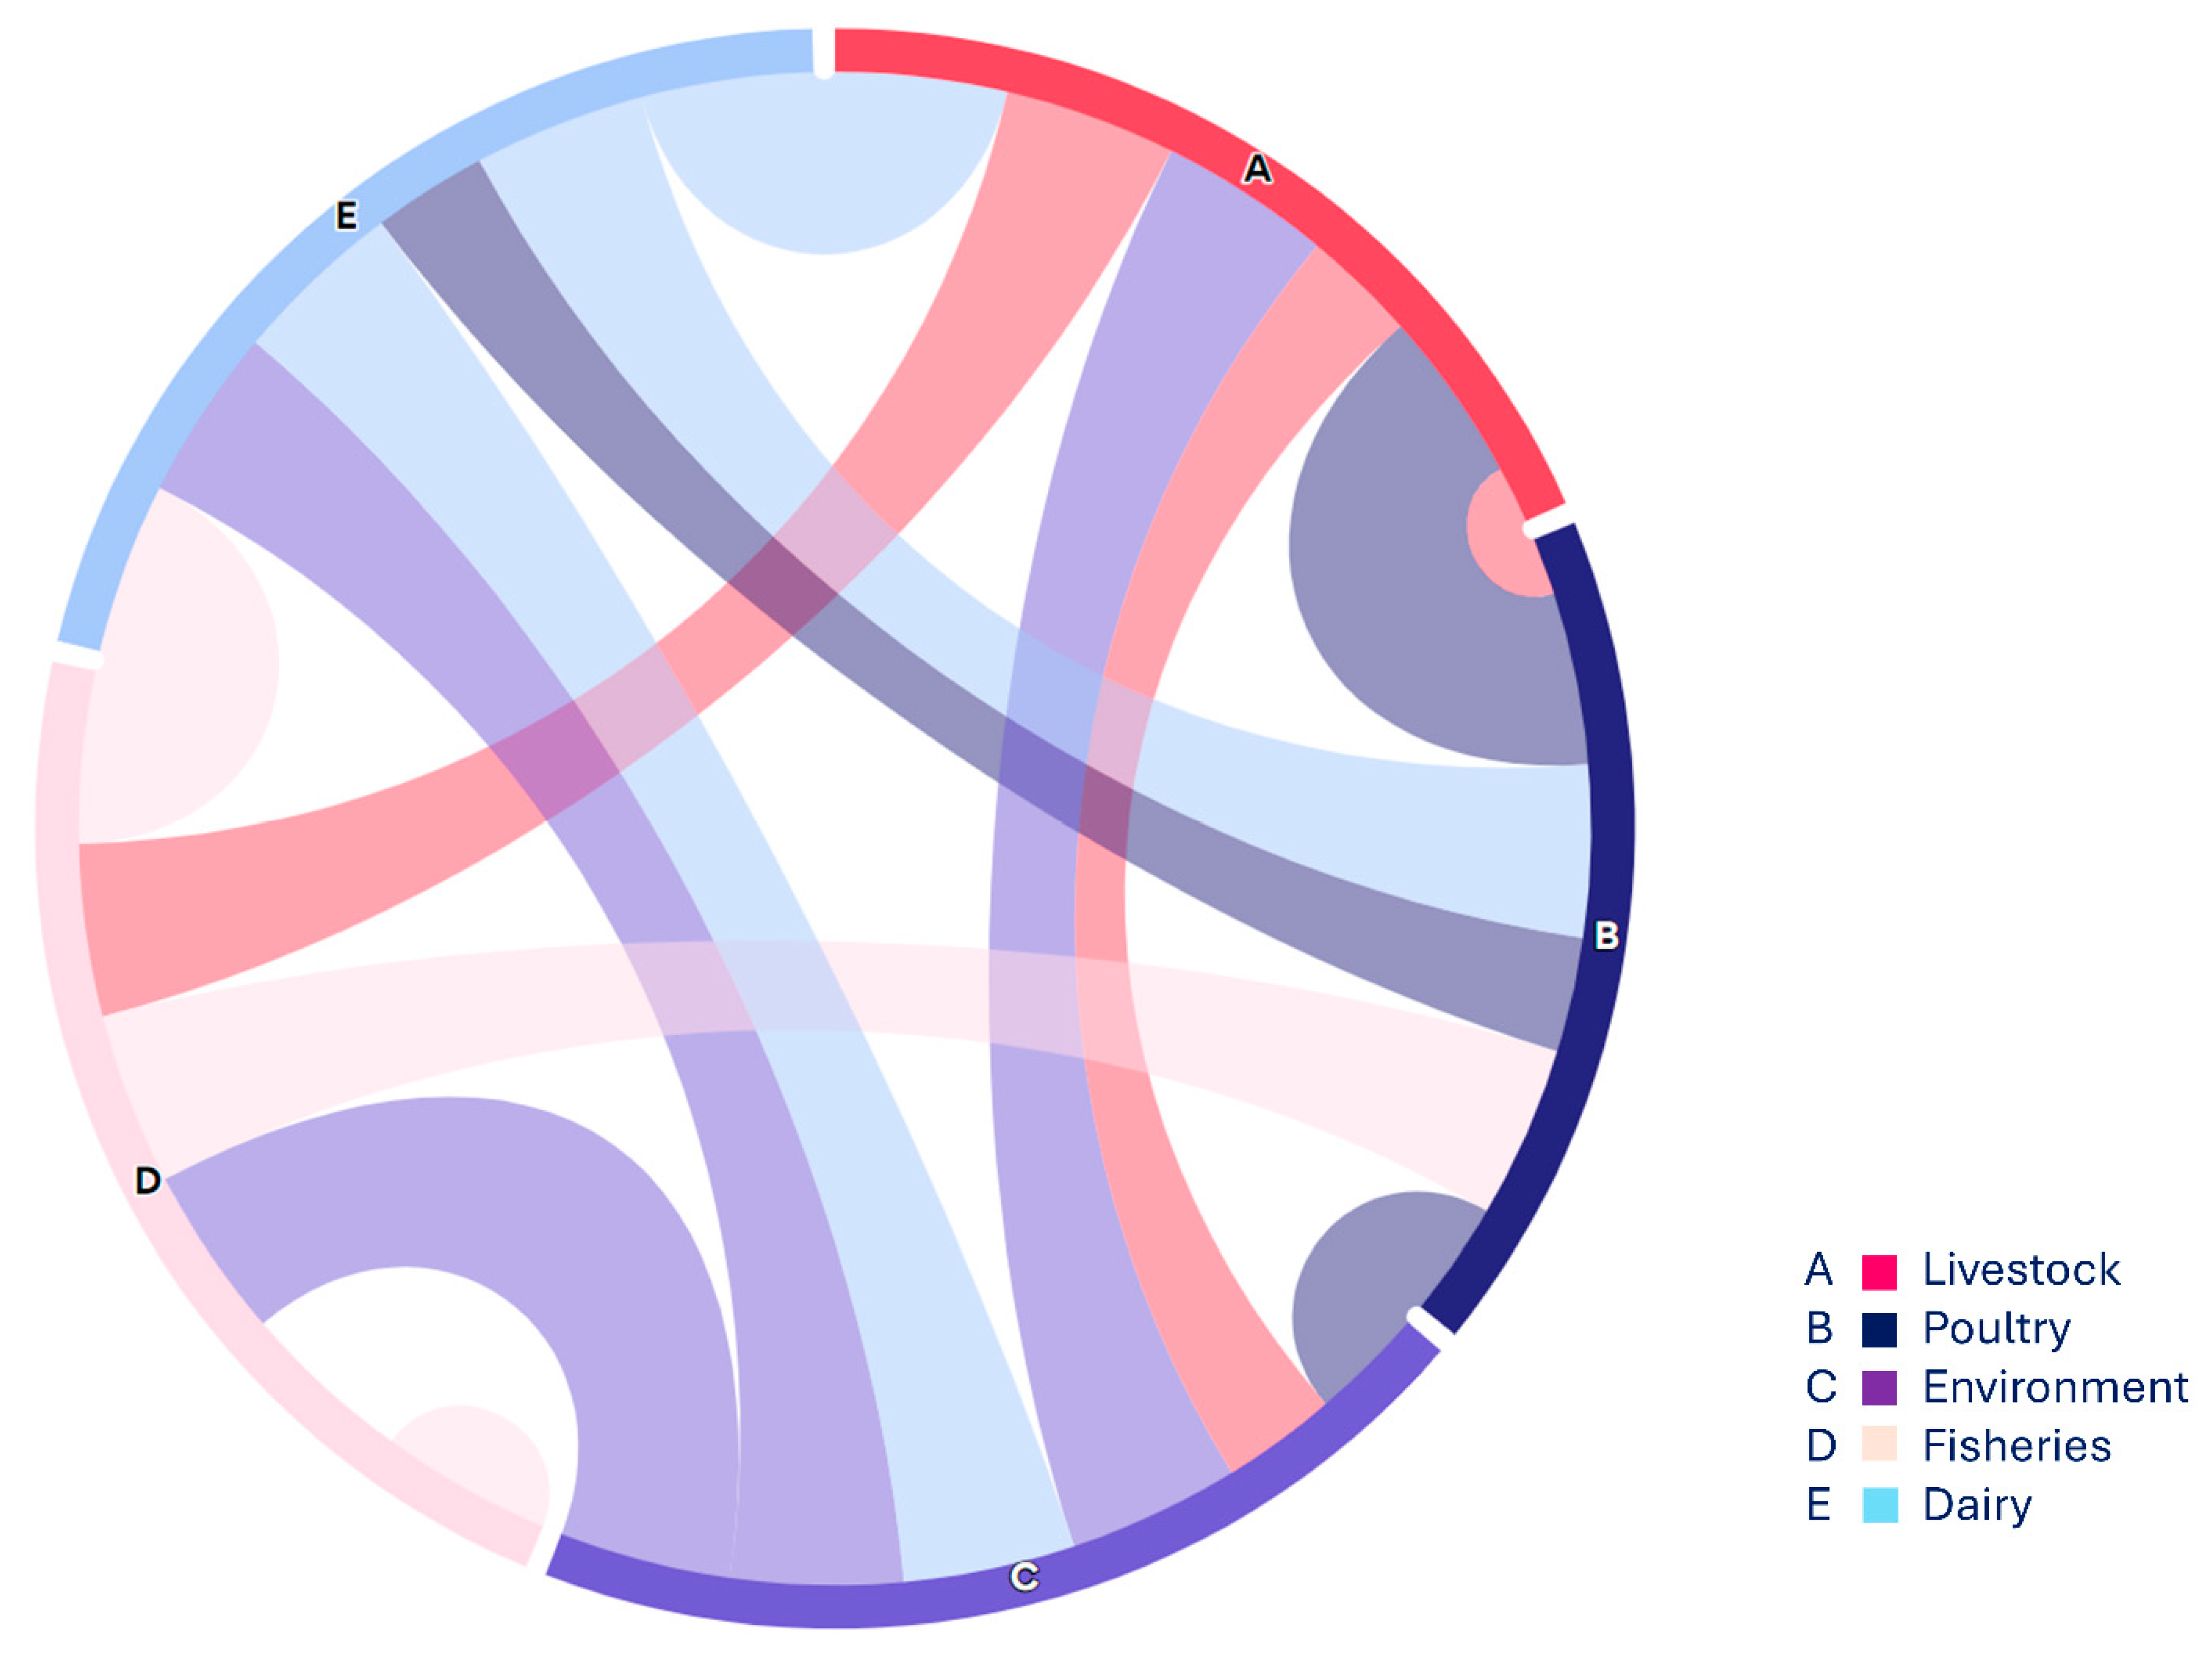
- Linear regression shows correlation of different selected sources and various Serotypes. In livestock category (beef samples) exhibited high percentage and same sample sources showing the high level of O26 in STEC cohobring blaNDM-1 and mcr-1 followed by chicken meat, cloacal/anal swabs and poultry dropping. Along with other Otypes, O103, O121 were also present along with O111 and O145 among selected food sources showing same rise pattern.
5. Conclusions
6. Patents
Author Contributions
Funding
Informed Consent Statement
Data Availability Statement
Acknowledgments
Conflicts of Interest
References
- Gompel, L.V.; Luiken, R.E.C; Hansen, R. B.; Munk, P.; Bouwknegt, M.; Heres, L.; Greve, G.D.; Scherpenisse, P.; Jongerius-Gortemaker, B.G.M.; Tersteeg-Zijderveld, M.H.G.; GarciaCobos, S.; Dohmen, W.; Dorado-Gracienaar, J.A.; Urlings, B.A.P.; Wagenaar, J.P.; Heederik, D.J.J.; Schmitt, H.; Bossers, A.; Smit, L.A. M.; et al.Description and determinants of the faecal resistome and microbiome of farmers and slaughterhouse workers: a metagenome-wide cross-sectional study. Environ.Int. 2020, 143, 105939. [Google Scholar] [CrossRef]
- Pokharel, S; Priyanka, S. ; Bipin, A. Antimicrobial use in food animals and human health: time to implement ‘One Health’approach. Antimicrob Resist Infect Control. 2020, 9, 181. [Google Scholar] [CrossRef]
- Hu, Y.; Wang, J.; Zhang, R.; Chen, L.; Zhang, H.; Qi, X.; Chen, J.; et al. Epidemiology of foodborne diseases caused by Salmonella in Zhejiang Province, China, between 2010 and 2021. Public Health Front. 2023, 11, 1127925. [Google Scholar]
- Gallo, M.; Ferrara, L.; Calogero, A.; Montesano, D.; Naviiglio, D.; et al. Relationships between food and diseases: What to know to ensure food safety. Food Res.Int. 2020, 137, 109414. [Google Scholar] [CrossRef]
- Pan, Y.; Hu, B.; Bai, X.; Yang, X.; Cao, L.; Liu, Q.; Sun, H.; Li, J.; Zhang, J.; Jin, D.; Xiong, Y.; et al. Antimicrobial Resistance of Non-O157 Shiga Toxin Producing Escherichia coli Isolated from Humans and Domestic Animals. Antibiotics. 2021, 10, 1. [Google Scholar] [CrossRef]
- Joseph, A.; Cointe, A.; kurkdijan, P. M.; Rafat, C.; Hertig, A.; et al. Shiga Toxin-Associated Hemolytic Uremic Syndrome: A Narrative Review. Toxins. 2020, 12, 2. [Google Scholar] [CrossRef]
- Tiseo, K.; Huber, L.; Gilbert, M.; Robinson, T.P.; Van Boeckel, T. P.; et al. Global trends in antimicrobial use in food animals from 2017 to 2030. Antibiot. 2020, 9, 918. [Google Scholar] [CrossRef]
- Nawaz, Z.; Aslam, B.; Zahoor, M.A.; Siddique, A.B.; Rafique, A.; Aslam, R.; Qamar, M.U.; Ali, S.; Mubeen, M.; et al. Frequency of Extended Spectrum Beta Lactamase Producing Escherichia coli in Fresh and Frozen Meat. Pak. Vet. J. 2020, 41, 1. [Google Scholar]
- Usman, M.; Rasool, M.H.; Khurshid, M.; Aslam, B.; Baloch, Z.; et al. Co-Occurrence of mcr-1 and Carbapenem Resistance in Avian Pathogenic E. coli Serogroups O78 ST95 from Colibacillosis-Infected Broiler Chickens. Antibiotics. 2023, 12, 5. [Google Scholar] [CrossRef] [PubMed]
- Bording-Jorgensen, M.; Parsons, B.; Szelewicki, J.; Lioyd, C.; Chui, L.; et al. Molecular Detection of Non-O157 Shiga Toxin Producing Escherichia coli (STEC) Directly from Stool Using Multiplex qPCR Assays. Microorganism. 2022, 10, 2. [Google Scholar] [CrossRef] [PubMed]
- Harada, T.; Iguchi, A.; Iyoda, S.; Seto, K.; Taguchi, M. ; Kumeda, Y.; et al. Multiplex Real-Time PCR Assays for Screening of Shiga Toxin 1 and 2 Genes, Including All Known Subtypes, and Escherichia coli O26-, O111-, and O157-Specific Genes in Beef and Sprout Enrichment Cultures. JFP. 2015, 78, 10.
- Silva, V.; Correia, S.; Pereira, J.E.; Igrejas, G.; Poeta, P.; et al. Surveillance and environmental risk assessment of antibiotics and amr/args related with mrsa: one health perspective. AMR. 2020, 271–295. [Google Scholar]
- Kinnula, S.; hemminki, K.; Kotilainen, H.; Ruotsalainen, E.; Tarkka, E.; Salmenlinna, S.; Hallanvuo, S.; Leinonen, E.; Jukka, O.; Rimhanen-Finne, R.; et al. Outbreak of multiple strains of non-O157 Shiga toxin-producing and enteropathogenic Escherichia coli associated with rocket salad, Finland, autumn 2016. Euro. Surveill. 2018, 23, 35. [Google Scholar] [CrossRef] [PubMed]
- Al-Mustapha, A. I.; Raufu, I.A.; Ogundijo, Q.A.; Brouwer, M.S.M.; Adetunji, V. ; Heikinheimo, A.; et al. Antibiotic resistance genes, mobile elements, virulence genes, and phages in cultivated ESBL-producing Escherichia coli of poultry origin in Kwara State, North Central Nigeria. Int. J. Food. Microbiol, 2023, 389, 110086. [Google Scholar]
- Hasona, I.F.; helmy, S.M.; and El Gamal, A. D.; et al.Prevalence, virulence factors, and antimicrobial resistance profiles of Shiga toxin-producing Escherichia coli isolated from broiler chickens in Egypt. Vet. Res. Forum. 2023, 14, 131–138. [Google Scholar] [PubMed]
- Anyanwu, M.U.; Jaj, F.I.; R. Okpala, C.O.; Njoga, E.O.; Okafor, N.A.; Oguttu, J.W.; et al. Mobile colistin resistance (mcr) gene-containing organisms in poultry sector in low-and middle-income countries: Epidemiology, characteristics, and one health control strategies. Antibiotics. 2023, 12, 1117.
- Sadek, J.; Rosa. J.M.O.; Maky, M. A.; Dandrawy, M.K.; Nordman, P.; Poirel, L.; et al. Genomic Features of MCR-1 and Extended-Spectrum β-Lactamase Producing Enterobacterales from Retail Raw Chicken in Egypt Mustafa. Microorganisms. 2021, 9, 195. [Google Scholar] [CrossRef] [PubMed]
- Zhang, J.; Chen, L.; Wang, J.; Yassin, A.K.; Butaye, P.; Kelly, P.; Gong, J.; Guo, W.; Li, J.; Li, M.; Yang, F.; Feng, Z.; Jiang, P.; Song, C.; Wang, Y.; You. J.; Price, S.; Qi, K.; Kang, Y.; Wang, C.; et al. Molecular detection of colistin resistance genes (mcr-1, mcr-2 and mcr-3) in nasal/oropharyngeal and anal/cloacal swabs from pigs and poultry. Sci. Rep. 2018, 8, 3705. [Google Scholar] [CrossRef] [PubMed]
- Islam, M.A.; Mondol, A.S.; Azmi, I.J.; Boer, E.D.; beumer, R.R.; Zwietering, M.H.; Heuvelink, A.E.; Talukder, K. A.; et al. Occurrence and Characterization of Shiga Toxin–Producing Escherichia coli in Raw Meat, Raw Milk, and Street Vended Juices in Bangladesh. Foodborne Pathog. Dis. 2010, 7, 11. [Google Scholar] [CrossRef] [PubMed]
- Ju, W.; Shen, J.; Li, Y.; Toro, M.A.; Zahoo, S.; Ayers, S.; Najjar, M.B.; Meng, J.; et al. Non-O157 Shiga toxin-producing Escherichia coli in retail ground beef and pork in the Washington D.C. area. Food Microbiol. 2012, 32, 2. [Google Scholar] [CrossRef] [PubMed]
- Yang, X.; Sun, H.; Fan, R.; Fu, S.; Zhang, J.; Matussek, A.; Xiong, Y.; Bai, X.; et al. Genetic diversity of the intimin gene (eae) in non-O157 Shiga toxin-producing Escherichia coli strains in China. Sci. Rep. 2020, 10, 3275. [Google Scholar] [CrossRef] [PubMed]
- Lee, JB.et al. , (2018)." Pathogenic and phylogenetic characteristics of non-O157 Shiga toxin-producing Escherichia coli isolates from retail meats in South Korea. J. Vet. Sci. 2017, 19, 2. [Google Scholar]
- Byrne, L.; Adams, N.; Jenkins, C.; et al. Association between Shiga Toxin–Producing Escherichia coli O157:H7 stx Gene Subtype and Disease Severity, England, 2009–2019. Emerge. Infect. Dis. 2020, 26, 10. [Google Scholar] [CrossRef]
- Li, Y.; Huang, T.Y.; Ye, C.; Chen, L.; Liang, Y.; Wang, K. ; Liu, J.; et al. Formation and Control of the Viable but Non-culturable State of Foodborne Pathogen Escherichia coli O157:H7. Front. Microbiol. 2020, 11, 1202. [Google Scholar]
- Shah, I. H. Molecular Characterization and Virulence Gene Profile of Entero-pathogenic and Shiga-Toxin Producing Escherichia coli from Food of Animal Origin and Environmental Sources. SKUAST Kashmir. 2023.
- Alotaibi, K.; and Khan, A.A. Prevalence and Molecular Characterization of Shiga Toxin Producing Escherichia coli from Food and Clinical Samples. Pathogens. 2023, 12, 1302. [Google Scholar] [CrossRef] [PubMed]
- Nüesch-Inderbinen, M.; Treier, A.; Stevens, M.J.A.; Stephen, R.; et al. Whole genome sequence-based characterisation of Shiga toxin-producing Escherichia coli isolated from game meat originating from several European countries. Sci. Rep. 2023, 13, 3247. [Google Scholar] [CrossRef]
- Shakerian, A.; rahimi, E. ; Emad, P.; et al. Vegetables and Restaurant Salads as a Reservoir for Shiga Toxigenic Escherichia coli: Distribution of Virulence Factors, O-Serogroups, and Antibiotic Resistance Properties. JFP. 2016, 79, 7.
- Sakthikarthikeyan, S.; Sivakumar, M.; Manikandan, R.; Senthkumar, P.; Sureskumar, V.; Malmarugan, S.; Prabhu, M.; Ramakrishnan, V.; et al. Prevalence and Molecular Characterization of Multidrug-resistant ESBL-producing E. coli in Commercial Poultry. Indian J. Anim. Res. 2024, 1, 6. [Google Scholar] [CrossRef]
- Tiedje, J. M.; Fu, Y.; Mei, Z.; Schaffer, A.; Dou, Q.; Amelung, W.; Elsner, M.; Adu-Gyamfi, J.; Heng, L.; Virta, M.; Jiang, X.; Smidt, H.; Topp, E.; Wang, F.; et al. Antibiotic resistance genes in food production systems support One Health opinions. Curr. Opin. Environ. Sci. Health. 2023, 43, 100492. [Google Scholar] [CrossRef]
- Hinthong, W.; Thaotumpitak. ; Sripradite, J.; Indrrawttana, N.; Srisook, T.; Kongngoen, T.; Atwill, E.R.; Jeamsripong, S.; et al. Antimicrobial resistance, virulence profile, and genetic analysis of ESBL-producing Escherichia coli isolated from Nile tilapia in fresh markets and supermarkets in Thailand. Plos one. 2024, 19, e0296857. [Google Scholar]
- Zhang, S.; Huang, Y.; Yang, G.; Wu, Q.; Zhang, J.; Wang, J.; Ding, Y.; Ye, Q.; Wu, S.; Gu, Q.; Zhang, Y.; et al. High prevalence of multidrug-resistant Escherichia coli in retail aquatic products in China and the first report of mcr-1-positive extended-spectrum β-lactamase-producing E. coli ST2705 and ST10 in fish. Int. J. Food Microbiol. 2024, 408, 110449. [Google Scholar] [CrossRef]
- Ilham, D.; Souad, L.; Asmae, L.H.; kawtar, N.; Mohammed, T. ; Nabila, S.; et al. Prevalence, antibiotic resistance profile, MBLs encoding genes, and biofilm formation among clinical carbapenem-resistant Enterobacterales isolated from patients in Mohammed VI University Hospital Centre, Morocco. Lett Appl Microbiol. 2023, 76, ovad107.
- Nwike, I. E.; Ugwu, M.C.; Ejikeugwu, P.C.; Ujam, N.T.; Iroha, I.R.; Esimone, C. O.; et al. Phenotypic and molecular characterization of enteropathogenic Escherichia coli and Salmonella spp. causing childhood diarrhoea in Awka, South-Eastern Nigeria. BNRC. 2023, 47, 97. [Google Scholar]
- Karim, M. R.; Zakaria, Z.; Hassan, L.; Faiz, N.K.; Ahmad, N.I.; et al. Antimicrobial Resistance Profiles and Co-Existence of Multiple Antimicrobial Resistance Genes in mcr-Harbouring Colistin-Resistant Enterobacteriaceae Isolates Recovered from Poultry and Poultry Meats in Malaysia. Antibiotics. 2023, 12, 6–1060. [Google Scholar] [CrossRef]
- Ali, M.W.; Utsho, K.S.; Karmakar, S.; Nazmul Hoque, Md.; Rahman, Md.T.; Hassan, J.; et al. et First report on the molecular characteristics of mcr-1 colistin resistant E. coli isolated from retail broiler meat in Bangladesh. Int. J. Food Microbiol. 2023, 388, 110065. [Google Scholar] [CrossRef] [PubMed]
- Sismova, P.; Sukar, I.; Kolidentsev, N.; Chytilova, I.; Bardon, J.; Dolejska, M.; Nesporova, K.; et al. Plasmid-mediated colistin resistance from fresh meat and slaughtered animals in the Czech Republic: nation-wide surveillance 2020–2021. Microbiol. spectr. 2023, 11, e00609–00623. [Google Scholar] [CrossRef] [PubMed]
- Guo, C.H.; Liu, Y.Q.; Duan, X.X.; Yang, T.Y.; Li, F.Y.; Zou, M.; Liu, B. T.; et al. et al. High prevalence and genomic characteristics of carbapenem-resistant Enterobacteriaceae and colistin-resistant Enterobacteriaceae from large-scale rivers in China. Environ Pollut. 2023, 331, 121869. [Google Scholar]
| Specimen Category | Sources | Collected Samples |
Total Samples |
Positive Sample |
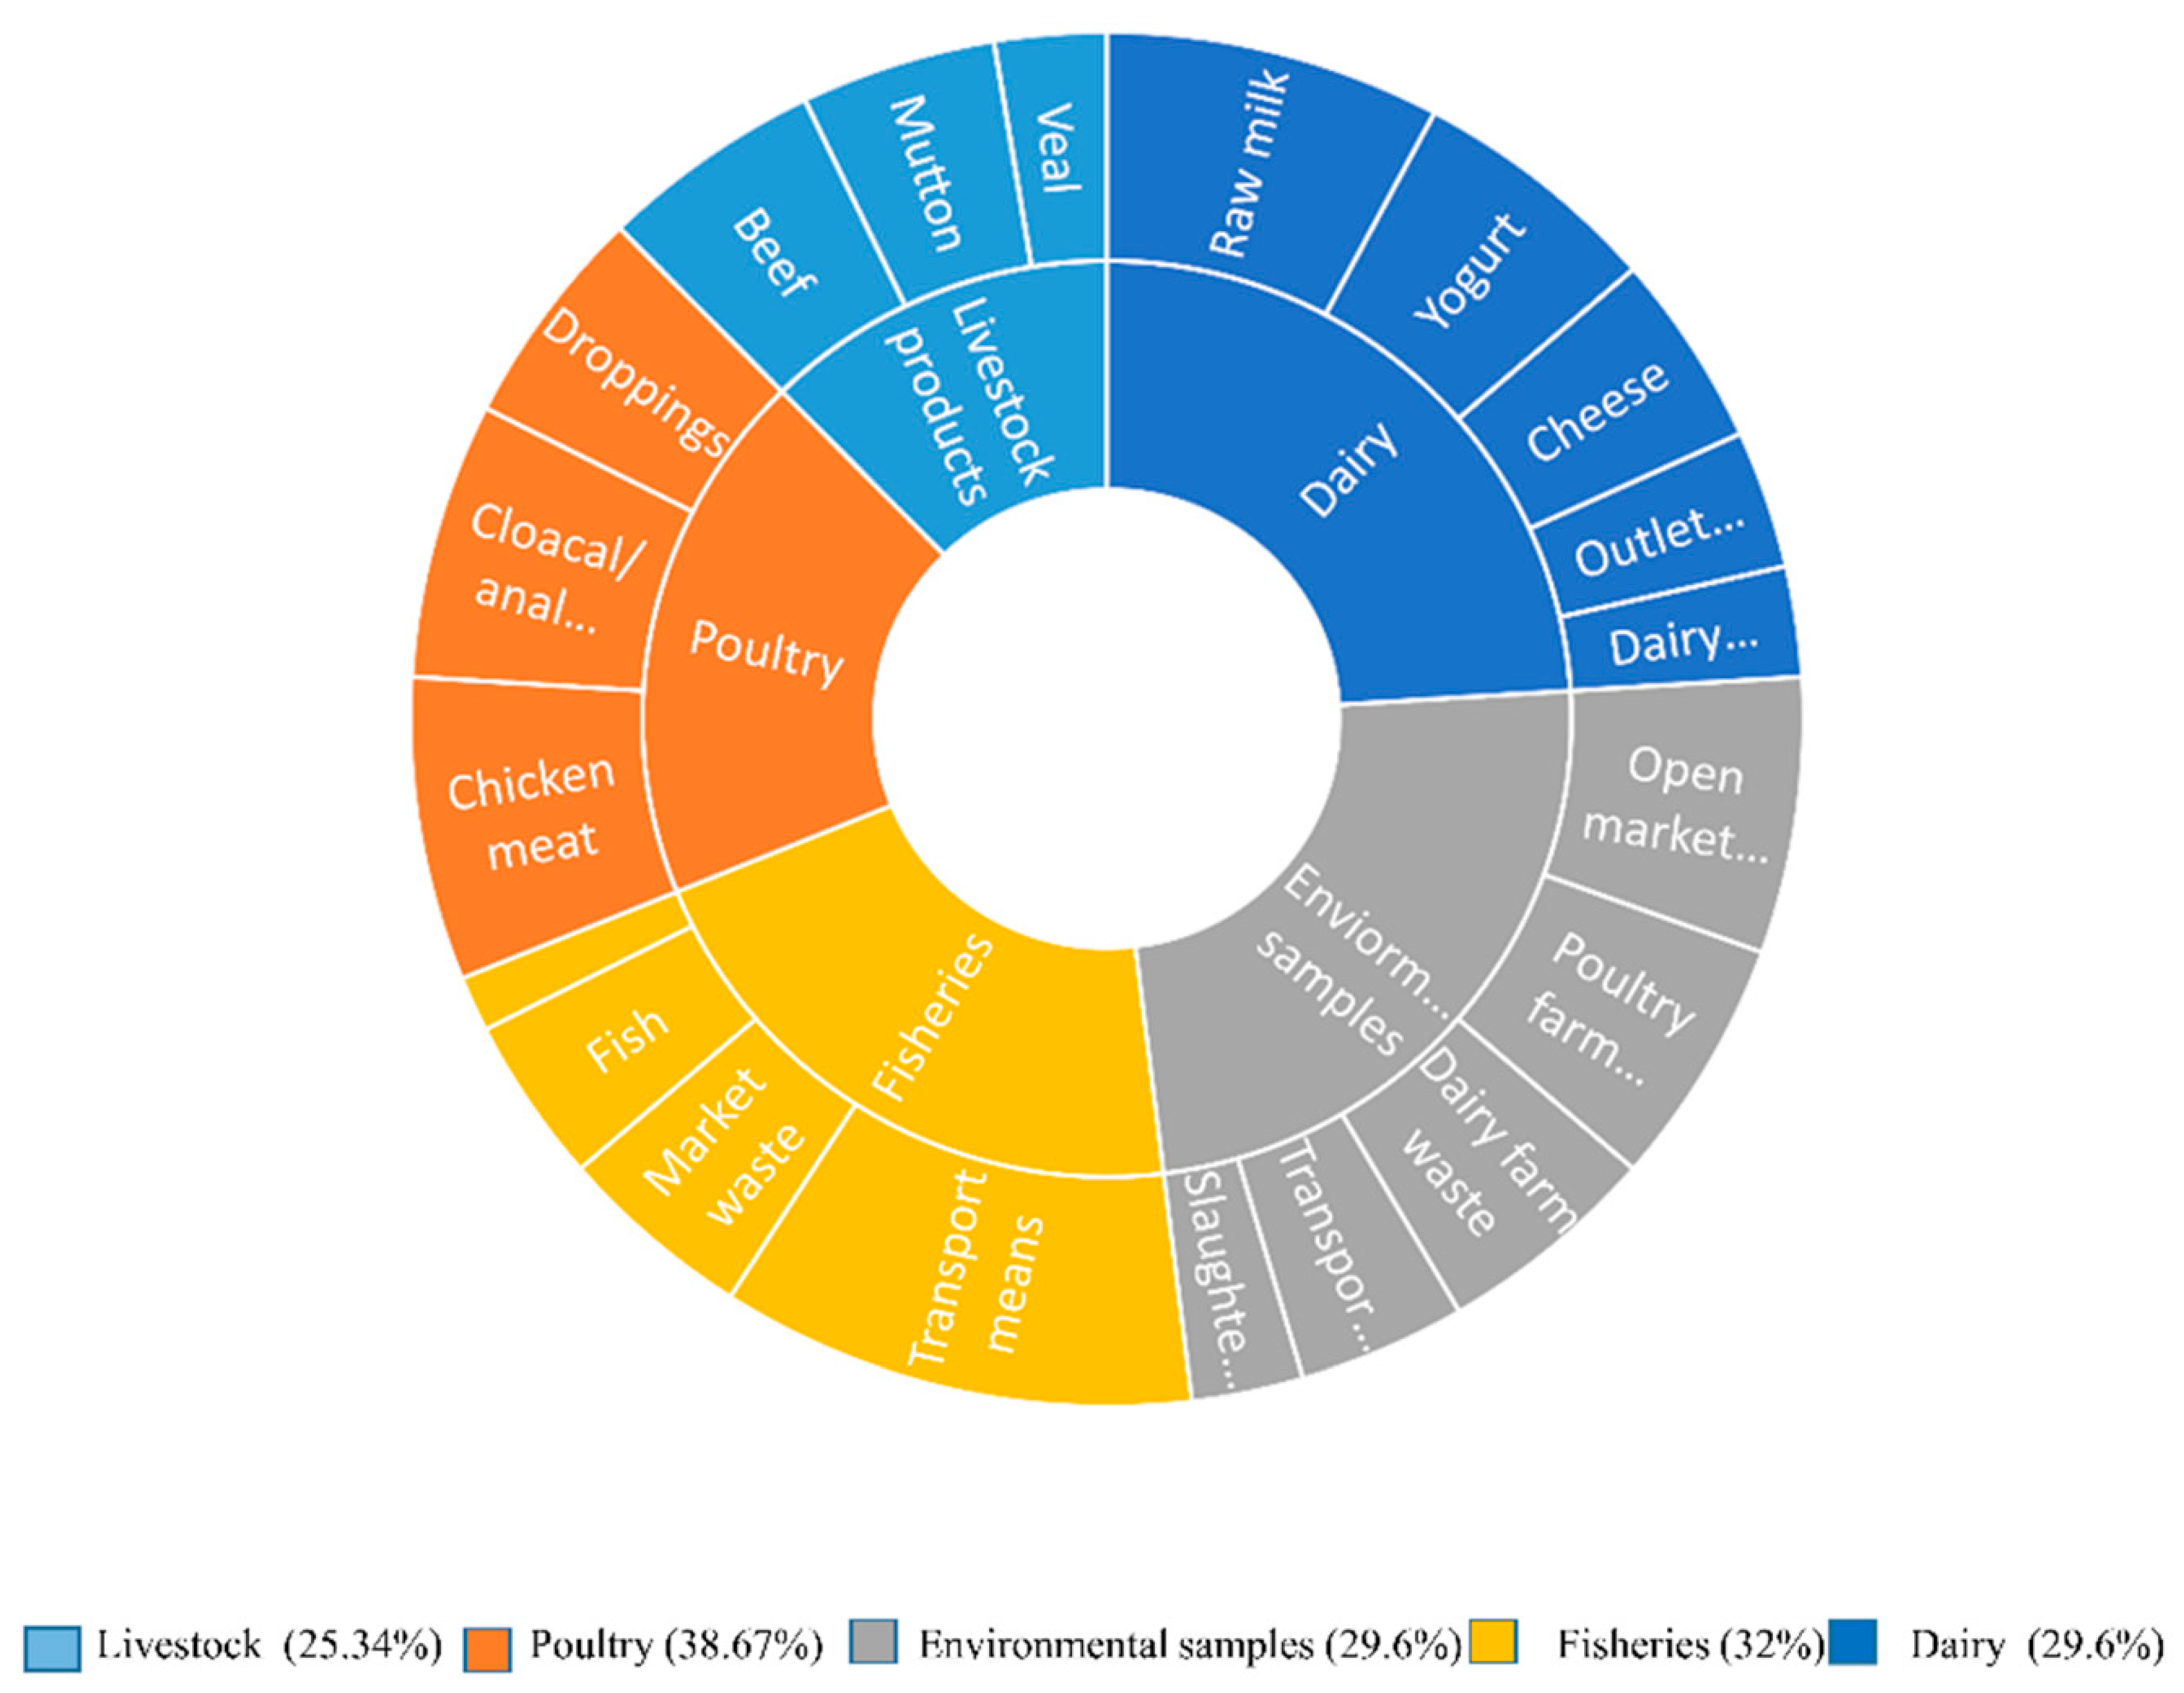
Distribution of E. coli positive Samples | Distribution of E. coli from selected categories |
P-value | ||
|---|---|---|---|---|---|---|---|---|---|
| Livestock products | Beef | 25 | 75 | 8 | 32% | 19/75 (25.34%) |
|||
| Mutton | 25 | 7 | 28% | .001* | |||||
| Veal | 25 | 4 | 16% | ||||||
| Poultry | Chicken meat | 25 | 75 | 11 | 44% | 29/75 (38.67%) |
|||
| Cloacal/anal swabs | 25 | 10 | 40% | ||||||
| Droppings | 25 | 8 | 32% | ||||||
| Environmental samples | Slaughterhouse | 25 | 125 | 4 | 16% | 37/125 (29.6%) |
|||
| Open market waste | 25 | 10 | 40% | ||||||
| Transport Means | 25 | 6 | 24% | ||||||
| Dairy farm waste | 25 | 8 | 32% | ||||||
| Poultry farm waste | 25 | 9 | 36% | ||||||
| Fisheries | Fish | 25 | 100 | 6 | 24% | 32/100 (32%) |
|||
| Shrimps | 25 | 2 | 8% | ||||||
| Market waste | 25 | 7 | 28% | ||||||
| Transport means | 25 | 17 | 68% | ||||||
| Dairy | Raw milk | 25 | 125 | 12 | 48% | 37/125 (29.6%) |
|||
| Yogurt | 25 | 9 | 36% | ||||||
| Dairy cream | 25 | 4 | 16% | ||||||
| Cheese | 25 | 7 | 28% | ||||||
| Outlet waste | 25 | 5 | 20% | ||||||
| Grand Total | 500 | 154 | 154/500 (30.8%) |
||||||
| Specimen category | VAGs based confirmed E. coli |
STEC % out of E. coli | Non O157 STEC co harboring blaNDM-1 & mcr-1 | O Type | Statistical analysis |
|---|---|---|---|---|---|
| Beef | 8(32%) | 6/8(75%) | 2/6(33.33%) | O26 , O103 & O121 | 0.05* |
| Mutton | 7(28%) | 3/7(42.85%) | 1/3(33.33%) | O26, O103 & O111 | |
| Veal | 4(16%) | 1/4(25%) | 1/1(100%) | O121 | |
| Chicken meat | 11(44%) | 3/11(27.27%) | 3/3(100%) | O26 & O145 |
|
| Cloacal/anal swabs | 10(40%) | 4/10(40%) | 2/4(50%) | O26, O111 & O145 |
|
| Droppings | 8(32%) | 2/8(25%) | 2/2(100%) | O26 |
|
| Slaughterhouse | 4(16%) | 2/4(50%) | 1/1(100%) | O103& O12 |
|
| Overall | 52(29.71%) | 21/52(40.38%) | 12/21(57.14%) |
| Sources | STEC | Non-O157 O types | Co-existence of ARGs | P value | ||||
| O26 | O103 | O111 | O121 | O145 |
0.05* |
|||
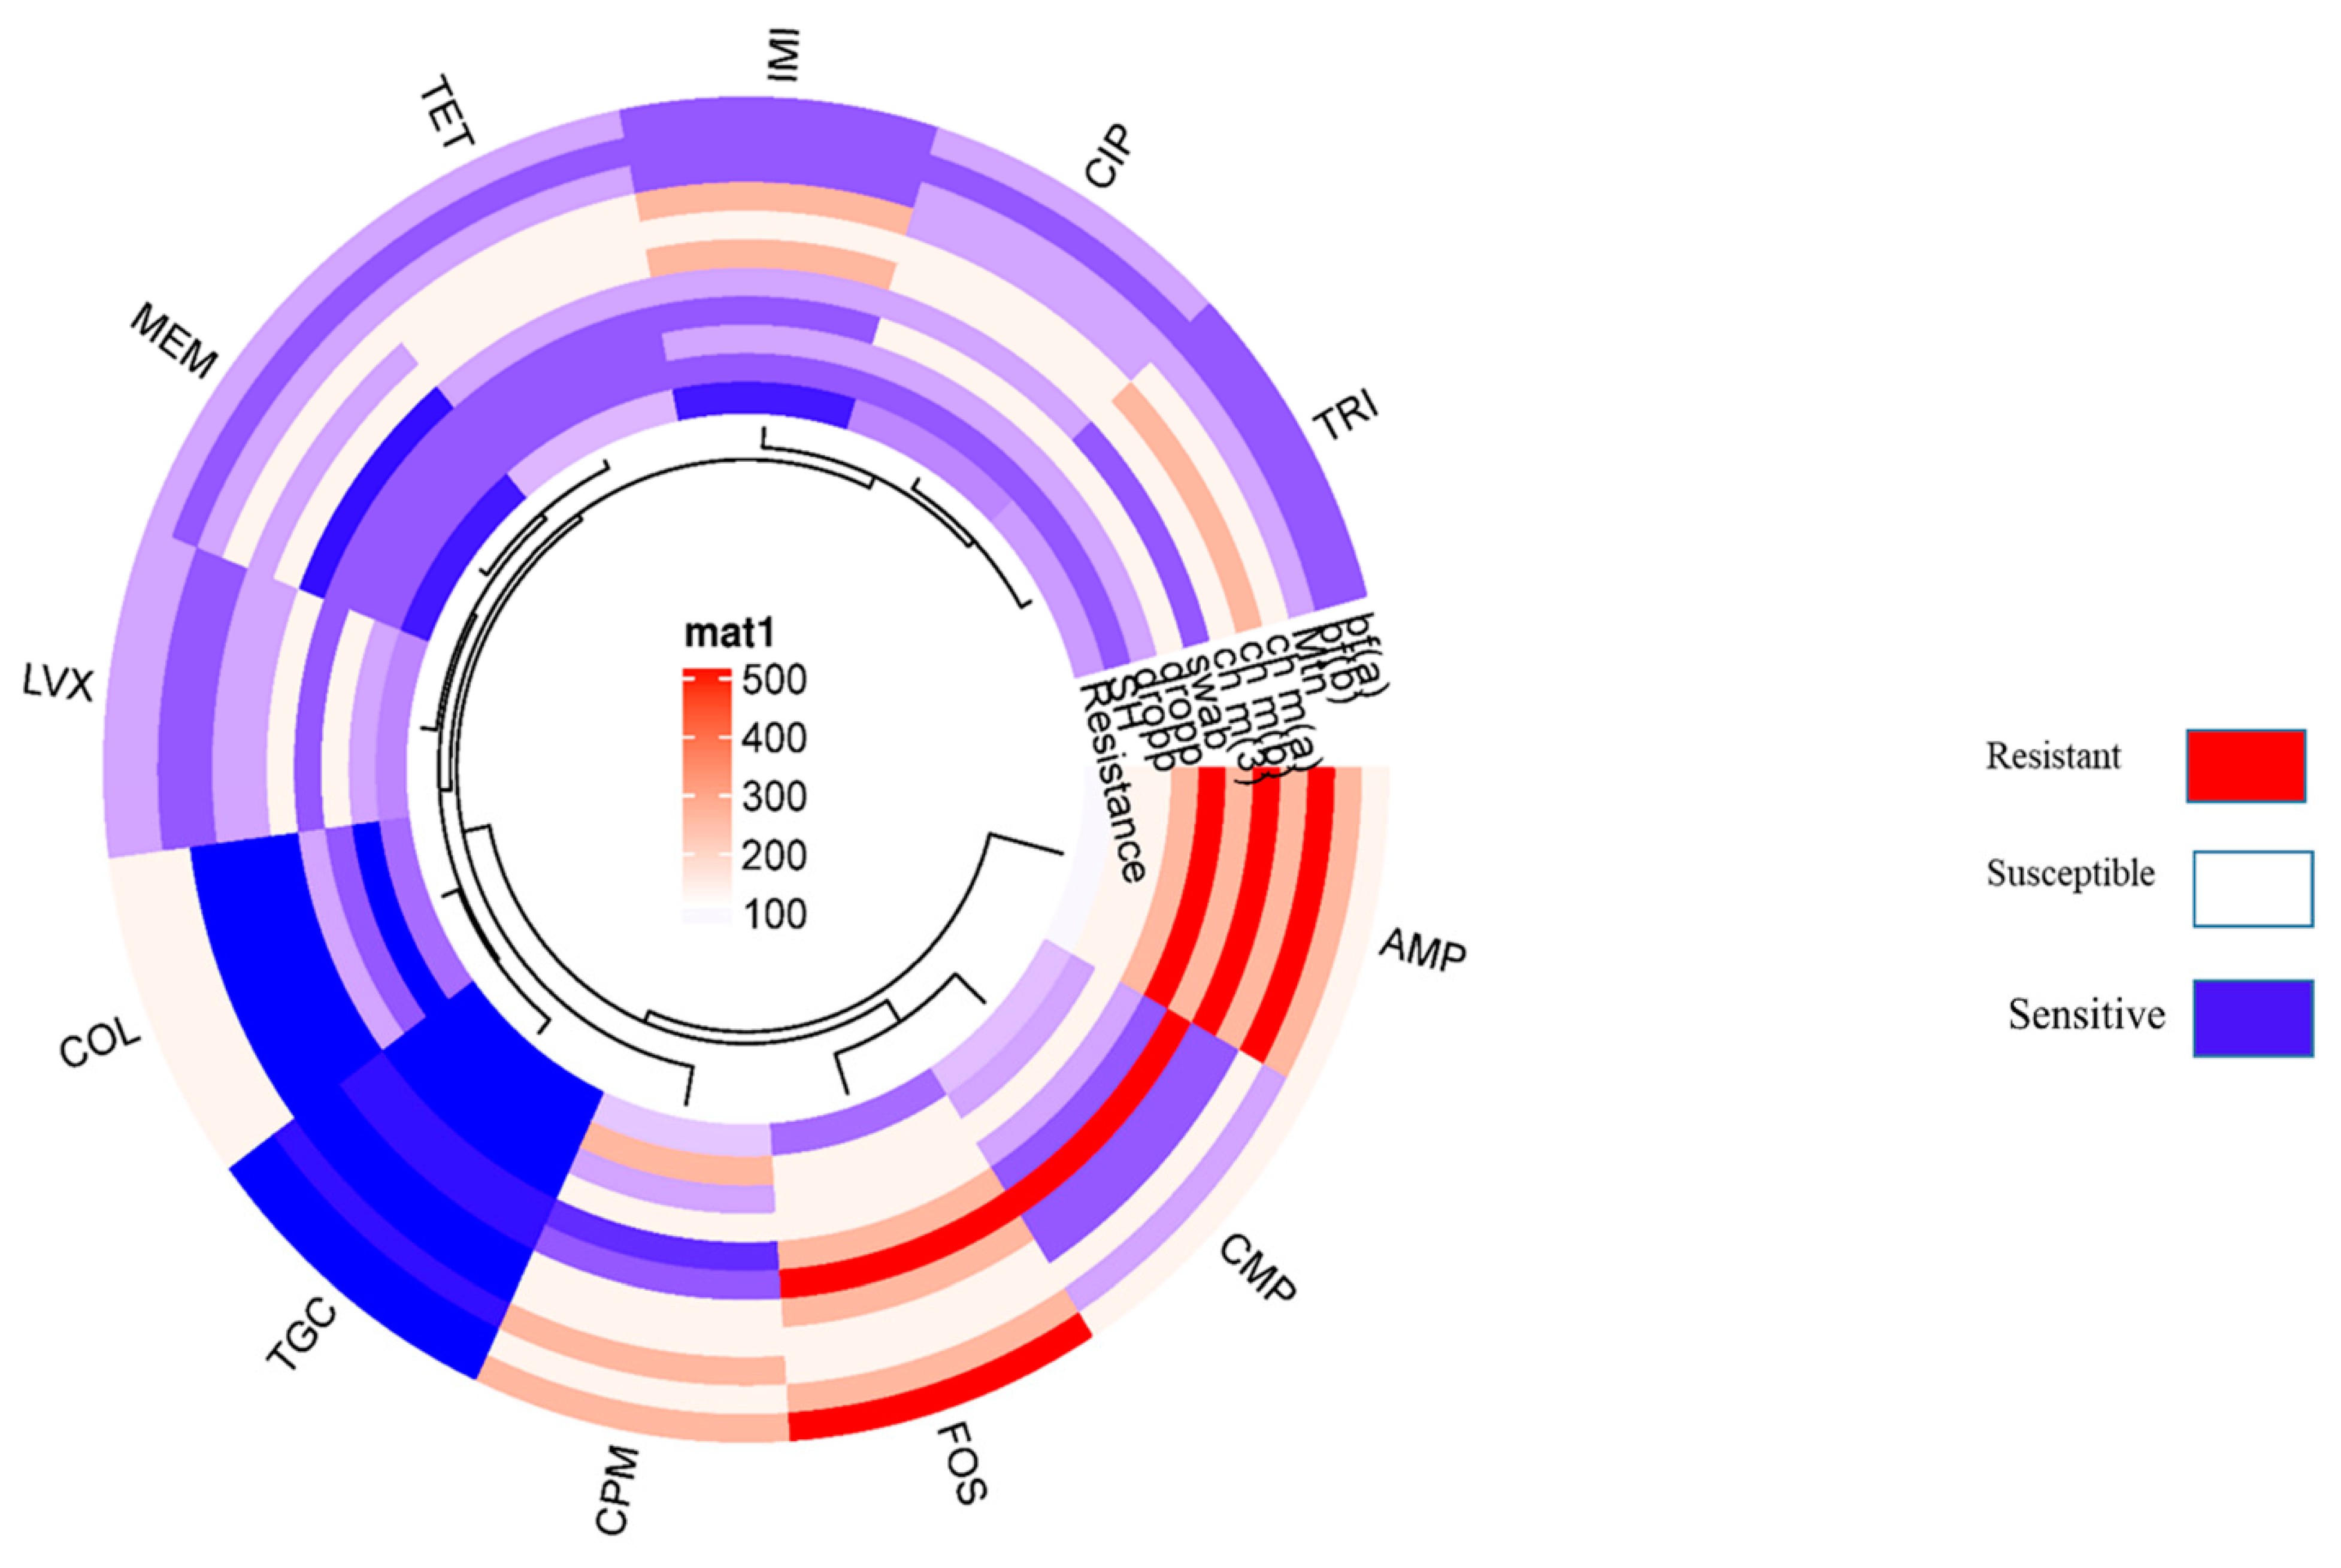
| Beef | 6 | 4 | 1 | -- | 1 | -- | blaNDM,mcr-1, blaTEM,blaOXA, blaKPC, blaqnrA, | |
| Mutton | 3 | 1 | 1 | 1 | -- | blaNDM,mcr-1, blaSHV, blaOXA, | ||
| Veal | 1 | -- | -- | -- | 1 | -- | blaNDM,mcr-1, blaCTX-M, blaTEM, blatetB | |
| Chicken meat | 3 | 2 | -- | -- | -- | 1 | blaNDM,mcr-1, blaCTX-M,blaqnrS, | |
| Cloacal/anal swabs | 4 | 2 | -- | 1 | -- | 1 | blaNDM,mcr-1, blaqnrB, | |
| Droppings | 2 | 2 | -- | -- | -- | -- | blaNDM,mcr-1, blatetA | |
| Slaughterhouse |
2 |
-- | 1 | -- | 1 | -- | blaNDM,mcr-1, blaTEM,blaqnrS,blatetA,blaSul2,blatetB | |
| Total | 21 | 11 | 3 | 2 | 3 | 2 | ||
| Sample Source |
Positive VAGs in E. coli |
NDM | mcr-1 | Stx | Pap | P value | |||||||||
|---|---|---|---|---|---|---|---|---|---|---|---|---|---|---|---|
| stx1 | stx2 | Eae | hylA | Iss | papA | papC | fimH | TraT | OmpT | AmpC | |||||
| Beef | 8 | 3 37.5% |
2 25% |
1 12.5% |
6 75% |
ND | 2 25% |
3 37.50% |
1 12.5% |
ND |
6 75% |
2 25% |
ND | ND |
.001* |
| Mutton | 7 |
1 14.28% |
1 14.28% |
3 42.85% |
1 14.28% |
1 14.28% |
3 42.85% |
ND | ND | ND | ND | ND | ND | 1 14.28% |
|
| Veal | 4 | ND | 1 25% |
1 25% |
ND | 1 25% |
ND | ND | ND | ND | ND | 2 50% |
2 50% |
ND | |
| Chicken Meat |
11 | 3 27.27% |
8 72.72% |
2 18.18% |
1 9.09% |
ND | 8 88.89% |
9 81.81% |
ND | 4 36.36% |
7 63.63.% |
9 81.81% |
7 63.63% |
ND | |
| Cloacal /anal Swabs |
10 | 1 10% |
2 20% |
2 20% |
4 40% |
5 50% |
ND | ND | ND | ND | ND | ND | ND | 1 10% |
|
|
Droppings |
8 | 5 62.5% |
2 25% |
2 25% |
2 25% |
2 25% |
ND | ND | ND | ND | 1 12.5% |
ND | ND | ND | |
| Slaughter House |
4 | 1 25% |
1 25% |
ND | 2 50% |
ND | 2 50% |
1 25% |
ND | ND | ND | ND | 2 50% |
ND | |
| Total |
52 |
14 | 17 | 11 | 16 | 9 | 15 | 13 | 1 | 4 | 14 | 13 | 11 | 2 | |
| Antibiotics | Conc. |
CLSI EUCAST/FDA Resistance Breakpoint |
Beef samples (n=2) |
Mutton sample (n=1) |
Veal sample (n=1) |
Chicken meat (n=3) |
Poultry Cloacal /anal swabs (n=2) |
Poultry droppings (n=2) |
Slaughter house (n=1) |
|||||
|---|---|---|---|---|---|---|---|---|---|---|---|---|---|---|
| Ampicillin | 10 µg | ≥32 | 128 | 256 |
512 |
256 | 256 | 512 | 256 | 512 | 512 | 256 | 128 | 128 |
| Cefepime | 30µg | ≥16 | 256 | 128 |
256 |
256 | 128 | 128 | 32 | 32 | 16 | 128 | 64 | 256 |
| Ciprofloxacin | 5µg | ≥4 | 64 | 32 |
64 |
128 | 64 | 128 | 128 | 64 | 64 | 128 | 64 | 32 |
| Levofloxacin | 5µg | ≥4 | 64 | 64 |
32 |
32 | 32 | 64 | 64 | 64 | 128 | 32 | 128 | 64 |
| Chloramphenicol | 30µg | ≥32 | 128 | 64 |
128 |
64 | 32 |
32 |
512 | 32 | 32 | 64 | 128 | 64 |
| Trimethoprim | 5µg | ≥16 | 32 | 32 |
64 |
32 | 128 |
256 |
128 | 64 | 32 | 128 | 64 | 32 |
| Imipenem | 10µg | ≥4 | 32 | 32 |
32 |
32 | 256 | 128 |
256 |
128 |
64 | 32 | 64 | 32 |
| Meropenem | 10µg | ≥4 | 64 | 32 |
64 |
64 | 128 | 64 | 128 | 8 | 8 | 32 | 32 | 32 |
| Colistin | 10µg | ≥8 | 128 | 128 |
128 |
32 | 4 | 4 | 4 | 4 | 4 | 64 | 32 | 4 |
| Tetracycline | 30µg | ≥16 | 64 | 32 |
64 |
64 | 128 | 128 | 128 | 32 | 64 | 32 | 32 | 32 |
| Tigecycline | 15µg | ≥8 | 4 | 4 |
8 |
8 | 4 | 4 | 8 | 4 | 8 | 4 | 4 | 4 |
| Fisfomycin | 200 μg | ≥64 | 512 | 256 |
128 |
128 | 128 | 256 | 512 | 128 | 256 | 128 | 128 | 128 |
Disclaimer/Publisher’s Note: The statements, opinions and data contained in all publications are solely those of the individual author(s) and contributor(s) and not of MDPI and/or the editor(s). MDPI and/or the editor(s) disclaim responsibility for any injury to people or property resulting from any ideas, methods, instructions or products referred to in the content. |
© 2024 by the authors. Licensee MDPI, Basel, Switzerland. This article is an open access article distributed under the terms and conditions of the Creative Commons Attribution (CC BY) license (https://creativecommons.org/licenses/by/4.0/).


