I. Introduction
According to the Centre for Disease Control and Prevention (CDCP), each year, up to 400 million people get infected with dengue and approximately 100 million people get sick from infection, and 40,000 die from severe dengue. One-half of the world population is predicted to be affected in 2080 by dengue [
1,
2,
3,
4,
5]. The virus that causes dengue fever is transmitted by the
Aedes aegypti mosquito. Because dengue fever is spread by mosquitos, it is linked to weather and environmental factors such as temperature, precipitation, and vegetation. Increasing temperatures may worsen the problem by allowing dengue fever to spread and spread faster in low-risk or dengue-free areas of Asia, Europe, North America, and Australia. To keep patients okay, supportive care is the main thing. As a consequence, forecasting dengue epidemics is critical. With this forecast, health authorities throughout the world may take preventative actions to treat dengue fever before it spreads, potentially saving millions of lives.
Therefore, this study aims to find the most efficient model for predicting dengue cases. So—that it can prevent a dengue outbreak by accurately forecasting an increase in dengue cases. To achieve our goal—we have utilized preprocessing techniques such as the mean method to fill the null data. Correlation also has been applied to select proper features which are more connected with the dengue incidence. Then, we have used Machine Learning (ML) [
6,
7,
8,
9,
10,
11,
12] methods to predict dengue cases. One more thing we have added is we worked with weather data so the predictions depend on the weather.
The rest of the study is organized as follows—Section II is all about related works which have been on the same topics. Section III contains dataset overview. Section IV contains the methodology, while Section V has the results and analysis, followed by the conclusion and future work in Section VI.
III. Data Analysis
In this study, we utilized data sourced from the driven data [
21] repository, comprising dengue case and meteorological datasets. The dataset encompasses 1456 records, each characterized by 24 features. Key features include location, temperature, precipitation, humidity, vegetation index, alongside the total dengue cases. Notably, the dataset covers two distinct cities of Peru—Sanjuan and Iquitos, from which meteorological data is sourced, indicating the correlation between mosquito activity and dengue occurrence. This dataset, structured on a weekly basis, serves as a foundation for forecasting dengue outbreaks as shown in Table I. Sanjuan's data, spanning from 1999 to 2008, encompasses 936 records, detailing the impact of dengue cases, with Sanjuan being one of the most significantly affected cities. Conversely, the Iquitos dataset spans from 2000 to 2010, consisting of 520 recordings—reflecting a comparatively lesser impact of dengue. Our analysis focuses on both cities individually, facilitating the construction of our predictive model.
Table I.
DENGUE CASES.
| Data Timelines |
Total Records |
Feature |
| 1999-2008 (Sun Juan) |
936 |
24 |
| 2000-2010 (Iquitos) |
520 |
24 |
IV. Methodology
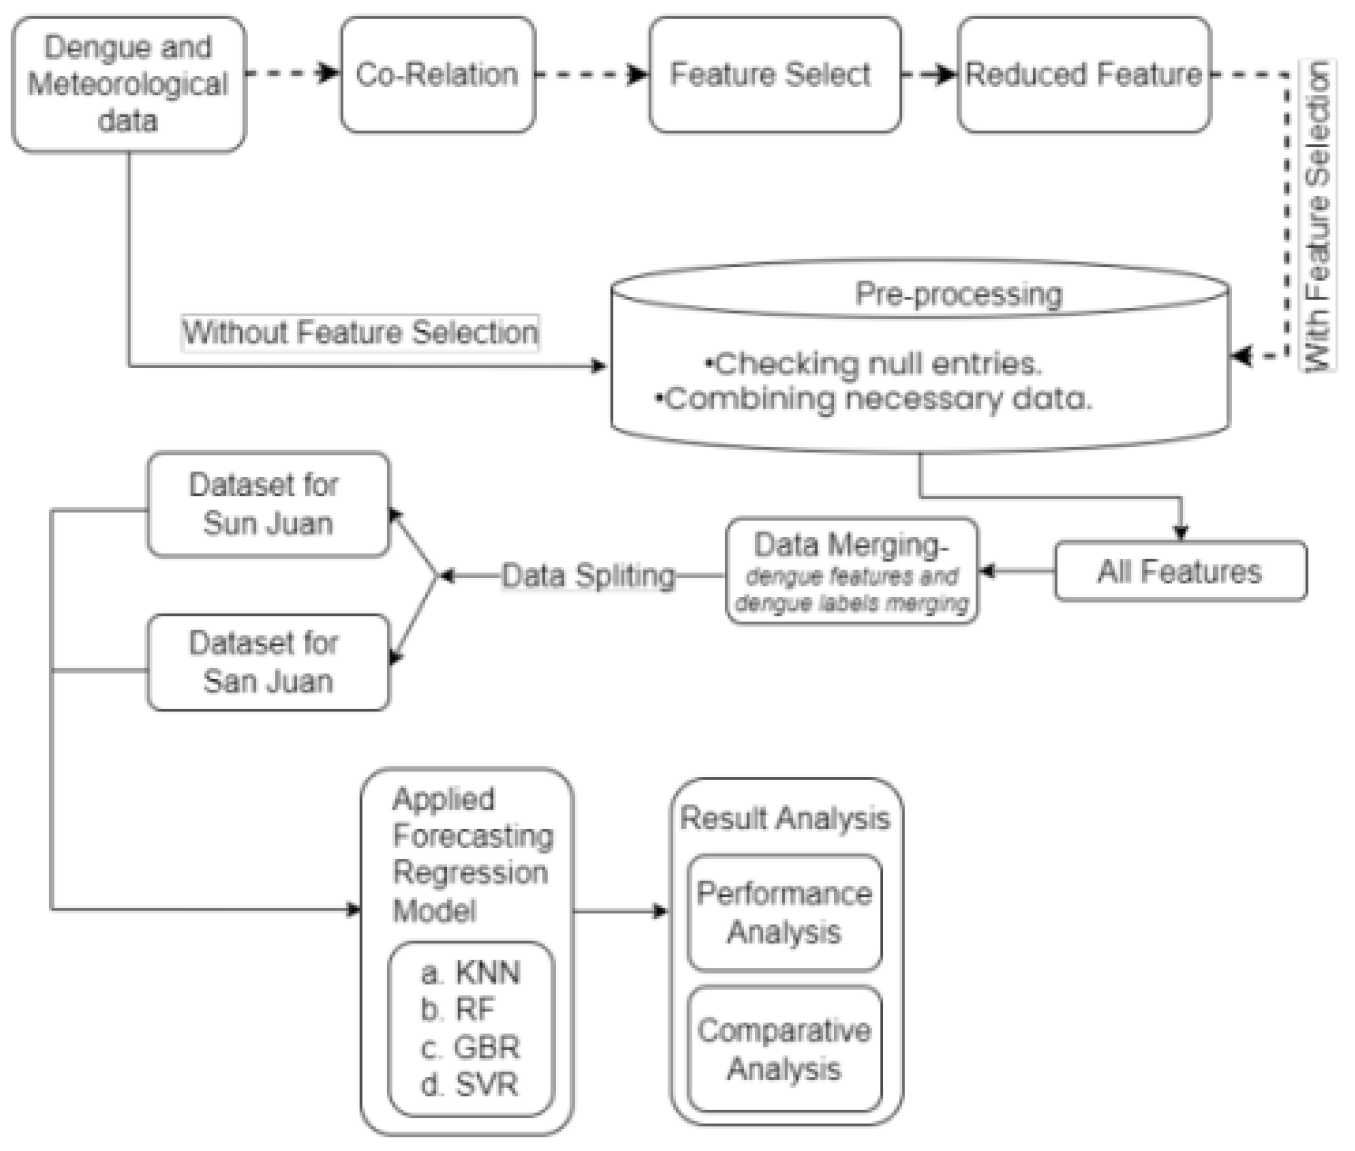
In the realm of data analysis, data mining serves as the fundamental process of scrutinizing vast repositories of past data to extrapolate insights and forecast outcomes for new instances. Our study employs regression analysis as a pivotal tool to prognosticate the incidence of dengue cases in specific scenarios, leveraging a pre-existing dataset as shown in
Figure 1. Initially, we conducted regression analysis comprehensively across the entire dataset. Subsequently, upon discerning correlations, we selectively pruned features exhibiting lesser correlation with the target variable. Thereafter, we iterated the regression analysis to derive enhanced predictive capabilities, facilitating an in-depth exploration of performance metrics and conducting a meticulous comparative analysis. Therefore, in the initial stage, the entire dataset undergoes a preprocessing phase aimed at ensuring data integrity. This involves scrutinizing for any missing entries, which, if detected, are imputed with the mean value corresponding to the respective feature. Subsequently, temperature measurements, initially recorded in Kelvin, are uniformly converted to the Centigrade scale. Precision is maintained by rounding all values to three decimal places. Any essential data points are amalgamated, taking their average when necessary. Following this preparation, the dengue-related features are consolidated with the total reported dengue cases. Since the incidence of dengue in San Juan and Iquitos exhibits independence, separate dataframes are created for each locality. These dataframes are further partitioned into distinct sets for training and testing purposes. Subsequently, four distinct regression models—namely, K Neighbors Regressor (KNN), RF, GBR, and Support Vector Regressor (SVR)—are applied to the dataset for forecasting. Finally, the performance of these models is calculated via Equation (1).
where 𝑛 represents the total number of samples,
denotes the actual values, and
represents the predicted values. Subsequently, in the second scenario, we initiate the process by evaluating the correlations of each feature concerning the total instances of dengue cases. Following this, features exhibiting notably low or negative correlations are subjected to optimization. Post feature selection, the procedure mirrors that of the first case. Subsequent to this methodology, we conduct a comparative analysis of the outcomes to discern the optimal result and model for the specified objective.
A. Feature Selection
Understanding the relationships between different attributes within a dataset is crucial. In our analysis, the focal point is the attribute 'total case', which signifies the total instances of dengue within a specific timeframe. Our task involves assessing the correlation of each attribute with 'total case'. This correlation analysis was conducted using statistical functions available in Excel, which calculate the correlation coefficient between pairs of variables. The formula utilized for this purpose is expressed in Equation (2).
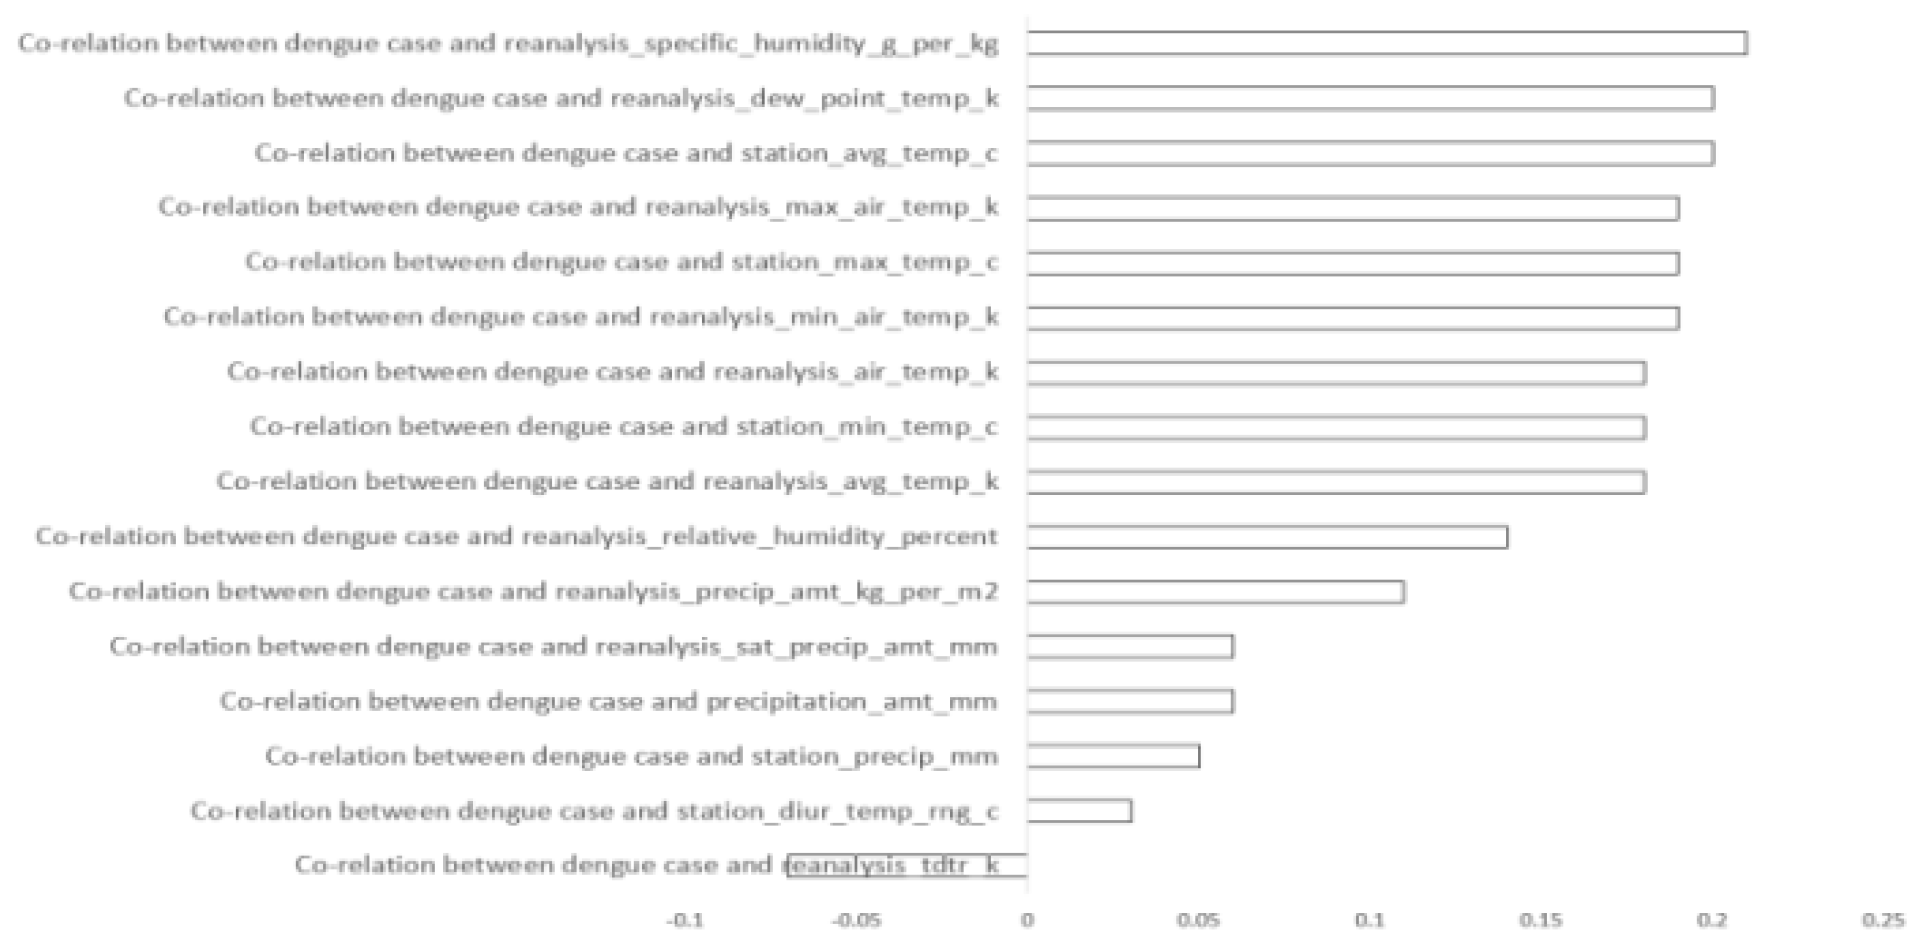
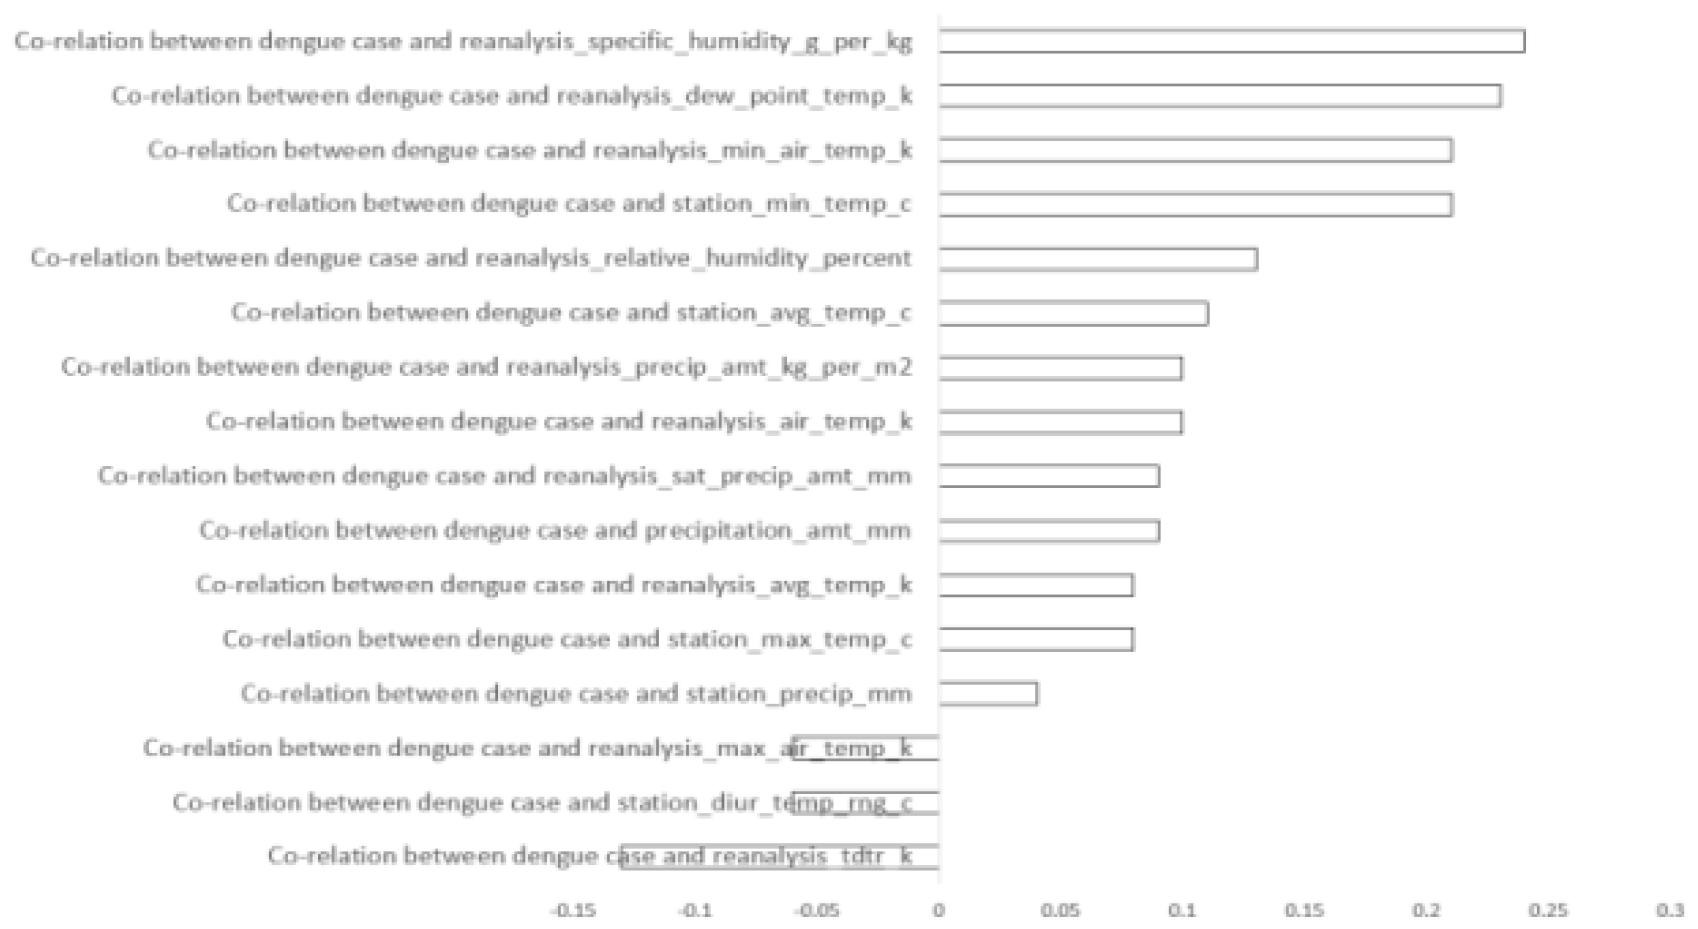
Following the application of Equation (2), we identified certain attributes that demonstrated weaker connections with dengue occurrences than desired. Consequently, attributes exhibiting negative correlations or minimal positive correlations were excluded from further consideration. As a result, for the San Juan dataset, out of the initial 16 features, 11 were retained for experimentation as shown in
Figure 2. Similarly, for the Iquitos dataset, 8 out of the 16 features were retained for experimentation as shown in
Figure 3.
B. Model Analysis
In our study, we undertook two preprocessing approaches for our dataset. Initially, we processed the dataset without considering correlation among its features. Subsequently, we processed the dataset accounting for correlated features. It's noteworthy that our dataset contained some missing values, the elimination of which could compromise its authenticity. Addressing missing data poses several challenges, and various techniques exist for this purpose. For our study, we opted to handle the missing data by employing a mean-based method. This method involves filling the missing values with the mean of the respective features. This approach ensures that the integrity of our dataset is maintained while mitigating the impact of missing values on our analyses. However, the concept of ML is wide and uses various algorithms which are employed to predict values or outcomes based on given data [
22,
23,
24,
25]. One such algorithm is the KNN, which determines the value of new data points by comparing them with similar points in the training set. This method relies on the assumption that data generated consistently exhibits recurring patterns. Another widely used algorithm is the RF, developed as an evolution of the bagging concept. RF combines the results of multiple decision trees to produce a final output. Despite its flexibility for tuning, RF often performs well with default settings. The GBR is another ensemble learning technique that sequentially improves upon weak decision trees. By incrementally adding models to the ensemble, GBR aims to enhance accuracy. Whereas, SVR is a supervised learning model used for classification and regression analysis. SVR aims to fit errors within a defined threshold, approximating the best value within a given margin known as the ε-tube. It utilizes a ε-insensitive loss function to penalize predictions deviating too far from the desired output [
26,
27,
28,
29,
30,
31].
V. Result Analysis
The experimentation in this study involved the utilization of four distinct ML model techniques as shown in Table II. Initially, employing the KNN regressor model on a preprocessed dataset yielded a MAE of 19.90 for Sanjuan and 5.52 for Iquitos. Subsequently, employing the RF model resulted in MAE values of 20.56 for Sanjuan and 5.41 for Iquitos in the second trial. Following this, the GBR was utilized, producing MAE values of 21.69 for Sanjuan and 5.39 for Iquitos. Lastly, the SVR was implemented, yielding MAE values of 26.70 for Sanjuan and 4.03 for Iquitos. Prior to feature selection, it was observed that KNN exhibited superior performance for Sanjuan, whereas SVR demonstrated better results for Iquitos. Subsequent to feature selection, notable improvements were witnessed across both cities. KNN emerged as the optimal model for Sanjuan, achieving an MAE of 16.88, while SVR proved to be the superior choice for Iquitos, with an MAE of 4.54. For Sanjuan, MAE values of 1.34, 17.14, and 19.92 were obtained utilizing RF, GBR, and SVR models, respectively. Conversely, for Iquitos, MAE values of 5.14, 5.21, and 5.58 were recorded for KNN, RF, and GBR models, respectively. Ultimately, based on the comprehensive results obtained for both cities, KNN emerged as the most effective model for this study.
Table II.
THE COMPARISON OF MAE BEFORE AND AFTER FEATURE SELECTION.
Table II.
THE COMPARISON OF MAE BEFORE AND AFTER FEATURE SELECTION.
| Model |
Before Feature Selection |
After Feature Selection |
| San Juan |
Iquitos |
San Juan |
Iquitos |
| KNN |
19.90 |
5.52 |
16.88 |
5.14 |
| RF |
20.56 |
5.41 |
17.34 |
5.21 |
| GBR |
21.69 |
5.39 |
17.14 |
5.58 |
| SVR |
26.70 |
4.03 |
19.92 |
4.54 |
A. Result Comparison
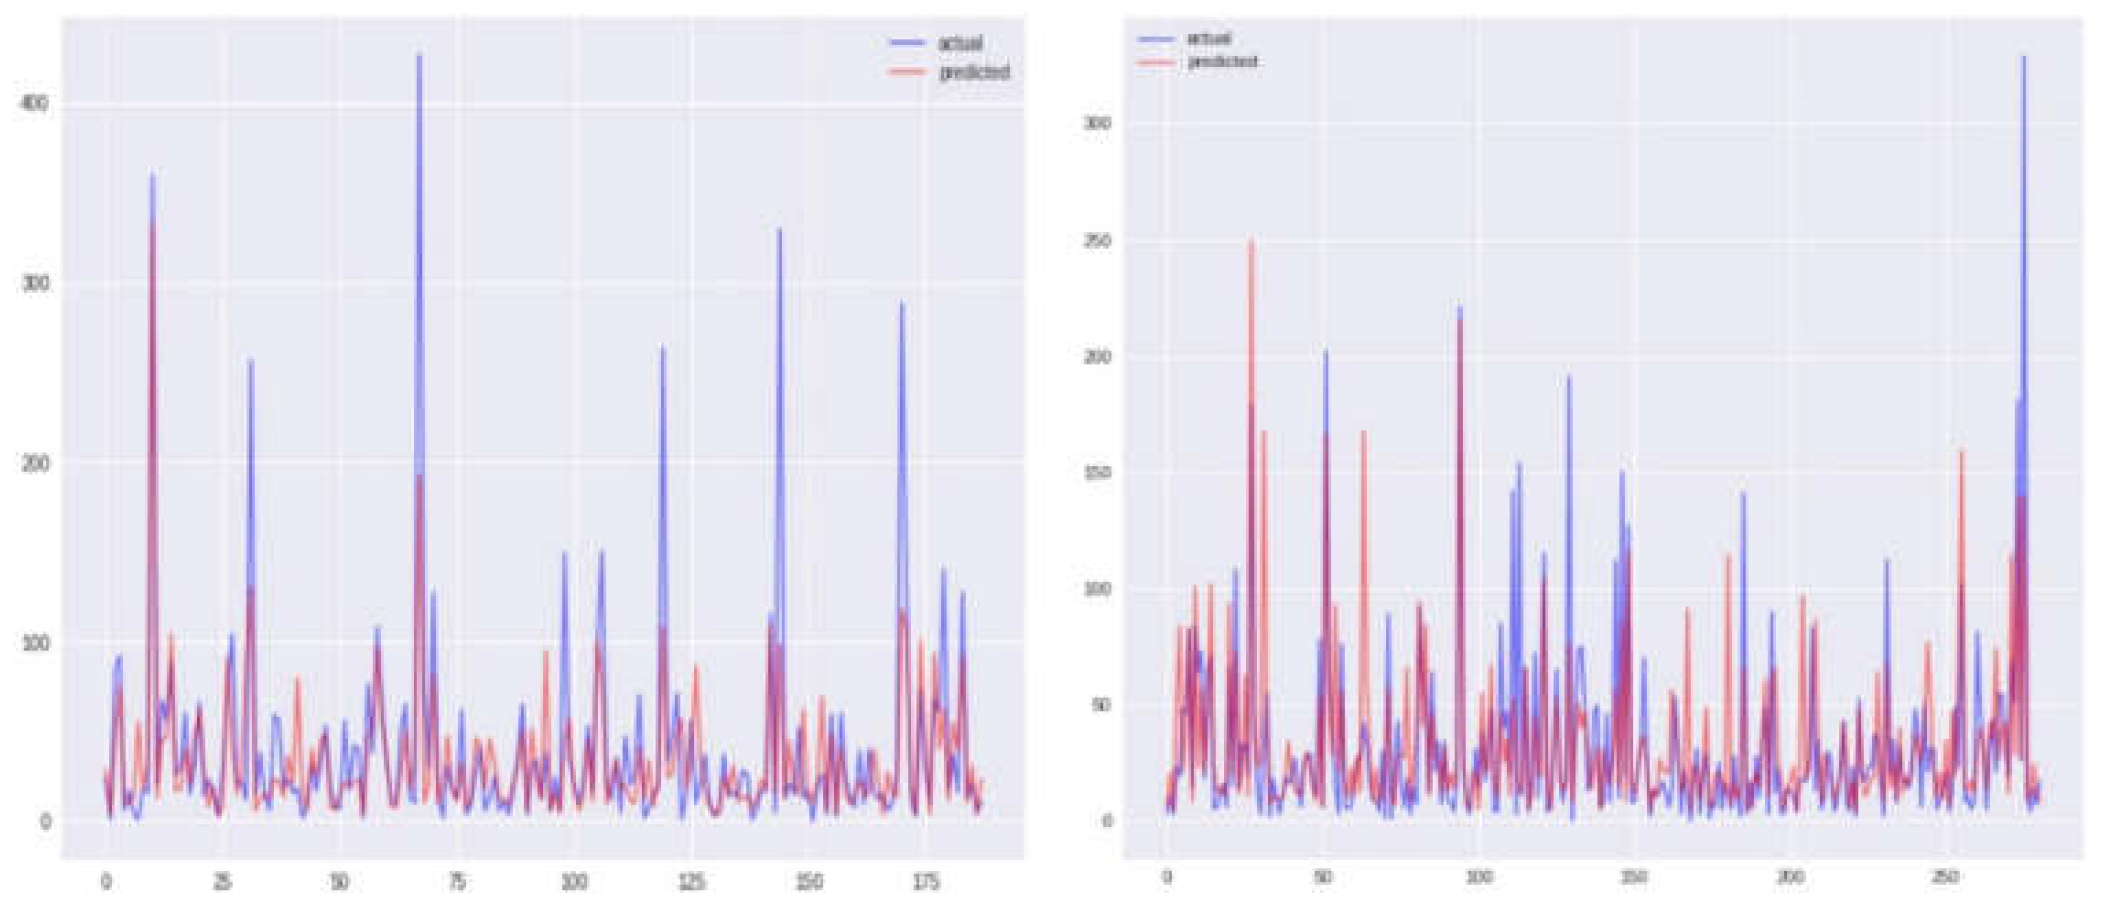
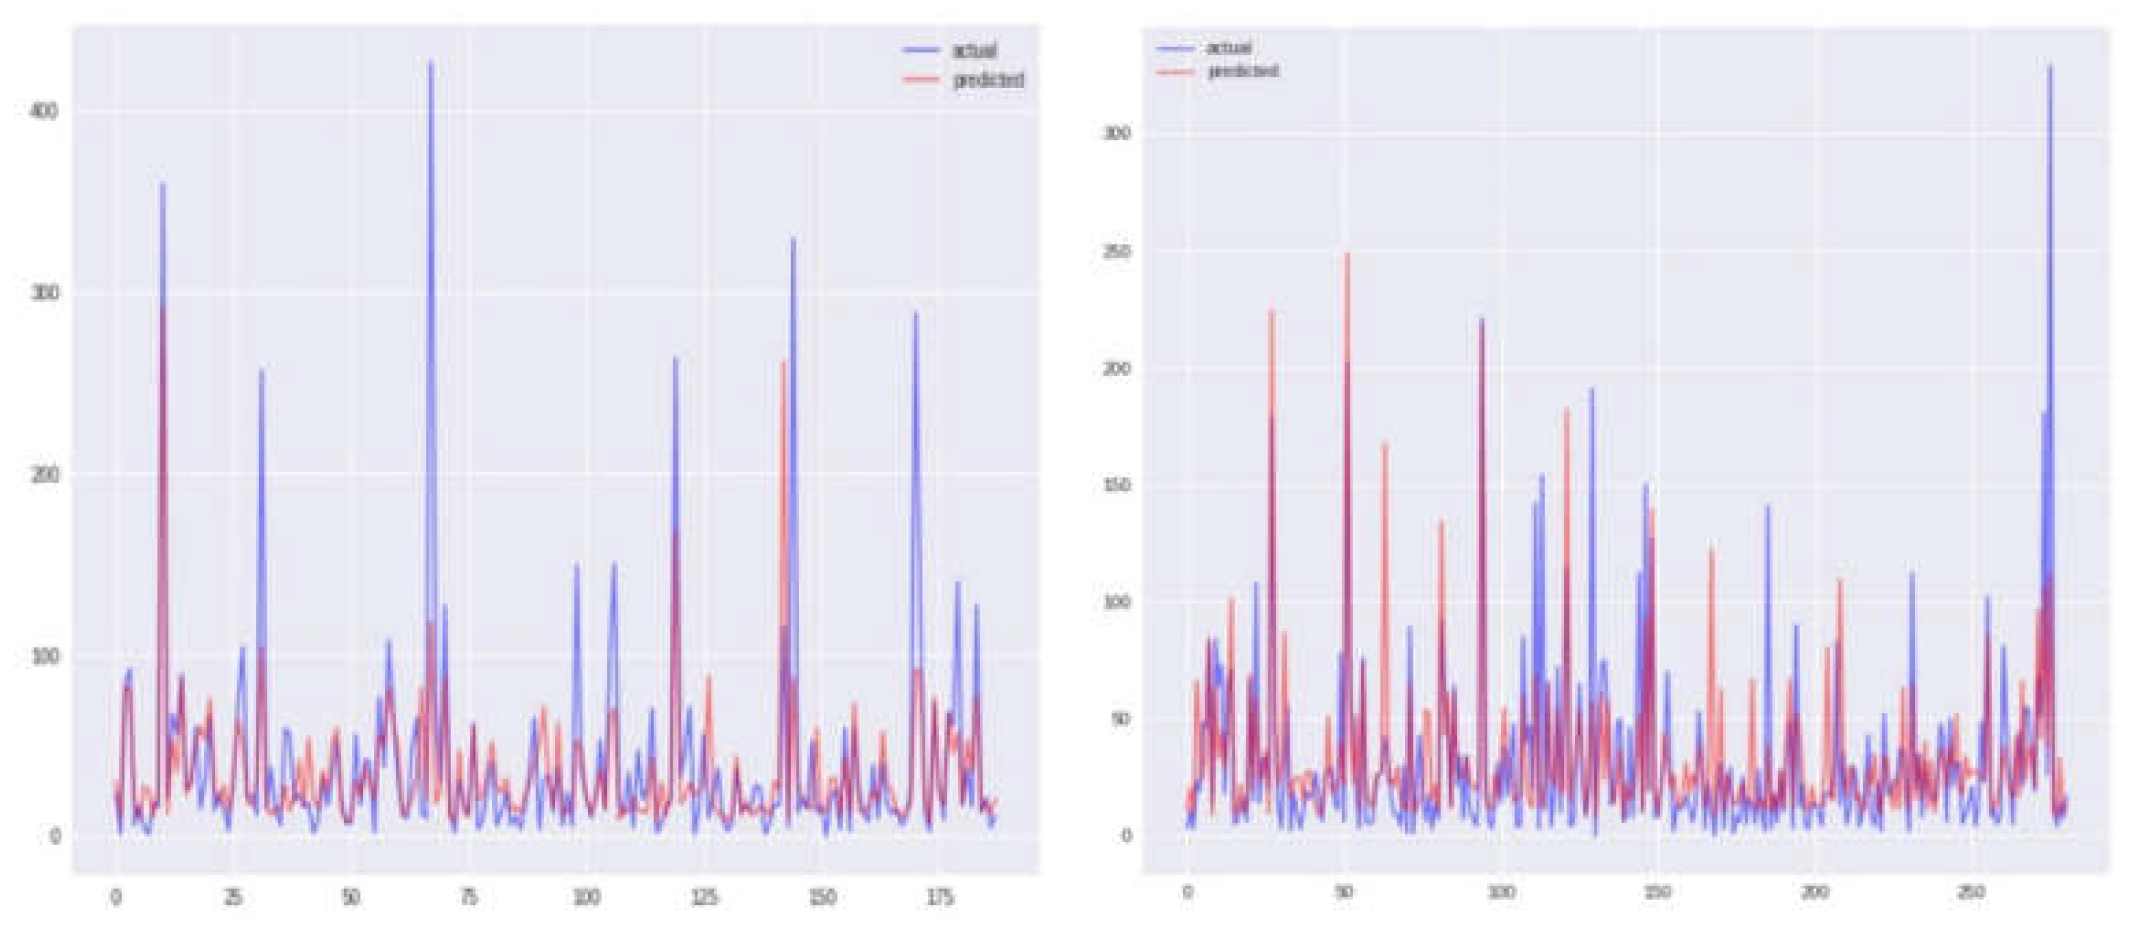
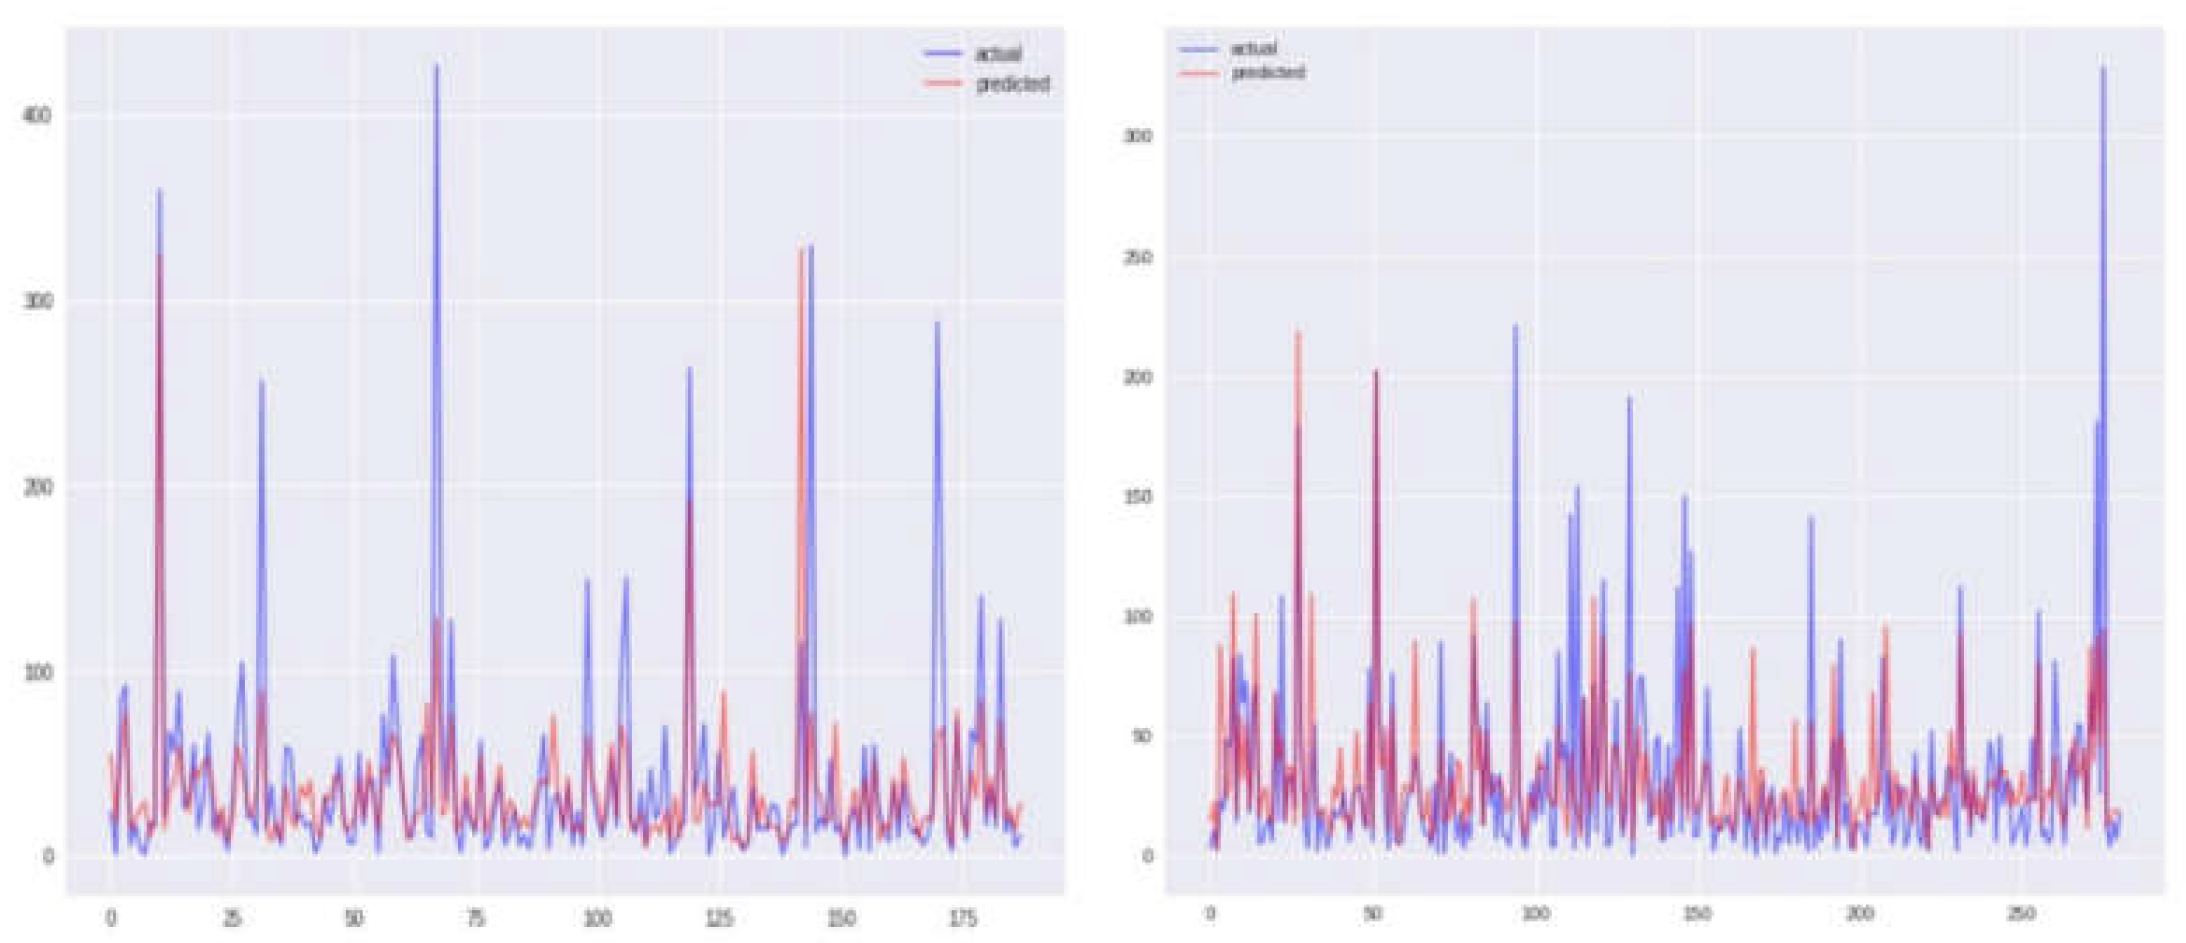
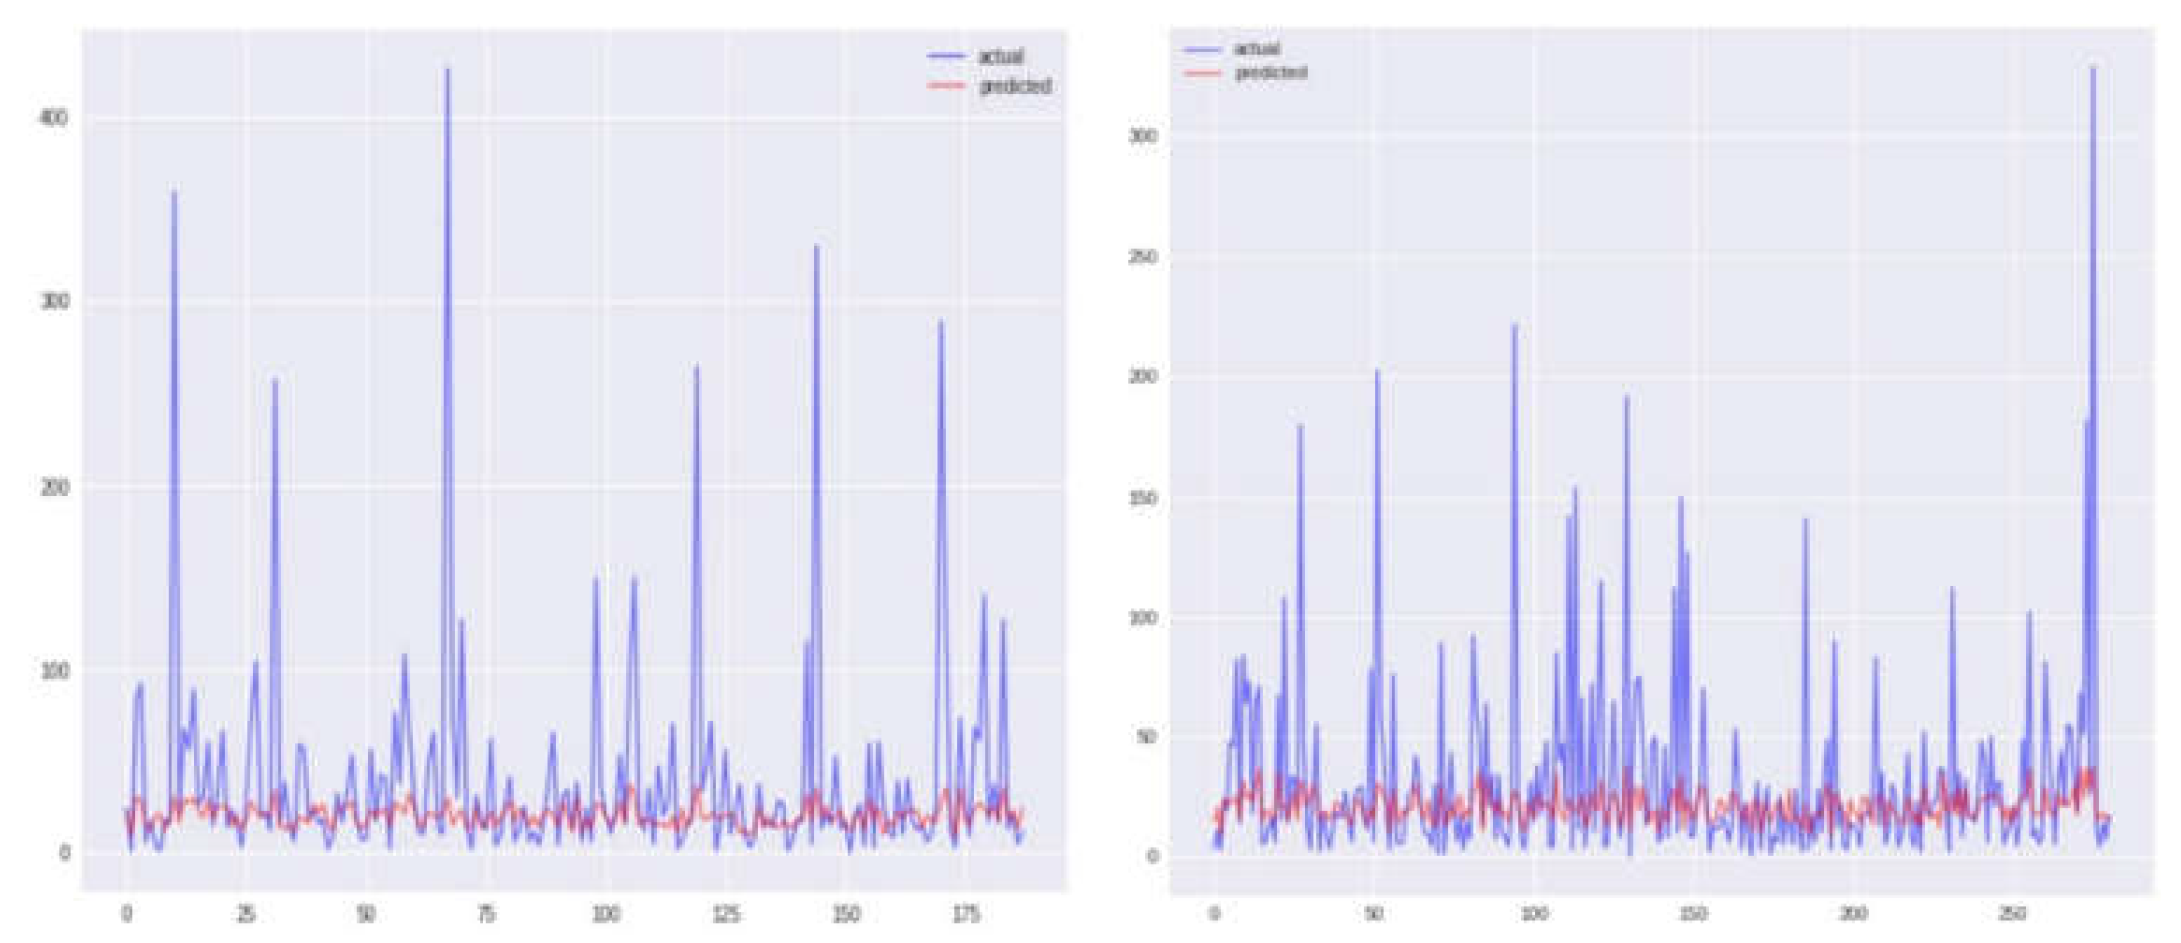
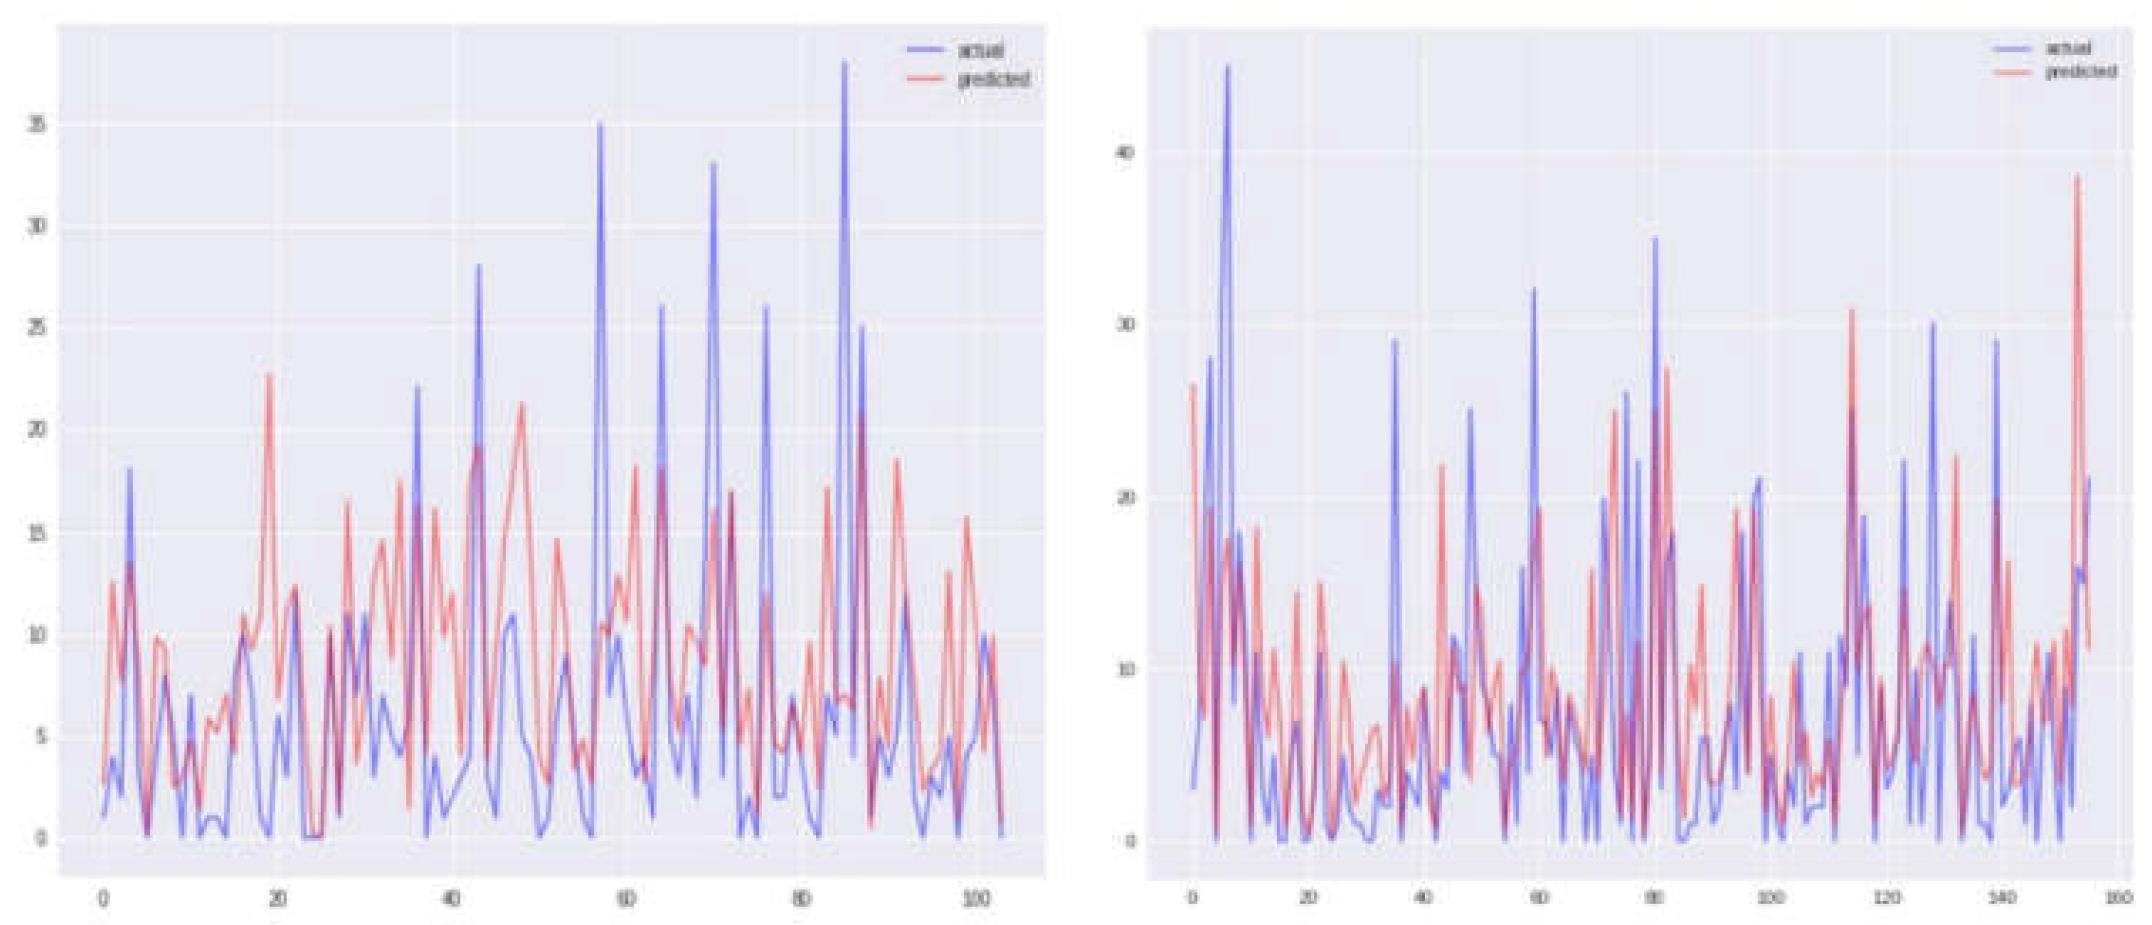
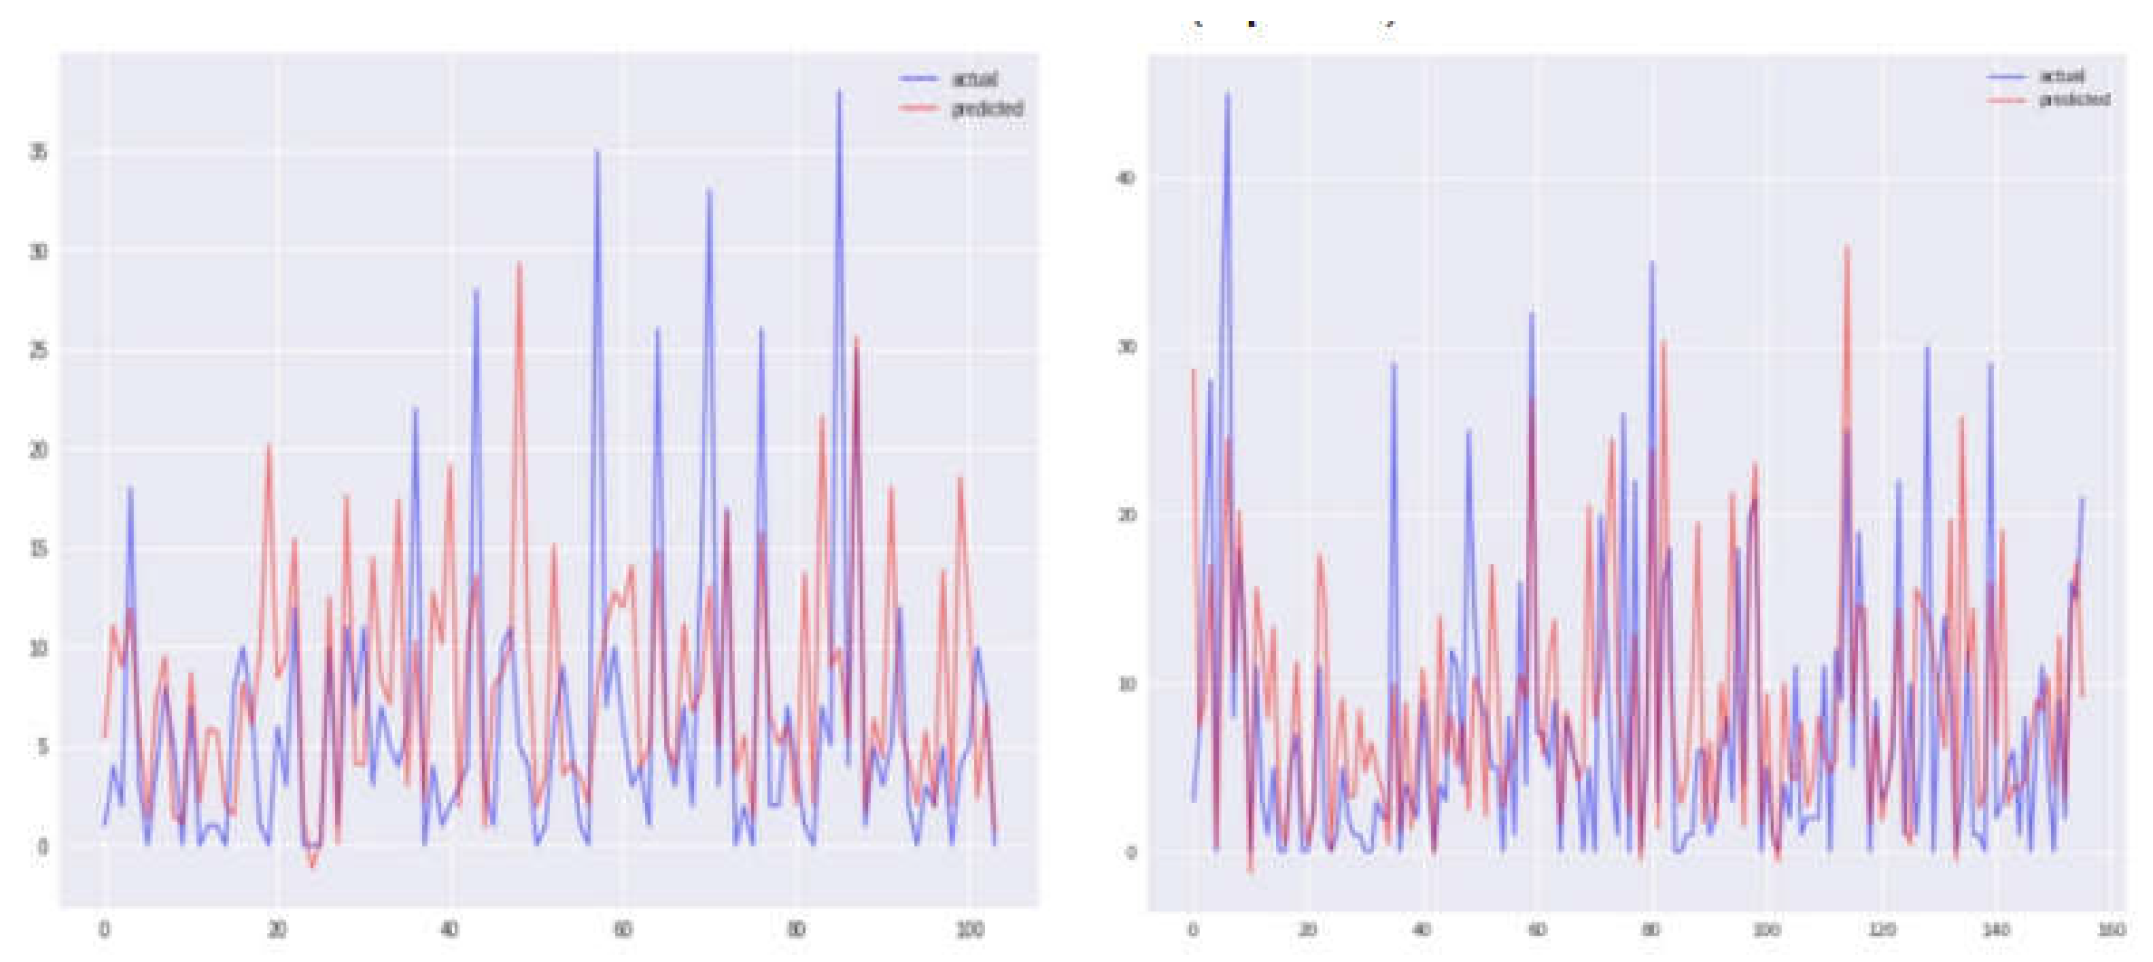
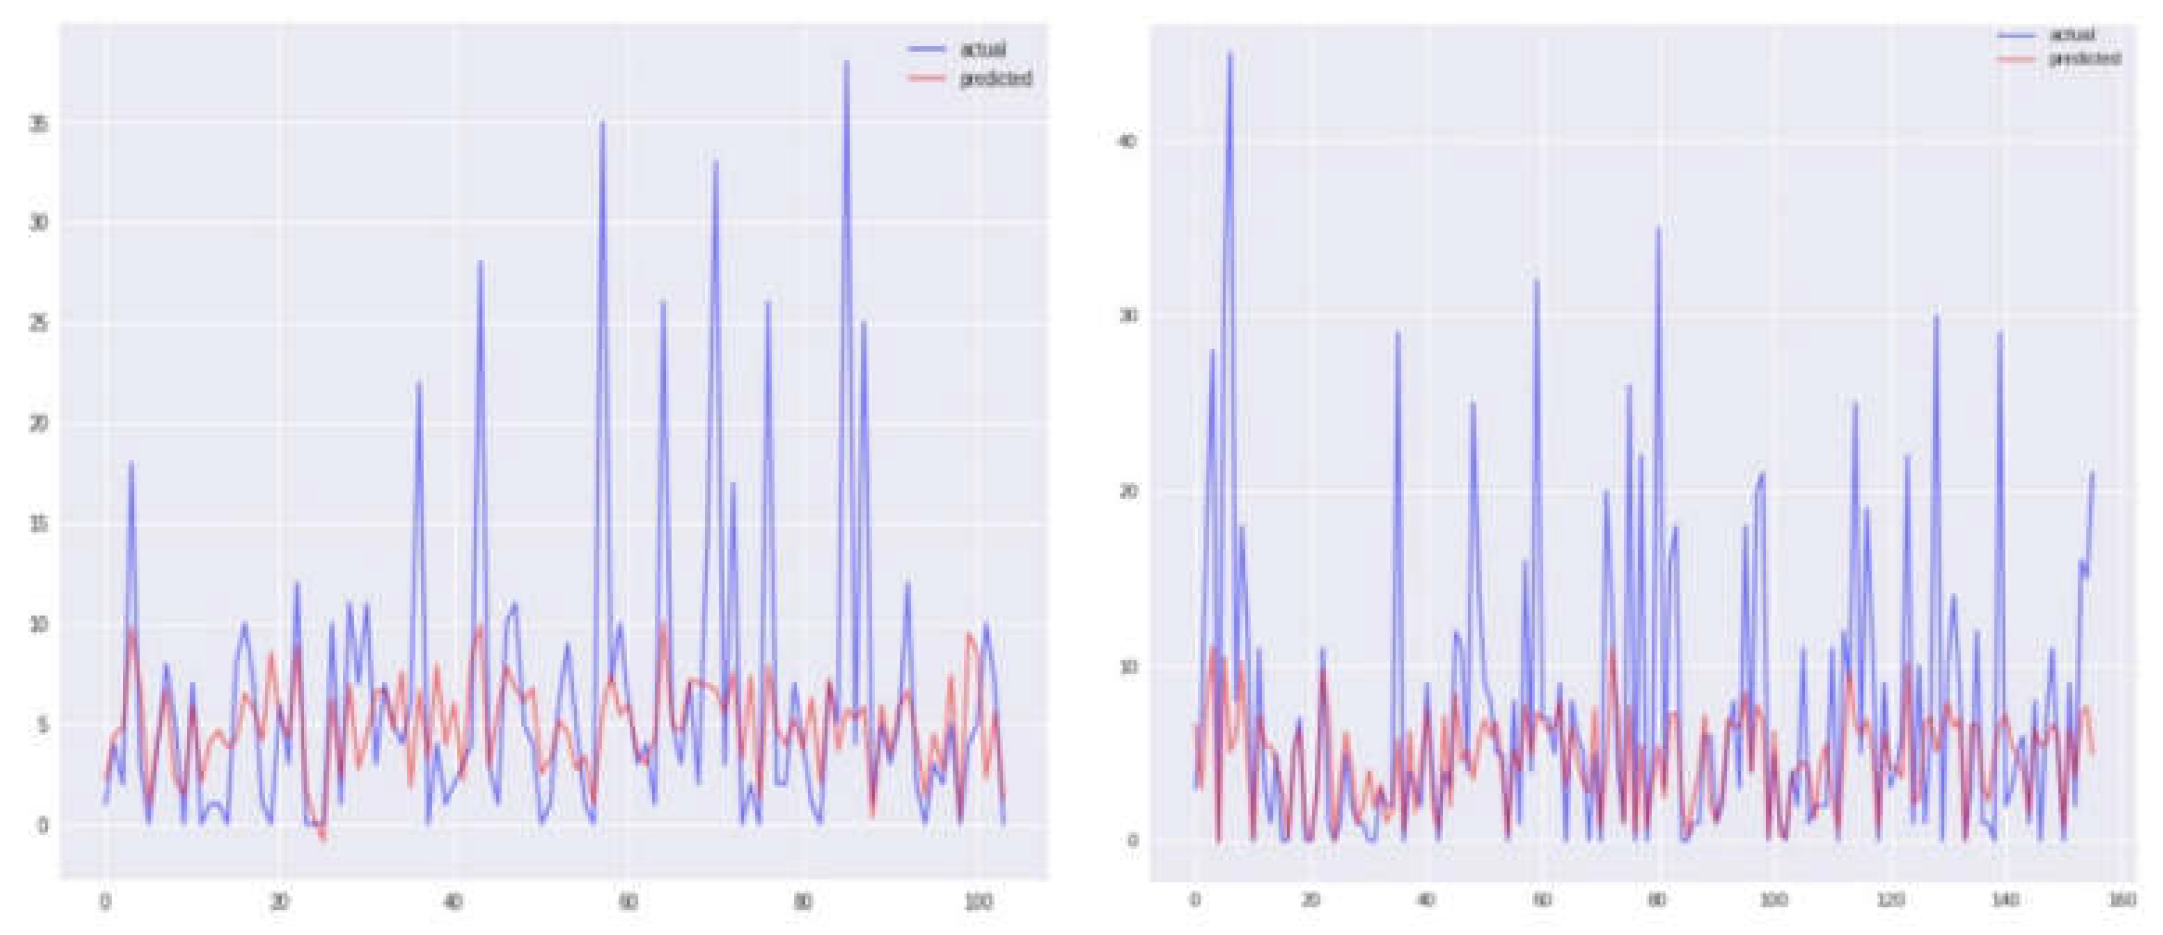
Graphical representations of Sanjuan city for each of the four models, namely KNN, SVR, and two others, are depicted in
Figure 4,
Figure 5,
Figure 6 and
Figure 7, displaying both the actual and predicted values. Notably,
Figure 4 illustrates a closer alignment between the actual and predicted values compared to the other figures, suggesting the superior performance of the KNN model in this context. Transitioning to the assessment of Iquitos city,
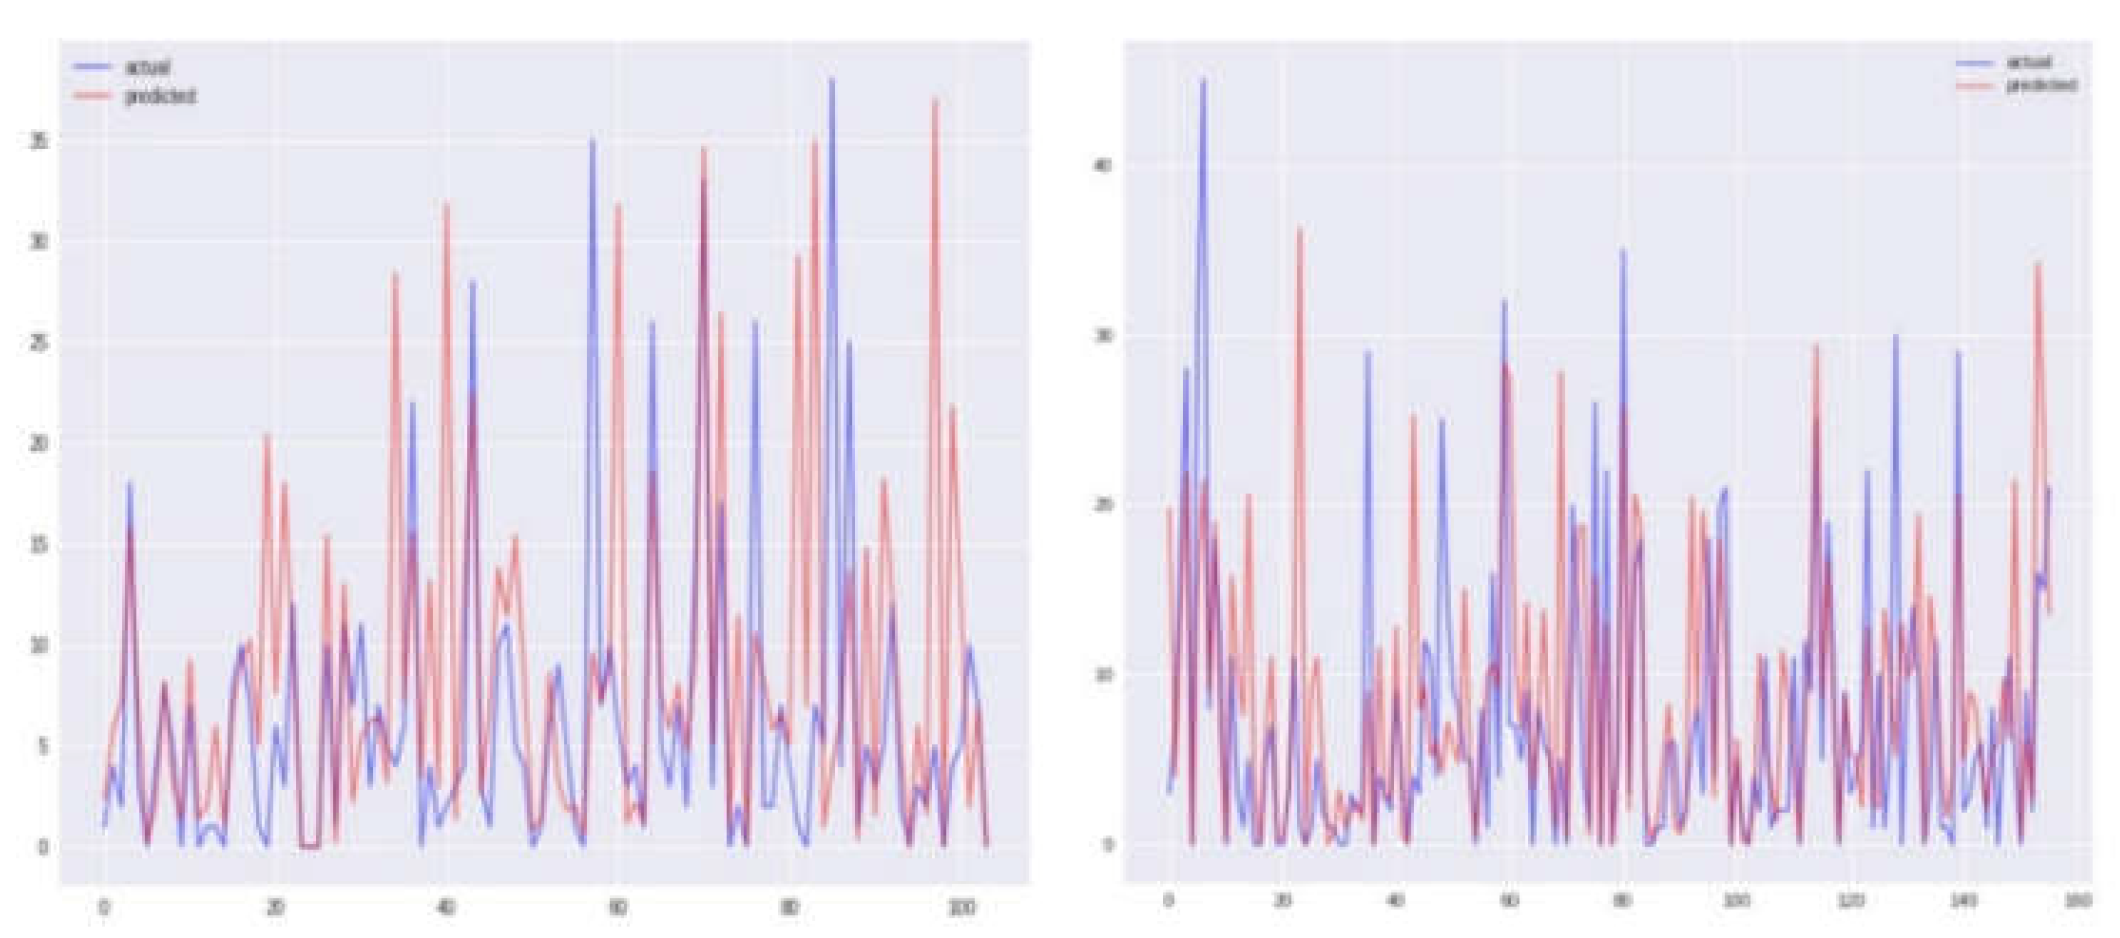
Figure 8,
Figure 9,
Figure 10 and
Figure 11 offer graphical insights for each of the four models alongside the respective actual and expected values. It is evident from
Figure 11 that the values exhibit greater proximity, indicating the enhanced efficacy of the SVR model for this city. Our findings are contextualized within the broader landscape of existing research, with comparisons made to prior studies utilizing the same dataset [
14] as shown in Table III. Through this comparative analysis, we affirm the merit of our approach, yielding outcomes that not only meet but exceed previous benchmarks. Furthermore, our endeavor extends beyond replication, as we introduce and successfully implement a novel model, thereby achieving significant advancements in predictive accuracy.
Table III.
COMPARISON BETWEEN OUR VS [
14].
Table III.
COMPARISON BETWEEN OUR VS [
14].
| Model |
OUR PAPER |
[14] |
| San Juan |
Iquitos |
San Juan |
Iquitos |
| KNN |
16.88 |
5.14 |
— |
— |
| RF |
17.34 |
5.21 |
26.66 |
6.70 |
| GBR |
17.14 |
5.58 |
24.11 |
25.98 |
| SVR |
19.92 |
4.54 |
— |
— |
VI. Conclusion and Future Works
In our study, we focused on analyzing a continuous dataset, which encompasses quantitative measurements including decimals and fractions, such as height, weight, and temperature. Due to the nature of our dataset, which doesn't lend itself to classification, we couldn't employ traditional classification models. Dengue, a disease affecting diverse populations, served as the focal point of our research. Leveraging ML techniques, we devised an intelligent system aimed at predicting dengue incidence based on variations in weather conditions using real-world data. Our investigation revealed a significant correlation between dengue incidence and climate variability in the selected cities. Interestingly, the primary climate factor influencing dengue incidence varied between the cities. Our findings underscore the efficacy of our forecasting model, with KNN emerging as the top performer among the evaluated models. It achieved a minimum MAE with the predominant models signifies the development of a robust forecasting framework for dengue incidence prediction.
Funding
No funds, grants, or other support was received.
Data Availability
Data will be made on reasonable request.
Conflict of Interest
The authors declare that they have no known competing for financial interests or personal relationships that could have appeared to influence the work reported in this paper.
Code Availability
Code will be made on reasonable request.
References
- V. Kanaparthi, “Credit Risk Prediction using Ensemble Machine Learning Algorithms,” in 6th International Conference on Inventive Computation Technologies, ICICT 2023 - Proceedings, 2023, pp. 41–47. [CrossRef]
- V. Kanaparthi, “Evaluating Financial Risk in the Transition from EONIA to ESTER: A TimeGAN Approach with Enhanced VaR Estimations,” Jan. 2024. [CrossRef]
- V. Kanaparthi, “AI-based Personalization and Trust in Digital Finance,” Jan. 2024, Accessed: Feb. 04, 2024. [Online]. Available: https://arxiv.org/abs/2401.15700v1.
- V. Kanaparthi, “Exploring the Impact of Blockchain, AI, and ML on Financial Accounting Efficiency and Transformation,” Jan. 2024, Accessed: Feb. 04, 2024. [Online]. Available: https://arxiv.org/abs/2401.15715v1.
- V. Kanaparthi, “Robustness Evaluation of LSTM-based Deep Learning Models for Bitcoin Price Prediction in the Presence of Random Disturbances,” Jan. 2024. [CrossRef]
- S. Wazir, G. S. Kashyap, and P. Saxena, “MLOps: A Review,” Aug. 2023, Accessed: Sep. 16, 2023. [Online]. Available: https://arxiv.org/abs/2308.10908v1.
- G. S. Kashyap, A. E. I. Brownlee, O. C. Phukan, K. Malik, and S. Wazir, “Roulette-Wheel Selection-Based PSO Algorithm for Solving the Vehicle Routing Problem with Time Windows,” Jun. 2023, Accessed: Jul. 04, 2023. [Online]. Available: https://arxiv.org/abs/2306.02308v1.
- G. S. Kashyap et al., “Revolutionizing Agriculture: A Comprehensive Review of Artificial Intelligence Techniques in Farming,” Feb. 2024. [CrossRef]
- G. S. Kashyap, D. Mahajan, O. C. Phukan, A. Kumar, A. E. I. Brownlee, and J. Gao, “From Simulations to Reality: Enhancing Multi-Robot Exploration for Urban Search and Rescue,” Nov. 2023, Accessed: Dec. 03, 2023. [Online]. Available: https://arxiv.org/abs/2311.16958v1.
- H. Habib, G. S. Kashyap, N. Tabassum, and T. Nafis, “Stock Price Prediction Using Artificial Intelligence Based on LSTM– Deep Learning Model,” in Artificial Intelligence & Blockchain in Cyber Physical Systems: Technologies & Applications, CRC Press, 2023, pp. 93–99. [CrossRef]
- G. S. Kashyap, K. Malik, S. Wazir, and R. Khan, “Using Machine Learning to Quantify the Multimedia Risk Due to Fuzzing,” Multimedia Tools and Applications, vol. 81, no. 25, pp. 36685–36698, Oct. 2022. [CrossRef]
- P. Kaur, G. S. Kashyap, A. Kumar, M. T. Nafis, S. Kumar, and V. Shokeen, “From Text to Transformation: A Comprehensive Review of Large Language Models’ Versatility,” Feb. 2024, Accessed: Mar. 21, 2024. [Online]. Available: https://arxiv.org/abs/2402.16142v1.
- Y. L. Cheong, P. J. Leitão, and T. Lakes, “Assessment of land use factors associated with dengue cases in Malaysia using boosted regression trees,” Spatial and Spatio-temporal Epidemiology, vol. 10, pp. 75–84, Jul. 2014. [CrossRef]
- C. Singh, A. V. Vidyapeetham, and T. S. Analysis, “Predicting Dengue Spread in San Juan and Iquitos,” no. December 2019, pp. 0–5, 2020. [CrossRef]
- K. G. S. Dharmawardana et al., “Predictive model for the dengue incidences in Sri Lanka using mobile network big data,” in 2017 IEEE International Conference on Industrial and Information Systems, ICIIS 2017 - Proceedings, Jul. 2017, vol. 2018-Janua, pp. 1–6. [CrossRef]
- A. Tate et al., “Prediction of Dengue , Diabetes and Swine Flu Using Random Forest Classification Algorithm,” International Research Journal of Engineering and Technology(IRJET), vol. 4, no. 6, pp. 685–690, 2017, Accessed: Apr. 26, 2024. [Online]. Available: www.irjet.net.
- P. Muhilthini, B. S. Meenakshi, S. L. Lekha, and S. T. Santhanalakshmi, “Dengue Possibility Forecasting Model using Machine Learning Algorithms,” International Research Journal of Engineering and Technology, pp. 1661–1665, 2018, Accessed: Apr. 26, 2024. [Online]. Available: www.irjet.net.
- 18. J. Ong et al., “Mapping dengue risk in Singapore using Random Forest,” PLoS Neglected Tropical Diseases, vol. 12, no. 6, p. e0006587, Jun. 2018. [CrossRef]
- N. Rachata, P. Charoenkwan, T. Yooyativong, K. Chamnongthai, C. Lursinsap, and K. Higuchi, “Automatic prediction system of dengue haemorrhagic-fever outbreak risk by using entropy and artificial neural network,” in 2008 International Symposium on Communications and Information Technologies, ISCIT 2008, 2008, pp. 210–214. [CrossRef]
- P. H.M.NishanthiHerath, A. A. I. Perera, and H. P. Wijekoon, “Prediction of Dengue Outbreaks in Sri Lanka using Artificial Neural Networks,” International Journal of Computer Applications, vol. 101, no. 15, pp. 1–5, 2014. [CrossRef]
- Driven Data, “Competition: DengAI: Predicting Disease Spread,” 2017. https://www.drivendata.org/competitions/44/dengai-predicting-disease-spread/ (accessed Apr. 26, 2024).
- V. Kanaparthi, “Examining Natural Language Processing Techniques in the Education and Healthcare Fields,” International Journal of Engineering and Advanced Technology, vol. 12, no. 2, pp. 8–18, Dec. 2022. [CrossRef]
- V. K. Kanaparthi, “Examining the Plausible Applications of Artificial Intelligence & Machine Learning in Accounts Payable Improvement,” FinTech, vol. 2, no. 3, pp. 461–474, Jul. 2023. [CrossRef]
- V. K. Kanaparthi, “Navigating Uncertainty: Enhancing Markowitz Asset Allocation Strategies through Out-of-Sample Analysis,” Dec. 2023. [CrossRef]
- V. Kanaparthi, “Transformational application of Artificial Intelligence and Machine learning in Financial Technologies and Financial services: A bibliometric review,” Jan. 2024. [CrossRef]
- S. Wazir, G. S. Kashyap, K. Malik, and A. E. I. Brownlee, “Predicting the Infection Level of COVID-19 Virus Using Normal Distribution-Based Approximation Model and PSO,” Springer, Cham, 2023, pp. 75–91. [CrossRef]
- G. S. Kashyap et al., “Detection of a facemask in real-time using deep learning methods: Prevention of Covid 19,” Jan. 2024, Accessed: Feb. 04, 2024. [Online]. Available: https://arxiv.org/abs/2401.15675v1.
- N. Marwah, V. K. Singh, G. S. Kashyap, and S. Wazir, “An analysis of the robustness of UAV agriculture field coverage using multi-agent reinforcement learning,” International Journal of Information Technology (Singapore), vol. 15, no. 4, pp. 2317–2327, May 2023. [CrossRef]
- G. S. Kashyap, A. Siddiqui, R. Siddiqui, K. Malik, S. Wazir, and A. E. I. Brownlee, “Prediction of Suicidal Risk Using Machine Learning Models.” Dec. 25, 2021. Accessed: Feb. 04, 2024. [Online]. Available: https://papers.ssrn.com/abstract=4709789.
- M. Kanojia, P. Kamani, G. S. Kashyap, S. Naz, S. Wazir, and A. Chauhan, “Alternative Agriculture Land-Use Transformation Pathways by Partial-Equilibrium Agricultural Sector Model: A Mathematical Approach,” Aug. 2023, Accessed: Sep. 16, 2023. [Online]. Available: https://arxiv.org/abs/2308.11632v1.
- S. Naz and G. S. Kashyap, “Enhancing the predictive capability of a mathematical model for pseudomonas aeruginosa through artificial neural networks,” International Journal of Information Technology 2024, pp. 1–10, Feb. 2024. [CrossRef]
|
Disclaimer/Publisher’s Note: The statements, opinions and data contained in all publications are solely those of the individual author(s) and contributor(s) and not of MDPI and/or the editor(s). MDPI and/or the editor(s) disclaim responsibility for any injury to people or property resulting from any ideas, methods, instructions or products referred to in the content. |
© 2024 by the authors. Licensee MDPI, Basel, Switzerland. This article is an open access article distributed under the terms and conditions of the Creative Commons Attribution (CC BY) license (http://creativecommons.org/licenses/by/4.0/).
