
Submitted:
28 April 2024
Posted:
29 April 2024
You are already at the latest version
Abstract
In recent years there has been a clear increase in bottled water consumption, globally which translates to significant health and environmental concerns. This cross-sectional study aims to understand the attitude and preferences of university students in Qatar towards use of bottled and tap water for drinking purposes using an online survey questionnaire. The number of students who responded to the online survey was 14% of the entire student population within the university (n = 688). Overall, majority of the students reported plastic bottled water as the main source of drinking water they preferred to use on campus (n=468; 68.02%), with a higher proportion of females (72.08%) preferring the use of plastic bottled water. Out of the 468 students who preferred plastic bottled water, safety was the most important factor (43.80%) followed by convenience (16.88%) and taste (15.60%). Cost (15.17%), personal/family habits (5.13%), Environmental concerns (2.14%) and minerals (1.28%) were found to be the least important factors. Among the 45 students who preferred tap water over plastic bottled water, cost (46.67%) was the dominant factor followed by convenience (20.00%) and environmental concerns and safety (13.33% each), taste (4.44%), and personal/family habits (2.22%). This study recommends campaigns to focus on attitude and behavior change and not solely emphasize knowledge; 71.7% believed that plastic water bottles are more harmful to the environment, yet the greater majority still resorted to this source. There is an immediate need to further educate students through environmental and health literacy programs on water consumption and quality. Enabling the population to understand the positive and negative aspects of their choices, may be an effective remedy to ensuring a healthy population and healthy environment.
Keywords:
bottled water
; tap water
; drinking water
; university students
; attitude
; preferences
; cross-sectional study
1. Introduction
The provision of safe and easily accessible water plays a crucial role in safeguarding public health [1]. Many countries have implemented measures to ensure the supply of clean and safe drinking water via tap water systems that meet basic drinking standards [2]. Nevertheless, in recent decades, there has been a noticeable increase in the global consumption of bottled water, particularly in developed countries, despite the fact that tap water is safe for direct consumption [3]. Bottled water consumption is mainly attributed to factors like safety and health, taste, convenience, marketing features and lifestyle choices [4,5,6,7,8,9,10]. The perception that bottled water is a healthier and safer option than other water sources like tap water has significantly impacted consumption patterns [4,5,6,10,11,12,13,14,15]. However, there exists a source of bias centered around people’s perception impacting these consumption trends [16,17], and the factual basis of this perception should be understood to make informed choices about water consumption at community and national levels, with a keen focus on their public and environmental health implications.
In most high-income countries, the provision of tap water is highly regulated and quality parameters are publicly disclosed to spread awareness on the safety of tap water [13,14,18,19]. On the other hand, in most low- and middle-income countries (LMIC) these water quality and safety specifications are not shared, leading to their populations, especially the younger generations resorting to bottled water as a more trusted source [17,20,21].
As for the affluent, yet naturally water scarce, Gulf Cooperation Council (GCC) countries, heavy reliance on seawater desalination exists [22]. Organoleptic parameters and physiochemical properties in the desalinated sea water have led to an increased dependency on plastic bottled water consumption in the region [22,23].
In the State of Qatar, the Qatar General Water and Electricity Corporation, known as KAHRAMAA, provides drinking water through desalination of seawater. KAHRAMAA developed its own drinking water quality requirements and conditions, in line with international World Health Organization (WHO) guidelines ensuring availability of safe and organoleptic pleasing water. KAHRAMAA collects more than 12,000 water samples from approximately 700 sampling points yearly, providing confidence in the safety and drinkability of municipal tap water [24]. According to a study conducted by Qatar Environment and Energy Research Institute (QEERI) in 2015, a total of 113 tap water samples and 62 bottled water samples were collected and tested. The findings revealed that tap water in Qatar meets the standards established by both the WHO and US Environmental Protection Agency (EPA) [25]. However, despite the availability and assurances of safe tap water, there is still a significant consumption of bottled water in the country. Data obtained from interviews conducted by KAHRAMAA in people's homes indicates that only 30% of Qatar residents consume tap water [26]. It is evident that there is no substantial advocacy in Qatar to encourage and motivate people to consume tap water, despite the comprehensive measures taken to ensure the safety and quality of municipal tap water.
In relation to extensive bottled water consumption regionally and globally, environmental concerns arise, ranging from high energy usage, increased carbon emissions during production and distribution, plastic pollution and depletion of groundwater resources [16,27]. In 2019, the global emissions resulting from the life cycle of all plastics amounted to 860 million tons of carbon dioxide (CO2), a figure comparable to CO2 released by 189 coal plants [28]. Every minute, over 1,000,000 bottles are sold globally [29] with most of them being single-use bottles and about 85% of all plastic bottles sold becoming waste, disposal of these inadvertently leads to excessive plastic pollution [30]. The predominant packaging material used for bottled water is polyethylene terephthalate (PET) derived from fossil fuels [16] and can persist for at least 450 years to 1000 years before it fully decomposes [31], thus overloading landfill space for an extended period of time [32].
Understanding the implications of bottled water consumption necessitates investigating consumer preferences and attitude. University students represents a significant demographic sector and future consumer sector of the community, especially in Qatar. Hence, understanding their attitude and preferences towards the use of plastic bottled water is essential. Few studies have delved into the drinking water choices of university students, shedding light on factors influencing their preferences, including safety perceptions, convenience, taste, and even cultural habits [3,16]. The study exploring drinking water choices at Purdue University revealed that women drink disproportionately more bottled water then men while undergraduate students drink more than graduate students, staff and faculty. Important barriers that were established in this study include; perceived risks from tap water, perceived safety of bottled water, preferred taste and convenience of bottled water [3]. In another cross-regional comparative study on east Asian university students across Singapore, Hong Kong, and Macau, it was noted that Singapore has a relatively low rate of bottled water consumption among its university students while in Hong Kong and Macau one-fourth of the students still drink bottled water more frequently than tap water. In terms of determinants of the drinking water choices, “Safety and Hygiene” and “Convenience and Availability” ranked the highest for all three regions compared. However, factors like “Taste”, “Price”, and “Personal and Family Habits” were less preferred by different sub-samples within the study population [16].
Currently, little is known about the west Asian region (Middle East), and there are no published studies on Qatar that address the attitude and preferences of drinking water choices among students in university campuses. Exploring these preferences helps in devising informed strategies to encourage sustainable and mindful drinking habits within academic communities. The purpose of this study is to explore the drinking water choices of students within a public university in Qatar (University of Doha for Science and Technology, Qatar) and to examine and assess the factors that determine their drinking water choices.
2. Materials and Methods
2.1. Study Design and Participants
This cross-sectional study utilized a structured survey administered to university students to gain insights into their attitude and preferences regarding drinking water. This approach allowed for a comprehensive assessment of patterns and correlations within a large and diverse sample of participants, establishing statistical relationships between the variables considered. The study was administered to all full-time students registered at the University of Doha for Science and Technology (N=4920) covering all the colleges (Business Management, Computing and IT, Engineering Technology, Health Sciences, and the Foundation program). The survey and reminders (sent two weeks after the original survey distribution to all students) were sent between September to October 2022 via the university's online survey software i.e., Blue software from Explorance. The invitation included a study description and letter of consent, emphasizing the anonymous and voluntary nature of participation with no penalties for refusal to participate.
2.2. Survey Questionnaire Development and Pilot Testing
The survey was developed from peer-reviewed articles addressing relevant subjects and outlining factors influencing preferences in water consumption. There was a rigorous process of pilot testing, and a pilot survey was distributed to a representative group consisting of university faculty, research assistants and students for feedback on the clarity, relevance, and layout of the questionnaire. Based on the feedback received, revisions were made and the group was re-consulted prior to finalizing the questionnaire. The finalized study questionnaire consisted of 15 items covering demographic factors such as sex, age, nationality, college, years at university, and hours per week spent on campus. Additionally, it examined attitudes, and preferences regarding plastic bottled water compared to tap water, encompassing daily consumption on campus, major drinking water sources used, convenience, safety concerns, taste, environmental concerns, mineral content, cost, and personal/family habits.
2.3. Framework
Several theoretical frameworks have been developed to explain the factors that determine certain behaviors. In this study concepts from previous studies were applied by incorporating the personal norms and behaviors which are predicted by behavioral intentions into the theory of planned behavior (TPB). According to TPB theory, the behaviors are predicted by personal intentions (including cost, taste, safety, minerals, environmental concerns, family habits and convenience) which are preceded by personal attitude, perception of norms, perceived behavioral control and self-expectations [3,33,34,35]. An individual’s perception of norms refers to how others would view particular pro-environmental behavior and the motivation to comply with the views. Moreover, the perceived behavior control relates to individuals’ perception of the extent to which the performance of the behavior is easy or difficult. It is noteworthy to mention that in this study, drinking tap water versus bottled water is considered to be a personal intention affected behavior. For this reason, a framework showing the factors that impact different behaviors of drinking water choices has been developed and is depicted in Figure 1. According to this proposed framework, the personal attitude for drinking water choices will be affected by gender, age, nationality, college to which students belong to, number of years spent at university, hours per week spent on campus, average daily water consumption on campus, and major source of water used on campus, which in turn contribute heavily to university students’ personal intentions.
2.4. Variables
The outcome variable for this study was the preferred water source on campus. Responses included: Plastic bottled water, tap water, and no preference. The independent variables for this study included age (continuous, years), sex (male or female), nationality (re-coded to Qatari or non-Qatari), college unit (business management, computing and IT, engineering technology, health sciences, and foundation program), number of years at university (up to 1 year, 1 to 2 years, 2 to 3 years, 3 to 4 years, or more than 4 years), hours per week spent on campus (less than 10 hours, 10 to 20 hours, 21 to 40 hours, more than 40 hours), and average daily water consumption on campus (less than 200 mL, 200 to 330 mL, 330-500 mL, 500 mL to 1 L, more than 1 L). Students were further surveyed about which source of water was more convenient and safer, tasted better, had more mineral content, and posed a higher environmental concern. Available responses to these questions were plastic bottled water, tap water, no difference or do not know. Finally, the participants were requested to rank their water preferences by assigning a score of 1 (most important) to 7 (least important) on the following factors: cost, convenience, safety, taste, environmental concerns, minerals, and personal/family habit.
2.5. Statistical Methods
Descriptive statistics of the sample were presented as mean and standard deviation for continuous variables and frequency and proportion for categorical variables. These results were stratified by preferred water source on campus (Group 1: plastic bottled water, Group 2: tap water, or Group 3: no preference). To examine whether differences exist between the three groups, one-way ANOVA was used for continuous variables, while the Chi-Squared test was used to test if there was a statistically significant association between categorical variables. In cases where the expected count in the cells for two categorical variables was less than five in more than 20% of cells, Fisher’s exact test was used. Similarly, the Chi-Squared test or Fisher exact test was used when assessing knowledge, attitudes and beliefs of students stratified by their preferred water source and when examining the ranking of factors influencing water preference on campus. All data analysis was conducted using Statistical Package for Social Sciences (SPSS) Version: 28.0.10.
2.6. Ethical Considerations
The study proposal was reviewed and granted exemption under research category (2) from the Health Research Governance Department at the Ministry of Public Health (MoPH) of Qatar (Approval Ref # ERC-61-2-2022). The data collected did not include any personal identifiers and steps were taken to ensure confidentiality of the data including securing data files by the Blue Explorance software program.
3. Results and Discussion
3.1. Demographic Results
In total, with a response rate of 14%, 688 student responses were received and the overall mean age of the respondents was 22.23 ± 5.15 years. Majority of respondents were females 437 (63.52%) and non-Qatari (n=598; 86.92%). A large proportion are enrolled in the College of Health Sciences (n=220; 31.98%), attending the university for one to two years (n=181; 26.31%), and spending 21-40 hours per week on campus (n=254; 36.92%).
Overall, students reported plastic bottled water as the preferred source of drinking water (n=468; 68.02%), followed by no preference (n=175; 25.44%), leaving only 6.54% who preferred tap water (n=45; 6.54%) (Table 1). There were statistically significant differences in preferences based on average daily water consumption on campus (p-value = 0.012) and main source of water used on campus (p-value < 0.001). The mean age of those who chose plastic bottled water was 23.21 ± 5.26 years and for those who chose tap water was 23.73 ± 5.67 years, with a higher proportion of Qatari students and Foundation Program Unit students preferring the use of plastic water bottles (75.56% and 78.95% respectively). Students who were enrolled at the University for under one year had a lower preference of plastic bottled water use (58.20%), as did those who spent 10-20 hours/week on campus (65.50%), and those who consumed over one liter of water per day on campus (55.80%). We observed discrepancies between preferred choices indicated by respondents and their actual drinking water usage source on campus. For instance, 21.60% of students using plastic bottled water reported no preference in water source, however, 21.10% of tap water users and 38.10% of mixed users prefer plastic bottled water on campus (Table 1).
3.2. Geographical Heterogeneity
Our findings indicate that the majority of students preferred plastic bottled water (68.02%). A study conducted in the UAE found approximately 80% of the plain drinking water supply for persons aged up to 18 years was through bottled water [36]. Another study conducted in the West Bank found 92% of students drank bottled water on campus [37]. There is significant geographical heterogeneity in bottled water use with another study indicating roughly 50% of respondents using bottled water as their primary drinking water source in Spain [38], and even lower rates between 9.68% to 19.05% of individuals reported daily bottled water use on campus in Singapore, Hong Kong, and Macau [3]. In Mexico, individuals on campus prefer to buy bottled water even when the quality of tap water system is met [39]. This could be due to the lack of trust and accession of tap water from municipalities, which encourage citizens to depend on plastic bottled water [40].
3.3. Gender Differences in Preferences for Water Sources
Table 1 summarizes the study sample characteristics stratified by preferred source of water used on campus. A statistically significant and higher proportion of females (72.08%) preferred using plastic bottled water (p-value = 0.006). This is consistent with studies supporting the existence of gender differences and revealing that females tend to consume more bottled water than males [16] and females having higher risk perception regarding tap water [41]. Another study in the United States stated that females have 1.32 times higher odds of consuming bottled water, even when all other factors like level of education etc., are equal [7]. In addition, it has also been established that gender differences influence ranking of taste and personal/family habits [3,37].
3.4. Average Daily Consumption
It is noteworthy to mention that the average daily consumption of drinking water, regardless of its sources, varies among students. Sixty-one students (8.86%) reported drinking less than 200ml per day, which is below the recommended 2,600 ml of daily consumption to maintain water balance in the body of an adult individual [42,62]. Moreover, only 95 students (13.80%) drink more than 1 Liter of water per day. This is well aligned with results from a study conducted in Iran, wherein the daily total mean of water intake for females and males was 780 ± 47ml and 714 ± 86ml, respectively [43].
3.5. Knowledge, Attitudes and Beliefs of Students about Water Sources on Campus
Results related to knowledge, attitudes and beliefs indicated that the majority of respondents consistently selected plastic bottled water as more convenient (60.50%), safer (71.50%), and having a more acceptable taste (67.20%) in alignment with previous studies [3,16]. In addition, 50.4% of the students perceived bottled water to be richer in minerals. There was a statistically significant correlation between convenience (p-value < 0.001), safety (p-value < 0.001), taste (p-value < 0.001) and preferred water source, while no significant association was seen with mineral content and preferred source of water (Table 2).
3.6. Ranking Factors Influencing Preferred Water Sources
Table 3 elaborates on the rankings of individuals by preferred water source. Out of the 468 students who preferred plastic bottled water rather than tap water, safety was the most important factor (43.80%) followed by convenience (16.88%) and taste (15.60%). Cost (26.50%) and personal/family habit (24.57%) were found to be the least important of the factors listed for our study respondents (Table 3). There were statistically significant differences in the distribution of the rankings of cost (p-value < 0.001), convenience (p-value = 0.006), safety (p-value < 0.001), taste (p-value = 0.023), and environmental concerns (p-value < 0.001) when comparing individuals who preferred plastic bottled water to those who preferred tap water on campus. Analyzing the responses of the 45 students who preferred tap water over plastic bottled water, cost was identified by 46.67% of respondents to be the most important factor influencing their preference followed by convenience (20.00%). Personal/family habit was most commonly reported as the least important factor influencing preference (44.44%) even among the tap water preferred cohort.
3.7. Health Human Concern
Contaminated tap water has been associated with gastrointestinal illnesses, and even death, all depending on the extent of its infection with certain microbial agents. Developmental delays, cognitive impairment and cardiovascular disease are prominent health concerns linked to unsafe drinking water, along with cancer, fertility and birth complications [44,45,46,47]. In the survey, it was revealed that 43.80% of the students prioritize safety over all other factors when it comes to choosing bottled water over tap water. This emphasis on safety could be attributed to the prevalent news coverage regarding contamination issues associated with tap water. Consequently, it is expected that people would necessarily resort to an alternative like bottled water.
Although bottled and other forms of commercial water products have attracted a health seeking cohort of people wishing to escape the fast urbanizing and inadequately maintained public water networks of overflowing cities, they too have presented their own health issues, and substantial environmental impacts throughout their lifecycle. Spanning from their method of manufacture, to their storage and exposure to the natural elements (presence of micro-nano plastics due to the mechanical stress on the plastic products) [48], and up to their type of disposal, plastic bottled water’s negative impact on human health includes prevalence of endocrine-disrupting chemicals, metabolic disorders, tissue necrosis, blood vessel embolization, apoptosis, and carcinogenicity [49,50,51,52,53,54,55,56].
3.8. Environmental Concerns
Plastic production processes prove more harmful to the environment, especially from the context of energy intensive technologies used for drinking water treatments [57]. Furthermore, the environmental effects related to plastic bottled water are substantial with only 14% of the 78 million metric tons of plastic packaging produced annually being recycled, and the remaining ~80% find its way into the oceans leading to the well documented marine plastic pollution [58,59]. When examining “environmental concerns” amongst the response of our study population, 71.7% of students indicated that plastic bottled water had a more negative environmental impact compared to tap water, while 8.6% said that tap water poses a greater environmental threat. This figure is exacerbated by another 4.8% that claim no difference at all between the two sources and 15% not knowing if the environmental impact exists. This shows that highlighting the consequences of plastic pollution among the student community is critical.
With the observed trend of ~30% of the students being unaware of environmental concerns like plastics contribution to global warming, plastic debris, including microplastics and nanoplastics in food and water sources [60,61], community level environmental health literacy is of paramount importance with ever increasing anthropogenic impacts on the environment.
4. Study Implications and Recommendations
The current study demonstrated that the key factors, seen across the world, that have promoted the favoring of plastic bottled water over tap water applies to our study region too. The uniqueness of our study rests in its focus on understanding the preferences amongst university students, in a high-income GCC country like Qatar. It reinstates the importance of aspects, such as taste and convenience, but of particular interest is its manifestation that knowledge, and lack of it, is not the sole culprit in the rise and prevalence of plastic bottled water dependency. Although almost 15.00% of the respondents within this higher education cohort asserts no to weak unknown correlation between plastic bottled water and its detrimental impact on the environment, it is the relative importance they give to safety, more than any other factor, that should be considered as the guiding compass for future public health policies and campaigns related to plastic bottled water use. It is arguable that academic and research institutions as well as non-governmental environmental organizations may have wielded a double-edged sword in their eagerness to address health concerns with increased emphasis on lack of public water network maintenance, leading to people opting for the alternative plastic bottled water, a detrimental source rooted with deep environmental concerns [63]. Accordingly, to reverse this trend, policy makers and environmental advocates need to acknowledge and act upon the fact that people value their immediate health and safety (especially in short-term) over the environmental implications of their actions [64,65]. Therefore, complementary efforts highlighting the consequences of plastic bottled water use with concurrent continued investment in improving public water networks, in countries like the State of Qatar (where tap water meets safe drinking standards) may increase and improve the public’s awareness of this issue.
Our study shows that there was a statistically significant decrease in plastic bottled water consumption with the overall increase in average daily water consumption (from those drinking <200ml, 72.13% chose plastic bottled water, compared to 55.79% who drink >1L per day). This could be attributed to students that are more health conscious (in that they ensure to drink sufficient amounts of water per day) are also, not necessarily just more aware of the dangers of plastic products, but have researched enough to be confident in tap water’s chemical and biological properties.
Additionally, campaigns to deter negative health and environmental practices need to focus on attitude and behavior change and not solely emphasize knowledge; 71.7% of our respondents believed that plastic water bottles are more harmful to the environment, and yet the greater majority still resorted to this source.
Our knowledge to practice recommendations is for institutions to test and publish results indicating the safety of the chemical and biological properties of tap water sources regularly to attract the health conscious among the student community within the University settings. If tests reveal sub-optimal properties, deliberations with the university board and ministries of education, environment and energy should be sponsored to install the fixes needed to ensure safe tap water. The success of these efforts should be disseminated annually to all academic institutions, both public and private, in the country. Data safety sheets available over public and tap water sources may serve as a powerful reassurance factor and need to be studied. This recommendation is supported by a study indicating a significantly greater proportion of GCC residents view tap water quality as poor (36.6%) compared to North American and European residents (23.8%) [66].
In conclusion, we advocate that enabling the population to understand the positive and negative aspects of their choices towards bottled water or tap water use, and improving their ability to easily and accurately access information about alternative health and environmentally friendly sources and practices may prove to be the most cost-effective measure from an environmental health standpoint.
Author Contributions
Conceptualization, RM, NH, AC. And RR.; Methodology, RM, NH, AC.; Validation, RM., NH. And RR.; Formal Analysis, RM, NH, AC, and RR; Investigation, RM, NH, and AC; Data Curation, RM, RR and RY; Writing – Original Draft Preparation, RM, NH, AC, RR and RY; Writing – Review & Editing, RM, NH, AC, RR and RY; Visualization, RM, NH, AC. And RR; Supervision, RR, NH; Project Administration, RM, NH.
Funding
The study did not receive any external or internal funding. The authors declare no conflict of interest.
Institutional Review Board Statement
Ethical review and approval were waived for this study by the Health Governance Department at the Ministry of Public Health in Qatar under exempt research category (2): Research involving the user of educational tests (cognitive, diagnostic, aptitude, achievement), survey procedures, interview procedures or observation of public behavior unless: (i) information obtained is recorded in such a manner that human subjects can be identified; and (ii) any disclosure of human subjects’ responses outside the research could reasonably place the subjects at risk of criminal or civil liability or be damaging to the subjects’ financial standing, employability or reputation [ERC-61-2-2022]. Informed consent was obtained from all subjects involved in the study.
Informed Consent Statement
Informed consent was obtained from all subjects involved in the study.
Data Availability Statement
The data presented in this study are available on request from the corresponding author. The data are not publicly available due to confidentiality concerns.
Acknowledgments
The authors would like to acknowledge the assistance provided by from Mr. Said Mohamed, Survey Management Senior Specialist with the Institutional Excellence Directorate and from Dr. Michael Phillips, Director, Applied Research, Innovation and Economic Development at the University of Doha for Science and Technology.
Conflicts of Interest
The authors declare no conflicts of interest.
References
- World Health Organization. Increased drinking-water consumption brings gains for health and the environment. World Health Organization. 2020. Available online: https://www.who.int/europe/news/item/19-03-2020-increased-drinking-water-consumption-brings-gains-for-health-and-the-environment.
- Ashton, D. A Traveller’s Guide to Tap Water. 2017.
- Qian, N. Bottled water or tap water? A comparative study of drinking water choices on university campuses. Water 2018, 10, 59. [Google Scholar] [CrossRef]
- Brei, V.A. How is a bottled water market created? Wiley Interdisciplinary Reviews: Water 2018, 5, e1220. [Google Scholar] [CrossRef]
- Stoler, J. From curiosity to commodity: a review of the evolution of sachet drinking water in West Africa. Wiley Interdisciplinary Reviews: Water 2017, 4, e1206. [Google Scholar] [CrossRef]
- Hawkins, G.; Potter, E.; Race, K. Plastic water: The social and material life of bottled water; MIT Press, 2015. [Google Scholar]
- Hu, Z.; Morton, L.W.; Mahler, R.L. Bottled water: United States consumers and their perceptions of water quality. International Journal of Environmental Research and Public Health 2011, 8, 565–578. [Google Scholar] [CrossRef] [PubMed]
- Gleick, P.H. Bottled and sold: The story behind our obsession with bottled water; Island Press, 2010. [Google Scholar]
- Parag, Y.; Roberts, J.T. A battle against the bottles: building, claiming, and regaining tap-water trustworthiness. Society and Natural Resources 2009, 22, 625–636. [Google Scholar] [CrossRef]
- Clarke, T. Inside the bottle: an exposé of the bottled water industry. Canadian Ctr for Policy, Ottawa: Polaris Institute, Revised edition. 2007. 216p.
- Espinosa-García, A.C.; Díaz-Ávalos, C.; González-Villarreal, F.J.; Val-Segura, R.; Malvaez-Orozco, V.; Mazari-Hiriart, M. Drinking water quality in a Mexico City University community: perception and preferences. EcoHealth 2015, 12, 88–97. [Google Scholar] [CrossRef] [PubMed]
- Cha, J.; Lee, J.Y. Qualities of groundwater source used for production of commercial bottled waters in Korea. 지질학회지 2020, 56, 789–802. [Google Scholar] [CrossRef]
- Cohen, A.; Rasheduzzaman, M.; Darling, A.; Krometis, L.A.; Edwards, M.; Brown, T.; Ahmed, T.; Wettstone, E.; Pholwat, S.; Taniuchi, M.; Rogawski McQuade, E.T. Bottled and Well Water Quality in a Small Central Appalachian Community: Household-Level Analysis of Enteric Pathogens, Inorganic Chemicals, and Health Outcomes in Rural Southwest Virginia. International Journal of Environmental Research and Public Health 2022, 19, 8610. [Google Scholar] [CrossRef] [PubMed]
- Valavanidis, A. Scientific Reviews Tap Drinking Water versus Bottled Water. Tap Drinking Water versus Bottled Water. Risk perceptions on safety and taste increased use of bottled drinking water that fit with the modern way of life. ResearchGate. 2020.
- Williams, A.R.; Bain, R.E.; Fisher, M.B.; Cronk, R.; Kelly, E.R.; Bartram, J. A systematic review and meta-analysis of fecal contamination and inadequate treatment of packaged water. PloS one 2015, 10, e0140899. [Google Scholar] [CrossRef]
- Saylor, A.; Prokopy, L.S.; Amberg, S. What’s wrong with the tap? Examining perceptions of tap water and bottled water at Purdue University. Environmental management 2011, 48, 588–601. [Google Scholar] [CrossRef] [PubMed]
- Doria, M.F. Bottled water versus tap water: understanding consumers' preferences. Journal of water and health 2006, 4, 271–276. [Google Scholar] [CrossRef] [PubMed]
- Diduch, M.; Polkowska, Ż.; Namieśnik, J. Chemical quality of bottled waters: a review. Journal of food science 2011, 76, R178–R196. [Google Scholar] [CrossRef] [PubMed]
- Geerts, R.; Vandermoere, F.; Van Winckel, T.; Halet, D.; Joos, P.; Van Den Steen, K.; Van Meenen, E.; Blust, R.; Borregán-Ochando, E.; Vlaeminck, S.E. Bottle or tap? Toward an integrated approach to water type consumption. Water research 2020, 173, 115578. [Google Scholar] [CrossRef] [PubMed]
- Sajjadi, S.A.; Alipour, V.; Matlabi, M.; Biglari, H. Consumer perception and preference of drinking water sources. Electronic physician 2016, 8, 3228. [Google Scholar] [CrossRef] [PubMed]
- United Nations University. Global Bottled Water Industry: A review of impacts and trends. 2023.
- Shomar, B.; Hawari, J. Desalinated drinking water in the GCC countries–The need to address consumer perceptions. Environmental research 2017, 158, 203–211. [Google Scholar] [CrossRef] [PubMed]
- Rowell, C.; Kuiper, N.; Shomar, B. Potential health impacts of consuming desalinated bottled water. Journal of water and health 2015, 13, 437–445. [Google Scholar] [CrossRef] [PubMed]
- Qatar Electricity and Water Corporation KAHRAMAA. Overview on: KAHRAMAA Drinking Water Quality Requirements. KAHRAMAA Health, Safety and Environment Department. 2014. chromeextension://efaidnbmnnnibpcajpcglclefindmkaj/https://www.km.com.qa/MediaCenter/Publications/KAHRAMAA%20Drinking%20Water%20Quality%20Requirment.pdf.
- Qatar Environment and Energy Research Institute. Tap Water Versus Bottled Water – the Great Debate Research. 2015. Available online: https://www.press.qf.org.qa/tap-water-versus-bottled-water-the-great-debate-researched-by-qatar-environment-and-energy-research-institute/.
- The Peninsula Qatar. Only 30 percent drink tap water in Qatar: Survey. 2 May 2015. Available online: https://thepeninsulaqatar.com/article/02/05/2015/only-30-percent-drink-tap-water-in-qatar-survey (accessed on 14 January 2022).
- Ferrier, C. Bottled water: understanding a social phenomenon. AMBIO: A journal of the Human Environment 2001, 30, 118–119. [Google Scholar] [CrossRef]
- Statista. Plastic industry worldwide. Statista Dossier on the global plastic industry, 32p. 2021c.
- Plastics Europe. Plastics - the facts 2020. Plastics Europe. 2020. Available online: https://plasticseurope.org/knowledge-hub/plastics-the-facts-2020/ (accessed on 27 October 2022).
- UNEP. Visual feature: Beat plastic pollution. UNEP. UN Environment Programme. 2022. Available online: https://www.unep.org/interactives/beat-plastic-pollution/.
- Organization for Economic Co-operation and Development. Global Plastics Outlook: Economic Drivers, Environmental Impacts and Policy Options. OECD Publishing. 2022.
- Okafor. Plastic water bottles environmental impacts. 2023. Available online: https://www.trvst.world/waste-recycling/plastic-pollution/plastic-water-bottles-environmental-impacts.
- Schwartz, S.H. Normative Influences on Altruism. Adv. Exp. Soc. Psychol. 1977, 10, 221–279. [Google Scholar]
- Ajzen, I. The theory of planned behavior. Organ. Behav. Hum. Decis. Processes 1991, 50, 179–211. [Google Scholar] [CrossRef]
- Harland, P.; Staats, H.; Wilke, H.A.M. Explaining Proenvironmental Intention and Behavior by Personal Norms and the Theory of Planned Behavior1. J. Appl. Soc. Psychol. 1999, 29, 2505–2528. [Google Scholar] [CrossRef]
- Ali, H.I.; Al Dhaheri, A.S.; Elmi, F.; Ng, S.W.; Zaghloul, S.; Ohuma, E.O.; Qazaq, H.S. Water and Beverage Consumption among a Nationally Representative Sample of Children and Adolescents in the United Arab Emirates. Nutrients 2019, 11, 2110. [Google Scholar] [CrossRef] [PubMed]
- Abdah, B.; Al-Khatib, I.A.; Khader, A.I. Birzeit University students’ perception of bottled water available in the west bank market. Journal of Environmental and Public Health 2020, 2020, 1–10. [Google Scholar] [CrossRef]
- March, H.; Garcia, X.; Domene, E.; Sauri, D. Tap water, bottled water or in-home water treatment systems: Insights on household perceptions and choices. Water 2020, 12, 1310. [Google Scholar] [CrossRef]
- Arriaga-Medina, J.A.; Piedra-Miranda, A.G. Water consumption practices in university campuses. The experience of the National Autonomous University of Mexico. Water Science and Technology 2021, 84, 1125–1135. [Google Scholar] [CrossRef]
- Ahmad, S.; Saleem, A. Qualitative assessment of bottled water in the middle east. 1996.
- Graydon, R.C.; Gonzalez, P.A.; Laureano-Rosario, A.E.; Pradieu, G.R. Bottled water versus tap water: Risk perceptions and drinking water choices at the University of South Florida. International Journal of Sustainability in Higher Education 2019, 20, 654–674. [Google Scholar] [CrossRef]
- The National Academy of Sciences. Dietary References Intakes for Water, Potassium, Sodium, Chloride, and Sulfate. Available online: https://www.nap.edu/read/10925/chapter/6#102 (accessed on 8 May 2019).
- Balaghi, S.; Faramarzi, E.; Mahdavi, R.; Ghaemmaghami, J. Fluids intake and beverage consumption pattern among university students. Health promotion perspectives 2011, 1, 54. [Google Scholar]
- World Health Organization. Guidelines for drinking-water quality: Fourth Edition. 2017. Available online: https://www.who.int/publications/i/item/9789241549950.
- Prüss-Ustün, A.; Wolf, J.; Bartram, J.; Clasen, T.; Cumming, O.; Freeman, M.C.; Gordon, B.; Hunter, P.R.; Medlicott, K.; Johnston, R. Burden of disease from inadequate water, sanitation and hygiene for selected adverse health outcomes: An updated analysis with a focus on low- and middle-income countries. International Journal of Hygiene and Environmental Health 2019, 222, 765–777. [Google Scholar] [CrossRef] [PubMed]
- U.S. Environmental Protection Agency. Drinking Water Standards and Health Advisories. 2020. Available online: https://www.epa.gov/sdwa/drinking-water-health-advisories-has.
- International Agency for Research on Cancer. Chlorinated Drinking-Water; Chlorination By-Products; Some Other Halogenated Compounds; Cobalt and Cobalt Compounds. 2020.
- Qian, N.; Gao, X.; Lang, X.; Deng, H.; Bratu, T.M.; Chen, Q.; Stapleton, P.; Yan, B.; Min, W. Rapid single- particle chemical imaging of nano-plastics by SRS microscopy. PNAS 2024, 121. [Google Scholar] [CrossRef]
- Alonso-Magdalena, P.; Ropero, A.B.; Soriano, S.; García-Arévalo, M.; Ripoll, C.; Fuentes, E.; Quesada, I.; Nadal, Á. Bisphenol-A acts as a potent estrogen via non-classical estrogen triggered pathways. Molecular and Cellular Endocrinology 2010, 2010, 8–12. [Google Scholar] [CrossRef]
- Bach, C.; et al. Chemical compounds and toxicological assessments of drinking water stored in polyethylene terephthalate (PET) bottles: a source of controversy reviewed. Water Res. 2012, 46, 571–583. [Google Scholar] [CrossRef]
- Gore, A.C.; et al. EDC-2: The Endocrine Society's second scientific statement on endocrine-disrupting chemicals. Endocrine Reviews 2015, 36, E1–E150. [Google Scholar]
- Mason, S.A.; Welch, V.G.; Neratko, J. Synthetic Polymer Contamination in Bottled Water. Front. Chem. 2018, 6, 407. [Google Scholar] [CrossRef] [PubMed]
- Melzer, D.; et al. Association of urinary bisphenol A concentration with heart disease: evidence from NHANES 2003/06. PLoS One 2010, 5, e8673. [Google Scholar] [CrossRef] [PubMed]
- Rochester, J.R. Bisphenol A and human health: A review of the literature. Reproductive Toxicology 2013, 42, 132–155. [Google Scholar] [CrossRef]
- Winkler, A.; Santo, N.; Ortenzi, M.A.; Bolzoni, E.; Bacchetta, R.; Tremolada, P. Does mechanical stress cause microplastics release from plastic water bottles? Water Res. 2019, 166, 115082. [Google Scholar] [CrossRef] [PubMed]
- Wright, S.L.; Kelly, F.J. Plastic and Human Health: A Micro Issue? Environ. Sci. Technol. 2017, 51, 6634–6647. [Google Scholar] [CrossRef]
- Fantin, V.; Scalbi, S.; Ottaviano, G.; Masoni, P. A method for improving reliability and relevance of LCA reviews: the case of life-cycle greenhouse gas emissions of tap and bottled water. Science of the Total Environment 2014, 476, 228–241. [Google Scholar] [CrossRef] [PubMed]
- Royte, E. Eat your food, and the package too. National Geographic. 2019.
- International Union for Conservation of Nature (IUCN). Marine plastic pollution. 2021. Available online: https://www.iucn.org/resources/issues-brief/marine-plastic-pollution.
- Geyer, R.; Jambeck, J.R.; Law, K.L. Production, use, and fate of all plastics ever made. Science advances 2017, 3, el700782. [Google Scholar] [CrossRef]
- Brandon, J.A.; Jones, W.; Ohman, M.D. Multidecadal increase in plastic particles in coastal ocean sediments. Science advances 2019, 5, eaax0587. [Google Scholar] [CrossRef]
- Griban, G.; Filatova, O.; Bosenko, A.; Tamozhanska, G.; Lytvynenko, A.; Topchii, M.; Orlyk, N.; Prontenko, K. Water in students’ life and its impact on their health. Acta Balneologica 2021, 2, 99–104. [Google Scholar] [CrossRef]
- Ruben, B.D. Communication theory and health communication practice: the more things change, the more they stay the same1. Health communication 2016, 31, 1–11. [Google Scholar] [CrossRef] [PubMed]
- Iizuka, M. Role of environmental awareness in achieving sustainable development. 2016.
- Sheather, J.; Littler, K.; Singh, J.A.; Wright, K. Ethics, climate change and health - a landscape review. Wellcome Open Res. 2023, 8, 343. [Google Scholar] [CrossRef] [PubMed] [PubMed Central]
- Wait, I.W. Consumer perception of water quality, abundance, and cost: comparison of drinking water source, attitudes, and preference. International Journal of Environmental Engineering 2014, 6, 361–369. [Google Scholar] [CrossRef]
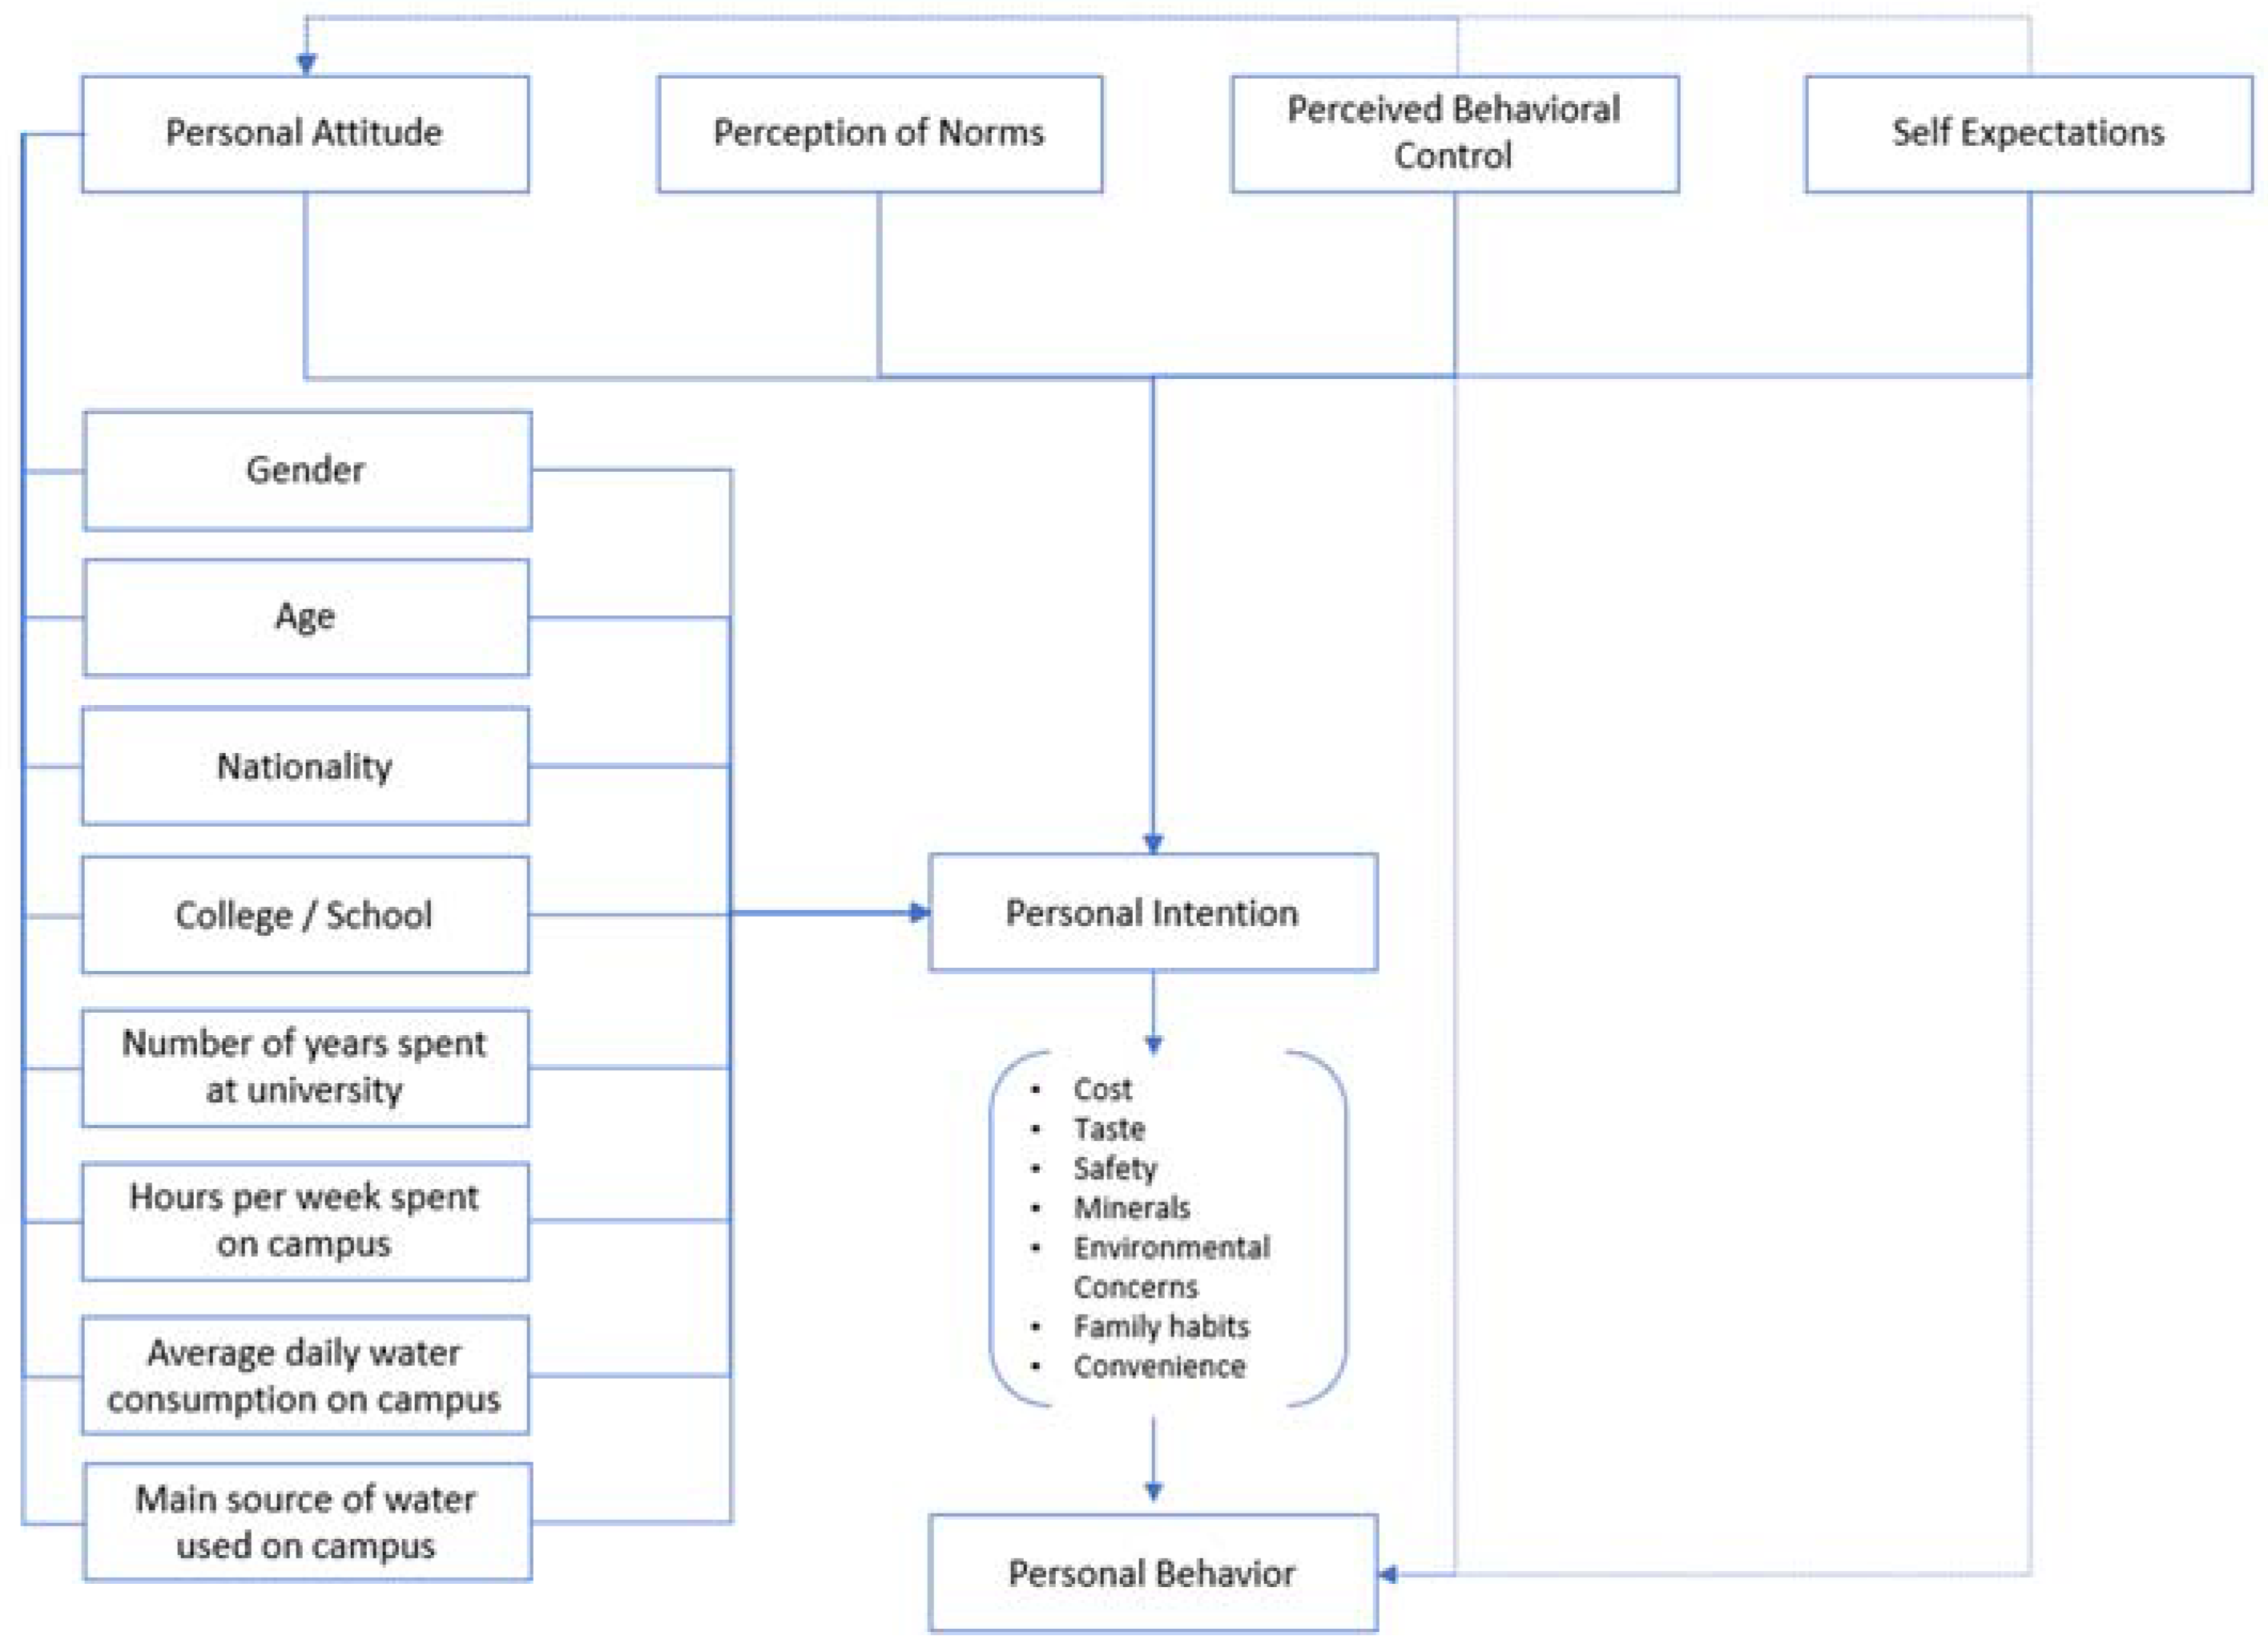

Table 1.
Summary of Sample Characteristics (N=688).
| Preferred water source used on campus | Total | Correlation (p-value) | |||
|---|---|---|---|---|---|
| Plastic Bottled Water (n=468; 68%) | Tap Water (n=45; 6.5%) | No preference(n=175; 25.4%) | N=688 | ||
| Gender | |||||
| Male | 153 (60.96%) | 17 (6.77%) | 81 (32.27%) | 251 | 0.006+ |
| Female | 315 (72.08%) | 28 (6.41%) | 94 (21.51%) | 437 | |
| Age (Years ± SD) | 23.21 ± 5.26 | 23.73 ± 5.67 | 23.30 ± 4.70 | 686 | NS* |
| Nationality | |||||
| Qatari | 68 (75.56%) | 2 (2.22%) | 20 (22.22%) | 90 | NS+ |
| Non-Qatari | 400 (66.89%) | 43 (7.19%) | 155 (25.92%) | 598 | |
| College | |||||
| Business | 148 (75.13%) | 10 (5.08%) | 39 (19.80%) | 197 | NS+ |
| Computing and IT | 75 (69.44%) | 6 (5.56%) | 27 (25.00%) | 108 | |
| Engineering Tech | 91 (63.19%) | 8 (5.56%) | 45 (31.25%) | 144 | |
| Health Sciences | 139 (63.18%) | 21 (9.55%) | 60 (27.27%) | 220 | |
| Foundation | 15 (78.95%) | 0 (0.00%) | 4 (21.05%) | 19 | |
| Number of years at university | |||||
| Up to 1 year | 39 (58.21%) | 6 (8.96%) | 22 (32.84%) | 67 | NS+ |
| 1-2 years | 138 (76.24%) | 9 (4.97%) | 34 (18.78%) | 181 | |
| 2-3 years | 109 (66.46%) | 12 (7.32%) | 43 (26.22%) | 164 | |
| 3-4 years | 119 (69.59%) | 11 (6.43%) | 41 (23.98%) | 171 | |
| More than 4 years | 63 (60.00%) | 7 (6.67%) | 35 (33.33%) | 105 | |
| Hours per week spent on campus | |||||
| < 10 hours/week | 98 (73.68%) | 6 (4.51%) | 29 (21.80%) | 133 | NS+ |
| 10-20 hours/week | 163 (65.46%) | 15 (6.02%) | 71 (28.51%) | 249 | |
| 21-40 hours/week | 172 (67.72%) | 19 (7.48%) | 63 (24.80%) | 254 | |
| > 40 hours/week | 35 (67.31%) | 5 (9.62%) | 12 (23.08%) | 52 | |
| Campus daily water consumption | |||||
| < 200 mL | 44 (72.13%) | 3 (4.92%) | 14 (22.95%) | 61 | 0.012+ |
| 200-330 mL | 70 (76.09%) | 1 (1.09%) | 21 (22.83%) | 92 | |
| 330-500 mL | 151 (69.91%) | 21 (9.72%) | 44 (20.37%) | 216 | |
| 500 mL-1 L | 150 (66.96%) | 11 (4.91%) | 63 (28.13%) | 224 | |
| > 1 L | 53 (55.79%) | 9 (9.47%) | 33 (34.74%) | 95 | |
| Campus main water source used | |||||
| Plastic Bottled Water | 445 (74.66%) | 22 (3.69%) | 129 (21.64%) | 596 | < 0.001# |
| Tap Water | 15 (21.13%) | 21 (29.58%) | 35 (49.30%) | 71 | |
| Both Water Sources | 8 (38.10%) | 2 (9.52%) | 11 (52.38%) | 21 | |
Note: Age (continuous variable) is presented as mean +/- standard deviation, while the other variables (categorical) are presented as frequency (percentage). +Indicates Chi-Squared test; #Indicates Fisher Exact test; *Indicates one-way ANOVA. NS: not significant
Table 2.
Knowledge and attitudes of students about sources of water on campus (N=688).
| Factors | Plastic bottled water | Tap water | No difference | Do not know | p-value |
|---|---|---|---|---|---|
| Convenience | 416 (60.5%) | 102 (14.8%) | 170 (24.7%) | N/A | < 0.001+ |
| Safety | 492 (71.5%) | 30 (4.4%) | 100 (14.5%) | 66 (9.6%) | < 0.001+ |
| Taste | 462 (67.2%) | 30 (4.4%) | 138 (20.1%) | 58 (8.4%) | < 0.001+ |
| Environmental Concerns | 493 (71.7%) | 59 (8.6%) | 33 (4.8%) | 103 (15.0%) | 0.005+ |
Note: +Indicates Chi-Squared test
Table 3.
Ranked factors influencing preferences for plastic bottled water (N=468) or tap water (N=45).
Table 3.
Ranked factors influencing preferences for plastic bottled water (N=468) or tap water (N=45).
| Factors | 1Most important | 2 | 3 | 4 | 5 | 6 | 7Least important | Correlation(p-value) |
|---|---|---|---|---|---|---|---|---|
| Cost | ||||||||
| Bottled | 15.17% | 15.60% | 11.11% | 11.11% | 6.84% | 13.68% | 26.50% | < 0.001+ |
| Tap | 46.67% | 15.56% | 4.44% | 2.22% | 6.67% | 6.67% | 17.78% | |
| Convenience | 0.006+ | |||||||
| Bottled | 16.88% | 12.18% | 11.75% | 9.62% | 14.10% | 20.90% | 15.38% | |
| Tap | 20.00% | 28.89% | 17.78% | 6.67% | 2.22% | 20.00% | 4.44% | |
| Safety | ||||||||
| Bottled | 43.80% | 19.66% | 19.44% | 8.33% | 4.91% | 1.28% | 2.56% | < 0.001# |
| Tap | 13.33% | 4.44% | 15.56% | 37.78% | 13.33% | 15.56% | 0.00% | |
| Taste | ||||||||
| Bottled | 15.60% | 28.42% | 21.37% | 12.82% | 8.55% | 8.97% | 4.27% | 0.023# |
| Tap | 4.44% | 17.78% | 26.67% | 11.11% | 13.33% | 13.33% | 13.33% | |
| Environmental Concerns | ||||||||
| Bottled | 2.14% | 4.06% | 8.76% | 19.87% | 29.70% | 19.23% | 16.24% | < 0.001# |
| Tap | 13.33% | 15.56% | 11.11% | 15.56% | 24.44% | 11.11% | 8.89% | |
| Minerals | ||||||||
| Bottled | 1.28% | 9.62% | 16.24% | 27.56% | 20.51% | 14.32% | 10.47% | NS# |
| Tap | 0.00% | 11.11% | 11.11% | 20.00% | 28.89% | 17.78% | 11.11% | |
| Personal/ Family habit | ||||||||
| Bottled | 5.13% | 10.47% | 11.32% | 10.68% | 15.38% | 22.44% | 24.57% | NS# |
| Tap | 2.22% | 6.67% | 13.33% | 6.67% | 11.11% | 15.56% | 44.44% |
Note: +Indicates Chi-Squared test; #Indicates Fisher Exact test. 175 students (25.4%) did not answer the rating question
Disclaimer/Publisher’s Note: The statements, opinions and data contained in all publications are solely those of the individual author(s) and contributor(s) and not of MDPI and/or the editor(s). MDPI and/or the editor(s) disclaim responsibility for any injury to people or property resulting from any ideas, methods, instructions or products referred to in the content. |
© 2024 by the authors. Licensee MDPI, Basel, Switzerland. This article is an open access article distributed under the terms and conditions of the Creative Commons Attribution (CC BY) license (http://creativecommons.org/licenses/by/4.0/).
Copyright: This open access article is published under a Creative Commons CC BY 4.0 license, which permit the free download, distribution, and reuse, provided that the author and preprint are cited in any reuse.


