2. Materials and Methods
The aim of the study is to propose a conceptual model for refining the boundaries of historical and cultural heritage objects using remote and non-invasive methods. To achieve this goal, the Citadel defensive complex located in Lviv, Ukraine, and listed among the objects of national significance in terms of historical and cultural heritage, was chosen as the research polygon. The primary focus of the research was on spaceborne synthetic aperture radar (SAR) and ground-penetrating radar (GPR) imaging methods [
22,
23,
24,
25,
26,
27].
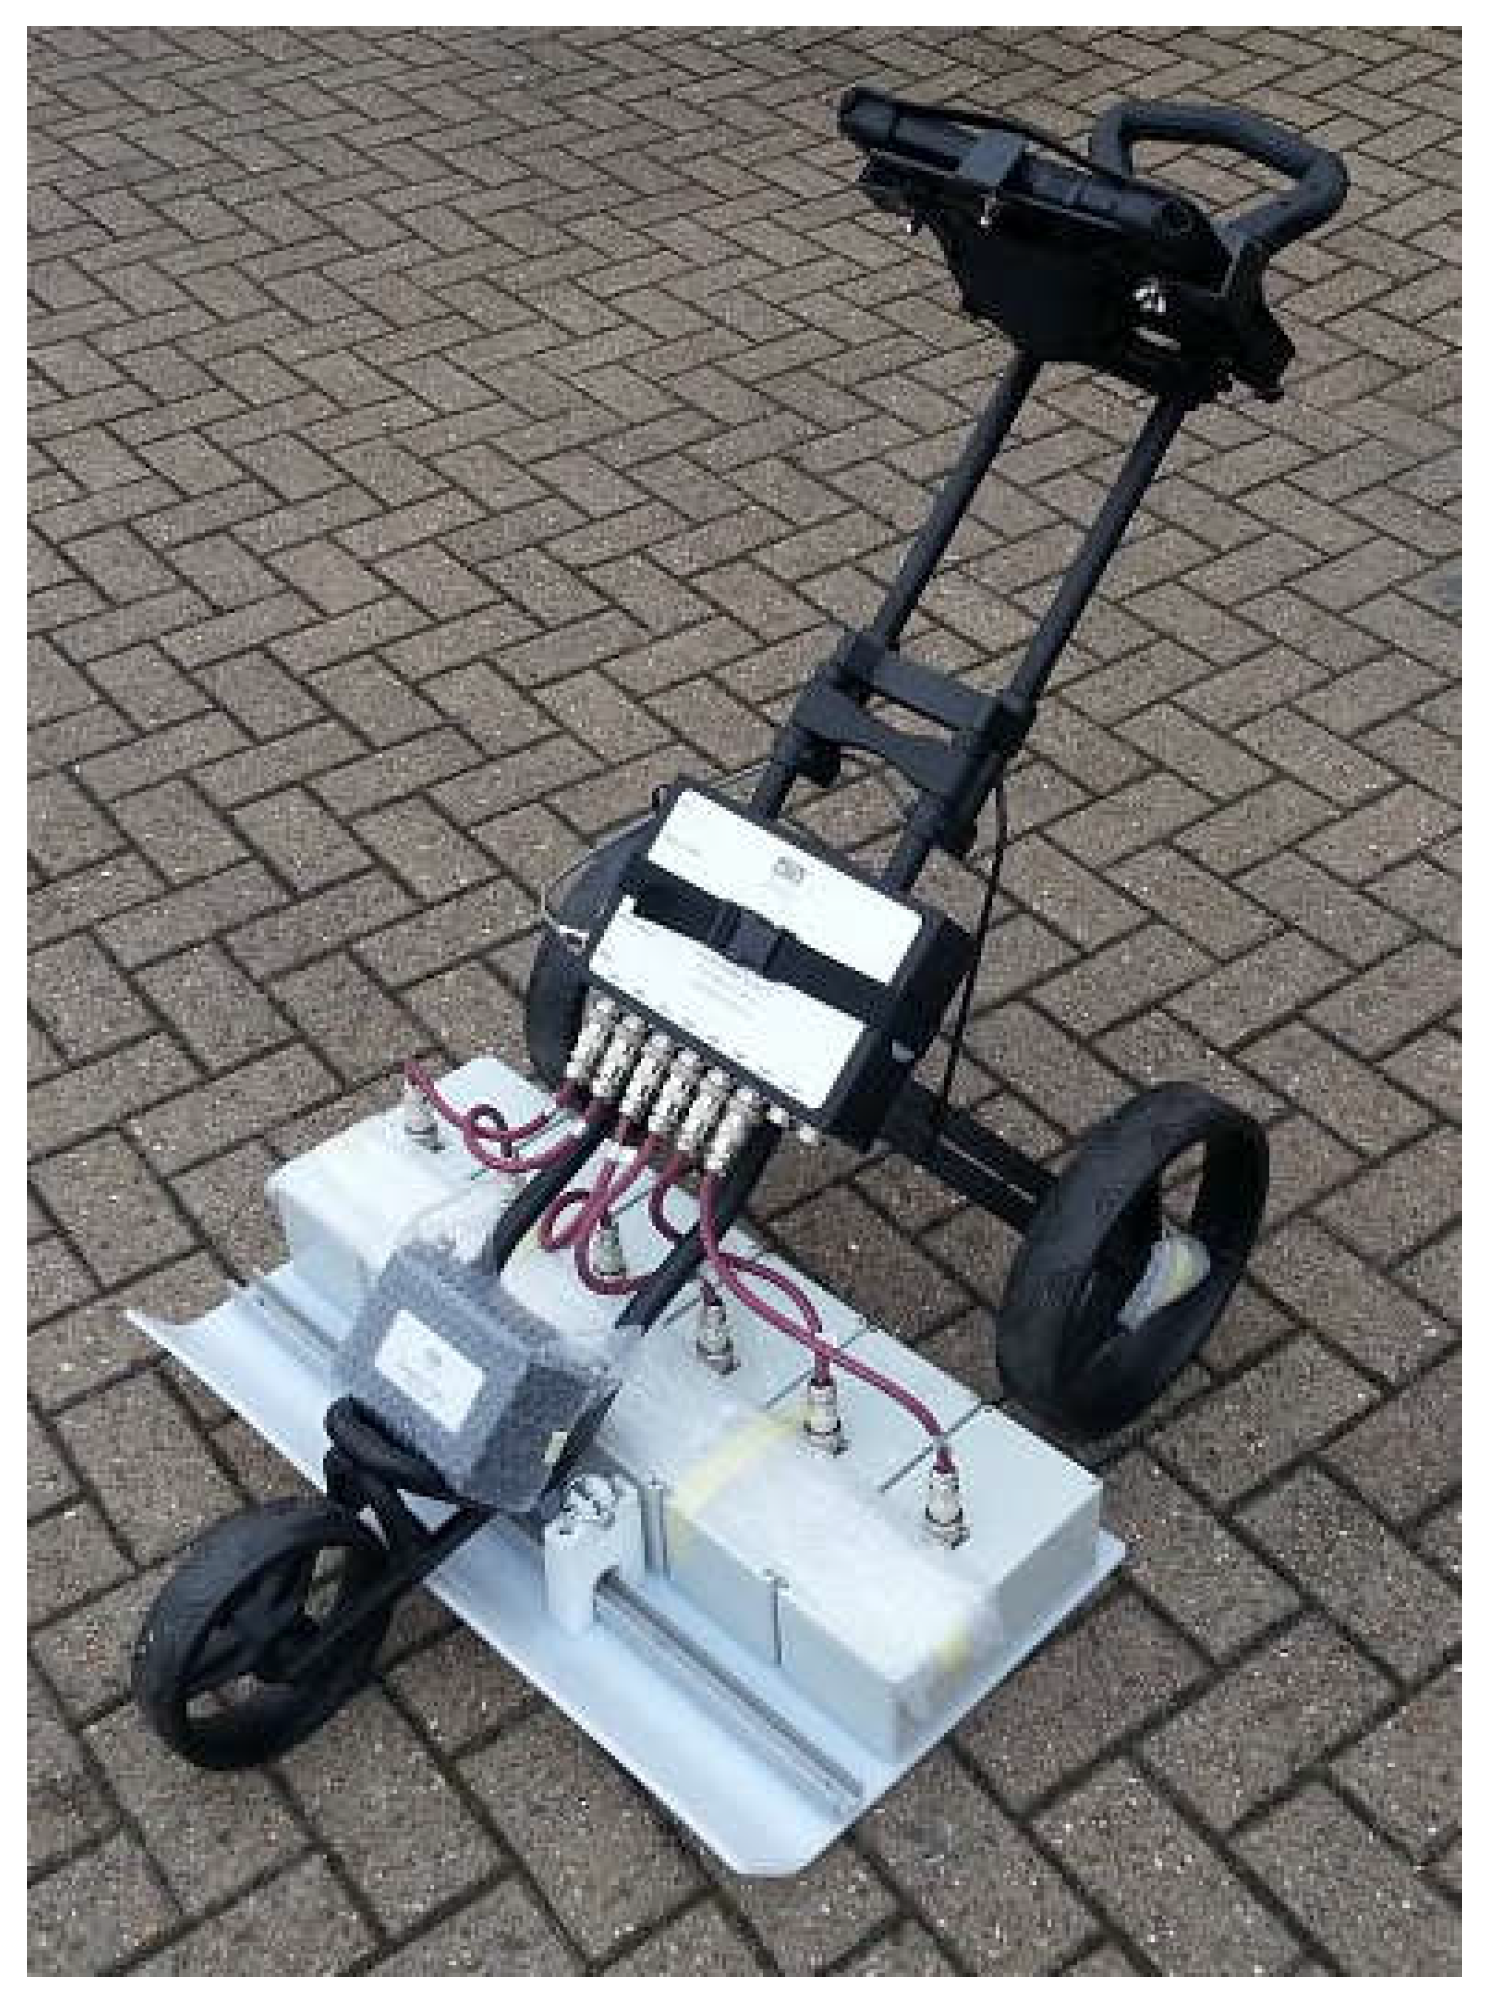
As input data for SAR analysis, 36 satellite images obtained from the Sentinel-1 satellite over two years from 2020 to 2022 were utilized. Ground-penetrating radar imaging was conducted at points of extreme vertical displacements of the Earth's surface, obtained from interferograms. Ground-penetrating radar imaging was performed using the UTSI GV3_1 GPR system (
Figure 2). The main characteristics of this system are provided in
Table 1.
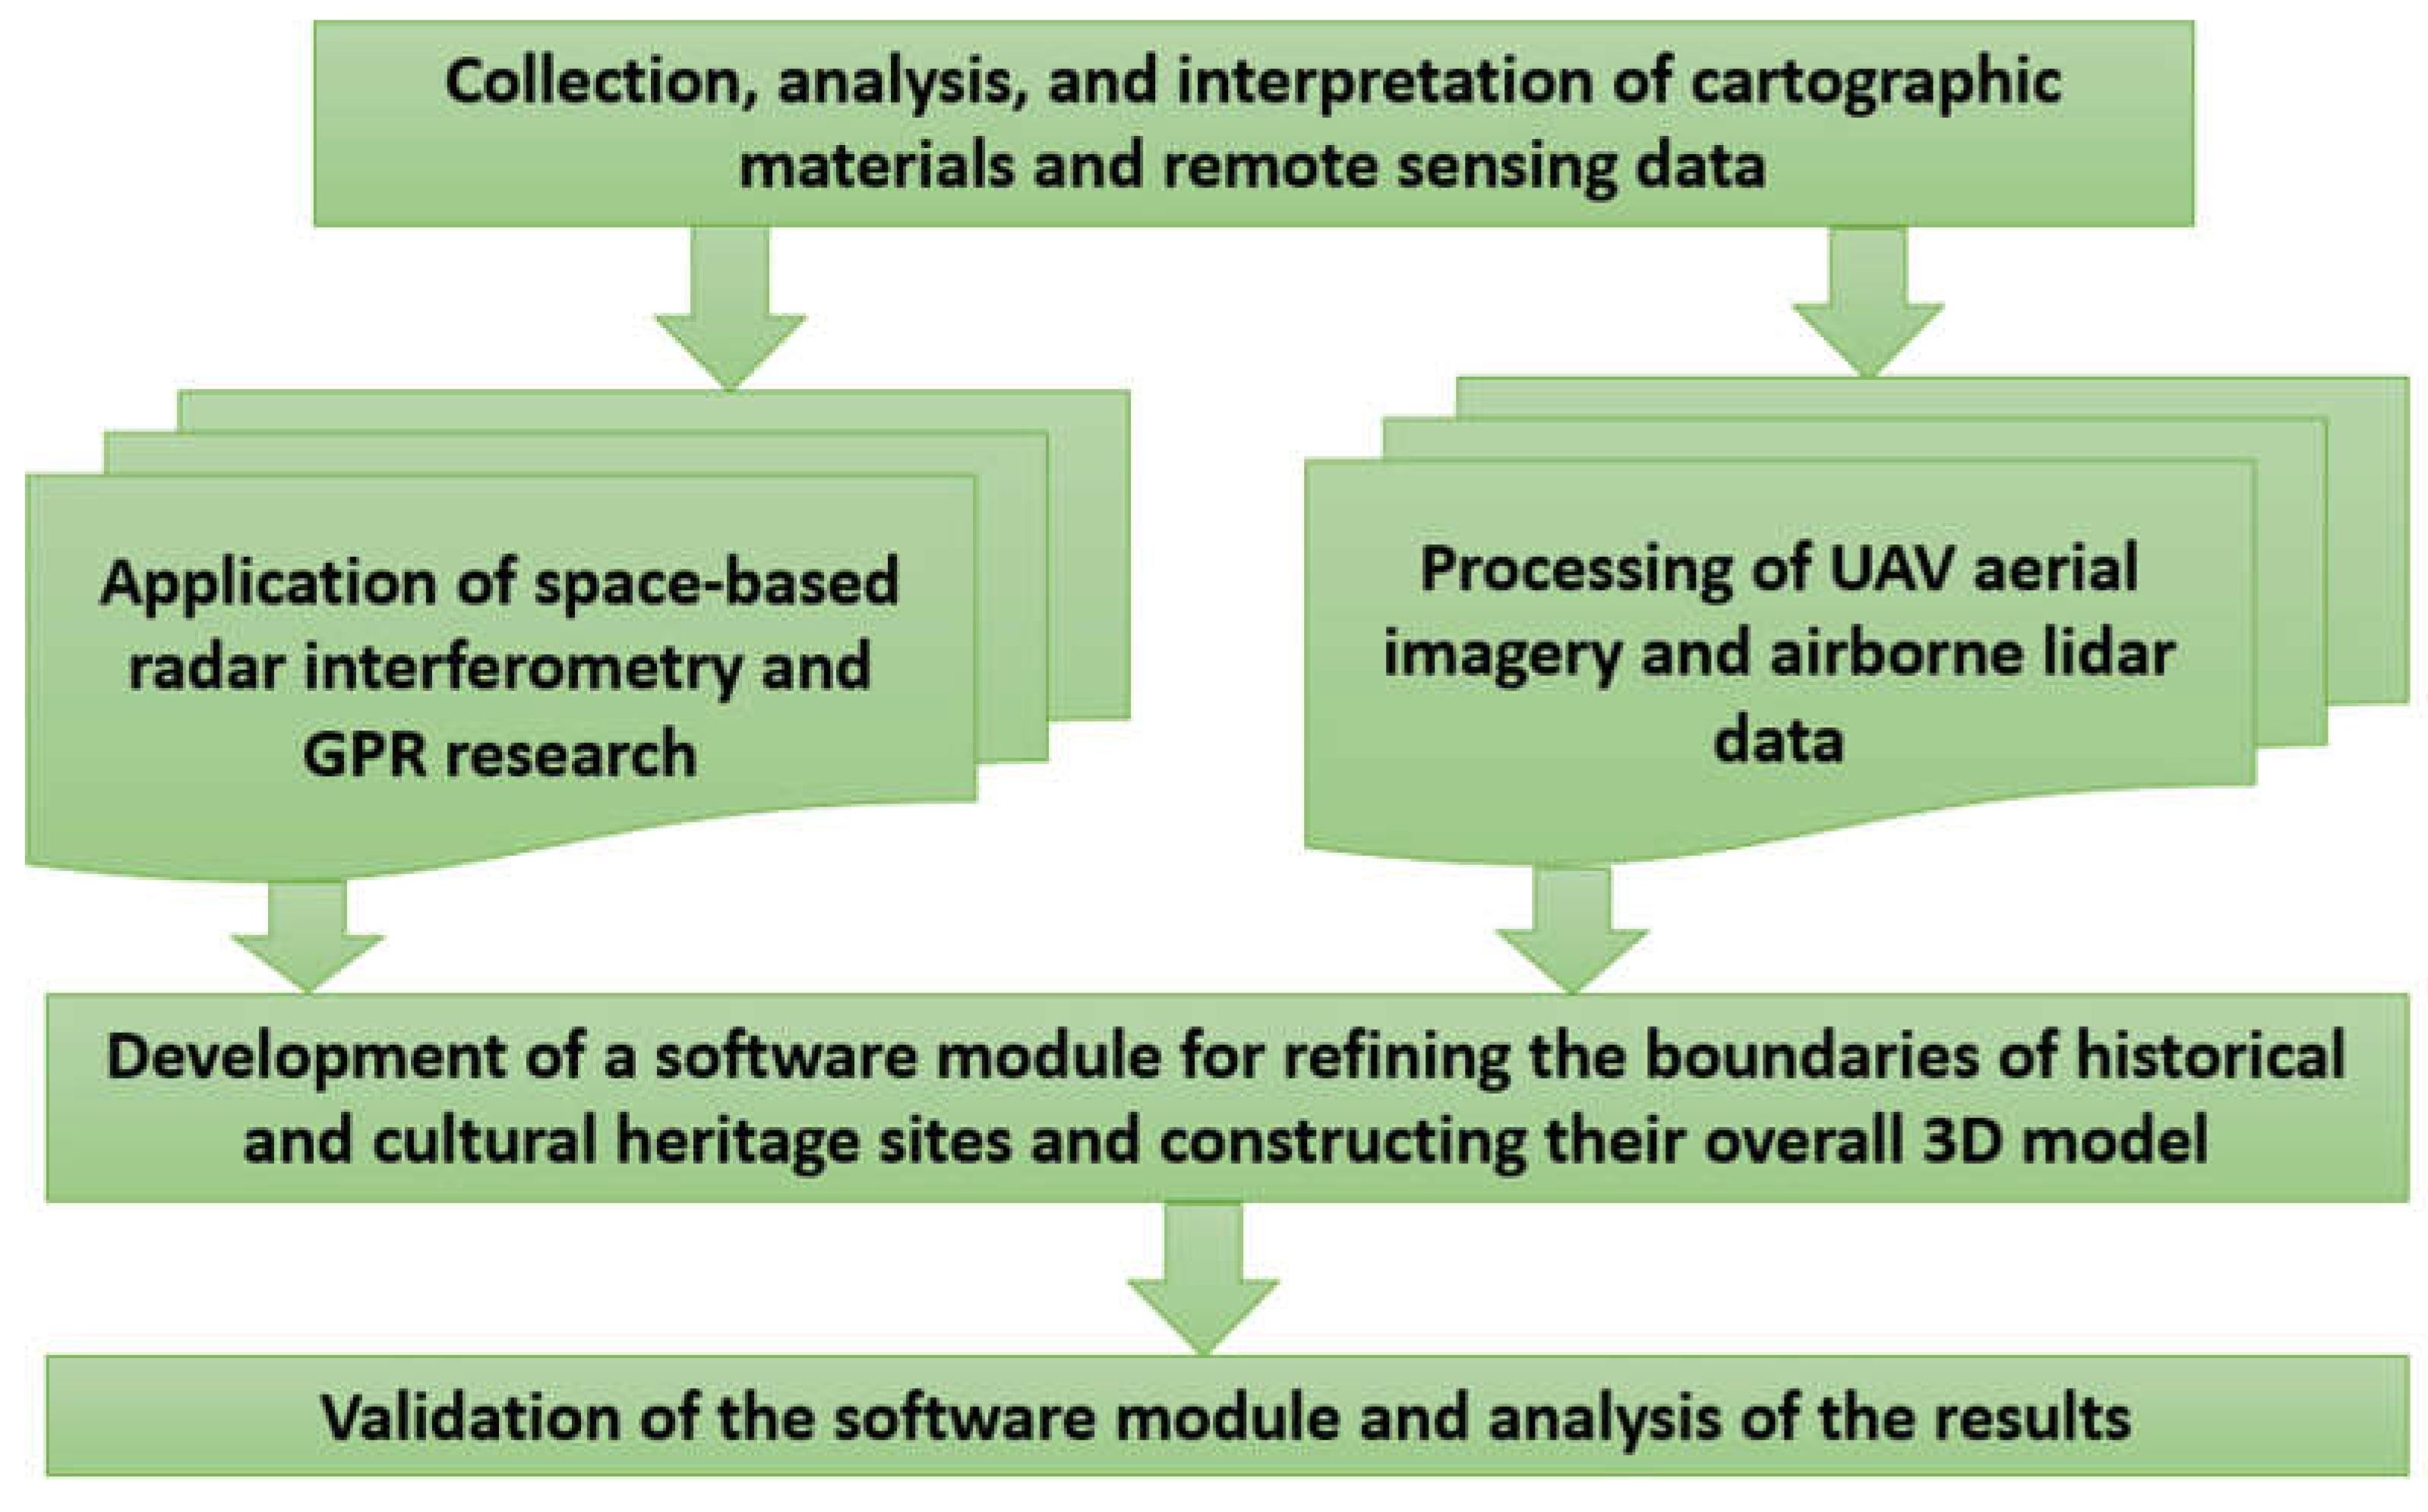
We have developed and proposed a generalized and detailed conceptual model for conducting our research (
Figure 3).
The generalized conceptual model comprises six main blocks, starting from data collection from remote sensing and ground-penetrating radar imaging to the final analysis and interpretation of the acquired data. Additionally, the generalized conceptual model includes data processing and visualization. At this stage, satellite imagery is processed to obtain detailed information about land covers, and ground-penetrating radar data is processed to detect underground structures such as building foundations or archaeological remains. Visualization of processed data aids in better understanding the geographic context of the studied area. In the preliminary analysis and data interpretation block, machine learning algorithms and computer vision are employed to classify land covers and identify features related to historical and cultural objects. Interpretation of the analysis results aims to identify lands of historical and cultural significance, such as the locations of ancient settlements, fortresses, or archaeological sites. The data validation stage occurs after image classification when it is essential to validate the results. This involves comparing classified data with a validation dataset containing information about known historical and cultural objects. Validation helps assess the accuracy and reliability of the classification and identify potential errors. After validation, ground investigations are recommended for a detailed study of historical and cultural objects. This may include visiting locations where potential objects are detected, gathering additional information, archaeological excavations, or ground-penetrating radar profiles to obtain more detailed data on the structure and characteristics of objects. The next step involves creating maps depicting lands of historical and cultural significance based on classified data and the results of ground investigations. This can be done by generating vector or raster layers showing the locations and types of historically and culturally significant objects on the map. The final stage involves the analysis and interpretation of the obtained results. This may include identifying patterns, relationships, and trends in the distribution of lands of historical and cultural significance, as well as establishing the significance and status of the identified objects [
28,
29,
30].
The detailed conceptual model provides a thorough description of each research stage. It includes the collection, analysis, and interpretation of cartographic materials and remote sensing data, followed by branching into parallel processes of processing spaceborne radar images and obtaining interferograms, as well as obtaining orthophotos and point clouds from aerial imagery and UAV Lidar data (although in this research example, we focus only on radar interferometry and ground-penetrating radar imaging, the conceptual model describes the application of various remote and non-invasive research methods for a comprehensive study of historical and cultural heritage objects). The block of processing spaceborne radar images and obtaining interferograms is further divided into manual and semi-automatic result retrieval. Subsequently, a software module is developed for loading resulting data and constructing overall 3D models of surface and subsurface elements of historical and cultural heritage objects. After analyzing the acquired data, the overall research model of immovable historical and cultural heritage objects is constructed, followed by the semi-automatic establishment of protective zones for historical and cultural heritage objects based on the obtained data [
31,
32,
33,
34].
The technology for implementing the conceptual model involves using two types of input data: analysis of archival aerial photographs (such as those from the World War II era), if the object of study is, for example, mass graves or similar objects that are often not depicted on cartographic materials, and analysis of archival cartographic materials (cadastral maps, other cartographic products) - for other planar objects of historical and cultural heritage. After analyzing archival aerial photographs, they are interpreted through visual inspection by the performer or by computer vision to identify potential areas of interest, such as possible locations of mass graves and other elements of historical and cultural heritage objects. If areas of interest are identified at this stage, the transition to ground-penetrating radar surveys to detect anomalies occurs; otherwise, areas of interest are determined, and the search for medium or high-resolution satellite radar images begins, which are processed using radar interferometry methods in SNAP or SARScape software packages or others. Interferograms are obtained, extreme points of vertical displacements are determined, and maps of vertical displacements are constructed. Then, ground-penetrating radar surveys are carried out to detect anomalies. The transition to ground-penetrating radar imaging also occurs after localizing objects of historical and cultural heritage and monitoring changes in their boundaries using various cartographic materials over time. If ground-penetrating radar surveys yield no results, the research is discontinued; if anomalies are found, their interpretation and identification of elements of historical and cultural heritage objects occur. In parallel with these processes, software development for semi-automatic search of areas of interest in ground-penetrating radar imaging and construction of a general 3D model using Visual Basic or Python programming languages, as well as aerial lidar and UAV aerial imagery, are carried out. Point clouds are processed to create orthophoto plans, and digital surface models or digital terrain models are built and compared, depending on the object. Interpreted anomalies from ground-penetrating radar surveys and digital surface models or digital terrain models from UAVs are uploaded into the developed software module, which involves data loading and construction of 3D models of surface and subsurface elements of historical and cultural heritage objects, as well as analysis and interpretation of elements for inclusion of newly discovered details within the defined boundaries of historical and cultural heritage objects. If the elements fall within the recognized boundaries of the object, the research is completed; if not, the boundaries of historical and cultural heritage objects are refined, and recommendations for establishing protective zones are proposed.
Satellite radar images were processed using ENVI SARscape software. These images were obtained in the C-band with VV+VH polarization and in interferometric Wide swath (IW) mode. In this case, the swath of each image is 250 km.
Sentinel-1A images are available in three processing levels: Level-0, Level-1, Level-2. Our input data is in the first processing level. Level-1 data are publicly available products designed for most data users. Level-1 products are produced as Single Look Complex (SLC) and Ground Range Detected (GRD). The images were obtained from the Copernicus geospatial portal.
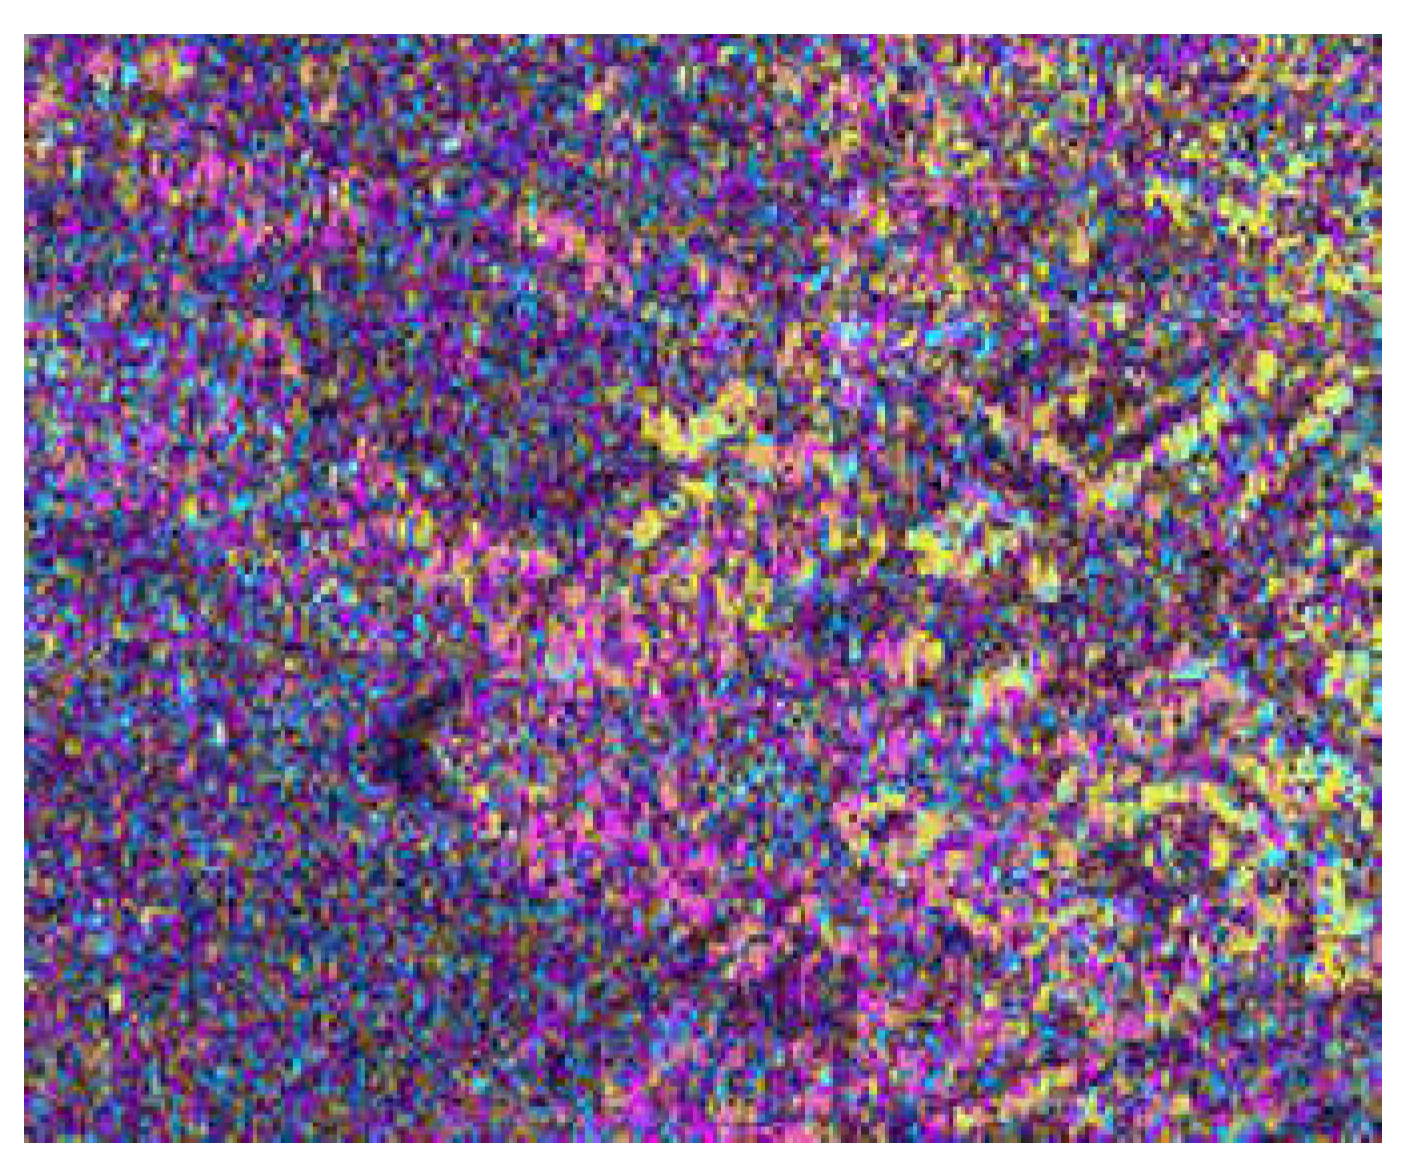
Radar data were processed using ENVI SARscape software. For the SBAS method, the cycle of interferometric processing in ENVI SARscape is performed for each pair of images in the interferometric series. Image pairs are automatically selected from the downloaded series of images. The first step of interferometric processing is precise spatial alignment (coregistration) of the master and slave radar images in the interferometric series, which is performed in SARscape module in automatic mode. At this stage, the coregistration accuracy is achieved to one or several pixels, at the second stage - subpixel accuracy of coregistration, and at the third stage - accuracy to 1/100 pixels. The next step calculates complex interferograms, which are the result of complex element-wise multiplication of phase of radar image pairs in the interferometric series. The complex interferogram contains several components: topographic phase, deformation phase, atmospheric phase, electromagnetic noise. Complex element-wise multiplication of phases is necessary for each pair of images in the interferometric series. The main output file of this procedure is the differential interferogram, which is the result of subtracting the synthesized relief phase from the complex interferogram. The differential interferogram contains the component of surface deformation that occurred between acquisitions, the phase noise component, and the component of atmospheric conditions influence during each image acquisition in the selected series. Adaptive filtering of the differential interferogram was used to reduce noise using the Goldstein filter for each pair of images (
Figure 4).
After filtering the phase noise (Goldstein algorithm), a reduction in the size of noise areas and an increase in the radius of noise correlation can be observed. To obtain a continuous phase, i.e., to remove phase jumps by 2π, it is necessary to perform the phase unwrapping procedure for each pair of images. There are about a dozen algorithms for performing the phase unwrapping operation, each with its own advantages and disadvantages. Phase unwrapping was performed using the Minimum Cost Flow method with Delaunay triangulation. In this method, the gradient of the unwrapped phase is restored by changing the integer number of phase periods of individual pixels. To separate significant phase values from insignificant ones, the coherence of the phase (phase correlation) was used as an auxiliary parameter. It is measured in dimensionless quantities from 0 to 1 and is calculated using the filtered differential interferogram. Further, the so-called inversion was performed, which restores the temporal dynamics of displacements from cross-temporal pairs of images. After that, the results were geocoded and converted to vector format.
After determining the points of maximum surface displacements using radar interferometry, we proceeded with ground-based non-invasive investigations using ground-penetrating radar (GPR). Seven points were processed, that raised the most questions, and were located either on the boundary of the historical and cultural heritage object or beyond it. Anomalies of artifacts were deciphered on the radargrams at two points, one located on the current territory of the tennis court, and the other beyond the boundary of the current object.
The ground-penetrating radar (GPR) emits high-frequency pulses from the transmitting antenna directly into the ground. When these electromagnetic waves pass through gaps in the soil or solid objects, a portion of this energy is reflected back to the receiving antenna, while another portion continues further and may be reflected from deeper fractures in the ground. This process continues until the energy of the transmitted wave decreases to a level that does not allow further penetration. By measuring the time of the reflected wave's return, the depth of the object can be determined along the vertical plane. Data from multiple planes are processed further to reflect the plan of the surveyed area at the desired depth.
The ability of soil to transmit radio waves depends on several factors, including soil conductivity, density, porosity, temperature, physical structure, frequency used, and the amount of salts present in the soil. The most significant factor is soil conductivity, which determines the speed of wave propagation and penetration depth. Soils with high conductivity result in signal loss. Overall, the soil and ground in the Lviv region are suitable for ground-penetrating radar surveys. The type and condition of the soil in the research area are loose, homogeneous, well-fractionated sandy loam with small gravel.
The surface cover consists of 85-95% grassy/herbaceous vegetation with shrubs and 10-25% trees with well-developed crowns on the northern and eastern sides of the surveyed area.
3. Results
The implementation of the set goal is demonstrated through the study of the historical and cultural heritage object, the Citadel defensive complex located in Lviv, where the Stalag-328 prisoner-of-war concentration camp was situated during World War II.
Using the obtained interferograms generated from 36 satellite images acquired from the Sentinel-1 satellite over three years from 2020 to 2022, we were able to identify the extremes of vertical ground displacements in the research area. By discarding the indicators of minimal displacements, only the maximum displacements were considered. There were 24 points identified with such displacements. The range of vertical ground displacements at these points varies from 17 to 36 centimeters. Additional investigations led to the exclusion of 5 points located within the object's territory in the built-up area. It was hypothesized that the vertical displacements in the built-up area may have occurred due to specific repair works.
As previously mentioned, processing of spaceborne radar images from the Sentinel-1 satellite was performed using the SARScape software with the SBAS method. Evaluating the characteristics of the territory of our research object and its relatively small area in the scale of satellite images, a coherence threshold of -22 decibels was chosen for the most precise filtering of noise and insignificant objects. The range of coherence thresholds for the SBAS method can also vary from several decibels to significant values, depending on the specific study and the nature of the data. Typically, the typical range of coherence thresholds for SBAS can be from -20 to -30 decibels or even less. The coherence threshold adjustment was performed by a selection method to ensure the best results.
For the SBAS method, an important step is the selection of baseline pairs. Perpendicular baseline pairs were chosen for measuring deformations along two directions, north-south and west-east. This allowed for measurements of deformations in both horizontal directions. Temporal baseline pairs were selected between pairs of radar images as of January 2020 and December 2020, and January 2021 and December 2021, to cover the desired time period. This allowed for considering the dynamics of deformations of the earth's surface during the selected time interval, which ranged from -0.7 to -10 cm/year over the selected time period.
It is emphasized that the research was conducted over a three-year period during which centimeter-scale subsidence was recorded, but it is not guaranteed that their average indicators were the same in previous years, most likely they were not, as the territory of the object has largely remained unchanged over the past decade.
In the SBAS method for processing radar images from the Sentinel-1 satellite, both descending and ascending geometries can be used. In the case of descending geometry, the same radar satellite is used to obtain both images used in pairs for interferometric analysis. The advantage of such geometry is that images obtained from the same radar satellite have minimal geometry differences, which can improve the quality of interferograms and reduce processing time, while the disadvantage is the limited availability of data, as it depends on the passage of the satellite and cloud cover. In our case, this geometry was used because all images were taken from the Sentinel-1 satellite at monthly intervals.
If we talk about ascending geometry, in this case, images obtained by different radar satellites (for example, two Sentinel-1 satellites) are used to create image pairs. Its advantages include increasing the available data, as images obtained by different satellites and at different times can be used, while its disadvantages include the possibility of differences in image geometry, which can affect the quality of interferograms and require additional computations for correction.
For obtaining vertical displacements, Line-of-Sight (LOS) estimates obtained from radar images are typically used. Transforming LOS estimates into vertical displacements usually requires additional data on topography and models of spatial distribution of velocity variations. These data are used to correct geometric artifacts and account for effects of horizontal and vertical ground motion. The accuracy of vertical displacement estimates was 0.6 cm, as the relief of the object is hilly and it is more difficult to accurately determine vertical displacements.
Furthermore, based on previous research [
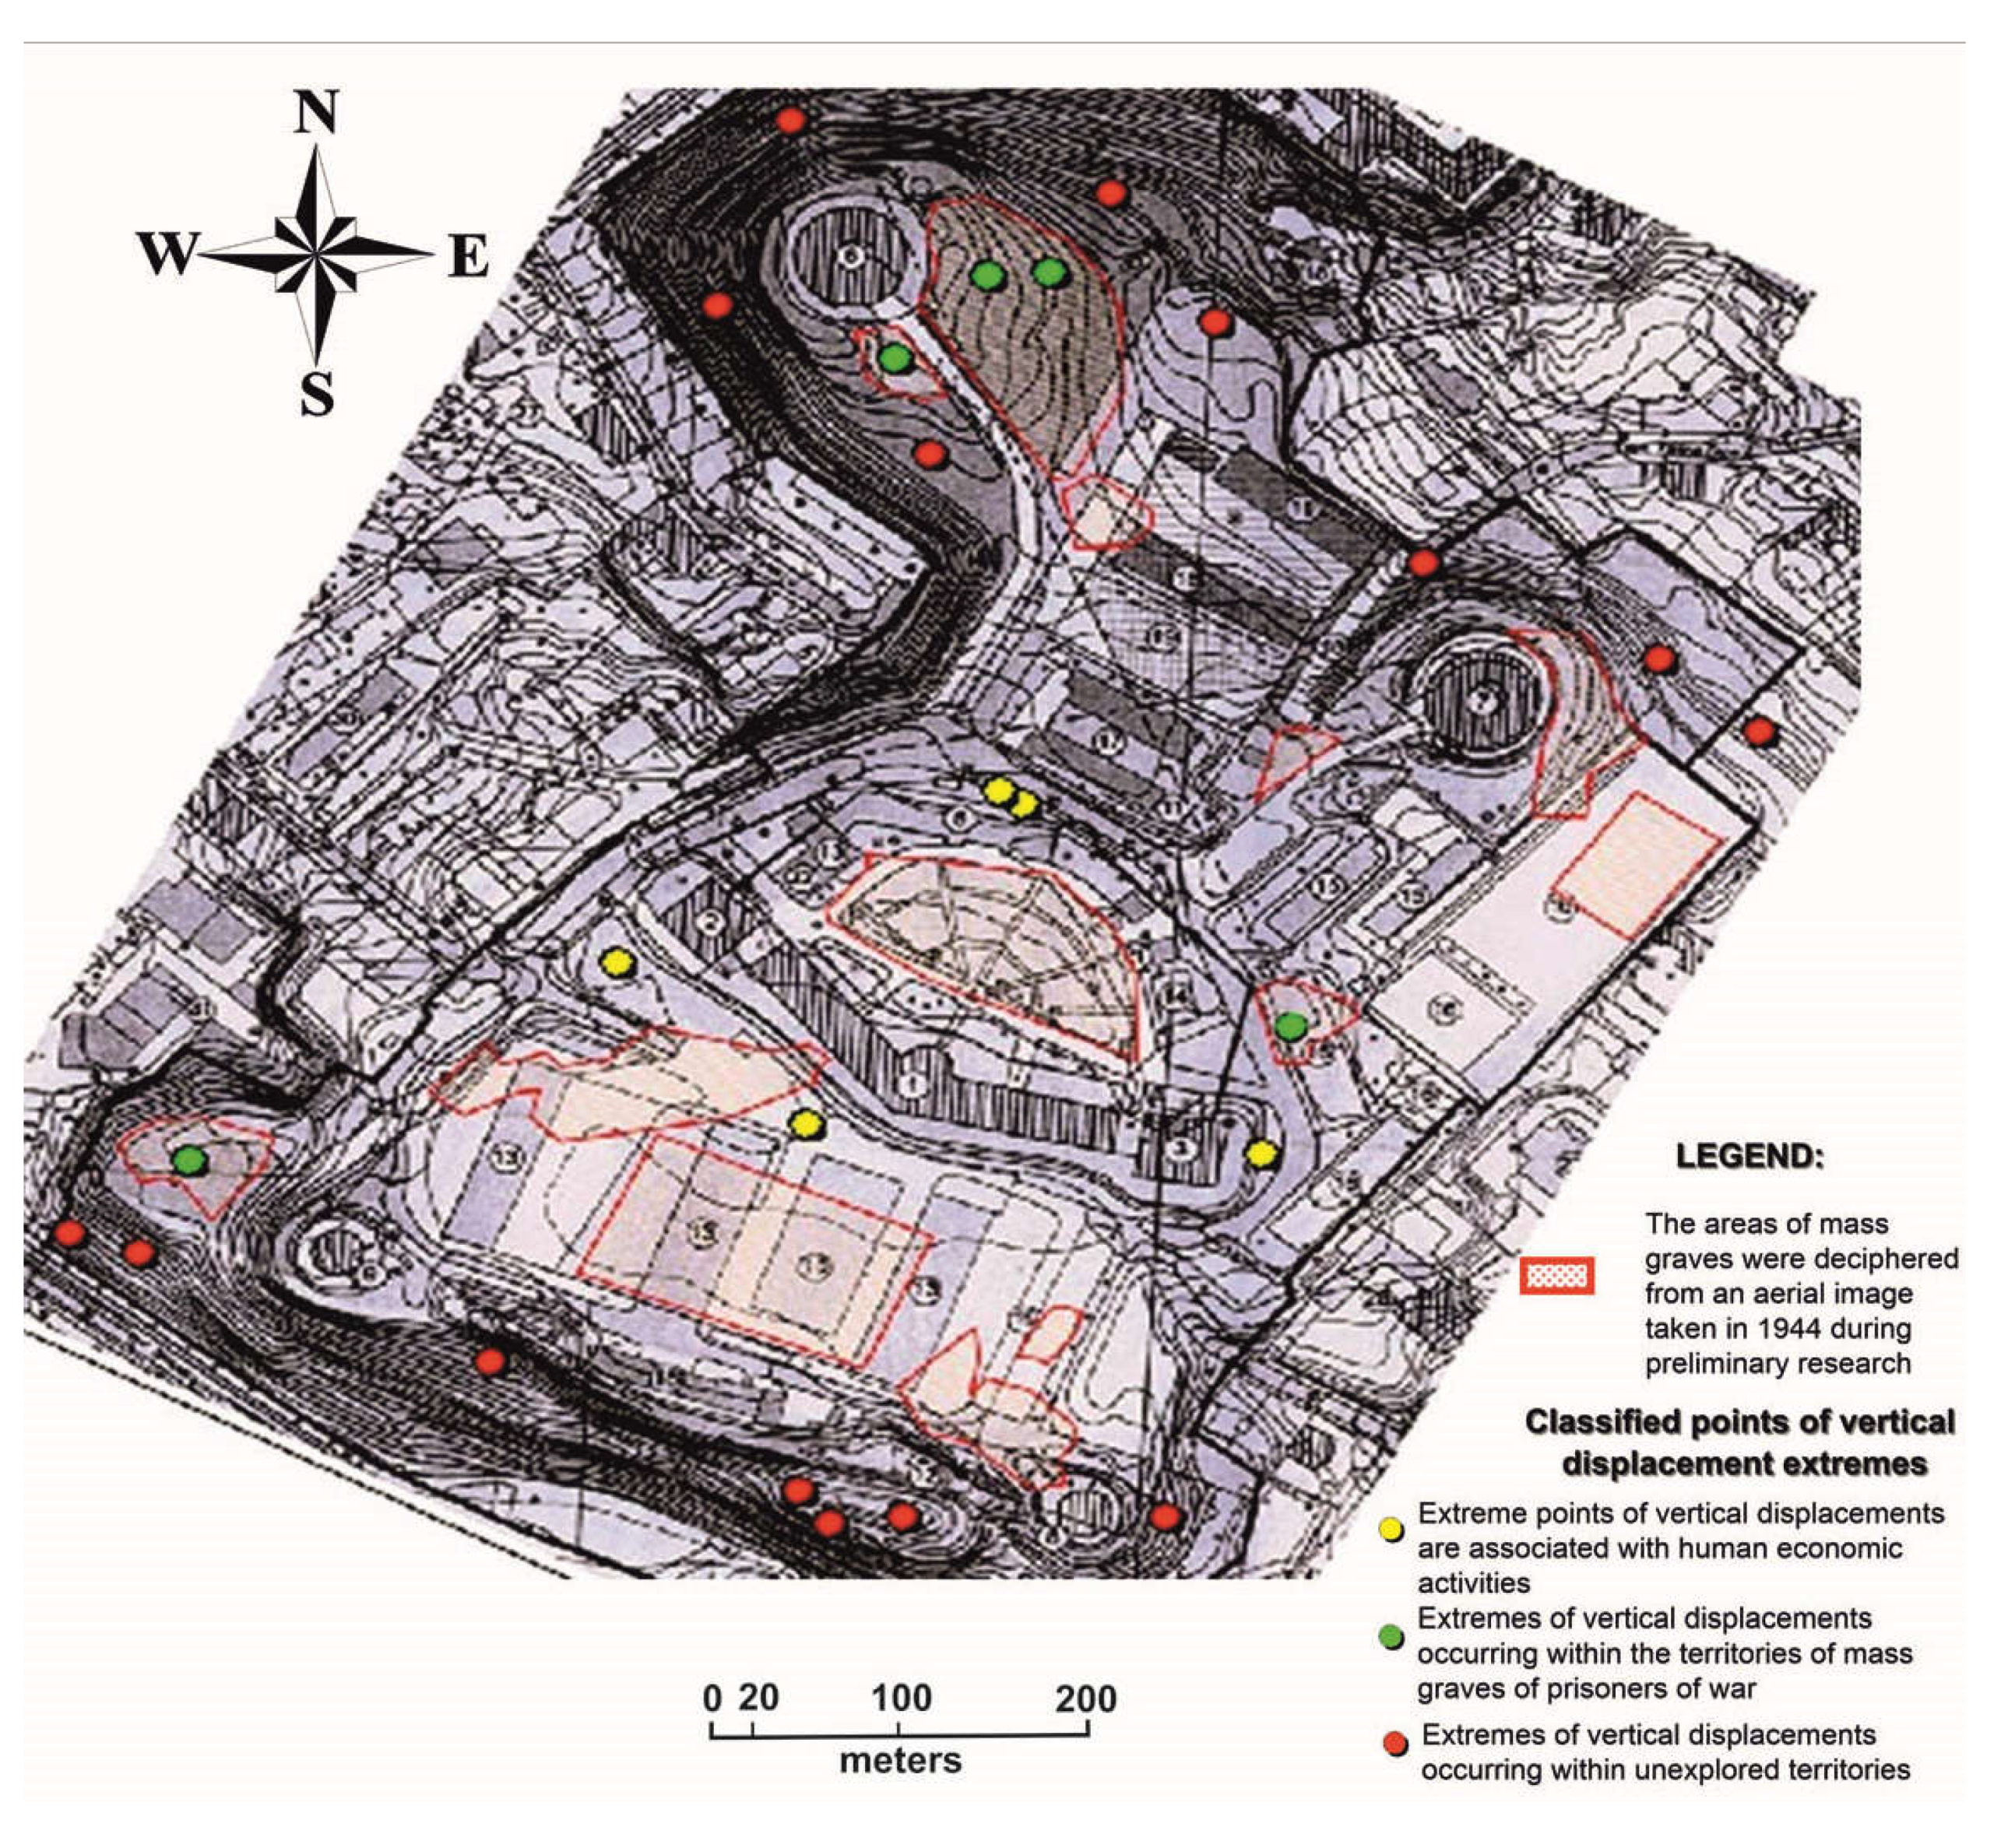
35], the territory of prisoner shootings and fraternal burials was overlaid onto the modern topographic plan of 2007 at a scale of 1:5000. Therefore, the points of extreme vertical displacements were color-coded: green for those falling within the areas of shootings and burials, yellow for those falling on the paved infrastructure likely formed by repair works, and red for those falling on the undeveloped territory. Additionally, the current boundary of the historical and cultural heritage object, represented by a thick black line, is delineated on the plan (
Figure 5).
The analysis of vertical displacements can reveal potential threats to historical structures, such as precipitation, erosion, soil subsidence, or geodynamic processes. This allows appropriate measures to be taken to prevent potential damage or destruction. Information about vertical displacements can be used for planning restoration work and preserving historical structures. This enables effective restoration measures that take into account the potential impacts of geodynamic processes [
36,
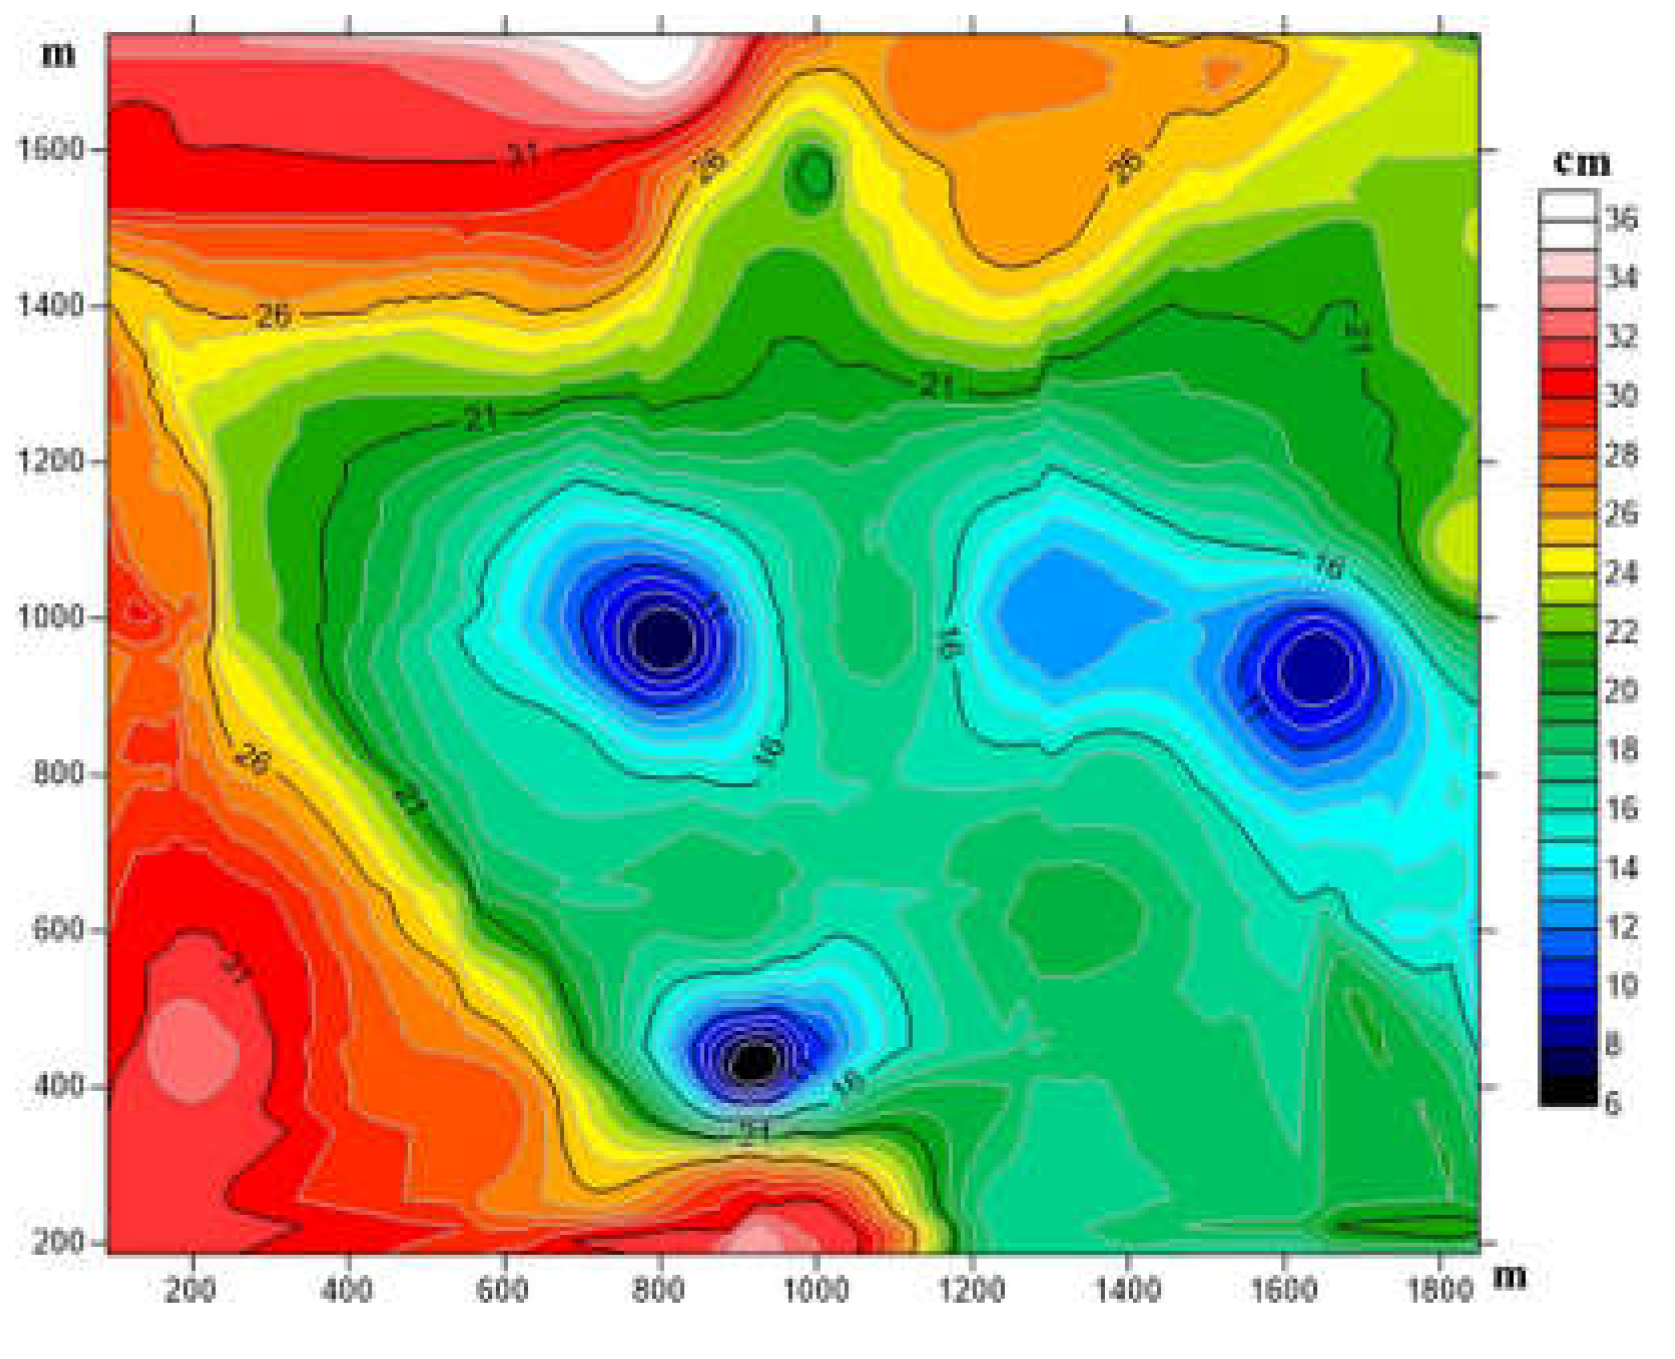
37]. Maps of vertical displacements serve as documentation of the state of historical structures at a certain period in time. This is important for archiving and monitoring changes over time, as well as for further scientific research. Map of maximum vertical displacements of the Earth's surface in the territory of the Citadel for the years 2020-2022 are presented in
Figure 6.
Area of Interest (AOI) 2 is a northern tennis court, closest to two smaller barracks. At a depth of approximately 0.3 m (t=11.88ns), there is an underground object measuring 20 m x 3 m, which diagonally crosses the tennis court and initially appears on ground-penetrating radar scans at a depth of 0.3 m. This object corresponds precisely to the disturbed ground area visible on the 1944 aerial photograph, and the results match well-defined historical excavations. The edges of the object are particularly well-defined closest to the southwest corner of the tennis court and extend beyond the surveyed area to the northwest corner of AOI 3.
The central cross-section of the object has less defined edges throughout its depth, possibly resulting from soil disturbance during the construction of the tennis courts. At a depth of approximately 0.7 m (t = 14.38ns), the clarity of the sides decreases, and additional features are observed within the main object. This may be reflections from objects within the excavation boundaries, but they are not observed along the entire length of the object and are notably absent where excavations may have occurred previously. Reflections from the northern edge of the object begin to lose clarity at a depth of about 0.8 m (t=15.63ns), unlike the southern side, where it remains clear at a depth of about 0.93 m (t=18.44ns). The object is not visible at depths exceeding 1.1 m (t=22.1ns).
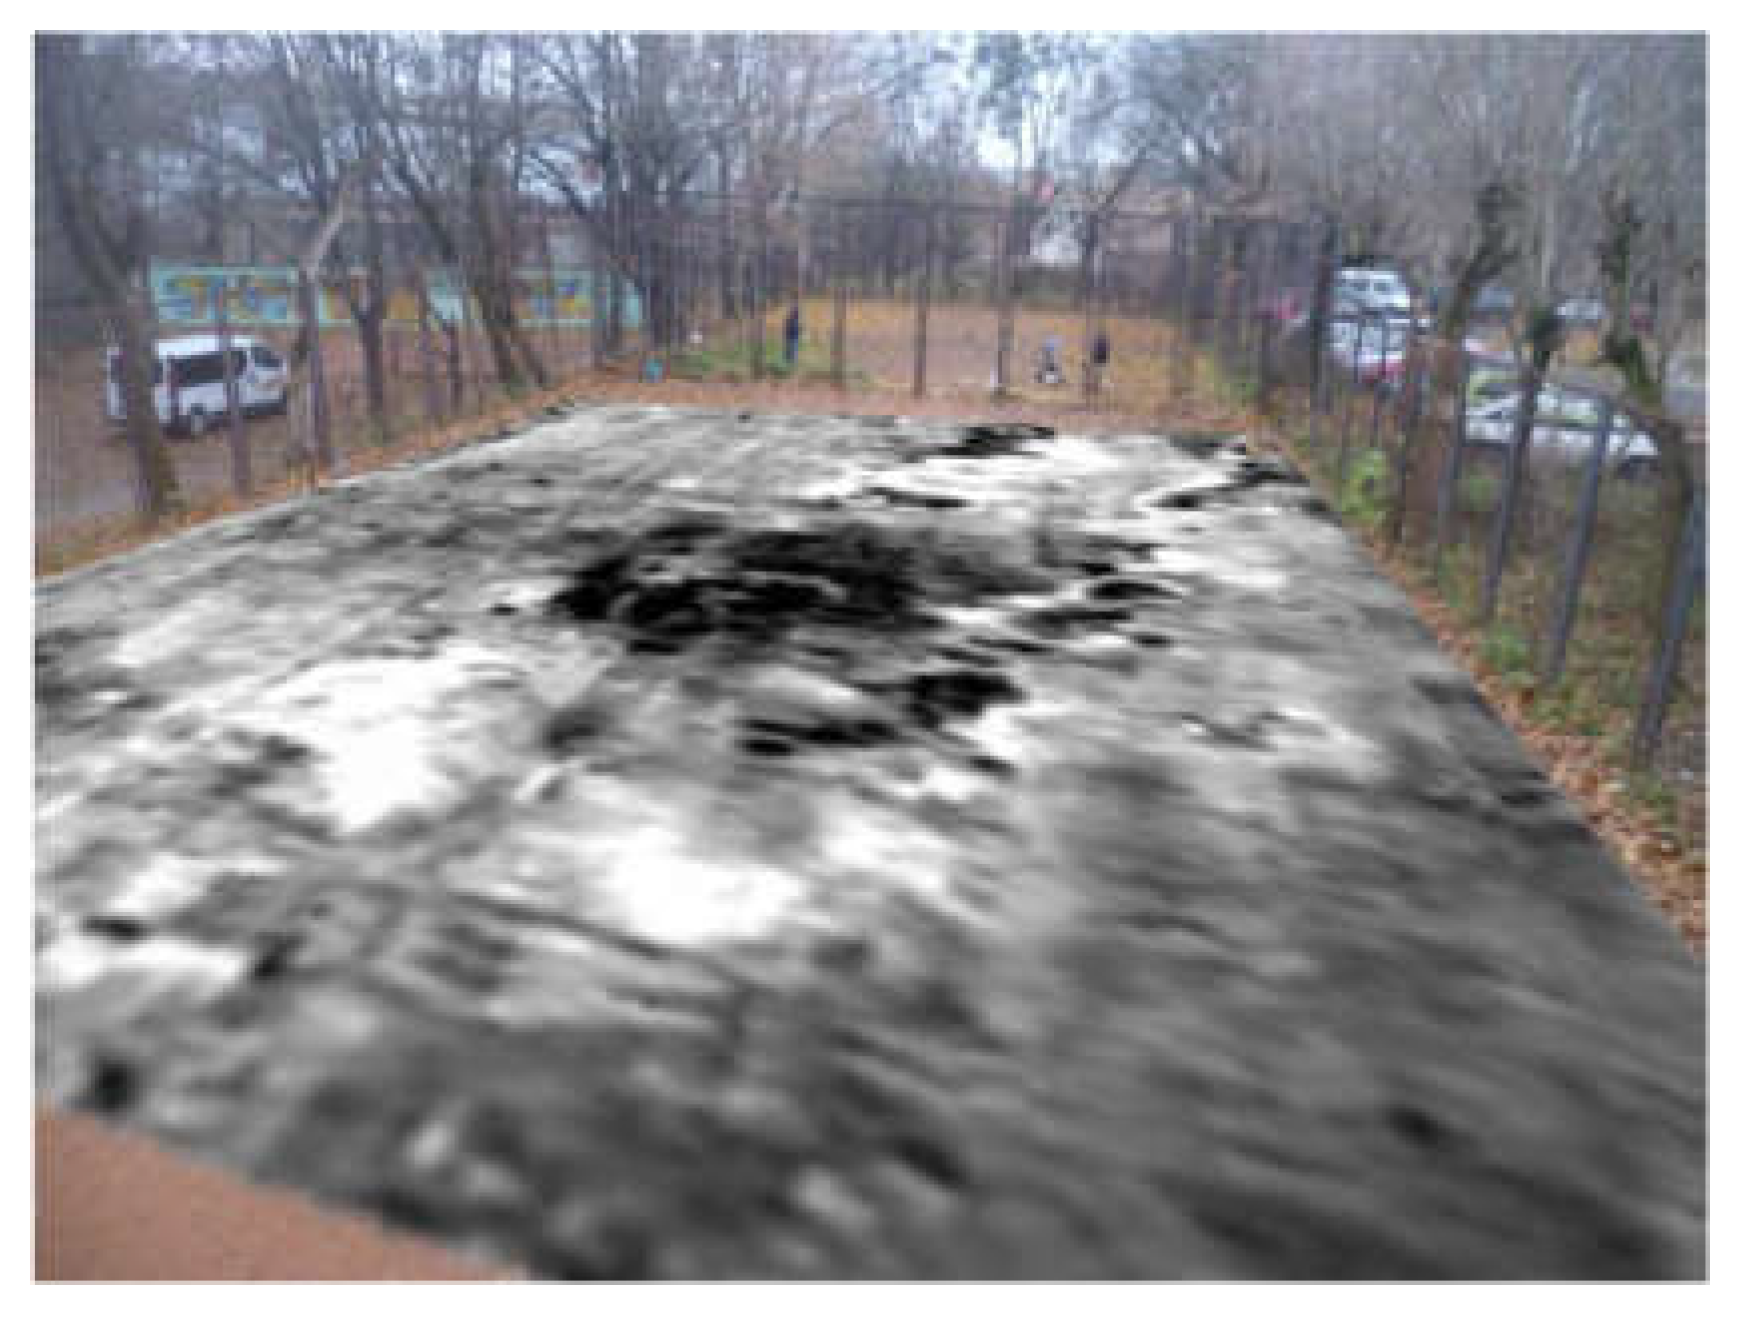
Figure 7 illustrates the interval of object AOI1 at a depth of approximately 0.68 meters (t=13.75 ns). Attention should be drawn to the darker visualization parts (higher amplitude) on the left side in the center of the object, indicating a possible disturbance that may have occurred during the construction of the tennis courts.
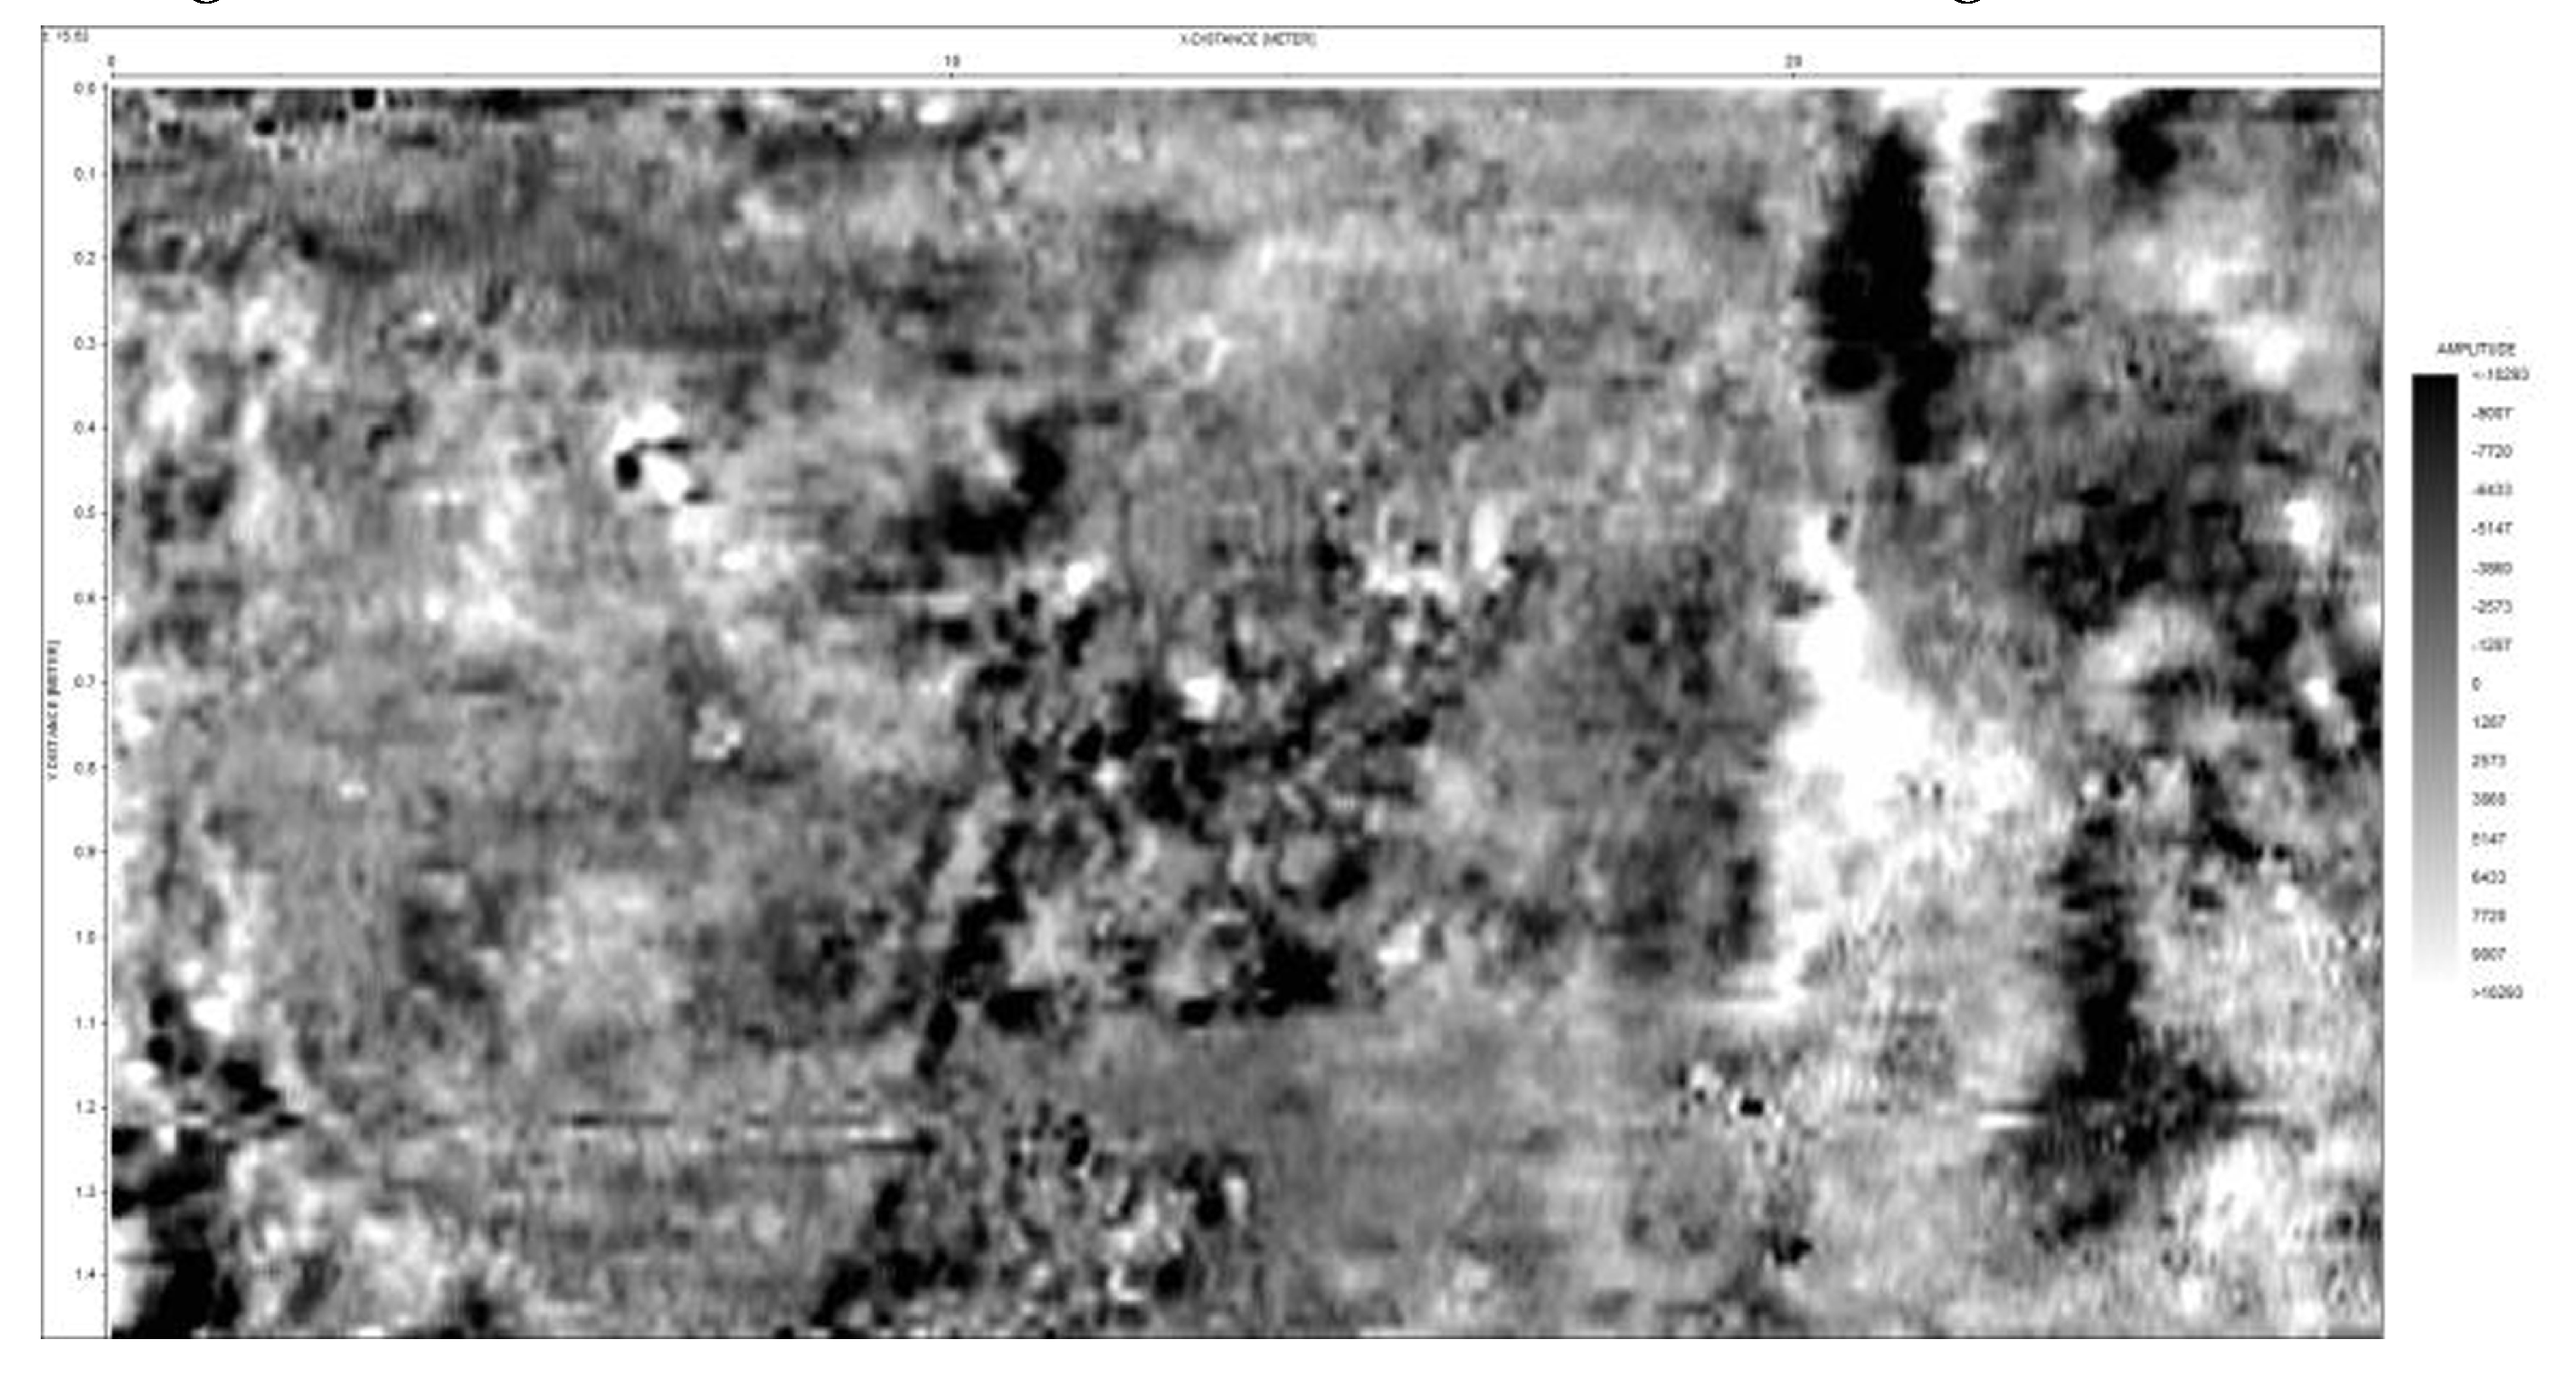
Figure 8 illustrates the interval of the object at a depth of approximately 0.78 meters (t=15.63 ns). The termination of this object can be observed at AOI2. A rectangular object can be seen below the center of the image. The soil outside the 1944 fence is located on the right side.
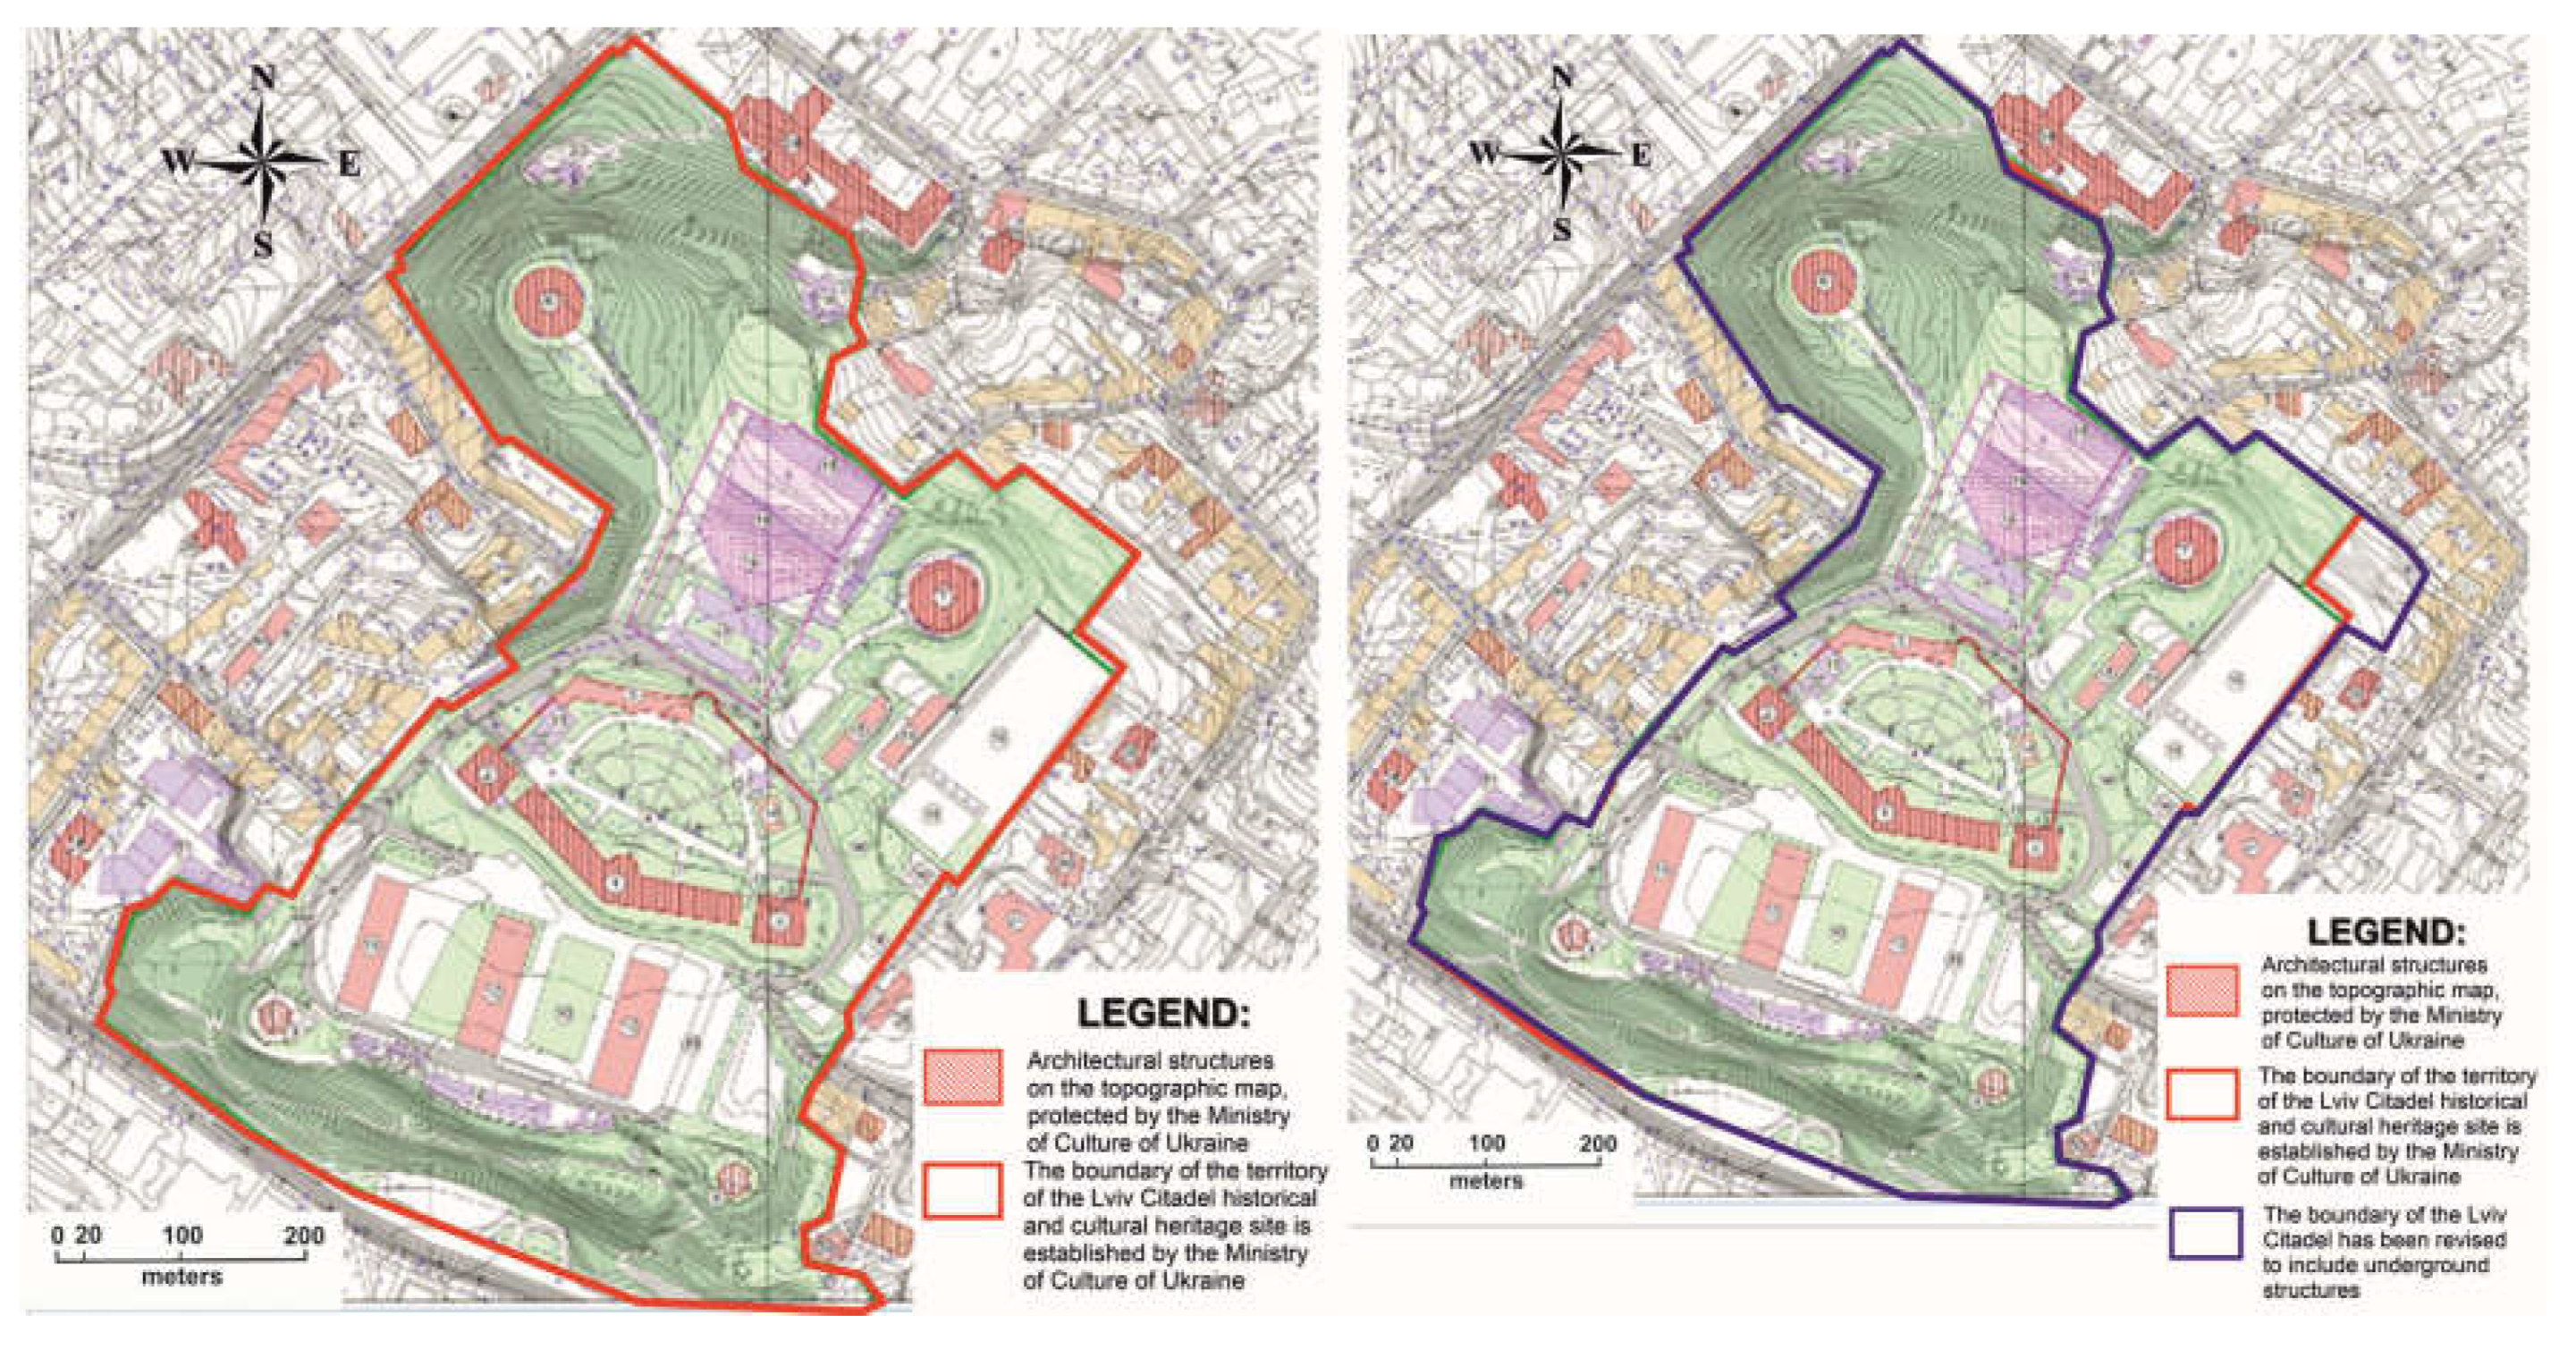
Using the newly acquired data from radar and ground-penetrating radar surveys, the boundaries of the historical and cultural heritage site, as established by the Ministry of Culture of Ukraine to date, were overlaid onto the modern topographic map from 2007, at a scale of 1:1000. Additionally, adjustments were made to the boundaries in light of the newly discovered underground artifacts (
Figure 9).
For the validation of the conceptual model for refining the boundaries of historical and cultural heritage sites and establishing protection zones around these sites, a software module has been developed and programmed. This module processes the synthetic aperture radar (SAR) data of the surface part and the ground-penetrating radar (GPR) profiles of the underground part of the object [
38,
39]. The main challenge in developing this software module was to mathematically integrate the results obtained from SAR and GPR.
Mathematical reconciliation of radar and ground-penetrating radar (GPR) data can be achieved using various data processing methods, including filtering and signal processing techniques. One approach to reconciling the results involves utilizing filtering algorithms such as the Kalman filter. This method relies on computing the system state estimation based on processed information from all sources and modeling the system using stochastic differential equations. Another approach to reconciling the data involves using signal processing algorithms like correlation analysis. This method is based on comparing signals obtained from different sources and determining the degree of their correspondence. Additionally, other mathematical methods such as principal component analysis, classification methods, and pattern recognition can be employed to reconcile the data processing results.
Regardless of the approach, when reconciling the results of radar and GPR data processing, it is essential to consider the characteristics of each method and data source and ensure the quality and accuracy of data processing.
To combine the results of spaceborne radar interferometry from the Sentinel-1 satellite and GPR imaging at a specific point, a weighted approach can be utilized (1).
where:
R - the result of combining the two methods for a specific point on the surface;
α and β - weights that determine the importance of each data source in the combined result. These weights can be determined by experts or through optimization depending on the specific application;
Ci - the measurement result obtained from spaceborne radar interferometry at a specific point;
Cg - the result of ground-penetrating radar imaging at the same point;
This approach allows combining information from both sources to obtain a more complete and reliable representation of a specific point.
The formula for combining InSAR (Interferometric Synthetic Aperture Radar) and GPR (Ground Penetrating Radar) can be complex and depend on specific use cases. However, the general idea is to integrate information obtained from both sources to improve the accuracy of interpreting and analyzing geological structures or soil properties.
A possible general formula (2) could be:
Here, f is a function that may include various data processing operations, filtering, and other analysis methods to achieve a more accurate result.
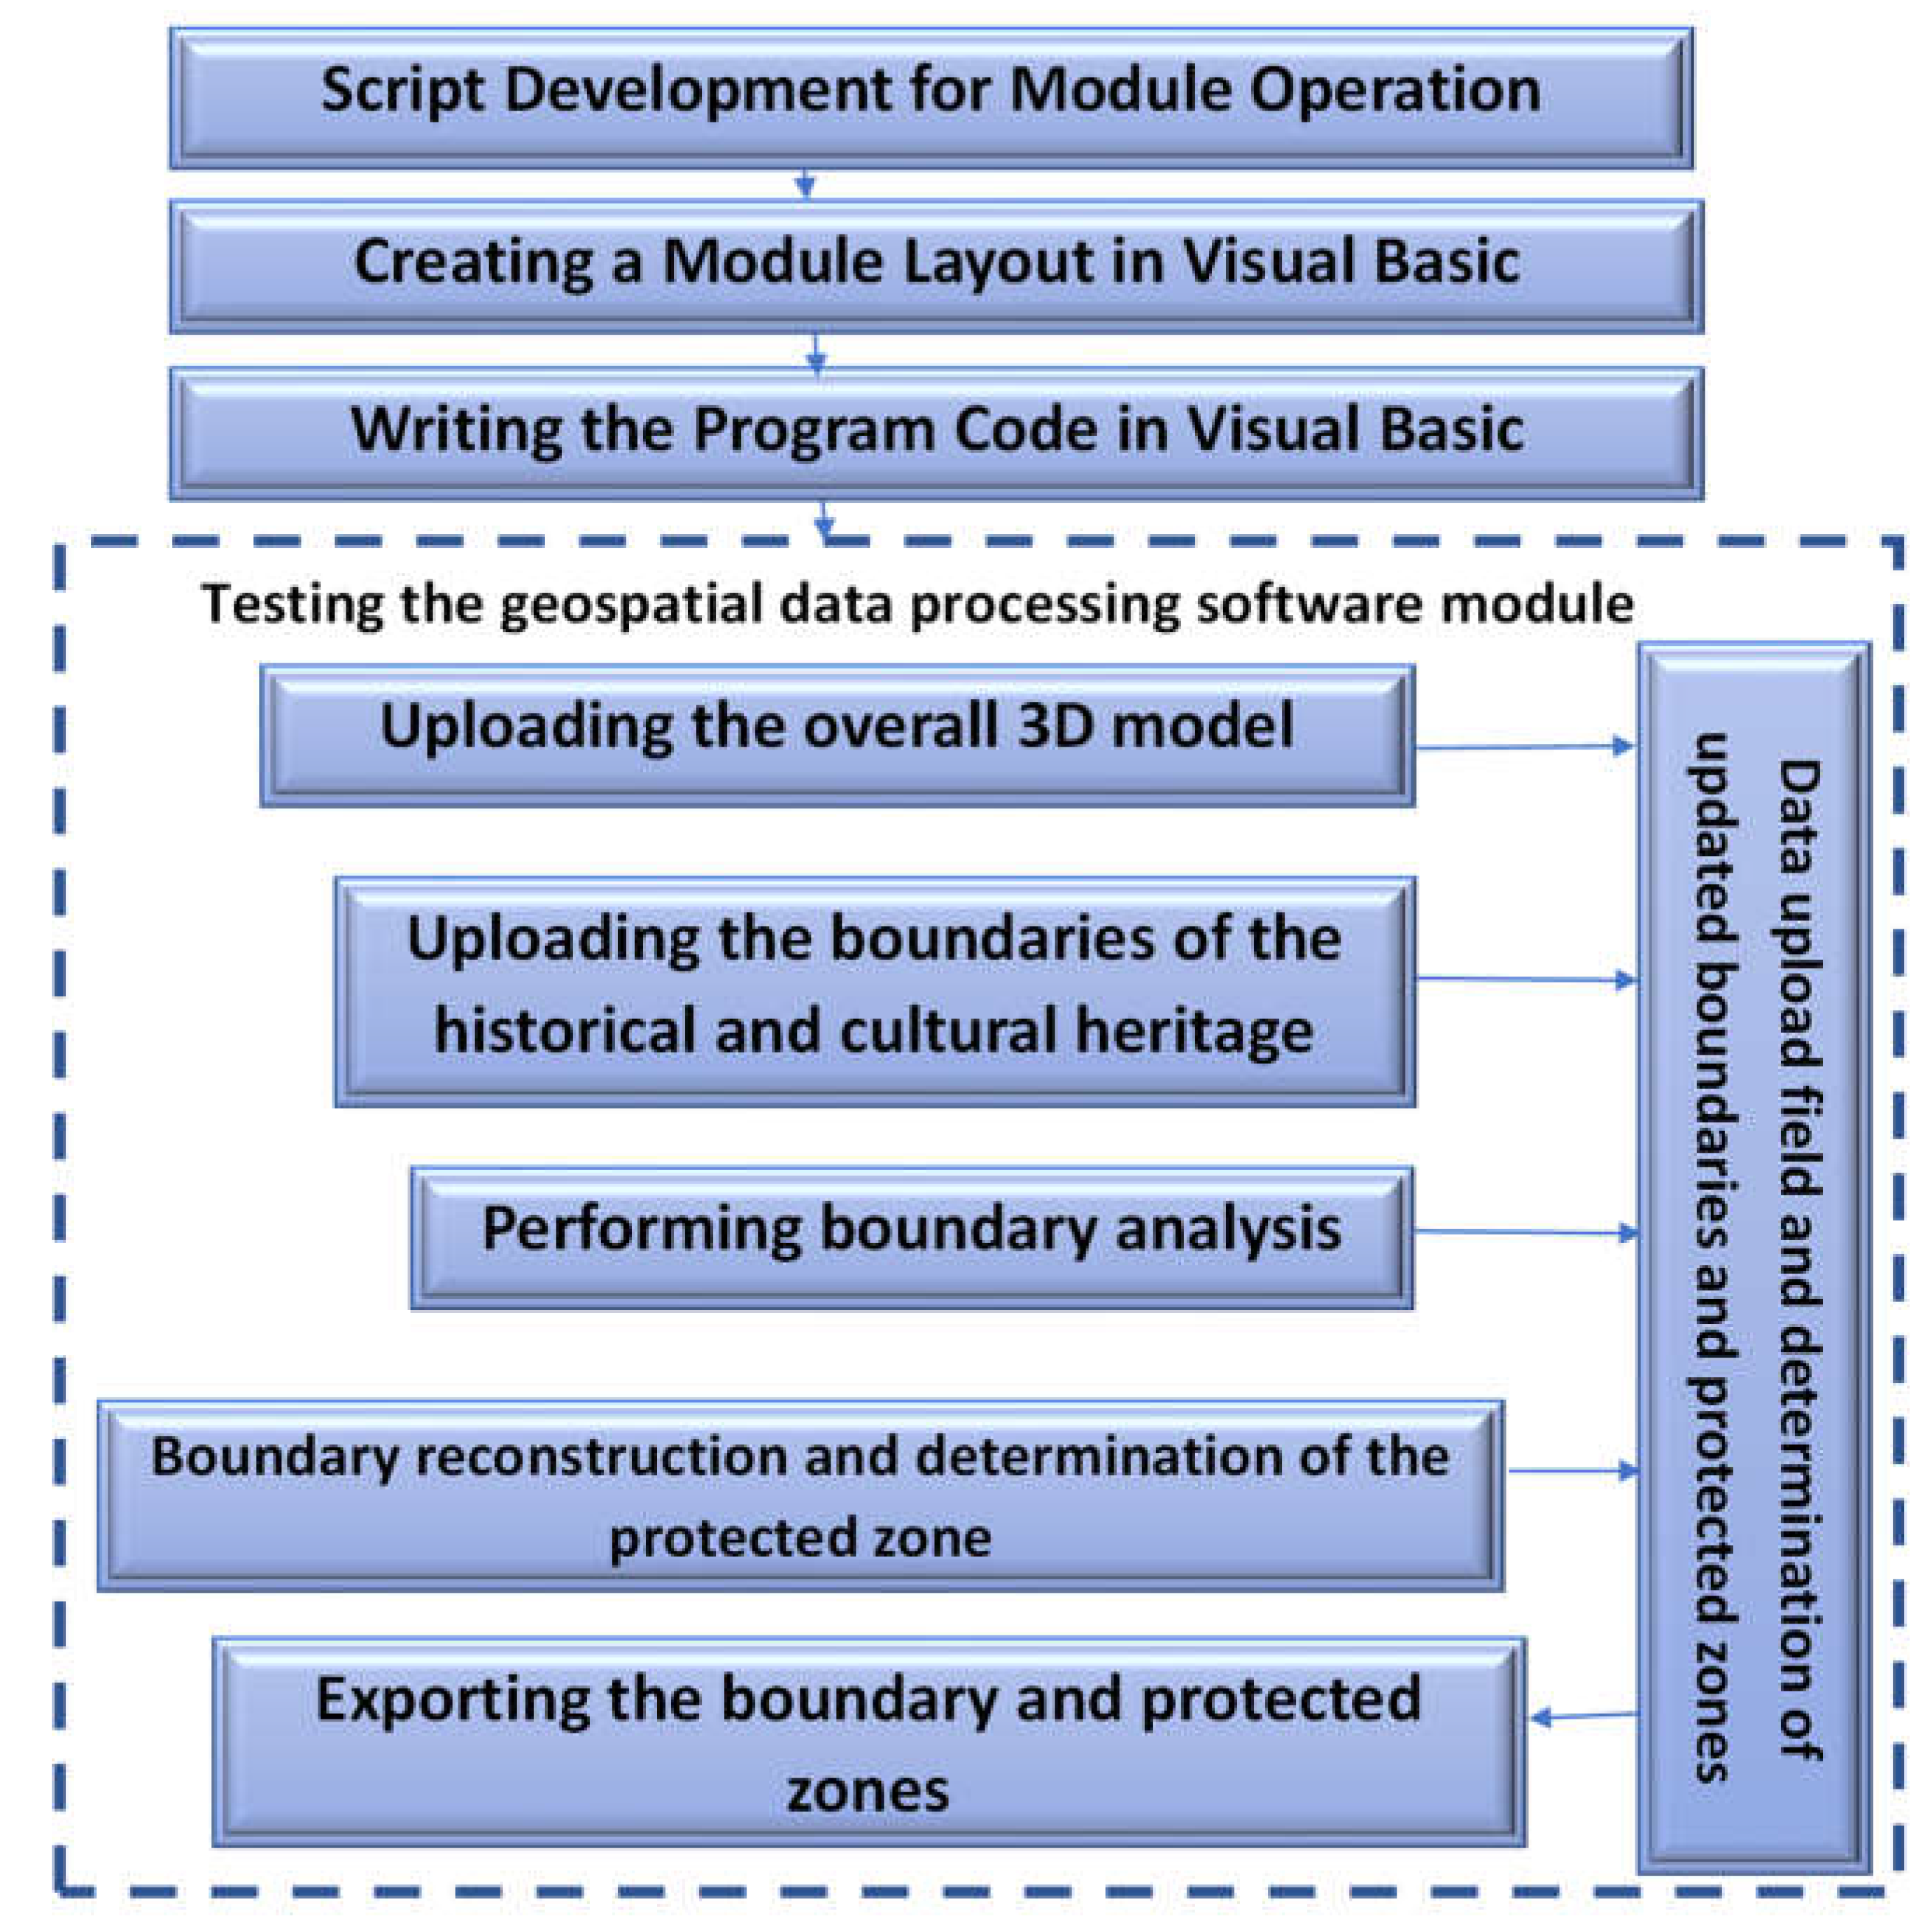
For the creation of the software module, a technological scheme was proposed, as shown in
Figure 10.
To automate the described processes, a software module was developed in the VisualBasic programming language for refining the boundaries of historical and cultural heritage sites. Although VisualBasic is less suitable for programming cartographic elements compared to, for example, Python, its advantage lies in its object-oriented nature and full integration with the Windows operating system. By using additional modules available for VisualBasic, we were able to implement the assigned task.
For testing and validation of the created software module, graphical materials on the Lviv Citadel were used in raster and vector formats, namely: Citadel's Cadastral Map in GeoTIFF format, radarogram of radar scanning of individual areas of interest of the Citadel in GeoTIFF format, vector layer of digitized radarogram anomalies in DXF vector format, and the boundary of the historical and cultural heritage site in DXF vector format.
The program execution started with testing the first functional block "Data Loading." When the command "Load 3D Model" is executed, the GeoTIFF format CAD model of the Citadel is loaded.
Next, we proceed to the next step - loading the radiogram obtained from the ground-penetrating radar survey in GeoTIFF format. Then, commands to load vectorized anomalies based on the radiograms of ground-penetrating radar survey are executed in DXF vector exchange format.
In fact, the dataset loaded in the window in
Figure 11 is final for analysis, and we can proceed to the next functional block. The first command executed in the second block is "Boundary Analysis," and its execution is hidden, with the result being loaded into the computer's memory. That is, after executing this command, the picture inside the window remains unchanged. This command performs an overlay analysis of the loaded data, after which the module determines whether all additional elements fit within the existing object boundary. If so, the next commands are unnecessary. If not, the software rebuilds the boundary according to the newly identified elements.
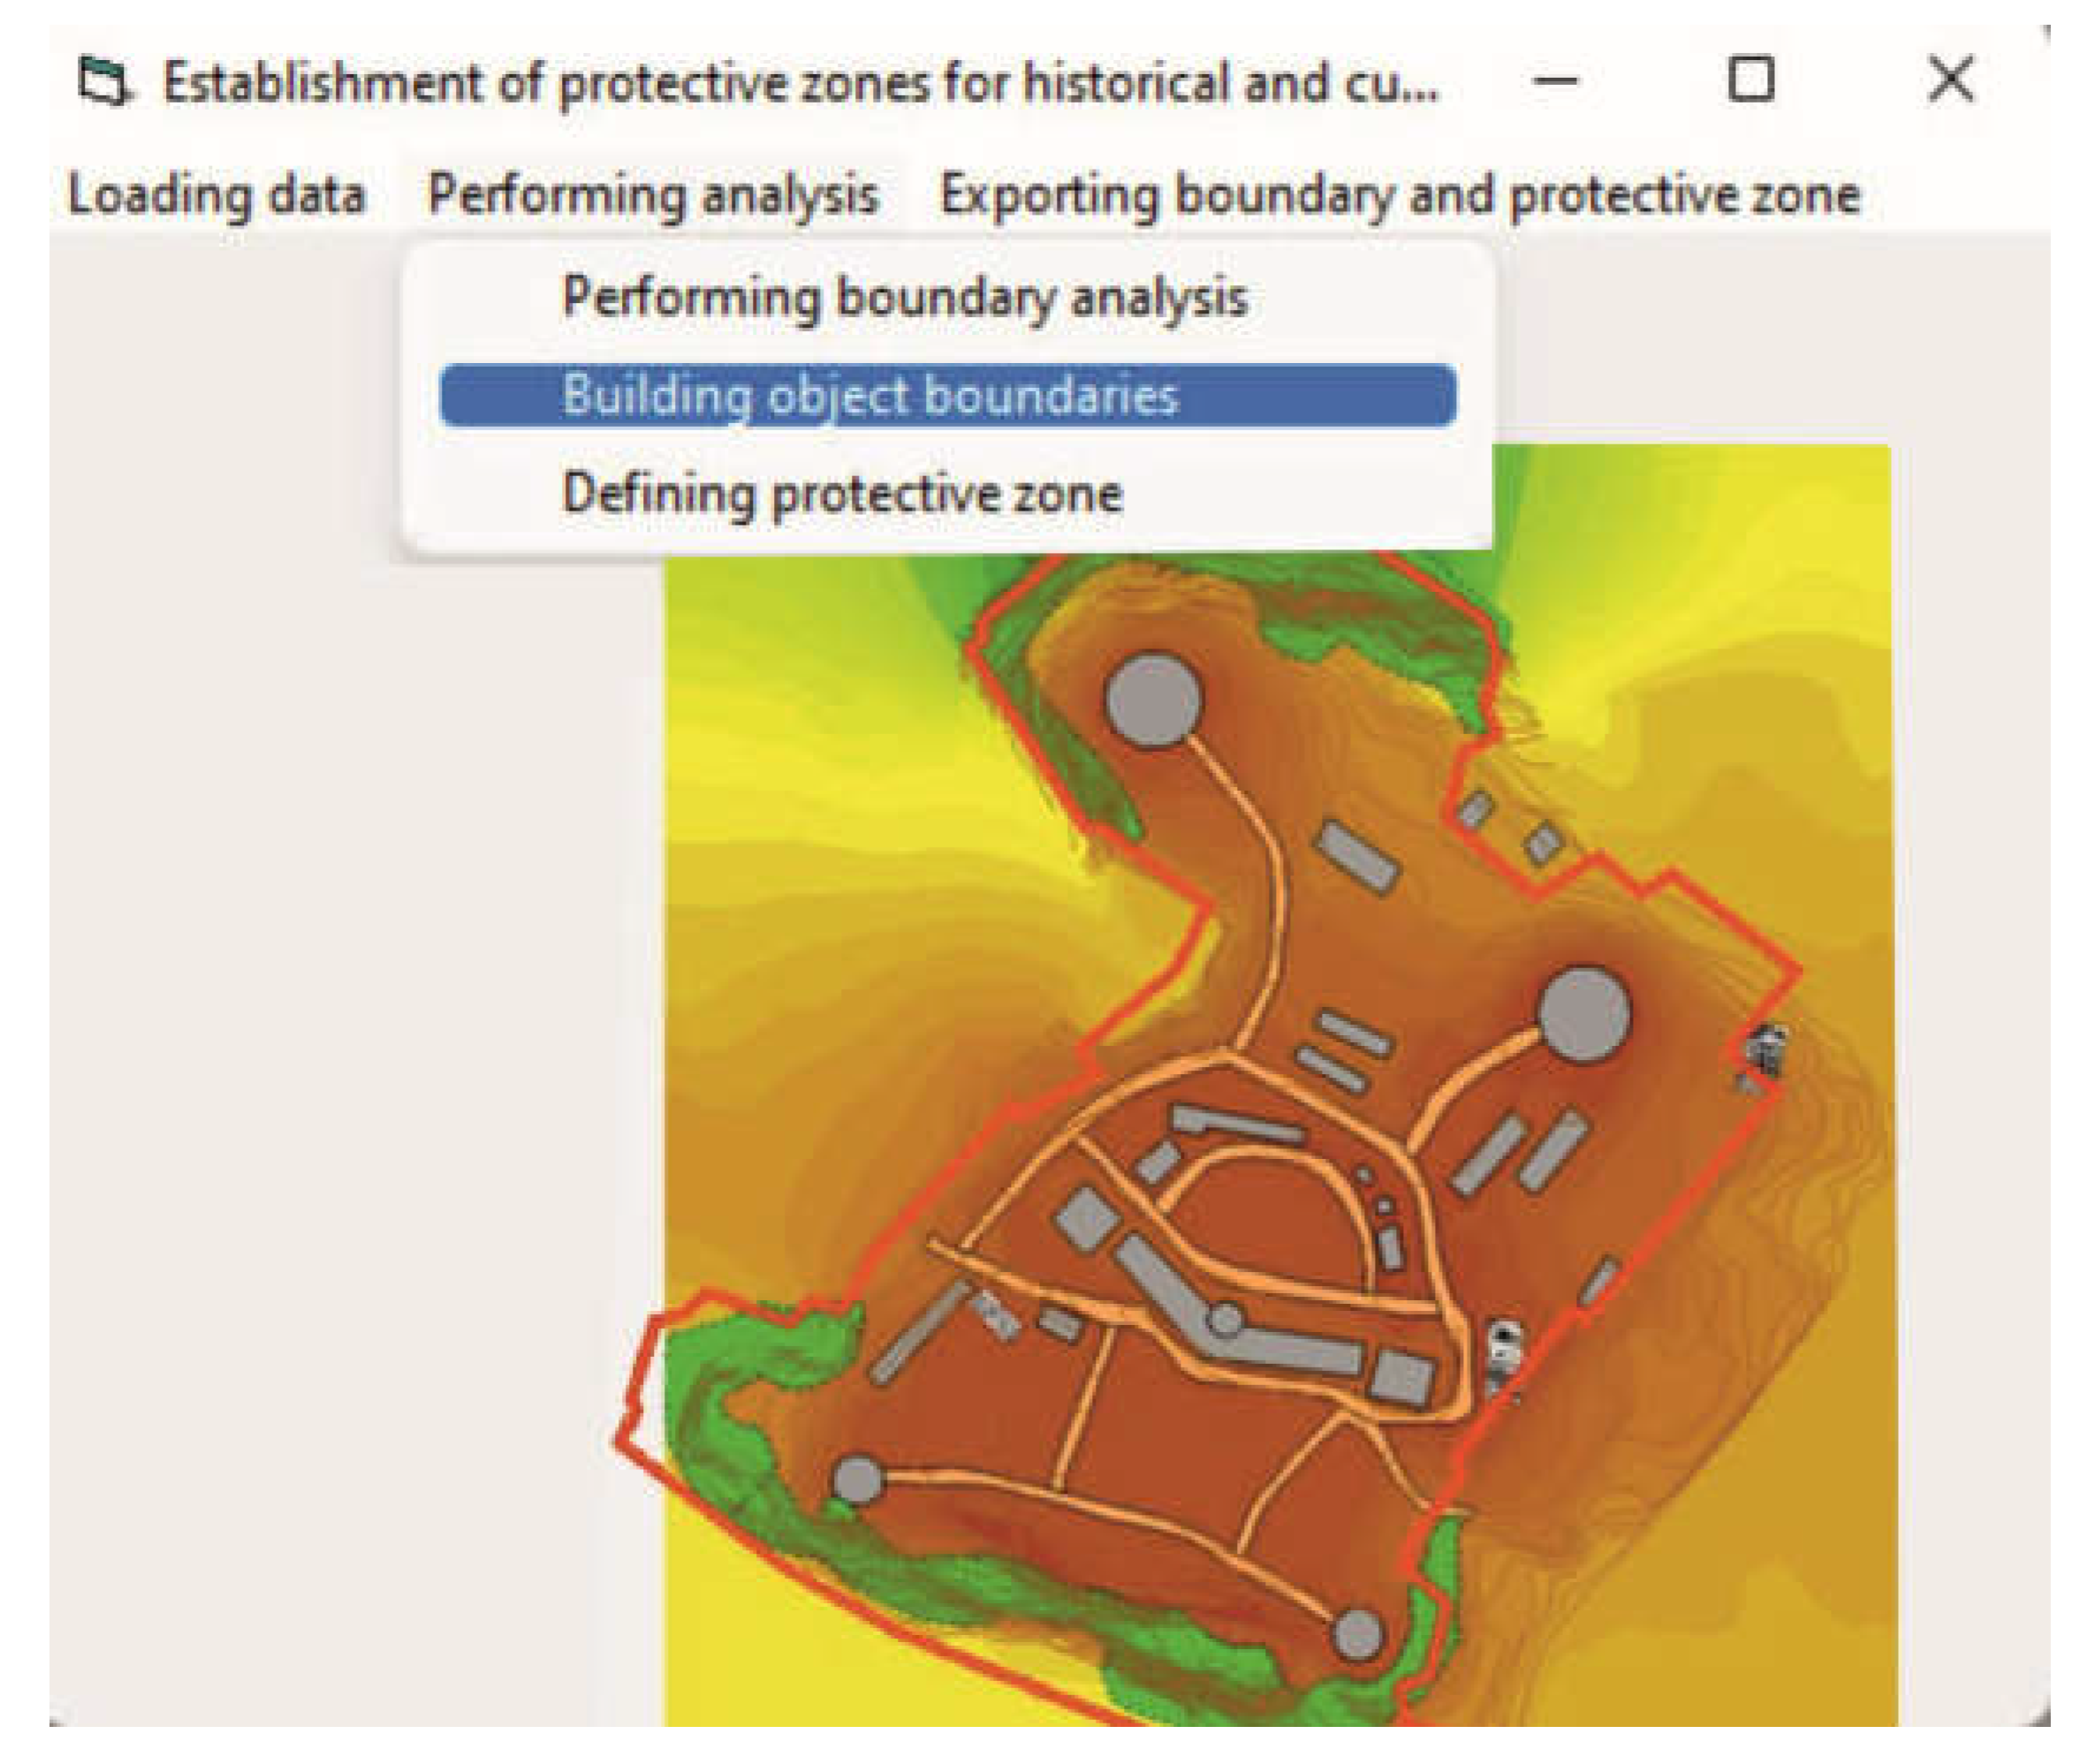
The next step is executing the command for boundary reconstruction (
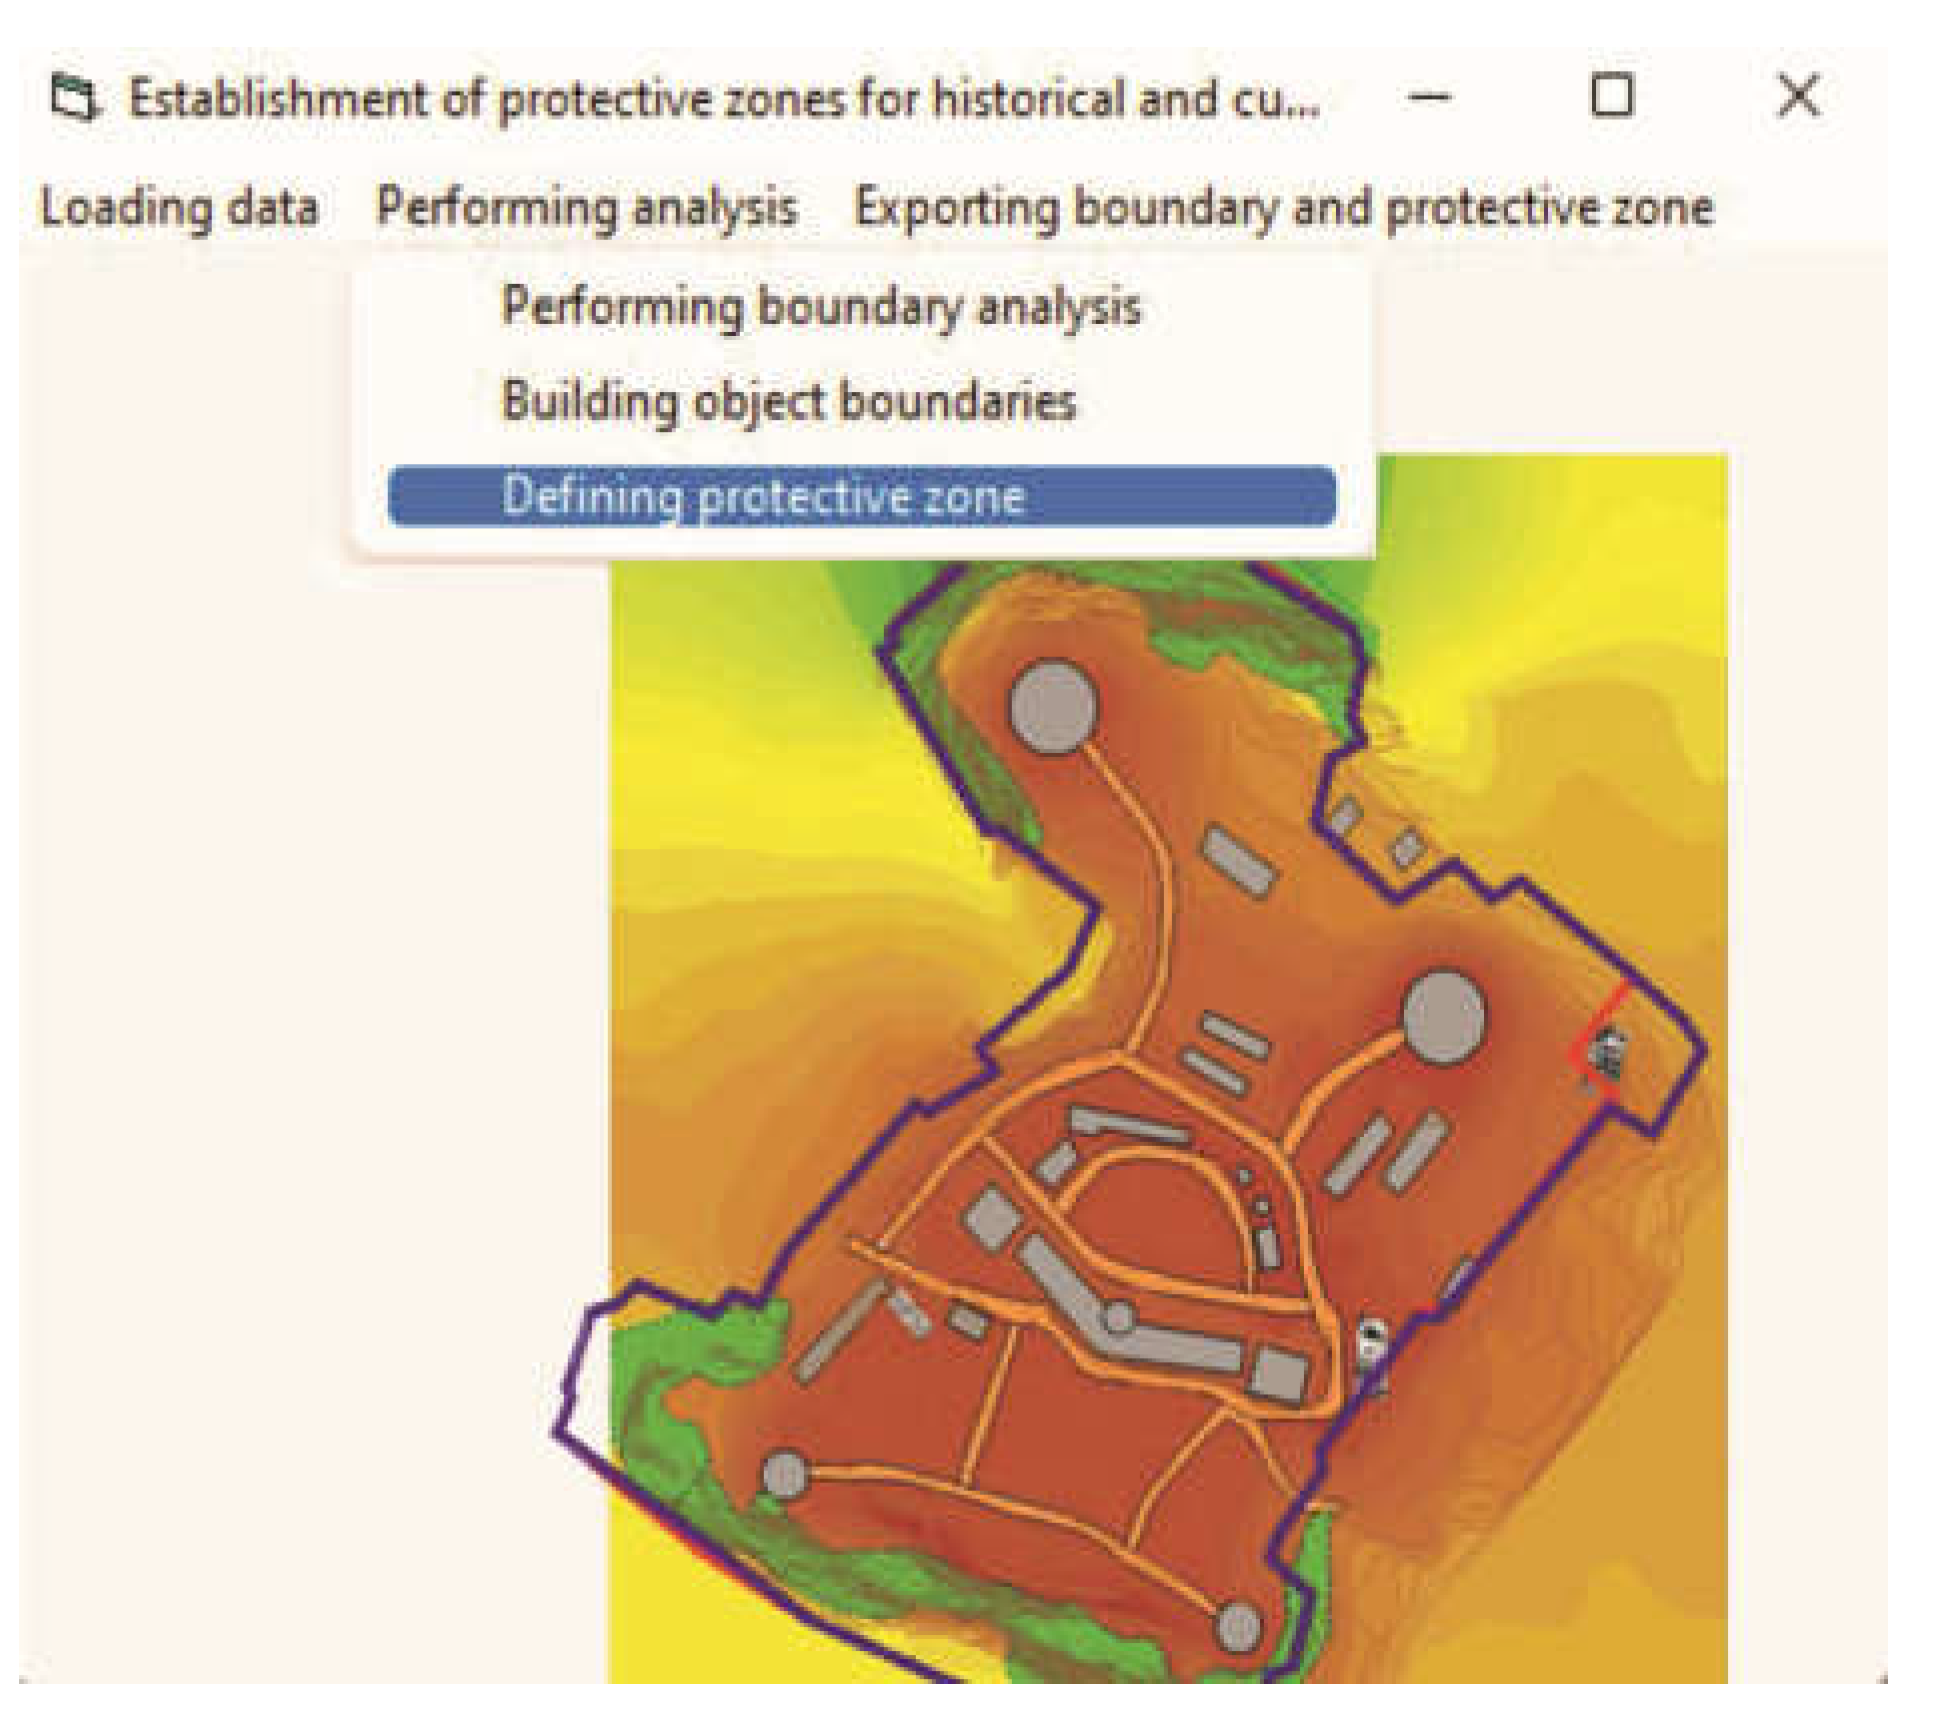
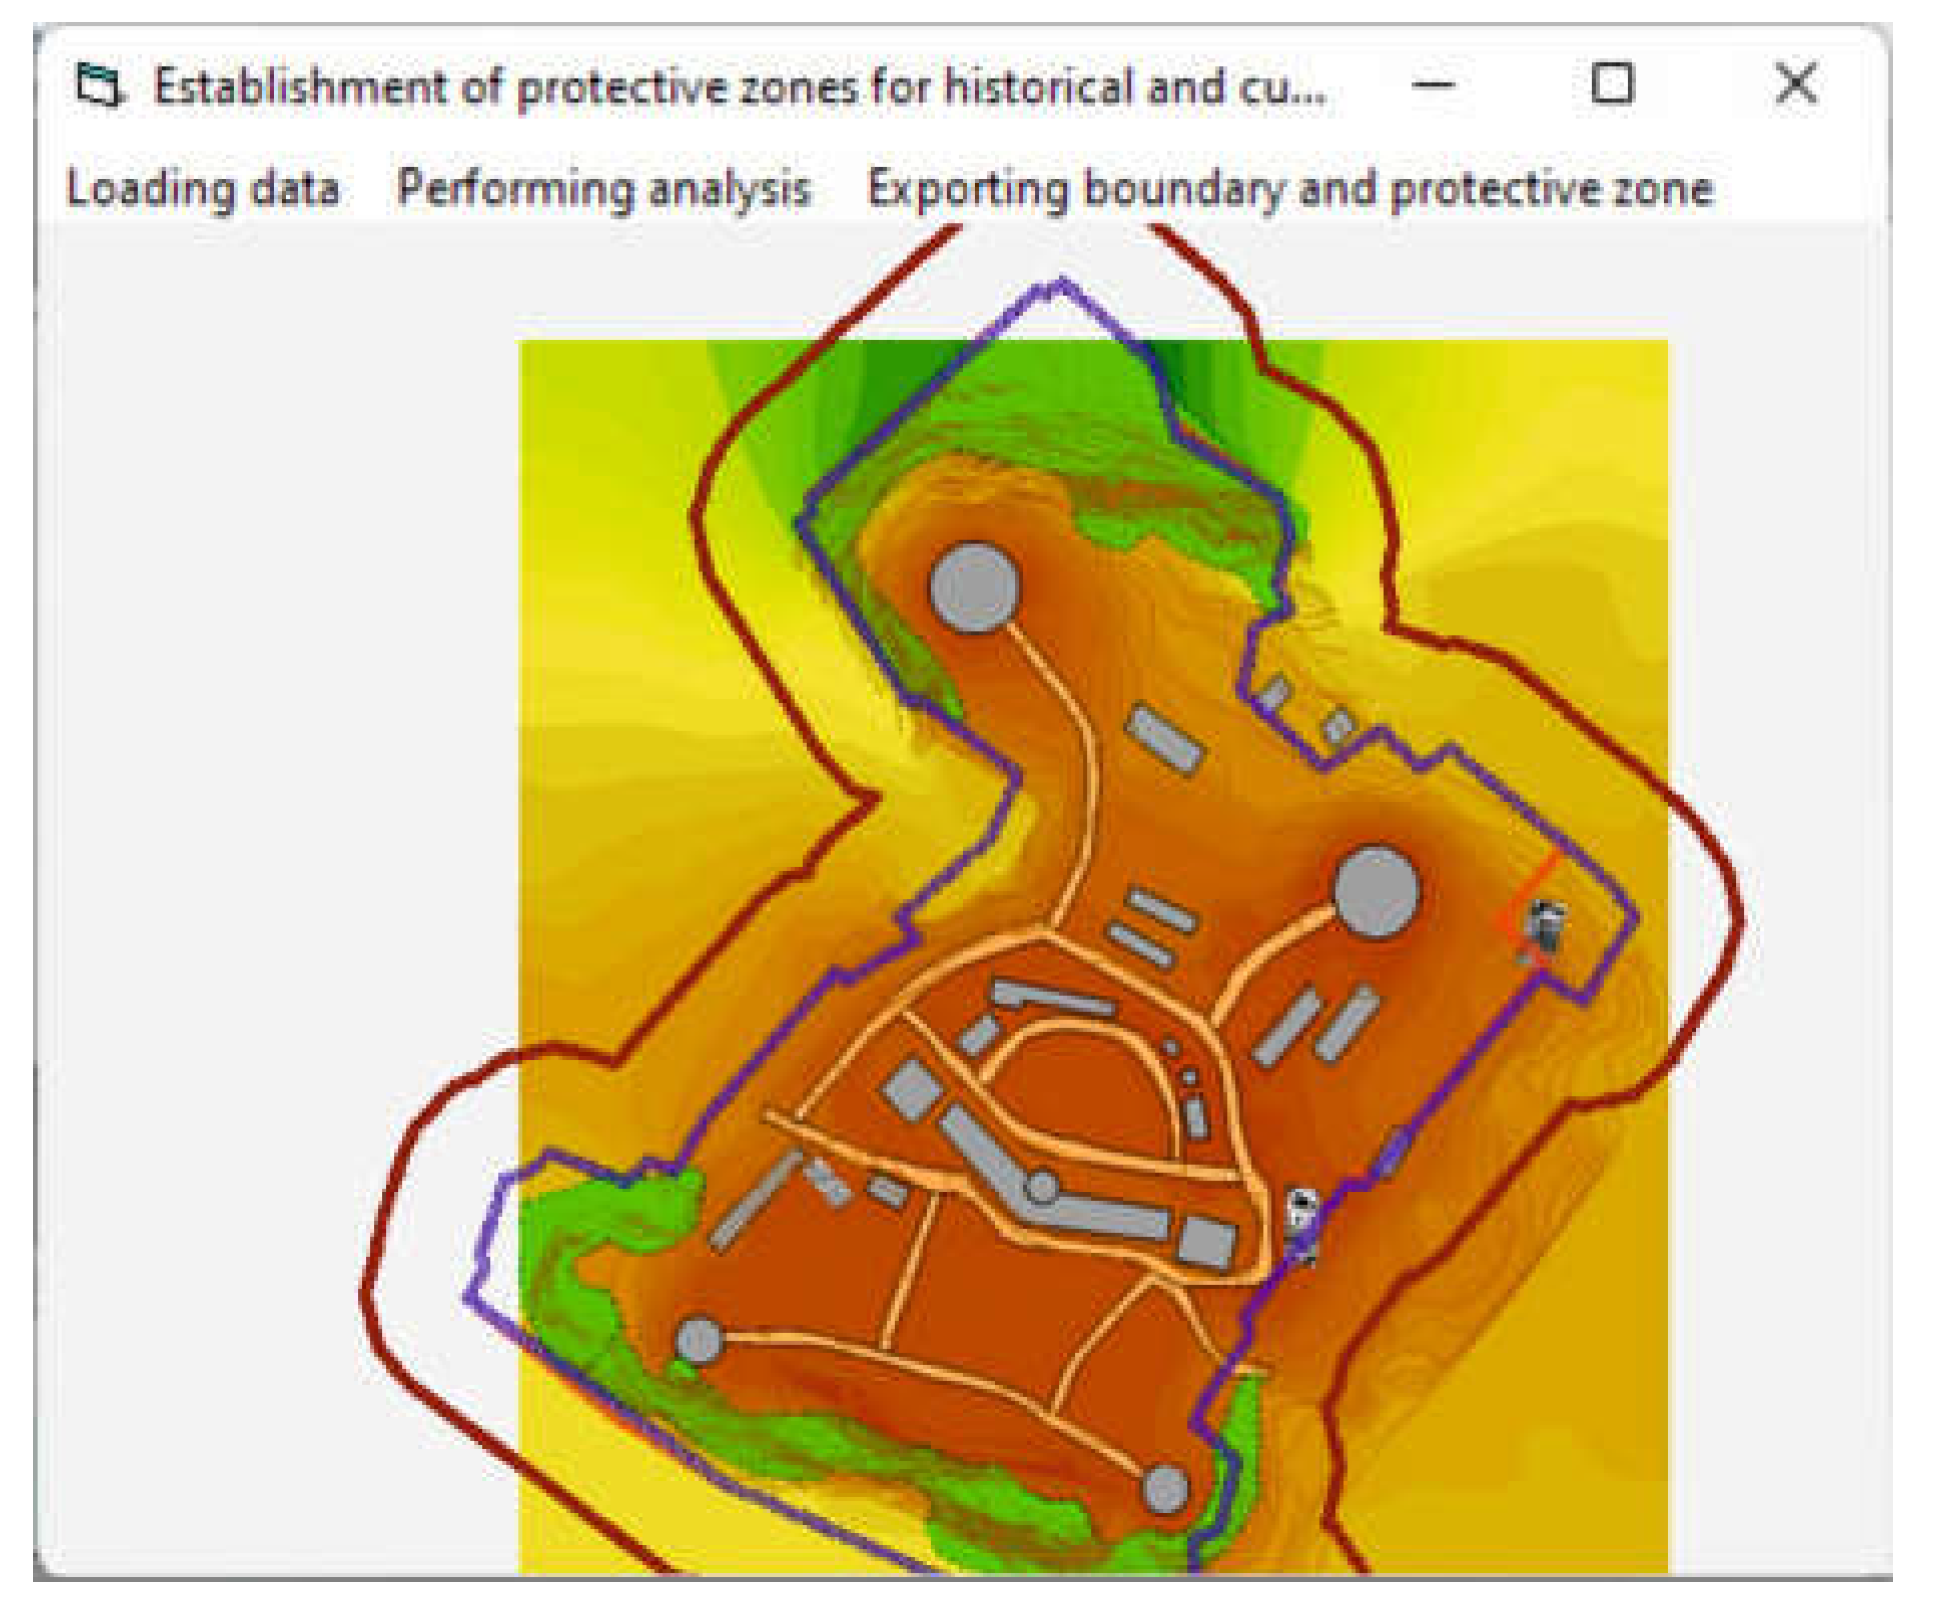
Figure 12), as a result of which the program visualizes the outcome of the previous step from its memory in the data field. After the reconstruction of the object's boundaries according to the new elements, the protective zone of the cultural heritage object is constructed (
Figure 13).
The result of the module execution is the reconstructed updated boundary of the object of historical and cultural heritage with an automatically generated protective zone (Figure 14). This result can then be exported to the exchange vector format DXF and opened in any geographic information system or CAD system for further work.
It is worth noting that this module is advisable to apply to already registered objects of cultural heritage based on the centroids of polygons when there is a need for directly refining the boundaries of the object itself.
