Submitted:
28 April 2024
Posted:
29 April 2024
You are already at the latest version
Abstract
Keywords:
1. Introduction
2. Materials and Methods
2.1. Chemicals and Reagents
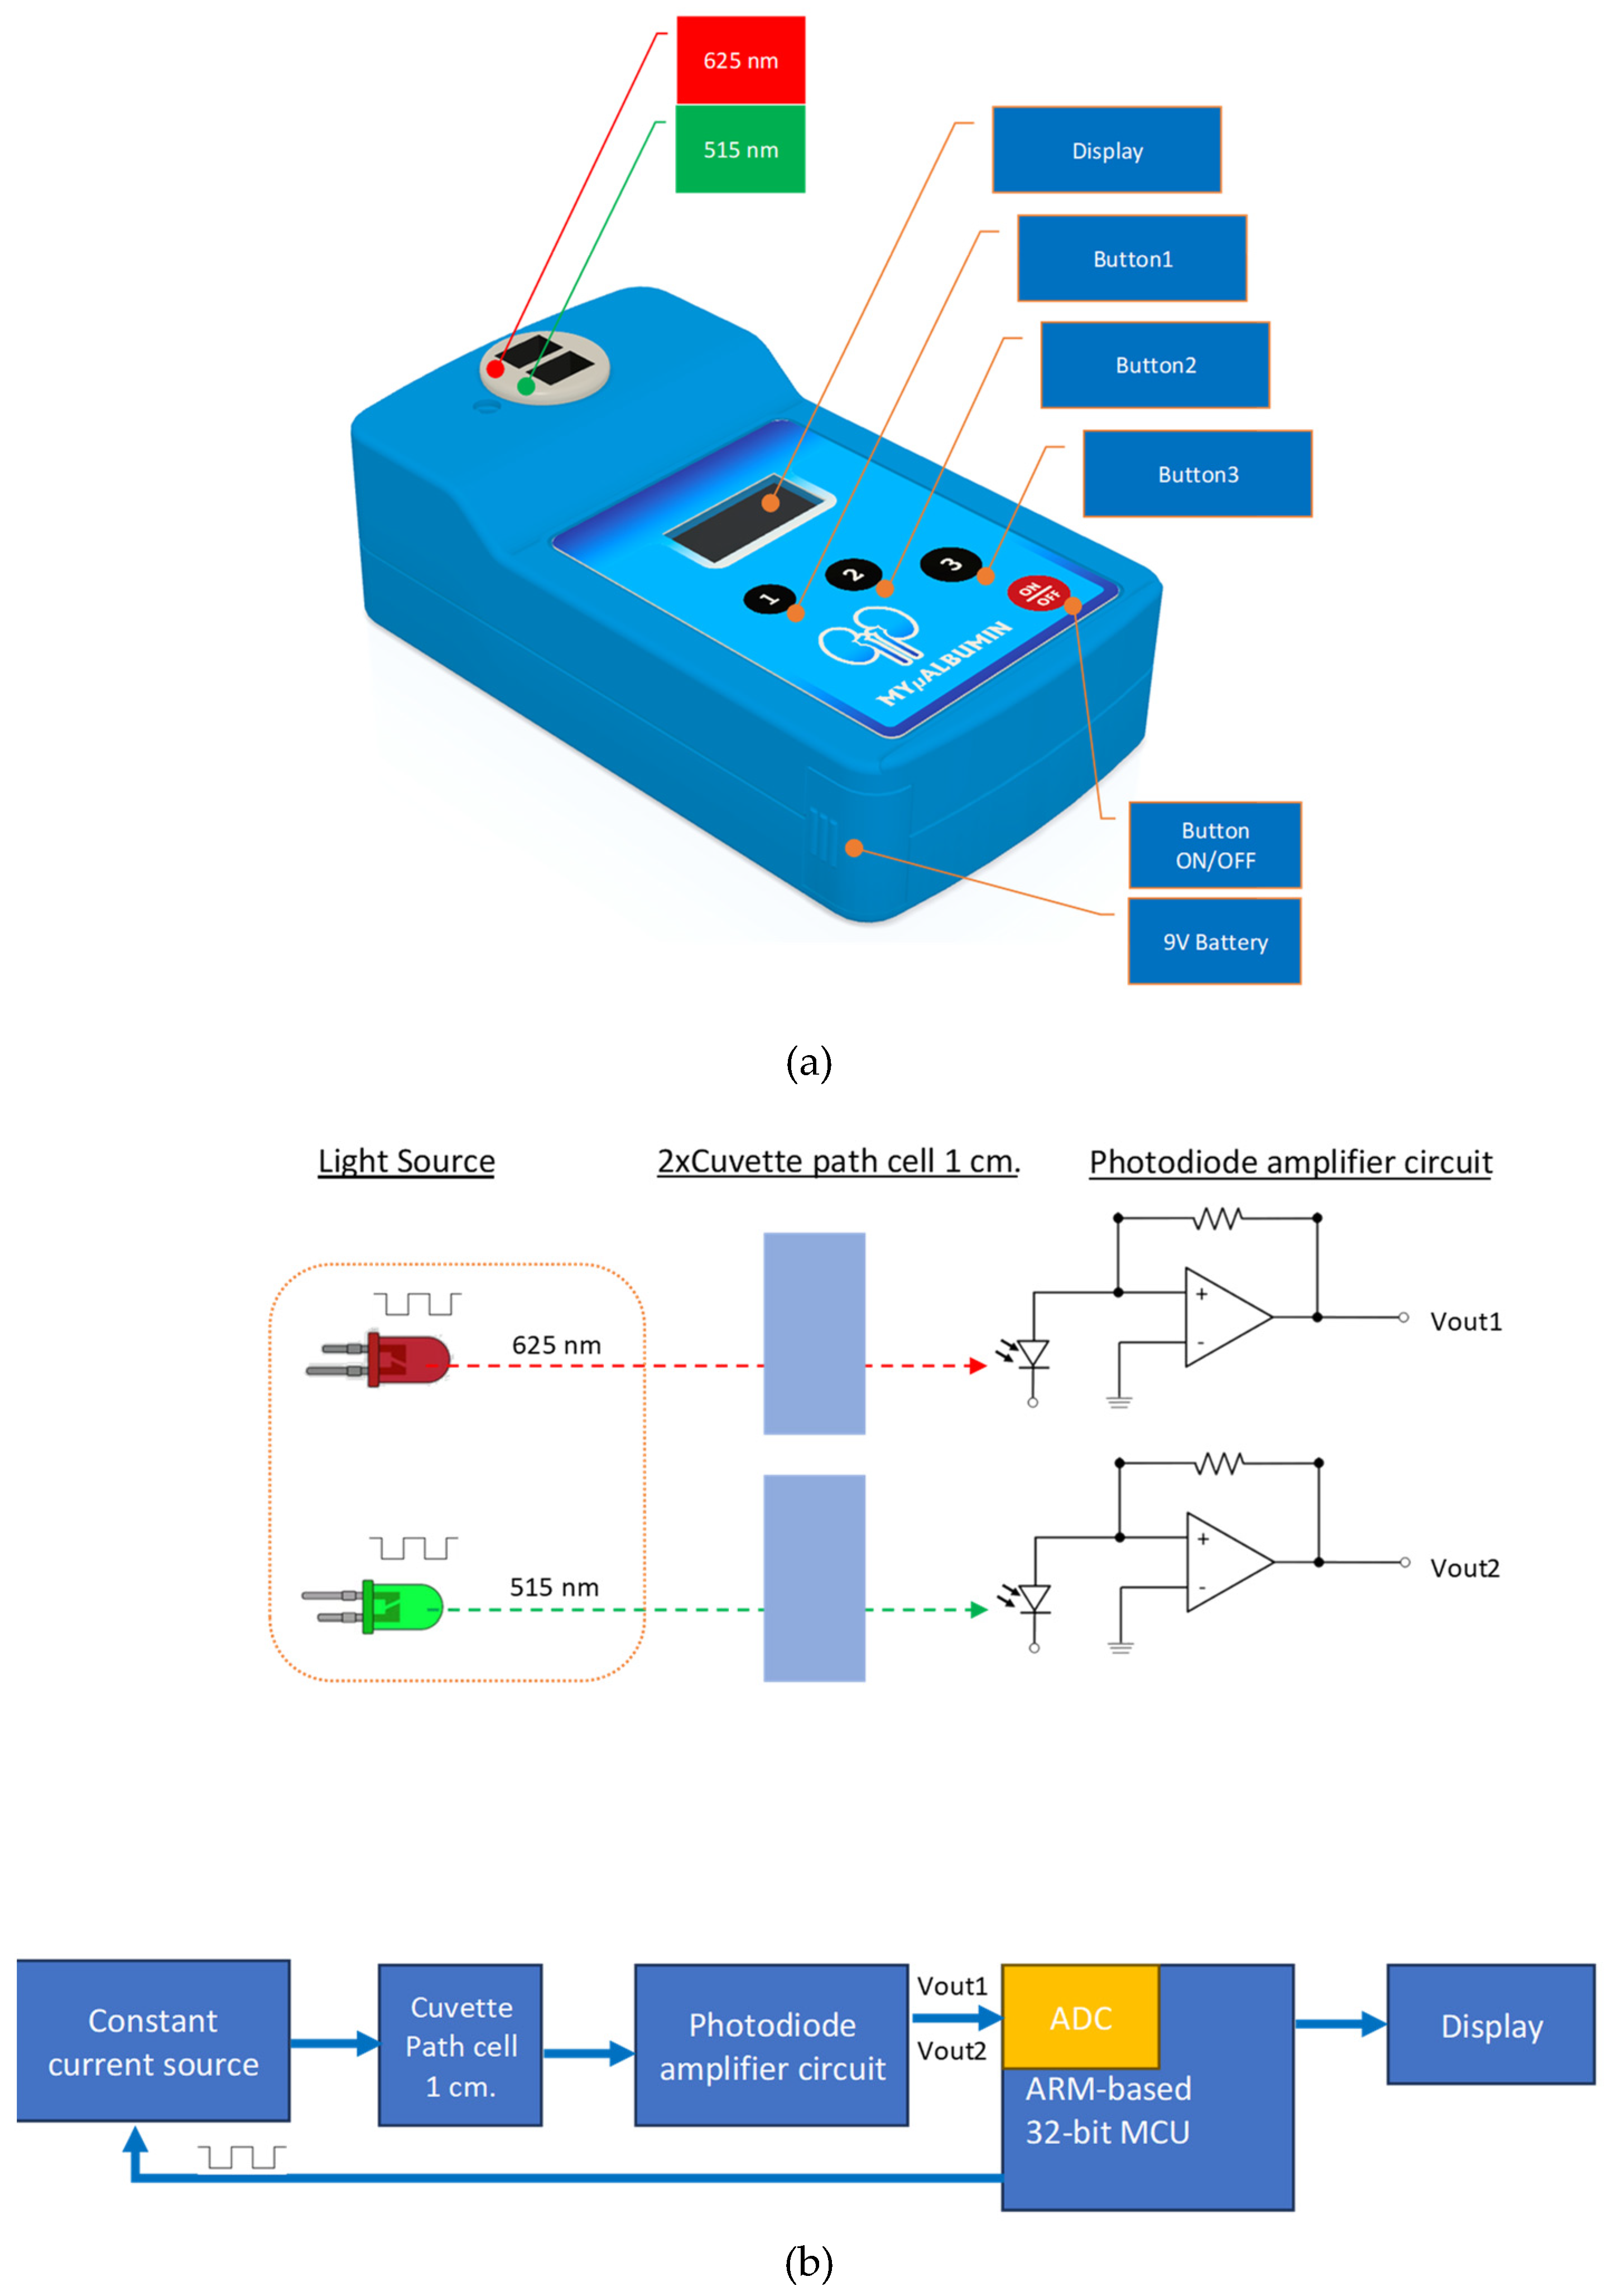
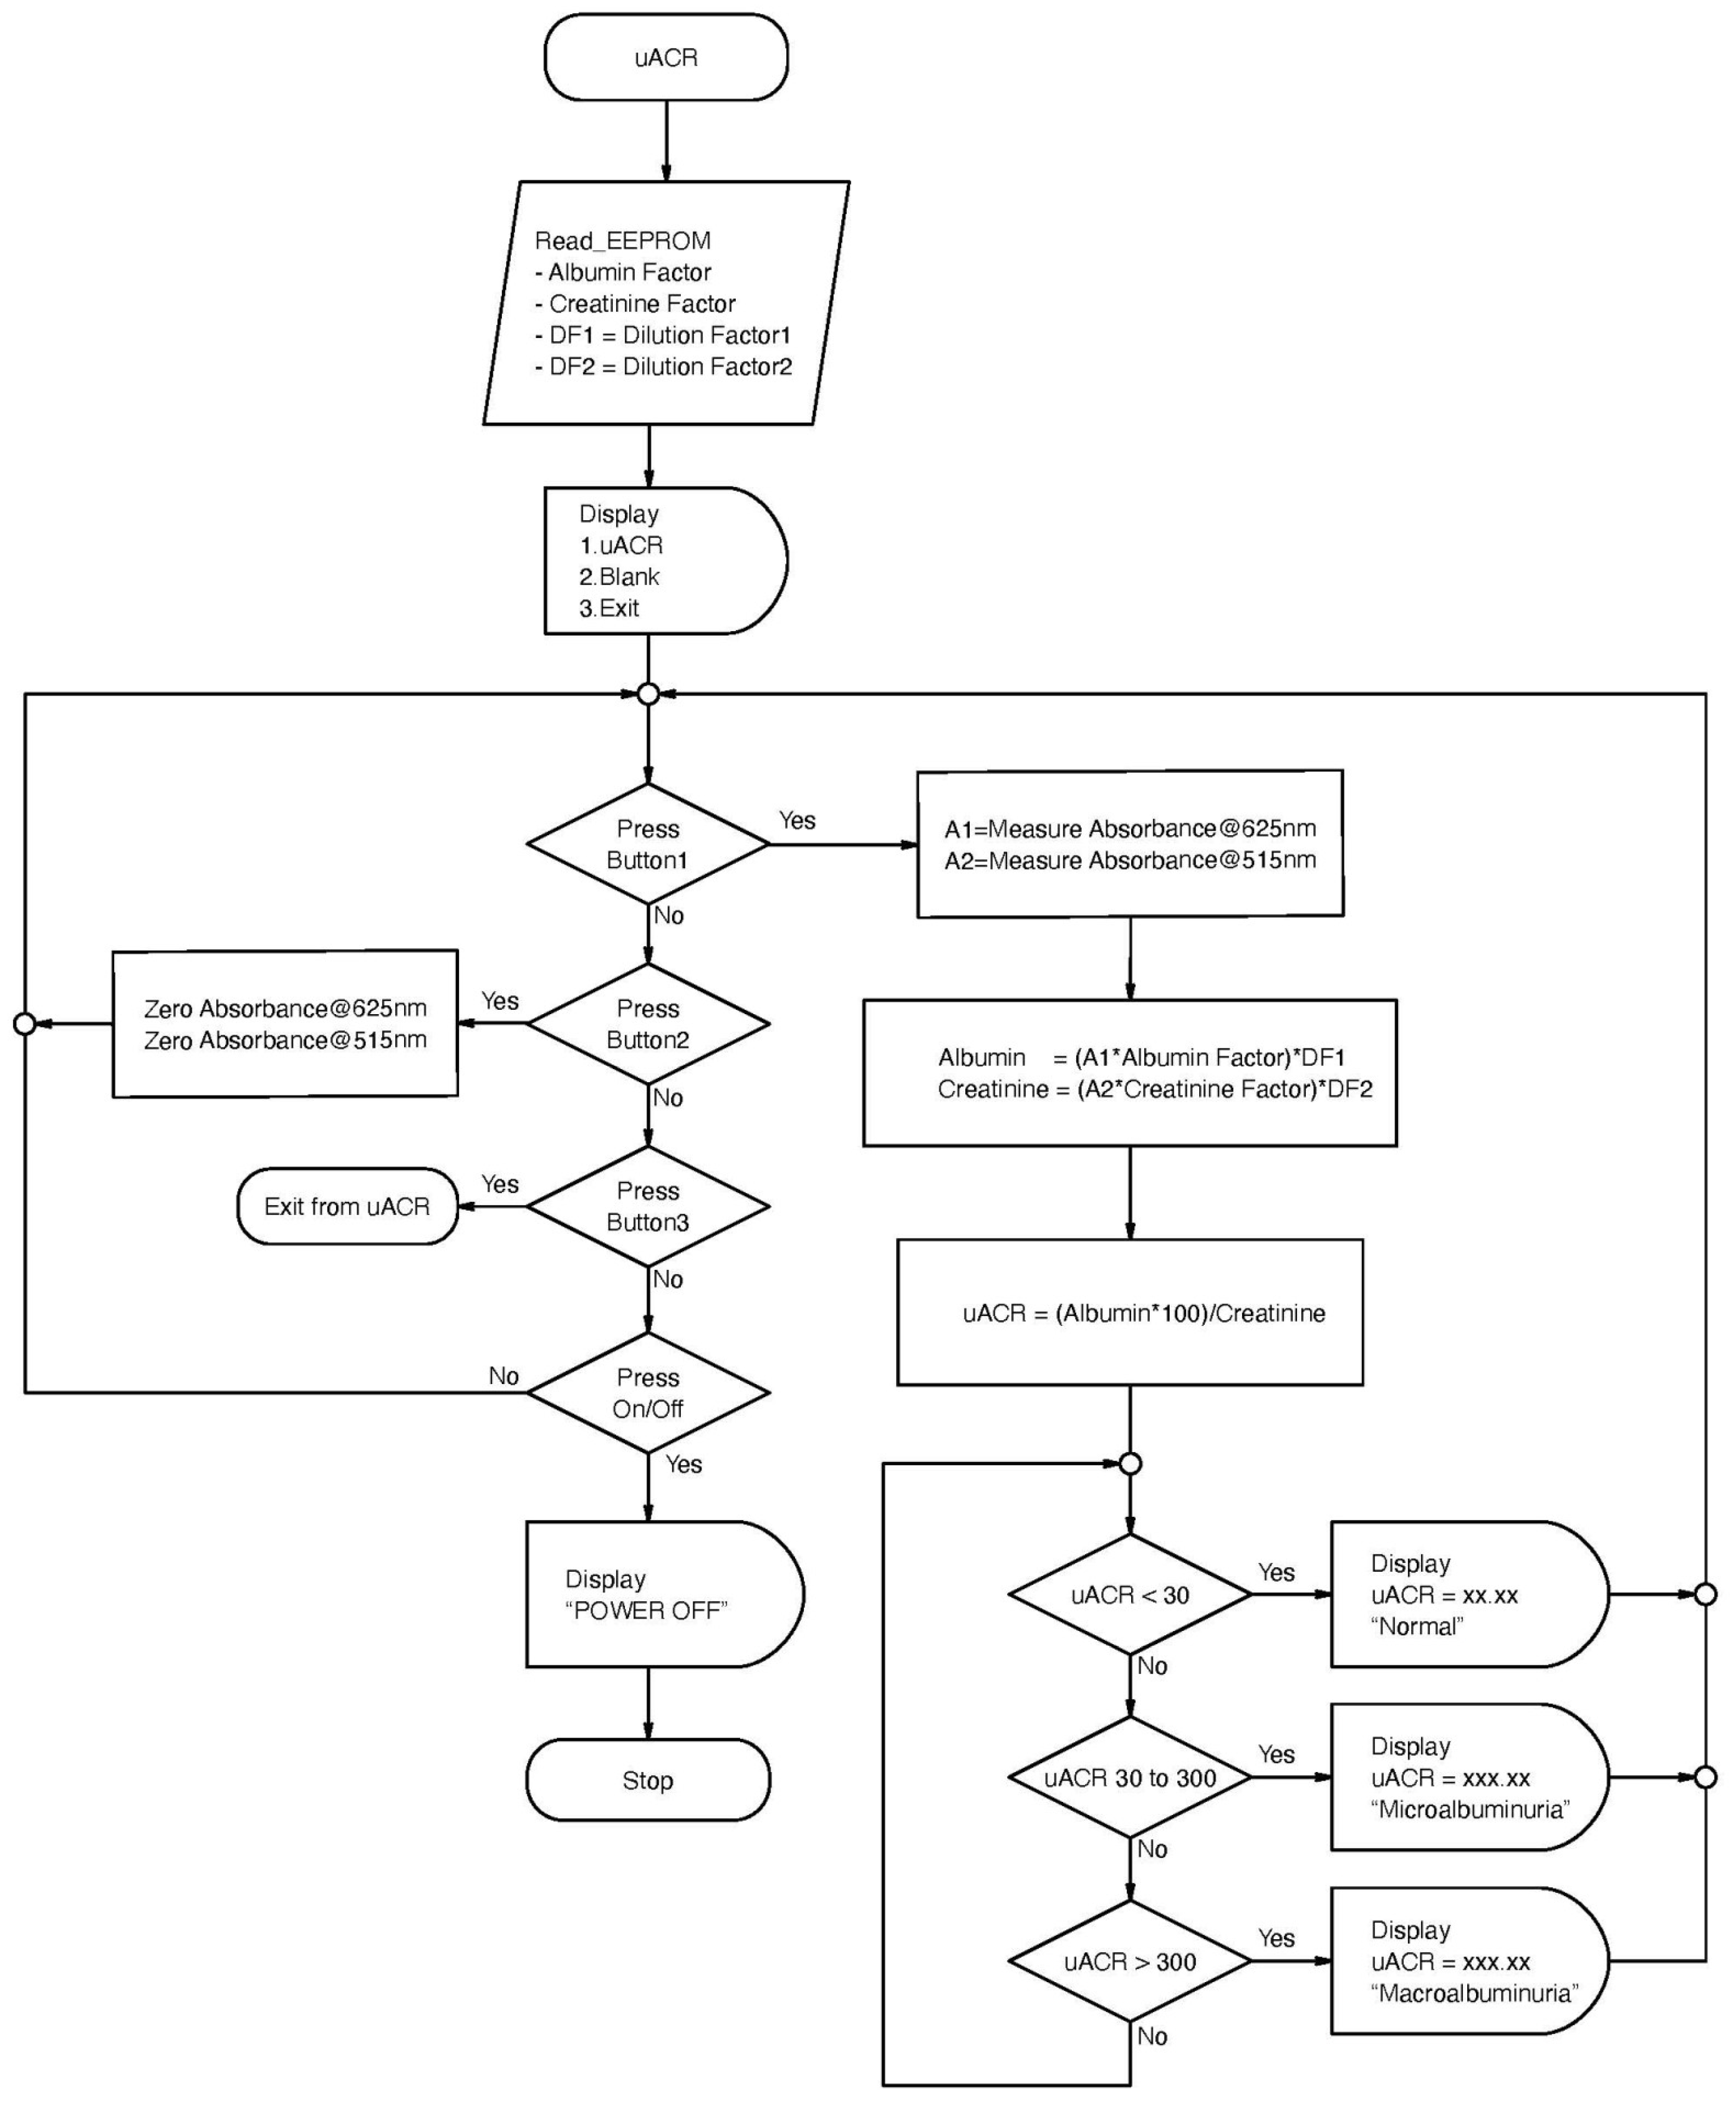
2.2. Instrumentation and Measurement Platform
2.3. Colorimetric Detection of Albumin and Creatinine
2.4. MYµALBUMIN Detector Linearity
2.5. Measurement of Albumin and Creatinine in Urine Samples
2.6. Validation of Test Performance of MYµALBUMIN
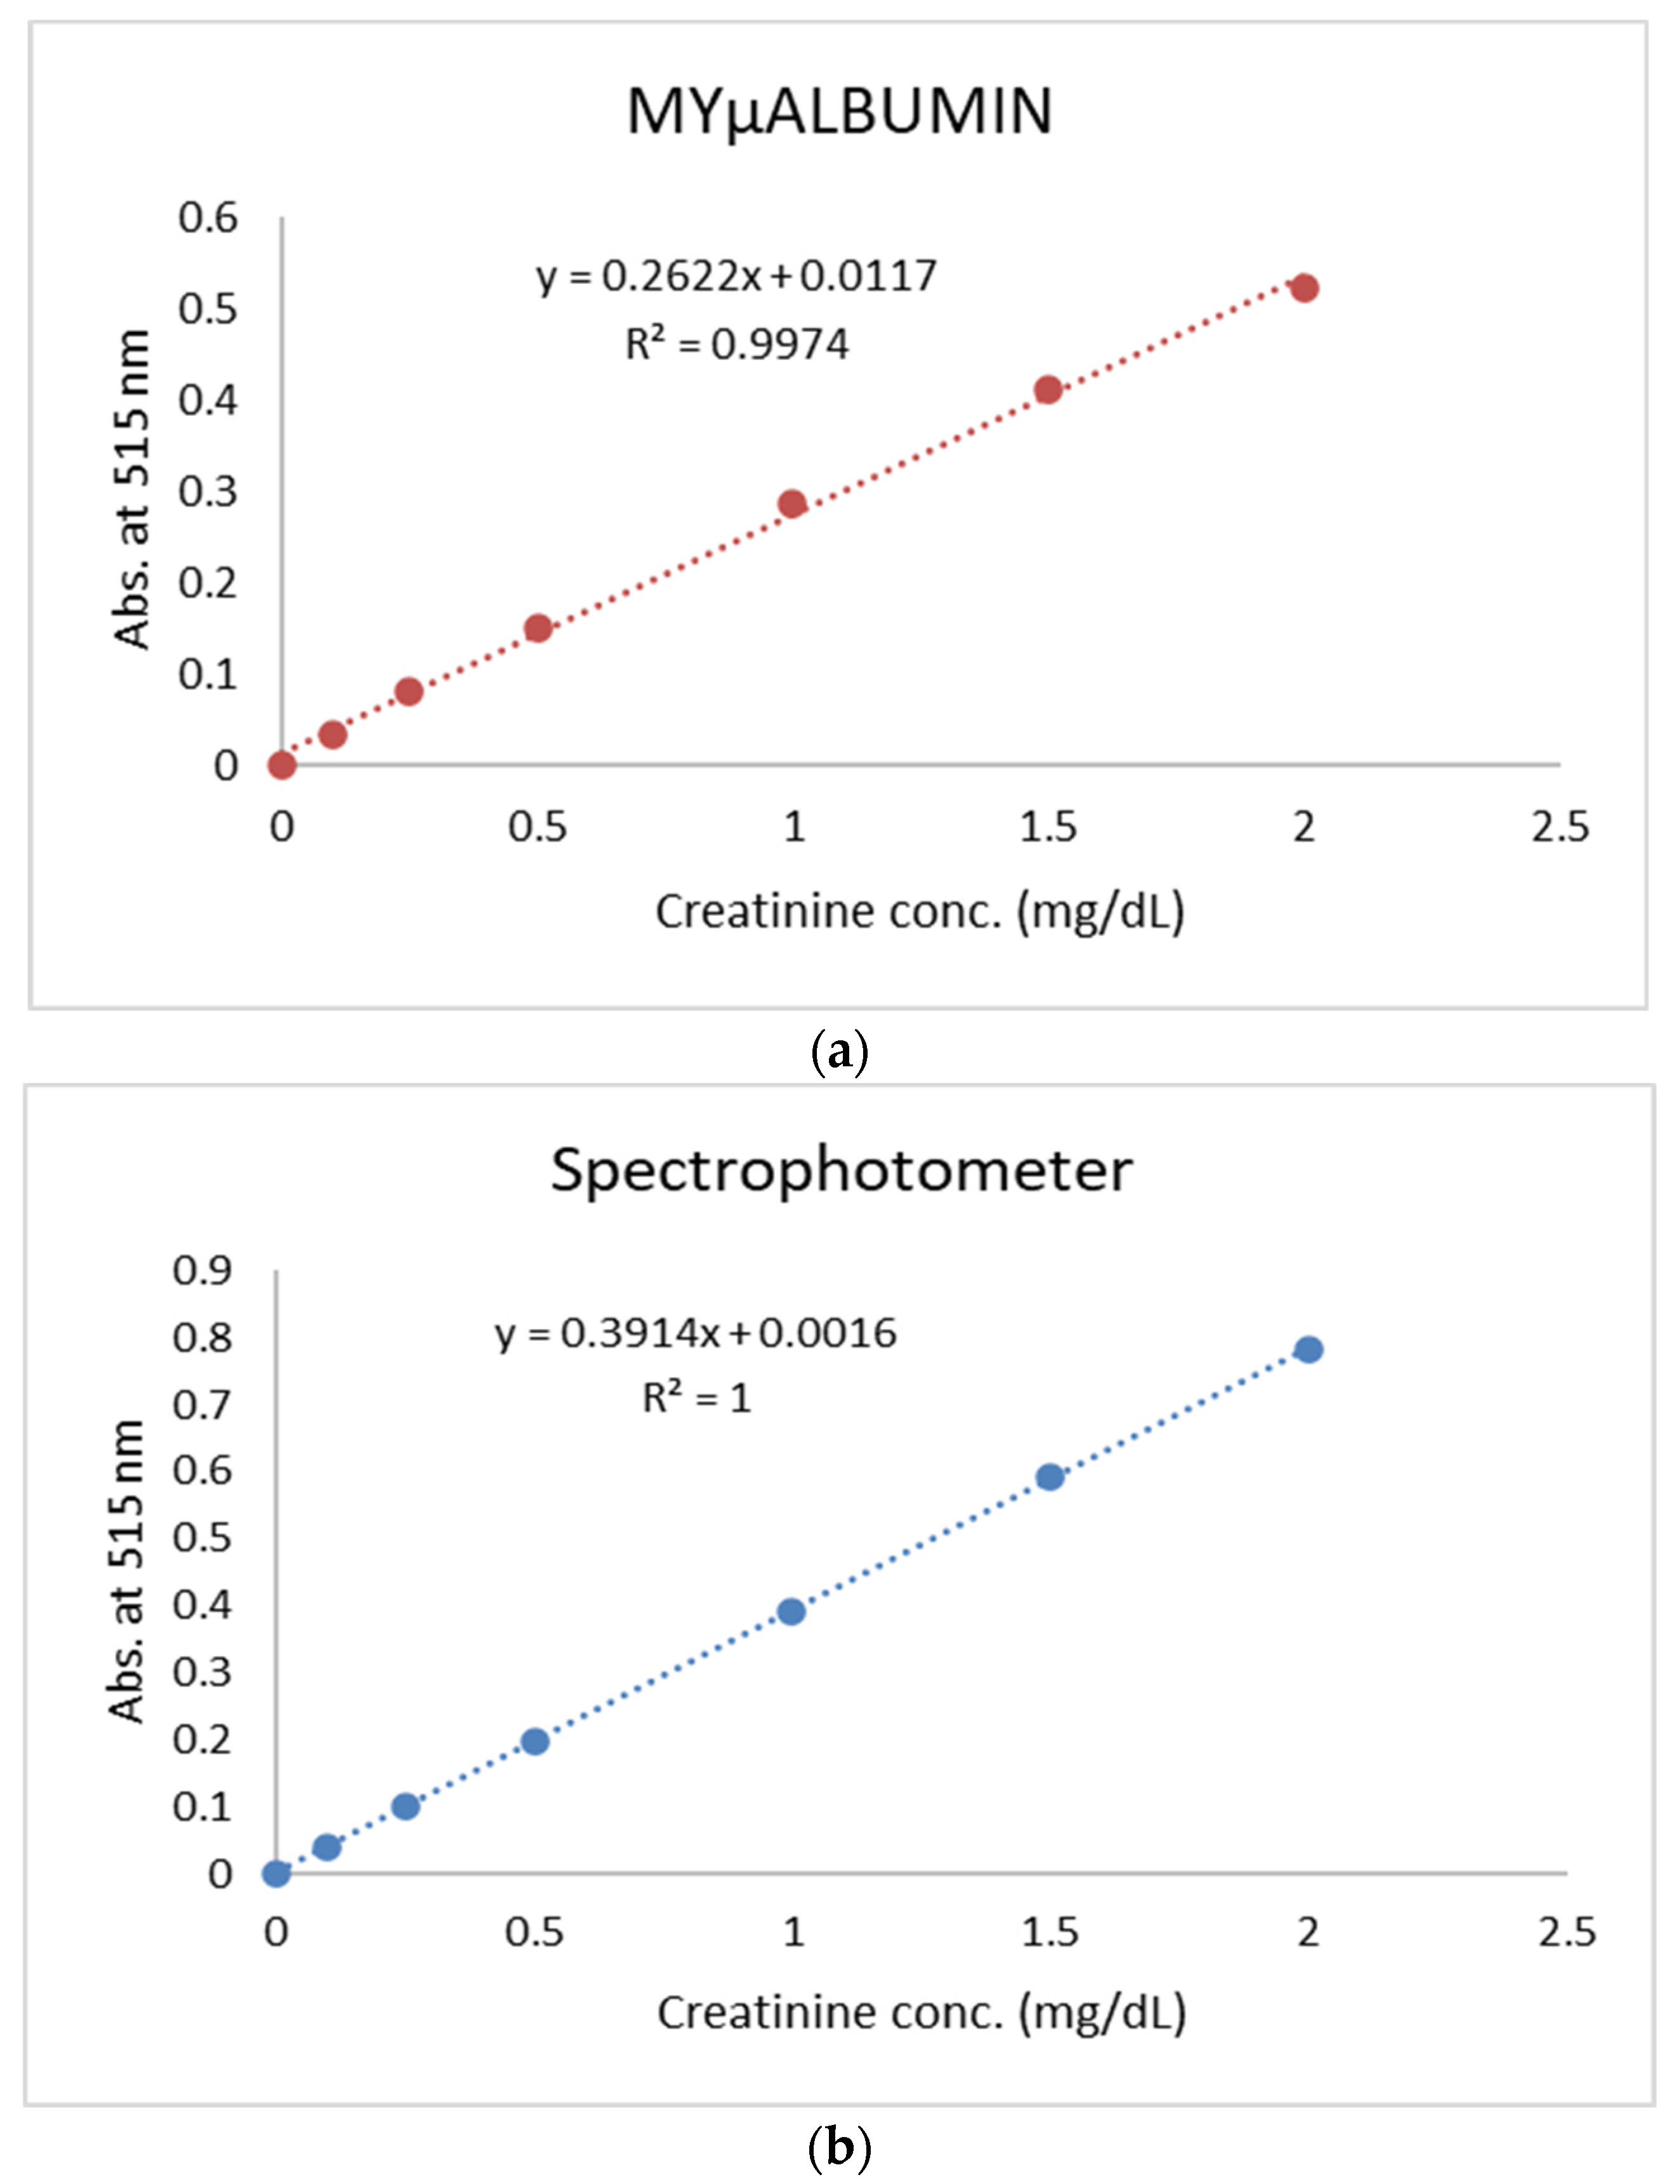
2.6.1. Calibration Curves
2.6.2. Accuracy
2.6.3. Precision
2.6.4. Limit of Quantification
2.7. Application of MYµALBUMIN to Clinical Samples
2.8. Statistical Analysis
3. Results
3.1. Validation of Test Performance of MYµALBUMIN Device
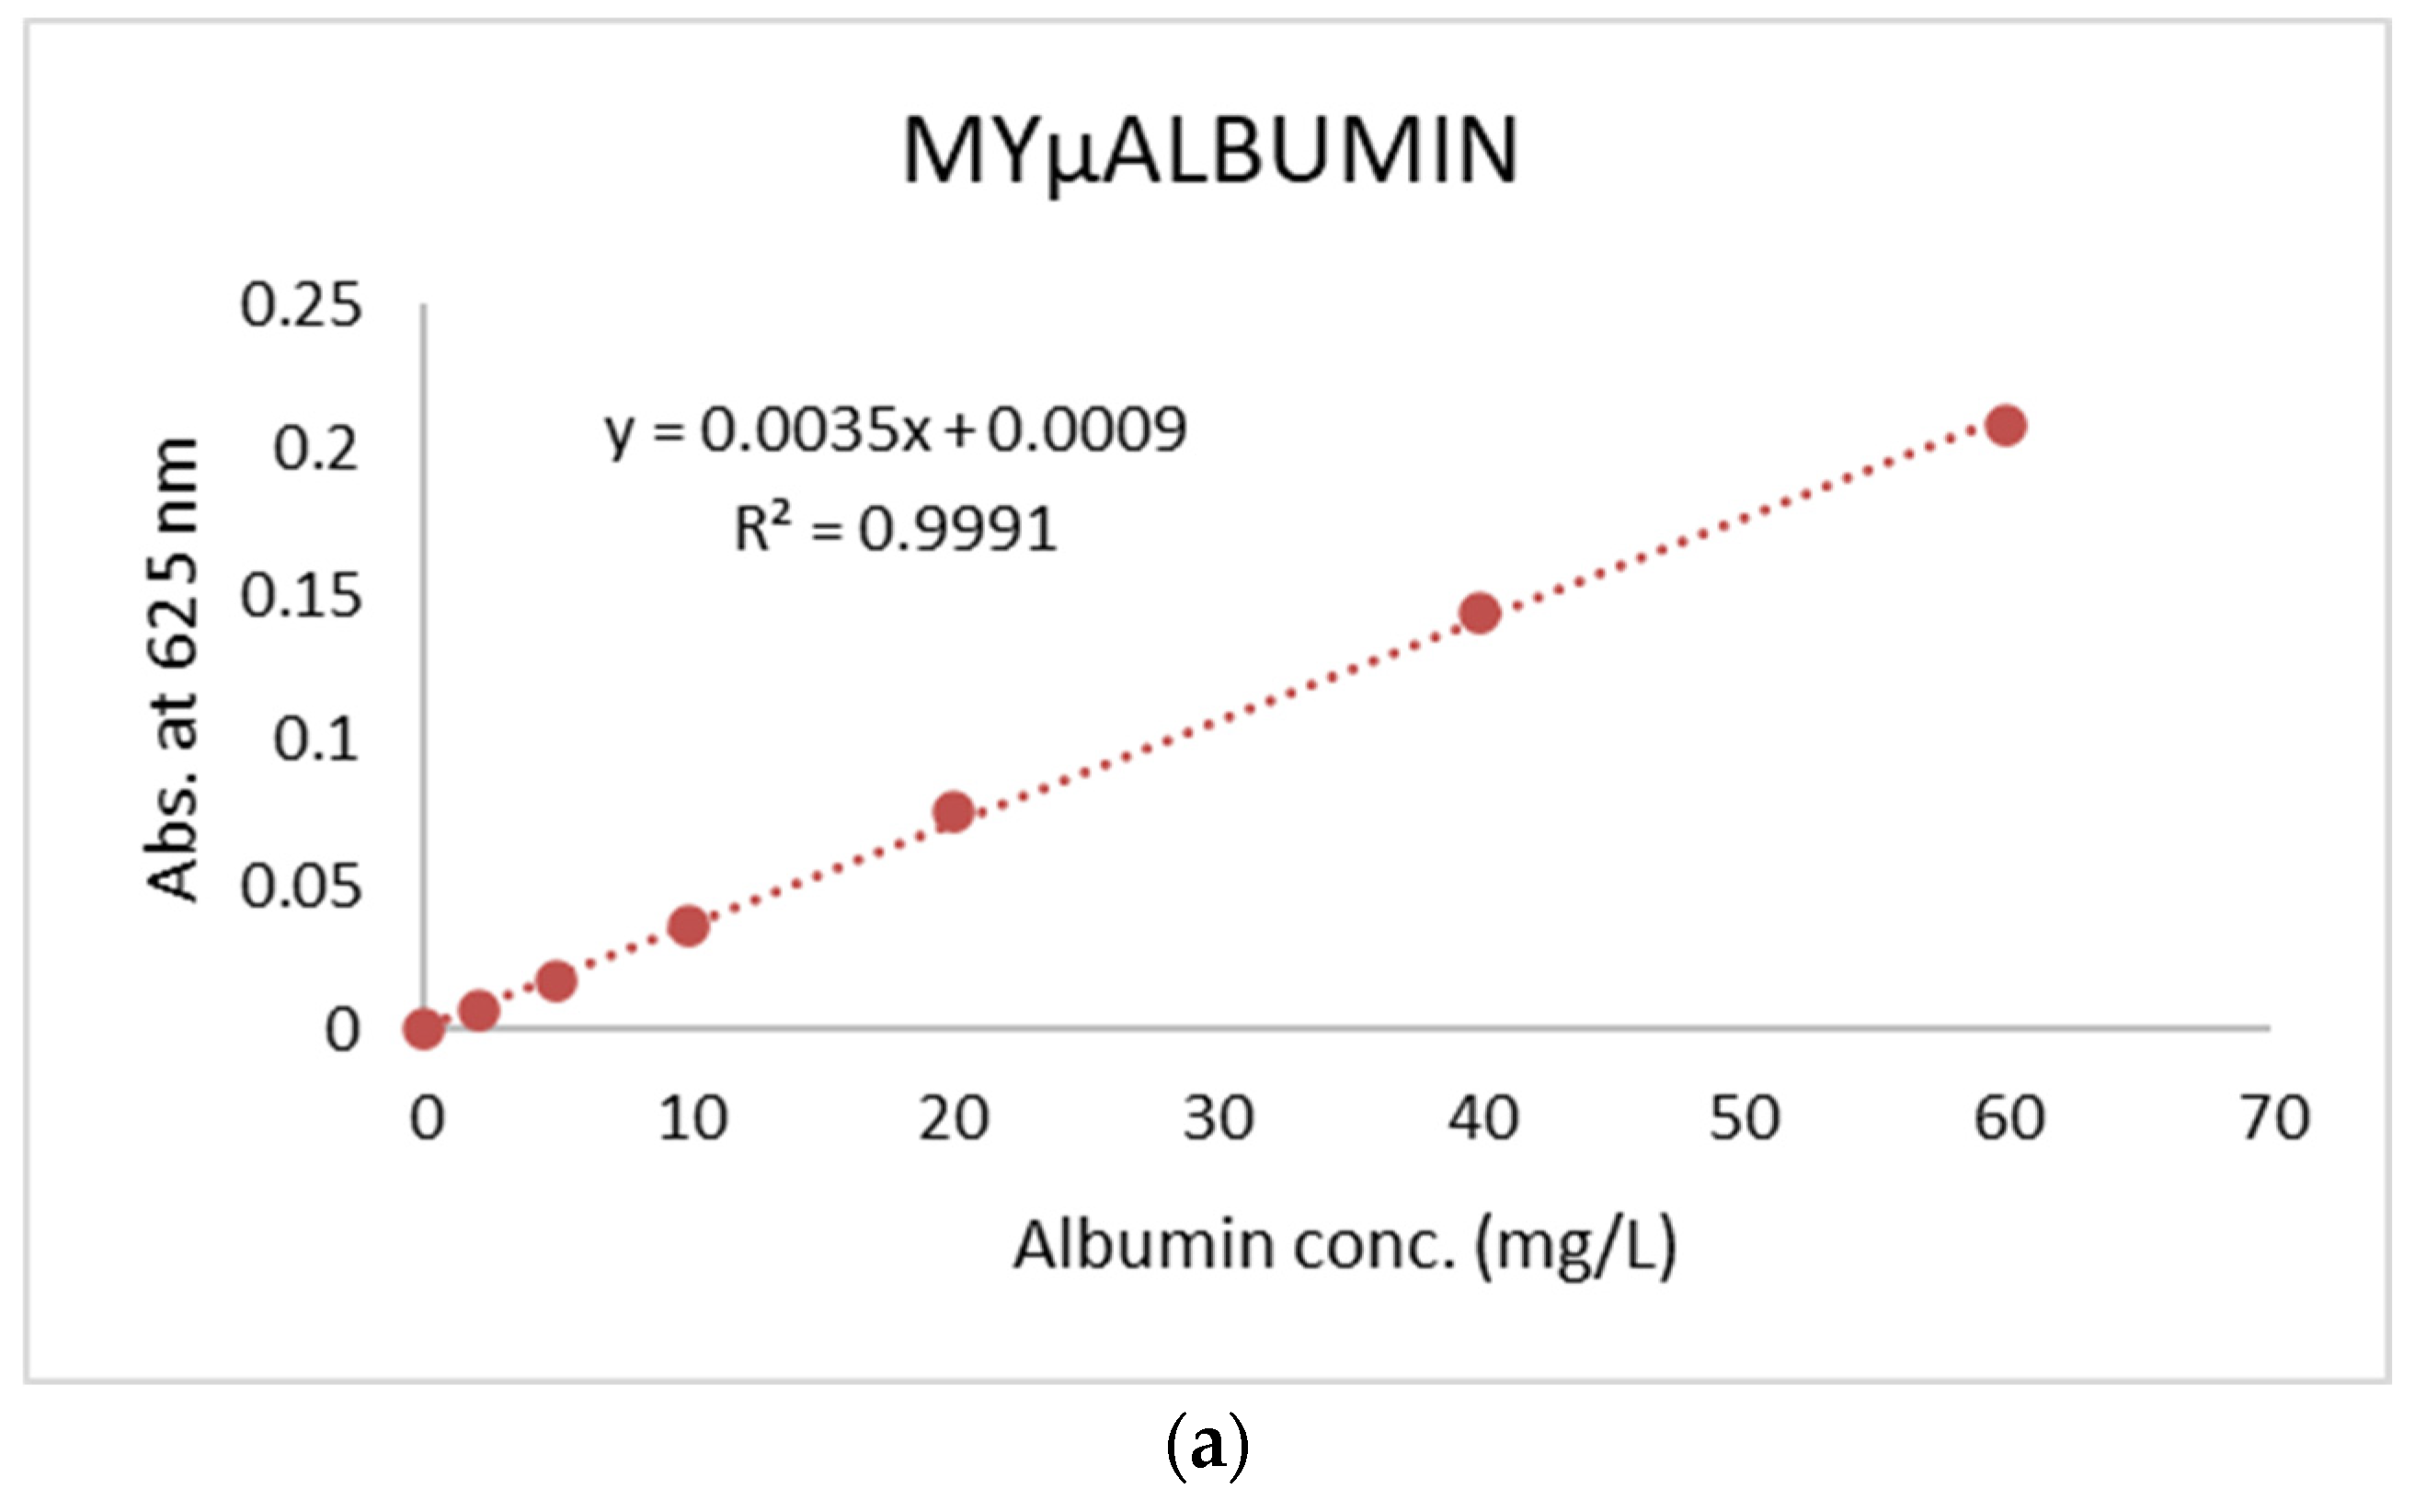
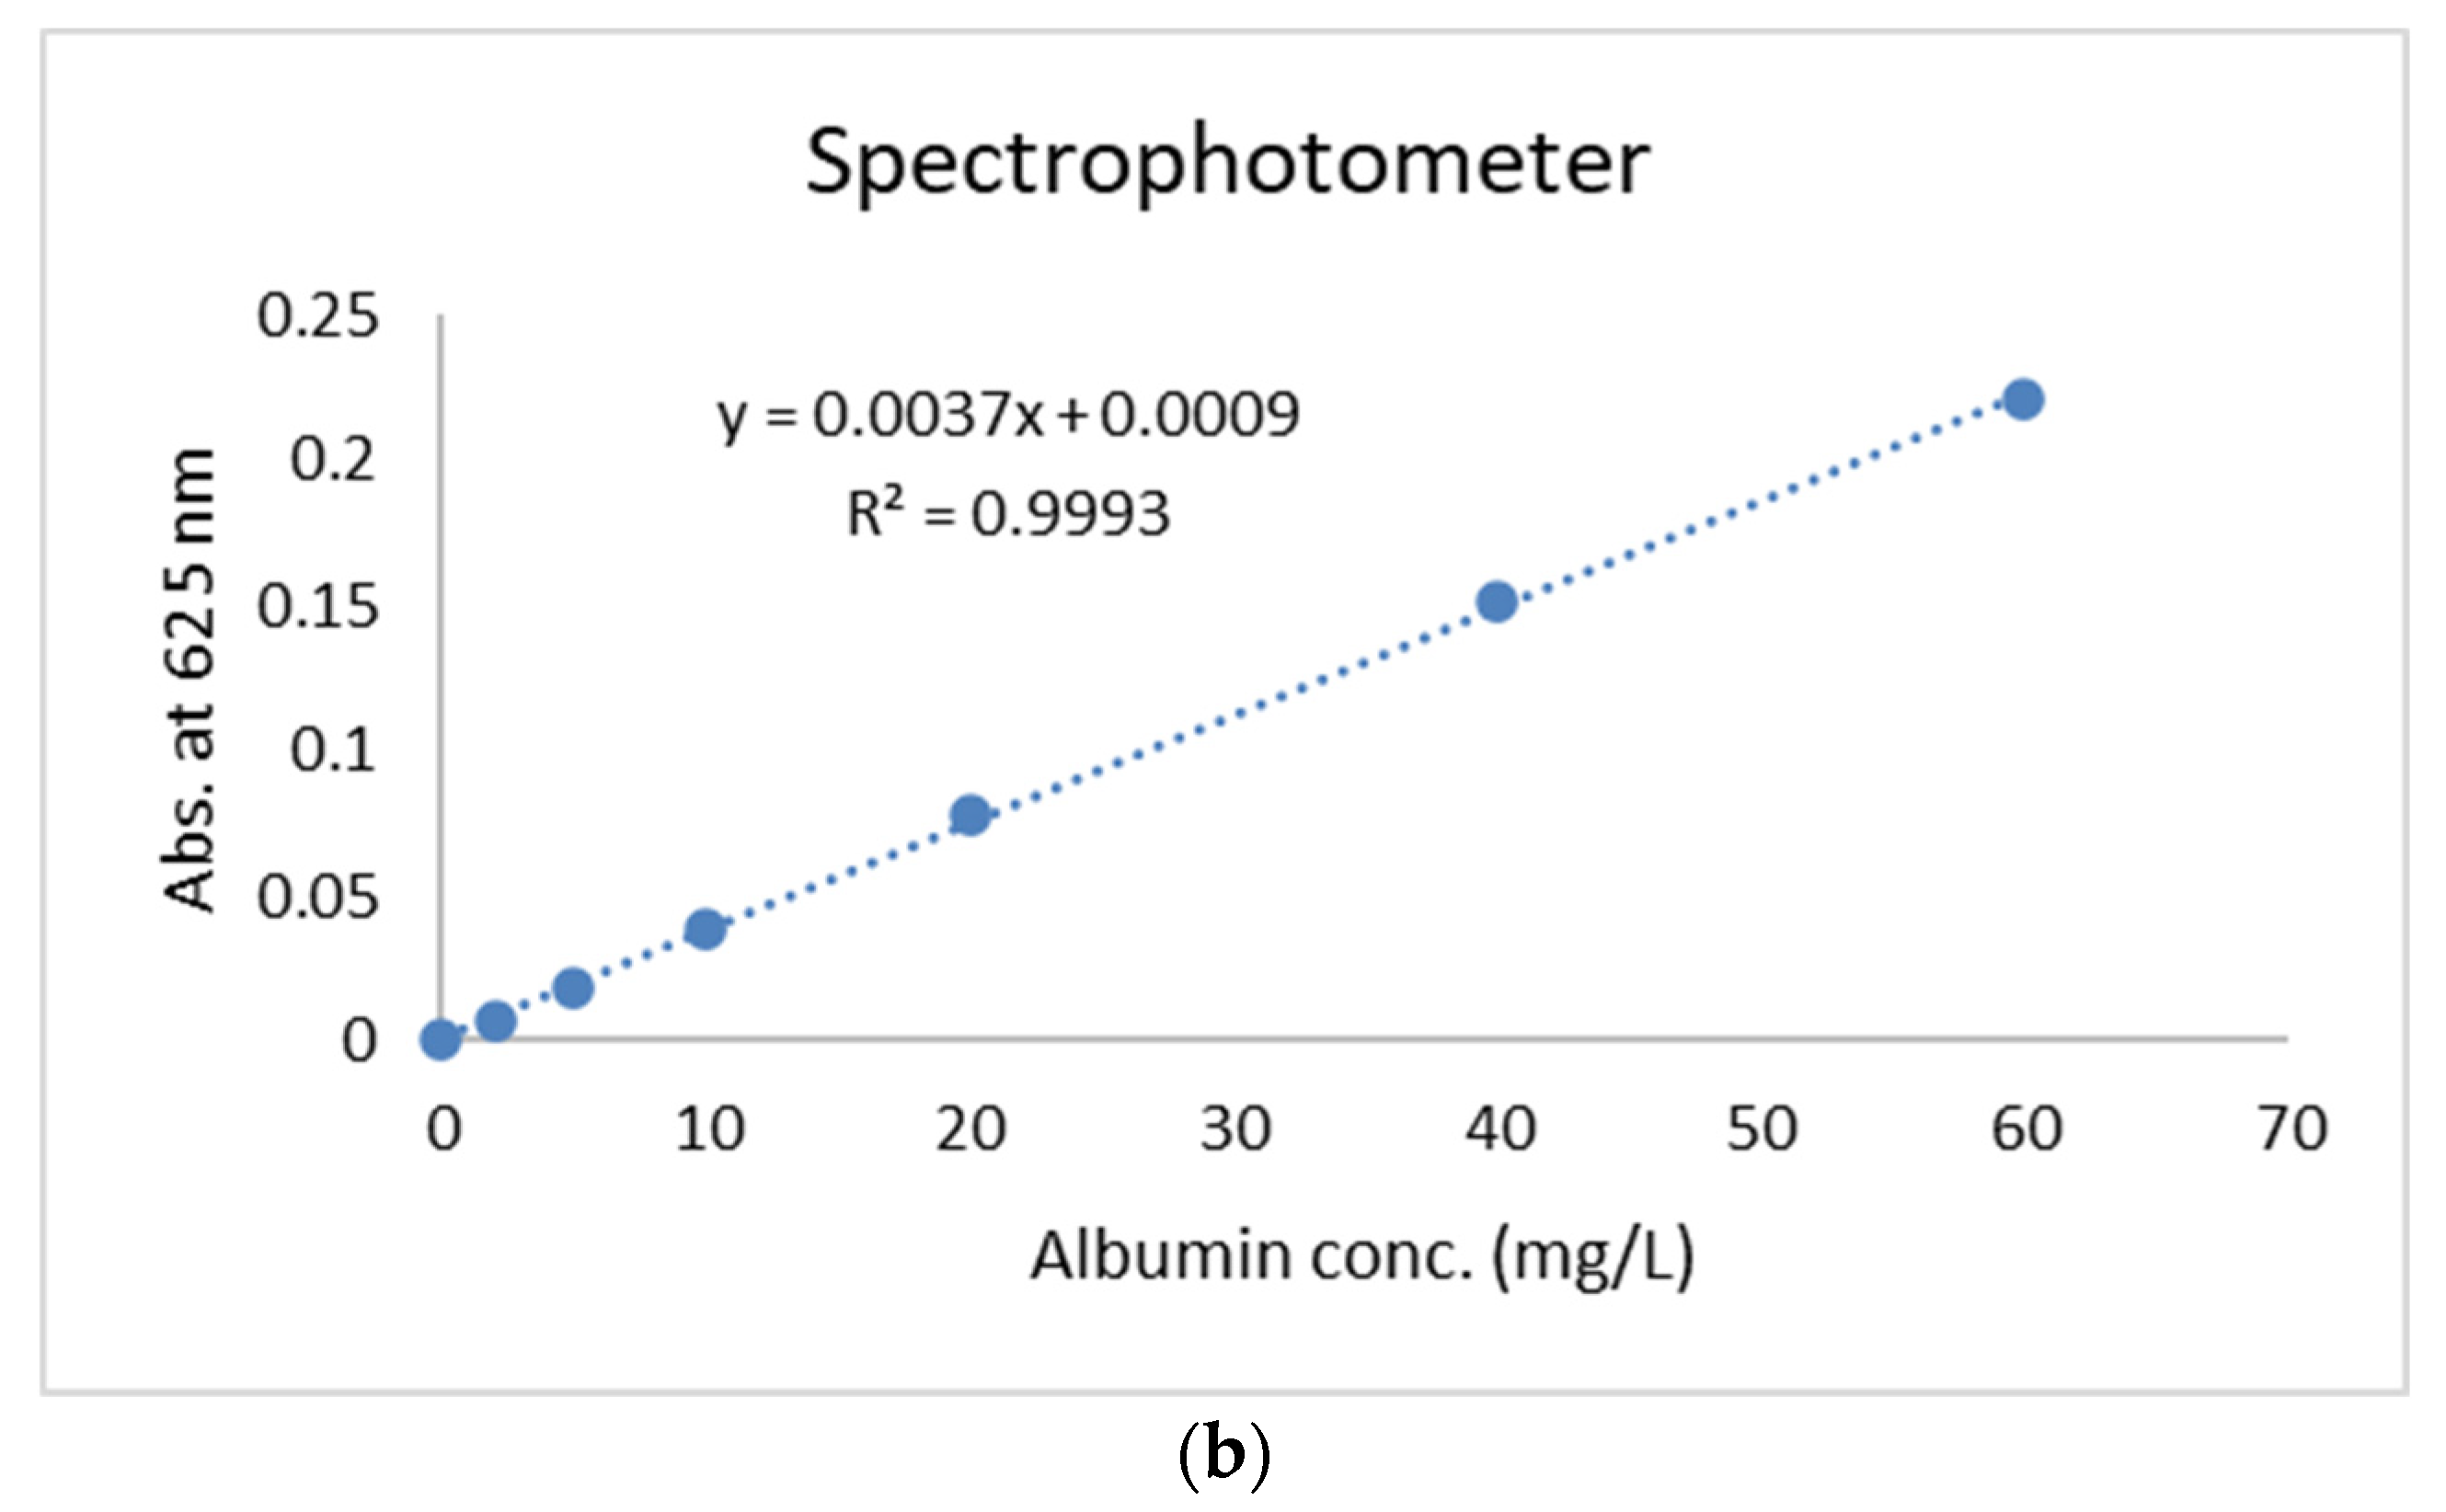
3.1.1. Calibration Curves
3.1.2. Accuracy
3.1.3. Precision
3.1.4. Limit of Quantification
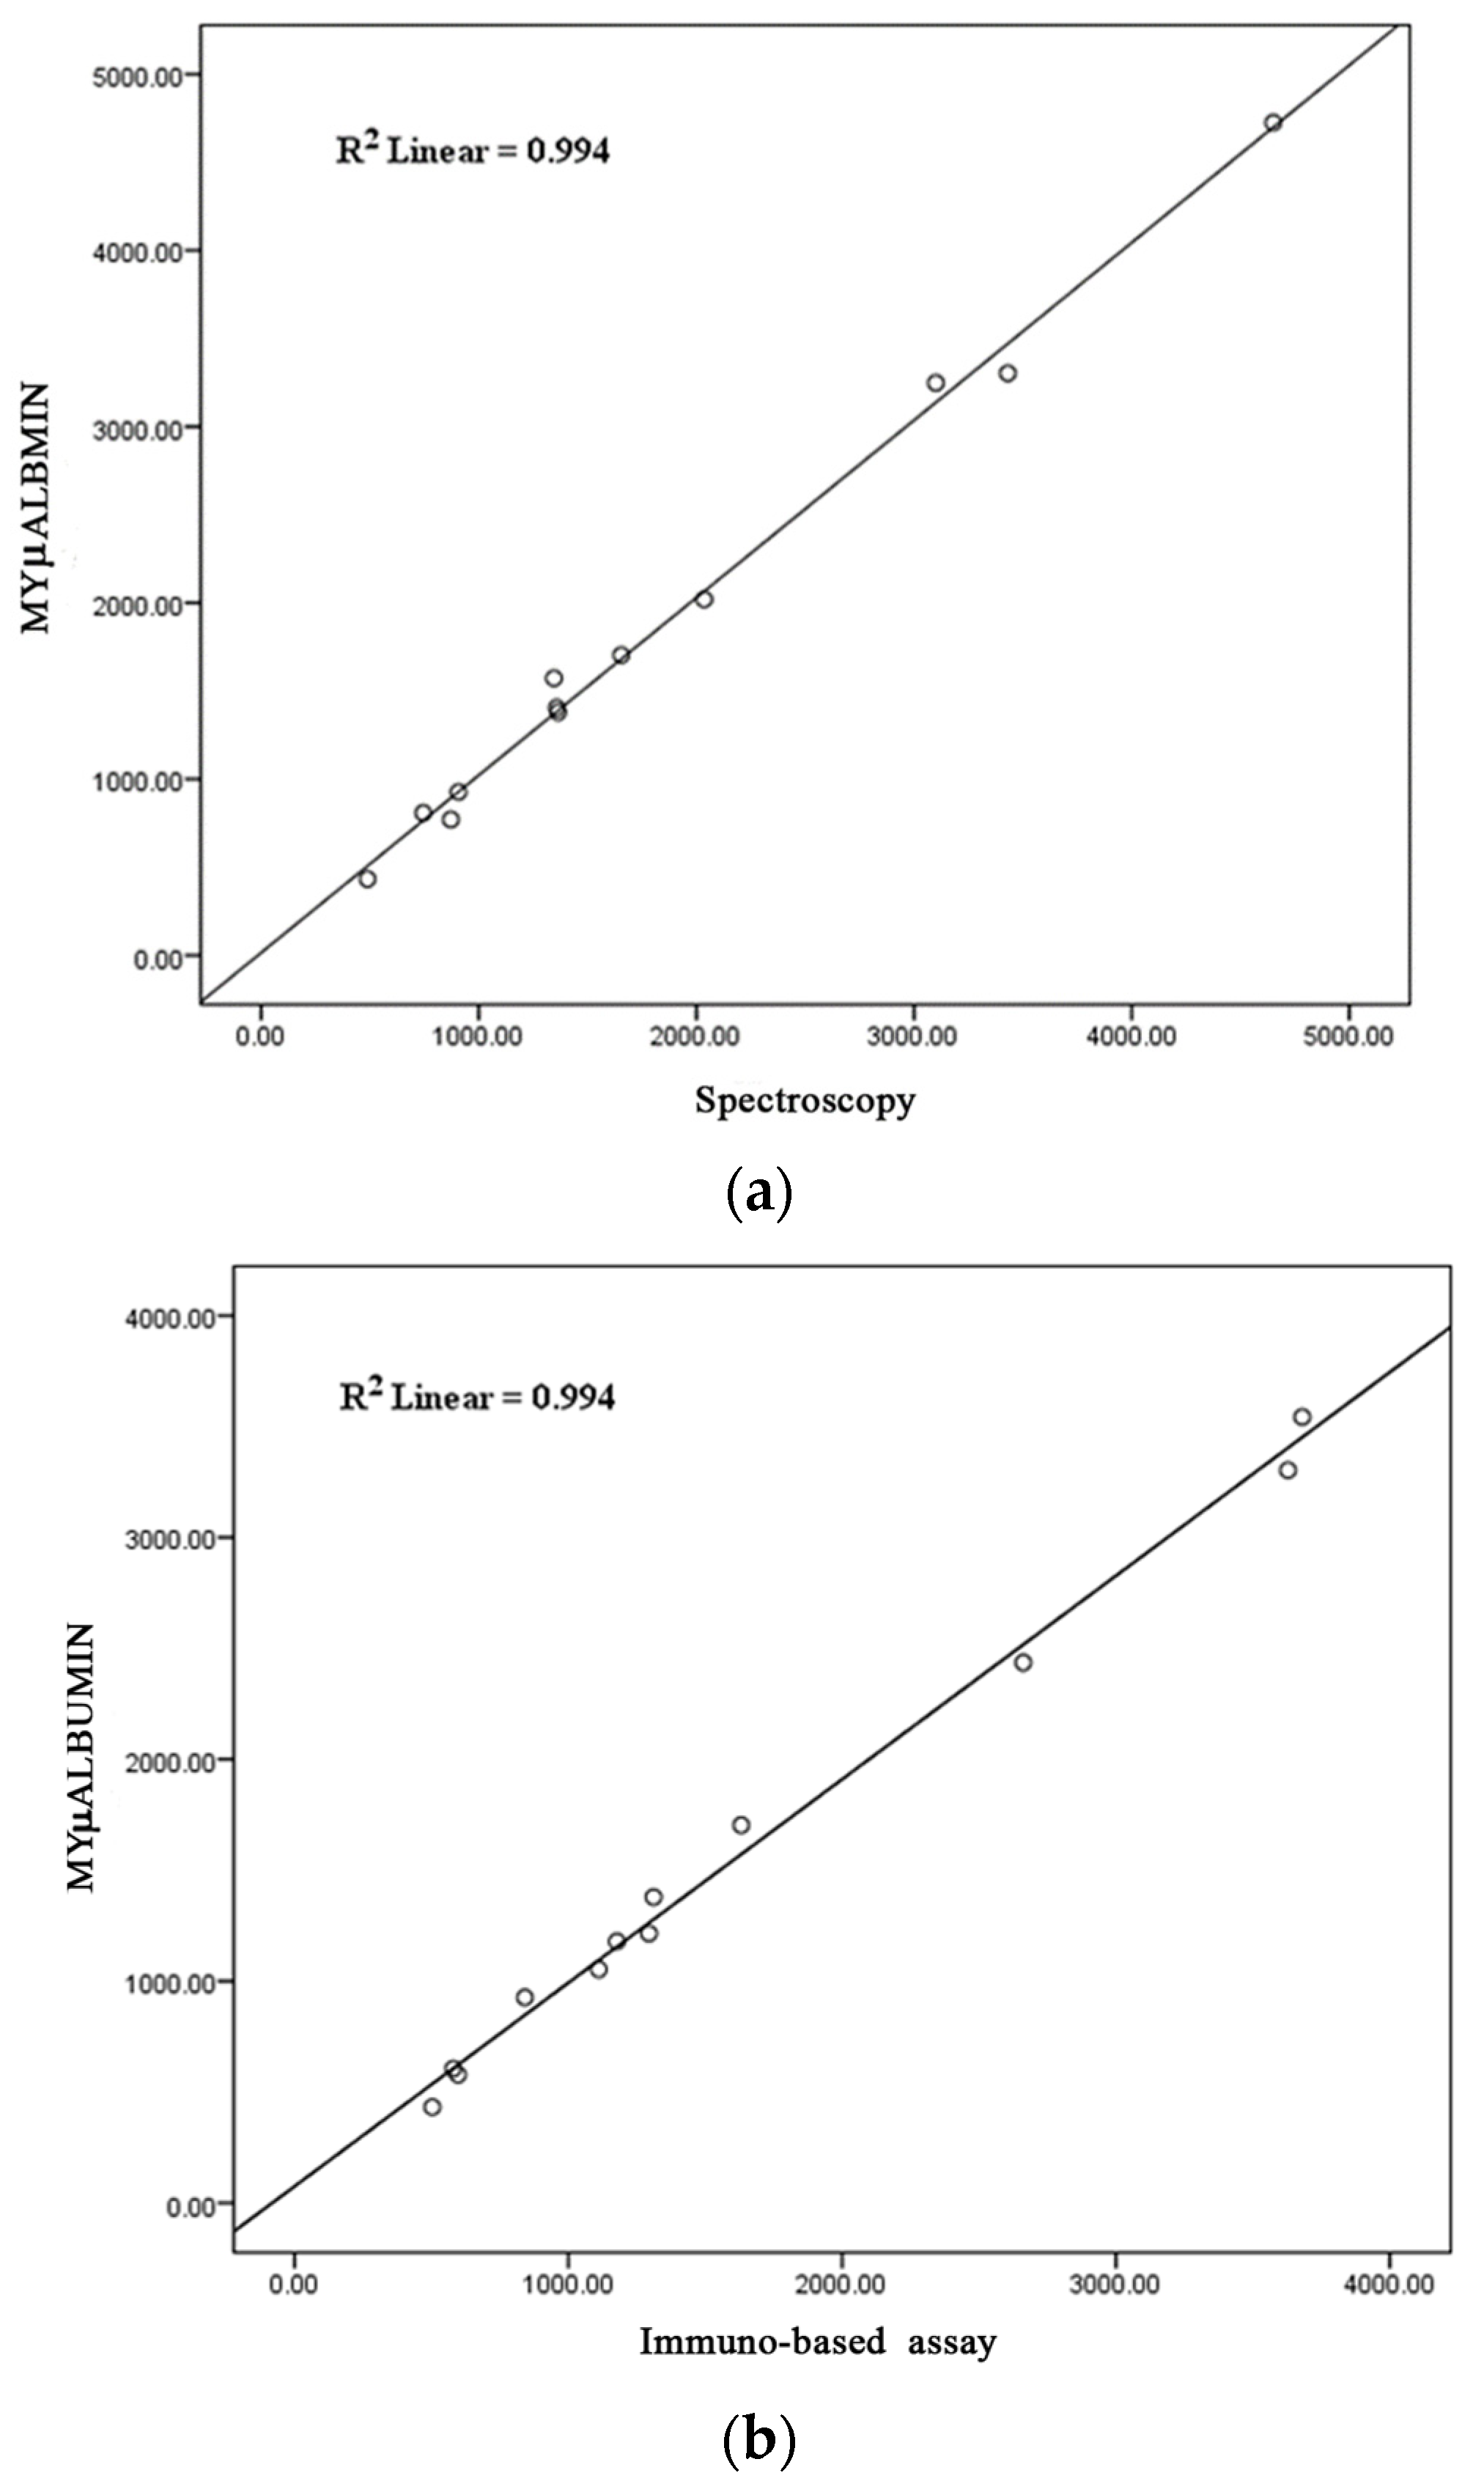
3.2. Application to Clinical Samples
4. Discussion
5. Conclusions
6. Patents
Author Contributions
Funding
Institutional Review Board Statement
Informed Consent Statement
Data Availability Statement
Acknowledgments
Conflicts of Interest
References
- Neuen, B.L.; Chadban, S.J.; Demaio, A.R.; Johnson, D.W.; Perkovic, V. Chronic kidney disease and the global NCDs agenda. BMJ Glob Health 2017, 2, e000380. [Google Scholar] [CrossRef] [PubMed]
- Hypertension and chronic kidney diseases. Cor et Vasa 2013, 55, e397–402. [CrossRef]
- Feher, M. Diabetes: Chronic Complications. Edited by Kenneth M Shaw and Michael H Cummings. 2nd Edition © John Wiley & Sons Ltd., 2005 ISBN: 0470865792 Paperback, 270 pages. Pract Diabetes 2005, 22, 327–327. [Google Scholar] [CrossRef]
- Jha, V.; Garcia-Garcia, G.; Iseki, K.; Li, Z.; Naicker, S.; Plattner, B.; Saran, R.; Wang, A.Y.; Yang, C.W. Chronic kidney disease: global dimension and perspectives. Lancet 2013, 382, 260–272. [Google Scholar] [CrossRef]
- Chen, T.K.; Knicely, D.H.; Grams, M.E. Chronic Kidney Disease Diagnosis and Management: A Review. Jama 2019, 322, 1294–1304. [Google Scholar] [CrossRef]
- Sumida, K.; Nadkarni, G.N.; Grams, M.E.; Sang, Y.; Ballew, S.H.; Coresh, J.; Matsushita, K.; Surapaneni, A.; Brunskill, N.; Chadban, S.J.; et al. Conversion of Urine Protein-Creatinine Ratio or Urine Dipstick Protein to Urine Albumin-Creatinine Ratio for Use in Chronic Kidney Disease Screening and Prognosis: An Individual Participant-Based Meta-analysis. Ann Intern Med 2020, 173, 426–435. [Google Scholar] [CrossRef]
- Ying, T.; Clayton, P.; Naresh, C.; Chadban, S. Predictive value of spot versus 24-hour measures of proteinuria for death, end-stage kidney disease or chronic kidney disease progression. BMC Nephrol 2018, 19, 55. [Google Scholar] [CrossRef]
- Chaiyo, S.; Kalcher, K.; Apilux, A.; Chailapakul, O. A Novel Paper-based Colorimetry Device for the Determination of the Albumin to Creatinine Ratio. Analyst 2018, 143. [Google Scholar] [CrossRef] [PubMed]
- Lin, C.-C.; Hsu, J.-L.; Tseng, C.-C.; Lee, G.-B. An integrated microfluidic system for the determination of microalbuminuria by measuring the albumin-to-creatinine ratio. MicrofluidNanofluidics 2011, 10, 1055–1067. [Google Scholar] [CrossRef]
- Weaver, R.G.; James, M.T.; Ravani, P.; Weaver, C.G.W.; Lamb, E.J.; Tonelli, M.; Manns, B.J.; Quinn, R.R.; Jun, M.; Hemmelgarn, B.R. Estimating Urine Albumin-to-Creatinine Ratio from Protein-to-Creatinine Ratio: Development of Equations using Same-Day Measurements. J Am Soc Nephrol 2020, 31, 591–601. [Google Scholar] [CrossRef]
- Mogensen, C.E. Microalbuminuria predicts clinical proteinuria and early mortality in maturity-onset diabetes. N Engl J Med 1984, 310, 356–360. [Google Scholar] [CrossRef] [PubMed]
- Ansar, M.M.; ShahrokhiRad, R.; Lebady, M.K. Risk Factors of Microalbuminuria and Macroalbuminuria in Type 2 Diabetic Patients in North of Iran - Rasht. Nephro-Urol Mon 2017, 9, e40031. [Google Scholar] [CrossRef]
- Chutipongtanate, S.; Thongboonkerd, V. Systematic comparisons of artificial urine formulas for in vitro cellular study. Anal Biochem 2010, 402, 110–112. [Google Scholar] [CrossRef] [PubMed]
- Keane, W.F.; Eknoyan, G. Proteinuria, albuminuria, risk, assessment, detection, elimination (PARADE): a position paper of the National Kidney Foundation. Am J Kidney Dis 1999, 33, 1004–1010. [Google Scholar] [CrossRef]
- American Diabetes Association Clinical Practice Recommendations 2001. Diabetes Care 2001, 24 (Suppl. 1), S1–S133.
- Ratanawimarnwong, N.; Ponhong, K.; Teshima, N.; Nacapricha, D.; Grudpan, K.; Sakai, T.; Motomizu, S. Simultaneous injection effective mixing flow analysis of urinary albumin using dye-binding reaction. Talanta 2012, 96, 50–54. [Google Scholar] [CrossRef] [PubMed]
- Sittiwong, J.; Unob, F. Detection of urinary creatinine using gold nanoparticles after solid phase extraction. Spectrochim Acta A Mol Biomol Spectrosc 2015, 138, 381–386. [Google Scholar] [CrossRef] [PubMed]
- Sung, K.C.; Ryu, S.; Lee, J.Y.; Lee, S.H.; Cheong, E.; Hyun, Y.Y.; Lee, K.B.; Kim, H.; Byrne, C.D. Urine Albumin/Creatinine Ratio Below 30 mg/g is a Predictor of Incident Hypertension and Cardiovascular Mortality. Journal of the American Heart Association 2016, 5, e003245. [Google Scholar] [CrossRef] [PubMed]
- Myers, G.L.; Miller, W.G.; Coresh, J.; Fleming, J.; Greenberg, N.; Greene, T.; Hostetter, T.; Levey, A.S.; Panteghini, M.; Welch, M.; et al. Recommendations for improving serum creatinine measurement: a report from the Laboratory Working Group of the National Kidney Disease Education Program. Clin Chem 2006, 52, 5–18. [Google Scholar] [CrossRef]
- Tziakas, D.; Chalikias, G.; Kareli, D.; Tsigalou, C.; Risgits, A.; Kikas, P.; Makrygiannis, D.; Chatzikyriakou, S.; Kampouromiti, G.; Symeonidis, D.; et al. Spot urine albumin to creatinine ratio outperforms novel acute kidney injury biomarkers in patients with acute myocardial infarction. Int J Cardiol 2015, 197, 48–55. [Google Scholar] [CrossRef]
- Schosinsky, K.H.; Vargas, M.; Luz Esquivel, A.; Chavarria, M.A. Simple spectrophotometric determination of urinary albumin by dye-binding with use of bromphenol blue. Clin Chem 1987, 33, 223–226. [Google Scholar] [CrossRef] [PubMed]
- Teppo, A.M. Immunoturbidimetry of albumin and immunoglobulin G in urine. Clin Chem 1982, 28, 1359–1361. [Google Scholar] [CrossRef] [PubMed]
- Bhatt, V.R.; Khese, V.B.; Jadhav, S.L.; Kakrani, A.L. Urinary Albumin Excretion, Estimated Glomerular Filtration Rate, and Prevalence of Microalbuminuria in Obese Nondiabetic and Nonhypertensive Adults: A Cross-Sectional Study. Indian J Nephrol 2019, 29, 166–171. [Google Scholar] [CrossRef] [PubMed]
- Huang, Z.; Zhang, R.; Chen, H.; Weng, W.; Lin, Q.; Deng, D.; Li, Z.; Kong, J. Sensitive polydopamine bi-functionalized SERS immunoassay for microalbuminuria detection. Biosens Bioelectron 2019, 142, 111542. [Google Scholar] [CrossRef] [PubMed]
- Shaikh, M.O.; Zhu, P.Y.; Wang, C.C.; Du, Y.C.; Chuang, C.H. Electrochemical immunosensor utilizing electrodeposited Au nanocrystals and dielectrophoretically trapped PS/Ag/ab-HSA nanoprobes for detection of microalbuminuria at point of care. Biosens Bioelectron 2019, 126, 572–580. [Google Scholar] [CrossRef] [PubMed]
- Woo, J.; Floyd, M.; Cannon, D.C.; Kahan, B. Radioimmunoassay for urinary albumin. Clin Chem 1978, 24, 1464–1467. [Google Scholar] [CrossRef] [PubMed]
- Comper, W.D.; Jerums, G.; Osicka, T.M. Differences in urinary albumin detected by four immunoassays and high-performance liquid chromatography. Clinical Biochemistry 2004, 37, 105–111. [Google Scholar] [CrossRef]
- Hiraoka, R.; Kuwahara, K.; Wen, Y.C.; Yen, T.H.; Hiruta, Y.; Cheng, C.M.; Citterio, D. Paper-Based Device for Naked Eye Urinary Albumin/Creatinine Ratio Evaluation. ACS Sens 2020, 5, 1110–1118. [Google Scholar] [CrossRef]
- Chagas, C.L.S.; de Souza, F.R.; Cardoso, T.M.G.; Moreira, R.C.; da Silva, J.A.F.; de Jesus, D.P.; Coltro, W.K.T. A fully disposable paper-based electrophoresis microchip with integrated pencil-drawn electrodes for contactless conductivity detection. Anal Methods 2016, 8, 6682–6686. [Google Scholar] [CrossRef]
- Heist, C.A.; Bandara, G.C.; Bemis, D.J.; Pommerenck, J.C.; Remcho, V.T. New paper-based microfluidic tools for the analysis of blood serum protein and creatinine built via aerosolized deposition of polycaprolactone. Anal Methods 2018, 10, 2994–3000. [Google Scholar] [CrossRef]
- Cai, Y.; Niu, J.-C.; Liu, Y.-Q.; Du, X.-L.; Wu, Z.-Y. Online sample clean-up and enrichment of proteins from salty media with dynamic double gradients on a paper fluidic channel. Analytica Chimica Acta 2020, 1100, 149–155. [Google Scholar] [CrossRef] [PubMed]
- Nurrahmah, N.; Amalia, K.T.; Sulistyarti, H.; Sabarudin, A. Fast colorimetric detection of albumin-to-creatinine ratio using paper-based analytical devices with alkaline picrate and Bromothymol Blue reagents. 2021, 12, 140–148. [Google Scholar] [CrossRef]
- Chen, S.J.; Tseng, C.C.; Huang, K.H.; Chang, Y.C.; Fu, L.M. Microfluidic Sliding Paper-Based Device for Point-of-Care Determination of Albumin-to-Creatine Ratio in Human Urine. Biosensors 2022, 12, 496. [Google Scholar] [CrossRef] [PubMed]
- Siangproh, W.; Teshima, N.; Sakai, T.; Katoh, S.; Chailapakul, O. Alternative method for measurement of albumin/creatinine ratio using spectrophotometric sequential injection analysis. Talanta 2009, 79, 1111–1117. [Google Scholar] [CrossRef] [PubMed]
- Sabarudin, A. Sequential Injection at Valve Mixing (SI-VM) for Determination of Albumin-Creatinine Ratio in Urine. Orient J Chem 2018, 34, 730–734. [Google Scholar] [CrossRef]
- Kiwfo, K.; Wongwilai, W.; Sakai, T.; Teshima, N.; Grudpan, K. Determination of Albumin, Glucose, and Creatinine Employing a Single Sequential Injection Lab-at-Valve with Mono-Segmented Flow System Enabling In-Line Dilution, In-Line Single-Standard Calibration, and In-Line Standard Addition. Molecules 2020, 25, 1666. [Google Scholar] [CrossRef] [PubMed]
- Tseng, C.C.; Ko, C.H.; Lu, S.Y.; Yang, C.E.; Fu, L.M.; Li, C.Y. Rapid electrochemical-biosensor microchip platform for determination of microalbuminuria in CKD patients. Anal Chim Acta 2021, 1146, 70–76. [Google Scholar] [CrossRef]
- Thakur, R.; Maheshwari, P.; Datta, S.K.; Dubey, S.K.; Shakher, C. Machine Learning-Based Rapid Diagnostic-Test Reader for Albuminuria Using Smartphone. IEEE Sens J 2021, 21, 14011–14026. [Google Scholar] [CrossRef]
- Zhang, Q.; Wang, G.; Zong, X.; Sun, J. Performance evaluation of Hipee S2 point-of-care testing urine dipstick analyser: a cross-sectional study. BMJ Open 2022, 12, e063781. [Google Scholar] [CrossRef]
- Jia, Y.; Liu, G.; Xu, G.; Li, X.; Shi, Z.; Cheng, C.; Xu, D.; Lu, Y.; Liu, Q. Battery-free and wireless tag for in situ sensing of urinary albumin/creatinine ratio (ACR) for the assessment of albuminuria. Sens Actuators B Chem 2022, 367, 132050. [Google Scholar] [CrossRef]
- Luppa, P.B.; Müller, C.; Schlichtiger, A.; Schlebusch, H. Point-of-care testing (POCT): Current techniques and future perspectives. Trends Analyt Chem 2011, 30, 887–898. [Google Scholar] [CrossRef] [PubMed]
- Suzuki, Y. Reaction between pH indicators with a large pKa value and human serum albumin and its application to the determination of the serum albumin concentration. Bunseki Kagaku 2003, 52, 939–944. [Google Scholar] [CrossRef]
- Jung, K.; Nickel, E.; Pergande, M. A microalbuminuria assay using bromphenol blue. Clinica Chimica Acta 1990, 187, 163–172. [Google Scholar] [CrossRef] [PubMed]
- Pugia, M.J.; Lott, J.A.; Profitt, J.A.; Cast, T.K. High-sensitivity dye binding assay for albumin in urine. J Clin Lab Anal 1999, 13, 180–187. [Google Scholar] [CrossRef]
- Yoshimoto, K.; Kaneko, E.; Yotsuyanagi, T. Analytical Chemistry for Environmental and Human Health. Visual determination of protein in urine using Bromochlorophenol Blue and a membrane filter. Bunseki Kagaku 2000, 49, 363–367. [Google Scholar] [CrossRef]
- Marshall, T.; Williams, K.M. Interference in the Coomassie Brilliant Blue and Pyrogallol Red protein dye-binding assays is increased by the addition of sodium dodecyl sulfate to the dye reagents. Anal Biochem 2004, 331, 255–259. [Google Scholar] [CrossRef]
- Waheed, A.A.; Rao, K.S.; Gupta, P.D. Mechanism of dye binding in the protein assay using eosin dyes. Anal Biochem 2000, 287, 73–79. [Google Scholar] [CrossRef]
| Composition | Molecular formula | Molecular weight (g/mol) | Final concentration (mM) |
|---|---|---|---|
| Sodium sulfate anhydrous | Na2SO4 | 142.04 | 9 |
| Trisodium citrate dehydrate | Na3C6H5O7·2H2O | 294.1 | 5 |
| Urea | CH4N2O | 60.06 | 200 |
| Potassuium chloride | KCl | 74.55 | 30 |
| Sodium chloride | NaCl | 58.44 | 54 |
| Calcium chloride | CaCl2 | 110.99 | 3 |
| Ammonium chloride | NH4Cl | 53.49 | 15 |
| Magnesium sulfate heptahydrate | MgSO4·7H2O | 246.47 | 2 |
| Sodium phosphate monobasic monohydrate | NaH2PO4·H2O | 137.99 | 3.6 |
| Sodium phosphate dibasic heptahydrate | Na2HPO4·7H2O | 268.03 | 0.4 |
| Sodium bicarbonate | NaHCO₃ | 84.01 | 2 |
| Disodium oxalate | Na2C2O4 | 134 | 0.1 |
| Albumin concentration added (mg/L) | Precision (%CV) | Accuracy (%DVM) | ||
|---|---|---|---|---|
| Intraday | Interday | Intraday | Interday | |
| MYµALBUMIN | ||||
| 10 | 2.52 | 4.58 | 1.43 | 4.29 |
| 40 | 1.34 | 3.02 | 2.36 | 1.07 |
| 60 | 1.44 | 2.75 | -0.90 | -1.57 |
| Spectrophotometer | ||||
| 10 | 2.86 | 3.77 | 3.51 | 6.22 |
| 40 | 0.30 | 1.00 | 1.96 | 2.50 |
| 60 | 1.42 | 0.87 | -0.95 | -0.95 |
| Creatinine concentration added (mg/L) | Precision (%CV) | Accuracy (%DVM) | ||
|---|---|---|---|---|
| Intraday | Interday | Intraday | Interday | |
| MYµALBUMIN | ||||
| 0.25 | 1.21 | 12.69 | 5.42 | -2.82 |
| 1 | 1.08 | 4.54 | 4.77 | 1.03 |
| 2 | 1.35 | 3.53 | -2.57 | -4.14 |
| Spectrophotometer | ||||
| 0.25 | 1.99 | 2.35 | 2.61 | 3.83 |
| 1 | 1.25 | 2.32 | -0.15 | 1.43 |
| 2 | 1.42 | 2.40 | -0.20 | 1.23 |
Disclaimer/Publisher’s Note: The statements, opinions and data contained in all publications are solely those of the individual author(s) and contributor(s) and not of MDPI and/or the editor(s). MDPI and/or the editor(s) disclaim responsibility for any injury to people or property resulting from any ideas, methods, instructions or products referred to in the content. |
© 2024 by the authors. Licensee MDPI, Basel, Switzerland. This article is an open access article distributed under the terms and conditions of the Creative Commons Attribution (CC BY) license (http://creativecommons.org/licenses/by/4.0/).


