1. Introduction
1.1. Low resistivity reservoirs
Low resistivity in oil-bearing zones can lead to low contrast with water-bearing zones resulting in water saturation above 50% due to which they can be overlooked and bypassed [1, 2]. Low resistivity and low contrasts can be associated with water salinity, clay type and micro-porosity, presence of conductive minerals, anisotropy, bed thickness and bed dip, drilling mud invasion, and logging tool resolution [
1,
2,
3,
4,
5]. High salinity interstitial water causes low resistivity within the pay zone, while low salinity water can cause low contrast pays.
The main features of the low-resistivity pay are the abundant microporosity and high irreducible brine saturation resulting from cementation, clay coating, or clay bridging within pores and in fine-grained sandstones [
1,
3]. Due to the lack of vertical resolution, the tools give an average resistivity measurement over the bedded sequences with laminar shales. With the dispersed clay, the irreducible water saturation increases, which can dramatically reduce resistivity. The actual water saturation can be high but water-free hydrocarbons are produced due to micro-porosity [
4]. In the presence of conductive minerals such as metal sulphides, the calculated water saturation can be overestimated compared to the water quantities produced during hydrocarbon production. However, the causes of low resistivity can differ from reservoir to reservoir or particular depositional environment and may not be directly applicable to other reservoirs, where conditions initially appear to be similar [
5]. For example, no resistivity contrast between oil and water zones was observed for the reservoirs in Sudan [
2]. Thus, uncertainty in low resistivity pay zones can arise at the initial phase of the evaluation of water saturation before the start of production.
1.2. Difficulties in reservoir simulation of mature fields
During their life cycle, mature oil fields can change owners and producers who are looking for the enhancement in oil production. Revision of existing data accumulated over a long period of production is required for the evaluation of remaining oil reserves to plan future operations such as drilling of new wells, water injection, pump settings, as well as repair and maintenance of existing wells. Reservoir simulation is used to model and reproduce the original state in the field using history match in order to predict future well and field performances. A good history match serves as a means for verifying the accuracy of the dynamic model to adequately present the field performances and its appropriateness for the predictions of future field characteristics such as oil production, water production, and pressure. The static and the dynamic models undergo a series of revisions to obtain a match between the measured field data and calculated data from the model. However, a prolonged production history with field operations overlapping in time and space complicates the simulation. Additionally, production from multiple reservoirs can occur comingled which can lead to uncertainties regarding individual performances of the reservoirs and wells. The original data are often missed which makes it impossible to compare with the base case that occurred before the start of production. New wells are often drilled in the areas already under previous water injections. In this regard, the following wireline logging cannot provide reliable data for the water saturation. All the above-mentioned lead to inconsistency and lack of evidence supporting the explanations of various processes. In addition, different parameters are used for matching by different investigators and these parameters often require rescaling. Additionally, there is segmentation and isolation of various Formation intervals as vertical and horizontal through the introduction of baffles or barriers. As a result, models and predictions vary largely from investigator to investigator leading to contradictory conclusions.
Early water breakthrough during water injection can lead to the bypassing of oil reserves, especially in heterogeneous Formations. Other sources of water breakthroughs such as those resulting from borehole cementing integrity issues, water encroachments along the high permeable streaks, fractures, or underlying aquifers of unclear sources and paths make the history match especially complicated. In the zone of active aquifers and dependent on the structure of the traps, tilted OWC can be formed. This can lead to early water breakthroughs in the areas of the uplifted plane of OWC [
6].
Fluid flows within Formation are controlled by mobility ratio and permeability anisotropy. The mobility ratio (M) that describes the stability of a displacement process is defined as a ratio of mobility (λ) of displacing fluid to the mobility of displaced fluid:
where Kr is the relative permeability, μ is the viscosity, crude oil is the displaced fluid, and water is the displacing fluid.
Efficient piston-like frontal displacement of oil occurs at M≤1. A significant contrast between relative permeabilities and/or viscosities creates a high mobility ratio indicative of an unstable displacement front and fingering [
7]. Notwithstanding, reservoir engineers widely use relative permeability curves as a parameter in history matching because of the inherent uncertainties in these flow curves. By varying relative permeability curves, reservoir engineers can adjust the fluid flow behavior in the model to match the observed production data. Therefore, uncertainty in relative permeability is an important consideration in history matching and reservoir engineering.
1.3. Permeability anisotropy
Permeability anisotropy is presented by the ratio of vertical to horizontal permeability (Kv/Kh) within a formation. The rock permeability depends on the size, form, and shape of grains constituting the reservoir rocks. The grain-scale or layer-scale heterogeneities in rocks that have a preferred orientation lead to the difference in permeability measured in various directions which is a permeability anisotropy [
8]. The permeability anisotropy established during deposition may be further modified by burial diagenetic processes including compaction, dissolution, and cementation of grains. The packing and shape of grains change due to the compaction, which leads to higher permeability in the horizontal than in the vertical direction. Clark (1969) indicated that the horizontal permeability (Kh) would be higher than the vertical one (Kv) for both large and flat rock grains He concluded that generally vertical permeability is lower than horizontal permeability and, especially, if the sand grains are small and have irregular shape [
9].
Laminar heterogeneities are very common in sandstone reservoirs, resulting in successive layers that may differ in permeability by several orders of magnitude [
10]. In such layering structures, the permeability measured parallel to the layers is higher than in the perpendicular direction. However, Kv can be bigger than Kh due to fractures [
11].
Anisotropy is also a scale-dependent property. The smaller volumes tend to be isotropic as can be seen in core plugs whereas at the Formation scale bedding fabric tends to give more difference between Kv and Kh. In fluvial systems, the arrangement of channel and inter-channel elements can have a significant effect on anisotropy. For example, well-intercalated channel systems have a higher tendency to be isotropic whilst preservation of more discrete channels will exhibit more anisotropic behavior.
The permeability anisotropy controls single-phase fluid flow as well as two-phase effective mobility of immiscible phases such as oil-water, and, provides a framework to upscale the effects of such structures to field-scale grids for reservoir models [11, 12].
A more homogeneous permeability distribution has important consequences for the efficiency of fluid flow, and hence, the implication is made that fluid displacement processes commonly applied in the industry (as in a waterflood project) will be more efficient in a sub-vertical direction. In contrast, displacement fronts are expected to be more highly fingered in a horizontal direction, subparallel to bedding or laminae.
The ratio of vertical to horizontal permeability (Kv/Kh) represents the contrast in permeability between the vertical and horizontal planes within a formation, and it is used in simulation. Therefore, the derivation of relevant Kv/Kh ratios is of great importance to predict and guide hydrocarbon recovery at the time scale of a few decades typical of subsurface exploitation schemes but also to model secondary migration processes leading to the location and filling of hydrocarbon reservoirs over geologic time.
In the present study, the effects of permeability anisotropy and relative permeabilities are studied on reservoir simulation results to find an explanation for early water breakthroughs and subsequent high water production in the oil reservoirs. The water breakthroughs occurred before the start of water injection, which assumes that a decent volume of unrecovered oil reserves could have been left behind that can be produced. Various reasons for water breakthroughs and mismatches in water production are investigated. The maps of the remaining oil are presented.
3. Materials and Methods
The objective of this study is to evaluate the remaining oil reserves by comparing the oil reserves before and after production. Core data from LHS formation including porosity, permeability, Kv and Kh were available from four wells. Logging data from seven wells, which were drilled before 1998 were used for the static modeling. Zonation and well correlation were performed using Gamma-Ray (GR) log. Clay volume (Vsh) was calculated using GR. Juhazh plot was imported in Techlog to determine the clay type, adjust the baselines for calculations of clay volume and choose the appropriate water saturation model [
18]. Porosity (Phi) was calculated using density log, which provided a good match with the core date, and permeability was calculated using correlations with porosity, as described in Ref. [
14]. Water saturation was calculated using Archie and Simandoux equations for comparison. Petrophysical and logging data were processed using Techlog software (2017) and further imported into Petrel software (2019).
A fine-scale 3D grid consisting of 660,192 cells (69x104x92) oriented SW–NE at an angle of 50 degrees was generated to create 3D models of thickness, petrophysical properties—using Sequential Gaussian Simulation—as well as to generate maps and conduct volumetric calculations at the start of production. Each cell has a size of 100 m x 100 m x 1.6 m (max). The model was upscaled and optimized for computational efficiency through cell cut-off, using theoretical aquifers, grid size refinement, etc. Sensitivity analyses for porosity and permeability cut-offs and other main uncertainties such as oil-water contact were also conducted. Details of the modelling and simulation procedures can be found in [14, 15].
Dynamic simulation was carried out using Intersect software to history match the production data from the above-mentioned wells of LHS up to the year 1999 and to further evaluate the remaining oil reserves. The history match philosophy adopted was that a simple model capable of a general match is preferable to a complex model requiring heavy “tuning” to individual wells. The history-matched data in order of importance include the oil production rate (OPR) and cumulative, water cuts and water production rate (WPR), RFT Pressures, Producing GOR, Productivity Index
Bottom-hole shut-in and flowing pressures, etc. To investigate the influence of permeability anisotropy, the model was history matched by varying the Kv/Kh ratio from 1:10 to 20:1. This was followed by the sensitivity on relative permeability curves. Previous coreflood experiment conducted has indicated that the maximum water relative permeability (Krwmax) in the presence of irreducible oil saturation was 0.8. Therefore, five different relative permeability curves were generated by shifting both curves (Krw and Kro) to the left or right or by shifting a single curve at a time. The maps of water saturation before and after the production and the percentage of remaining reserves to the initial oil in place are presented for all the sensitized cases.
4. Results and Discussion
4.1. Vertical permeability as a function of horizontal permeability and porosity
Using available measured core data, permeability anisotropy presented by permeabilities measured in vertical (Kv) and horizontal directions (Kh) were studied in four wells.
Since Kh is dominantly measured using cores while Kv measurements are often absent, correlations between Kh or Kh/phi ratio are usually used for Kv calculations. Generally, the equation used for Kv is given in equation 2 [
19]:
However, we have found that the power coefficient of 0.5 does not match the correlation line when plotting Kv vs. (Kh/Phi)
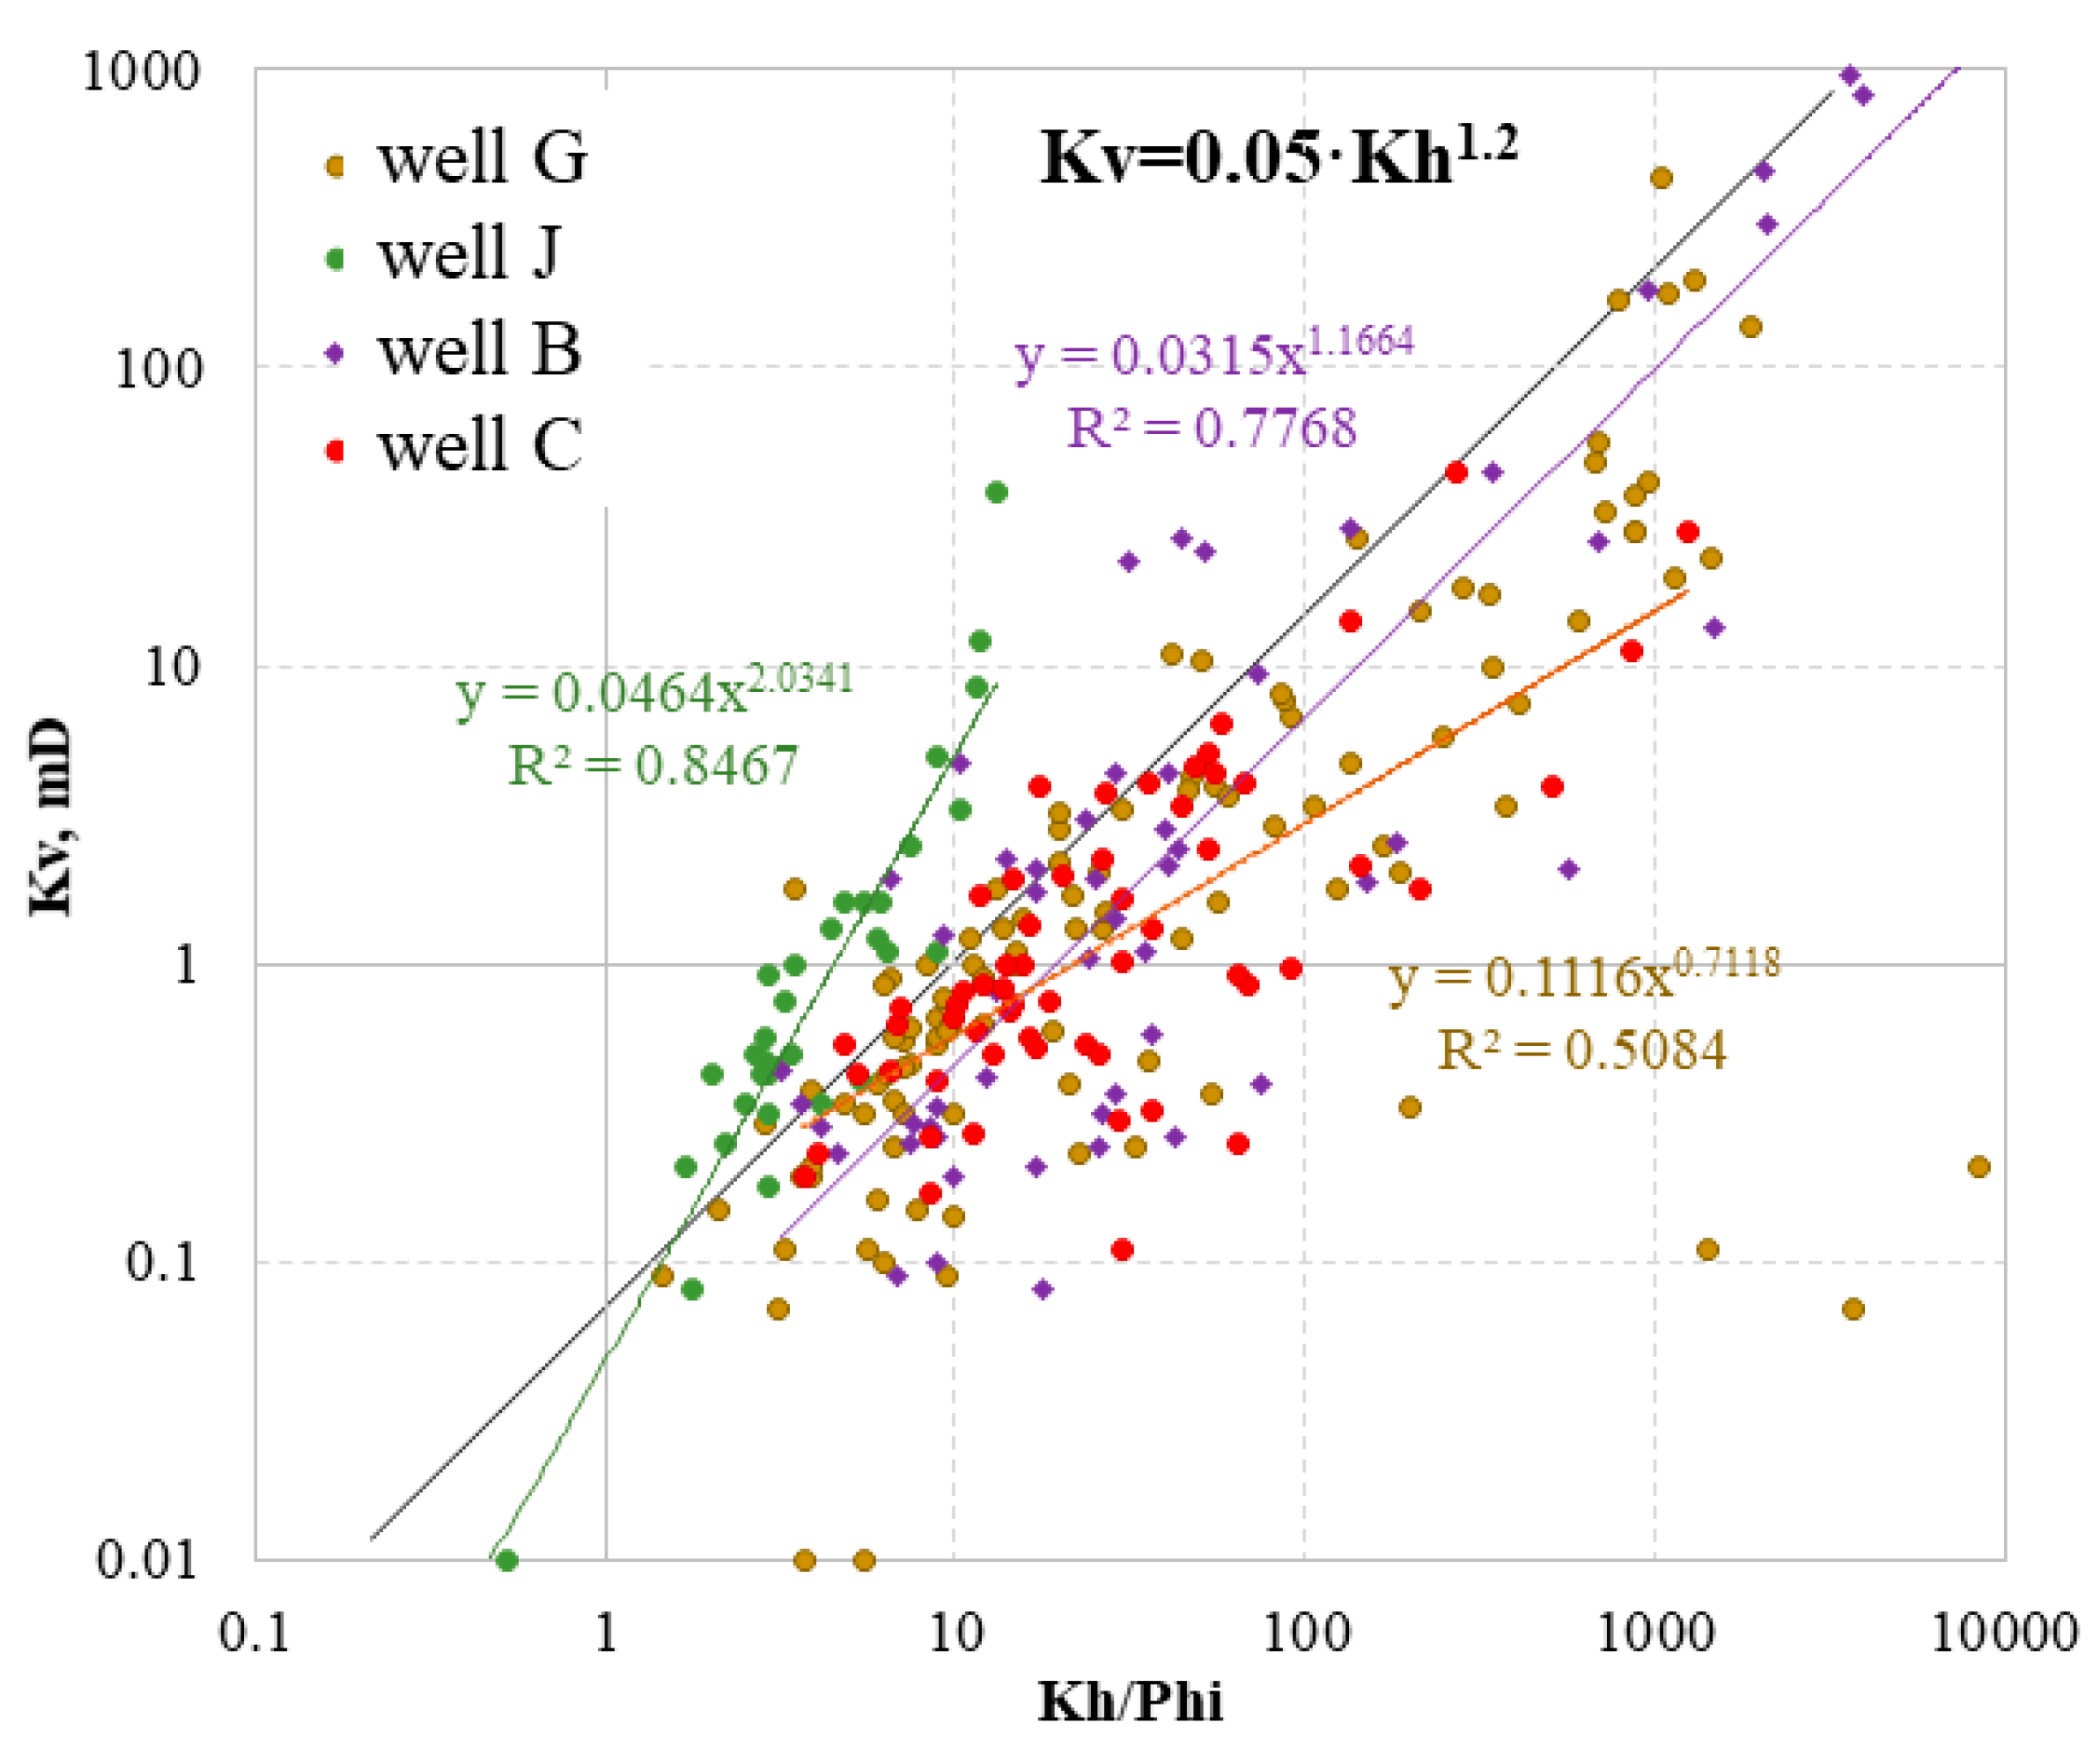
0.5. The datasets of individual wells required a substantially higher slope than 0.5. To clarify the power coefficient, Kv was plotted vs. Kh/Phi in
Fig.1. The highest slope of 2 was required for Well-K, which is located outside of the considered area. The lowest slope of 0.7 was obtained for Well-C. The analyses on wells B and G indicate that most of the data have a slope of 1.2.
The line which intercepts most of the data is described using the following equation:
where the y-intercept is 0.05 and the power coefficient which regulates the slope of the line is 1.2.
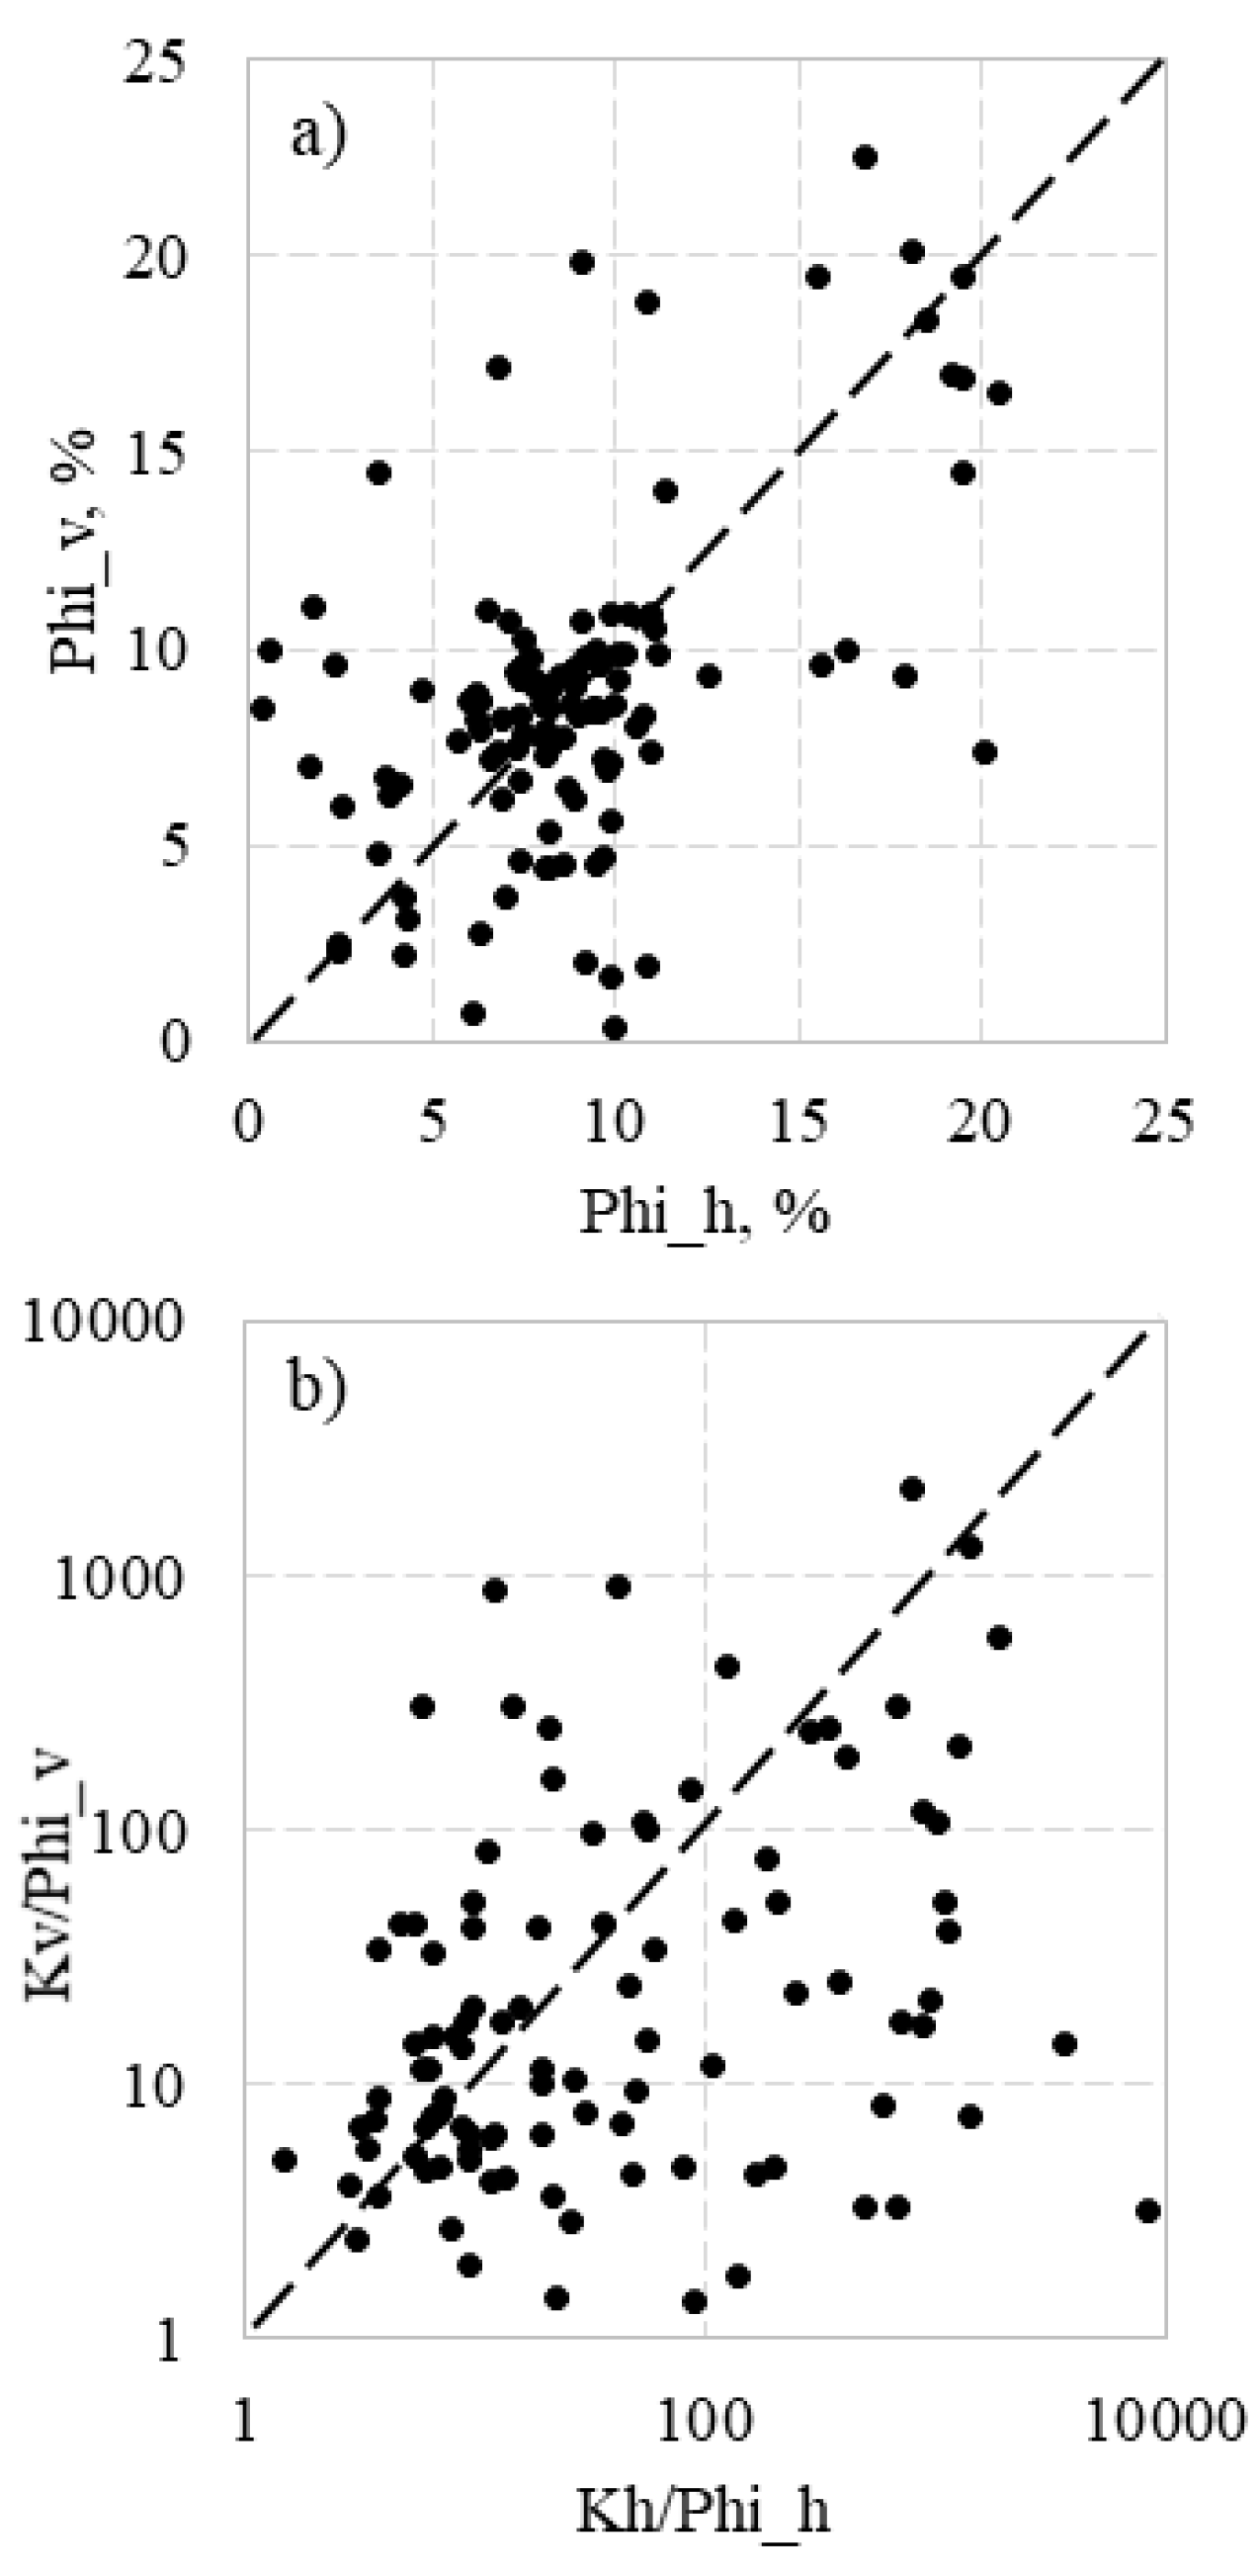
It could be assumed that the large data scatter is caused by the porosity. For the given datasets, porosity was measured in both horizontal (Phi_h) and vertical (Phi_v) directions and showed significant differences. For example, although porosities in horizontal and vertical directions of Well-G are concentrated around a 1/1 line, the majority of the data are scattered (
Fig.2a). The reason for the deviation is described in the core description as having fissures.
It can be expected that the data scatter in
Fig.1 can be decreased if to use Kv/Phi_v ratio instead of Kv. However, the effect is the opposite. The scatter of data increased dramatically on the plot of Kv/Phi_v vs Kh/Phi_h in
Fig.2b, compared to Kv vs Kh/Phi_h in
Fig.1, which uses data from Well-G as an example. Consequently, the Kv/Kh was further analysed to understand its significance in modelling the displacement.
4.2. Permeability anisotropy (Kv/Kh)
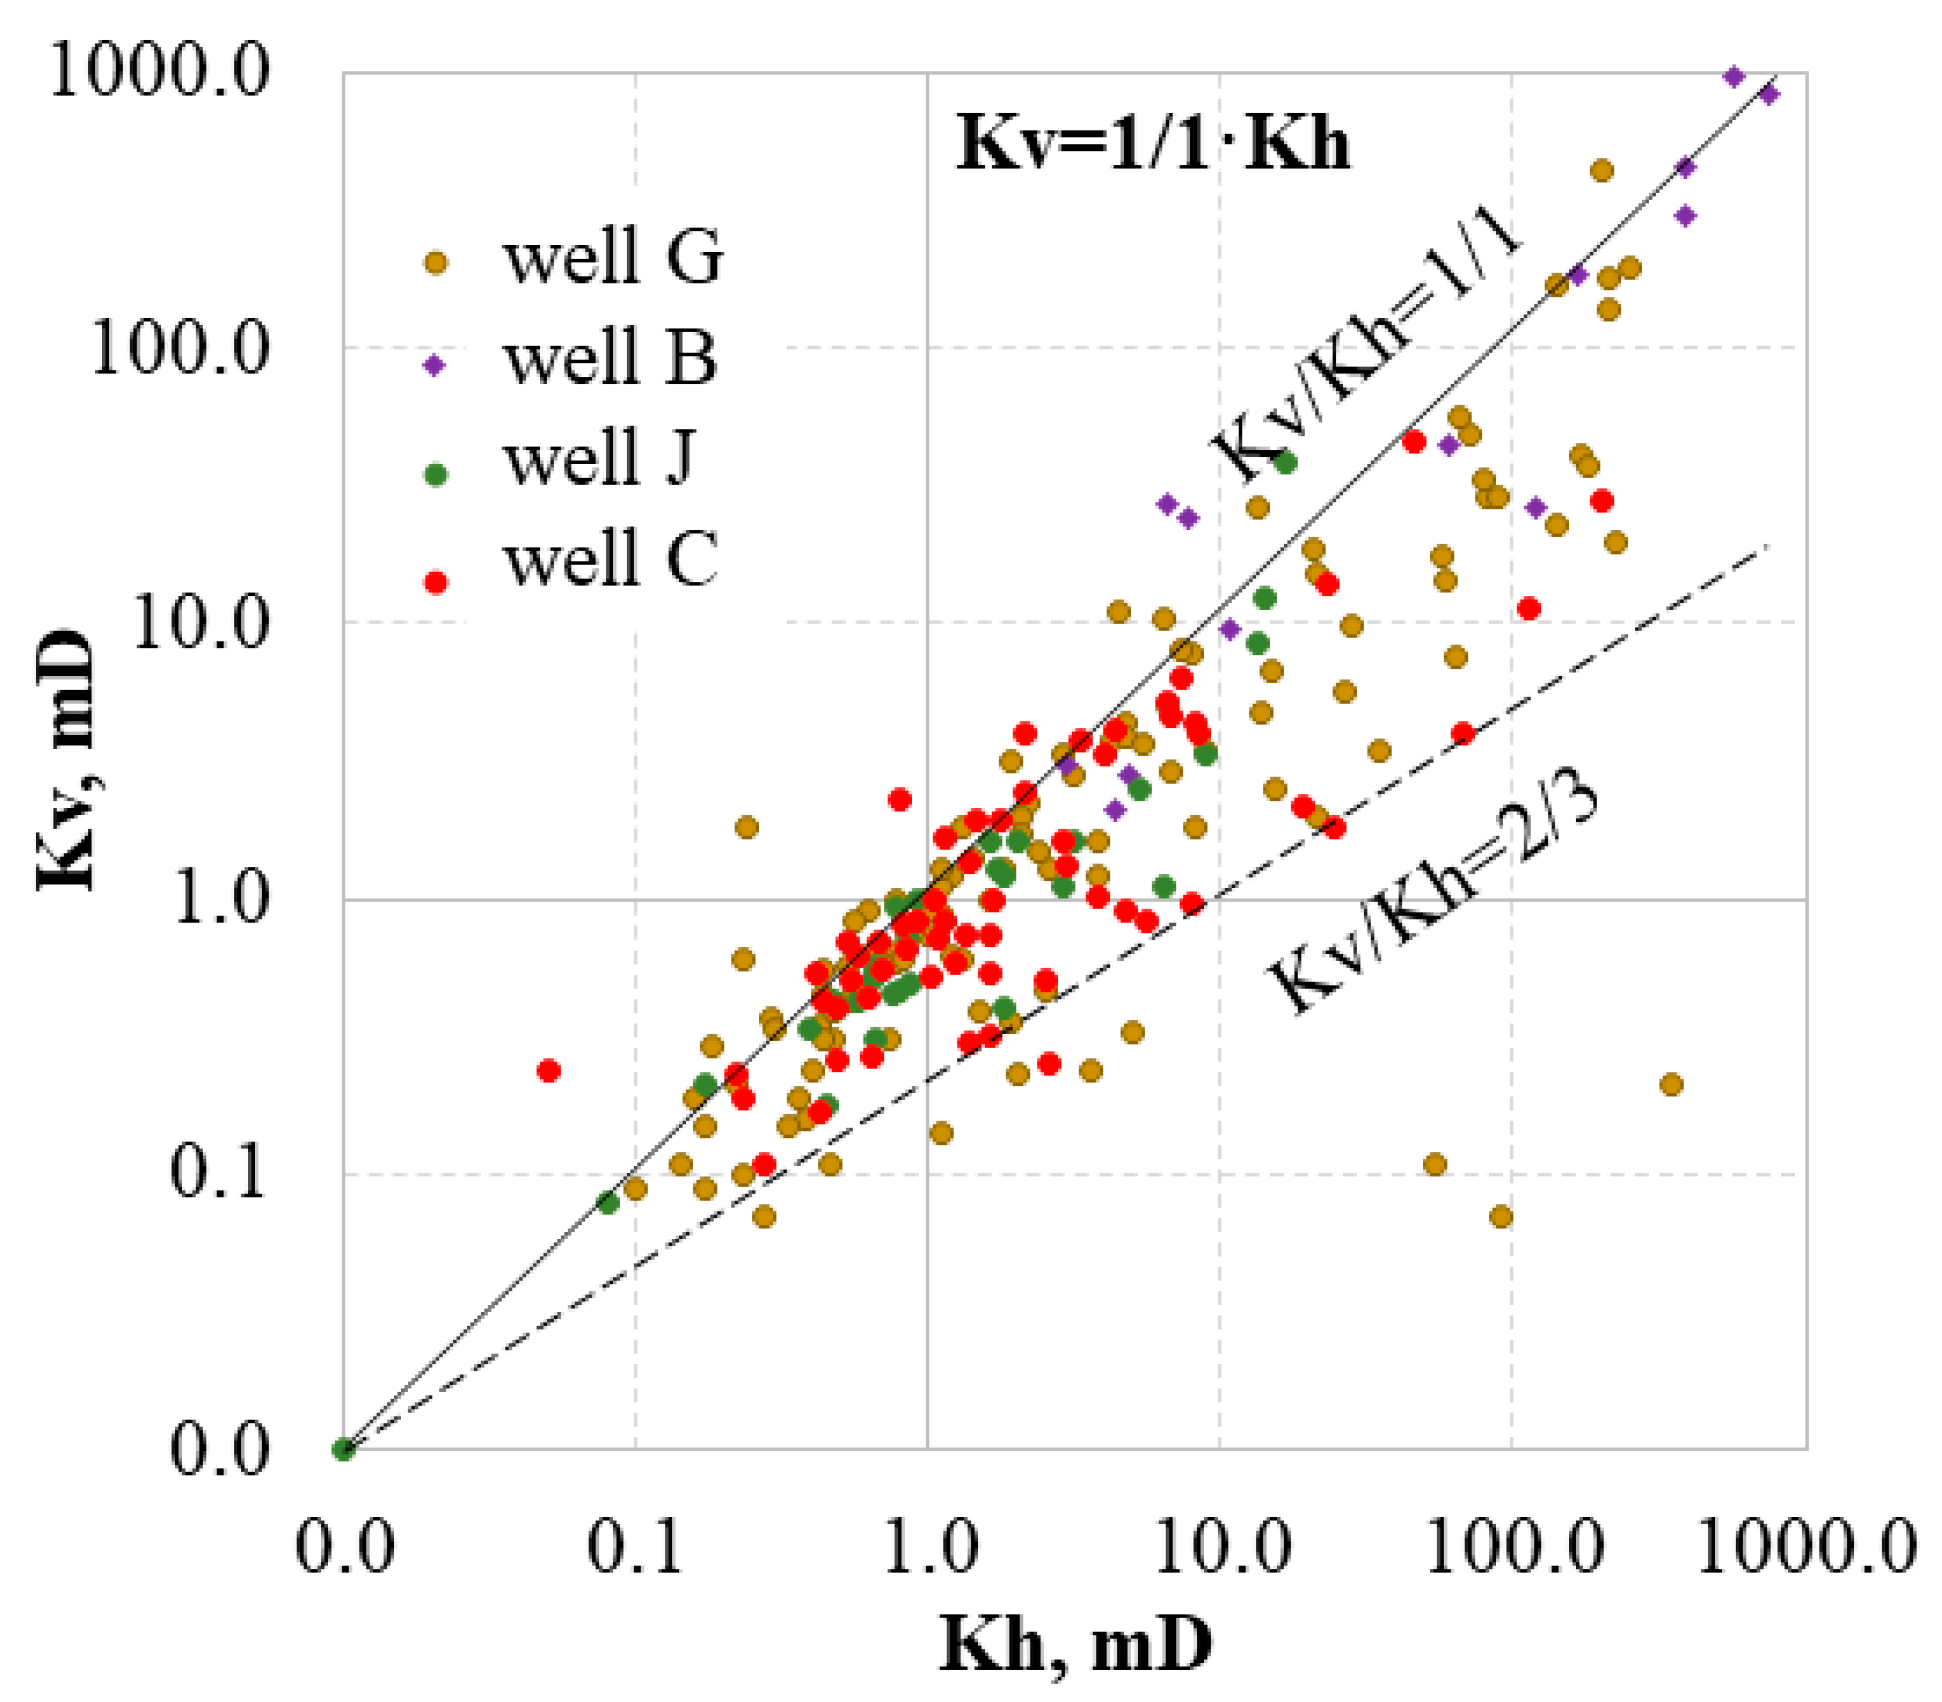
Permeability anisotropy (KV/Kh), which is often presented by the integer ratio (Widarsono et al. 2006) [.19.], is an essential parameter that controls fluid production rates, OPR and WPR. If the fractured samples are excluded - in which the ratio Kv/Kh is above 1000 - the data of all wells converge between the upper line which corresponds to Kv/Kh=1/1, and the lower line which corresponds to Kv/Kh=2/3 (
Fig.3). Most of the data follow the line of Kv/Kh=1/1. The data of Well-G are scattered more widely. Some of the deviating points also belonged to Well-C. Most of the data points were below 10 mD, which can mean that Kv/Kh has little significance in terms of recovery because such low permeabilities limit the rate of flow as the fluids are diverted almost exclusively through the more permeable cells (Lishman 1970) [.17.].
However, in Well-G, there are intervals with Kh up to 200 mD within the very tight Formation even if the fissures are not detected. Irrespective of the high values of the permeabilities ranging up to 10,000 mD, the data of Well-B closely followed a 1/1 line.
The data deviating above the 1/1 line indicate secondary fabrics with increased Kv, while the data below it show depositional pore structure. In Ref. [
21], it can also be seen that a group of data follow a 1/1 line with other data below it indicating higher Kh.
The Kv/Kh=0.1 often used by default in simulation is indicative of laminar structure (Meyer and Krause 2001) [
22]. For example, Kv/Kh=0.19 was used for the Arbuckle Formation, which is a laminar rock structure without fractures [
11]. In contradiction to the commonly held notion that laminated sandstones have low Kv/Kh-ratios, Kv/Kh of laminated sandstones of the Virgelle Member varied between 0.5 and 0.8 while it was 0.7 for the homogeneous sandstone [
12], which is close to the 2/3 we established for the Gharif Formation.
Using the Kv/Kh value of 1/1, the LHS sandstone is very homogeneous through which the water flow can be equally diverted in all directions with the upward water inflow into the upper layers controlled only by gravity. The relatively higher vertical water mobility can be a substantial factor for the fast water breakthroughs observed in LHS.
4.3. Water saturation calculation
Water saturation was calculated by Archie’s equation:
where “m” is the cementation exponent, “n” is the saturation exponent, and “aRw” is the formation water resistivity (Rw) multiplied by tortuosity (a).
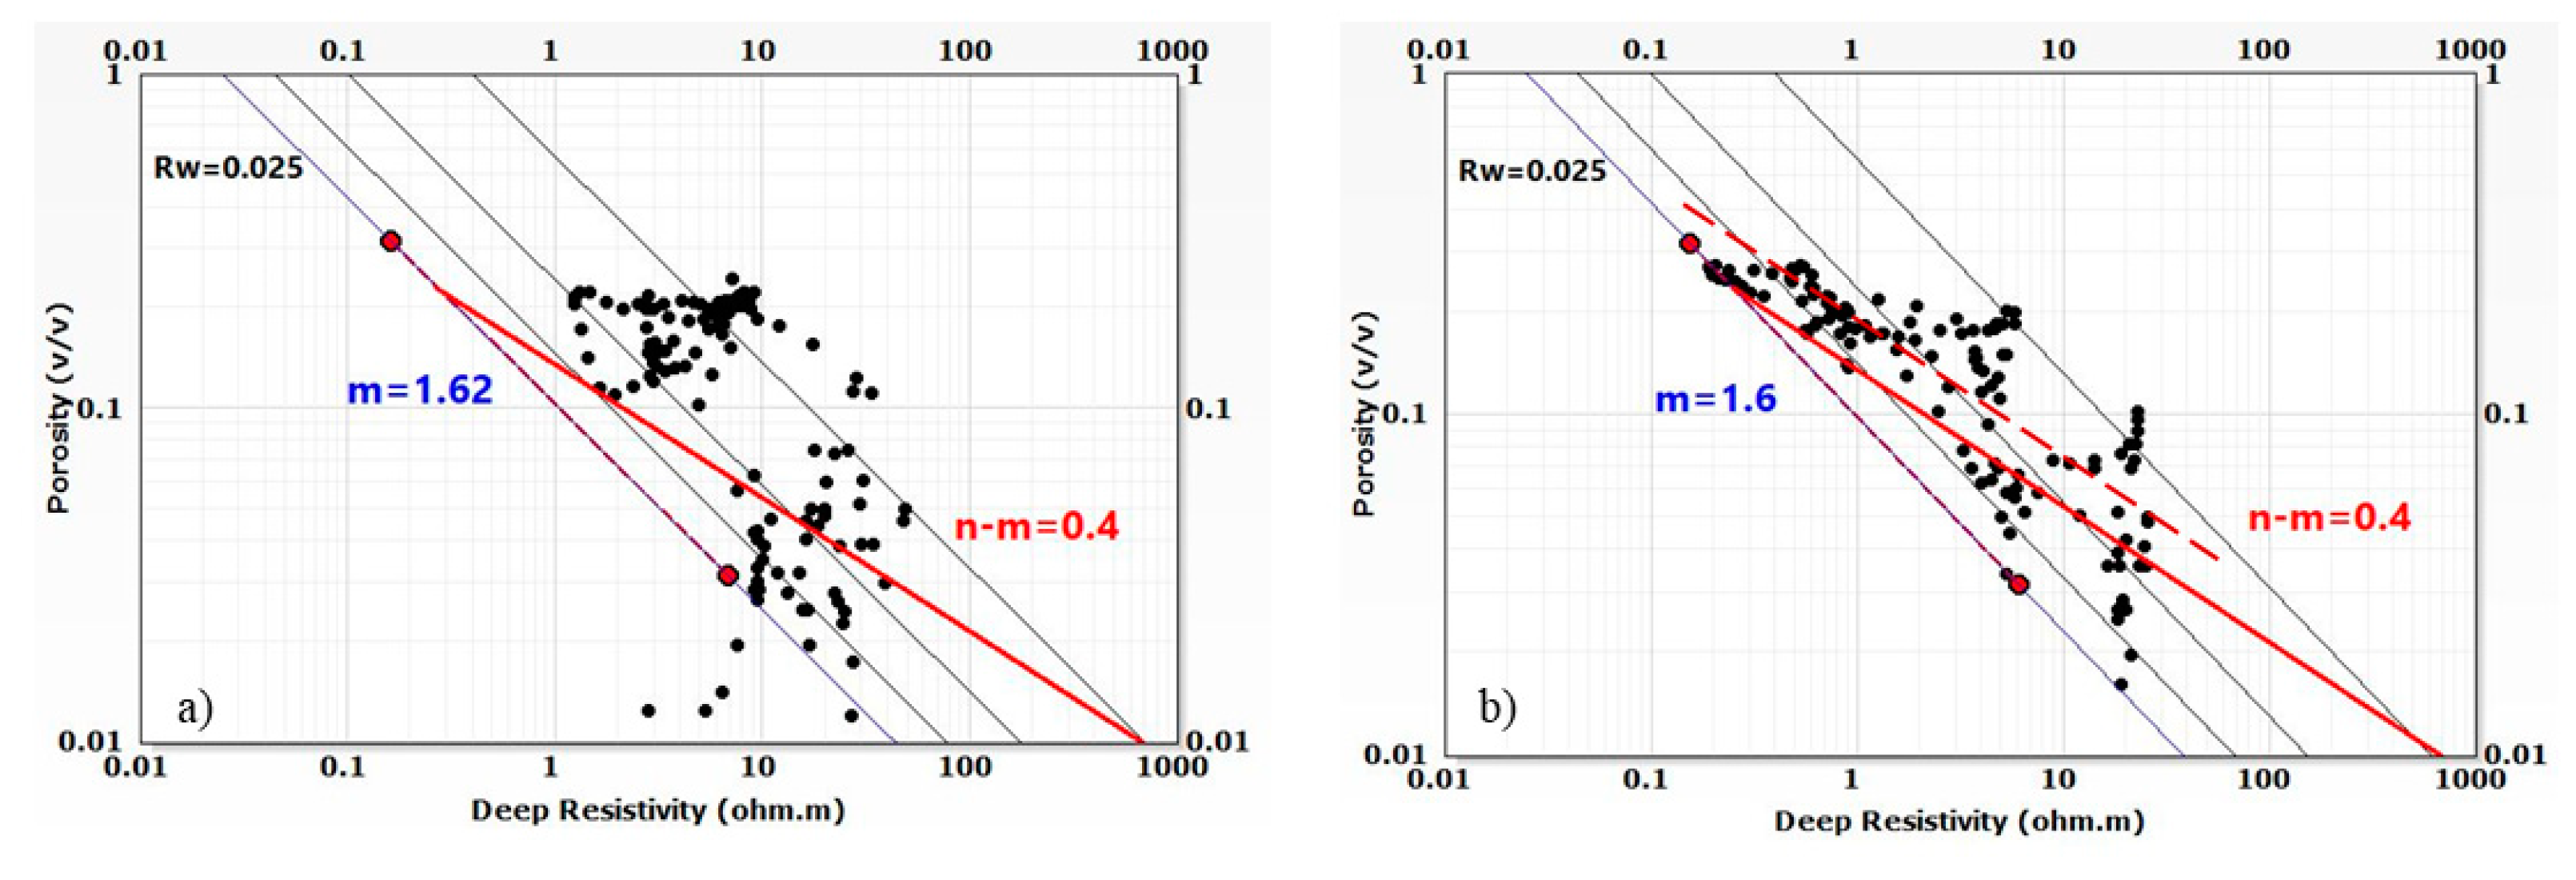
Pickett plot was used to derive Archie’s parameters as shown for two wells in
Fig.4. The slope of the line across the water zone is “1/m” while the resistivity on the x-axis corresponding to the y-intercept at Phi=1 indicates Rw=0.025 Ohmm with a=1. The lines across oil zones are parallel to that of the water zone, implying similar “m” in both zones. Pickett plot can also be used to determine “n-m” for the oil zone. Red lines indicate n-m=0.4, which implies that n=2. The data more clearly follow the lines with slopes of 0.4 in the plot of Well-E.
Two field water samples with total dissolved solids of 166 and 183 g/L were dated 2005 although water injection commenced in 1997. At the reservoir temperature of 90 oC, such salinity results in the resistivity close to the Rw determined using the Pickett plot, which can indicate that the Rw reflects actual formation water resistivity.
Cementation exponent can vary laterally as vertically with the depth [23, 24]. The “m” decreases with decreases in porosity and salinity [
25]. Experiments using porosity ϕ > 65% showed that the increase in “m” is universally correlated with the volume fraction of pore throats for all the samples regardless of their particle shapes, particle size range, and porosities [
26] On the other hand, “m” decreases with increase in clay volume due to large amount of interconnected clays combined with formation water [
24]. As a result, m=1.3 can be obtained in unconsolidated sand as in shaly sand [27, 28]. A cementation exponent of 1.5 represents the analytical solution for the case where the rock is composed of perfect spheres [
25].
Based on that, it can be concluded that the cementation exponent of the LHS reservoir, which is uniformly close to 1.6 in all wells, indicates a high degree of connectivity in the pore network and poor cementation if such low value is not associated with the shaliness. Parameters “m” and “n” are often close in magnitude. However, n=2 is used in the Sw calculations since most of the data clearly followed two lines of n-m=0.4 in
Fig.5b.
Thus, the obtained Archie’s parameters are as follows: (aRw = 0.025, m = 1.6 and n = 2). Howver, in previous calculations, the parameters used were aRw = 0.035, m = 1.66 and n = 2) and aRw = 0.054, m = 1.8 or 1.95 and n = 2 [
16]. It is important to highlight that Small differences in Archie’s parameters can cause big differences in Sw. Therefore, the sensitivity of Sw to Archie’s parameters was studied using our values and previous data. The decrease of aRw by 0.1 decreases Sw by about 5% while a decrease of “m” by 0.06 decreases Sw by about 2%. In general, Sw calculated using the revised parameters is about 7-8% lower than the previous dataset, thus increasing oil saturation to values higher than 60%. In any case, with both sets of Archie’s parameters, the oil saturation is above 50%. In this regard, previous evaluations of Sw can be considered conservative and, hence, high water production cannot be associated with underestimations of Sw.
4.4. Clay type using Juhasz plot
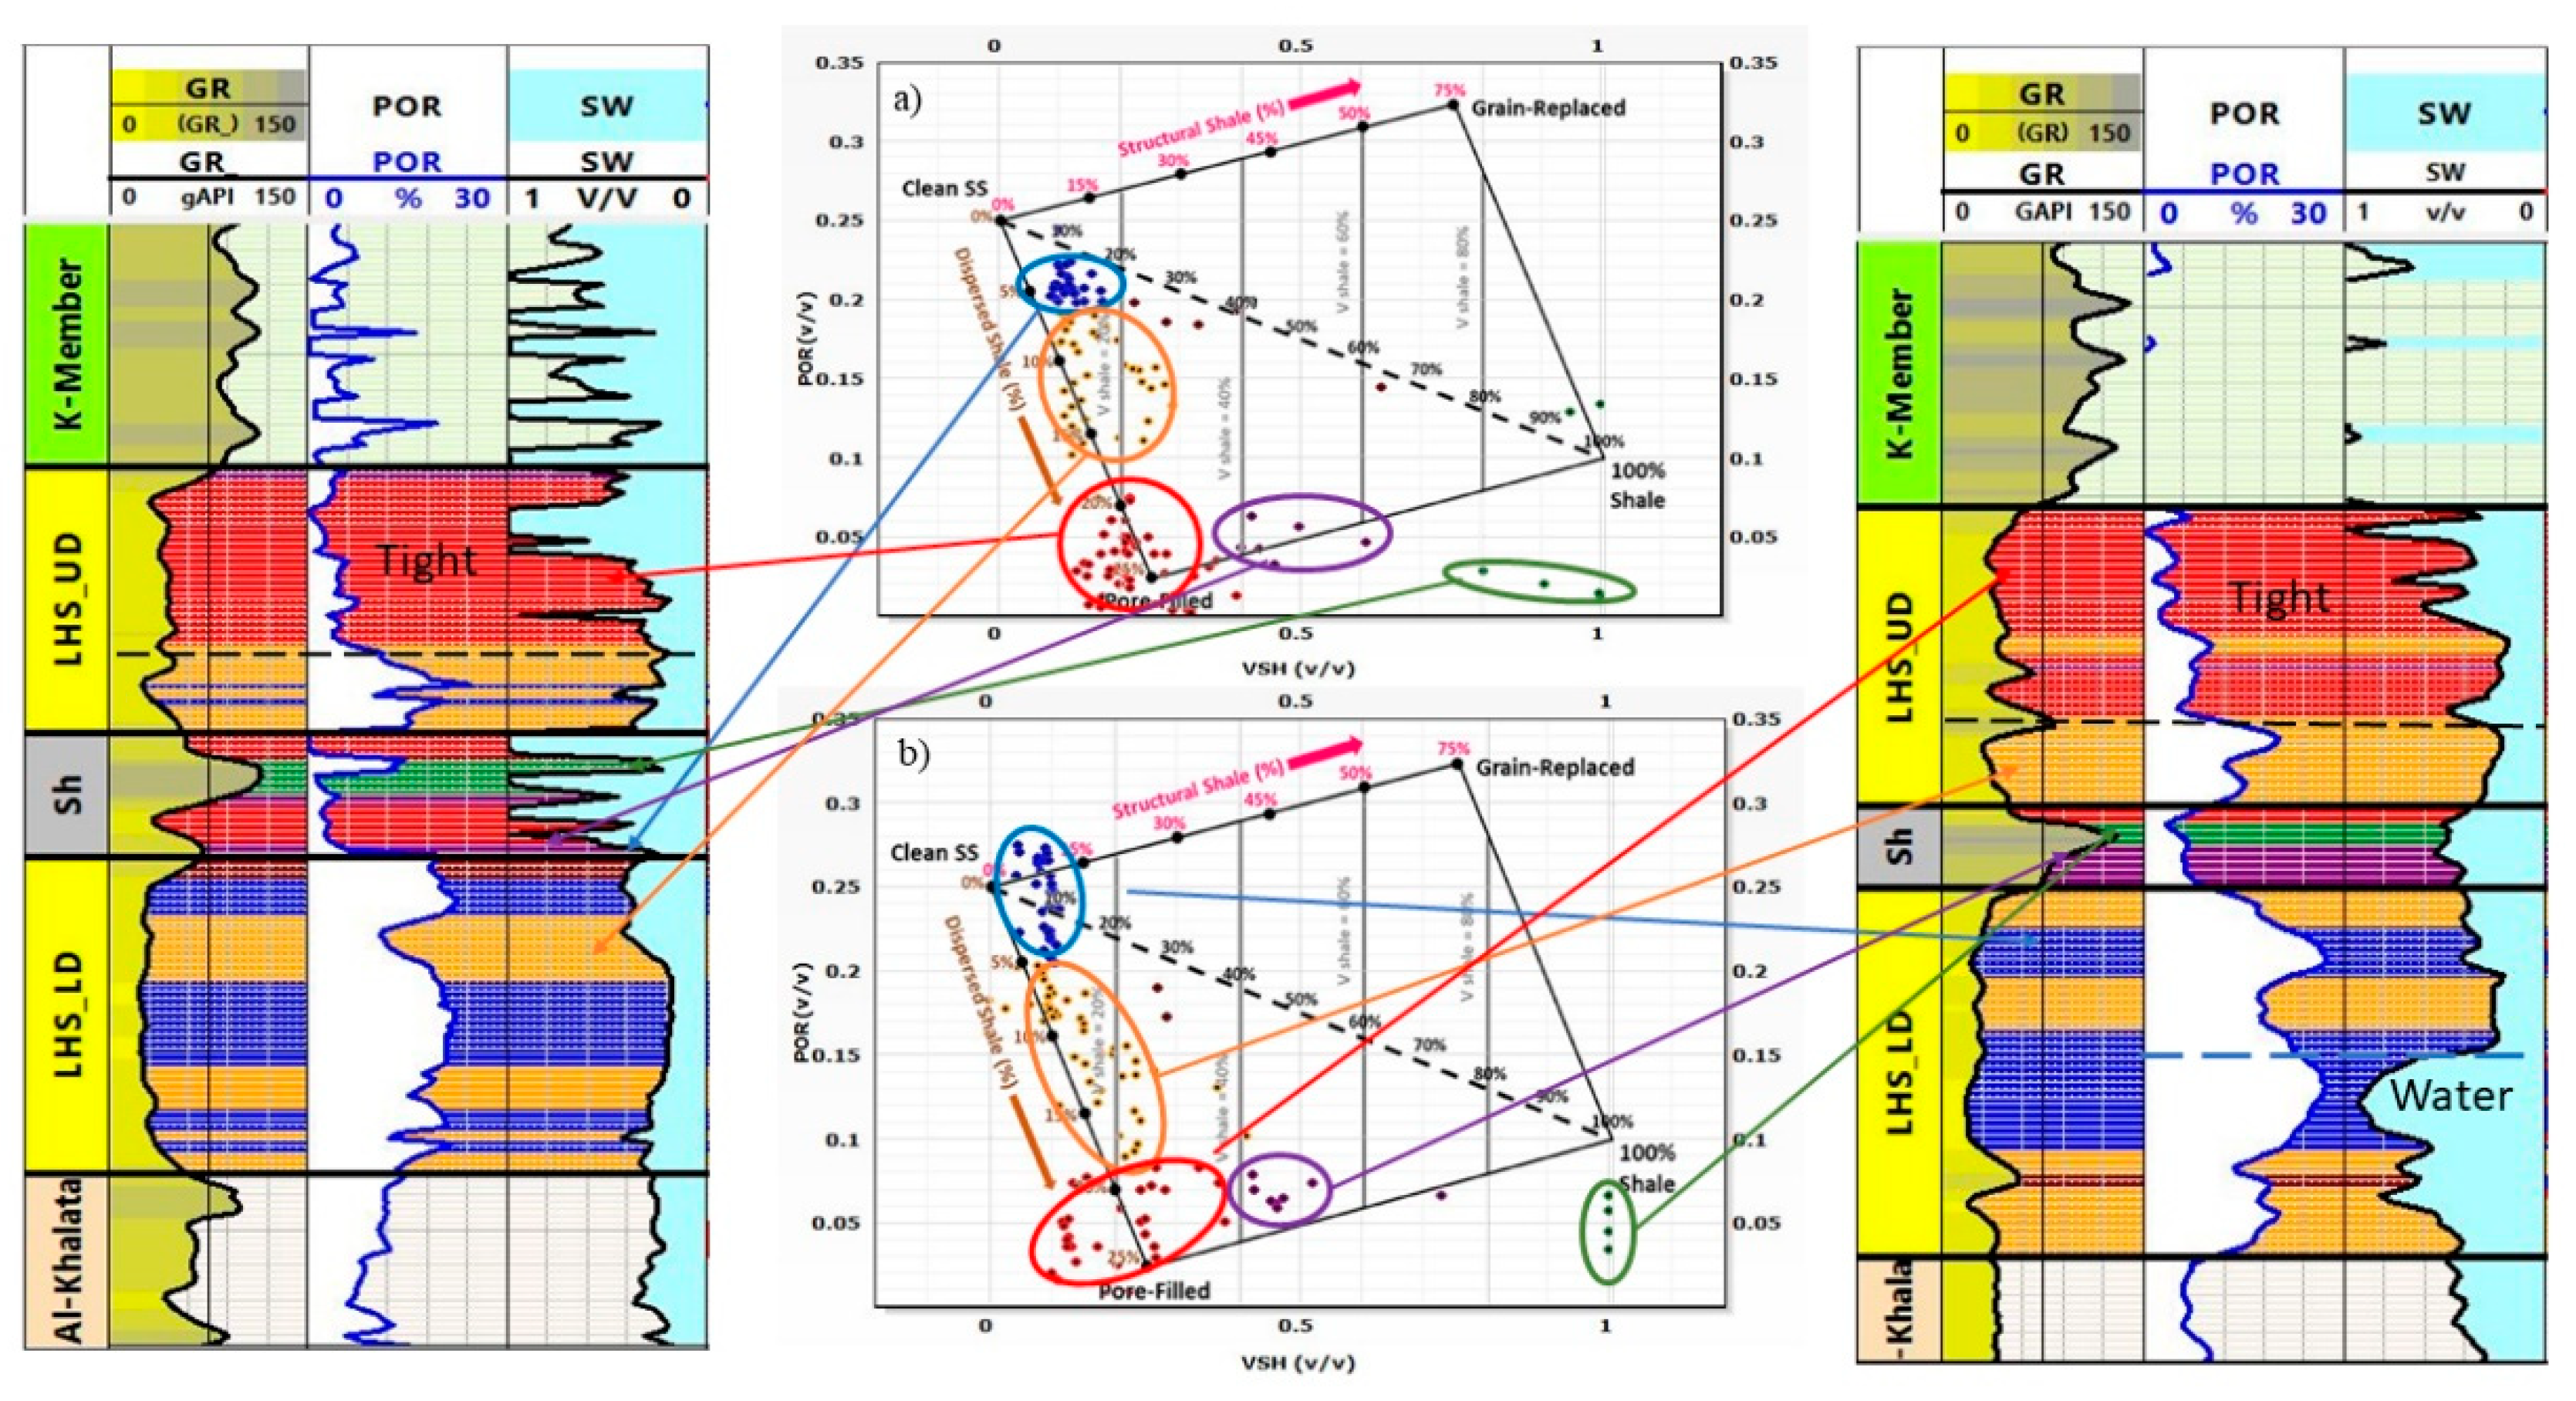
The logging curves of GR, porosity and water saturation are shown for two wells in
Fig.5. The LHS reservoir is divided into two sections by a shale layer in the middle of the reservoir: the upper section (LHS-UD) and the lower section (LHS-LD). In the uppermost part of (LHS-UD), the sandstone is tight with porosity well below 6%. Some thin layers have porosity below 2%. This tight section has a thickness of about 4 m. This upper layer of LHS-UD can be characterized as a tight oil reservoir due to its low porosity and permeability. Such tight oil sandstone reservoirs attract much attention in many countries and present a huge oil resource potential in China [
29].
Due to very low porosity and despite resistivity in the range of 10-50 Ohmm, Sw at the top of LHS-UD results in values close to unity and indicated in blue as water, which contradicts the actual presence of oil because this is an oil zone on the top of the reservoir (
Fig.5, 6).
Shale volume (Vsh) and clay type can significantly affect the values of water saturation derived from resistivity logs. For the account of shaliness in the calculations of Sw, numerous water saturation models have been derived, which can be found elsewhere [25, 27]. In order to evaluate the clay type distribution, the Juhasz plot was used, as shown using wells G and E for example (
Fig.5). The shale lines were adjusted to make sure that shale in the middle of LHS was indicated as shale. Across the depth, clay types are distributed differently, as indicated in different colors. In the tight oil section, the clay is pore-filling with Vsh between 20 and 25%. In the cleanest part of the sandstone with the highest porosity, the dispersed clay is below 7%. In other parts with also high porosity, the Vsh of dispersed clay varies between 7-15%.
In Well-E, the lowest 8 m of LHS-LD has resistivity below 1 Ohmm resulting in Sw >80%, which clearly indicates a water zone and oil-water contact (OWC). This can be explained by the fact that this well was drilled 7 years later than Well-G, and this water zone at the bottom shows rather the rise of OWC than water breakthrough. This also shows that in the porous part, the contrast between oil and water is sufficient to separate them even at such low resistivity and implying that the oil zone in Well-G is down deep to the base of the reservoir. However, this water influx from the aquifer and the logging response of the invaded water may not be the same as the connate water saturation.
Hence, the lower parts of LHS-UD and LHS-LD sandstone are mostly clean homogeneous sandstone with porosities up to 23% on average, with a low fraction of dispersed shale, which should not noticeably affect the water saturation. A sufficient contrast between oil and water zones is generated irrespective of the low resistivity. However, in the tight part of LHS-UD, low porosity with a shale volume of about 20-25 % even at higher resistivity results in high water saturation due to low contrast between oil and water.
4.5. Well logging profile for LHS reservoir
Gamma-ray, porosity, resistivity, water saturation and perforation intervals in the LHS reservoir are shown for wells G, D, C, B, H and E in
Fig.6. Well-A is not included because well logging was not performed in this well. Instead, Well-H is shown for the correlation purpose but it did not produce from LHS.
Core porosity data measured using core samples closely followed calculated logging porosity in Well-G. In Well-C, the core porosity also closely followed log-derived porosity in the tight section of LHS-UD but shows lower values in the lower part of LHS-UD and the LHS-LD of higher log-derived porosity.
In the lower part of the LHS-UD and over the entire LHS-LD, the porosity is up to 23% and the resistivity is below 5 Ohmm. The resistivity in the porous layers can be as low as less than 1 Ohmm.
Porosity does not vary significantly across the LHS-LD section in wells G and C, while in Well-D, the porosity noticeably decreased from top to base accompanied by a resistivity increase. It can be assumed that the grain size decreased with the depth in LHS-UD in Well-D. The resistivity decrease is often associated with an increase in grain size since resistivity is inverse to average grain diameter when other parameters are kept constant. For example, quartz sandstones composed of big grains formed in the continental crust in the rift zones of Western Siberia and the Dnieper-Donetsk depression have 1-5 Ohmm at Rw=0.01 Ohmm [
30].
The uppermost tight layer on top of LHS-UD has an Sw value close to unity in all wells in the oil zone, which can be due to the low contrast between oil and water caused by very low porosity. Except for this layer, the water saturation is consistently about 40-45 %, indicating the oil zone covers the entire LHS reservoir. Consequently, the OWC was set in the underlying Al-Khlata Formation in the previous model and was maintained in this study.
Although it was assumed that the oil zone included both LHS and UHS reservoirs, low resistivity or low contrast may mask the difference between oil and water and lead to misinterpretation of OWCs. For example, 59 oil pools were recently discovered in Sudan in low-resistivity reservoirs, which were bypassed in the past because they did not exhibit any contrasts with the water zones [
2].
Among all the wells, only Well-D—which produced solely from LHS—did not experience early water breakthrough. Others produced comingled with the reservoirs of Upper Haushi, as shown in
Table 1, and experience water breakthroughs. In wells C, B and E, perforations also covered the overlying shale and reservoirs of the Upper Haushi Formation. Perforation in Well-C extends down to the Al-Khlata Formation. Hence, water can influx from the upper or the lower Formations if the contrast between water and oil is not captured by the logging methods. For example, well-testing performed in the uppermost tight zone of UHS showed only water.
4.6. Porosity derived from electric propagation time method
In Well-E, which was drilled later than the other wells, the contrast between oil and water determined using resistivity logs in the LHS-LD reservoir is clear (
Fig.5,
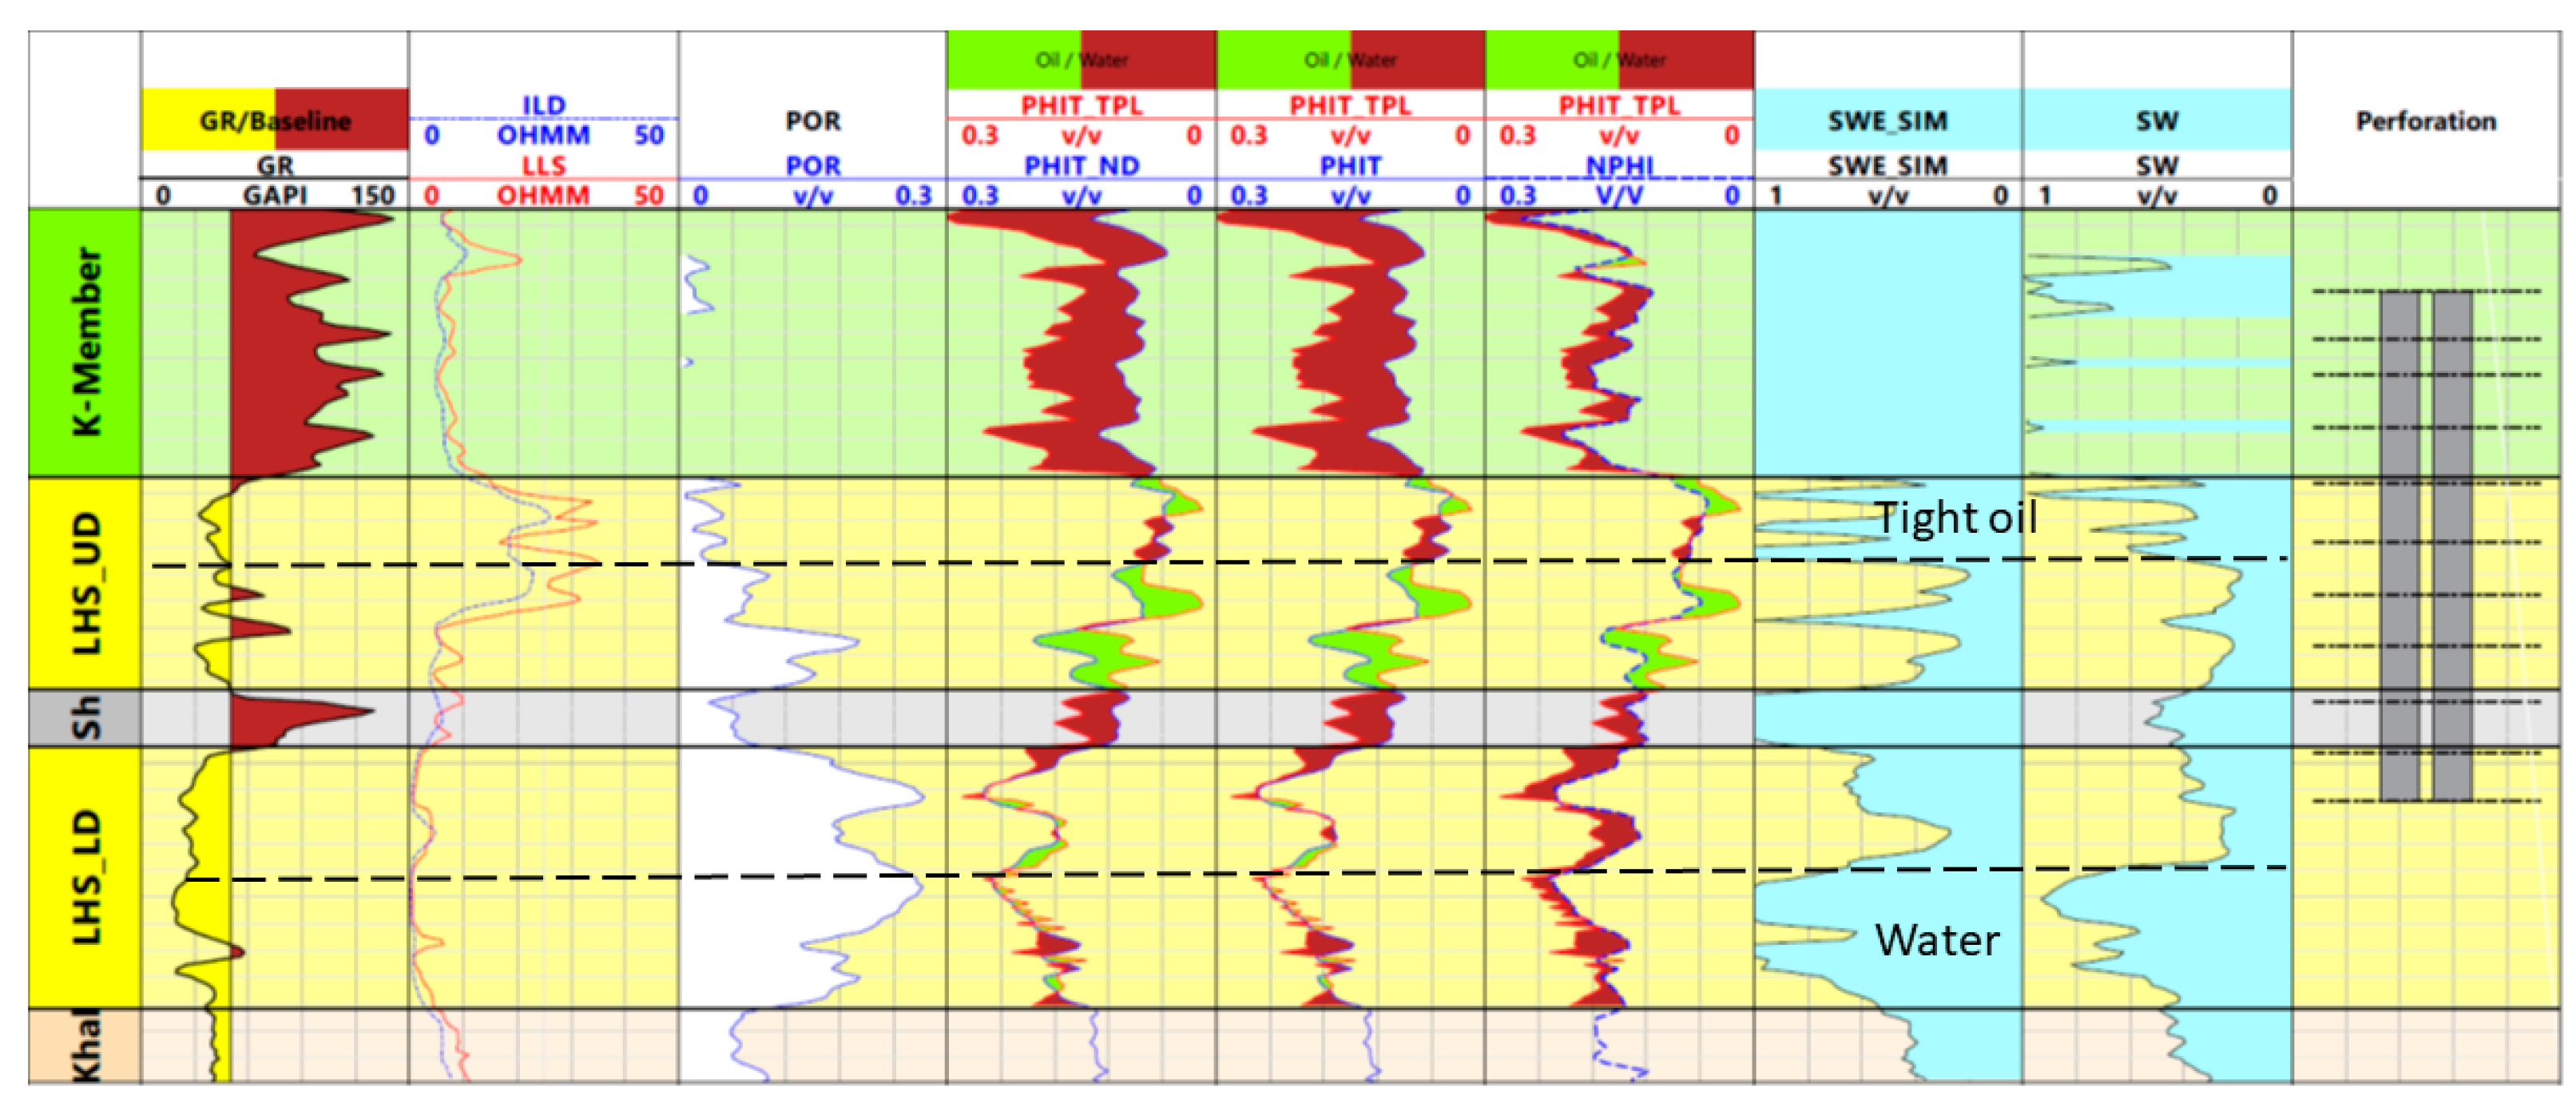
6). The electric propagation time (EPT) log, which is only available in this well was used to investigate the viability of the method in capturing the oil-water contrast. The Gamma-Ray, Deep and Shallow Induction logs, Electric propagation time (EPT) log and Sw calculated using Archie and Simandoux equations in Well-E are compared in
Fig.7. Porosity calculated using EPT (PhiTPL) was compared with Phi calculated using neutron and density methods: mean porosity of neutron and density porosities (PhiND), density total porosity (PHIT) and neutron porosity (NPHI) in
Fig.7. Brown color indicates water, which can be clearly seen in the shale.
In the LHS-UD, bigger separations between PhiTPL and all three other curves indicate oil (green) in the tight as well as the porous zones. Therefore, EPT certainly indicates oil in the upper tight part of the reservoir despite the Sw value indicating close to 1 when calculated using the Archie equation and above 1 using the Simandoux equation.
However, the porosity curves are so close in the LHS-LD that the result is inconclusive on whether this is oil or water. The separation of PHIT_TPL with NPHI is indicative of water in the entire LHS-LD section while the water zone is clearly distinguishable in the Sw curves.
The separation of PHIT_TPL with PHIT_ND and PHIT is too small to give a confirmative conclusion regarding the type of saturation. Low contrast can be caused by water influx due to the rise of OWC. Accordingly, EPT and ILD methods can have different sensitivity to the presence of water at such conditions of this reservoir.
Other methods may be required method to determine water saturation in the current state, such as the pulsed neutron-neutron method, which has shown good result in a low- resistivity depleted oil reservoir [
31].
The perforations in this well cover the upper shale (K-member) which has sandstone layers, for which the EPT as both the water saturation curves indicate water which can be mobile in these layers. Initially, UHS and LHS were considered as single reservoirs with a single OWC. Later, they were separated into two different reservoirs with unclear and undetermined OWC contacts [
16].
4.7. Factors leading to low resistivity
To discuss the reasons for the low resistivity in the LHS reservoir, various factors were considered. The factor of additional conductivity can be excluded since Vsh is very low and conducting minerals have not been mentioned in the mineralogical description of the reservoir. A factor of high irreducible water saturation can also be excluded.
Although the MICP data were unavailable for LHS, they were available for the Upper Haushi reservoir which also has similar low resistivity and a tight section on the top. Irreducible water saturation (Swir) depends on the maximum measured pressure. Therefore, it can vary with the pressure and height above the free-water level. The irreducible water saturation in UHS according to capillary curve analysis was below 20% in the measured range of pressure. For comparison, in another tight sandstone sample, Swir was 18% at a porosity of 5.7% and a permeability of 5.6 mD [32, 33].
The resistivity of the formation is controlled by the resistivity of the fluid and rock. High salinity fluid generates low resistivity. Low resistivity can be promoted by a well-developed porous system with fissures, which does not create high resistance to the electrical current flow, and in the combination with high salinity formation water results in low resistivity. Additionally, the cementation factor of 1.6, Kv/Kh=1, dispersed clay type and high porosity indicate homogeneous sandstone with even grain packing and good connectivity. The fact that the resistivity is high in the oil-producing Dolomite Drain with different geometry of porous media can support this conclusion.
4.8. Influence of Kv/Kh on the production curves
The factor of similar horizontal and vertical permeabilities can play a substantial role in fast water breakthroughs. In this study, we focused on the influence of permeability anisotropy on the simulation results while the details of the simulation procedure can be found in Ref [14, 15].
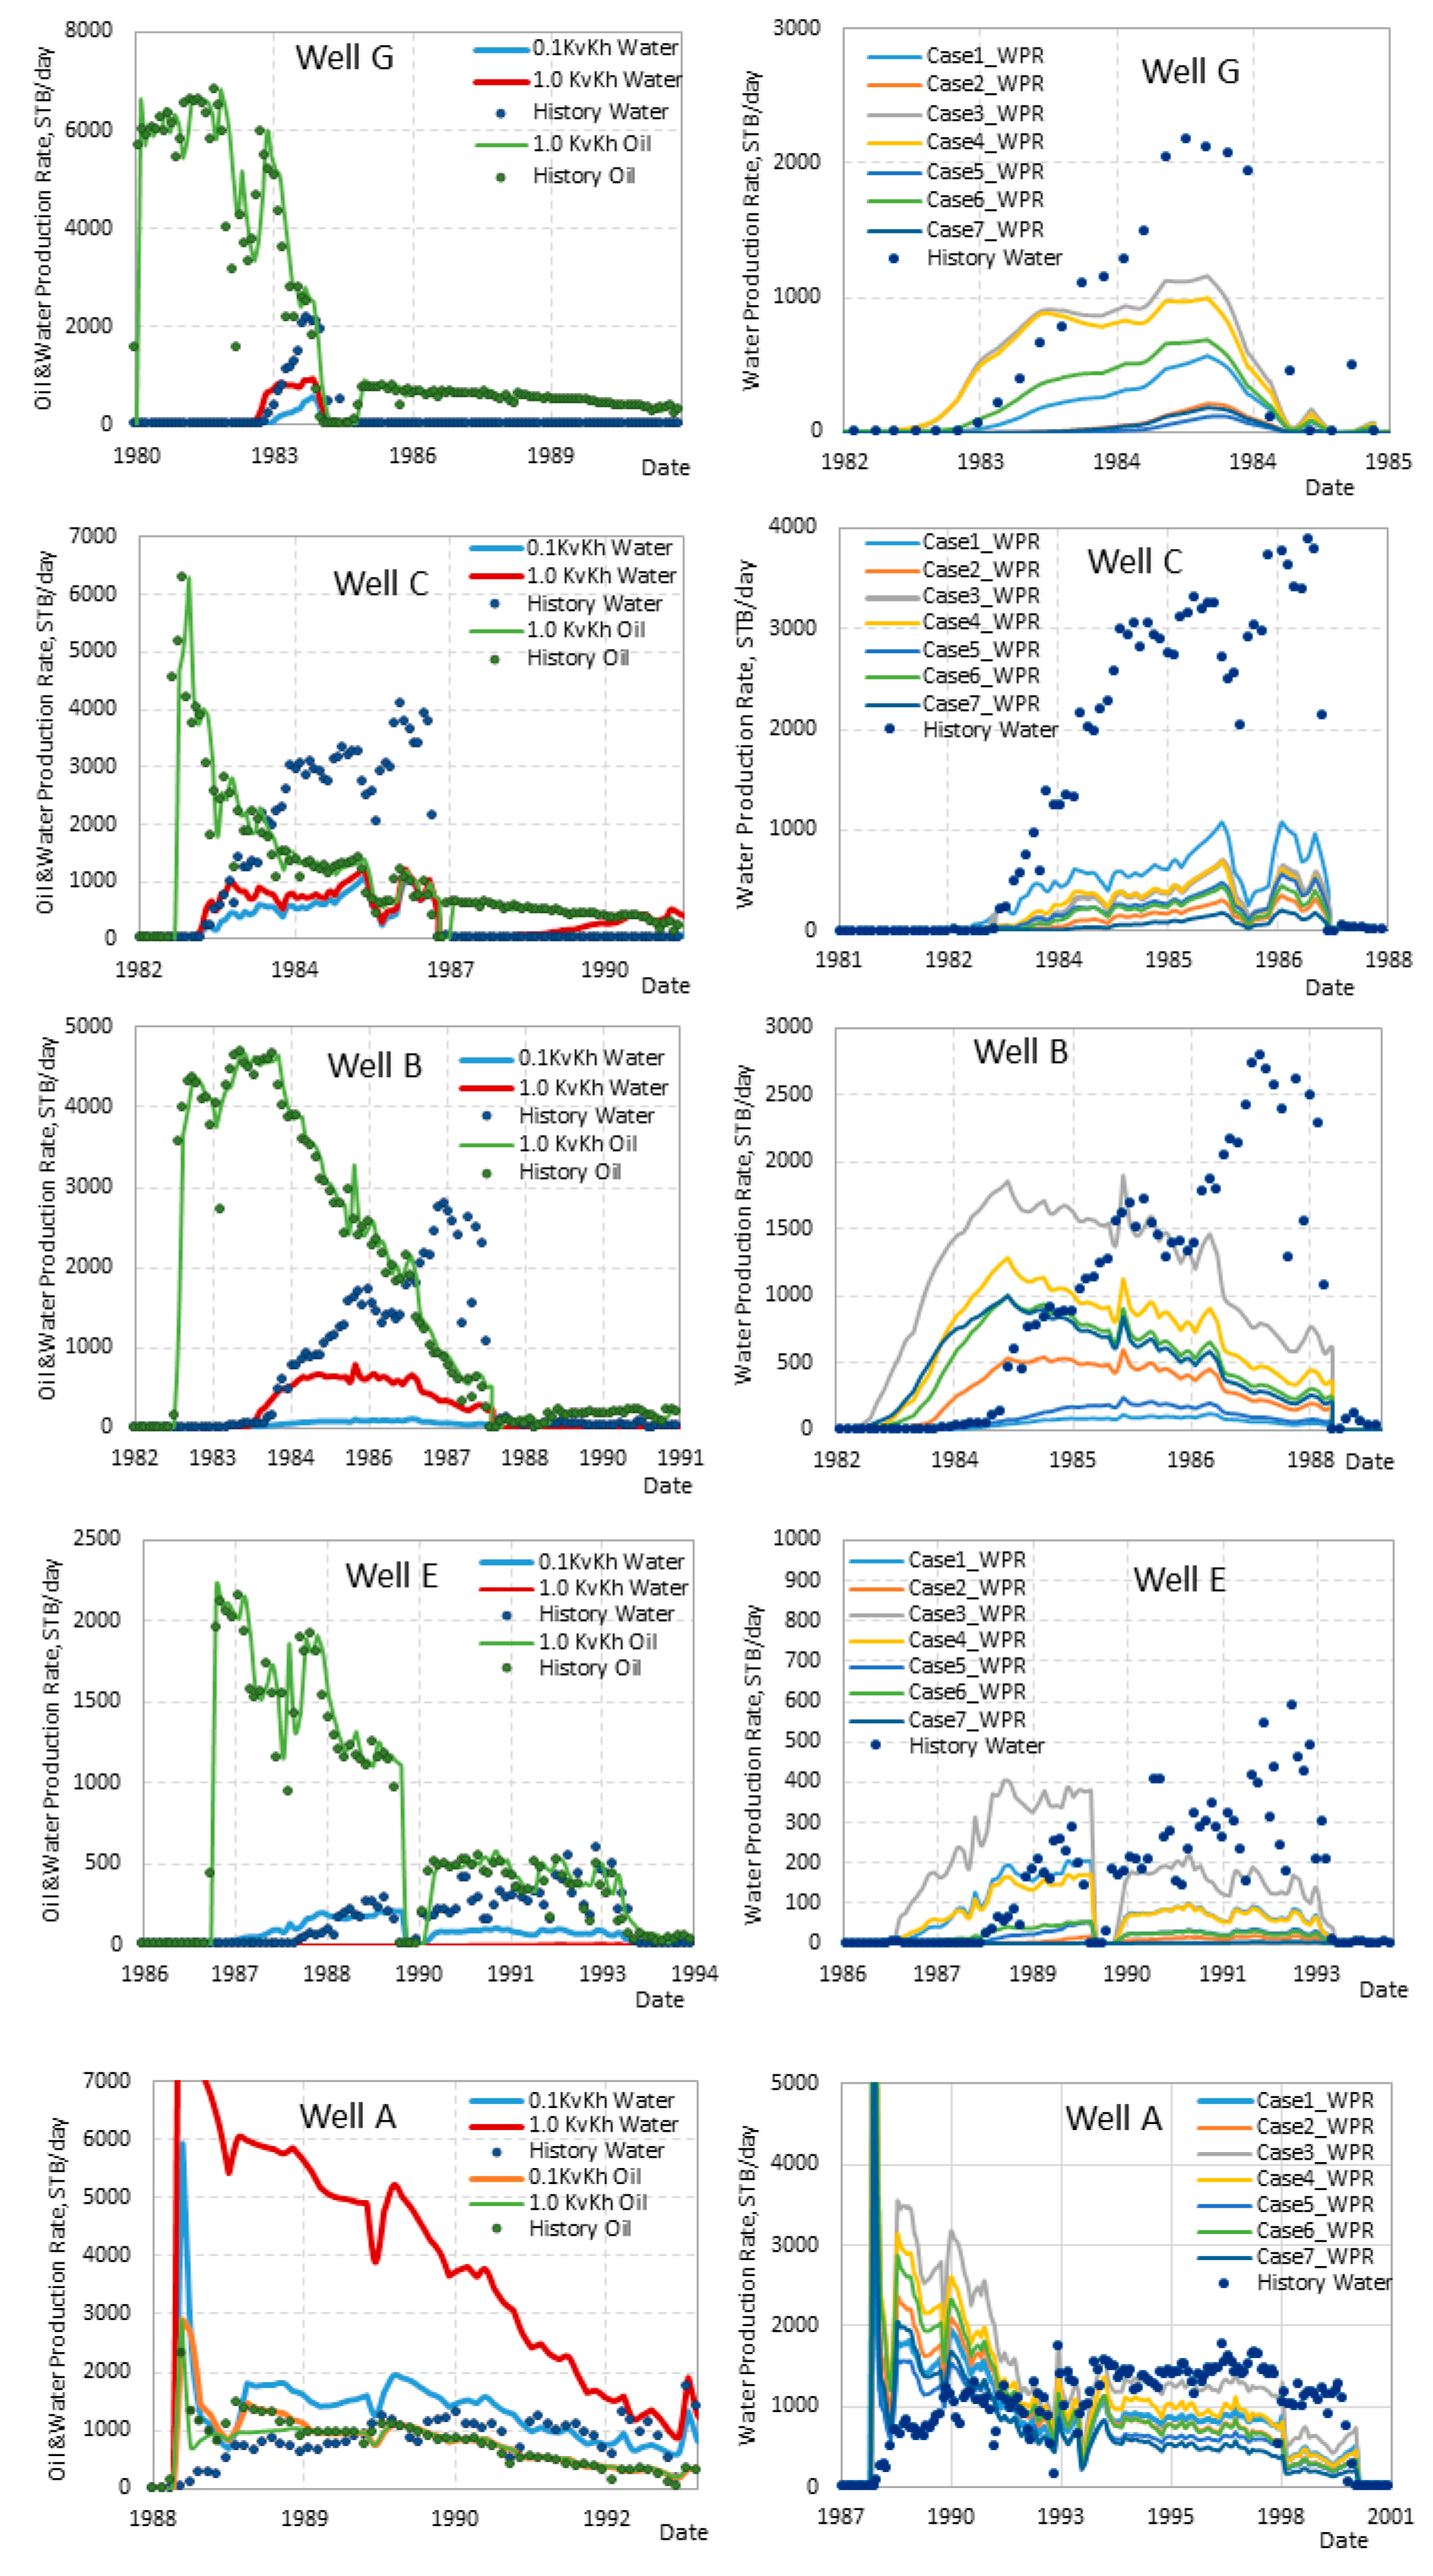
In the Base-case simulation, the ratio of Kv/Kh=1/10 was used by default in the history match of OPR and WPR. Several Kv/Kh ratios were attempted in our simulations such as 1/100, 1/1, 2/3, 10/1 and 20/1 for the comparison with the Base-case. For some wells, slight differences between the results were observed for cases with 1/1 and 2/3, but the simulation appeared to be insensible to higher ratios when Kv/Kh of 10/1 were compared to 20/1. In addition, there was no difference between the results of 1/10 and 1/100. Therefore, the results for cases with 1/10 and 1/1 only are compared for wells G, C, B, E and A in the first column of
Fig.8.
Well-D was perforated in the LHS only—in the lower porous part of the LHS-UD and the upper part of LHS-LD (
Fig.6)—and no water breakthrough was also observed in the well. Kv/Kh=1/1 predicts WPR close to zero, which better matches the actual WPR below 20 STB/d, while 1/10 predicts higher WPR.
Well-G was perforated in LHS-UD and LHS-LD but the production has also occurred from Gharif Basal Sandstone. In this well, the water breakthrough occurred beginning-1983 to the end of 1985 with a maximum of 2200 STB/d. The Kv/Kh=1/1 predicted WPR of about 900 STB/d on average but one month earlier than on the actual date. Kv/Kh=1/10 predicted significantly lower WPR but matches more accurately the start of the water breakthrough. The end of the water breakthrough was predicted by 1/1 and 1/10 on the same date which fits the actual date.
In Well-C, WPR predicted by 1/1 is twice higher than by 1/10 during the first year of production. In the following three years, the WPR for the case with 1/10 gradually increased to the same WPR of 1000 STB/d on average became similar to the WPR of the 1/1 case between 1986 and 1987. The actual WPR between 1983 and 1987 was higher, varying between 3000 and 4000 STB/d. The commingled production started on the same date from LHS and Basal Gharif, which indicates that the water could be from Basal Gharif.
In Well-B, the comingled production started from LHS and DD in 1982. The water breakthrough started at the end of June 1983, reaching a maximum of 2700 STB/day at the end of 1987. WPR of 650 STB/d on average was predicted using 1/1, while WPR below 100 STB/d was predicted using 1/10.
In Well-E, the WPR was below 300 STB/day which is much lower than in wells C and B.
From 1986 to 1993, Kv/Kh=1/10 predicted the beginning of water inflow 3 months earlier, close to the WPR in 1988-1990, but about two times higher than in 1990-1994. Similar to Well-D, 1/1 predicted WPR near zero, which can indicate that the water inflow was actually lateral.
In Well-A, WPR predicted by Kv/Kh=1/10 is higher by 500 STB/day than the actual 1000 STB/day on average. The match provided by 1/10 indicates that the water inflow was in the lateral direction. 1/1 predicts an enormously high WPR, which illustrates how big can be the effect of Kv/Kh. This scenario is not unrealistic because Well-A is located at the edge of the structure. Unfortunately, logging data is absent for this well to compare the petrophysical properties with those from other wells.
Thus, in wells G, C and B, Kv/Kh=1/1 provides a better match with the actual WPR because of higher WPR than predicted using 1/10 while 1/1 predicts a better match in Well-G, because of lower WPR. Kv/Kh=1/1 indicates the water inflow in both the lateral and the vertical directions.
1/10, which indicates lateral direction, was a better predictor for wells E and A because WPR predicted by 1/1 was too low in Well-E and too high in Well-A. Comparison of actual WPR with the simulated WPR using two Kv/Kh ratios of 1/10 and 1/1 can help in evaluating whether the water inflow is vertical or lateral.
For all the Kv/Kh scenarios, higher WPR was predicated at the beginning and lower at the end of assumed water breakthrough periods. However, WPR increases while OPR decreases often linearly, e.g. in Well-B, during 4-5 years. Such consistent decline in OPR and increase in WPR can be rather attributed to the depletion of the reservoir than water breakthroughs due to borehole poor integrity, even if they took place. Moreover, the repairs of the borehole cementing carried out later during the many years of production often did not lead to the reduction in WPR.
It can be assumed that water intervened in the porous intervals of LHS due to good hydrodynamic conductivity of the reservoir in all directions leading to earlier waterflooding than expected. The vertical water inflow may show that the mostly wet underlying Al Khlata formation or overlying Upper Haushi reservoirs are hydro-dynamically connected with the LHS reservoir.
A bottom and edge water Carter-Tracy aquifer for the Lower Haushi was implemented in the model previously and showed that influx can be attributed to the aquifers from the north and west [
16]. However, the volumes of water produced from the Lower Haushi wells are much higher and could not be justified from a material balance standpoint using any of the attempted models.
Although a full match of WPR was not obtained, the substantially higher WPR is predicted using Kv/Kh=1. Unfortunately, the model appeared to be insensitive to higher Kv/Kh.
For comparison, primarily to facilitate the pressure match in the simulation, the previous investigators reduced Kv globally in all the reservoirs by a factor of 0.01 [
16].
4.9. Influence of relative permeability on water production
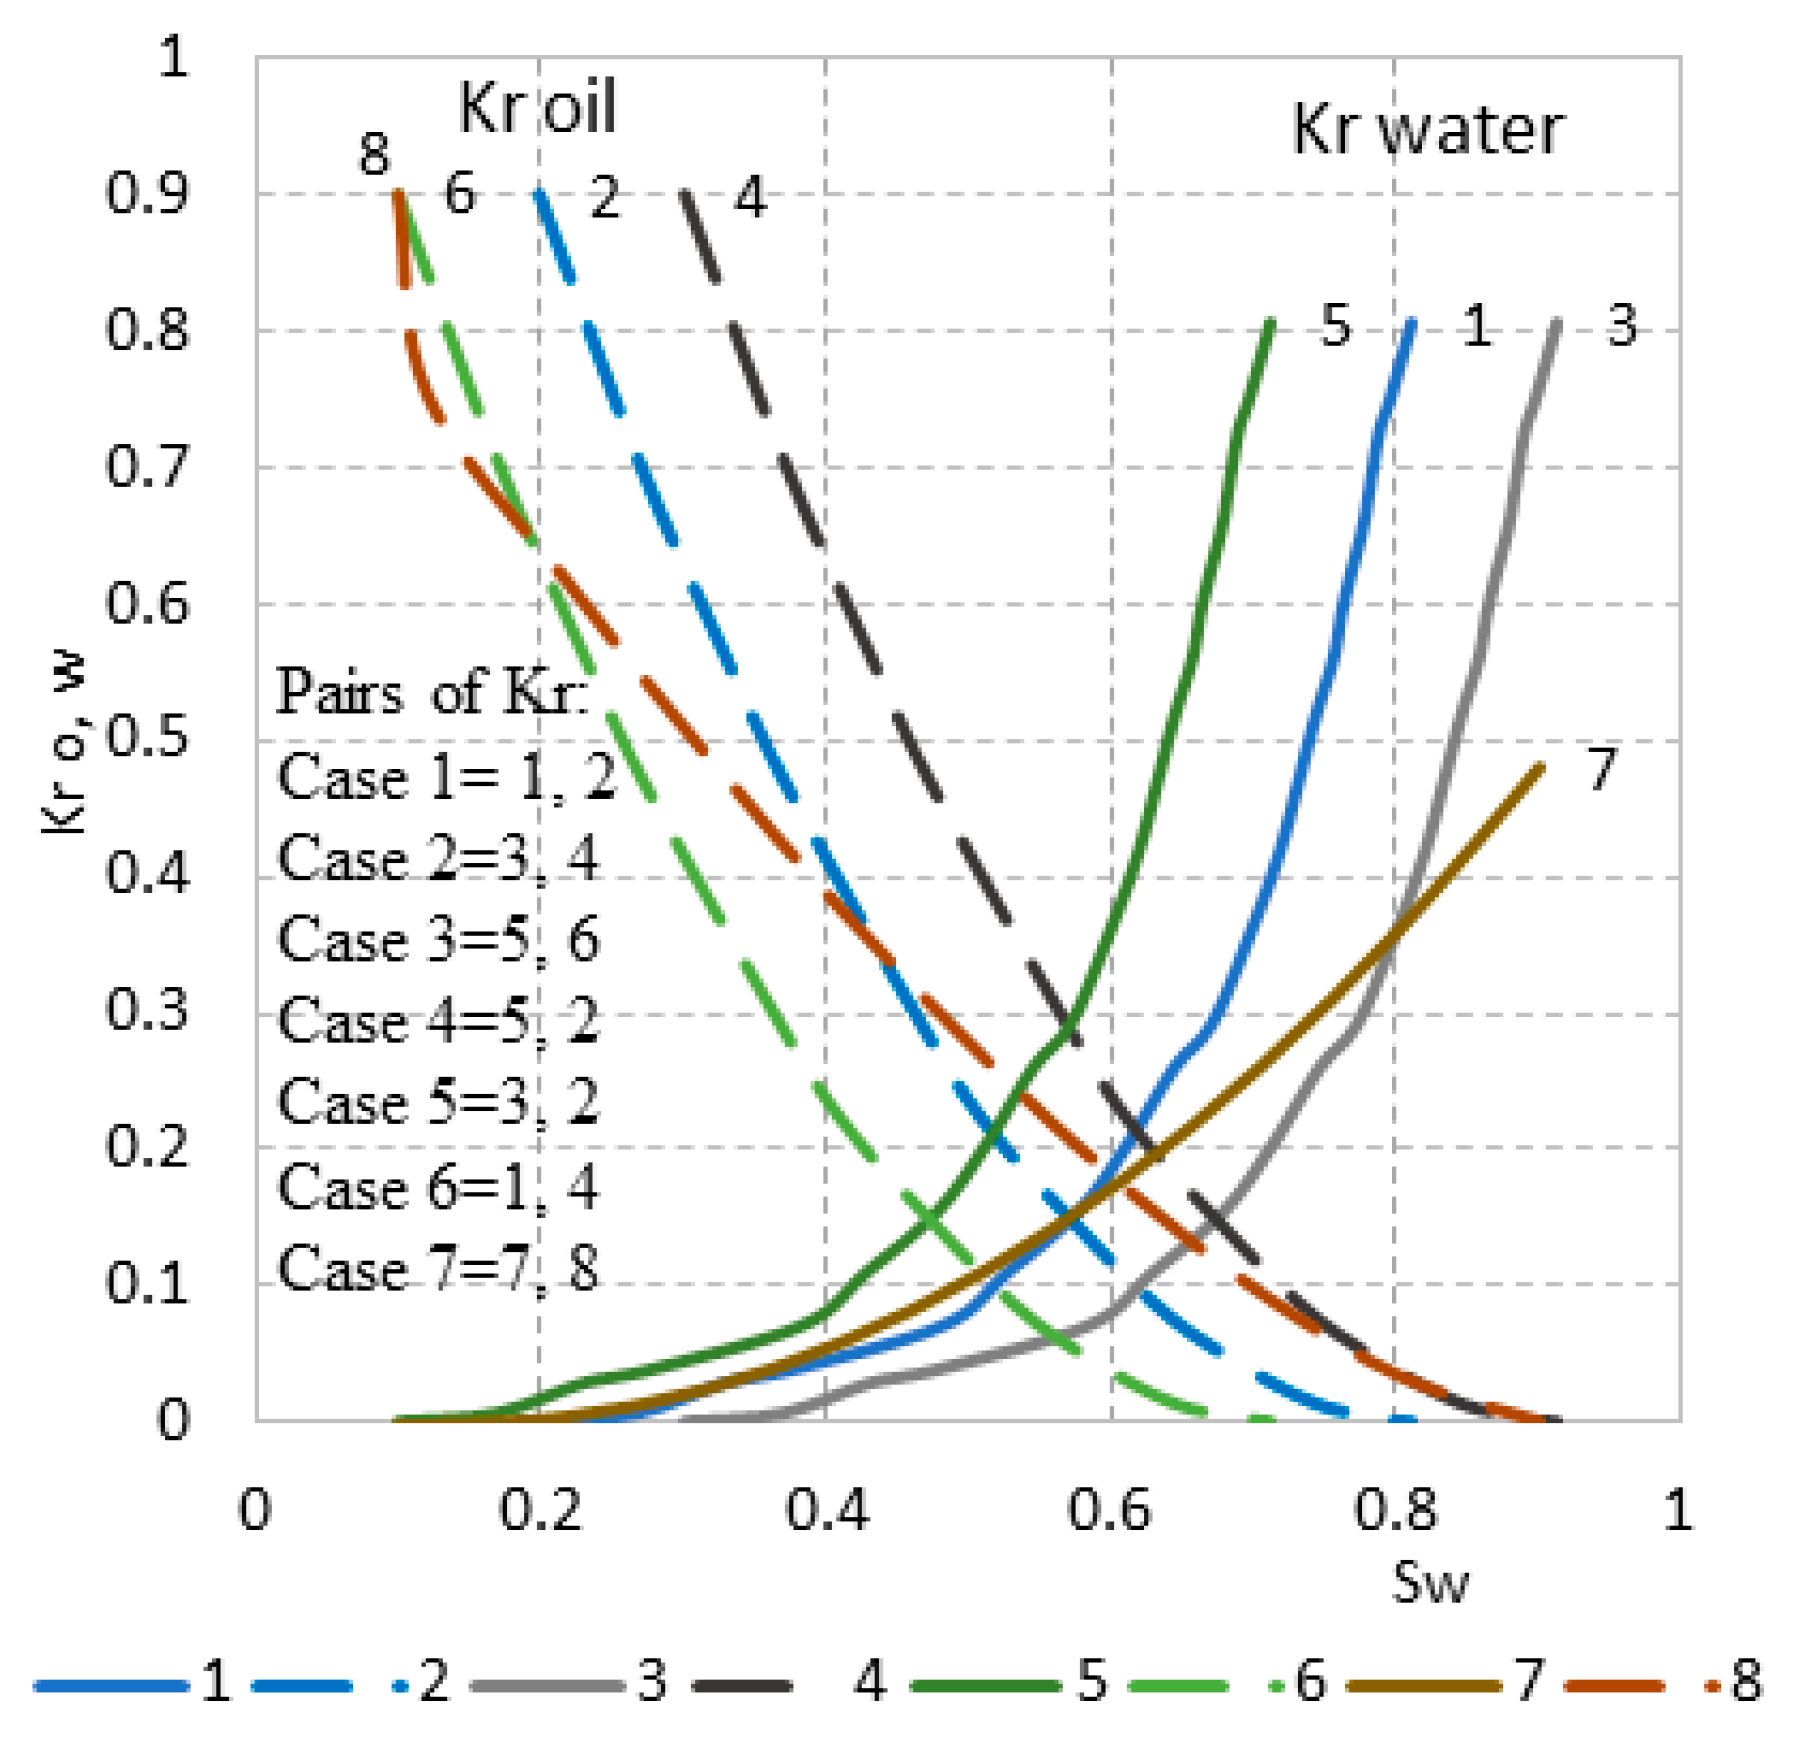
Wettability can significantly influence oil recovery. The position of relative permeability curves on the plot of water saturation indicates wettability: lower Sw – oil-wet, higher Sw – water-wet. Reliable relative permeability data to be used in the simulation were not available for LHS reservoir. For the simulations of OPR and WPR shown in
Fig. 8, a pair of relative permeability curves called Case 1 (Base case) was used with Kv/Kh=0.1 (
Fig.9). To test the sensitivity of the simulation results to the changes in relative permeabilities, six additional pairs of curves were generated. The curves were shifted relative to the curves of base Case 1 as follows: Case 2 - shifting both curves to the right, Case 3 -shifting both curves to the left, Case 4 -shifting Krw only to the left, Case 5 - shifting Krw only to the right, Case 6 -shifting Kro only to the right, Case 7 - modifying the curvature by changing the curvature and reducing the Krw max (
Fig.9). In the result, the following pairs of Kr with the specific crossing points were used to build the cases: Case 1 with Sw=0.58 for (1, 2); Case 2 with Sw=0.68 for (3, 4); Case 3 with Sw=0.48 for (5, 6); Case 4 with Sw=0.51 for (5, 2); Case 5 with Sw=0.63 for (3, 2); Case 6 with Sw=0.61 for (1, 4); Case 7 with Sw=0.6 for (7, 8). Crossing points and intervals of Sw are shown in
Table 2. Thus, of all these cases, Case 3 indicates the most oil-wet and Case 2 most water-wet conditions while Case 7 covers the widest Sw range.
Changes in WPR due to variations in relative permeabilities were investigated using simulation, as shown in
Fig.8 in the second column to the right.
In Well-D, no increase in water production was predicted using any of the pairs, which corresponds to the actual negligible WPR in this well.
The most oil-wet scenario, Case 3, with the lowest Sw intersection of 0.48, predicted the highest WPR in all wells excluding Well-C.
Except for the modified Case 7, crossing Sw increases in the following order of cases: 3, 4, 1, 6, 5, and 2. However, WPR does not strictly follow the same order. In all wells, the highest WPR indeed decreases in the following order of cases: 3, 4, and 6. The lowest WPR was predicted by Cases 2, 5, and 7 distributed in random order from well to well. WPR predicted by Case 1 varies randomly in a broad range predicting the maximum WPR in Well-C and a minimum in Well-B.
With the decrease in Sw, the start of water breakthroughs shifted to much earlier dates which did not correspond to the start of water breakthroughs in wells G, B, and E.
The shape of the simulated WPR curves fitted the shape of the actual WPR in wells G and C although the prediction in WPR was substantially lower. In wells B, E and A, the prediction of WPR was higher in the first part of the considered period and lower in the second part, while it was the opposite for the actual WPR.
Case 3 most closely predicts high WPR in the second period starting from 1992 in Well-A and between 1985-1986 in Well-B. Case 1 predicted a better match for wells E and A during the 2-5 years from the start of production. Because the decrease in crossing Sw results in the shift of water breakthrough to earlier dates than actual, the simulation was carried out using the relative permeability curves of Case 1, which predicts the start of water breakthroughs correctly.
4.10. Petrophysical property modeling
Reservoir modeling begins with the classification and zonation of the reservoir, structural construction and petrophysical models, followed by a 3D static model and mapping of porosity, permeability and water saturation [
34,35].
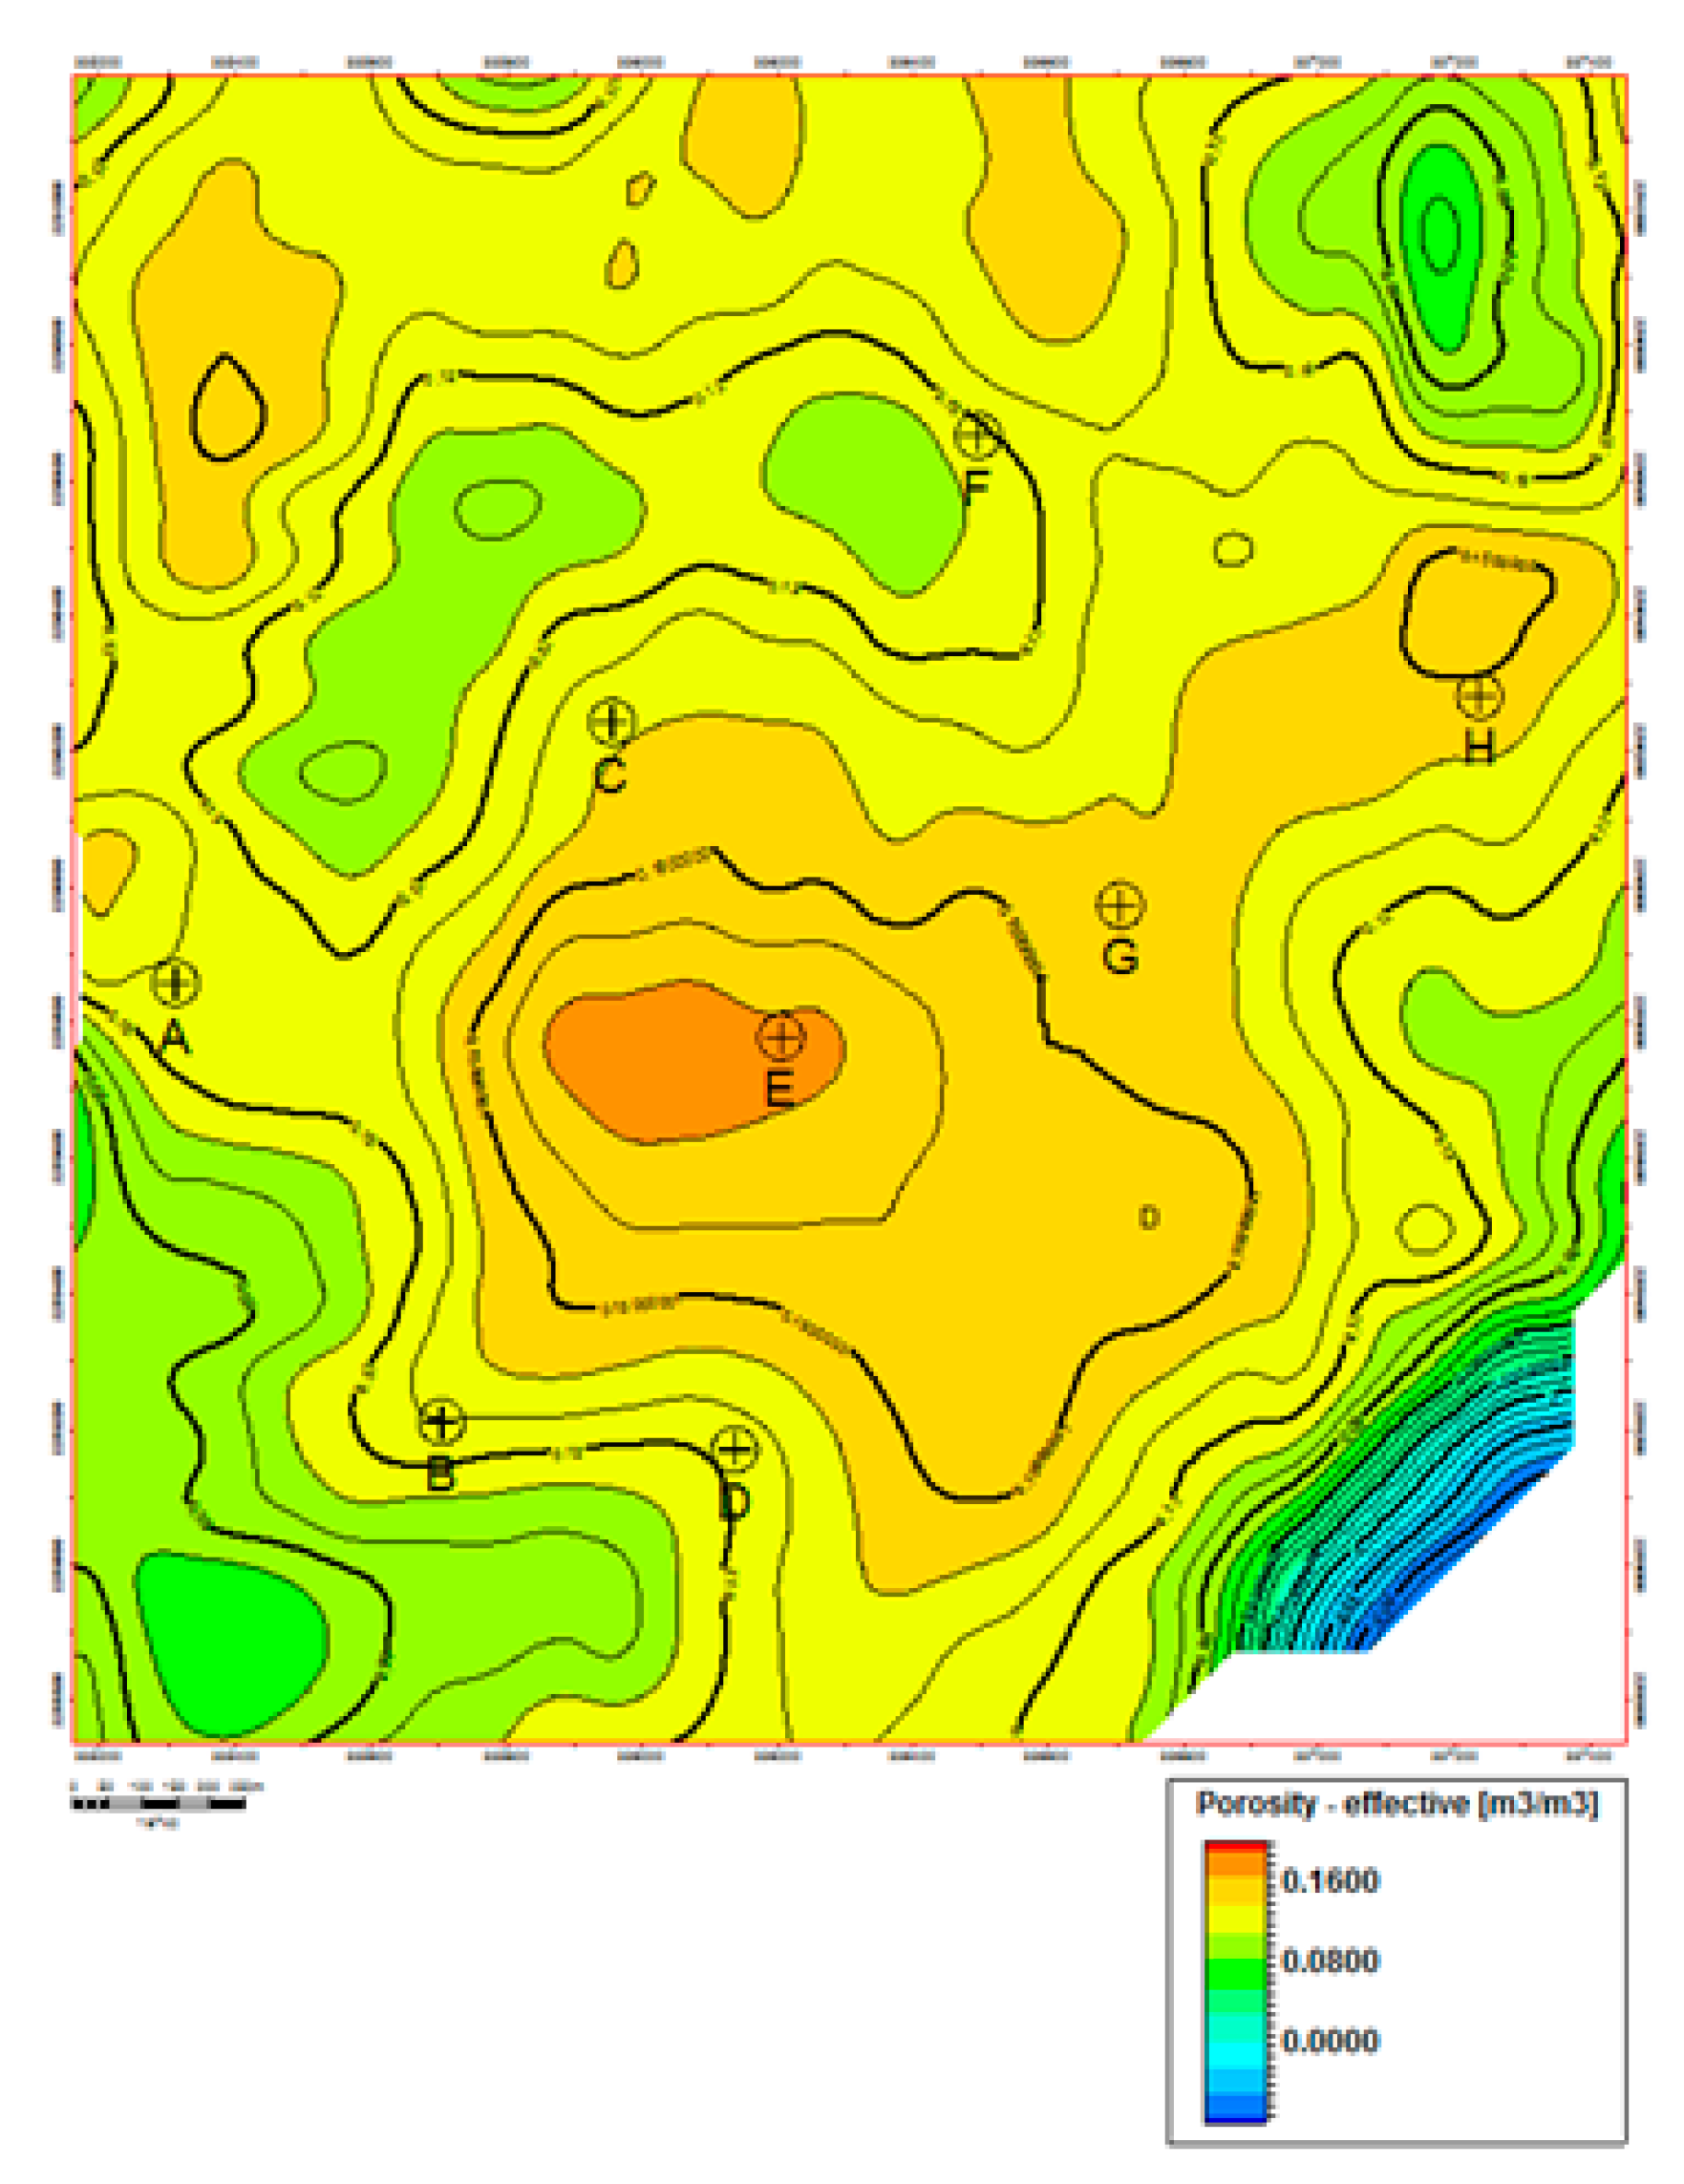
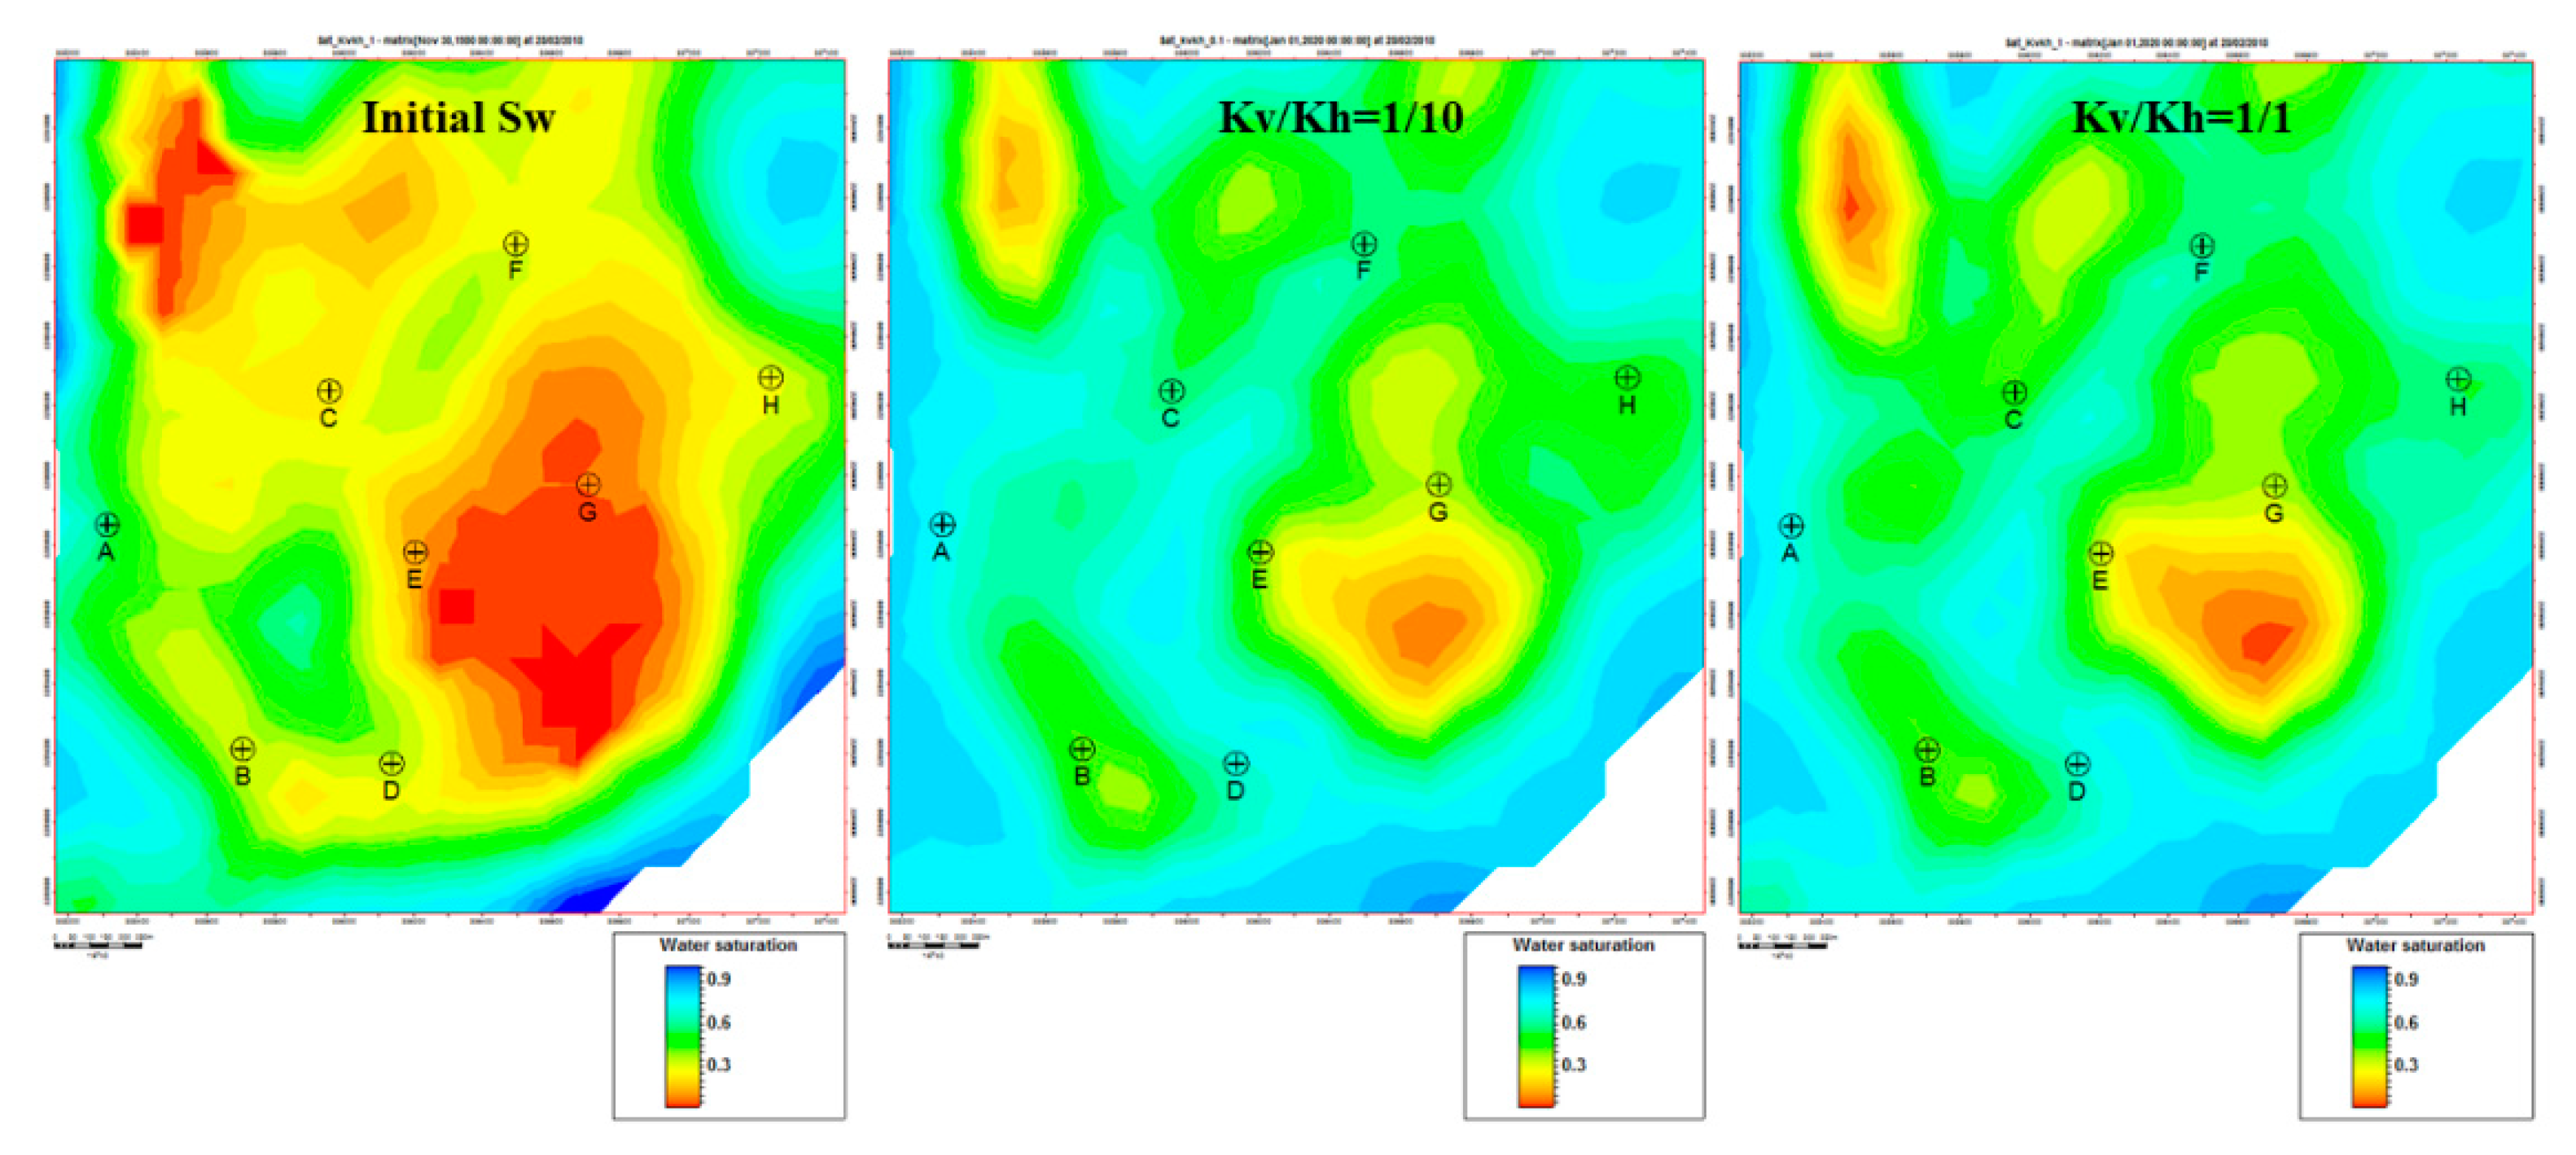
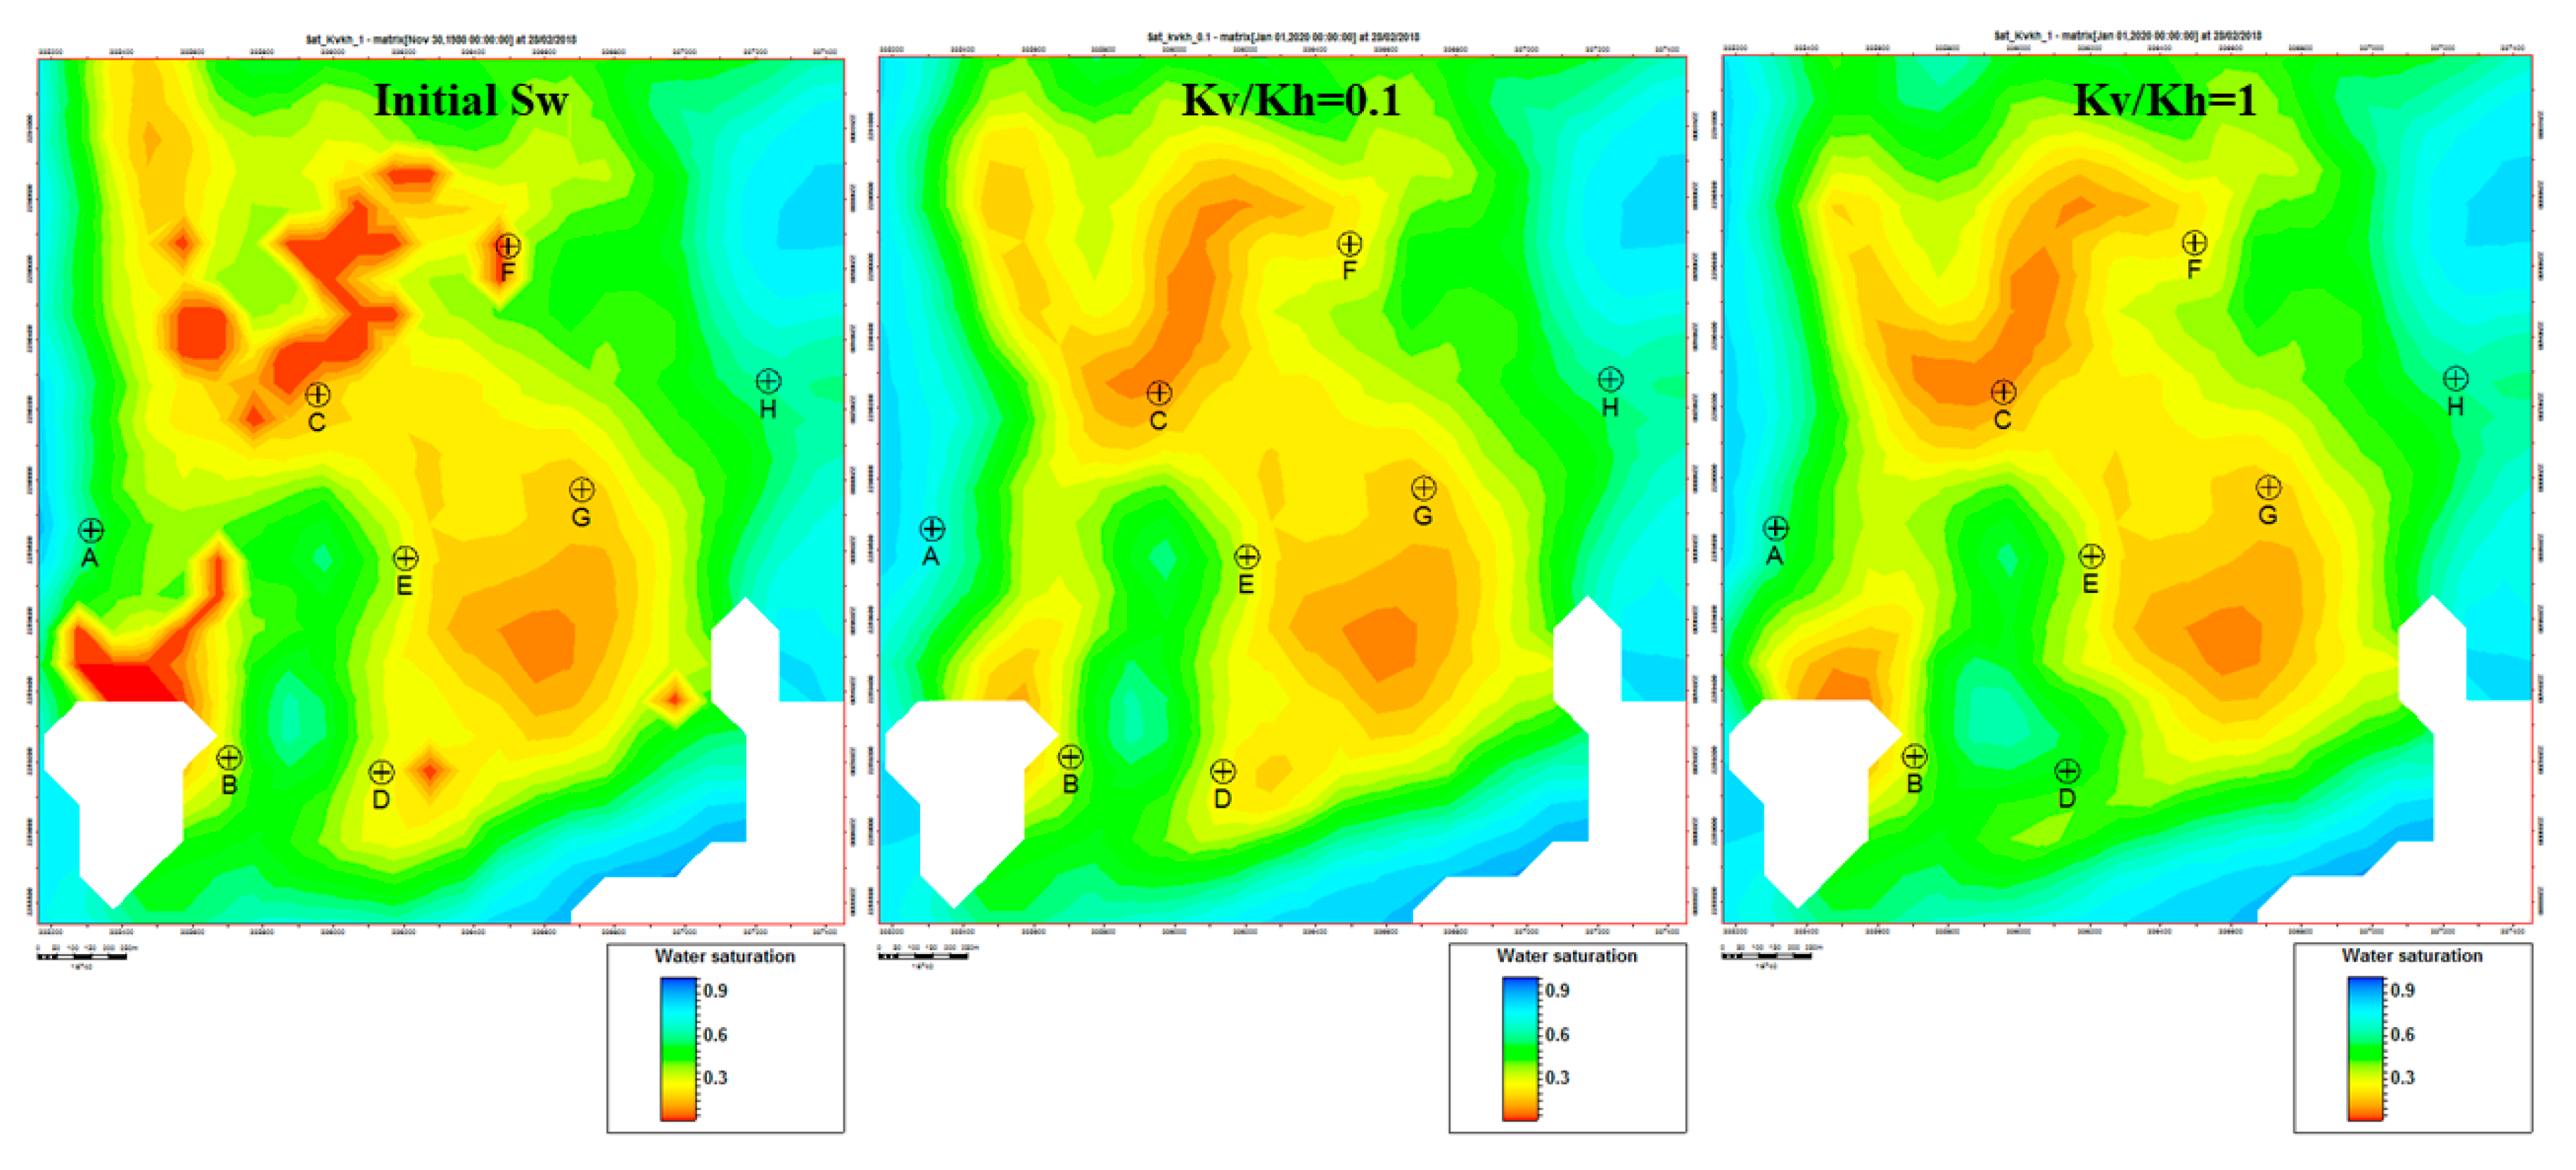
The initial high oil saturation and fast water breakthrough imply that some oil was bypassed and remained unrecovered in LHS. Property modeling using reservoir simulation was employed to build models of porosity, and water saturation at the start and the end of production using Kv/Kh=0.1 and Kv/Kh=1 for comparison (
Fig.10,
Fig.11 and
Fig.12).
The highest porosity is related to the dome in the vicinity of Well-E. Wells G and H also fall into the area with high porosity of above 16% (
Fig.10). Other wells with lower porosity in LHS surround this dome.
In LHS-UD, the highest initial oil saturation was to the NW of wells C and F, and between A and B (
Fig.11). In these areas, the oil saturation decreased after production but the oil still remained. Although the difference was insignificant, Kv/Kh=1 indicates a larger area of the remaining oil.
Another area with high initial oil saturation is the SE of wells E and G. With both Kv/Kh of 0.1 and 1, these areas remained unrecovered. The area around Well-D with Kv/Kh =1 was more depleted compared to Kv/Kh =0.1.
In LHS-LD, the highest initial oil saturation was also in the dome close to the E and G wells with even higher oil saturation to the south where the wells were not drilled (
Fig.12). Another undrilled area of high oil saturation is to the NW of F, C, and A wells. After years of production, this reservoir is almost fully depleted. Oil was recovered in wells A, D, C and F. The drainage areas around wells B, E, G and H were significantly reduced. However, oil remains at the top of the dome to the SE of well E and G in the undrilled part. When the ratio of Kv/Kh was equal to 1, there was an increase in oil saturation not only in the dome area but also towards the northwest of well C, as compared to when the Kv/Kh ratio was 0.1.
Therefore, two areas remained unswept in the LHS reservoir due to the absence of wells: to the NW of wells C and F and the SE of wells E and G.
5. Conclusions
1. LHS oil reservoir is divided into two parts by a shale layer. The upper part (LHS-UD) is tight across almost the entire thickness, and the lower part (LHS-UD) is of good porosity.
2. Low resistivity is caused by the high salinity of the formation water in combination with the well-connected porous system of the homogeneous sandstone, which is characterized by a cementation factor of 1.6, Kv/Kh=1, and the presence of fissures indicating that such porous system can be electrically conductive. In contrast, the Dolomite Drain oil reservoir above the LHS with a different porous system demonstrates high resistivity.
3. Increase in Kv/Kh from 0.1 used by default in simulation to 1 increased the WPR many times over in wells G and B over all periods of water breakthroughs, and about two times higher in Well-C during the first 2 years. The high water influx can be attributed to the faster than expected water encroachment due to the high hydrodynamic connectivity in all directions leading to the fast depletion of the reservoir.
4. The depletion of the reservoir is confirmed by the two areas remaining unswept in the LHS reservoir due to the absence of wells: to the NW of wells C and F and the SE of wells E and G. With Kv/Kh, the areal size and the oil saturation in the potentially unswept areas are larger. The remaining oil in the tight upper part of LHS-UD requires unconventional methods of oil extraction.
Figure 1.
Kv vs. Kh/Phi obtained using core data of four wells of Lower Haushi sandstone (LHS) reservoir. The resulting mean function is described by equation Kv=0.05·Kh1.2.
Figure 1.
Kv vs. Kh/Phi obtained using core data of four wells of Lower Haushi sandstone (LHS) reservoir. The resulting mean function is described by equation Kv=0.05·Kh1.2.
Figure 2.
Data of Well G measured in horizontal (h) and vertical (v) directions: a) porosity (Phi); b) ratio Kv/Phi_v vs. ratio Kh/Phi_h.
Figure 2.
Data of Well G measured in horizontal (h) and vertical (v) directions: a) porosity (Phi); b) ratio Kv/Phi_v vs. ratio Kh/Phi_h.
Figure 3.
Permeability anisotropy (Kv/Kh) derived from core data from four wells of LHS.
Figure 3.
Permeability anisotropy (Kv/Kh) derived from core data from four wells of LHS.
Figure 4.
Pickett plots for: a) well G; b) well E. Rw- resistivity of formation water, m- cementation factor, n – saturation exponent.
Figure 4.
Pickett plots for: a) well G; b) well E. Rw- resistivity of formation water, m- cementation factor, n – saturation exponent.
Figure 5.
Logging data profiles of well G and E: Gamma Ray Log (GR), porosity determined using density log and water saturation. Juhasz plot shows the distribution of different clay types at respective depths in different colors in the LHS reservoir..
Figure 5.
Logging data profiles of well G and E: Gamma Ray Log (GR), porosity determined using density log and water saturation. Juhasz plot shows the distribution of different clay types at respective depths in different colors in the LHS reservoir..
Figure 6.
Well logging profile of 6 wells: Gamma-Ray (GR), Resistivity logs, Porosity, Water saturation and perforation intervals. Well E was drilled 7 years later than well G, which explains the appearance of water at the base of LHS-LD as a result of OWC rise. Well H is shown for correlation purpose only, as it did not produce from LHS.
Figure 7.
Gamma-Ray (GR), Resistivity logs (ILD, LLS), Porosity (PHI) calculated using EPT (TPL), Neutron (NPHI) and Density (PHIT) logs, water saturation (Sw) calculated using Archie and Simandoux equations, and perforations in well E of LHS reservoir.
Figure 7.
Gamma-Ray (GR), Resistivity logs (ILD, LLS), Porosity (PHI) calculated using EPT (TPL), Neutron (NPHI) and Density (PHIT) logs, water saturation (Sw) calculated using Archie and Simandoux equations, and perforations in well E of LHS reservoir.
Figure 8.
First column: actual oil (OPR) and water (WPR) productions designated as History and simulated ones using Kv/Kh of 1/10 and 1/10. Second column: actual (History Water) and simulated water production using different pairs of relative permeabilites curves that are plotted for different cases as shown in
Fig. 9.
Figure 9.
Relative permeability curves (Kr) for water and oil used to build various simulation cases.
Figure 9.
Relative permeability curves (Kr) for water and oil used to build various simulation cases.
Figure 10.
Petrophysical model of porosity of LHS reservoir.
Figure 10.
Petrophysical model of porosity of LHS reservoir.
Figure 11.
Petrophysical models of water saturation of porous LHS-LD reservoir: before the start of production (a); and at the end of production with b) Kv/Kh=0.1 and c) Kv/Kh=1. Red, orange and yellow colours indicate the areas of remaining oil.
Figure 11.
Petrophysical models of water saturation of porous LHS-LD reservoir: before the start of production (a); and at the end of production with b) Kv/Kh=0.1 and c) Kv/Kh=1. Red, orange and yellow colours indicate the areas of remaining oil.
Figure 12.
Petrophysical models of water saturation of porous LHS-UD reservoir: before the start of production (a) and at the end of production with b) Kv/Kh=0.1 and c) Kv/Kh=1. Red, orange and yellow colours indicate the areas of remaining oil.
Figure 12.
Petrophysical models of water saturation of porous LHS-UD reservoir: before the start of production (a) and at the end of production with b) Kv/Kh=0.1 and c) Kv/Kh=1. Red, orange and yellow colours indicate the areas of remaining oil.
Table 1.
Comingled production from Upper Haushi and Lower Haushi reservoirs.
Table 1.
Comingled production from Upper Haushi and Lower Haushi reservoirs.
| Well-Name |
Production
start date |
Commingled
production |
Reservoir |
| Well-G |
11/1/1980 |
Lower Haushi
Dolomite Drain
Gharif Basal |
LHS
UHS-DD
UHS-GB |
| Well-D |
11/1/1980 |
Lower Haushi |
LHS |
| Well-C |
9/1/1982 |
Lower Haushi
Gharif Basal |
LHS
UHS-GB |
| Well-B |
10/1/1982 |
Lower Haushi
Dolomite Drain |
LHS
UHS-DD |
| Well-E |
3/1/1987 |
Lower Haushi
Dolomite Drain |
LHS
UHS-DD |
| Well-A |
3/1/1988 |
Lower Haushi
Upper Haushi
Dolomite Drain |
LHS
UHS
UHS-DD |
Table 2.
Relative permeability curves shown in
Fig.8 and their parameters used for the simulation.
Table 2.
Relative permeability curves shown in
Fig.8 and their parameters used for the simulation.
| Case N |
Kr Oil |
Kr Water |
Crossing |
Sw min |
Sw max |
| 1 |
2 |
1 |
0.58 |
0.3 |
0.8 |
| 2 |
4 |
3 |
0.68 |
0.37 |
0.8 |
| 3 |
6 |
5 |
0.48 |
0.2 |
0.7 |
| 4 |
2 |
5 |
0.51 |
0.2 |
0.8 |
| 5 |
2 |
3 |
0.63 |
0.37 |
0.8 |
| 6 |
4 |
1 |
0.61 |
0.25 |
0.9 |
| 7 |
8 |
7 |
0.6 |
0.2 |
0.9 |
