
Submitted:
30 April 2024
Posted:
01 May 2024
You are already at the latest version
Abstract
Abstract: Petrol is considered the most common fire accelerant. However, the identification and classification of petrol sources through the years has been proven to be a challenging field in the investigation of fire debris analysis. This research explored the possibility of identifying petrol sources by high field NMR methods accompanied by ML (Machine Learning). The automated identification and classification of petrol brands were achieved for first time based on the ML clas-sification model developed in this research. A hierarchical classification model was constructed using local classifiers to categorize neat or weathered petrol into its sources.
Keywords:
Machine Learning
; petrol
; fire investigation
; NMR
; MATLAB
1. Introduction
Fire investigation is considered one of the most challenging forensic science disciplines. Current gas chromatographic and spectroscopic analytical methods in fire investigation cannot discriminate or individualize petrol sources based on class compounds within the petrol samples from the fire scene that are an indication of the country of origin, refinery (source), natural weathering/age and or fire exposure. As petrol is considered one of the most commonly Petroleum Products (PP) used as an Ignitable Liquids (IL) in fire investigation, it was a primary concern of this study [1]. The characterization and identification of petrol samples is a crucial challenge in the scientific investigation of fire as the current reference data relating to petrol does not highlight the broad range of petrol composition [2]. Identifying individual compounds in the petrol contributes to understanding complex petrol chemical composition and its additive and blending agents as the refineries do not reveal the exact composition of their petrol. Those compounds have not been previously identified due to their volatility and trace amounts in the petrol mixture. Gas Chromatography (GC)-Mass Spectroscopy (MS) analysis of ILs using chemometric analysis for comparison of unevaporated, evaporated and “on substrate” petrol samples from stations across the UK displayed very similar chromatographic patterns regardless of petrol grade or type, hence discrimination by grade, type or brand could be very challenging [3]. The author used Principal Component Analysis (PCA) analysis to target C2-C4 alkyl benzenes; the PCA achieved grouping of petrol brands based on their grade (premium and regular). Hierarchical Cluster Analysis (HCA) was applied to the data and no substantial clustering based on petrol type or brand was revealed. However, the HCA dendrogram demonstrated a linkage of the samples according to their degree of evaporation [3].
A method based on Gas Chromatography (GC)-Flame Ionization Detector (FID) analysis combined with an ANN (artificial neural networks) algorithm was explored for discrimination of petrol brands from five petrol stations in Spain based on the entire chromatogram [2]. It was concluded that despite there not being significant variations in the chromatogram, mathematically the different petrol samples were classified according to their brand. The author suggested that the potential difference that contributed to the discrimination was the content of oxygenates and hydrocarbons groups such as aromatics and olefins. In that experiment, native petrol samples were only considered for identification purposes and no identification of specific compounds was made [2].
Research by Monfreda and Gregori [4] offered promising results where unevaporated samples from different petrol sources were correctly grouped based on aromatic compounds. In addition, Barrett, et al. [5] used Direct Analysis Real Time-Mass Spectroscopy (DART-MS) combined with Partial Least Squares -Discriminant Analysis (PLS-DA) model to classify petrol sources on different substrates; however, the petrol samples were grouped to already identified class rather than unknown class.
Even though many spectroscopic and chromatography techniques are considered, it can be concluded that the identity of the source of ILs recovered from a fire scene is still a challenging and ongoing research area. Therefore, there is a need for individualizing and classification of petrol sources to enhance evidential value.
Nuclear Magnetic Resonance (NMR) is a spectroscopic method that studies the nuclei of atoms within a molecule and their chemical environment. NMR spectroscopy is sufficient to completely determine the structure of an unknown molecule and to differentiate between isomers or related compounds which can be difficult using GC-MS. Various NMR pulse sequences allow complex spectra to be dissected by focusing on individual small spectral regions and extracting the spectra of those coupled spin systems that have a resonance within that region, even when their spectra are severely overlapped. Therefore, NMR spectroscopy has capabilities to extract the sub-spectra of an individual component without prior separation from highly complex spectra [6].
A simple 1H NMR method has been proven to be successful in the determination of the petrol composition and some individual compounds with rapid and accurate analysis. Further investigation of NMR applications in the petroleum industry displayed the capabilities of 1H NMR coupled with PCA, k-NN (k-Nearest Neighbors), HCA and SIMCA (Soft Independent Modeling of Glass Analogy) proved to be a useful tool for categorizing of petrol samples with adulteration (solvents), fuel additives and blends, petroleum mixtures (kerosene and diesel mixtures) and petrol samples with different octane numbers [7,8,9,10,11].The primary application of high field NMR spectroscopy in the petroleum industry was based on quality control of hydrocarbon classes in a sample rather than individual compounds of the overly crowded complex spectra. 1H NMR methods coupled with clustering and multivariate classification techniques were used for the successful identification of adulteration between two types of samples. The potential of NMR spectroscopy for structural elucidation of petrol components in a sample is established.
Considering the application of NMR in various scientific fields, forensic NMR is still in the early stages of development with a particular focus on chemical compositions of single compounds. A 1H NMR method has been combined with statistical analysis to identify the chemical ‘‘fingerprint’’ of cocaine samples and to link cocaine samples based on this information. It was concluded that the NMR method could establish a link between seized samples obtained at different locations or in possession of different individuals. The relative ratios of the minor components in coca leaf are closely associated with plant varietal, cultivar and agronomic differences that can be exploited for the assignment of geographical origin, at least when suitable authentic databases are available [12]. One of the disadvantages of 1H NMR is that it is generally used for nonselective analysis compared to the MS selectivity. Peak overlaps from multiple detected compounds pose major challenges in the complex 1H NMR spectrum of petrol. Therefore, band-selective sequences including selective (sel) TOCSY and pure shift that use tailored pulses which narrow the excitation bandwidth to the region of interest in a signal measurement to obtain information for a single spin system are recommended.
Machine learning has been proven to be beneficial in forensic science in its various fields such as public safety, image and video analysis, image recognition, gunshot detection, firearms identification, 3D crime scene reconstruction, huge digital data analysis, building statistical evidence, handwriting identification, time since death estimation, dental age estimation and personal identification through dental findings [13], sex determination of skeletal remains, 3D facial reconstruction from unidentified skull, cybercrimes and digital evidence detection [14], bloodstain pattern analysis [15] and pattern recognition which involves pattern evidences such as bite marks, lip prints, bullet marks, tool marks, shoe prints and fingerprint comparison and identification with more accuracy and ultimately higher speeds than human experts [16,17].
The objective of this work, using high-field (600 Hz) NMR spectroscopy, was to uniquely individualize and discriminate aliquot petrol sources based on: 1) source (origin of the crude oil 2) refinery processes and procedures (blending agents) and 3) brand (additive package). Within forensic science, the identification and classification of petrol sources could help police forces in the investigation of various fuel offenses, including arson, motor vehicle incidents, environment spillage, fuel smuggling and petrol bomb related incidents. Therefore, the objective of the study also included individualization and discrimination of weathered (evaporated) and Ignitable Liquid Residue (ILR) samples (fire debris residues) to consider the petrol sample collected at a fire scene. This study develops an automated classification model to individualize and classify an unknown native and fire debris petrol sample based on class characteristics of a source by using machine learning.
An automated hierarchical model for classification using local classifiers for each leaf used for predication of petrol sources is described in these paper and experimental results and limitation of this model are discussed. The key contributions of this paper are: 1) developing an automated classification model that can successfully classify petrol sources; 2) providing machine learning and statistical analysis results to support the opinion-based decision making when identifying petrol samples in fire debris analysis, 3) creating a new dataset of different petrol sources from UK and Ireland.
2. Materials and Methods
The main steps of this study methodology included NMR analysis of petrol, data acquisition; data pre-processing; feature selection; design, training, optimization, and evaluation of the classification model.
2.1. Materials
This study used 58 petrol samples that represented British Petroleum (Mainland (M) and Scotland(S)), Jet, Esso, Texaco, and Shell sources across petrol stations in UK and Ireland. To address the issues associated with evaporation and matrix interferences, the experimental protocol was followed to analyze 1) evaporated petrol samples (per laboratory protocol described below) and 2) simulated fire debris petrol samples burnt to 50% of the original weight. For each petrol brand collected, a set of three evaporated samples was generated. In a dry bath at approximately 25°C (room temperature), 10 mL of neat petrol samples from various petrol sources in triplicates were pipetted into 15 ml plastic tubes and placed under a nitrogen stream until approximately evaporation percentages were 25%, 50%, 75% and 90% corresponding to volume reductions of 2.5 mL, 5.0 mL, 7.5 mL, and 9.0 mL, respectively. The samples were prepared for analysis by diluting in non-deuterated cyclohexane. Finally, petrol sources (2ml) were burnt up to 50% their original weight on their own and on a substrate (flooring material, carpets, fabrics, and paper materials) and subsequently extracted by immersing the substrate with cyclohexane. To impartially compare the NMR method for the discrimination of neat, weathered and burnt petrol samples to the current laboratory method used Automated Thermal Desorption (ATD)-Gas Chromatography-Mass Spectroscopy (GCMS) (in house developed method used by Eurofins Forensic Services) to analyze ILs and their residues for interpretation of volatile compounds and ignitable liquids, a set of neat, evaporated, burnt and fire debris samples was created. Different petrol samples were prepared by an independent laboratory examiner/analyst; the samples prepared included different brands of neat petrol samples, weathered petrol samples, and burnt petrol samples of different substrates The neat and extracted weathered petrol samples were deposited into a glass vial and sealed. The corresponding burnt on substrates samples were collected and packed into a control nylon bag (Table 1).
2.2. Data Acquisition
The data in this paper was acquired by using a Bruker high field 600 MHz NMR spectrometer with a 5mm broadband inverse diameter probe. The Icon NMR software was used to set the NMR experiments and control acquiring the data. The NMR experiment was a simple single pulse sequence (zg30 from the Bruker library) for 1) neat petrol, and 2) a second data set was acquired in cyclohexane with a solvent suppression pulse sequence (NOESY) for evaporated (due to limited volume) and burnt petrol samples. A pulse sequence program (seldigpzs from the Bruker library) was used for the acquisition of 1H sel (selective) TOCSY. Data was collected with 64k points as the size of the free induction decay (fid) a spectral width of 20.0ppm, a mixing time of 0.06sec, an acquisition time of 2.7 sec, a pre-scan delay of 6.5 sec and a minimum of 16 scans for neat petrol samples. The acquisition parameters are based on the default pulse sequences in the Bruker library. The 1H selTOCSY was performed on the following bands of chemical shift: 4.65ppm-4.72ppm (olefin set 1), 4.73ppm-4.85ppm (olefin set 2), 4.95ppm-5.10ppm (olefin set 3) and 5.10ppm5.35ppm (olefin set 4). The couplings are resolved and provide assignment of the chemical species. The four discriminative sets of olefins were identified as 3-methyl-1-butene by irradiating the signal at 4.64ppm-4.72ppm, a mixture of 3-methyl-1-butene and 1-pentene by irradiating the signal at 4.73ppm-4.85ppm, 2-methyl-2-butene by irradiating the signal at 4.95ppm-5.10ppm and a mixture of cis and trans-2-pentene by irradiating the signal at 5.10ppm-5.35ppm.For the double-blind study, the exhibits analyzed using headspace-ATD-GC-MS using a Tenax TA sorbent sampling tube. 1ml headspace was taken from within the packaging after a period of incubation at circa 100℃. Interpretation of results was based on pattern recognition and comparing chromatography obtained from evidential items with the standards references. Where possible, comparison against a reference of the relevant liquid was preferable, but if not possible, the sample was compared to the laboratory reference database or published literature.
2.3. Data Pre-Treatment and Pre-Processing
The 1H NMR spectrum of petrol is a complex mixture consisting of multiple detectable and overlapping peaks. The position, intensity, and spectra width of the peaks of interest significantly impact on the quality of the NMR spectrum and its subsequent interpretation. The acquired 1H NMR and 1H TOCSY data were processed with Mestre Nova (version 10.1.0 LITE-SE) software, where different processing parameters were applied to achieve the most efficient data set. Processing included 1) chemical referencing, 2) phasing, 3) baseline correction, 4) sub-spectral selection and filtering 5) normalization and 6) binning (Figure 1).
To achieve optimal and robust chemical shift referencing, an internal reference was applied to the single protonated peak at 7.05 ppm of the benzene ring using Bruker Topspin software version 3.6.5. The single protonated peak of the benzene ring was chosen due to its single peak representation, its location (end of the aromatic region) and its clear resolution from other signals of interest. Phase correction was performed in Mestre Nova software. Auto phasing was selected which consisted of performing a zero-order phase correction on the whole spectrum by selection of the PH0 algorithm in the processing parameters of the software. Thereafter, all NMR spectra were manually inspected for any phase distortions. There were several baseline correction algorithms in the Mestre Nova software available from which to select. The most frequently recommended automated baseline algorithm is the Bernstein polynomial fit, where the baseline is extracted using the polynomial curve [18]. For this experiment, the automatic baseline correction function in Mestre Nova which applies a Berstein polynomial fit algorithm to the frequency domain of the NMR data was selected. Drift correction was used to remove a baseline offset of the spectrum resulting from a non-zero integral for the fid and zero-frequency spikes in the spectrum. The Mestre Nova software applied this automatically, by default, using the common procedure of averaging the last 5% of the points in the fid and subtracting these from the rest of the fid.
Subsequently, the 1H NMR and 1H TOCSY data was binned with a 0.01ppm bin size using Mestre Nova software for every petrol sample and the binned data was saved as CSV comma (*.csv) files. However, not all the variables in the binned data were relevant for discrimination. Visual inspection of the 1H NMR and 1H TOCSY spectra showed ranges of the spectrum that did not contain any information, which was considered as background noise that had to be filtered out of the binned data. The chemical shift ranges of the spectrum that did not contain any spectral information, i.e. the presence of no couplings, were 2.70ppm-3.10ppm, 3.50ppm-3.90ppm, 4.20ppm-4.50ppm and 5.70ppm—6.50ppm. The position of the relevant couplings in the binned data was significant for the investigation of the variables; for that reason, the spectral free regions of the data were not omitted or deleted but conditioned, so they were not considered for the classification model. To filter out the data noise and spectra-free regions, if the numerical value of the bin was <1, the value in the bin was transformed to be equivalent to the numerical value of 0, else the binned data was the actual value.
The normalization process includes rescaling and/or transforming the raw data in such a way that each attribute is a uniform contribution [19]. Normalizing techniques set data values in a range of 0-1. The main advantages of applying normalization to the raw data are overcoming outliners and controlling data attributes [20]. The total area sum normalization consists of normalizing the intensity of each individual spectral bin to the total intensity of each spectrum. This type of normalization procedure is performed automatically in the MetaboAnalyst version 5.0 web platform or by applying a Log function in MS Excel. Single peak normalization is performed when each data point is divided by the amplitude of a specific peak of interest. Usually, the intensity of the internal standard peak is used as it is consistent for all samples. However, if an internal standard is not added to the sample mixture, a peak within the sample can be used for single peak normalization. This peak is usually the highest intensity peak in each sample. There are limitations of the single peak normalization method when there is no internal standard present; there is a possibility of skewing the relative abundance among samples because the abundance of the selected peak may not exhibit the same intensity in all samples [21]. Therefore, total area sum normalization process was applied to the NMR data.
2.4. Feature Selection
The datasets underwent unsupervised machine learning by applying PCA and supervised analysis by applying PLS-DA in MetaboAnalyst. PCA was chosen as the explorative tool of the pre-processed data to display any natural groupings. The score plots were a visual representation of the clustering between groups. A loading plot displays how strongly each characteristic influences a principal component. Therefore, PLS-DA was then used for classification and feature selection of the variables, using cross-validation to select an optimal number of components for classification. The bins that contained important variable information for classification were identified by PLS-DA in Variation Importance Projection (VIP) score The VIP score is a measure of a variable’s importance in the PLS-DA model [22]. It summarizes the contribution a variable makes to the model. The VIP score of a variable is calculated as a weighted sum of the squared correlations between the PLS-DA components and the original variable. Statistical analysis was performed exploiting the real-time interactive web-based application MetaboAnalyst. Firstly, the non-targeting approach, considering all the spectral information, was explored for classification purposes, then the targeting approach where the four sets of olefins was evaluated for achieving better clustering. Using the dataset from the 1H selTOCSY spectral data, which edited out many NMR peaks by filtering out all signals that do not have a component of their spin system in selective excitation.
2.5. Classification Model
The study used for the first-time machine learning techniques to automatically individualize and classify petrol sources from native, evaporated and fire debris samples. They were implemented in MATLAB (R2019b) using the Classification Learner app. The evaluation of the model was performed over selected datasets which were essential in experimental modelling developments.
The classification model research design is outlined as follow:
Step 1- data collection: The datasets evaluated in this research were as follow: 1) entire 1H NMR spectrum of neat petrol samples; 2) 1H selTOCSY spectrum of the four olefins of neat petrol samples; 3) 1H selTOCSY spectrum of the four olefins of neat and evaporated petrol samples; 4)1H selTOCSY spectrum of the four olefins of neat, evaporated and fire debris residue samples.
The datasets were divided into i) training data, comprising non-targeting (contained all the NMR spectrum information) and targeting (1H selTOCSY spectrum that consisted of selected features that were recognized as an important feature for discrimination purposes) datasets and ii) blind study testing dataset (for the practical validation of the model to a real-world dataset). The training and testing datasets are used to determine the best classifier model for classification of petrol brands based on the NMR spectrum.
Step 2- reduction of data dimensionality by selecting only a subset of measured features (predictor variables) to create a cluster model through PCA or for feature selection function (using the featured chemical bins from the PLS-DA VIP scores). The PCA function is enabled with component reduction criteria of 80% explained variance as it represents sufficient information variance; typically, the first few PCs correspond to cumulative eigenvalues accounting for 80% or above of the variation within the data set and are sufficient to describe or explain most of the variability in the given dataset thus reducing the dimensionality [3]. For optimal results, the study aims to choose a classifier model with a minimum of 60% accuracy (validation).
Step 3- dataset optimization: the effect of the pre-processed parameters on the classification training model for discrimination of petrol samples was tested. Two different parameter pre-processing methods were investigated in this study: filtering of the redundant spectral bins and the normalization parameter. Data filtering was applied to set any spectral bin value less than 1 to 0. For normalization, the dataset was (i) single peak normalized (to the highest peak of the spectrum) and (ii) normalized with the total area sum normalization (LOG function).
Step 4- dataset splitting: datasets are split into training and testing datasets using the cross-validation function with K-folds. The cross-validation method with 5 and 10 folds was investigated.
Step 5- evaluating different classifier models such as Decision Trees, Discriminant Analysis (DA), Support Vector Machines (SVM), Logistic Regression, k- Nearest Neighbour (k-NN), Naïve Bayes, Ensembles, and Artificial Neural Networks (ANN).
Step 6- after training multiple models, their performance is compared, and then the most robust and effective classification model was chosen. The Classification Learner app displayed the results of the validated model. Performance measures, such as model accuracy, and visual representation plots such as the confusion matrix chart, reflect the validated model results. The confusion matrix table displayed six petrol brands as true classes in rows and predicted classes in column.
The goal of the classification model method was to investigate different datasets of native, evaporated and fire debris petrol samples with different pre-treatment techniques including data filtering and normalization to identify the most desirable classifier which provides the highest classification accuracy.
3. Results
3.1. NMR Results
The typical 1H NMR spectrum of the petrol samples contained signals in the chemical shift region of 0 ppm to 8ppm (Figure 2). The 1H NMR profiling of various chemical shift (∂) regions clearly showed that each petrol source had a diagnostic “fingerprint” with specific chemical markers that could be potentially used for identification, classification and ultimately linking unknown sample to its source. The primary region of interest in the 1H NMR spectrum was the area that represented the additives and blending agents added to the base petrol like olefins and oxygenates produced during the refinery procedure with chemical shifts (∂) of 4.00ppm-6.00ppm (Figure 2).
3.2. Classification of Neat Petrol Classes
The first stage of the classification experiment aimed to discriminate the classification of neat petrol samples by their brand (source/origin). Different classifier models such as Decision Trees, Discriminant Analysis (DA), Support Vector Machines (SVM), Logistic Regression, k-Nearest Neighbour (k-NN), Naïve Bayes and Ensemble techniques were used. The accuracy of the best performing models is summarized in Table 1, when training and testing were done with 5- and 10-fold cross-validation. The classification model of the entire 1H NMR spectral dataset of neat petrol samples filtered and normalized by total area sum displayed an advantage over the non-filtered single peak normalized dataset, successfully classifying BP S and Texaco. The lower accuracy for BP M, Jet, Esso, and Shell could be explained by the overall chemical similarities in the whole spectra; as previously stated, the potential discriminative features were the four olefinic compounds/mixtures. Therefore, when feature selection was applied using the spectral bins representing specific couplings, BP S, BP M, Texaco, and Jet were successfully classified previously. In addition, the high intensity of the aliphatic and aromatic region of the 1H NMR spectra could suppress the low-intensity olefin components, which contributed to the model’s low accuracy when using no feature selection. No significant difference was observed when evaluating the dataset with 10 folds.
The classification model of the olefin datasets did not achieve sufficient accuracy on classification of all petrol brands, except the BP S and Texaco, classified using the feature selection technique. This could be simply explained by the alkene couplings being spread across the chemical shift ranges of the 4.0ppm-6.0ppm (allylic carbons) and 1.6ppm-2.6ppm (aliphatic carbons) rather than couplings only in the 4.0ppm-6.0ppm olefin region. Comparing the individual olefins and the combination of all four sets of olefins for raining of the classification model revealed that the highest accuracy classification model for discrimination of native petrol samples based on their brands was using the combination of the four featured olefins. In conclusion, comparing the individual olefins and the combination of all four sets of olefins for the classification model revealed that the highest accuracy classification model for discrimination of neat petrol samples based on their brands was using the combination of the four featured olefins. The Ensemble Classifier applied to the filtered and normalized by total area sum data with 10-fold cross-validation displayed the most satisfactory classification model that successfully classified all the petrol brands with an overall accuracy of 81% (Table 2).
3.3. Classification of Weathered Petrol Classes
The second stage of this research aims to build a classification model suitable for classifying weathered petrol samples according to brand. The evaluation of linking a sample that has undergone compositional changes (through weathering) back to its unevaporated source was investigated. To build the most robust classification model, different classification models were evaluated: 1) the dataset of 2-methyl-2-butene and the mixture of cis and trans-2-pentene of the neat petrol samples, 2) the evaporated petrol samples dataset, and 3) the combined dataset of neat and evaporated petrol samples.
It was concluded that based on the above evaluated classification models, it is not possible to compare the native and the weathered petrol samples directly. Table 3 summarizes the classification models of the neat, the evaporated, and the combined neat and evaporated and the combined evaporated, burnt and substrate samples datasets.
3.3. Classification Model for Native, Evaporated and Burnt Petrol Sources.
Firstly, the identification of the petrol samples status: native (unevaporated) or weathered (evaporated and fire debris) needed to be determined. The evaluation of the blind dataset of native petrol brands showed that the combination of all four olefins classification model predicted correctly 80% of the petrol brands. On the other hand, it was identified that the combination of the 2-methyl-2-butene and the mixture of cis and trans-2-pentene classification model was not successful in discriminating native petrol brands. The combined native and evaporated displayed an accuracy of 44.4% on the blind weathered dataset. The evaporated and the weathered classification model displayed an accuracy rate of 33%. The multi-classifier classification models for evaporated and weathered samples were not satisfactory when evaluated on the blind sets of samples. Therefore, evaluation of a binary classifier between a single sources of petrol vs the rest of the petrol brands was needed. The binary models were created based on the 1H selTOCSY discriminative potential of the minor compounds; the identification of the four sets of olefins displayed the minor differences in the NMR spectra, which could contribute to the distinction of the petrol samples from different sources. The BP M and Jet displayed similar NMR spectra fingerprints compared to the other petrol brands based on 2-methyl-2-butene and the mixture of cis and trans-2-pentene. In addition, Texaco and Shell share similar NMR profiles, however, the 1H selTOCSY of the 2-methyl-2-butene and the mixture of cis and trans-2-pentene potentially assisted with distinguishing those two brands from the rest of the petrol sources. For the weathered dataset, the combination of evaporated petrol samples (25% and 50% of sample weight), burnt petrol on their own and burnt petrol on substrates (cardboard) was used for the training. Due to the limitation of the results of the multi-class classification models, a hierarchical classification model was created to build a more robust classification model.
For this study, the hierarchically structured local classifiers model was constructed. Local classifiers were used per each parent node. The first parent node was a binary classification model between the types of a petrol sample: Native vs weathered petrol sample, which produced two child nodes. The binary Classifier predicted the source of petrol sample based on its evaporation (weathered) status using a Linear Discriminant Classifier. Each child node had its local Classifier. If the sample was predicted as native petrol, a multi-class classification model was applied to individualize the native petrol sample based on its sources. The Ensemble Classifier used the combination of four olefins compounds to create the multi-class classification model. The classification model for the weathered samples was more complex than the classification model for the native petrol samples due to the complications in the recovered spectra and background interferences from the substrate. The weathered samples contained the recovered 2-methyl-2-butene and the mixture of cis and trans-2-pentene. Therefore, for the child node containing weathered samples, a local binary classifier was used for each level. For each level of the second child node, a local binary Classifier was used to identify if a sample belonged to a petrol source; if it did not belong to the first petrol source, the sample was input through the next level and classified. The first leaf-level of the binary classification model used the k-NN Classifier to determine if a petrol sample was BP M or other petrol sources. If the sample was not identified as the BP M source, the second leaf level used Logistic Regression Classifier to classify the samples as Jet vs other petrol sources. If a sample was not identified as BP M and Jet, the third leaf-level used Neural Network Classifier to identify the petrol sample as Esso vs other petrol sources. The last leaf level was a binary Classifier between Shell and Texaco using Neural Network Classifier (Figure 3).
3.4. Blind Study
The first blind dataset that represents native petrol samples was input into the classification model. All the samples were correctly identified as native petrol samples. Table 4 represents the multi-class classification model’s output for prediction of petrol sources. The Jet sample was misclassified as Esso petrol source; however, this can be explained by the low number of Jet petrol samples were available for building up the classification model. Esso and Shell displayed strong similarity in the 1H selTOCSY of the four sets of olefins, only minor compounds potentially contributing to the incorrect classification. Overall, the success rate of classifying the blind dataset of the native petrol samples was 80% compared to the currently used ATD-GC-MS method (30% classification) which uses target compounds and visual interpretation for comparison of ignitable liquids (Table 4). The second blind dataset, which contained a combination of evaporated petrol samples (25% and 50%), burnt petrol on their own petrol samples and burnt petrol on substrates (petrol samples extracted from cardboard substrate) was input into the model. The goal was to identify and link the petrol samples despite their evaporation status to their source (brand). Firstly, all blind samples were correctly identified as weathered through the binary model (native vs weathered). Then, the blind weathered dataset was input through the binary Classifiers for each leaf. The NMR classification model displayed overall accuracy of 78%, one of the Shell and one of the Texaco petrol samples misclassified compared to the ATD-GC-MS which is not suitable for identification and differentiation of petrol source (Table 5). The local classifier between Shell and Texaco had 60% success rate, which could contribute to the misclassification of the Shell petrol sample with Texaco petrol samples. In addition, both petrol brands displayed similar 1H selTOCSY profiles of the four sets of olefinic compounds. Esso petrol samples displayed similarities in the 1H selTOCSY profiles of the four sets of olefins compounds to the Shell and Texaco investigated.
In all cases, the native and weathered petrol samples were correctly classified into their respective class regardless of their evaporation and substrate interference status with more than 60% accuracy (Table 6). Those results demonstrated that the development of the hierarchical classification model objectively individualized and correctly discriminated petrol brands under one classification model despite their evaporated products or in the presence of interfering products from cardboard substrates.
The model performance was affected by the availability of the data (petrol samples used for training the classification model were in limited number). A higher number of samples strengthens the model and results in greater accuracy. To compensate for the lower numbers of data points, the cross-fold validation method was applied to the data to avoid overfitting. In addition, we explored different types of classifiers such as the Ensemble Classifier which combines weaker classifiers to build a more robust classification. Moreover, the limitations that come from the properties of the additives and their chemical alternation: the loss of the 3-methyl-1-butene and the mixture of and 3-methyl-1-butene and 1-pentene during weathering (evaporation and burning) impacted the classification model by complicating the like-for-like comparison of native and evaporated/weathered petrol samples.
4. Discussion and Conclusion
The NMR method combined with ML has been successfully applied for individualization and classification of petrol samples from different sources. The NMR spectroscopy method had not been previously evaluated for fire debris analysis. The use of a 1H sel TOCSY NMR spectroscopy is also a new approach for fire debris analysis to identify distinctive compounds, background interferences and their sources, and pyrolysis products in petrol source. In addition, the 1H selTOCSY method is innovative for structural elucidation of petrol samples. Our paper proves they can be used for identification of trace amount of specific compounds from the complex spectra of petrol previously unknown and combined with ML for classification purposes.
A hierarchal classification model based on a multi-class classifier for native petrol samples and a combination of binary classifiers for weathered petrol samples was constructed. The overall accuracy of the classification model was 80% for native petrol samples and 78% for weathered petrol samples, significantly outperforming the alternative method ATD-GC-MS currently used. The combination of the 1H combined with the NOESY NMR method and 1H selTOCSY displayed potential in individual identification of fire debris samples and linking them to a source or suspect. The model has the potential of identifying an unknown petrol sample and linking it to their source despite their evaporation rate (based on to 25% and 50% evaporated samples) and sample burned on cardboard substrate. In conclusion, an automated hierarchical classification model was created for the successful discrimination and individualizing of petrol samples based on their source using a machine learning classifier. This paper described for the first time a state of art ML model that has potential to be used for classification of petrol sources in fire debris.
Author Contributions
“Conceptualization, Yanita.Yankova, Michael Coleand Silvia Cirstea; methodology, Yanita.Yankova, John Warren and Silvia Cirstea.; validation, Yanita.Yankova.; formal analysis, Yanita.Yankova.; investigation,Yanita.Yankova.; writing—original draft preparation,Yanita.Yankova; writing—review and editing, Michael.Cole and Silvia Cirstea.; supervision, Michael.Cole,John Warren and Silvia Cirstea;” . All authors have read and agreed to the published version of the manuscript.
Funding
This research received no external funding.
Informed Consent Statement
Not applicable.
Data Availability Statement
Not applicable.
Acknowledgments
I would like to express my special appreciation to my family for their patience and encouragement through my journey. My extra special thanks to Arti, Bhavini and Bayram for always believing in me and giving me their emotional and moral support through the end. I am grateful for the financial support of this work by Eurofins Forensic Services.
Conflicts of Interest
The authors declare no conflict of interest.
References
- Bumbrah, S. Gurvinder, Sarin. K. Rajinder and Sharma M. Rakesh. Analysis of Petroleum Products in Fire Debris Residues by Gas Chromatography: A Literature review. Arab Journal of Forensic Sciences and Forensic Medicine 2017, 1(5), pp.512-534.
- Ugena, L., Moncayo, S., Manzoor, S., Rosales, D. and Cáceres, J. Identification and Discrimination of Brands of Fuels by Gas Chromatography and Neural Networks Algorithm in Forensic Research. Journal of Analytical Methods in Chemistry 2016, pp.1-7. [CrossRef]
- Desa, W. The Discrimination of Ignitable Liquids and Ignitable Liquid Residues using Chemometric Analysis. PhD, University of Strathclyde, UK,2012.
- Monfreda M, Gregori A. Differentiation of unevaporated gasoline samples according to their brands, by SPME-GC-MS and multivariate statistical analysis. J Forensic Sci. 2011 Mar;56(2):372-80. [CrossRef]
- Barnett, I., Bailey, F. and Zhang, M. Detection and Classification of Ignitable Liquid Residues in the Presence of Matrix Interferences by Using Direct Analysis in Real Time Mass Spectrometry, Journal of Forensic Sciences 2019, 64(5), pp.1486-1494. [CrossRef]
- Novoa-Carballal, R., Fernandez-Megia, E., Jimenez, C. and Riguera, R. NMR methods for unravelling the spectra of complex mixtures. Natural product reports 2011, 28(1), pp.78-98. [CrossRef]
- Flumignan, D.L., Boralle, N. and De Oliveira, J.E. Screening Brazilian commercial gasoline quality by hydrogen nuclear magnetic resonance spectroscopic fingerprinting and pattern-recognition multivariate chemometric analysis. Talanta 2010, 82(1), pp.99-105. [CrossRef]
- Monteiro, M., Ambrozin, A., Lião, L., Boffo, E., Tavares, L., Ferreira, M. and Ferreira, A. Study of Brazilian Gasoline Quality Using Hydrogen Nuclear Magnetic Resonance (1H NMR) Spectroscopy and Chemometrics. Energy & Fuels 2009, 23(1), pp.272-279. [CrossRef]
- Obeidat, M. Safwan. The Use of 1H NMR and PCA for Quality Assessment of Gasoline of Different Octane Number.Appl Magn Reason 2015,46, pp.875-883.16. [CrossRef]
- Obeidat, S. and Alomary, A. Multivariate Calibration and 1H NMR Spectroscopy for Uncovering Fuel Adulteration. Applied Magnetic Resonance 2006, 47(11), pp.1273-1282.
- Sun, C. and Wang, Z. 1H NMR application in characterizing the refinery products of gasoline.
- Pagano, B., Lauri, I., De Tito, S., Persico, G., Chini, M.G., Malmendal, A., Novellino, E. and Randazzo, A. Use of NMR in profiling of cocaine seizures. Forensic science international 2013, 231(1-3), pp.120-124. [CrossRef]
- Takano H, et al., J Forensic Leg Investig Sci 2019, 5: 041. [CrossRef]
- Mitchell, F.The use of Artificial Intelligence in digital forensics: An introduction, Digital Evidence and Electronic Signature Law Review 2010, vol. 7, pp. 35-41. [CrossRef]
- Autilia Vitiello, Ciro Di Nunzio, Luciano Garofano, Maurizio Saliva, Pietrantonio Ricci, Giovanni Acampora, Bloodstain pattern analysis as optimization problem, Forensic Science International 2016,266, Pages e79-e85, ISSN 0379-0738. [CrossRef]
- Chinnikatti, S. Artificial Intelligence in Forensic Science. Forensic Science & Addiction Research 2018, 2. [CrossRef]
- Christopher Rigano. Using Artificial Intelligence to Address Criminal Justice Needs. NIJ Journal 280, January 2019, https://www.nij.gov/journals/280/Pages/using-artificialintelligence-to-address-criminal-justice-needs.aspx.
- Cobas, J.C., Bernstein, M.A., Martín-Pastor, M. and Tahoces, P.G. A new general-purpose fully automatic baseline-correction procedure for 1D and 2D NMR data. Journal of Magnetic Resonance 2006, 183(1), pp.145-151. [CrossRef]
- Nawaiseh, A. Audit opinion decision using artifical intelligence techniques: empirical study of UK and Ireland. Ph. D, Brunel University, UK,2021.
- Singh, D. and Singh, B. Investigating the impact of data normalization on classification performance. Applied Soft Computing 2020, 97, p.105524. [CrossRef]
- McIlroy, J., Smith, R. and McGuffin, V. Assessing the effect of data pretreatment procedures for principal components analysis of chromatographic data. Forensic Science International 2015, 257, pp.1-12. [CrossRef]
- Olawode, E.O., Tandlich,R, and Cambray G. 1H-NMR Profiling and Chemometric Analysis of Selected Honeys from South Africa, Zambia, and Slovakia. Molecules 2018, 23, p.578. [CrossRef]
Figure 1.
A summary of spectra processing and data pre- processing steps required for optimizing the NMR data of petrol for further machine learning classification.
Figure 1.
A summary of spectra processing and data pre- processing steps required for optimizing the NMR data of petrol for further machine learning classification.
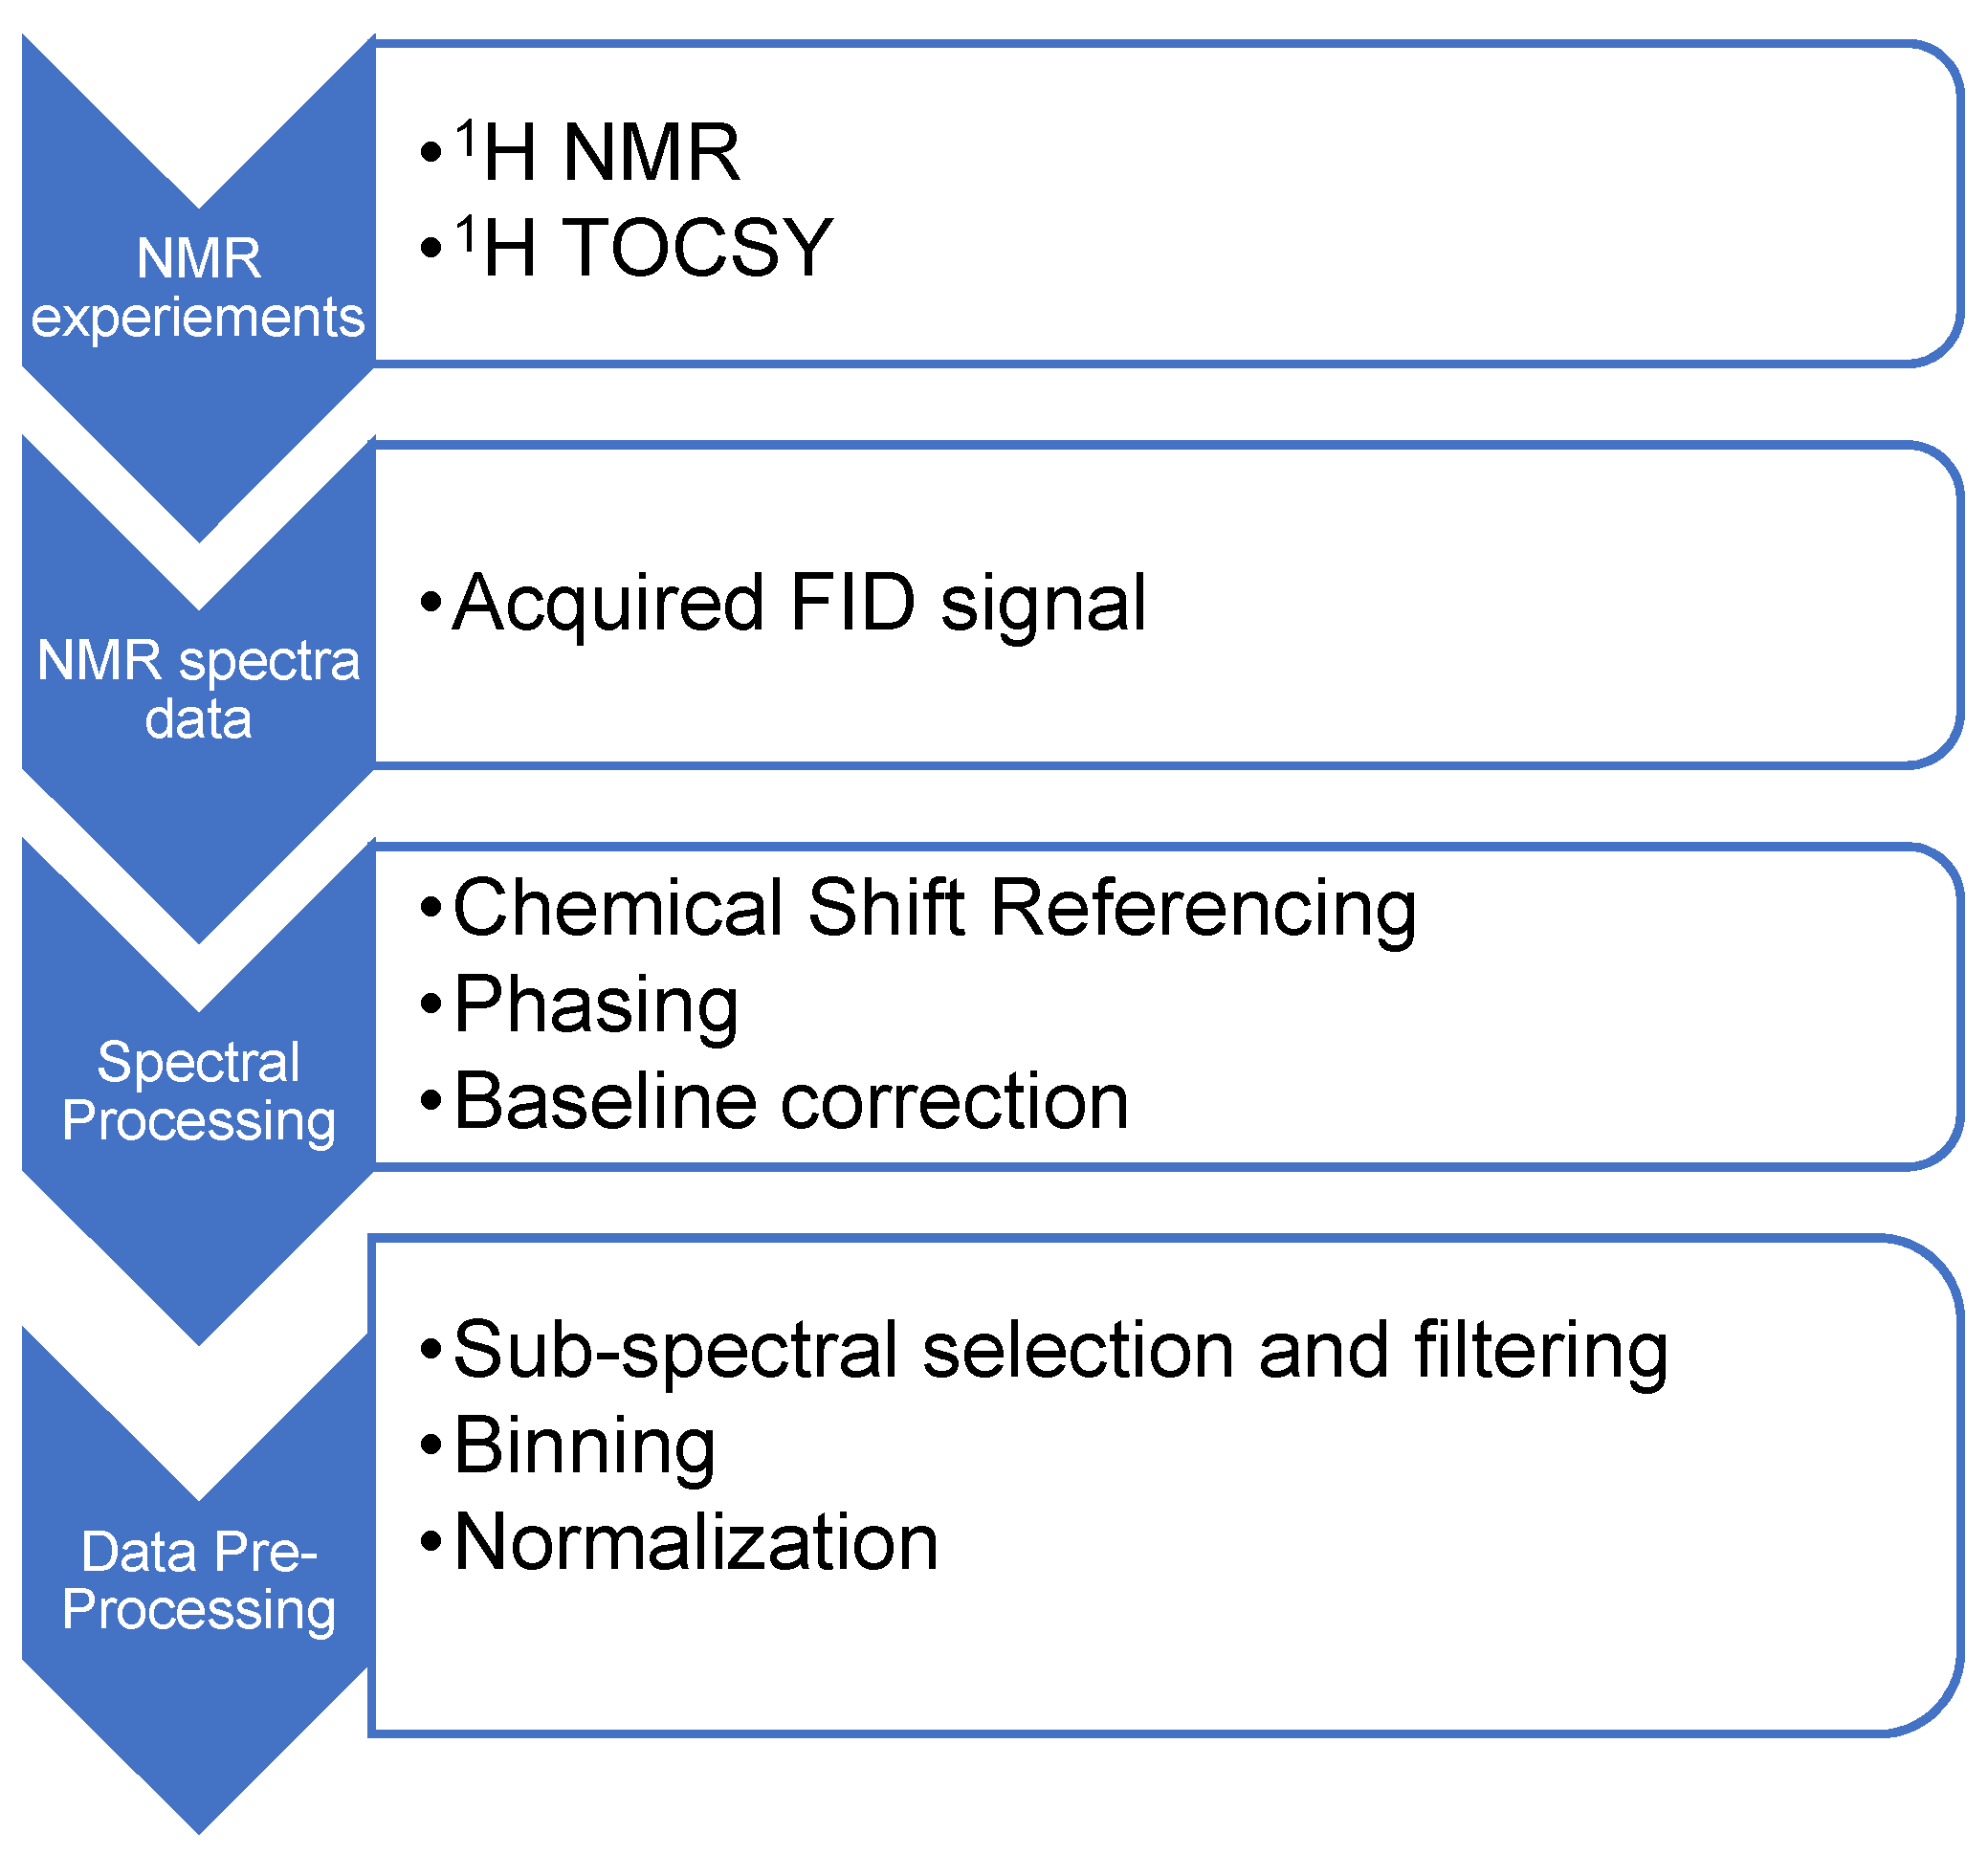
Figure 2.
Typical 1H NMR spectra of British Petroleum (BP) petrol: (i) entire spectrum (approximately 0ppm-10ppm) (ii) olefinic area of the spectrum (approximately 4.00ppm-6.00ppm).
Figure 2.
Typical 1H NMR spectra of British Petroleum (BP) petrol: (i) entire spectrum (approximately 0ppm-10ppm) (ii) olefinic area of the spectrum (approximately 4.00ppm-6.00ppm).
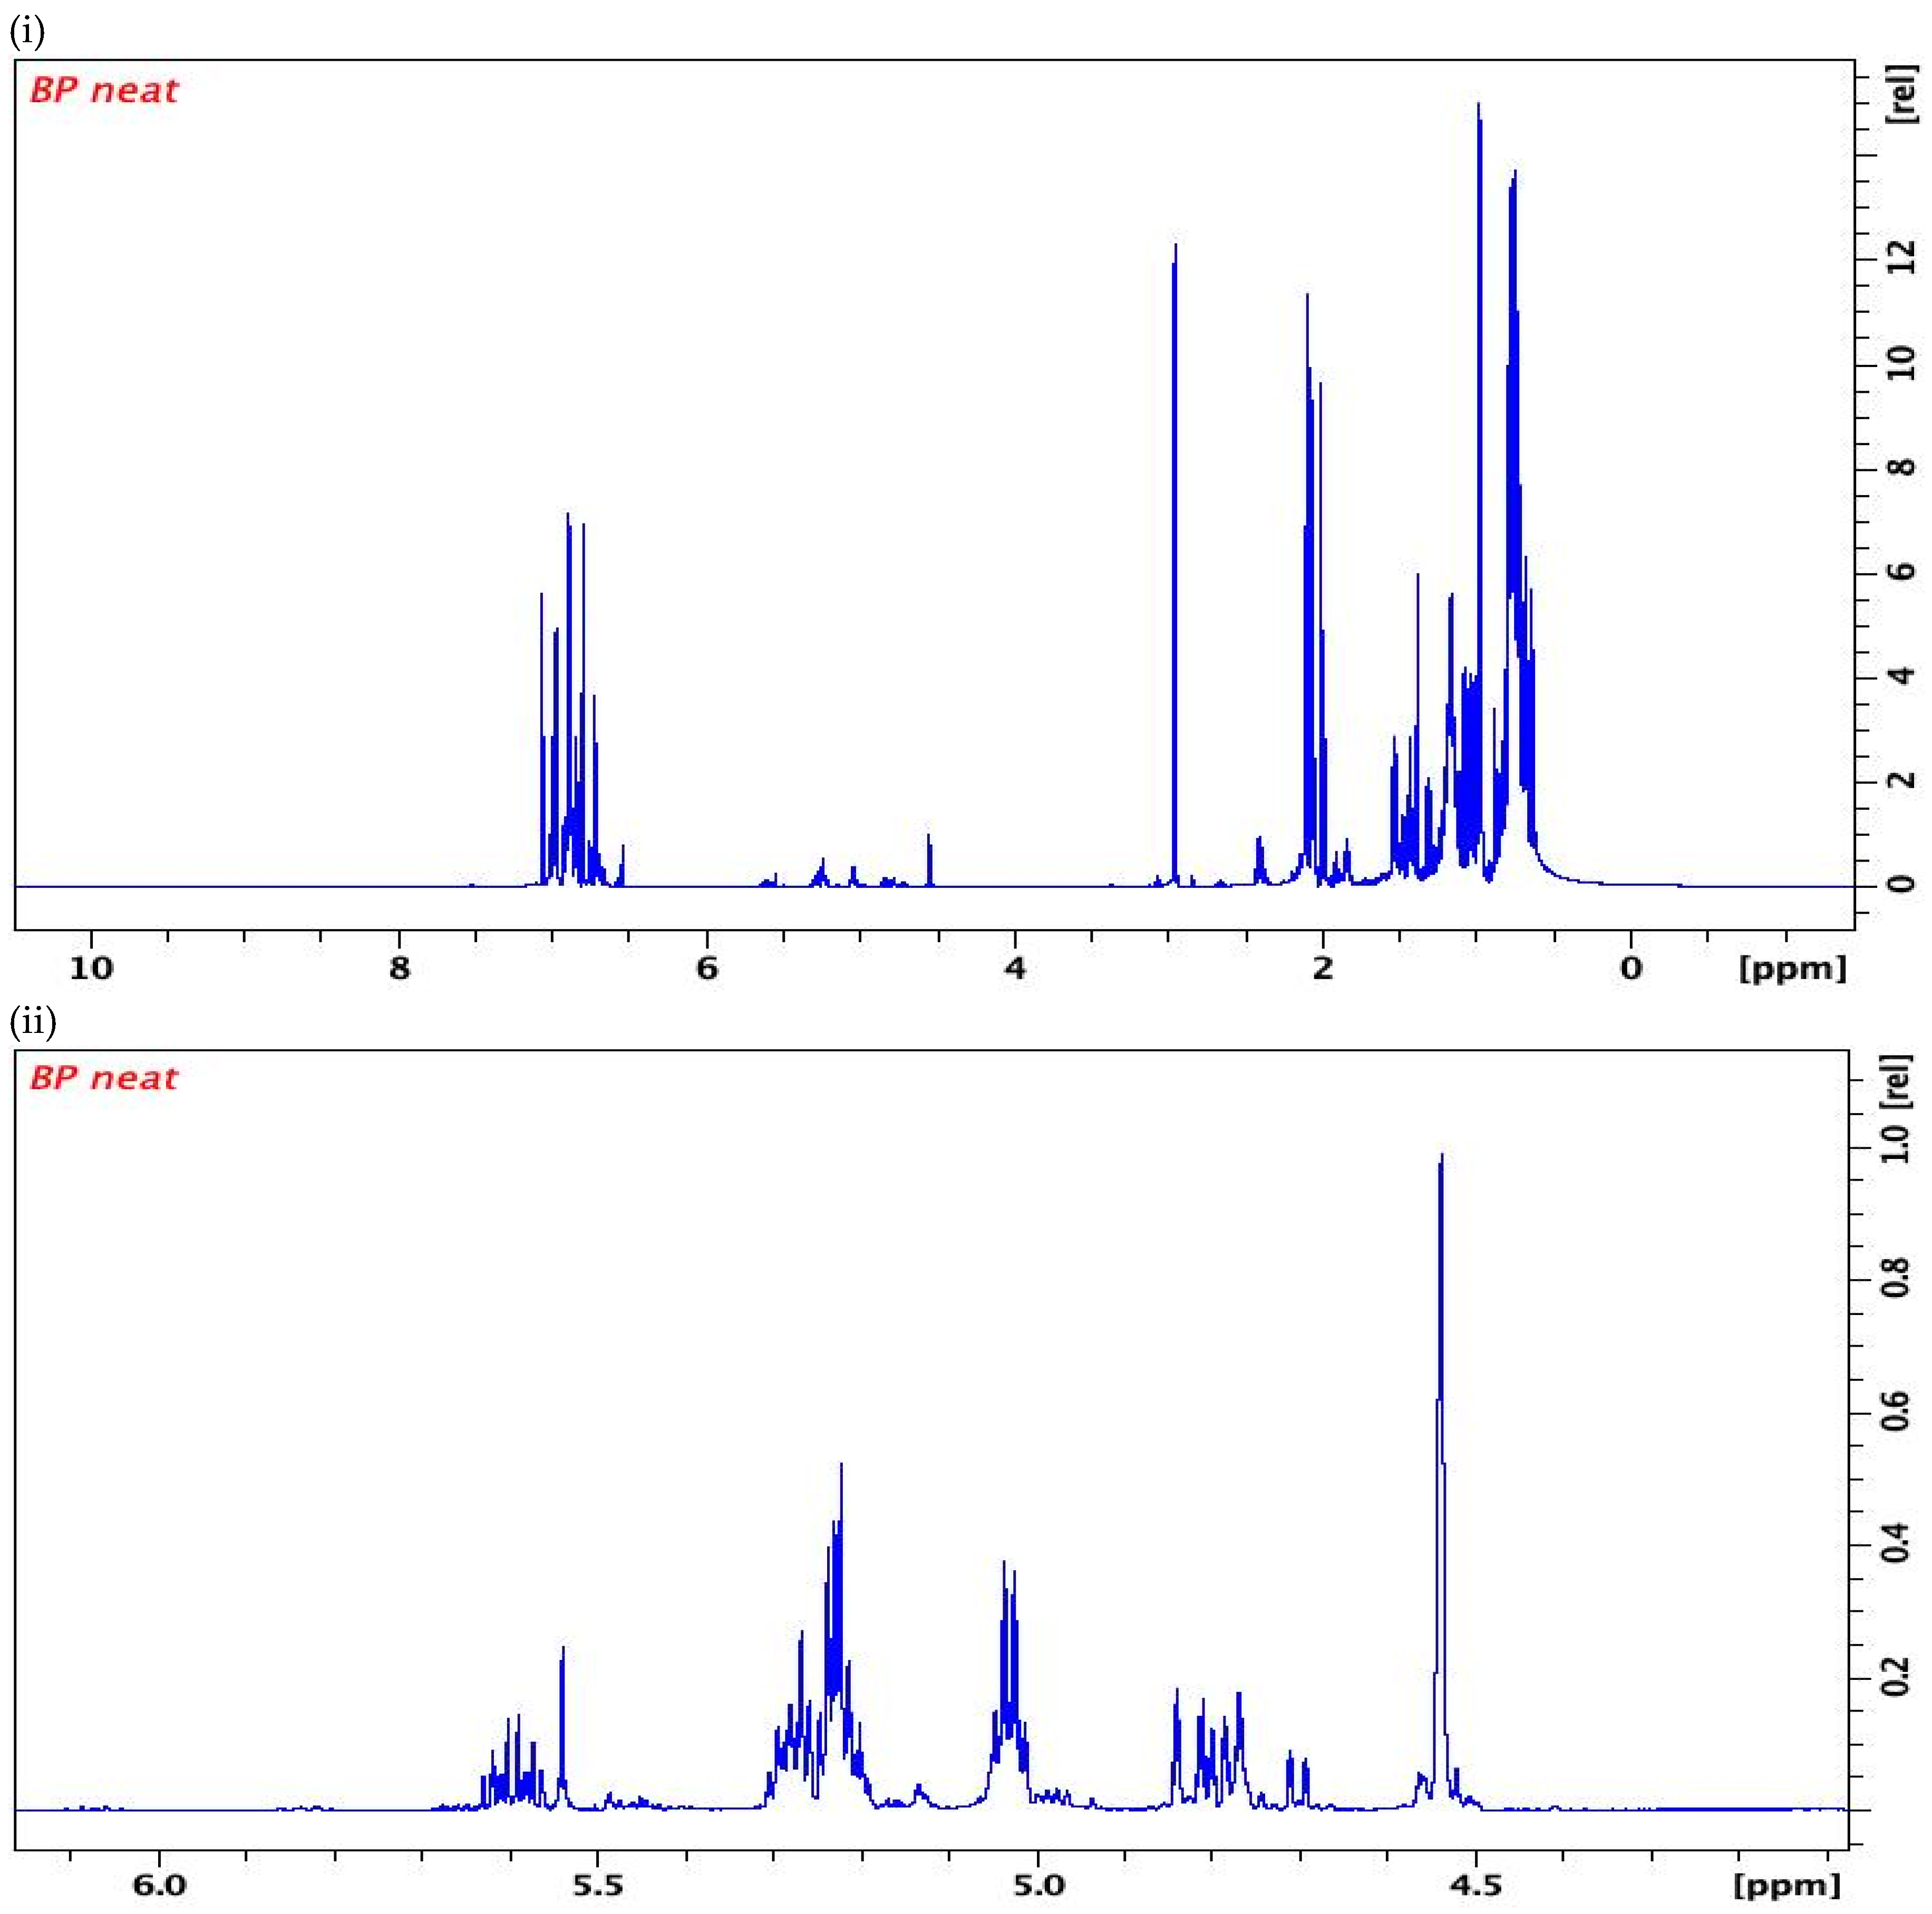
Figure 3.
A representation of the hierarchy classification model of the combination of native, evaporated, burnt petrol, and burnt petrol on substrate sources.
Figure 3.
A representation of the hierarchy classification model of the combination of native, evaporated, burnt petrol, and burnt petrol on substrate sources.
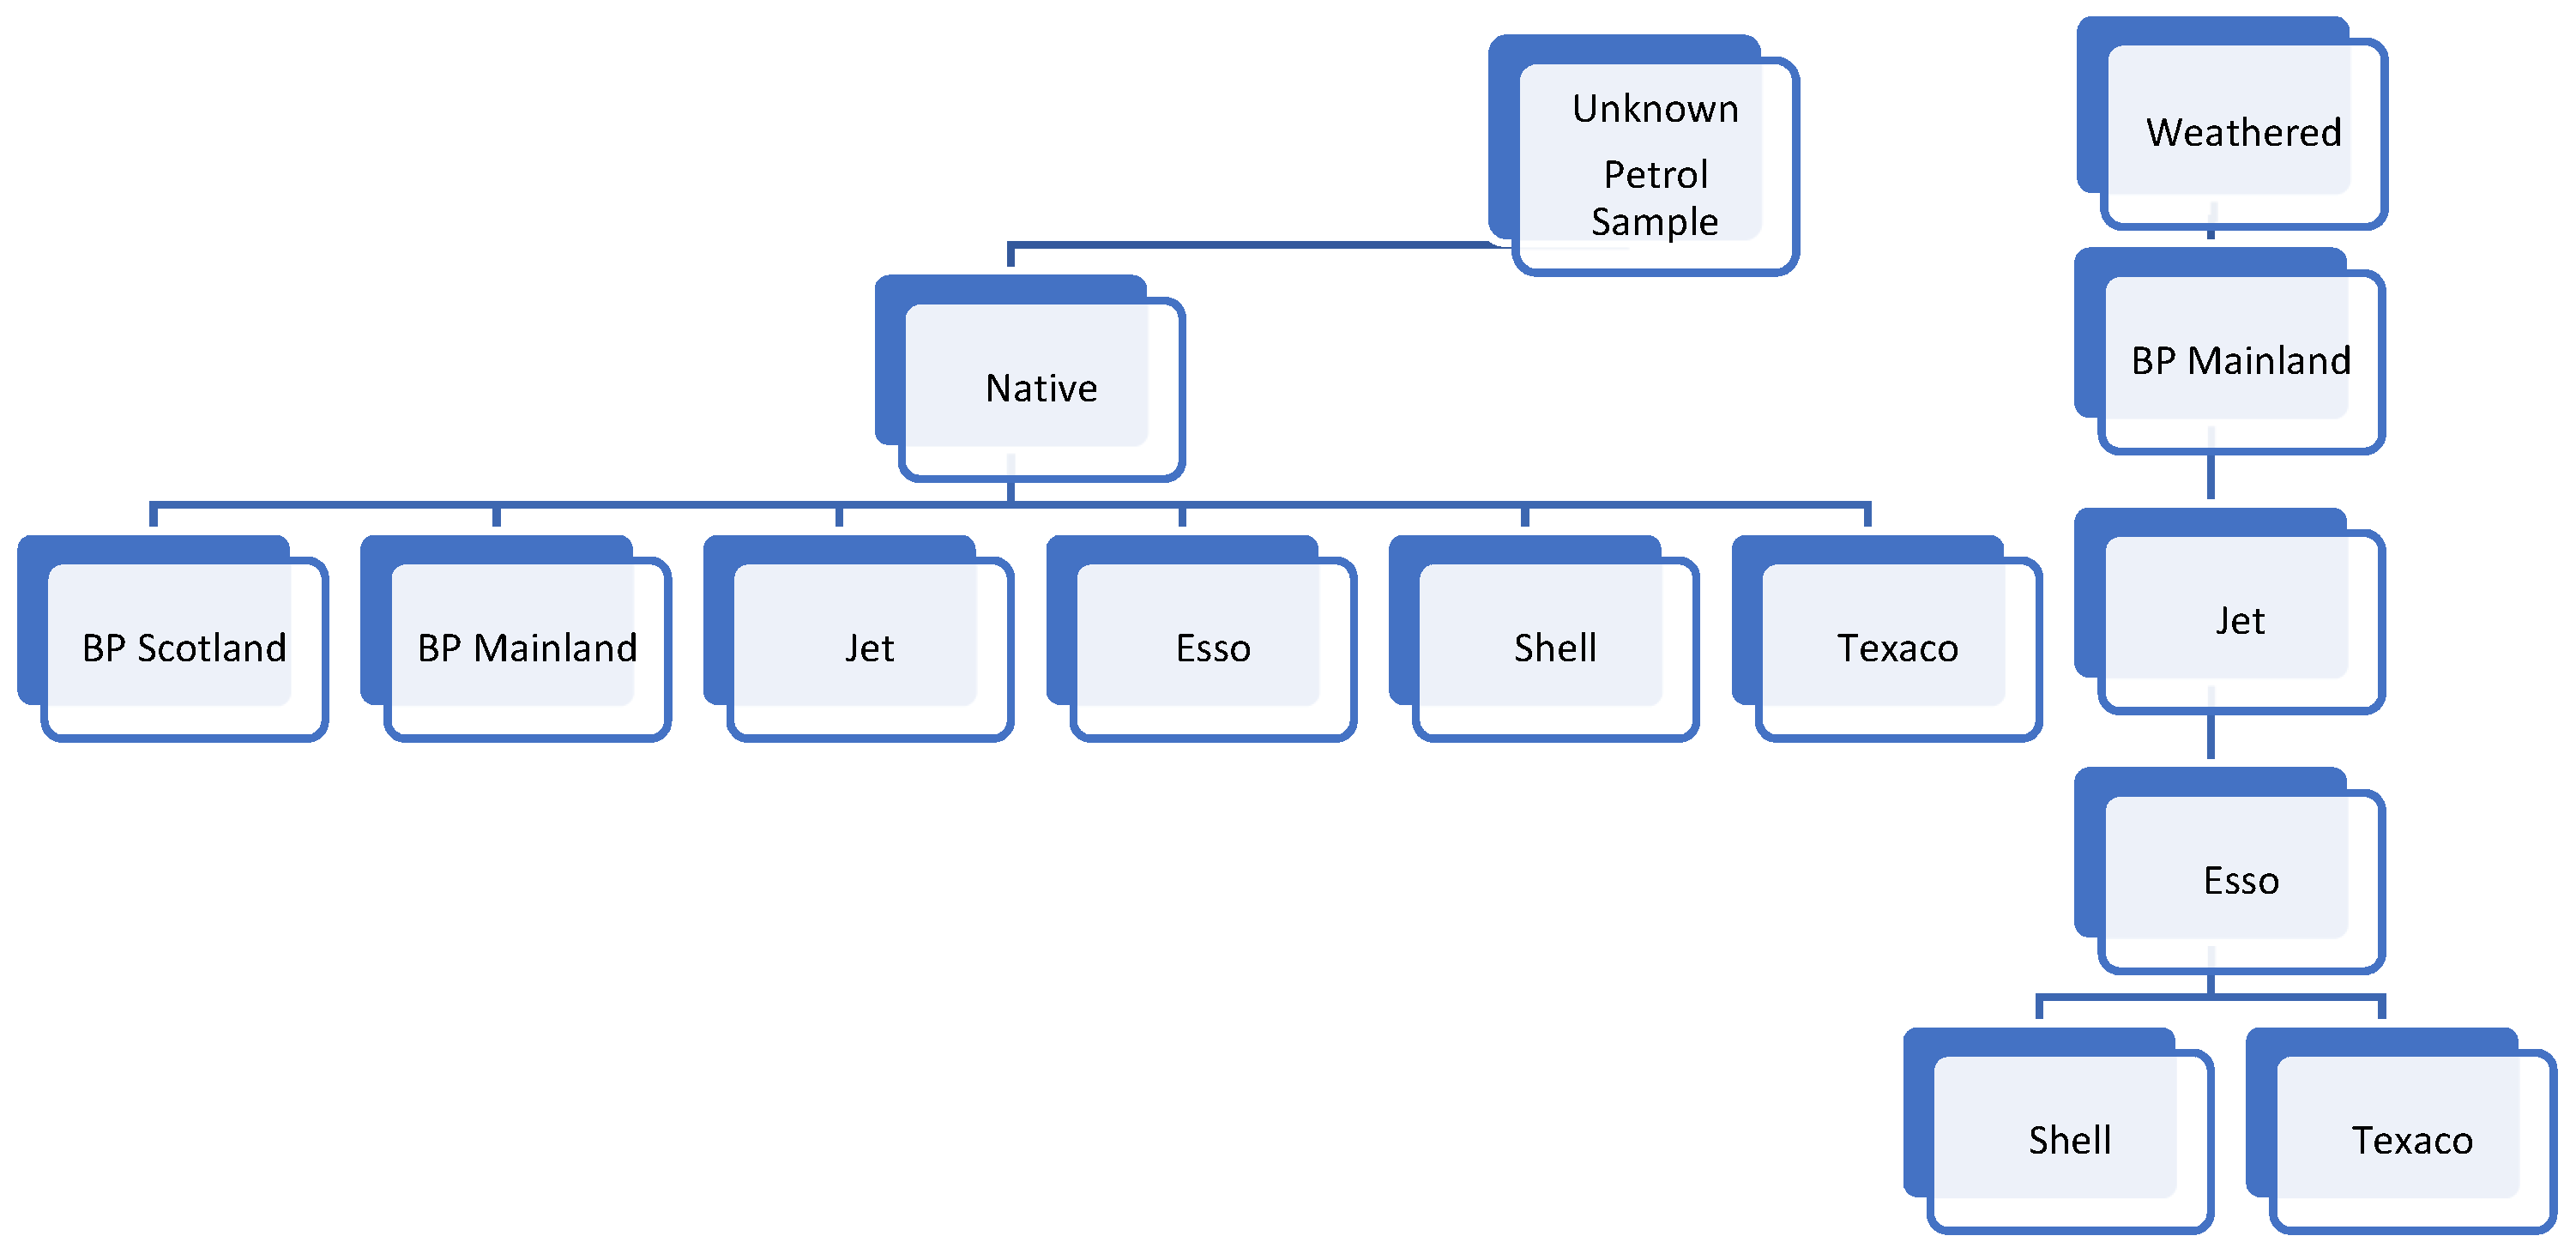

Table 1.
The summary table represents the blind sets of 1) neat petrol sample and 2) combination of evaporated, burnt and fire debris petrol samples.
Table 1.
The summary table represents the blind sets of 1) neat petrol sample and 2) combination of evaporated, burnt and fire debris petrol samples.
| 1) The summary table which contains the neat petrol samples used for building the double-blind study. | ||
| Blind Samples Name | Class | |
| BLIND A | Jet | |
| BLIND B | Esso I (from regions) | different |
| BLIND C | Esso II | |
| BLIND D | Esso III | |
| BLIND E | Texaco I | |
| BLIND F | Texaco II | |
| BLIND G | Shell I | |
| BLIND H | BP M | |
| BLIND I | Shell II | |
| BLIND J | BP S | |
| 2) The summary table which contains the evaporated, burnt and burnt on substrate petrol used for double blind study. | ||
| Blind Exhibits Name | CLASS | Weathered Status |
| BLIND EXHIBIT A | BP M | Evaporated 50% |
| BLIND EXHIBIT B | BP M | Cardboard Substrate |
| BLIND EXHIBIT C | JET | Burnt |
| BLIND EXHIBIT D | JET | Evaporated 25% |
| BLIND EXHIBIT E | ESSO | Evaporated 25% |
| BLIND EXHIBIT F | SHELL | Cardboard Substrate |
| BLIND EXHIBIT G | SHELL | Burnt |
| BLIND EXHIBIT H | TEXACO | Burnt |
| BLIND EXHIBIT I | TEXACO | Evaporated 25% |
Table 2.
A summary table of the Classification Models for neat petrol samples with the most successful classifier of different petrol source with prediction rate >60% and <60%.
Table 2.
A summary table of the Classification Models for neat petrol samples with the most successful classifier of different petrol source with prediction rate >60% and <60%.
| Dataset | Classifier | PCA |
Feature Selection |
k-folds | BP S | BP M | Jet | Esso | Shell | Texaco |
|---|---|---|---|---|---|---|---|---|---|---|
| Entire 1H NMR spectra | Ensemble | √ | 5 | 92.3% | 91.7% | |||||
| Entire 1H NMR spectra | SVM | √ | 10 | 100% | 71.4% | 83.3% | ||||
| Olefins Region | NN | √ | 5 | 76.9% | 66.7% | |||||
| Olefins Region | NN | √ | 10 | 92.3% | 75% | |||||
| 3-methyl-2-butene | NN | √ | 10 | 100% | 83.3% | 88.9% | 100% | |||
| 3-methyl-2-butene | Ensemble | √ | 5 | 91.7% | 66.7% | 62.5% | 77.8% | 90% | ||
| Mixture of 3-methyl-2-butene and 1-pentene | Ensemble | √ | 5 | n/a | 100% | 100% | ||||
| Mixture of 3-methyl-2-butene and 1-pentene | kNN | √ | 10 | n/a | 66.7% | 76% | ||||
| 2-methyl-2-butene | SVM | √ | 10 | n/a | 66.7% | 85.7% | 76 % | |||
| 2-methyl-2-butene | Ensemble | √ | 5 | n/a | 71.4% | 71.4% | 66.7% | 69.2% | ||
| Cis and trans-2-pentene | Linear Discriminant |
√ | 10 | 85.7% | 71.4% | 60% | 60% | 83.3% | ||
| Cis and trans-2-pentene | Ensemble | √ | 10 | 100% | 71.4% | 60% | 60% | 83.3% | ||
| Combined Olefins | Ensemble | √ | 10 | 100% | 77.8% | 71.4% | 71.4% | 77.8% | 76.9% | |
| Combined Olefins | Ensemble | √ | 10 | 100% | 66.7% | 71.4% | 71.4% | 88.9% | 76.9% |
Table 3.
A summary table of the Classification Models for neat, evaporated, burnt on its own and on variety of substrates samples petrol samples with the most successful prediction of different petrol source with prediction rate >60% and <60%.
Table 3.
A summary table of the Classification Models for neat, evaporated, burnt on its own and on variety of substrates samples petrol samples with the most successful prediction of different petrol source with prediction rate >60% and <60%.
| Dataset | Classifier | k-folds | BP S | BP M | Jet | Esso | Shell | Texaco |
|---|---|---|---|---|---|---|---|---|
| Neat Combined | Linear Discriminant | 5 | 85.7% | 88.9% | 76.9% | |||
| Evaporated petrol samples | NN | 10 | 75% | 60% | ||||
| Neat and Evaporated petrol samples | NN | 10 | 60% | 69.2% | 70.6% | |||
| Neat, Evaporated, Burnt and Substrates petrol samples | NN | 5 | 100% | 62.5% |
Table 4.
Summary table of the results of the blind dataset of native petrol sources with >60% displaying correct classification and <60% displaying incorrect classification.
Table 4.
Summary table of the results of the blind dataset of native petrol sources with >60% displaying correct classification and <60% displaying incorrect classification.
| SAMPLE N | CLASS | Native vs Evaporated | Predicted Class by NMR hierarchical Classifier | ATD-GC-MS |
|---|---|---|---|---|
| BLIND A | JET | native | ESSO | Identified as unique petrol source |
| BLIND B | ESSO | native | SHELL | Identified as unique petrol source or similar to J, E, F and H |
| BLIND C | ESSO | native | ESSO | Sample G identified as similar to Sample C |
| BLIND D | ESSO | native | ESSO | Sample D identified to be similar to Sample I |
| BLIND E | TEXACO | native | TEXACO | Sample E and F identified as same petrol source |
| BLIND F | TEXACO | native | TEXACO | Sample E and F identified as same petrol source |
| BLIND G | SHELL | native | SHELL | Sample G identified as similar to Sample C |
| BLIND H | BP M | native | BP M | Sample H and J are grouped with Texaco petrol source |
| BLIND I | SHELL | native | SHELL | Sample I identified as similar to Sample D |
| BLIND J | BP S | native | BP S | Sample H and J are grouped with Texaco petrol source |
Table 5.
Summary table of the results of the blind dataset of weathered petrol sources with >60% displaying correct classification and <60% displaying incorrect classification.
Table 5.
Summary table of the results of the blind dataset of weathered petrol sources with >60% displaying correct classification and <60% displaying incorrect classification.
| SAMPLE N | CLASS | Native vs Weathered | BP M Classifier |
Jet Classifier |
Esso Classifier | Shell/Texaco Classifier |
Predicted Class by NMR hierarchical Classifier | ATD-GC-MS |
|---|---|---|---|---|---|---|---|---|
| BLIND A | BP M 50% evaporated | Weathered | BP M | BP M | No differentiation achieved | |||
| BLIND B | BP M on cardboard | Weathered | BP M | BP M | Differentiate as different petrol source | |||
| BLIND C | JET burnt | Weathered | others | JET | JET | No differentiation achieved | ||
| BLIND D | JET 25% evaporated | Weathered | others | JET | JET | No differentiation achieved | ||
| BLIND E | ESSO 25% evaporated | Weathered | others | others | ESSO | ESSO | No differentiation achieved | |
| BLIND F | SHELL on cardboard | Weathered | others | others | others | SHELL | SHELL | No differentiation achieved |
| BLIND G | SHELL burnt | Weathered | others | others | others | TEXACO | TEXACO | No differentiation achieved |
| BLIND H | TEXACO burnt | Weathered | others | others | others | TEXACO | TEXACO | No differentiation achieved |
| BLIND I | TEXACO 25% evaporated | Weathered | others | others | ESSO | ESSO | No differentiate achieved |
Table 6.
Summary of machine learning model performance output using different classifiers and their accuracy on classification of different petrol sources.
Table 6.
Summary of machine learning model performance output using different classifiers and their accuracy on classification of different petrol sources.
| Classifier | Overall Accuracy % | Classification |
|---|---|---|
| Linear Discriminant | 98.5 | Native vs Weathered |
| Ensemble | 80 | BP S vs BP M vs Jet vs Texaco vs Shell vs Esso |
| k-NN | 84.4 | BP M vs other petrol brands |
| Logistic Regression | 82.4 | Jet vs other petrol brands |
| ANN | 82.1 | Esso vs other petrol brands |
| ANN | 60 | Texaco vs Shell |
Disclaimer/Publisher’s Note: The statements, opinions and data contained in all publications are solely those of the individual author(s) and contributor(s) and not of MDPI and/or the editor(s). MDPI and/or the editor(s) disclaim responsibility for any injury to people or property resulting from any ideas, methods, instructions or products referred to in the content. |
© 2024 by the authors. Licensee MDPI, Basel, Switzerland. This article is an open access article distributed under the terms and conditions of the Creative Commons Attribution (CC BY) license (http://creativecommons.org/licenses/by/4.0/).
Copyright: This open access article is published under a Creative Commons CC BY 4.0 license, which permit the free download, distribution, and reuse, provided that the author and preprint are cited in any reuse.


