Preprint
Article

Analysis of Altitude and Ambient Temperature Effects on the Reactivity of Oxidation Catalysts in the Presence of H2

Altmetrics

Downloads

67

Views

21

Comments

0

A peer-reviewed article of this preprint also exists.

Submitted:

30 April 2024

Posted:

01 May 2024

You are already at the latest version

Alerts
Abstract
Worldwide emission standards are now required to cover engine operation under extreme ambient conditions, which affect the raw emissions and the efficiency of the exhaust aftertreatment systems. These regulations also target new combustion technologies for decarbonization, such as neat hydrogen (H2) combustion or dual-fuel strategies, which involve a challenge to the analysis of exhaust aftertreatment systems requirements and performance. This work addresses the impact of high altitude and low ambient temperature conditions on the reactivity of an oxidation catalyst in the presence of H2. A reaction mechanism is proposed to cover the main conversion paths of CO, HC, and H2, including the formation and consumption of high-energy surface reaction intermediates. The mechanism has been implemented into a faster-than-real-time reduced-order model for multi-layer washcoat honeycomb catalytic converters. The model was utilized to investigate the effect of H2 concentration on the reactivity of CO and HC within the catalyst under various operating and ambient conditions. By applying the model and examining the selectivity towards different reaction pathways in the presence H2, insights into surface intermediates and reactivity across different cross-sections of the monolith were obtained. This analysis discusses the underlying causes of reactivity changes promoted by H2 and its relative importance as a function of driving boundary conditions.
Keywords: 
Subject: Engineering  -   Energy and Fuel Technology

1. Introduction

Stringent emissions regulations reflect growing societal demands for cleaner and more sustainable transportation [1]. The introduction of Real Driving Emissions (RDE) testing and the Worldwide harmonized Light vehicles Test Cycles (WLTC) within the Worldwide harmonized Light vehicles Test Procedure (WLTP) framework aims to narrow the gap between homologation and real-world emissions of Internal Combustion Engines (ICE) [2]. However, research indicates that vehicles meeting current standards still emit significant pollutants under specific conditions, such as cold starts [3], short trips [4], and scenarios involving high altitudes [5] or extreme ambient temperatures [6]. Current RDE tests establish environmental limits to assess vehicle emissions control in real-world driving scenarios [7]. These tests define two categories: moderate conditions (altitude 0-700 m, temperature 0-30   C) and extended conditions (altitude 700-1300 m, temperature -7 to 35   C) [8]. Furthermore, the upcoming Euro 7 regulations will cover a broader range of driving scenarios [9]. This new regulation predictably proposes to extend the temperature limits to -7   C to 35   C for moderate conditions and increase the maximum altitude to 1600 m. Extended conditions will cover altitudes up to 2200 m and temperatures ranging from -10 to 45   C [10]. This strategy addresses the emission challenges of low cold-start temperatures and high summer temperatures across Europe, reflecting the diversity of driving conditions and climates across the continent [11].
Studies demonstrate that extreme environmental conditions, specifically low temperatures and high altitudes, negatively impact ICE performance and exhaust aftertreatment systems (ATS). The study by Giechaskiel et al. [12] revealed that CO, HC, and NOx emissions from a Euro 6d-temp gasoline engine doubled at -10   C compared to mild ambient temperatures during urban driving scenarios, particularly spiking during cold start conditions. The research by Luján et al. [13] showed that low temperatures significantly impacted emissions from a light-duty diesel engine, with CO, HC, and NOx emissions doubling or even tripling during WLTC at -7   C compared to 20   C . Also, research by Bermúdez et al. [14] on Euro 4 internal combustion engines and by Suarez-Bertoa et al. [15] analyzing road emissions from three Euro 6d-TEMP engines (diesel, gasoline, and hybrid electric gasoline) demonstrated that higher altitudes tend to increase raw emissions of CO and NOx.
In lean ICEs, oxidation catalysts (OC) are essential for reducing pollutants like CO and HC. The efficiency of these catalysts, however, is influenced by environmental conditions. A study by Serrano et al. [16], examining a Euro 6d-Temp ICE at various altitudes (0 and 2500 m) and temperatures (20   C and -7   C), reported increased raw emissions of CO and HC and decreased OC efficiency at 2500 m and -7   C. Additionally, increased CO and HC raw emissions at higher altitudes lead to higher inhibitory effects, damaging OC performance. Historical research, including studies by Voltz et al. [17] and Oh et al. [18], has established that CO and HC presence impairs the oxidation process, decreasing conversion efficiency. Notably, at lower temperatures, the inhibitory effects of CO and HC on oxidation increase [19]. Additionally, research by Lefort et al. [20], utilizing various diesel fuels and operational settings with different CO, HC, and NOx levels, indicated that increased CO concentrations lead to higher CO and HC light-off temperatures. However, at elevated temperatures, the inhibition effect on oxidation declined because of decreased chemisorption. These observations underscored the competitive nature of CO [21] and HC [22] against O 2 for binding to active sites and the critical role of surface intermediates.
The presence of H 2 in exhaust gases is unusual in traditional ICEs. Nonetheless, with regulatory shifts favoring the adoption of alternative fuels and technologies to decrease CO 2 emissions, H 2 has emerged as a critical element in transitioning towards more sustainable transportation [23]. This shift encompasses strategies involving H 2 combustion [24] and dual-fuel strategies [25]. Specifically, the dual-fuel H 2 combustion approach has demonstrated substantial gains in fuel efficiency and a general decrease in raw emissions [26]. This enhacement is attributed to the formation of reaction intermediates favoured by the H 2 promotion of hydroxyl radicals on the catalyst surface [27]. However, introducing H 2 as a fuel alters the composition of exhaust gases, impacting the operating conditions for ATS. Consequently, a comprehensive assessment of ATS performance is essential to ensure its effectiveness across various conditions, notably when its efficiency can be affected.
From this background, this work examines the impact of H 2 on an OC under various environmental conditions. A simplified reaction mechanism including the primary conversion paths for CO, HC, and H 2 was implemented into a one-dimensional model for multi-layer washcoat honeycomb catalytic converters [28]. The model was calibrated with data from two sets of experimental tests. First, data from a Euro 6d-Temp Internal Combustion Engine (ICE) coupled with a MEDAS altitude simulator was used, operating at two distinct conditions: sea level (0 m) and 20   C, and an altitude of 2500 m with a temperature of -7   C. This data was used as the basis for calibrating the model in the absence of H 2 . To assess the impact of H 2 , the calibration process integrated selectivities for various reaction pathways, derived from the simulation of temperature ramp tests conducted on diesel exhaust gases with varying concentrations of H 2 . The calibrated model was then used to evaluate how H 2 affects the conversion efficiency of CO and HC under the specified environmental conditions, covering a broad spectrum of H 2 concentrations. Furthermore, the study investigated the reactivity of CO and HC within the catalyst monolith, focusing on the selectivity towards different oxidation pathways. The objective was to understand how H 2 variably influences these reaction pathways in the environmental scenarios studied and to identify the mechanisms behind these differences. This understanding is crucial to optimize OC control in dual-fuel diesel- H 2 ICE under various environmental conditions.

2. Materials and Methods

This study used a combination of experimental and theoretical methods to analyze the effect of H 2 presence in the exhaust gas on the operation of an OC in warm sea-level and high altitude and low-temperature conditions, representative of real driving scenarios.
The initial phase of the study was based on tests conducted by Serrano et al. [16] on an HSDI diesel Euro 6d-Temp engine installed in a test bench coupled with the Horiba MEDAS. The MEDAS system, an altitude simulator developed by CMT - Thermofluids & Clean Mobility [29,30], facilitated variable working pressure for the engine based on the designated driving altitude. These tests provided the baseline data to calibrate the reactions that do not involve H 2 in the OC model. In the second part of the study, the model reactions influenced by the presence of H 2 were calibrated using the selectivities of CO and HC to different reaction pathways [31]. After performing the model calibration, a comprehensive analysis was conducted to assess the impact of H 2 on the conversion efficiency and selectivities of CO and HC reactions along the monolith cross-section under both cold altitude and warm sea-level conditions. This analysis covered different molar fractions of H 2 representative of exhaust gases from a dual-fuel H 2 -diesel engine. The fractions included 500 ppm and 1000 ppm of H 2 , as well as post-injection strategies employing 5000 ppm and 10000 ppm of H 2 .

2.1. Experimental Setup

The experimental facility used as a base to conduct the first part of the study consisted of an HSDI diesel Euro 6d-Temp engine for passenger car application, whose detailed characteristics are described in [16]. The engine was installed in a test bench integrated with Horiba MEDAS which can handle altitudes from sea level to 5000 m and ambient temperatures from -15 to 45   C [29]. The ATS comprised a close-coupled OC and a wall-flow particulate filter coated as a selective catalytic reduction system. The characteristics of the OC are listed in Table 1.
The experiments conducted by Serrano et al. [16] were carried out under steady-state conditions, with the engine operating at constant torque and speed until thermal stabilization was achieved, enabling the measurement of CO and HC conversion efficiencies. These tests were guided by the gas inlet temperature and the exhaust gas mass flow of the OC, which were constrained by the two distinct ambient conditions. To establish a baseline for comparison, the conversion efficiency of pollutants was measured at 0 m of altitude and 20   C, referred to as the warm sea-level case. This was then compared to the results obtained at 2500 m of altitude, corresponding to an ambient pressure of 0.747 bar and a temperature of -7   C, referred to as the cold altitude case. To establish the mass flow of exhaust gases, the engine speed was assessed at 1000 rpm, 1250 rpm, and 1500 rpm under warm sea-level conditions. Following this, the speed range was modified for the cold altitude scenario to achieve a comparable exhaust mass flow in both situations. Additionally, the OC inlet gas temperature was controlled within the same range (100 to 300   C) for both cases. The exhaust gas mass flow, catalyst inlet pressure and temperature, along with CO and HC concentrations at the catalyst inlet for both warm sea-level and cold altitude cases, are detailed in Appendix A - Table A1 and Table A2.
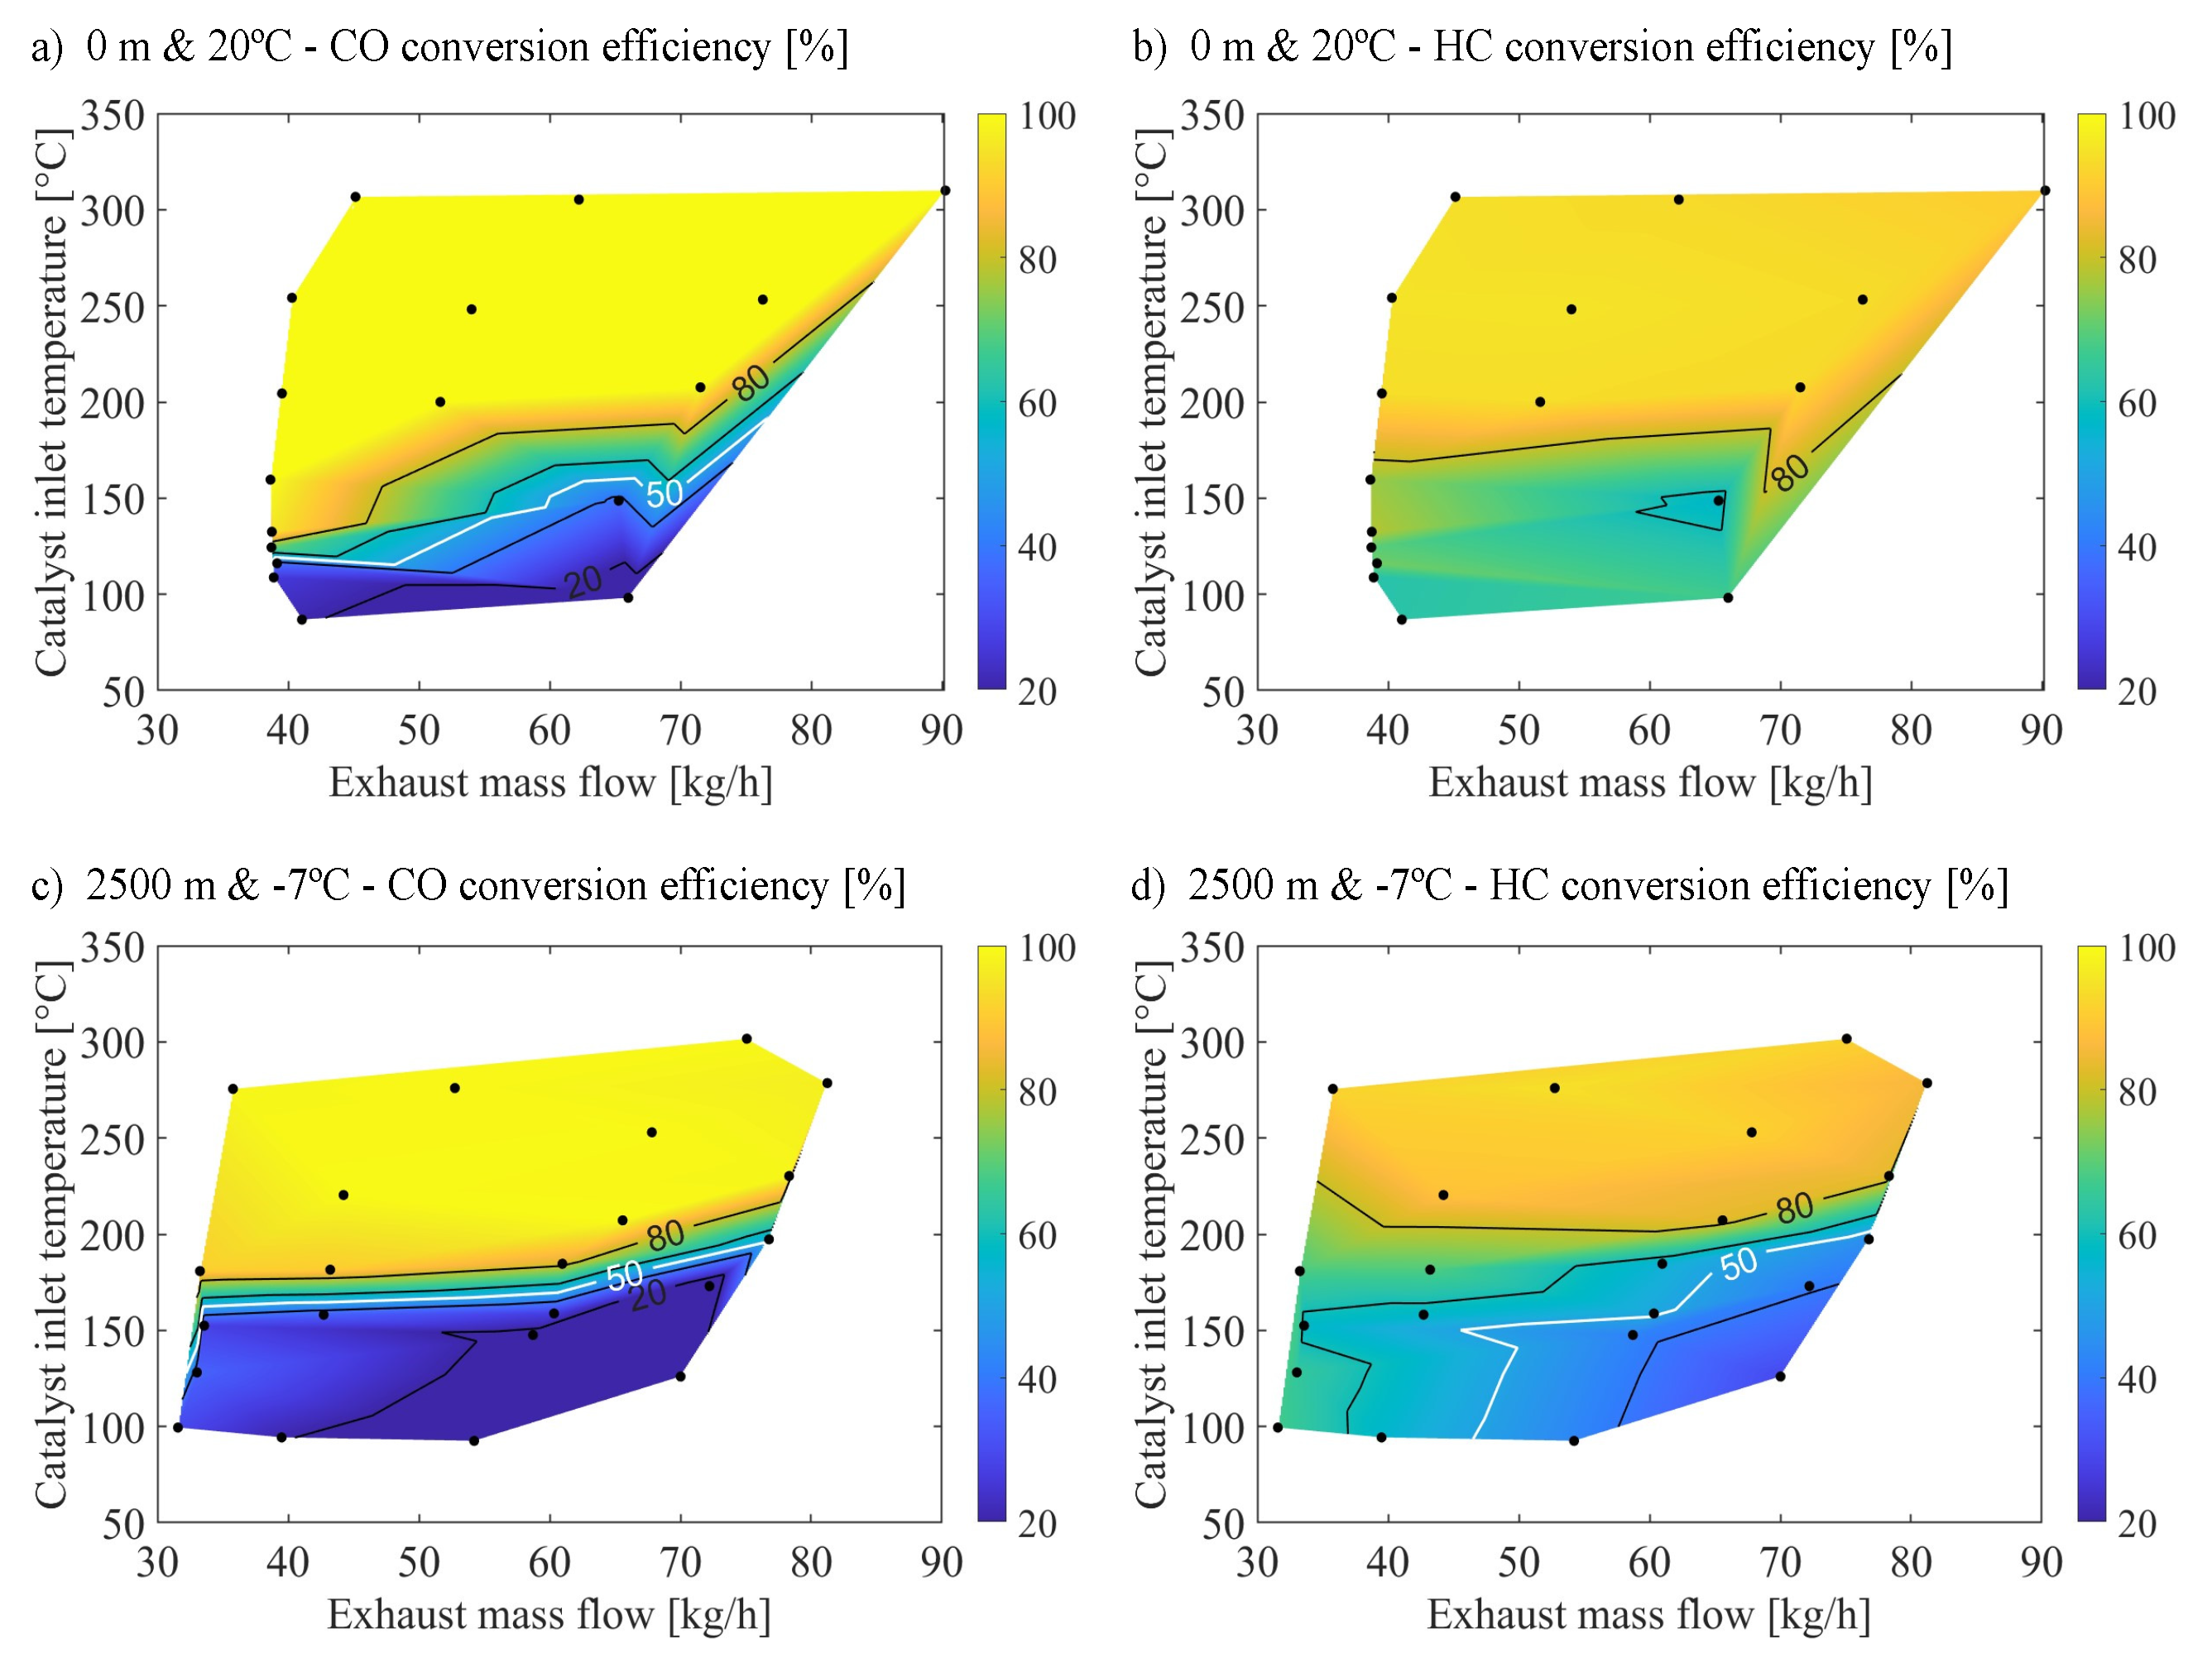
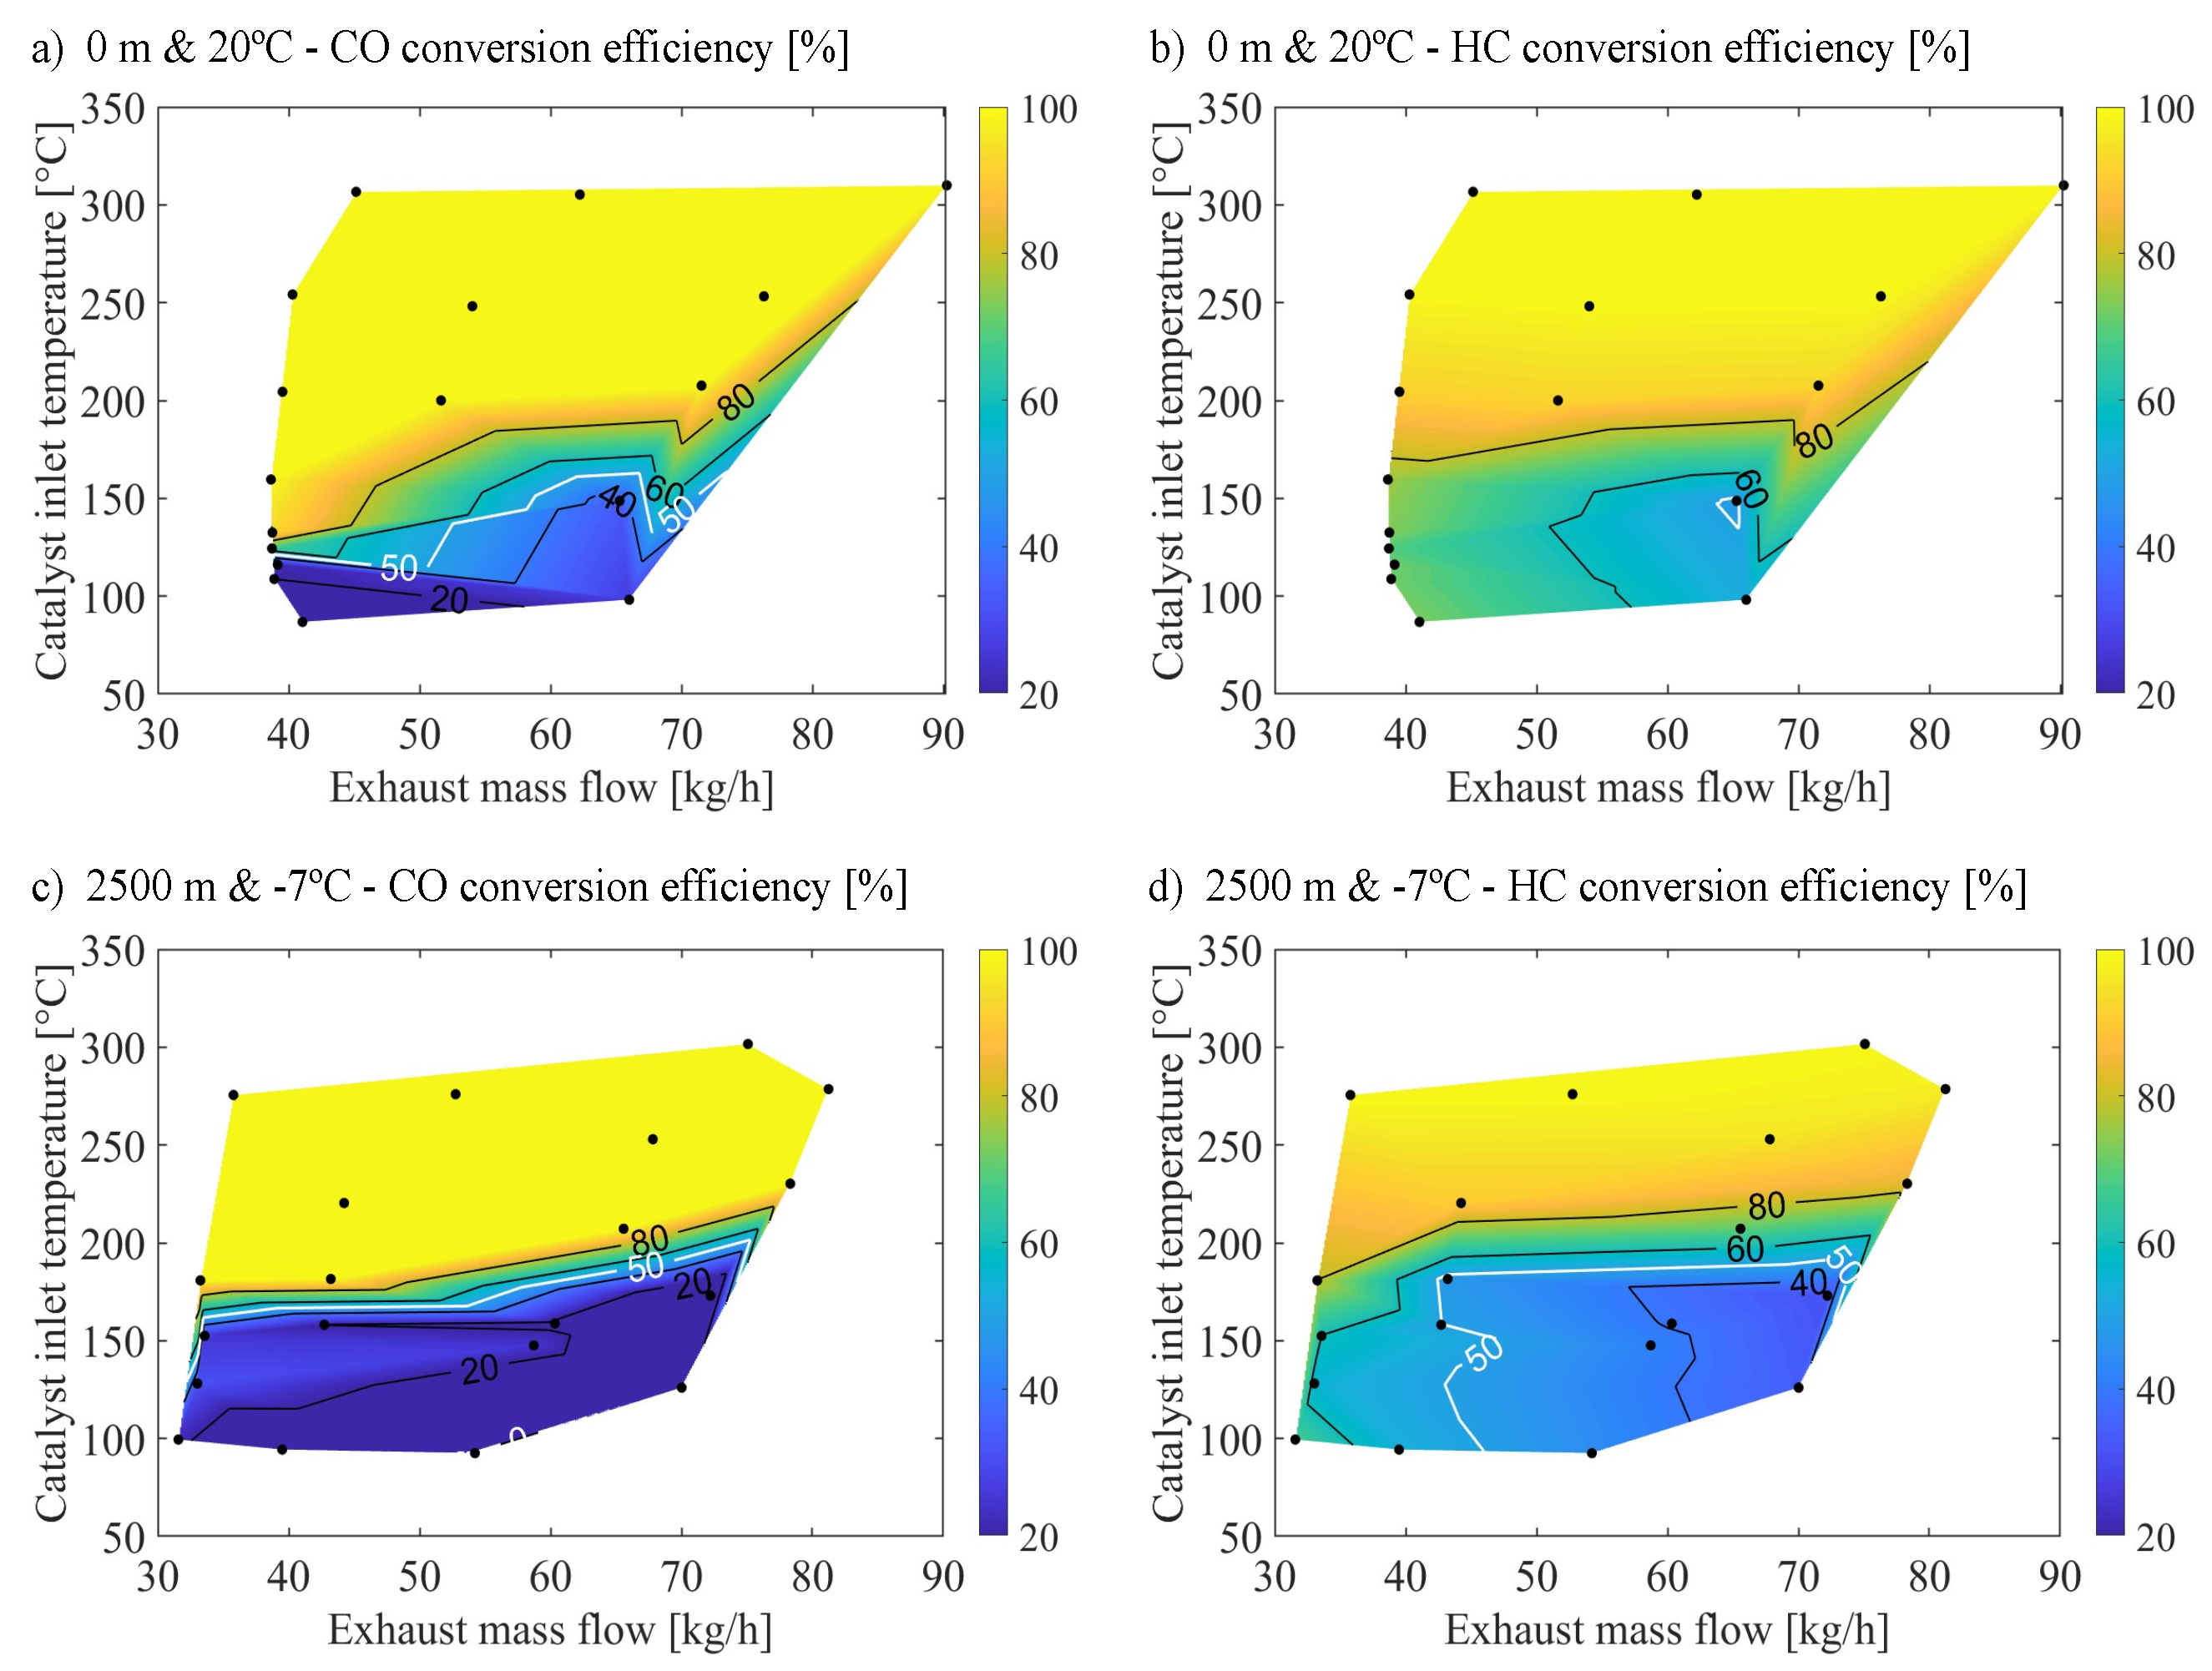
At each tested point, pollutants were continuously measured according to the specific measurement protocol described in [16]. The results of CO and HC conversion efficiency of the experimental tests for both warm sea-level and cold altitude cases are shown in the conversion efficiency maps in Figure 1, which is analyzed in detail in [16].
To conduct the second part of the study, which examines the effect of H 2 on the OC under warm sea-level and cold altitude cases, modeling results from a previous work by Piqueras et al. [31] were employed. These results analyzed the selectivity of CO and HC reactions to O 2 and ·OH due to the presence of H 2 using a reduced-order model proposed by Piqueras et al. [28]. The selectivities were modeled based on experimental temperature ramp tests carried out by Herreros et al. [32]. These tests involved a Pt-coated OC on alumina, which was placed in a tubular furnace in the by-pass of the exhaust line of a single-cylinder diesel engine. The catalyst inlet gas was doped with varying molar fractions of H 2 , ranging from 500 to 8000 ppm. The resulting CO and HC selectivities as a function of the temperature and H 2 inlet molar fraction were integrated into the calibration of the catalyst model utilized in this study.

2.2. Catalyst Model

The study employed a flow-through monolith oxidation catalyst model for dual-layer washcoat, as proposed by Piqueras et al. [28]. This model is incorporated into VATS, a software developed by CMT-Clean Mobility & Thermofluids, designed to simulate ATS. VATS is coupled with VEMOD, a gas dynamic software utilized for engine simulation [33]. Detailed descriptions of the model for dual-layer washcoat catalysts can be found in [28], which is based on earlier developments focused on deriving explicit solutions for flow transport in catalytic reactors with single-layer washcoats [34,35] from a 1+1D two-phase approach [36]. The model calculates the concentration of chemical species in the bulk gas along the monolith. It includes convective and diffusive transport mechanisms and accounts for chemical reactivity in dual-layer washcoat structures. The model assumes constant flow properties across the monolith inlet and negligible radial temperature gradients, ensuring consistent behavior across all channels [35], as well as quasi-steady incompressible flow [37,38]. The chemical species conservation equations, corresponding to a single channel bulk gas (Equation 1) and washcoat layers (Equations 2-3) are written as:
u x c g x = S s , g J g , w c 1
r w c 1 ν r w c 1 R r w c 1 m = S s , w c 1 J g , w c 1 J w c 1 , w c 2
r w c 2 ν r w c 2 R r w c 2 m = S s , w c 2 J w c 1 , w c 2
In the equations, subscripts g, w c 1 , and w c 2 denote the bulk gas and the two washcoat layers, respectively. The variable u x indicates the axial velocity of the gas. The term R r w c i m quantifies the reaction rate of an m t h -order reaction, and ν r w c i are the stoichiometric coefficients, with positive values for products and negative values for reactants. Additionally, S s refers to the specific surfaces of the gas and each substrate layer. The terms J g , w c 1 and J w c 1 , w c 2 describe the fluxes at the interface between the gas and the upper washcoat layer, and between the upper and lower washcoat layers, respectively [28].
The fundamentals of the explicit solver development for chemical species transport lies in the dependence of the interfacial fluxes on the species concentration at every phase, as proposed by Ratnakar et al. [38].
An explicit solution is obtained to determine the concentration of the chemical species at the outlet of the monolith according to Equation 4. Constants b and d are functions of specific surfaces, diffusion times, reaction rates and Sherwood numbers, as detailed in [28].
c g , o u t = d + b c g , i n e S s , g b τ d b
In parallel to the solution of the chemical species transport, the energy balance in the gas and solid phases is also addressed due to the influence of substrate temperature on reactivity and outlet gas concentration, as detailed in [28].
Regarding the reaction mechanism of the model, which is depicted in Table 2, it involves primary processes in an OC, covering HC adsorption/desorption ( R 1 and R 2 ), CO and HC oxidation with O 2 ( R 3 and R 4 ), and NOx interconversion ( R 5 and R 6 ), detailed in [31]. While these reactions address catalyst behavior with excess O 2 , they lack sensitivity to H 2 presence. Introducing ·OH radicals as intermediates captures the influence of H 2 . Mhadeshwar and Vlachos [27] proposed a microkinetic scheme highlighting the significance of carboxylic pathway in CO-·OH interaction, modeled by reactions R 8 and R 9 . This pathway offers an alternative to direct CO oxidation, involving a two-step reaction route forming ·COOH groups on Pt surface, represented by reaction R 11 , as detailed in [31]. A similar radical pathway models HC light-off temperature reduction [32] via reaction R 12 . Despite the oxidative environment, reactions like water gas shift ( R 13 and R 14 ) and steam reforming ( R 15 ) are included for comprehensive analysis, despite their minor contribution. The competitive interaction among species is taken into account through the incorporation of an inhibition term, specifically defined for the oxidation of CO and HC (reactions R 3 and R 4 in Table 2). The inhibition term ( G o x ) was derived using the expression proposed by Voltz et al. [17] as detailed in [16].
Finally, Table 2 presents the comprehensive reaction mechanism along with the corresponding rates for each reaction accounted for in every catalyst layer, including kinetic constants ( k i ) derived from the Arrhenius equation. Equilibrium constants of the NOx interconversion reaction ( K e q , N O x ) and the water-gas shift reaction ( K e q , w a t e r ) are also included, calculated from the thermodynamic data obtained in [39] and [40], respectively.

3. Results and Discussion

This section discusses the results obtained from modeling the catalyst to assess the reactivity in the presence of H 2 by applying the methodology detailed in Section 2. First, the methodology used and the results obtained to carry out the calibration of the OC model are presented. The analysis of the results obtained after the model calibration was focused on two main parts. Initially, the study examined the reactivity of CO in the OC across various molar fractions of H 2 under warm sea-level and cold high-altitude conditions. Subsequently, the reactivity of HC in the OC under the same conditions was also studied. In both cases, the evolution of the selectivity of CO and HC to O 2 /·OH and HC adsorption and the conversion efficiency of both species along the cross-section of the monolith were analyzed.

3.1. Modeling H 2 Effect on Reactivity under Altitude and Sea Level Conditions

The initial phase of the study focused on model calibration to reproduce observed conversion efficiencies for CO and HC during steady-state tests conducted under warm sea level and cold altitude conditions, as referenced in [16] and detailed in Section 2.1. The calibration tests are detailed in Table A1 for warm sea-level conditions (0 m and 20   C), and in Table A2 for cold high-altitude conditions (2500 m and -7   C). Both tables are located in Appendix A.
Due to the absence of H 2 in these tests, calibration was restricted to reactions excluding this species. Specifically, it focused on HC adsorption and desorption ( R 1 and R 2 ), CO oxidation ( R 3 ), and HC oxidation ( R 4 ) reactions, as outlined in Table 2. The calibration of kinetic constants for these reactions considered the effects of thermal transients on oxidation and the equilibrium of adsorption-desorption, as well as the progressive influence of HC accumulation on the reaction rate of adsorption-desorption. This methodology facilitated a steady-state representation at test completion, distinguishing between HC oxidation and adsorption conversion efficiencies under varying environmental conditions.
In this initial part of the calibration, the objective function, defined in Equation 5 and minimized using the simplex search method by Lagarias et al. [41], represented the weighted sum of cumulative errors in conversion efficiency ( C e f f ) for CO and HC. It considered the modulus of the error up to each time point (t) for each pollutant species (p), CO and HC, ensuring balanced weighting for both pollutants.
Φ O C O 2 = test ω test t ε C O t + t ε H C t
ε p t = | C e f f p , e x p C e f f p , m o d |
Figure 2 presents the modeling results of the steady-state tests under warm sea-level and cold altitude conditions. The comparison of the model results with experimental data, depicted in Figure 1, underscores its efficacy in simulating CO and HC conversion efficiencies with notable accuracy.
The agreement between Figure 2a and Figure 1a validated the ability of the model to capture CO conversion behavior at warm-sea level. The model successfully predicted the low reactivity below 100   C OC inlet temperature. Additionally, it accurately captured the enhancement in CO conversion efficiency and its sensitivity to changes in exhaust mass flow as temperatures increased. Furthermore, the model accurately identified regions achieving 100% CO conversion.
In the context of CO conversion efficiency under cold altitude conditions, as illustrated in Figure 2c, the model reflected the changes in conversion efficiencies caused by modifying environmental conditions. Notably, it reproduced the elevation in CO light-off temperature and the significant reduction in CO conversion efficiency at reduced exhaust mass flows, a trend more pronounced under cold altitude conditions than warm sea-level conditions.
The ability of the model to predict HC conversion efficiency under varying environmental conditions was further validated by comparing Figure 2b,d with their corresponding experimental data of Figure 1b,d. This analysis demonstrates the capacity of the model to capture the influence of exhaust mass flow and OC inlet temperature on HC conversion. Notably, the model accurately predicted the dominance of zeolite adsorption at lower temperatures [16]. Additionally, it captured the dependence of conversion efficiency on both temperature and mass flow rate for oxidation reactions. However, the model predicted a slightly weaker dependence on these factors than the experimental data
The calibrated reactions allow CO and HC elimination prediction across diverse conditions, emphasizing the O 2 oxidation pathway for lean combustion scenarios and accounting for HC accumulation. Nonetheless, these reactions cannot account for the influence of H 2 present in exhaust gases under both warm altitude and sea level conditions, as elaborated in Section 2.1. To address this gap, a targeted calibration of reactions that occur in the presence of H 2 is essential.
Therefore, next phase of calibration focuses on fine-tuning the reactions involving H 2 within the catalyst, specifically targeting reactions R 7 to R 12 as delineated in Table 2. The goal is to refine the predictive capability of the model regarding the catalytic processes influenced by H 2 . A new objective function for this calibration phase was added to reflect the selectivities ( S p , R k ) of CO and HC to reactions involving H 2 and O 2 pathways. These selectivities were detailed in a preceding investigation by Piqueras et al. [31], which examined the reactivity of an OC across different H 2 concentrations. The objective of this calibration step was to ensure that the elimination of CO and HC occurred in the presence of H 2 , following established pathways at each reaction temperature. Selectivity, defined in Equation 7, accounts for the contribution of each reaction ( Λ p , R r ) to the conversion of individual species, calculated as the proportion of a change in concentration of a species due to a specific reaction to the total change in that concentration, which is the sum of all reaction contributions.
S i , R k = Λ i , R k r Λ i , R r
A new error function was formulated based on the selectivities of each reaction, for both the simulation and the reference case, as described in Equation 8.
ε S i , R k t = t e s t S i , R k O C r e f e r e n c e t S i , R k O C s i m u l a t i o n t
Equation 9 shows the objective function to calibrate the model in the second part of this study. The second term of this equation refers to the selectivity of CO to the oxidation with O 2 ( R 3 ) and the oxidation with ·OH ( R 11 ). It also accounts for the selectivity of HC to the oxidation with O 2 ( R 4 ) and the oxidation with ·OH ( R 12 ), without taking into account the adsorption/desorption processes taking place in the zeolite.
Φ O C H 2 = test ω test t ε C O t + t ε H C t + test ω test test e S C O , R 3 t + test e S C O , R 11 t + test e S H C , R 4 t + test e S H C , R 12 t
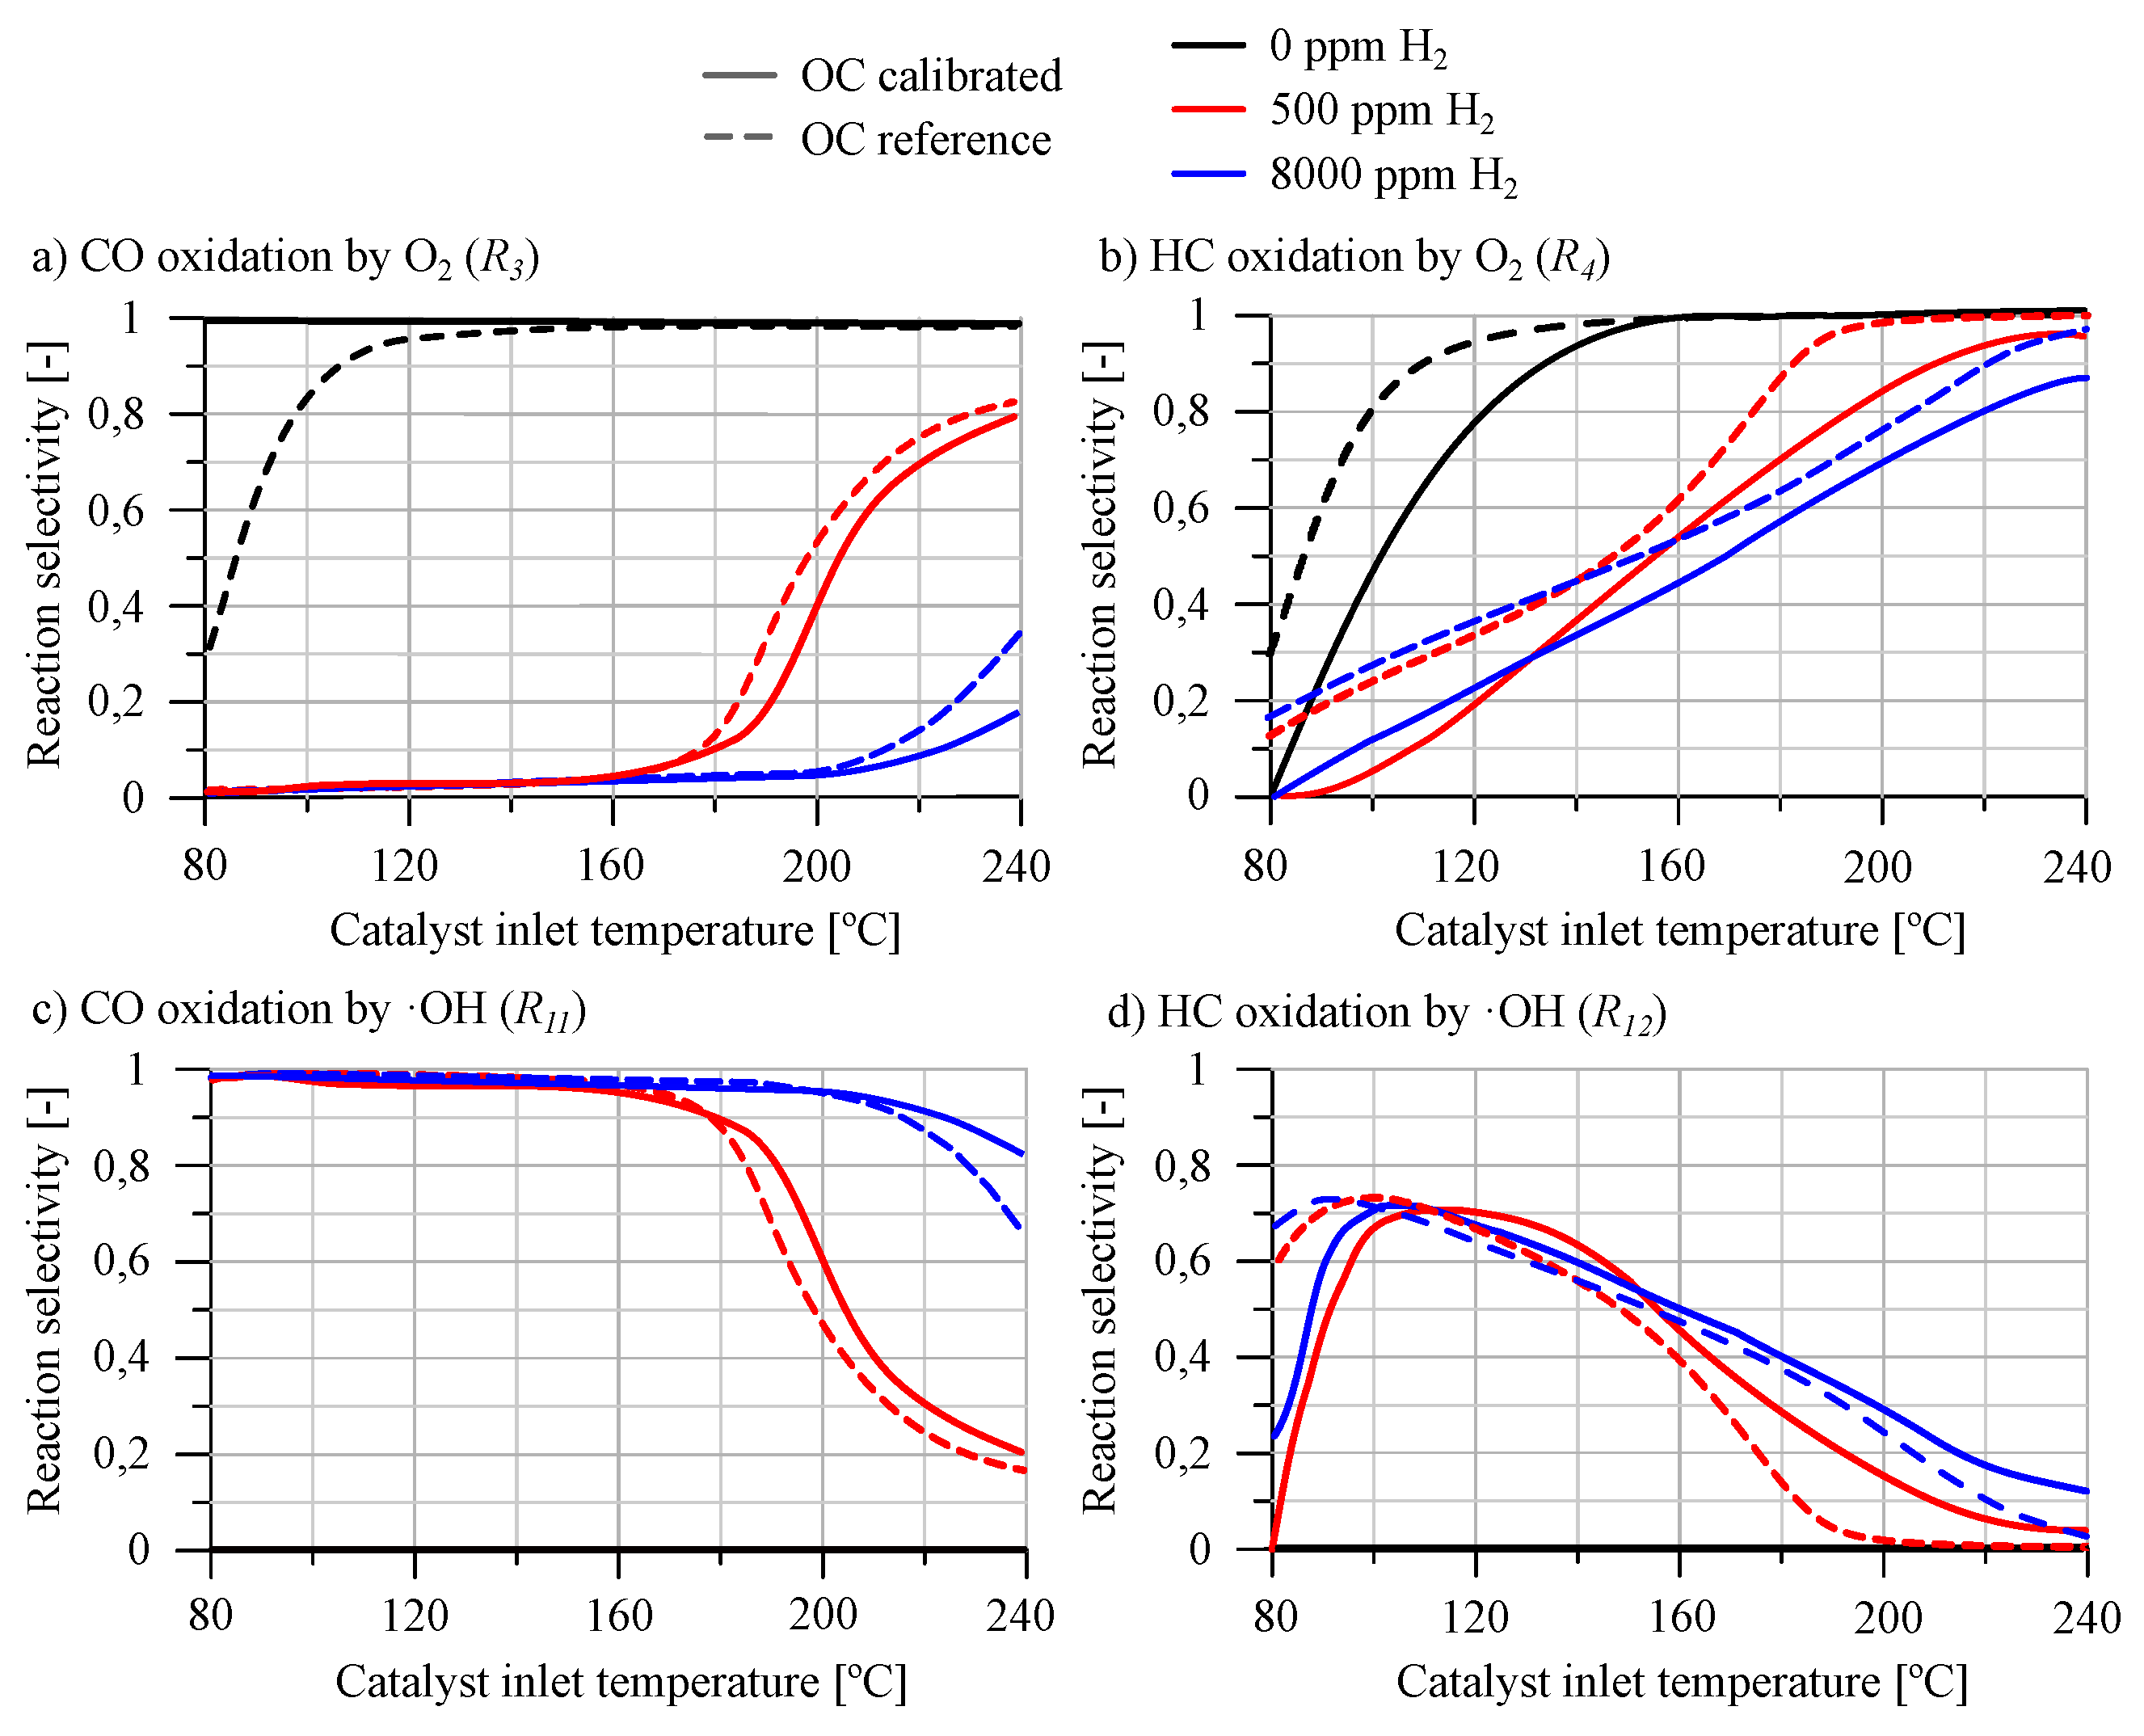
Results of the second part of the calibration are shown in Figure 3, which compares the selectivities for CO and HC oxidation via O 2 or ·OH with those reported by Piqueras et al. [31]. The analysis revealed that the presence of H 2 in the exhaust gases yields a closely aligned response between the selectivity of the simulation and the reference.
For CO reactivity, as depicted in Figure 3a,c, the model exhibited a high degree of consistency with the reference data in terms of selectivity. The selectivity towards ·OH, shown in Figure 3c, indicated that at temperatures below 160   C for low H 2 concentrations and below 200   C for high H 2 concentrations, the selectivity was predominantly one, suggesting a preferred pathway. This trend is consistent in both the reference case and the results obtained by the model, with the selectivity being zero in the absence of H 2 , indicating that this pathway does not occur in these conditions. Above these temperature thresholds, introducing H 2 led to a decrease in CO selectivity from ·OH to the O 2 oxidation pathway.
Regarding the selectivity of HC oxidation, as depicted in Figure 3b,d, it showed the same type of trend as observed with CO upon the introduction of H 2 . However, it did not reach the selectivity levels for the ·OH pathway observed in CO. The influence of H 2 on HC conversion is weaker at low temperatures. While selectivity of ·OH pathway decreases with lower temperature, this decrease is more gradual and less affected by H 2 concentration than for CO. Notably, the presence of adsorption reactions, which are significant under low-temperature conditions, means that the sum of selectivities at low temperatures for oxidation reactions does not total one, indicating that adsorption is an important reaction pathway at low temperature, especially in the absence of H 2 .
As a result of this calibration, the kinetic constants collected in Table A3 - Appendix B were obtained. These constants include the activation energies and pre-exponential factors of the reactions involved and the accumulation capacity of HC and ·OH in the catalyst.
Following the calibration of the model to assess environmental changes and the reaction pathways of CO and HC with O 2 and H 2 , these subsections examine the influence of H 2 presence on the CO and HC conversion efficiency in both cold altitude and warm sea level conditions. The analysis involved simulating specific experimental conditions described in Section 2.1, which were also employed in the first calibration phase of the model. These simulations incorporated varying mole fractions of H 2 , namely 500, 1000, 5000, and 10000 ppm, in the gas mixture at the inlet of the OC.

3.2. CO Reactivity Analysis

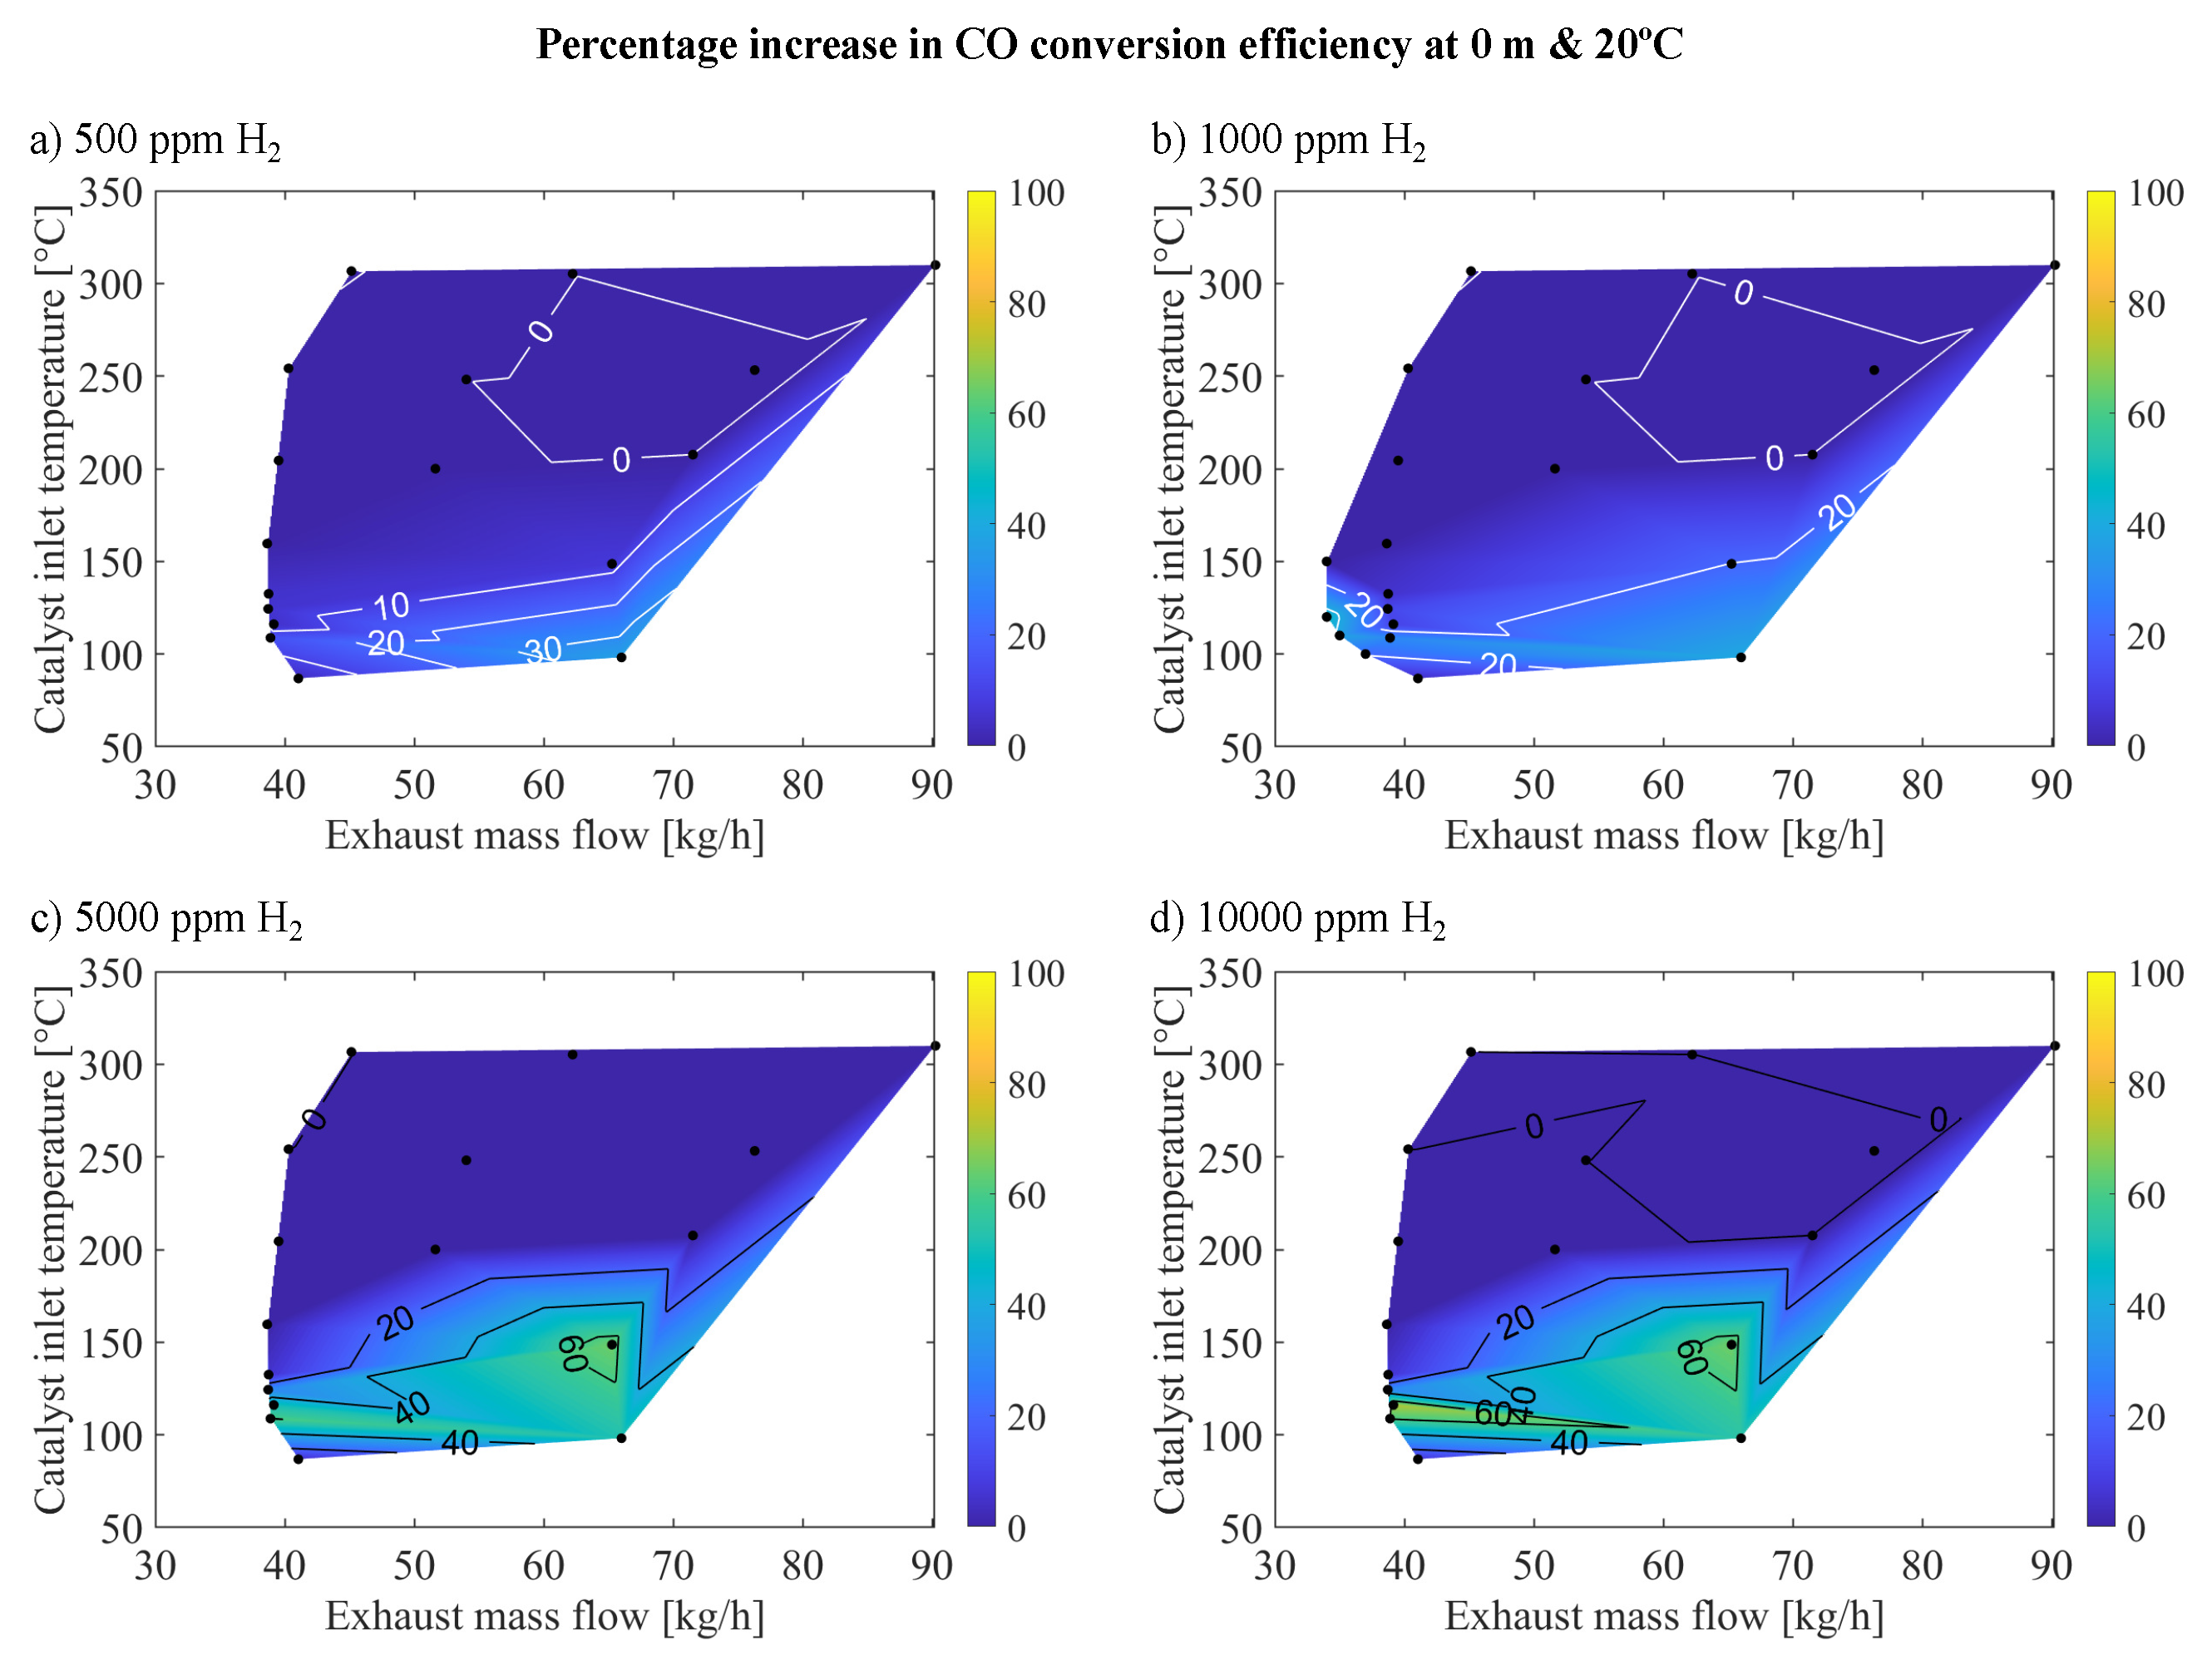
For the CO case, Figure 4 shows the percentage increase in CO conversion efficiency relative to the baseline results shown in Figure 2a under warm-sea level conditions, as a function of exhaust mass flow and catalyst inlet temperature. This analysis encompasses the introduction of 500, 1000, 5000, and 10000 ppm of H 2 into the catalyst inlet gas, as detailed in Section 2.
The findings indicated an enhancement in CO reactivity with increasing molar fractions of H 2 , particularly evident within the low-temperature range under low flow conditions (around 100   C and 35-50 kg/h). This effect extended to higher temperatures as conditions transitioned to higher flow rates (around 150   C with 60-70 kg/h). The improvement in conversion efficiency was most pronounced in the operating points with notably low conversion efficiency in the absence of H 2 . These points were characterized by elevated CO concentrations and temperatures insufficient to facilitate oxidation reactions with O 2 , as shown in Table A1 in Appendix A.
The improvement in CO conversion efficiency consistently increased up to the introduction of 5000 ppm of H 2 , resulting in a significant improvement of over 60% at approximately 150   C and an exhaust mass flow of 65 kg/h. This substantial increase differed from the 20% improvement observed at 1000 ppm of H 2 and less than 10% improvement at 500 ppm of H 2 , accompanied by an expansion of the enhanced region to higher temperatures. However, the addition of 10000 ppm of H 2 did not lead to a discernible improvement in reactivity beyond that achieved with 5000 ppm of H 2 , with the enhancement stabilized at 60%. This trend indicated a saturation point beyond which further increases in H 2 concentration did not significantly impact reactivity.
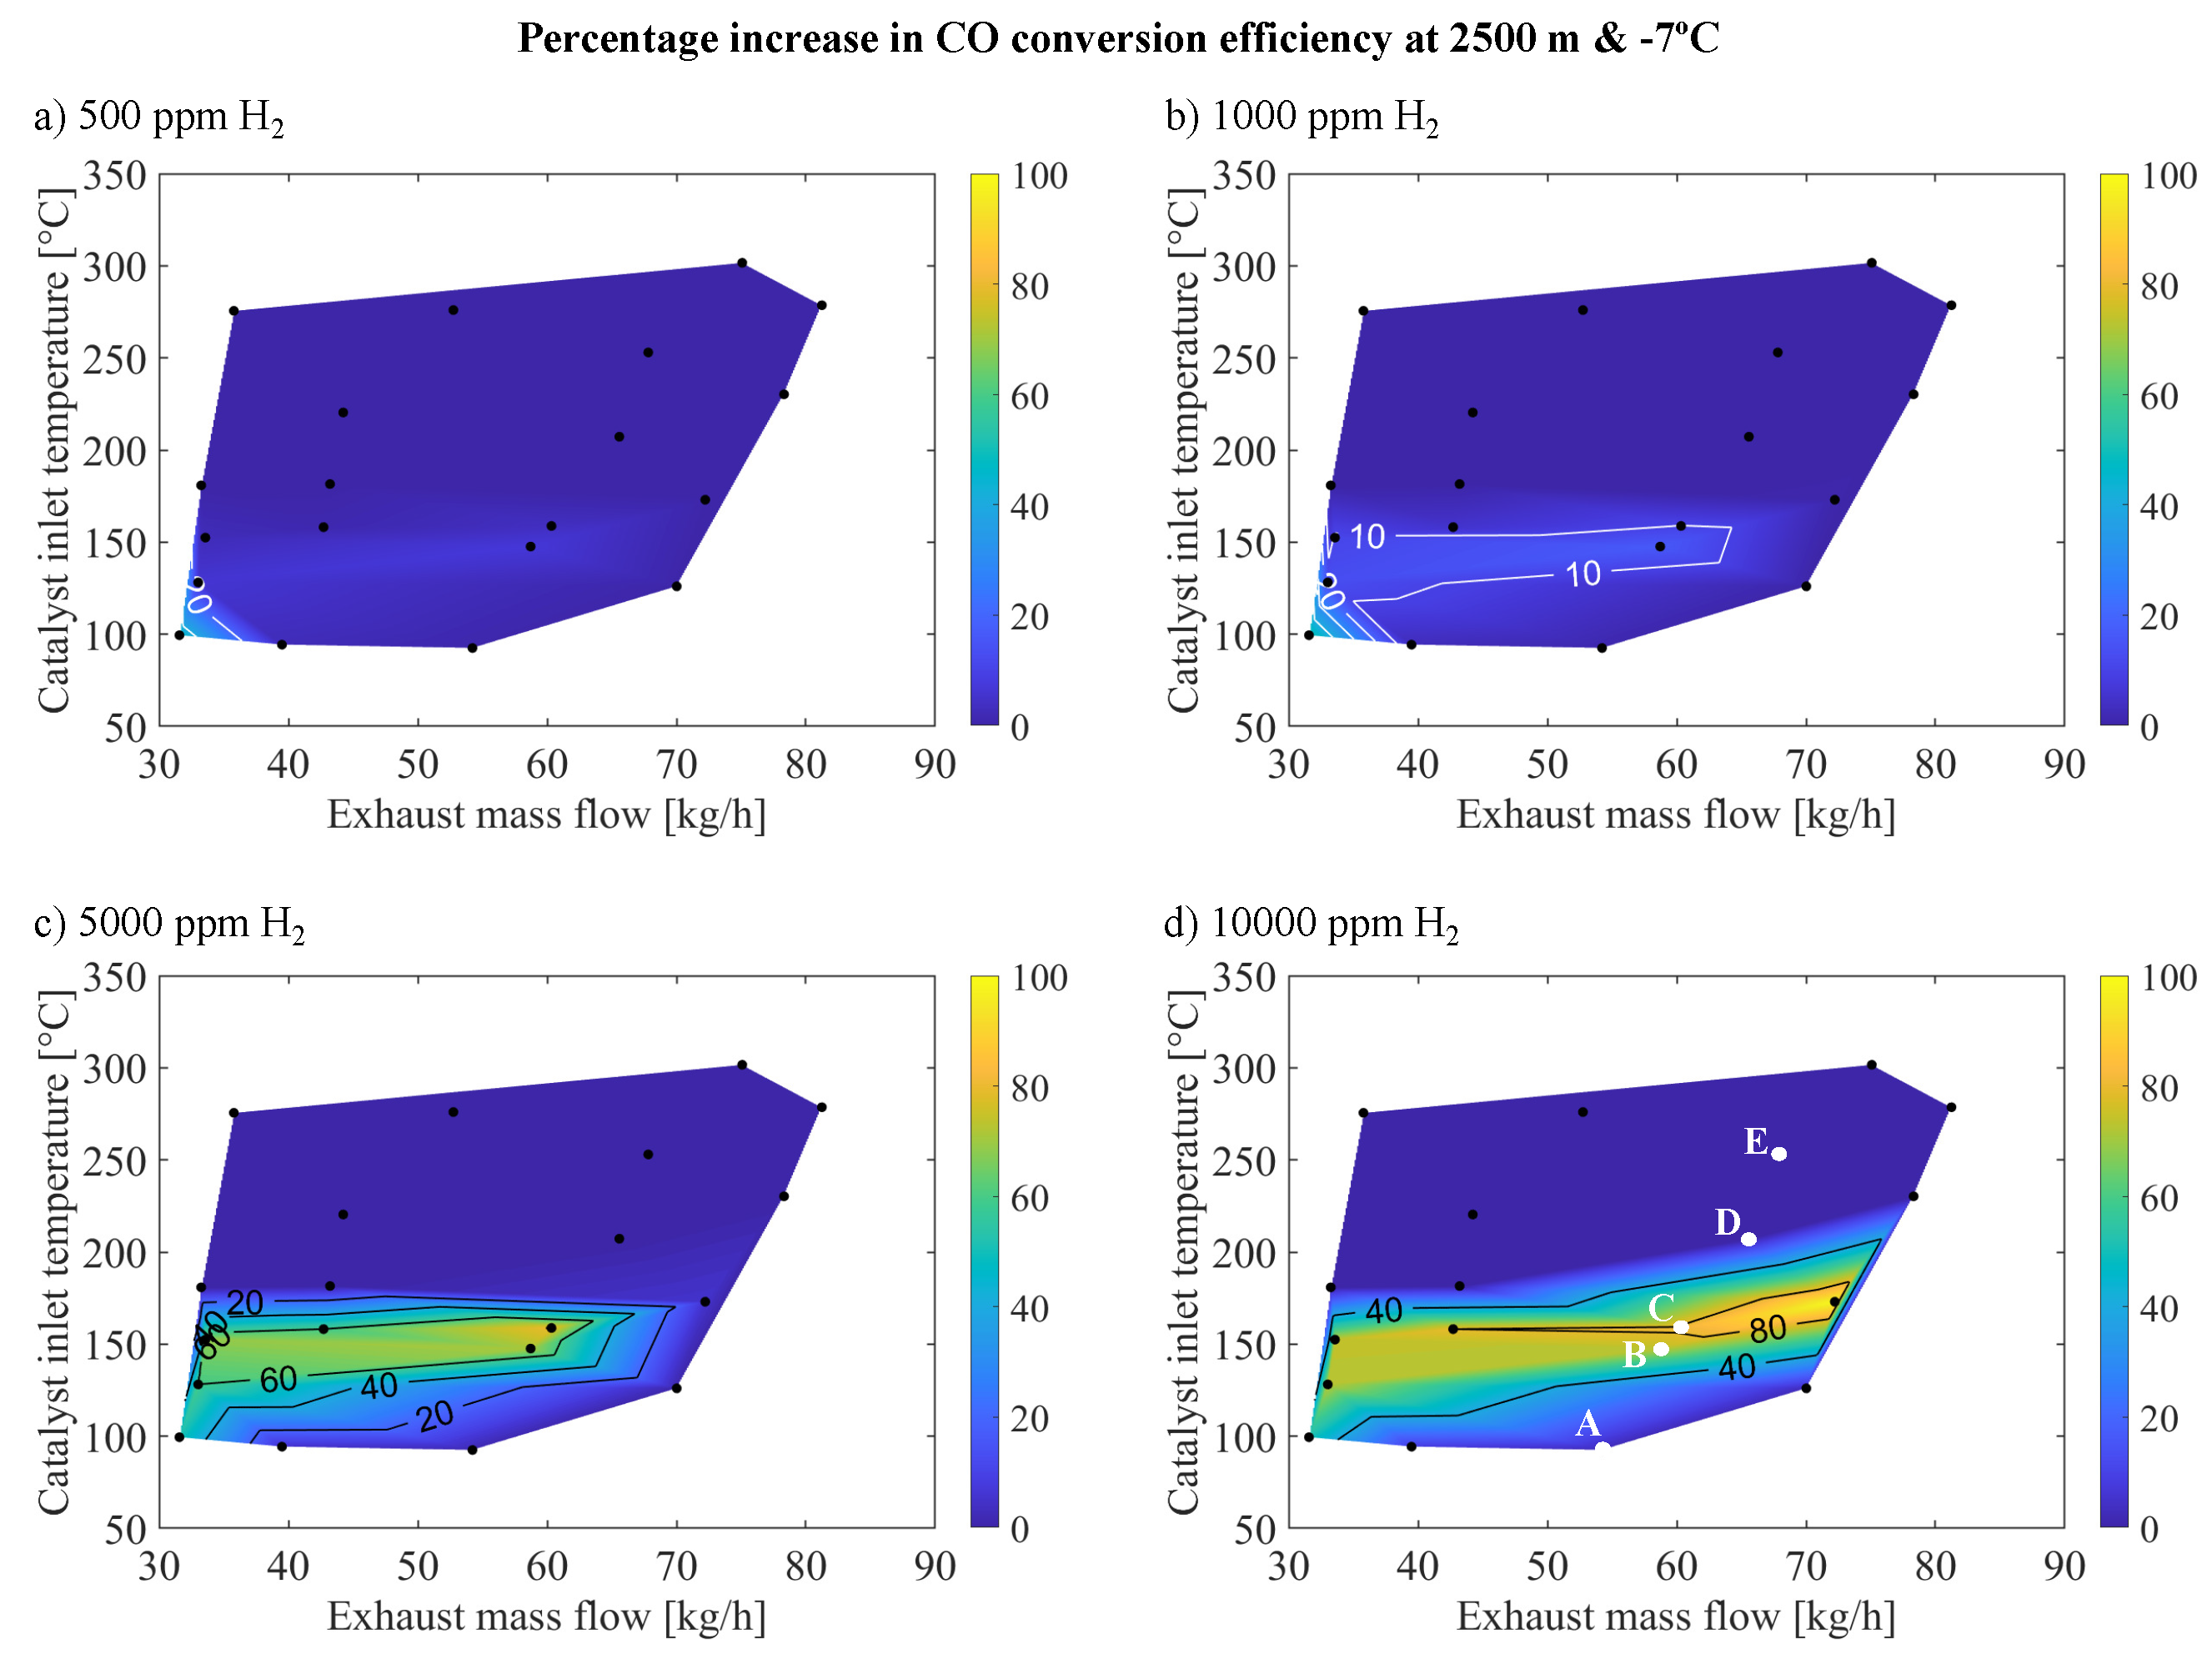
The effect of introducing H 2 on improving CO conversion efficiency was also observed under cold altitude conditions. Figure 5 shows the percentage increase in CO conversion efficiency relative to baseline results shown in Figure 2c, considering cold altitude scenarios as influenced by exhaust mass flow and catalyst inlet temperature. Similar to the previous scenario, the same molar fractions of H 2 were introduced into the catalyst inlet gas: 500 ppm, 1000 ppm, 5000 ppm, and 10000 ppm. An enhancement band was observed at 150   C in the low-to-mid mass flow range (30-60 kg/h) for the cases of 1000, 5000 and 10000 ppm of H 2 . Introducing 10000 ppm H 2 further extends this band to the highest mass flow rates (70-80 kg/h). This differs from the warm sea-level case, where enhancement occurred at lower temperatures and mass flows (around 100   C and 35-50 kg/h) and at 150   C within the mid-mass flow region with high H 2 molar fractions.
This difference in the increase of CO conversion efficiency profiles was primarily attributed to high CO raw concentration in cold altitude conditions (see Table A2 in Appendix A). This limited the effectiveness of H 2 in enhancing CO reactivity. At lower molar fractions of H 2 , such as 500 ppm, the enhancement in conversion efficiency was minimal and limited to regions with low exhaust mass flow and temperature, where the concentration of CO and inhibition was reduced. However, as H 2 molar fraction increased, the enhancement region became more distinct and shifted towards higher exhaust mass flows, highlighting the role of the ·OH reaction pathway and the decrease in inhibition caused by CO consumption. Higher H 2 molar fractions made this effect increasingly apparent. Unlike warm-sea level conditions, high molar fractions of H 2 did not lead to saturation effects in cold altitude conditions in every operating point due to the inherently lower initial reactivity of the catalyst in the absence of H 2 . Therefore, significantly greater reactivity was observed when H 2 molar fraction was increased from 5000 to 10000 ppm, especially in areas of high mass flow, which were highly affected by inhibition.
To elucidate the improvement in CO reactivity observed in the regions depicted in Figure 4 and Figure 5 and to understand the variability in the response to H 2 introduction across different operating points. The analysis was initiated by assessing the axial distribution of conversion efficiency throughout the catalyst. This involved identifying the cross-sectional areas of the OC that exhibit the highest reactivity at each operating point, as well as those areas most affected by the introduction of H 2 . For this purpose, three sections along the length of the monolith have been selected. First, the catalyst inlet cross-section corresponds to 4.66 mm from the inlet of the monolith. Then, the middle cross-section was 69.99 mm, and the outlet cross-section was 135.34 mm. The study prioritizes the cold altitude case for a more detailed examination, given its more notable increase in reactivity attributed to higher levels of inhibition. Table 3 presents points A-E from Figure 5, representing different operating points of the region where a significant increase in reactivity is noted upon introducing H 2 in the inlet gas mixture, arranged in increasing order by inlet gas temperature and exhaust mass flow to the OC.
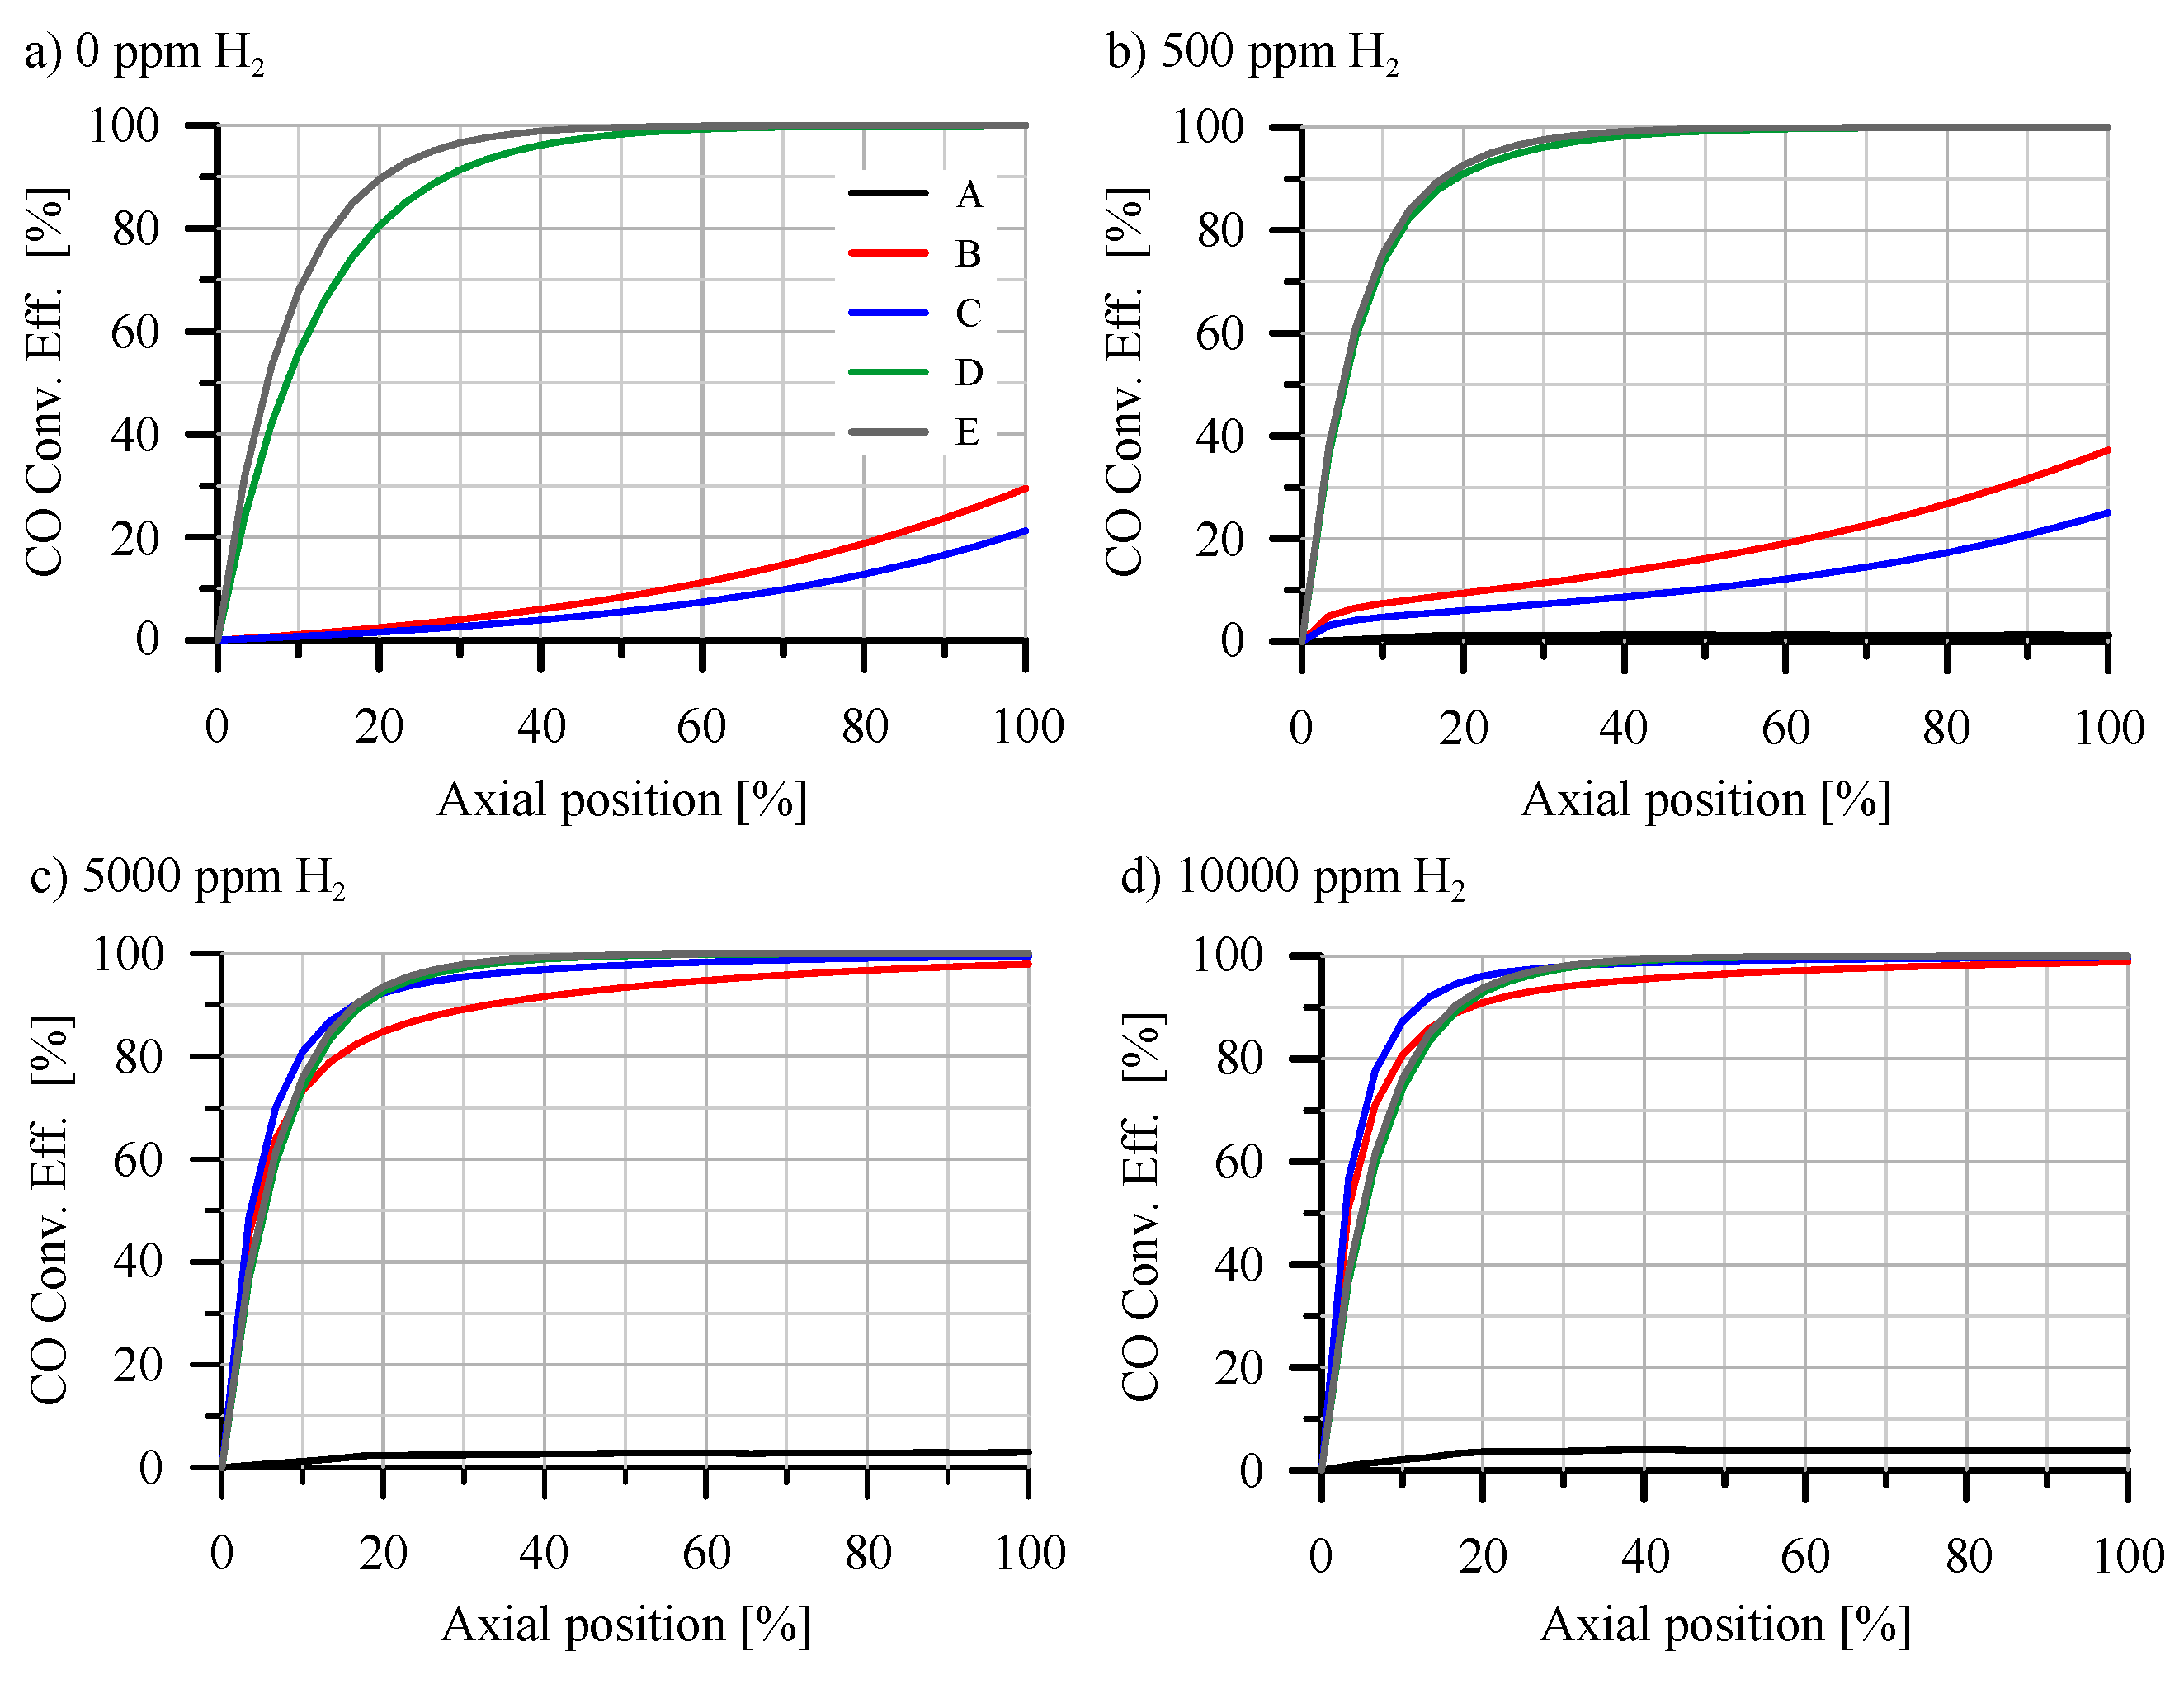
Thus, Figure 6 presents the axial distribution of CO conversion efficiency along the monolith length for points A-E as outlined in Table 3. Each subplot within this Figure corresponds to a different H 2 molar fraction in the catalyst inlet gas. The results for 0 ppm of H 2 shown in Figure 6a, revealed three distinct trends across the five operational points presented. At operating point A, no reactivity was observed across any section of the monolith due to the low inlet gas temperature (92.52   C) and very high CO molar fraction (1194 ppm), resulting in significant inhibition. Points B and C exhibited higher inlet gas temperatures and high CO molar fractions (616 ppm and 461 ppm, respectively) but were lower than point A, indicating OC inhibition. However, the temperature facilitated the reaction of CO with O 2 , resulting in heightened reactivity in the monolith cross-sections. As CO started to react at the inlet region of the monolith, its concentration decreased, thereby reducing inhibition in subsequent regions and enhancing overall reactivity along the monolith. In these scenarios, the entire length of the monolith contributed to the reaction, and an expanded catalyst volume would enhance CO conversion efficiency, contrasting with point A. Finally, points D and E, characterized by high inlet gas temperatures and low CO concentrations (with low inhibition), demonstrated conversion efficiencies near 100%, with most reactivity occurring at the inlet cross-section of the monolith.
Upon introducing 500 ppm of H 2 , as shown in Figure 6b, the conversion efficiency results were largely consistent with the 0 ppm of H 2 scenario, with only minor differences. Notably, at points B and C, there was a marginal increase in conversion efficiency in the initial cross-section of the monolith, which exhibited higher local conversion efficiency than subsequent sections. This indicated an enhanced conversion efficiency in the initial zone, attributed to new reaction pathways facilitated by the presence of H 2 , particularly through the formation of ·OH groups on the surface. At this relatively low H 2 concentration, the generation of these surface groups was limited, resulting in only a modest reactivity increase at the monolith inlet. Points D and E also experienced a boost in reactivity from the H 2 presence at the inlet, with point D showing slightly higher reactivity due to the additional H 2 , which offsets the lower inlet temperature. This resulted in better conversion efficiency for point D compared to point E, due to its lower inlet mass flow and longer residence time. However, since both points already achieved near 100% conversion efficiency, no significant improvement was noted in the conversion efficiency increase map (Figure 5a). For point A, the presence of H 2 fails to enhance conversion efficiency due to the inlet temperature being too low for reactivity through the new reaction pathway.
The enhancement effects were more pronounced when the H 2 molar fraction was increased to 5000 and 10000 ppm of H 2 , as illustrated in Figure 6c,d. At points B and C, the increase in reactivity resulting from the high molar fraction of H 2 led to greater availability of ·OH groups at the monolith inlet, consequently increasing the conversion efficiency to near 100% in these inlet regions. For operating points D and E, the enhanced reactivity improved conversion efficiency in the inlet region, but only marginally, as these points already face limitations due to mass transfer rather than reactivity. The superior reactivity of point C, coupled with its lower inlet flow, allows for higher residence time and conversion efficiency at the inlet compared to points D and E. Furthermore, the elevated availability of ·OH groups with this high H 2 concentration boosts the reactivity at the inlet for operating point A. However, this increase in conversion efficiency was modest due to the low temperature, which does not sufficiently reduce CO concentration to overcome inhibition. Consequently, despite this initial increase, the conversion efficiency throughout the rest of the monolith remained negligible due to the persistent inhibition and low gas temperature.
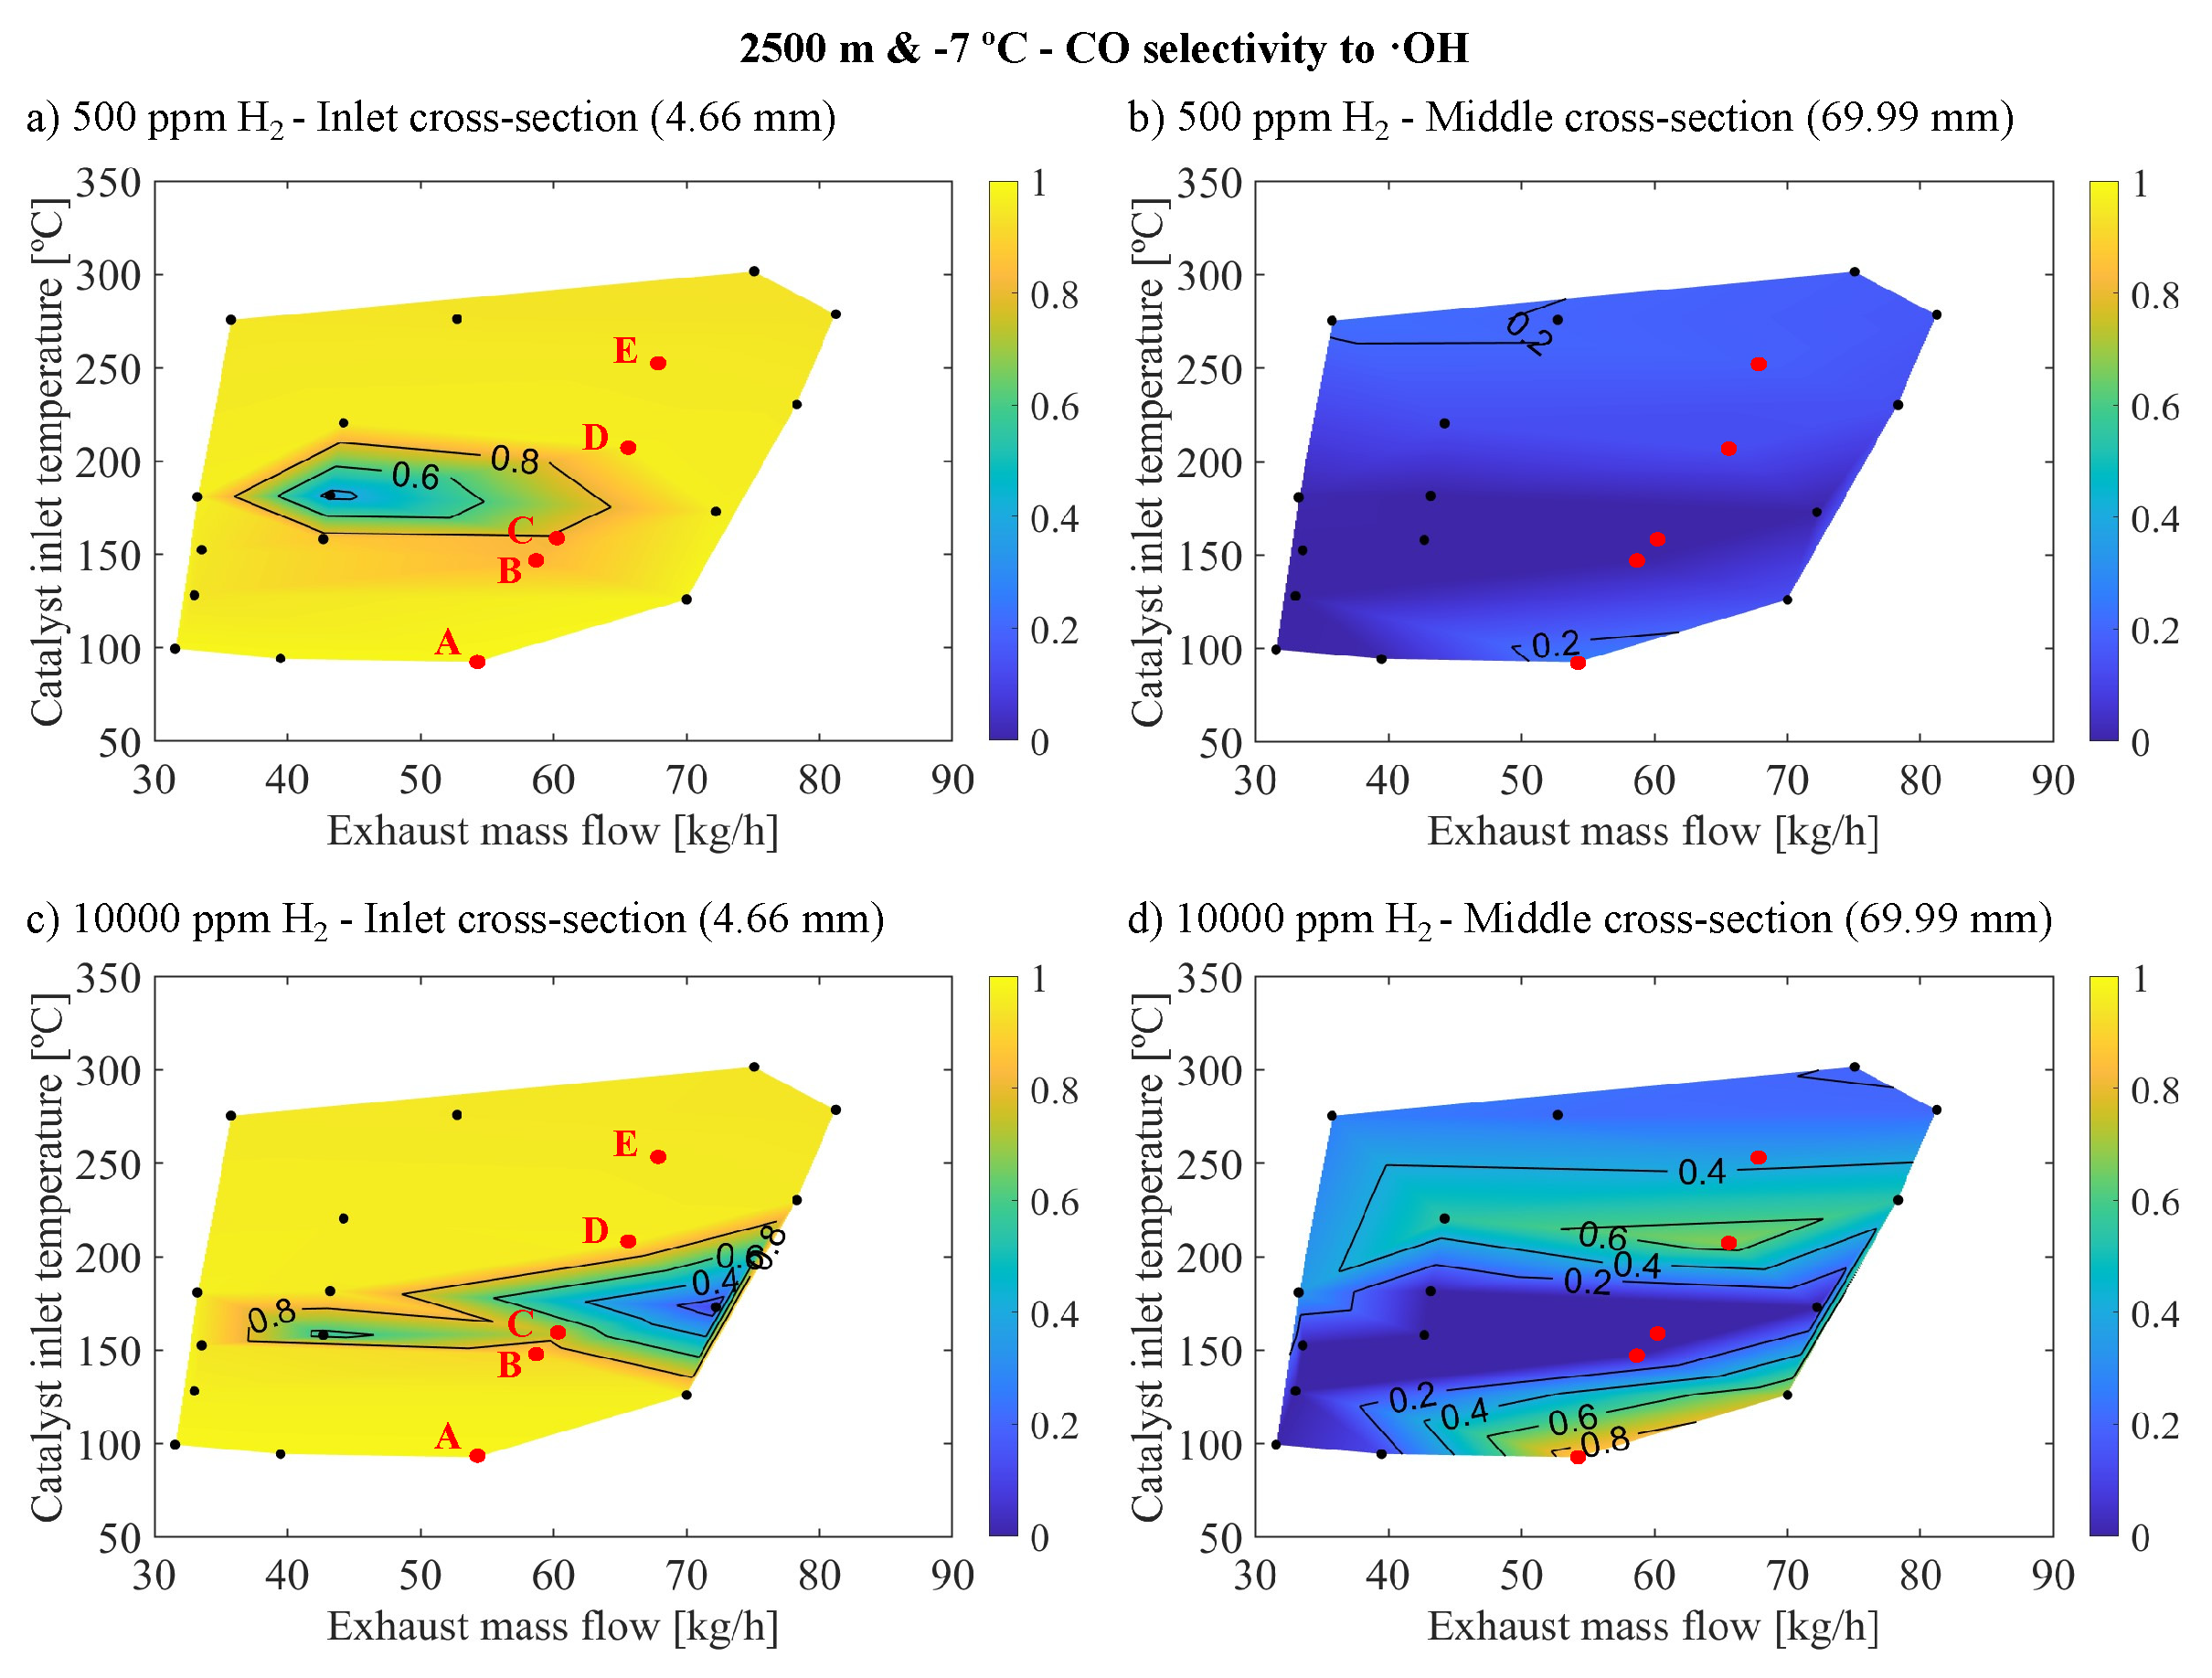
The findings depicted in Figure 6 demonstrated that H 2 predominantly influences the inlet cross-section of the monolith, with the observed variations in reactivity in subsequent sections resulting from alterations in CO concentration initiated in these inlet cross-sections. To understand why the impact of H 2 presence was primarily at the inlet of the monolith, it is crucial to examine the selectivity of CO reactions with O 2 and ·OH across different operating points and cross-sections of the monolith. Figure 7 illustrates the selectivity of CO towards ·OH in the context of cold altitude conditions with 500 ppm of H 2 (Figure 5a,b) and 10000 ppm of H 2 (Figure 5c,d), for the inlet and medium cross-sections of the monolith.
The reactivity of CO with ·OH varied significantly between the inlet and middle cross-sections. Notably, the selectivity towards CO with ·OH was considerably higher in the inlet cross-section of the monolith for 500 ppm and 10000 ppm of H 2 , approaching a value of 1 for most operating points, except in areas showing the most significant increases in conversion efficiency. This selectivity sharply declined along the monolith length, with much lower values in the middle cross-sections, reaching its peak at approximately 0.6 for 500 ppm of H 2 and 0.8 for 10000 ppm of H 2 introduced into the inlet gas. Interestingly, these peaks in selectivity occurred in regions with minimal increases in conversion efficiency. The areas of high selectivity in the middle cross-section aligned with areas of low temperature where there was no reactivity (point A) and, to a lesser degree, with areas of high temperature where conversion efficiency was already elevated without H 2 (points D and E). In both scenarios, reactivity in these areas remained low due to unfavourable conditions that avoid oxidation (point A) or oxidation has already occurred in the inlet cross-section, leaving no residual CO to react (points D and E). This selectivity pattern may seem counterintuitive since the areas with the most pronounced improvements in conversion efficiency, namely points B and C, upon H 2 introduction, appeared least affected by the CO with ·OH reaction pathway. Moreover, the selectivity for this reaction was more significant with 500 ppm of H 2 than with 10000 ppm since, in the latter case, the improvement is much more substantial, but the selectivity is significantly lower.
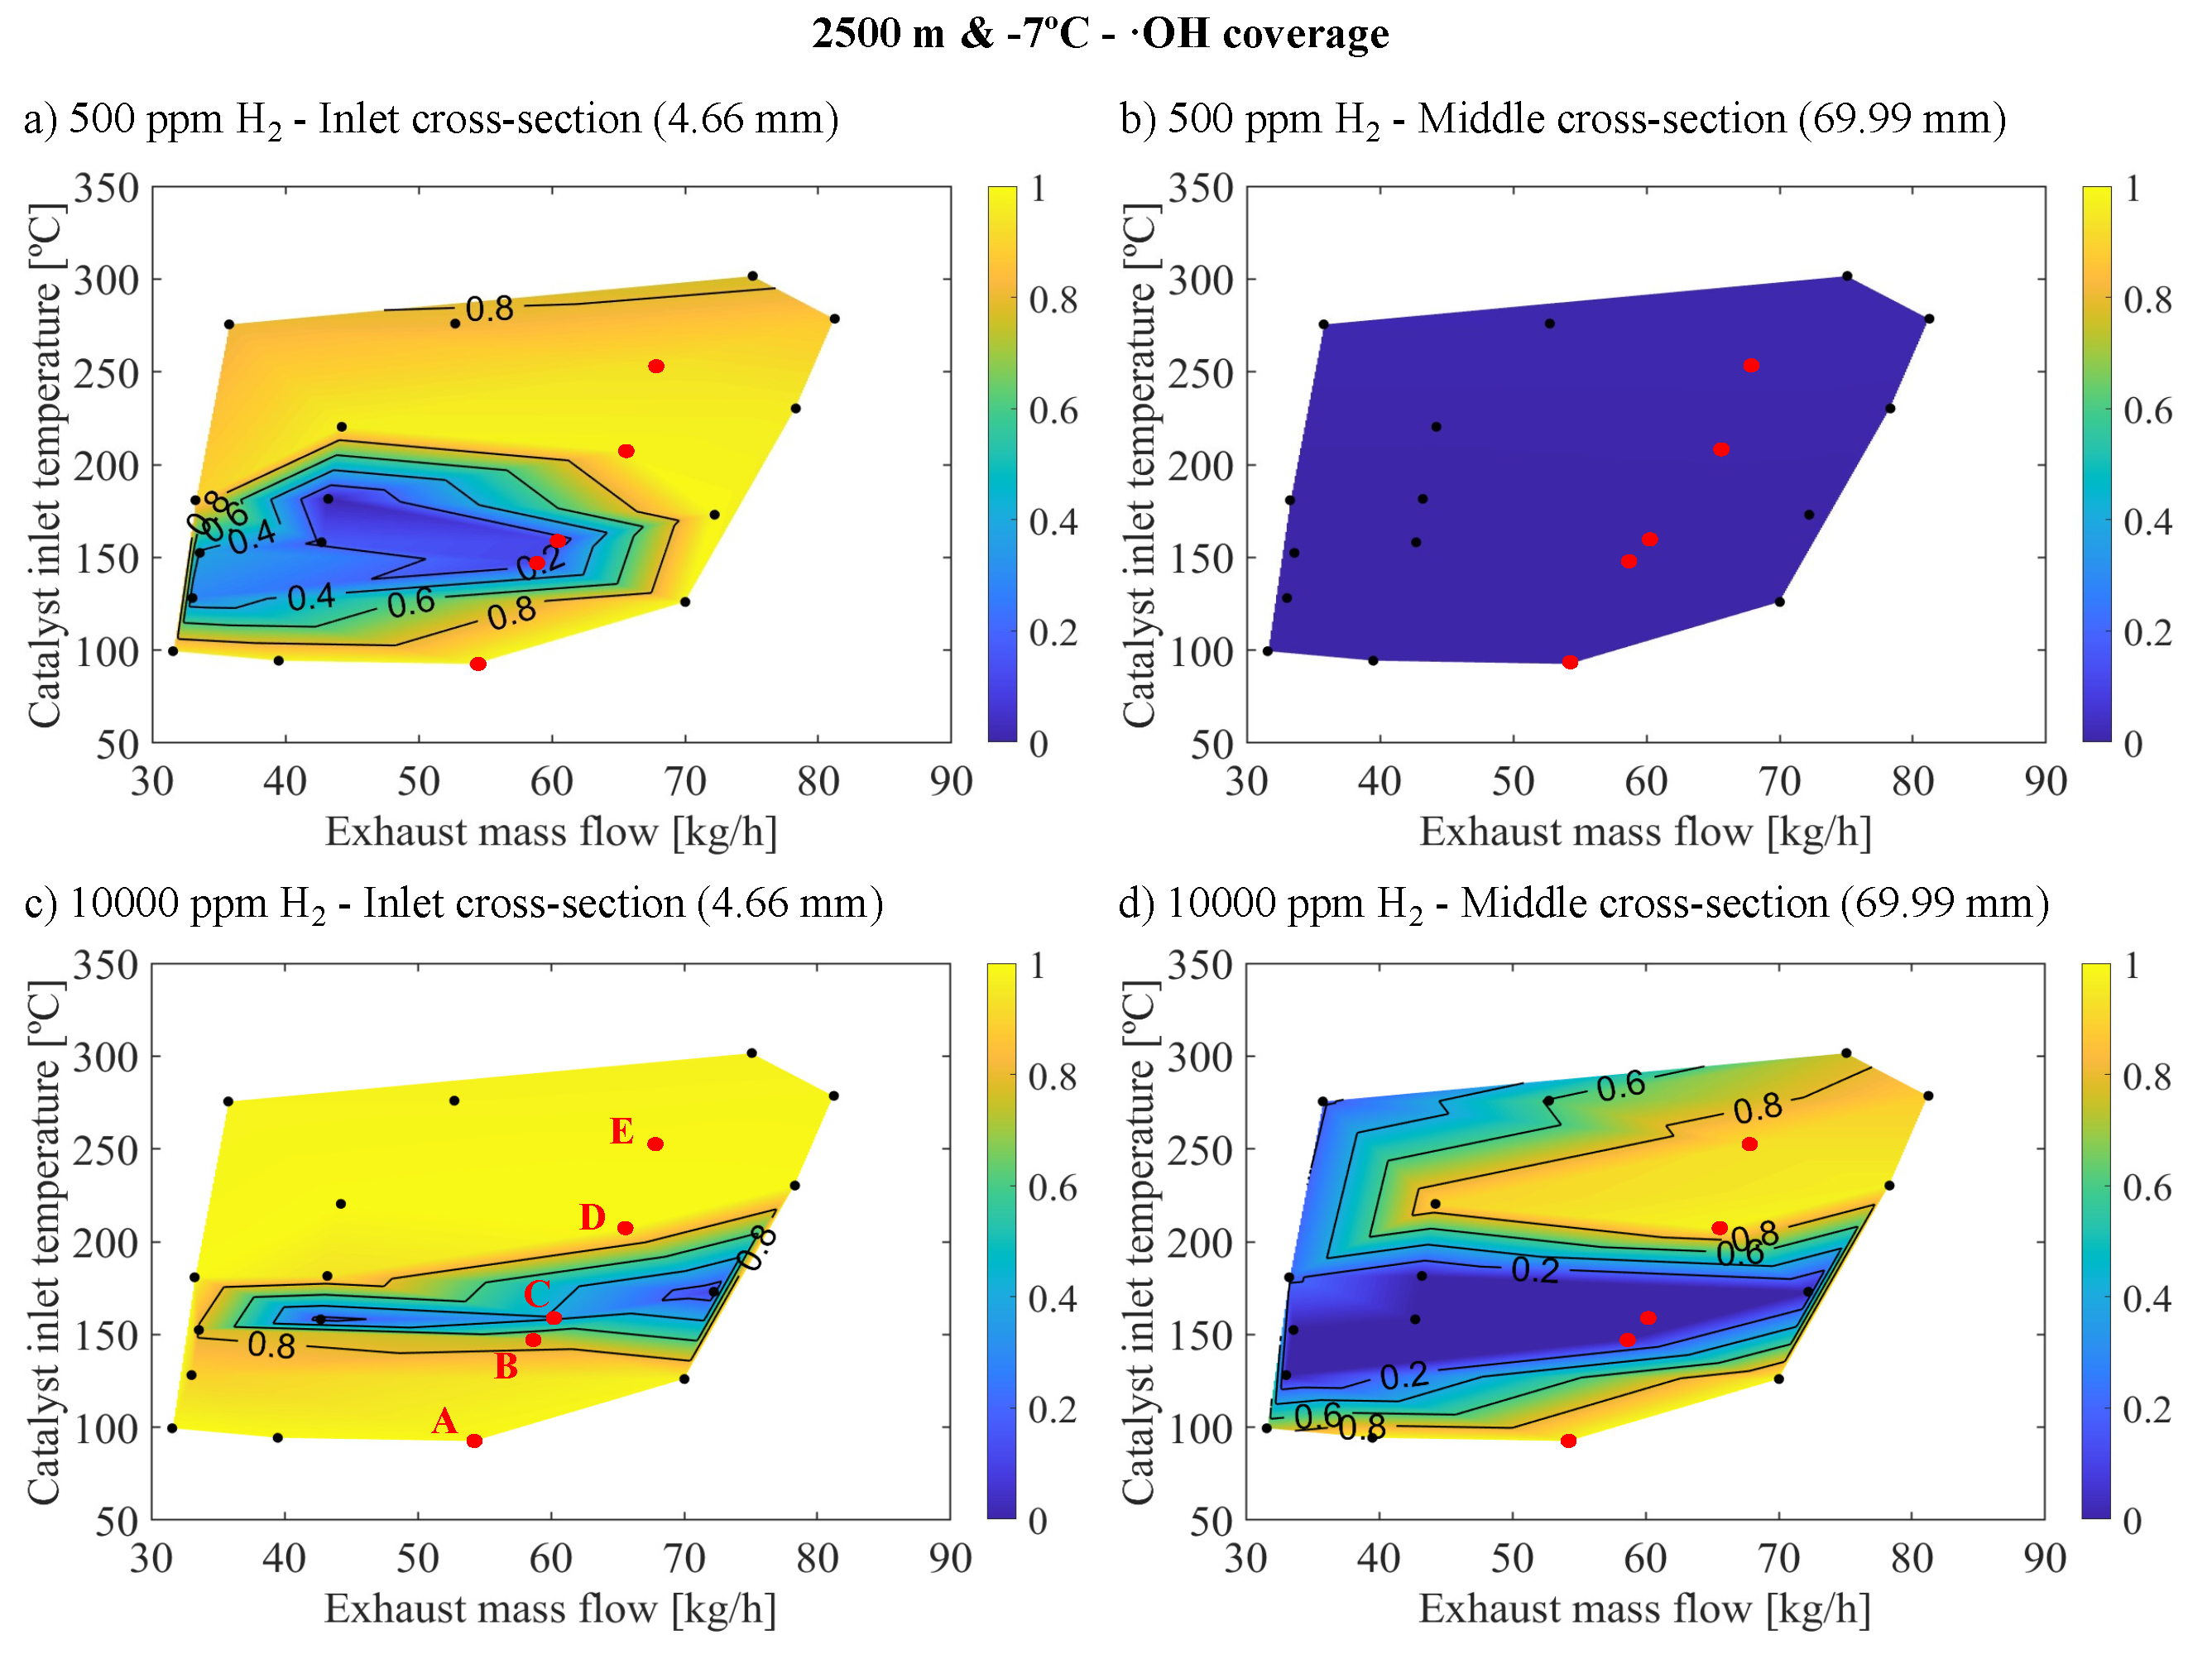
This seemingly contradictory behavior can be elucidated by examining the interplay between oxidation reactions and inhibition dynamics, alongside ·OH coverage, as demonstrated in Figure 8. This figure illustrates ·OH coverage at both 500 and 10000 ppm of O 2 , focusing on the inlet and middle cross-sections of the monolith under cold altitude conditions. At points D and E, the variation in CO concentration was less pronounced compared to points B and C, attributed to their lower initial CO concentrations. This facilitated the replacement of CO oxidation with O 2 by oxidation with ·OH, enabled by the relative abundance of H 2 , even at 500 ppm, which allowed for significant·OH coverage.
However, at points B and C, which had higher initial CO concentrations, the introduction of 500 ppm of O 2 enhanced CO reactivity via the ·OH pathway, as evidenced by observed increases in conversion efficiency and selectivity. Yet, this H 2 concentration was insufficient to sustain high ·OH coverages, limiting the reaction rate, particularly in the inlet cross-section as shown in Figure 8a, which is crucial for overall reactivity. With 10000 ppm of H 2 , the ability to generate and maintain ·OH coverage improved significantly in the inlet section (Figure 8c), leading to a substantial reduction in CO concentration and decreased inhibition, thus facilitating oxidation via the O 2 pathway. This resulted in high activity but low selectivity for the ·OH reaction.
After analyzing all cases, it was found that there is a significant correlation between the coverage of ·OH and selectivity, confirming that in operating points where conversion efficiency improved, most notably under altitude conditions, the reaction rate was constrained by the capability to stabilize ·OH coverage. This elucidates why no saturation in conversion efficiency enhancement was observed with higher H 2 molar fractions at altitude, as the increased H 2 molar fraction boosted the ·OH coverage in the most positively affected operating points. With 10000 ppm of H 2 , selectivity saturation had not been reached indicating a higher selectivity for reactions with O 2 but the reaction with ·OH effectively reduced CO enough to decrease inhibition, thereby enabling reactivity with O 2 and achieving conversion efficiency saturation.
Moreover, at the highest temperature points, ·OH coverage neared saturation at the inlet (approaching saturation in intermediate regions) due to diminished reactivity from lower CO concentrations at the inlet. These areas did not benefit from further H 2 introduction. Conversely, low-temperature regions also reached ·OH saturation, but the prevailing temperatures were too low for significant reactivity, hence not benefiting from increased H 2 concentration. Therefore, it is evident that certain operating points do not gain from H 2 introduction, whereas those that do require higher H 2 molar fractions for cold altitude conditions compared to warm sea level conditions. This is mainly due to the higher CO concentrations in these conditions necessitating higher H 2 mole fractions to stabilize sufficient ·OH coverage to guarantee the elimination of CO in this way. Notably, ·OH coverages decrease abruptly along the channel in the axial direction, indicating that the presence of H 2 primarily enhances reactivity in the inlet sections. This localized improvement is partially attributable to the reduction in the inhibition of oxidation with O 2 . Furthermore, this reduction in inhibition is the principal factor behind the reactivity enhancement in downstream regions, as evidenced by the low selectivity of the ·OH reaction pathway (Figure 7b,d), which is a consequence of the limited ·OH coverage (Figure 8b,d).

3.3. HC Reactivity Analysis

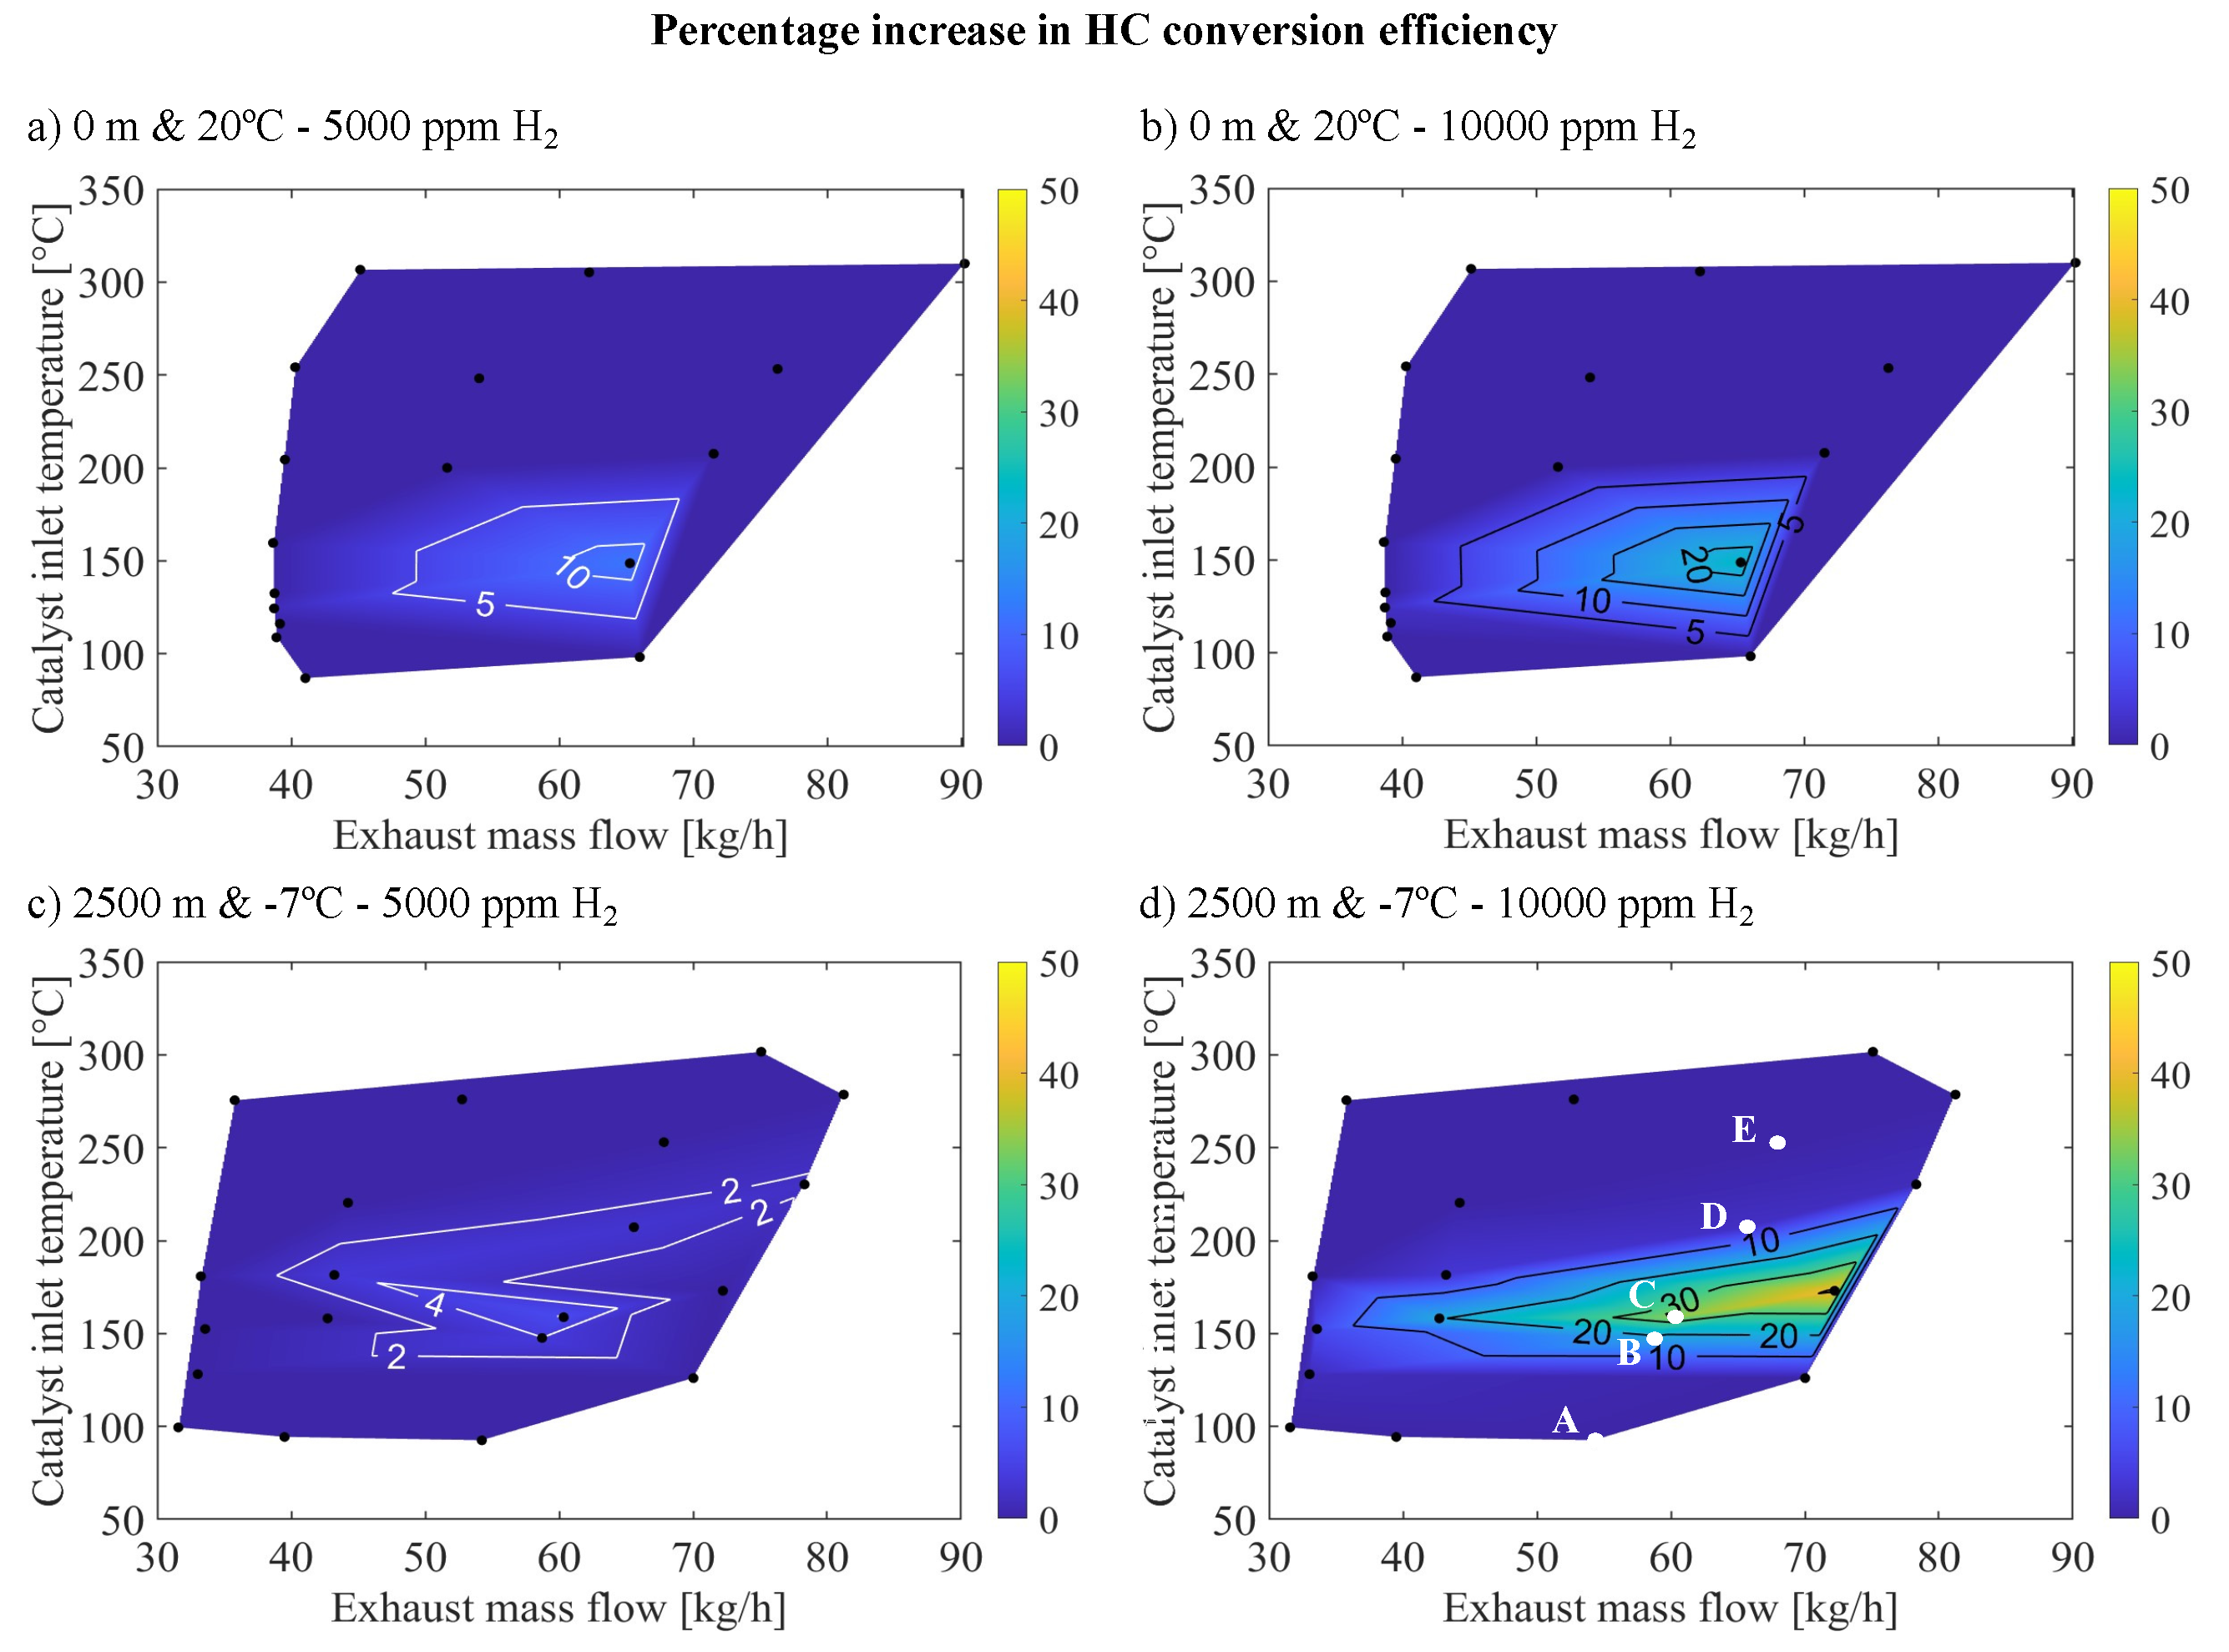
In the analysis of the impact of H 2 on HC reactivity, Figure 9 shows an improvement in HC conversion efficiency under warm sea-level and cold altitude scenarios. This figure illustrates the percentage increase in HC conversion efficiency based on the mass flow rate of exhaust gas and the inlet temperature to the OC, particularly at high molar fractions of H 2 (5000 and 10000 ppm) in the exhaust gas for warm-sea level and cold altitude cases. It is observed that the most significant enhancements in HC conversion efficiency induced by H 2 corresponded with the conditions that are also most affected by H 2 in terms of CO conversion efficiency, specifically at temperatures around 140   C - 150   C and an exhaust mass flow of 60 to 65 kg/h. However, in the case of HC, this improvement was less significant, as it aligned with zones where adsorption by reaction R 1 from Table 2 was dominant in the absence of H 2 . In this area, oxidation with O 2 by reaction R 4 was not yet significant, but already showed moderate HC conversion efficiencies, as shown in Figure 2b,d.
Moreover, introducing H 2 gradually increased reactivity under warm sea-level environmental conditions as the concentration of H 2 rises. This was manifested by the fact that introducing 5000 ppm H 2 (Figure 9a) led to maximum improvements of around 10% while introducing 10000 ppm of H 2 resulted in a maximum improvement exceeding 20%. On the other hand, in cold altitude conditions, a significant enhancement in reactivity only occurred with the introduction of 10000 ppm of H 2 , as shown in Figure 9d, with conversion efficiency improvements exceeding 30% at point B, whereas introducing 5000 ppm (Figure 9c) yields only minimal changes (maximum improvement of around 5%).
This phenomenon of improvement and the varying behavior between different altitude conditions can be attributed to two complementary factors. Firstly, increased reactivity was facilitated by the reaction pathway between HC and ·OH, following the reaction R 12 detailed in Table 2. Given the inherently lower reactivity of HC, significant coverage of · O H was required, requiring higher concentrations of H 2 . Secondly, greater efficiency in the CO conversion reaction reduced inhibition by this species, facilitating the oxidation of HC with O 2 [16].
In cold altitude conditions, as depicted in Figure 9c,d, an improvement in reactivity only occurred in the presence of 10000 ppm of H 2 . Under these conditions, ·OH coverage reached significant levels at the catalyst inlet, as illustrated in Figure 8c, indicating an excess of this intermediary that facilitates the R 4 reaction. Less notably, this phenomenon also occurred at warm-sea level, where HC reactivity increased more gradually because lower amounts of CO at the catalyst inlet required less H 2 to stabilize the necessary ·OH groups.
Finally, the fact that the improvement in the efficiency of the HC reaction was more moderate compared to that of CO is because not only an increase in reactivity but also a change in the adsorption pathway is taking place ( R 1 ) to that of oxidation, both with ·OH ( R 14 ) and with O 2 ( R 4 ) (the latter due to the reduction in inhibition). This replacement of one reaction pathway by another was reflected in the global selectivity (integrated across all conditions) of the R 1 reaction, depicted in Figure 10 for warm sea-level conditions with 0 ppm of H 2 (plot a) and with 10000 ppm of H 2 (plot b), and for cold altitude conditions with 0 ppm of H 2 (plot c) and with 10000 ppm of H 2 (plot d).
The analysis of Figure 10 showed a decrease in the selectivity for adsorption in HC upon the introduction of H 2 , with this reaction accounting for 100% of the reactivity when H 2 is not introduced in regions where improvements occur upon its introduction, and also in colder regions. However, this reaction becomes irrelevant for both environmental conditions once the light-off temperature for the R 4 reaction is reached. When 10000 ppm of H 2 was introduced, the selectivity for the R 1 reaction significantly decreased in the area with temperatures around 140 - 150   C and exhaust mass flow of 60 to 65 kg/h, falling from 100% with 0 ppm of H 2 in both environmental conditions to 2% with 10000 ppm of H 2 for the warm sea-level case and to 39% for the cold altitude case. This replacement of one reaction pathway by another is the most significant phenomenon related to the effect of H 2 on the reactivity of HC in these conditions, not implying a particularly relevant change in the overall conversion efficiency of the HC into the OC.
4. Conclusions

In this work, the reactivity of an OC in the presence of H 2 under high altitude and low-temperature conditions has been investigated. Employing a combined approach utilizing both experimental and modeling techniques, the research extended the reaction mechanism to include alternative oxidation pathways based on the formation of ·OH at the active sites of the catalyst. This reaction mechanism was incorporated into a dual-layer washcoat catalyst model to assess the impact of varying H 2 molar fractions on CO and HC reactivity. The robustness of the model was validated against experimental data, accurately reflecting CO and HC conversion efficiencies across various environmental conditions. Introducing H 2 notably enhanced CO conversion efficiencies, especially at specific temperature ranges in different conditions. At sea level, an optimal H 2 concentration of 5000 ppm was identified, beyond which no further benefits were observed. However, in cold altitude conditions, improvements were evident even with 10000 ppm of H 2 . Detailed analysis revealed that the greatest enhancement in reactivity due to H 2 occurred in the inlet regions of the monolith, primarily attributed to reactions with ·OH groups. Additionally, a significant portion of the reactivity comes from the O 2 pathway, facilitated by the reduction in CO concentration resulting from the ·OH pathway. In the case of HC, the lower selectivity of ·OH for this species, combined with its higher reactivity at low temperatures, results in a less pronounced improvement in HC conversion efficiency upon introducing H 2 . This improvement also necessitates higher H 2 molar fractions at the inlet.
Consequently, the impact of H 2 concentration on conversion efficiency is closely related to operational and environmental factors. Extremely low-temperature points, below 100   C, do not see benefits from H 2 -induced reactivity enhancement. However, points with higher temperatures and moderate CO concentrations do benefit, with warmer sea-level conditions requiring lower H 2 molar fractions compared to colder altitude conditions. Thus, it’s advisable to adjust H 2 levels in the exhaust based on operating conditions and altitude, avoiding its presence in low-temperature conditions where it’s ineffective and increasing it in colder altitudes compared to warmer sea-level conditions.

Author Contributions

Conceptualization, J.R.S. and P.P.; Methodology, P.P. and C.C.; Software, E.J.S. and C.C.; Formal analysis, P.P. and E.J.S.; Investigation, J.R.S., P.P., E.J.S. and C.C.; Resources, J.R.S.; Writing—original draft preparation, P.P., E.J.S. and C.C.; Writing—review and editing, J.R.S., P.P., E.J.S. and C.C.; Supervision, J.R.S. and P.P.; Project administration, J.R.S; Funding acquisition, J.R.S. All authors have read and agreed to the published version of the manuscript.

Funding

This research has been supported by Grant PID2020-114289RB-I00 funded by the Spanish Ministerio de Ciencia e Innovación, Agencia Estatal de Investigación (MCIN/AEI/10.13039/501100011033). Additionally, C. Conde thanks PhD funding from Universitat Politécnica de Valéncia through grant FPI-2022-S2-49099, which is supported by project CIPROM/2021/061 funded by Generalitat Valenciana.

Conflicts of Interest

The authors declare no conflict of interest.

Abbreviations

The following abbreviations are used in this manuscript:
Acronyms
1D One dimensional
ATS Aftertreatment system
ICE Internal Combustion Engine
MEDAS Multifunctional Efficient Dynamic Altitude Simulator
OC Oxidation Catalyst
RDE Real Driving Emissions
SCRf Wall-flow articulate Filter with Selective Catalytic Reduction
WLTC Worldwide Harmonized Light vehicle & Test Cycle
WLTP Worldwide Harmonized Light vehicle Test Procedure
Latin Letters
b Constant in concentration solution
c Concentration
C e f f Conversion efficiency
d Constant in concentration solution
e Relative cumulative error
G o x Inhibition term
J Interfacial flux
k Arrhenius kinetic constant
K e q , N O x NOx interconversion reaction equilibrium constant
K e q , w a t e r Water gas shift reaction equilibrium constant
R Reaction rate
S Selectivity
S s Specific surface
t Time
T Temperature
u Velocity
w c Washcoat
x Axial direction
Z e o l Zeolite
Greek letters
Δ Variation
ε Modulus of conversion efficiency error
Λ Contribution
Φ Objective function
ν Stoichiometric coefficient
τ Residence time
θ Surface coverage
ω Weight coefficient
Subscripts
a Axial
e x p Experimental
g gas
i Phase (g, w c 1 , w c 2 )
i n Inlet
H 2 Referred to second part of the calibration procedure
k Index
m o d Modeled
m Number of H atoms in HC species
n Number of C atoms in HC species
o u t Outlet
O 2 Referred to first part of the calibration procedure
p Chemical species
w Wall
w c Washcoat
Superscript
m Reaction order
t Time

Appendix A

This appendix includes the input data to the catalyst model for the environmental conditions studied: 0 m & 20   C in Table A1, and 2500 m & -7   C in Table A2.
Table A1. Input data for 0 m & 20   C.
Engine speed [rpm] OC inlet pressure [bar] Exhaust gas mass flow [kg/h] OC inlet temperature [   C] CO inlet molar fraction [ppm] HC inlet molar fraction [ppm]
1000 1.01 41.05 86.83 386 126
1000 1.00 38.89 108.74 343 159
1000 1.00 39.15 116.11 351 131
1000 1.00 38.72 124.39 317 157
1000 1.00 38.75 132.49 254 86
1000 1.01 38.64 159.60 270 137
1000 1.01 39.52 204.43 323 152
1000 1.01 40.29 254.16 473 164
1000 1.02 45.14 306.65 370 113
1250 1.01 51.63 200.02 402 205
1250 1.02 54.02 248.16 536 194
1250 1.03 62.23 305.23 570 141
1475 1.04 65.27 148.69 566 246
1500 1.02 66.00 98.17 649 282
1500 1.03 71.52 207.60 533 210
1500 1.04 76.29 253.22 595 190
1500 1.05 90.25 309.95 367 81
Table A2. Input data for 2500 m & -7   C.
Engine speed [rpm] OC inlet pressure [bar] Exhaust gas mass flow [kg/h] OC inlet temperature [   C] CO inlet molar fraction [ppm] HC inlet molar fraction [ppm]
1000 0.76 31.57 99.46 914 512
1000 0.76 33.02 128.13 495 262
1000 0.75 33.57 152.44 423 258
1000 0.76 33.25 180.81 274 196
1000 0.77 35.78 275.54 286 181
1250 0.75 39.49 94.32 1169 836
1250 0.75 42.71 158.14 548 322
1250 0.76 43.22 181.54 411 253
1250 0.76 44.23 220.36 294 221
1250 0.76 52.74 275.96 202 124
1500 0.75 54.22 92.52 1194 838
1500 0.76 58.72 147.59 616 257
1500 0.76 60.33 158.77 461 268
1500 0.76 65.58 207.22 308 175
1500 0.76 67.81 252.96 222 97
1500 0.77 75.07 301.61 198 78
1750 0.76 70.01 125.98 946 468
1750 0.78 72.21 172.99 602 290
1750 0.78 78.31 230.25 384 217
1750 0.78 81.23 278.57 257 154

Appendix B

This appendix includes Table A3 with the pre-exponential factors and activation energies of the reactions from Table 2 obtained in the model calibration.
Table A3. Calibration parameters.
Reaction Pre-exponential factors [-] Activation energy [kJ/mol]
1 1.05· 10   2 0
2 2.98· 10   12 101000
3 2.48· 10   15 84800
4 7.31· 10   14 92000
5 6.55· 10   7 41000
6 9.67· 10   6 45600
7 6.09· 10   14 78400
8 6.09· 10   14 78400
9 5.00· 10   10 60000
10 1.01·10   8 81200
11 1.1· 10   15 71800
12 5.96· 10   13 71800
13 3.80· 10   9 88000
14 4.6· 10   8 107100
HC maximum capacity [mol/#] 5.0· 10   5
OH maximum capacity [mol/#] 5.0· 10   5

References

  1. Claßen, J.; Pischinger, S.; Krysmon, S.; Sterlepper, S.; Dorscheidt, F.; Doucet, M.; Reuber, C.; Görgen, M.; Scharf, J.; Nijs, M.; et al. Statistically supported real driving emission calibration: Using cycle generation to provide vehicle-specific and statistically representative test scenarios for Euro 7. International Journal of Engine Research 2020, 21, 1783–1799. [Google Scholar] [CrossRef]
  2. Ravi, S.S.; Osipov, S.; Turner, J.W. Impact of Modern Vehicular Technologies and Emission Regulations on Improving Global Air Quality. Atmosphere 2023, 14, 1164. [Google Scholar] [CrossRef]
  3. Tang, G.; Wang, S.; Du, B.; Cui, L.; Huang, Y.; Xiao, W. Study on pollutant emission characteristics of different types of diesel vehicles during actual road cold start. Science of The Total Environment 2022, 823, 153598. [Google Scholar] [CrossRef]
  4. Shahariar, G.H.; Sajjad, M.; Suara, K.A.; Jahirul, M.; Chu-Van, T.; Ristovski, Z.; Brown, R.J.; Bodisco, T.A. On-road CO2 and NOx emissions of a diesel vehicle in urban traffic. Transportation Research Part D: Transport and Environment 2022, 107, 103326. [Google Scholar] [CrossRef]
  5. Liu, J.; Li, Y.; Zhang, C.; Liu, Z. The effect of high altitude environment on diesel engine performance: Comparison of engine operations in Hangzhou, Kunming and Lhasa cities. Chemosphere 2022, 309, 136621. [Google Scholar] [CrossRef]
  6. Selleri, T.; Gioria, R.; Melas, A.D.; Giechaskiel, B.; Forloni, F.; Mendoza Villafuerte, P.; Demuynck, J.; Bosteels, D.; Wilkes, T.; Simons, O.; et al. Measuring Emissions from a Demonstrator Heavy-Duty Diesel Vehicle under Real-World Conditions—Moving Forward to Euro VII. Catalysts 2022, 12, 184. [Google Scholar] [CrossRef]
  7. Wang, Y.; Hao, C.; Ge, Y.; Hao, L.; Tan, J.; Wang, X.; Zhang, P.; Wang, Y.; Tian, W.; Lin, Z.; et al. Fuel consumption and emission performance from light-duty conventional/hybrid-electric vehicles over different cycles and real driving tests. Fuel 2020, 278, 118340. [Google Scholar] [CrossRef]
  8. EUR-Lex. Commission Regulation (EU) 2017/1151 of Supplementing Regulation (EC) No 715/2007 of the European Parliament and of the Council on Type-Approval of Motor Vehicles with Respect to Emissions from Light Passenger and Commercial Vehicles (Euro 5 and Euro 6) and on Access to Vehicle Repair and Maintenance Information, Amending Directive 2007/46/EC of the European Parliament and of the Council, Commission Regulation (EC) No 692/2008 and Commission Regulation (EU) No 1230/2012 and Repealing Commission Regulation (EC) No 692/2008., 2017. Accessed on February 14, 2024. 1 June.
  9. Commission, E. Questions and Answers: Commission proposal on the new Euro 7 standards. Available online:, 2022. Accessed on , 2024. 20 April.
  10. Commission, E. ; Directorate-General for Internal Market, Industry, E.; SMEs. Technical studies for the development of Euro 7 – Testing, pollutants and emission limits, 2022. [Google Scholar] [CrossRef]
  11. Liu, X.; Lara, R.; Dufresne, M.; Wu, L.; Zhang, X.; Wang, T.; Monge, M.; Reche, C.; Di Leo, A.; Lanzani, G.; et al. Variability of ambient air ammonia in urban Europe (Finland, France, Italy, Spain, and the UK). Environment International, 1085. [Google Scholar] [CrossRef]
  12. Giechaskiel, B.; Valverde, V.; Kontses, A.; Suarez-Bertoa, R.; Selleri, T.; Melas, A.; Otura, M.; Ferrarese, C.; Martini, G.; Balazs, A.; et al. Effect of extreme temperatures and driving conditions on gaseous pollutants of a Euro 6d-Temp gasoline vehicle. Atmosphere 2021, 12, 1011. [Google Scholar] [CrossRef]
  13. Luján, J.M.; Climent, H.; Ruiz, S.; Moratal, A. Influence of ambient temperature on diesel engine raw pollutants and fuel consumption in different driving cycles. International Journal of Engine Research 2019, 20, 877–888. [Google Scholar] [CrossRef]
  14. Bermúdez, V.; Serrano, J.R.; Piqueras, P.; Gómez, J.; Bender, S. Analysis of the role of altitude on diesel engine performance and emissions using an atmosphere simulator. International Journal of Engine Research 2017, 18, 105–117. [Google Scholar] [CrossRef]
  15. Suarez-Bertoa, R.; Valverde, V.; Pavlovic, J.; Clairotte, M.; Selleri, T.; Franco, V.; Kregar, Z.; Astorga, C. On-road emissions of Euro 6d-TEMP passenger cars on Alpine routes during the winter period. Environmental Science: Atmospheres 2021, 1, 125–139. [Google Scholar] [CrossRef]
  16. Serrano, J.R.; Piqueras, P.; Sanchis, E.J.; Diesel, B. Analysis of the driving altitude and ambient temperature impact on the conversion efficiency of oxidation catalysts. Applied Sciences 2021, 11, 1283. [Google Scholar] [CrossRef]
  17. Voltz, S.E.; Morgan, C.R.; Liederman, D.; Jacob, S.M. Kinetic Study of Carbon Monoxide and Propylene Oxidation on Platinum Catalysts. Industrial & Engineering Chemistry Product Research and Development 1973, 12, 294–301. [Google Scholar] [CrossRef]
  18. Oh, S.H.; Cavendish, J.C. Transients of Monolithic Catalytic Converters: Response to Step Changes in Feedstream Temperature as Related to Controlling Automobile Emissions. Industrial and Engineering Chemistry Product Research and Development 1982, 21. [Google Scholar] [CrossRef]
  19. Datye, A.K.; Votsmeier, M. Opportunities and challenges in the development of advanced materials for emission control catalysts. Nature Materials 2021, 20, 1049–1059. [Google Scholar] [CrossRef] [PubMed]
  20. Lefort, I.; Herreros, J.M.; Tsolakis, A. Reduction of Low Temperature Engine Pollutants by Understanding the Exhaust Species Interactions in a Diesel Oxidation Catalyst. Environmental Science & Technology 2014, 48, 2361–2367. [Google Scholar] [CrossRef]
  21. Pan, Y.; Xu, L.; Huang, L.; He, W.; Li, H.; Wang, S.; Long, Z.; Sun, Z. Identification of active sites in Pt–Co bimetallic catalysts for CO oxidation. ACS Applied Energy Materials 2021, 4, 11151–11161. [Google Scholar] [CrossRef]
  22. Du, Y.; Zou, J.; Guo, Y.; Xu, X.; Chen, H.; Su, C.; Zeng, Z.; Li, L. A novel viewpoint on the surface adsorbed oxygen and the atom doping in the catalytic oxidation of toluene over low-Pt bimetal catalysts. Applied Catalysis A: General 2021, 609, 117913. [Google Scholar] [CrossRef]
  23. Acar, C.; Dincer, I. The potential role of hydrogen as a sustainable transportation fuel to combat global warming. International Journal of Hydrogen Energy 2020, 45, 3396–3406. [Google Scholar] [CrossRef]
  24. Shadidi, B.; Najafi, G.; Yusaf, T. A review of hydrogen as a fuel in internal combustion engines. Energies 2021, 14, 6209. [Google Scholar] [CrossRef]
  25. Hernández, J.J.; Cova-Bonillo, A.; Wu, H.; Barba, J.; Rodríguez-Fernández, J. Low temperature autoignition of diesel fuel under dual operation with hydrogen and hydrogen-carriers. Energy Conversion and Management 2022, 258, 115516. [Google Scholar] [CrossRef]
  26. Nag, S.; Sharma, P.; Gupta, A.; Dhar, A. Experimental study of engine performance and emissions for hydrogen diesel dual fuel engine with exhaust gas recirculation. International Journal of Hydrogen Energy 2019, 44, 12163–12175. [Google Scholar] [CrossRef]
  27. Mhadeshwar, A.B.; Vlachos, D.G. Microkinetic modeling for water-promoted CO oxidation, water-gas shift, and preferential oxidation of CO on Pt. Journal of Physical Chemistry B 2004, 108. [Google Scholar] [CrossRef]
  28. Piqueras, P.; Pla, B.; Sanchis, E.J.; García, E. Control-Oriented Reduced-Order Modelling of Conversion Efficiency in Dual-Layer Washcoat Catalysts With Accumulation and Oxidation Functions. In Proceedings of the Internal Combustion Engine Division Fall Technical Conference. American Society of Mechanical Engineers, Vol. 86540; 2022; p. 001. [Google Scholar] [CrossRef]
  29. Desantes, J.M.; Galindo, J.; Payri, F.J.; Piqueras, P.; Serrano, J.R. Device for Atmosphere Conditioning for Testing Combustion Engines, and Associated Method and Use, 2015. Patent WO 2015/110683 A1.
  30. Desantes, J.M.; Galindo, J.; Payri, F.J.; Piqueras, P.; Serrano, J.R. Device for Conditioning the Atmosphere in Test of Alternative Internal Combustion Engines, Method and Use of Said Device, 2016. Patent WO 2016/116642 A1.
  31. Piqueras, P.; de la Morena, J.; Sanchis, E.J.; Conde, C.; Herreros, J.M.; Tsolakis, A. Potential of H2-Assisted Light-Off of Oxidation Catalyst in H2-Diesel Dual-Fuel Engines. In Proceedings of the Internal Combustion Engine Division Fall Technical Conference. American Society of Mechanical Engineers, Vol. 87561; 2023; p. 001. [Google Scholar] [CrossRef]
  32. Herreros, J.M.; Gill, S.S.; Lefort, I.; Tsolakis, A.; Millington, P.; Moss, E. Enhancing the low temperature oxidation performance over a Pt and a Pt-Pd diesel oxidation catalyst. Applied Catalysis B: Environmental 2014, 147. [Google Scholar] [CrossRef]
  33. Martin, J.; Arnau, F.; Piqueras, P.; Auñon, A. Development of an Integrated Virtual Engine Model to Simulate New Standard Testing Cycles. 2018, Vol. 2018-April. [CrossRef]
  34. Piqueras, P.; Ruiz, M.J.; Herreros, J.M.; Tsolakis, A. Sensitivity of pollutants abatement in oxidation catalysts to the use of alternative fuels. Fuel 2021, 297. [Google Scholar] [CrossRef]
  35. Piqueras, P.; Ruiz, M.J.; Herreros, J.M.; Tsolakis, A. Influence of the cell geometry on the conversion efficiency of oxidation catalysts under real driving conditions. Energy Conversion and Management 2021, 233. [Google Scholar] [CrossRef]
  36. Kryl, D.; Kočí, P.; Kubíček, M.; Marek, M.; Maunula, T.; Härkönen, M. Catalytic converters for automobile diesel engines with adsorption of hydrocarbons on zeolites. 2005, Vol. 44. [CrossRef]
  37. Bissett, E.J. An Asymptotic Solution for Washcoat Pore Diffusion in Catalytic Monoliths. Emission Control Science and Technology 2015, 1. [Google Scholar] [CrossRef]
  38. Ratnakar, R.R.; Dadi, R.K.; Balakotaiah, V. Multi-scale reduced order models for transient simulation of multi-layered monolith reactors. Chemical Engineering Journal 2018, 352. [Google Scholar] [CrossRef]
  39. Gieshoff, J.; Schäfer-Sindlinger, A.; Spurk, P.; Van Den Tillaart, J.; Garr, G. Improved SCR Systems for Heavy Duty Applications, SAE. Technical report, Paper 2000-01-0189, 2000. [CrossRef]
  40. Rhodes, C.; Hutchings, G.; Ward, A. Water-gas shift reaction: finding the mechanistic boundary. Catalysis Today 1995, 23, 43–58. [Google Scholar] [CrossRef]
  41. Lagarias, J.C.; Reeds, J.A.; Wright, M.H.; Wright, P.E. Convergence Properties of the Nelder–Mead Simplex Method in Low Dimensions. SIAM Journal on Optimization 1998, 9, 112–147. [Google Scholar] [CrossRef]
Figure 1. Experimental results for CO and HC conversion efficiency as a function of exhaust mass flow and catalyst inlet temperature for both warm-sea level and cold altitude conditions: (a) CO conversion efficiency at 0 m & 20   C; (b) HC conversion efficiency at 0 m & 20   C; (c) CO conversion efficiency at 2500 m & -7   C; and, (d) HC conversion efficiency at 2500 m & -7   C [16].
Preprints 105323 g001
Figure 2. Modeled results for CO and HC conversion efficiency as a function of exhaust mass flow and catalyst inlet temperature: (a) CO conversion efficiency at 0 m & 20   C; (b) HC conversion efficiency at 0 m & 20   C; (c) CO conversion efficiency at 2500 m & -7   C; and, (d) HC conversion efficiency at 2500 m & -7   C.
Preprints 105323 g002
Figure 3. CO and HC selectivity to O 2 and ·OH in OC calibrated and OC reference: (a) CO oxidation by O 2 ; (b) HC oxidation by O 2 ; (c) CO oxidation by ·OH; and, (d) HC oxidation by ·OH.
Preprints 105323 g003
Figure 4. Increase in CO conversion efficiency at 0 m & 20   C as a function of the exhaust mass flow and catalyst inlet temperature for different H 2 inlet molar fractions: (a) 500 ppm H 2 ; (b) 1000 ppm H 2 ; (c) 5000 ppm H 2 ; and, (d) 10000 ppm H 2 .
Preprints 105323 g004
Figure 5. Increase in CO conversion efficiency at 2500 m & -7   C as a function of the exhaust mass flow and catalyst inlet temperature for different H 2 inlet molar fractions: (a) 500 ppm H 2 ; (b) 1000 ppm H 2 ; (c) 5000 ppm H 2 ; and, (d) 10000 ppm H 2 .
Preprints 105323 g005
Figure 6. Axial distribution of CO conversion efficiency with different H 2 concentrations for 2500 m & -7   C and points A, B, C, D and E from Table 3: (a) 0 ppm H 2 ; (b) 500 ppm H 2 ; (d) 5000 ppm H 2 ; and, (d) 10000 ppm H 2 .
Preprints 105323 g006
Figure 7. Axial distribution of CO selectivity to ·OH along the cross-section of the monolith at 2500 m & -7   C as a function of the exhaust mass flow and catalyst inlet temperature for 500 and 10000 ppm H 2 : (a) 500 ppm H 2 - Inlet cross-section; (b) 500 ppm H 2 - Middle cross-section; (c) 10000 ppm H 2 - Inlet cross-section; and, (d) 10000 ppm H 2 - Middle cross-section.
Preprints 105323 g007
Figure 8. Axial distribution of ·OH coverage along the cross-section of the monolith at 2500 m & -7   C as a function of the exhaust mass flow and catalyst inlet temperature for 500 ppm and 10000 ppm H 2 : (a) 500 ppm H 2 - Inlet cross-section; (b) 500 ppm H 2 - Middle cross-section; (c) 10000 ppm H 2 - Inlet cross-section; and, (d) 10000 ppm H 2 - Middle cross-section.
Preprints 105323 g008
Figure 9. Increase in HC conversion efficiency at 0 m & 20   C and 2500 m & -7   C as a function of the exhaust mass flow and catalyst inlet temperature for different H 2 inlet molar fractions: (a) 0 m & 20   C - 5000 ppm H 2 ; (b) 0 m & 20   C - 10000 ppm H 2 ; (c) 2500 m & -7   C - 5000 ppm H 2 ; and, (d) 2500 m & -7   C - 10000 ppm H 2 .
Preprints 105323 g009
Figure 10. HC selectivity to adsorption as a function of the exhaust mass flow and catalyst inlet temperature for 0 and 10000 ppm of H 2 at different ambient conditions: (a) 0 ppm H 2 - 0 m & 20   C; (b) 0 ppm H 2 - 2500 m & -7   C; (c) 10000 ppm H 2 - 0 m & 20   ; and, (d) 10000 ppm H 2 - 2500 m & -7   .
Preprints 105323 g010
Table 1. Characteristics of the oxidation catalyst.
Substrate Cordierite
Washcoat Alumina oxide and zeolite
Coating Pt
Monolith length [mm] 140
Monolith diameter [mm] 120
Channel cross-section Square
Cell density [cpsi] 400
Cell size [mm] 1.04
Wall thickness [mm] 0.23
Catalytic area [m2] 3.95
Table 2. H 2 -OC reaction mechanism.
Reaction Reaction expression rate
Zeolite layer
C n H m + Z e o l C n H m Z e o l R 1 = k 1 c H C 1 θ H C
R 2 = k 2 θ H C
Platinum layer
C O + 1 2 O 2 C O 2 R 3 = k 3 G o x c C O c O 2
C n H m + n + m 4 O 2 n C O 2 + ( m 2 ) H 2 O R 4 = k 4 G o x c H C c O 2
N O + 1 2 O 2 N O 2 R 5 = k 5 c O 2 c N O
R 6 = k 5 K e q , N O x c N O 2
H 2 + 1 2 O 2 H 2 O R 7 = k 7 c H 2 c O 2
H 2 + O 2 + 2 P t 2 · O H P t R 8 = k 8 c O 2 c H 2 1 θ O H
R 9 = k 9 θ O H
H 2 + 2 · O H P t 2 H 2 O + 2 P t R 10 = k 10 c H 2 θ O H
C O + 2 · O H P t H 2 O + C O 2 + 2 P t R 11 = k 11 c C O θ O H
C n H m + · O H P t + ( 4 n + m 1 4 ) O 2 n C O 2 + m + 1 2 H 2 O + P t R 12 = k 12 c H C θ O H
C O + H 2 O C O 2 + H 2 R 13 = k 13 c C O c H 2 O
R 14 = k 13 K e q , w a t e r c C O 2 c H 2
C n H m + n H 2 O n C O + n + m 2 H 2 R 15 = k 15 c H C c H 2 O
Table 3. Selected points for 2500 m & -7   C conditions.
Point Exhaust mass flow [kg/h] OC inlet temperature [   C] CO inlet molar fraction [ppm] HC inlet molar fraction [ppm]
A 54.22 92.52 1194 838
B 58.72 147.59 616 257
C 60.33 158.77 461 268
D 65.58 207.22 308 175
E 67.81 252.96 222 97
Disclaimer/Publisher’s Note: The statements, opinions and data contained in all publications are solely those of the individual author(s) and contributor(s) and not of MDPI and/or the editor(s). MDPI and/or the editor(s) disclaim responsibility for any injury to people or property resulting from any ideas, methods, instructions or products referred to in the content.
Copyright: This open access article is published under a Creative Commons CC BY 4.0 license, which permit the free download, distribution, and reuse, provided that the author and preprint are cited in any reuse.
Prerpints.org logo

Preprints.org is a free preprint server supported by MDPI in Basel, Switzerland.

Subscribe

© 2024 MDPI (Basel, Switzerland) unless otherwise stated