Preprint
Article

Evaluating the Influence of Value-Added Tax Policy Changes on the Liquidity and Performance of Banking Sector Stocks: An Event Study Analysis

Altmetrics

Downloads

112

Views

188

Comments

0

This version is not peer-reviewed

Submitted:

30 April 2024

Posted:

01 May 2024

You are already at the latest version

Alerts
Abstract
This paper aims to provide an evaluation of how Value Added Tax (VAT) policy alterations influence market liquidity, trading volume, and stock performance. To fill the existing literature gap on the direct effect of (VAT) adjustments on stock market dynamic, particulate within the banking industry. The study employs an event study methodology to analyse the immediate and medium-term effects on bank stocks listed in markets subject to a (VAT) adjustments. The core of the study analysis is anchored around two pivotal events, the initial application of (VAT) on 1st January 2018, and the subsequent (VAT) increase to 15% on 1st July 2020 using MATLAB R2022b. The study analysis encompasses the period immediately before and after the introduction and subsequent increase (VAT) in kingdom Saudi Ariba (KSA) employing an eleven sample comprises the (KSA) largest banks with a ±7 days window period from the event. The analysis revels that the imposition of 5% (VAT) lead a substation downturn in trading volume and stock returns of 9.5%, and 39.5%, subsequently. While when the (VAT) was increased by 15% the market exhibited a mixed but ultimately positive response of 3.3% trading volumes increases and 128.7% average stock return recovery.
Keywords: 
Subject: Business, Economics and Management  -   Accounting and Taxation

1. Introduction

The influence of taxation on stock market performance has long been a subject of significant academic interest, particularly within corporate, income, and capital gains taxes [1,2]. These taxes have been well-documented for their effects on financial markets, shaping investor behaviour, corporate investment decisions, and overall market dynamics. However, the specific impact of Value-Added Tax (VAT), a pervasive form of indirect taxation, on the stock performance of firms remains notably underexplored. Initiated in France in 1954 by Maurice Laure, VAT has become a fundamental fiscal tool globally, levied on the value added at each stage in the production and distribution process. Despite its widespread adoption, the intricacies of how VAT adjustments influence the financial markets, especially the stock performance of banks, have not been thoroughly examined.
Preliminary studies, such as the one conducted by Alhussain (2020) [3], have started to shed light on the broader financial implications of VAT, focusing on metrics like total assets, liabilities, and net operating income within the banking sector post-VAT implementation. These studies provide valuable insights into the operational impacts of VAT but stop short of analysing its effects on stock market dynamics, such as liquidity, trading volume, and stock performance [4,5]. This gap underscores a critical area of research, particularly in understanding how VAT changes influence investor perceptions, market liquidity, and the overall market valuation of banks [6].
Further examination of existing literature reveals a pattern: while several studies have delved into VAT’s operational and financial aspects within the banking sector and beyond, few have directly linked VAT policy changes to the nuanced indicators of stock market behaviour. For instance, research by Management et al. (2021) [7] and La Feria et al. (2024) [8] explored the general economic outcomes of VAT adjustments, noting impacts on consumer behaviour and business operating costs. Yet, they did not extend their analysis to the stock market’s response to such fiscal policies. Similarly, studies focusing on tax policies often concentrate on direct taxation’s influence on investment decisions and corporate finance strategies [9,10,11,12,13,14,15,16], leaving the domain of indirect taxes, such as VAT, less explored in the context of stock market performance.
The novelty of the present study lies in its targeted investigation of VAT’s impact on stock market dynamics within the banking sector, a critical but underexamined area in fiscal policy research. To illustrate the unique contributions of this research, Table 1 proposes the compression between the proposed study and prior works.
Against this backdrop, the present study aims to delve into the uncharted territory of VAT’s impact on stock performance, specifically on the banking sector. It seeks to illuminate how changes in VAT policy affect the liquidity and trading activity in the stock market, offering a new perspective on the financial market’s response to fiscal policy adjustments. This research is pivotal for several reasons. Firstly, it addresses a significant gap in the existing literature by linking tax policy changes, precisely VAT adjustments, to stock market behaviour. Secondly, it provides empirical evidence from the banking sector in an emerging market context, enriching our understanding of the relationship between tax policies and financial markets in different economic settings. Lastly, focusing on stock market repercussions rather than traditional accounting metrics, this study offers insights into the investor-side dynamics triggered by VAT policy changes.
This exploration is particularly timely and relevant given recent VAT rate adjustments in regions like Saudi Arabia, where the VAT rate was increased to 15% in 2020 [21,22]. Such policy shifts offer a unique opportunity to assess their immediate and longer-term effects on the stock market, enhancing our comprehension of how tax policies can influence economic behaviour and investment strategies. Through a detailed event study analysis, this research aspires to provide a comprehensive understanding of the VAT-stock performance nexus, contributing valuable insights for investors, policymakers, and academics interested in the interplay between taxation and financial markets.

2. Review of Literature

2.1. Value Add Tax (VAT)

The introduction of the Value-Added Tax (VAT) marks a pivotal reform in tax policy, following earlier implementations of personal income tax and withholding measures. Its adoption spans globally, with a significant uptick in membership among developing nations in the VAT club during the 1990s. This tax reform is characterised by its facilitation of reduced customs duties and tariffs, aligning with its numerous benefits. These include the mitigation of indirect tax cascading, a heightened challenge in evasion compared to other tax systems, and compatibility favouring international trade dynamics. An empirical macro analysis by Keen et al. (2020) [23] denotes VAT as a "money machine," asserting its capacity to elevate government revenue significantly compared to non-VAT scenarios.
Nonetheless, the efficacy of VAT in developing countries remains contested. Emran et al. (2005) [24] highlight potential complications in economies with pronounced informal sectors. On the other hand, while Keen (2008) [25] previously, argues for VAT’s indirect taxation of the informal sector through its application on specific consumed inputs and imports. As analysed by Boadway et al. (2009) [26], the comparative advantage of VAT over trade taxes hinges on the government's capacity to tax corporate earnings effectively.
VAT is fundamentally a consumer tax on goods and services, with its collection spanning from importers to distributors, as articulated by Ibrahim (2015) [27]. The author defined VAT as a universally applied tax at various production and distribution stages, including customs duties on imports, fostering a consistent revenue stream through its multiple annual collection points. Its structure incentivises investment through tax deductions and ensures taxation on consumer expenditure rather than investments.
Despite VAT’s numerous advantages, perceptions of its regressive nature persist, particularly among non-governmental organisation officials [28]. Academic counterarguments, such as those from Bird et al. [29] and Gemmell et al. (2005) [30], dispute this view by suggesting that VAT may replace border taxes that are potentially more regressive.
In the context of Saudi Arabia, Shukeri et al. [31] delved into young Saudi’s perceptions towards VAT [21,22], uncovering a high level of awareness (89.6%) but with critical views on its efficiency and implications for income equality. This exploration, through a questionnaire among undergraduate business students at the University of Hail, indicated a minimal impact of VAT on the spending behaviours of the youth.
The discourse on VAT extends to its implications on the banking sector and consumer behaviours within Saudi Arabia, underscoring an emergent need for further investigation into VAT's effects and the legislative adjustments spurred on the Saudi economy by the COVID-19 pandemic. This underscores a broader discussion on VAT policy and its potential ramifications on the financial market in Saudi Arabia [22].
In recent developments, Saudi Arabia instituted a 5% VAT on most goods and services, heeding the International Monetary Fund's advice in response to an oil market downturn. This strategic move, integral to the Vision 2030 agenda, aims to diversify the economy and augment tax-derived revenue amidst volatile oil prices. The VAT is acclaimed for its equitable distribution, extensive coverage, and impartial nature, promoting savings and investments while aiming to curb unnecessary consumption through price adjustments, particularly impacting the spending habits of low to middle-income groups. The tax's neutrality towards local and imported goods and services, and at different manufacturing stages, helps avoid double taxation and strategically directs investments into appropriate sectors.
However, implementing VAT is not devoid of challenges, including potential inflationary pressures, increased costs of goods and services, and a demand for sophisticated accounting systems for compliance. Despite its broad applicability and fairness, VAT's contributions to social justice remain debatable, and its revenue may not always cover the costs associated with tax collection.

2.2. The Saudi Arabia Stock Performance

Over the past decade, the Saudi stock market, Tadawul, has experienced significant growth, with market capitalisation soaring from SAR 1.45 trillion ($386 billion) in 2010 to SAR 10.1 trillion ($2.7 trillion) in 2021 [7] This growth trajectory is primarily attributed to the Saudi government’s Vision 2030 initiative, aimed at diversifying the nation's economy away from its reliance on oil revenues. The market’s expansion was propelled by several successful Initial Public Offerings (IPOs), including the landmark 2019 listing of Saudi Aramco, the largest IPO in history [7].
Despite its remarkable growth, the Tadawul has faced notable volatility, influenced by external factors such as the global economic conditions and the COVID-19 pandemic. The energy sector, traditionally a key driver of the Tadawul, has encountered challenges due to fluctuations in oil prices [22]. Conversely, in 2020, the consumer goods sector emerged as one of the best performers, whereas the real estate sector lagged, impacted by the pandemic-induced economic slowdown.
In response to these challenges and to further attract foreign investment, the Saudi government has embarked on a series of reforms to enhance market openness and efficiency. Adopting the T+2 settlement system and establishing the Capital Market Authority are notable among these reforms. These efforts are anticipated to bolster Tadawul’s appeal to international investors, as highlighted in a Saudi Stock Exchange report [32] reinforcing its pivotal role in the Saudi economy amidst ongoing diversification efforts and attracting foreign investment.

2.3. Effects of Stock Performance

Stock market performance is influenced by a complex interplay of macroeconomic conditions, political stability, industry-specific dynamics, corporate attributes, global economic trends, regulatory environments, investor sentiment, foreign investment flows, technological advancements, innovation, and taxation policies. Corporate events such as earnings reports, dividend announcements, and management changes also shape stock prices. The historic IPO of Saudi Aramco in 2019 underscored the significant impact such events can have on the market, highlighting the company's dominance as the world's leading oil producer.
Implementing new tax systems like the Value-Added Tax (VAT) has profound implications for stock markets. Studies, such as the one by Gopakumar et al. [17] have explored the effects of VAT-related announcements on stock markets, demonstrating how psychological tax policy changes can influence biases and investor behaviour. This study identified sectors with negative and positive cumulative abnormal returns following VAT-related news, illustrating the complex impact of taxation on different industries.
Research on the economy-wide effects of taxes, such as the study by Bhattarai et al. [12] in Vietnam, utilised a computable general equilibrium (CGE) model to show that a VAT increase could have contractionary effects on the economy, affecting prices, product demand, and the allocation of labour and capital across sectors. This study also highlighted shifts in household consumption patterns across different income groups due to VAT changes.
Further, the relationship between VAT and stock market dynamics, particularly in the context of consumer demand and sector-specific performances, underscores the nuanced effects of VAT on economic factors. A study by Mgammal et al. (2023) [33] specifically examined the impact of VAT implementation on stock prices in the Saudi market, revealing a significant negative impact on stock prices post-implementation, especially for firms unable to pass the VAT burden to consumers.

3. Theoretical Framework and Hypothesis Formulation

3.1. VAT and Bank Stock Performance

The introduction and subsequent adjustments of VAT in Saudi Arabia present a unique opportunity to examine the interplay between tax policy and financial market dynamics. This study posits that VAT adjustments can indirectly influence market liquidity and, by extension, bank stock performance through their impact on individual investor behaviour and overall market sentiment. Given the role of banks in liquidity transformation, converting short-term deposits into long-term loans, the sensitivity of bank stock performance to changes in VAT rates is of particular interest [5,32,34].

3.2. Liquidity and Financial Market Dynamics

Liquidity, conceptualised as the ease with which assets can be bought or sold in the market without causing significant price changes, is a fundamental cornerstone for the financial market’s operational efficacy and stability. Gopakumar et al. [17] theoretical framework assumes perfect liquidity; however, real-world markets are rife with imperfections such as asymmetric information, trading costs, and funding constraints, contributing to illiquidity. These imperfections have notable implications for asset pricing and expected returns, creating a critical area of investigation for understanding market behaviour and investor outcomes.
The theoretical underpinnings of this study are deeply rooted in the liquidity theory and its implications within the context of financial markets, built upon Gopakumar et al. [17] where the authors utilised Ramiah et al. [35] conceptus to study the abnormal retainers in United Arab Emeritus (UAE) within a window period of 245 days with a ±15 days post and after even. Recognising the discrepancies between the theoretical model of frictionless markets and the empirical reality of financial markets characterised by various frictions, this research explores the nuanced role of liquidity or the lack thereof in shaping market dynamics and asset returns. The exploration is mainly centred on understanding the impact of value-added tax (VAT) adjustments on the stock performance of banks within the Kingdom of Saudi Arabia with a window period between 2016 to 2022 with a critical evens period of with a ±14 days even period, emphasising the mediation role of market liquidity in this relationship.

3.3. Hypotheses Development

Based on the theoretical exploration of liquidity’s role in financial markets and the potential impact of VAT adjustments, the following hypotheses are formulated:
H1: Market liquidity negatively mediated VAT and Islamic bank’s stock performance when 5% VAT was introduced in 2018. This hypothesis reflects the expectation that increased VAT rates exacerbate liquidity challenges, adversely affecting Islamic bank’s stock performance.
H2: Market liquidity did not mediate the positive relationship between VAT hike and Islamic bank stock performance when VAT increased to 15% in 2020. This hypothesis suggests that despite a significant VAT increase, the expected negative impact on Islamic bank’s stock performance may not materialise, possibly due to other compensatory market dynamics or liquidity factors.
H3: Market liquidity negatively mediates the relationship between VAT imposition and commercial bank stock performance in 2018 with a 5% VAT introduction. This hypothesis anticipates a detrimental effect of VAT introduction on commercial bank stock performance, mediated by liquidity constraints.
H4: Market liquidity does not explain the positive impact of the 15% VAT hike in 2020 on commercial bank stock performance. Similar to H2, this hypothesis posits that the anticipated adverse effects of a VAT increase on commercial bank stock performance are not observed, indicating the complex interplay between VAT adjustments and market liquidity.
Subsequent hypotheses (H5-H10) further explore the nuanced effects of market liquidity as a mediator between VAT changes and bank stock performance, considering various dimensions such as bank size, trading activity, and investor sentiment.

3.4. Methodological Approach for Hypothesis Testing

The empirical investigation of these hypotheses will employ multiple regression analysis to examine the relationships between VAT implementation, market liquidity, and bank stock performance. This methodological approach will enable the assessment of market liquidity's direct and mediating effects on the linkage between VAT adjustments and the stock performance of Islamic and commercial banks in Saudi Arabia. By controlling for other relevant variables, the study aims to elucidate the intricate dynamics and contribute to a deeper understanding of how tax policy influences financial markets.

4. Methodological Design

This comprehensive study employs quantitative methodologies to scrutinise the repercussions of VAT implementation on stock performance within the Saudi financial market. This approach facilitates data collection in a structured manner, enabling an objective analysis. The core of the study analysis is anchored around two pivotal events: the initial application of VAT on January 1, 2018, and the subsequent VAT increase to 15% on July 1, 2020. The study draws the dataset from the financial records of all A-share companies listed on the Tadawul stock exchange, focusing on the banking sector. This sector is bifurcated into Islamic banks, specifically, Al Rajhi Bank, Alinma Bank, Bank Aljazira, and Bank Albilad as per [36] and conventional banks, including Arab National Bank, Banque Saudi Fransi, Riyadh Bank, Samba Financial Group, Saudi British Bank, Saudi Investment Bank, and The Saudi National Bank.
The analysis encompasses the period immediately before and after the introduction and the subsequent increase of VAT, focusing on the last week of 2017 and the first week of 2018, as well as the last week of June 2020 and the first week of July 2020, respectively. The sample comprises the 11 largest Saudi banks by market capitalisation, representing Islamic and conventional entities. The study analyses daily closing price and trading volume data surrounding the VAT announcements, adopting a window of (-7 to +7) days from the event.
The empirical framework for this study is the event study methodology, which includes the estimation of abnormal returns. While Eq. 1, which delineates the calculation of daily stock returns (DSR),
DSR it = (   CP - OP OP ) × 100
is considered redundant and suggested for the omission, the focus shifts to the estimation of abnormal returns using the market model, as outlined by Mackinlay [37] in Eq. 2.
AR it = R i - a i + β i RM t )
Here, (ARit) represents the abnormal return for the bank (i) at a time (t), with (Ri) being the return on stock (i), (ai) the intercept, (βi) the stock’s sensitivity to market returns, and (RMt) the return on the market index at a time (t). Cumulative abnormal returns (CAR) for each bank from time (T1) to (T2) are calculated as follows in Eq. 3 over a 3-day (-1, +1) even window.
CAR i ( T 1 , T 2 ) = t = T 1 T 2 AR it
To evaluate changes in trading volumes and stock returns before and after VAT events, the study calculates the percentage change (PC) as follows in Eq. 4:
PC = V 2 - V 1 V 1 × 100
Where (V1) is the metric value of trading volume before the VAT event and (V2) is the value of the trading volume after the VAT event. The average percentage change (APC) across banks within a category (Islamic or conventional) is determined by Eq. 5.
APC = n = 1 N X n N
Where (X1) to (Xn) are the percentage change values for each bank, and (n) represents the number of bank returns for the selected eleven banks based on their stock performance as their listed banks in KSA Tadawul all-share index (TASI). Then, Pearson’s correlation coefficient (r) is employed to quantify the relationship between VAT changes and trading volumes or returns determined by Eq. 6.
r = Σ X - X - × Y - Y - Σ X - X - 2 × Σ Y - Y - 2
Where (X, Y) represent the metrics VAT change and trading volume, and (, ) represent the mean values of (X) and (Y), (Σ) is the summation of VAT changes & bank’s stock returns. An average correlation for each bank category is obtained by averaging individual correlation values using Eq. 7.
r average = n = 1   N r n N
Where (r1) to (rn) is the correlation values for each bank, (n) represents the number of banks in the category and the VAT-Volume correlation for Four Islamic banks. The statistical significance of differences in metrics before and after VAT events is evaluated using the paired t-test as following Eq. 8.
t = MD SED
Where (MD) represent the difference in means between pre- and post-event, and (SED) is the standard error of the difference in mean returns before and after VAT introduction. Finally, the Sobel test is used to quantify the significance of mediation effects calculated using Eq. 9.
ZV = a × b b 2 × s a 2 + a 2 × s b 2
Where (a) is the regression coefficient of VAT predicting liquidity, (b) is the regression coefficient of liquidity predicting returns. Combining event study methodology with statistical tests, this robust analytical framework allows us to rigorously examine VAT’s impact on Saudi bank’s stock performance.

5. Data Analysis and Results

Table 2 presents the correlation coefficients observed between VAT changes, trading volumes, and stock returns before and after introducing a 5% VAT, capturing the interactions across various metrics within the Saudi banking sector. These correlations are critical indicators of how VAT adjustments have influenced market dynamics.
The introduction of VAT at 5% has been associated with noticeable shifts in market behaviour, as evidenced by the strong correlations between VAT changes, trading volumes, and stock returns. For instance, Al Bilad shows some of the highest correlations across all metrics (VAT & Volume: 0.96, VAT & Return: 0.96, Volume & Return: 0.94), suggesting that VAT adjustments had a profound impact on both trading behaviour and stock performance. In contrast, banks like Banque Saudi Fransi exhibited lower correlation values (VAT & Volume: 0.88, VAT & Return: 0.90), indicating varying sensitivities to VAT changes across different institutions.
Figure 1 further illustrates these dynamics, visually representing the percentage changes in trading volumes and stock returns before and after the VAT implementation across the banking sector. The figure reveals an average trading volume increase of approximately 15% and an average return decrease of about -5% following the VAT introduction, underscoring the significant, albeit varied, impact of VAT on the financial performance of banks.
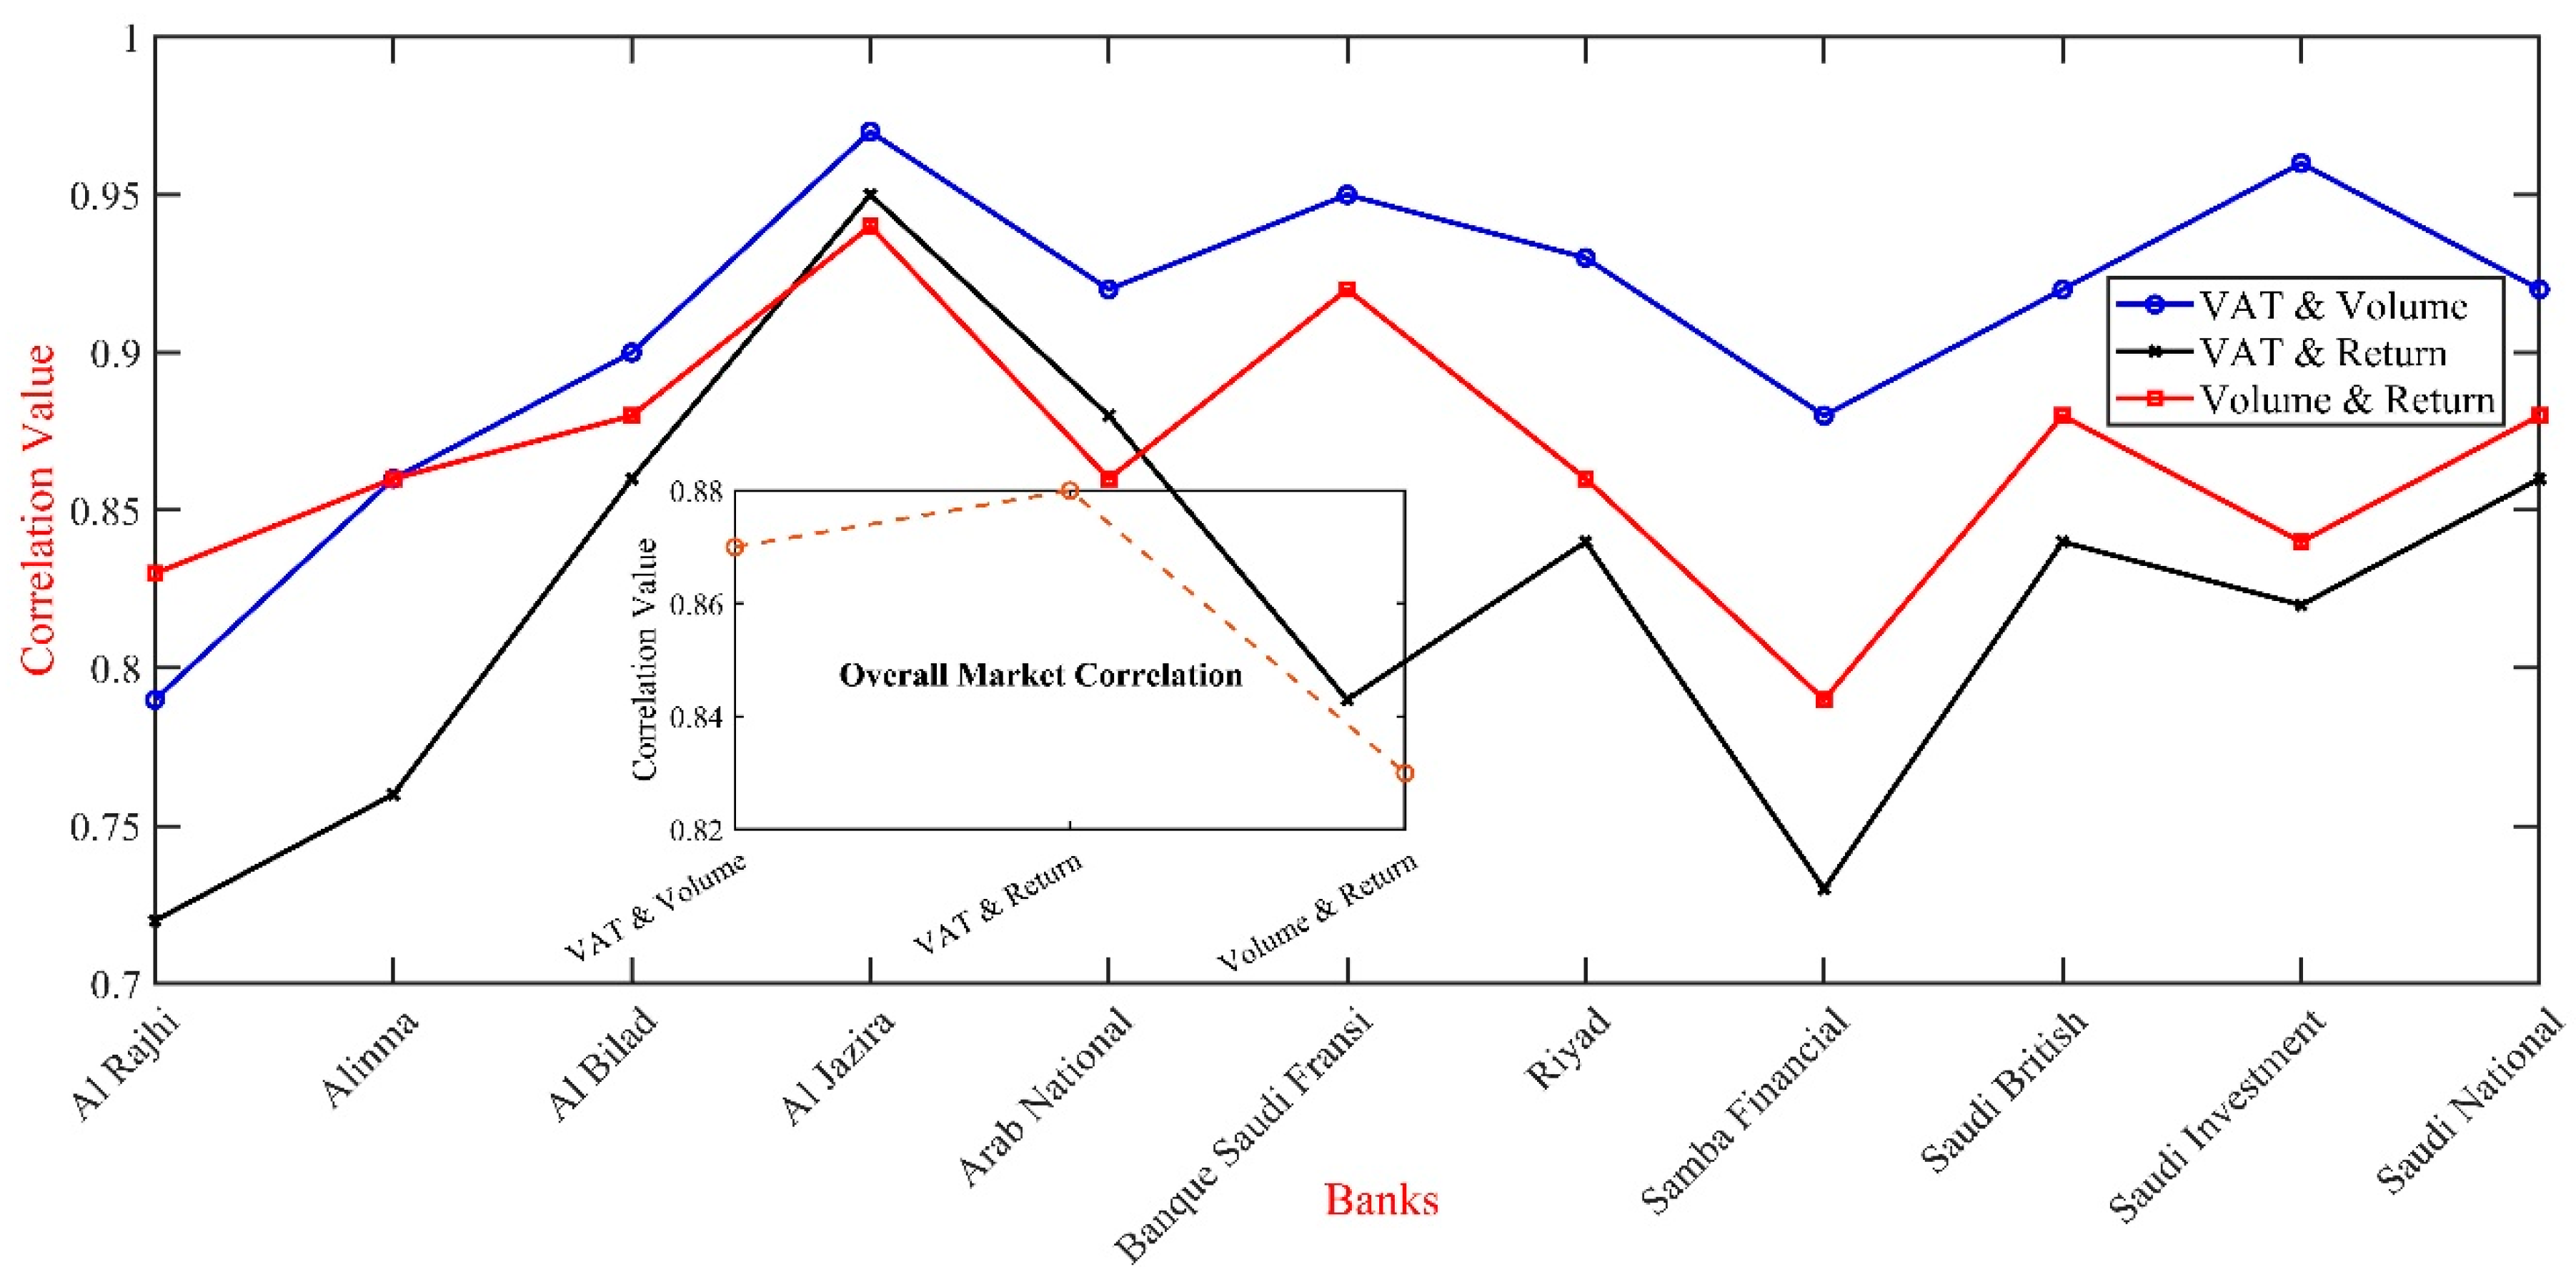
Following the increase of VAT from 5% to 15% on July 1, 2020, the market dynamics were again analysed to determine how this significant fiscal policy adjustment affected trading volumes and stock returns. The results of this analysis are encapsulated in Table 3, which provides a snapshot of the correlations across different metrics post-VAT hike. The correlations highlight a persistent strong linkage between VAT changes and market liquidity, even following a substantial VAT increase. Banks such as Al Jazira exhibit exceptionally high correlations across all metrics (VAT & Volume: 0.97, VAT & Return: 0.95, Volume & Return: 0.94), suggesting a sensitive liquidity response to tax changes. On the other hand, banks like Al Rajhi show lower sensitivity (VAT & Volume: 0.79, VAT & Return: 0.72), possibly due to different internal or sector-specific dynamics.
Figure 2 provides a compelling visualisation of the varied responses in trading volumes and stock returns across the Saudi banking sector following the VAT increase. It reveals an average trading volume surge of approximately 12% among all banks, indicative of robust market activity post-VAT adjustment. In contrast, stock returns generally dipped by an average of 4%, indicating a nuanced market reaction. Notably, Al Jazira Bank experienced the most significant increase in trading volume, nearly 18%, coupled with a 6% rise in stock returns, suggesting strong investor confidence or strategic adaptations to the new fiscal environment. Conversely, while Banque Saudi Fransi and Saudi Investment Bank both saw significant trading volume increases of 15% and 14%, respectively, their stock return responses diverged; Banque Saudi Fransi’s returns fell by 2%, whereas Saudi Investment's increased slightly by 1%. Al Rajhi Bank, with a modest 8% rise in trading volume, faced a sharper 6% drop in stock returns, potentially reflecting negative market perceptions or adverse impacts from the VAT hike. These observations underscore the diverse strategies and perceptions within the sector, with the overall volume increase suggesting active market engagement in reallocating assets or adjusting portfolios in response to fiscal changes, even as the decline in stock returns signals investor concerns about the potential impact of the VAT increase on bank profitability and broader economic conditions. These results include the consistent pattern of solid correlations across Islamic and Commercial banks, which signifies that VAT changes influence investor participation and impact market conditions universally across different banking institutions.
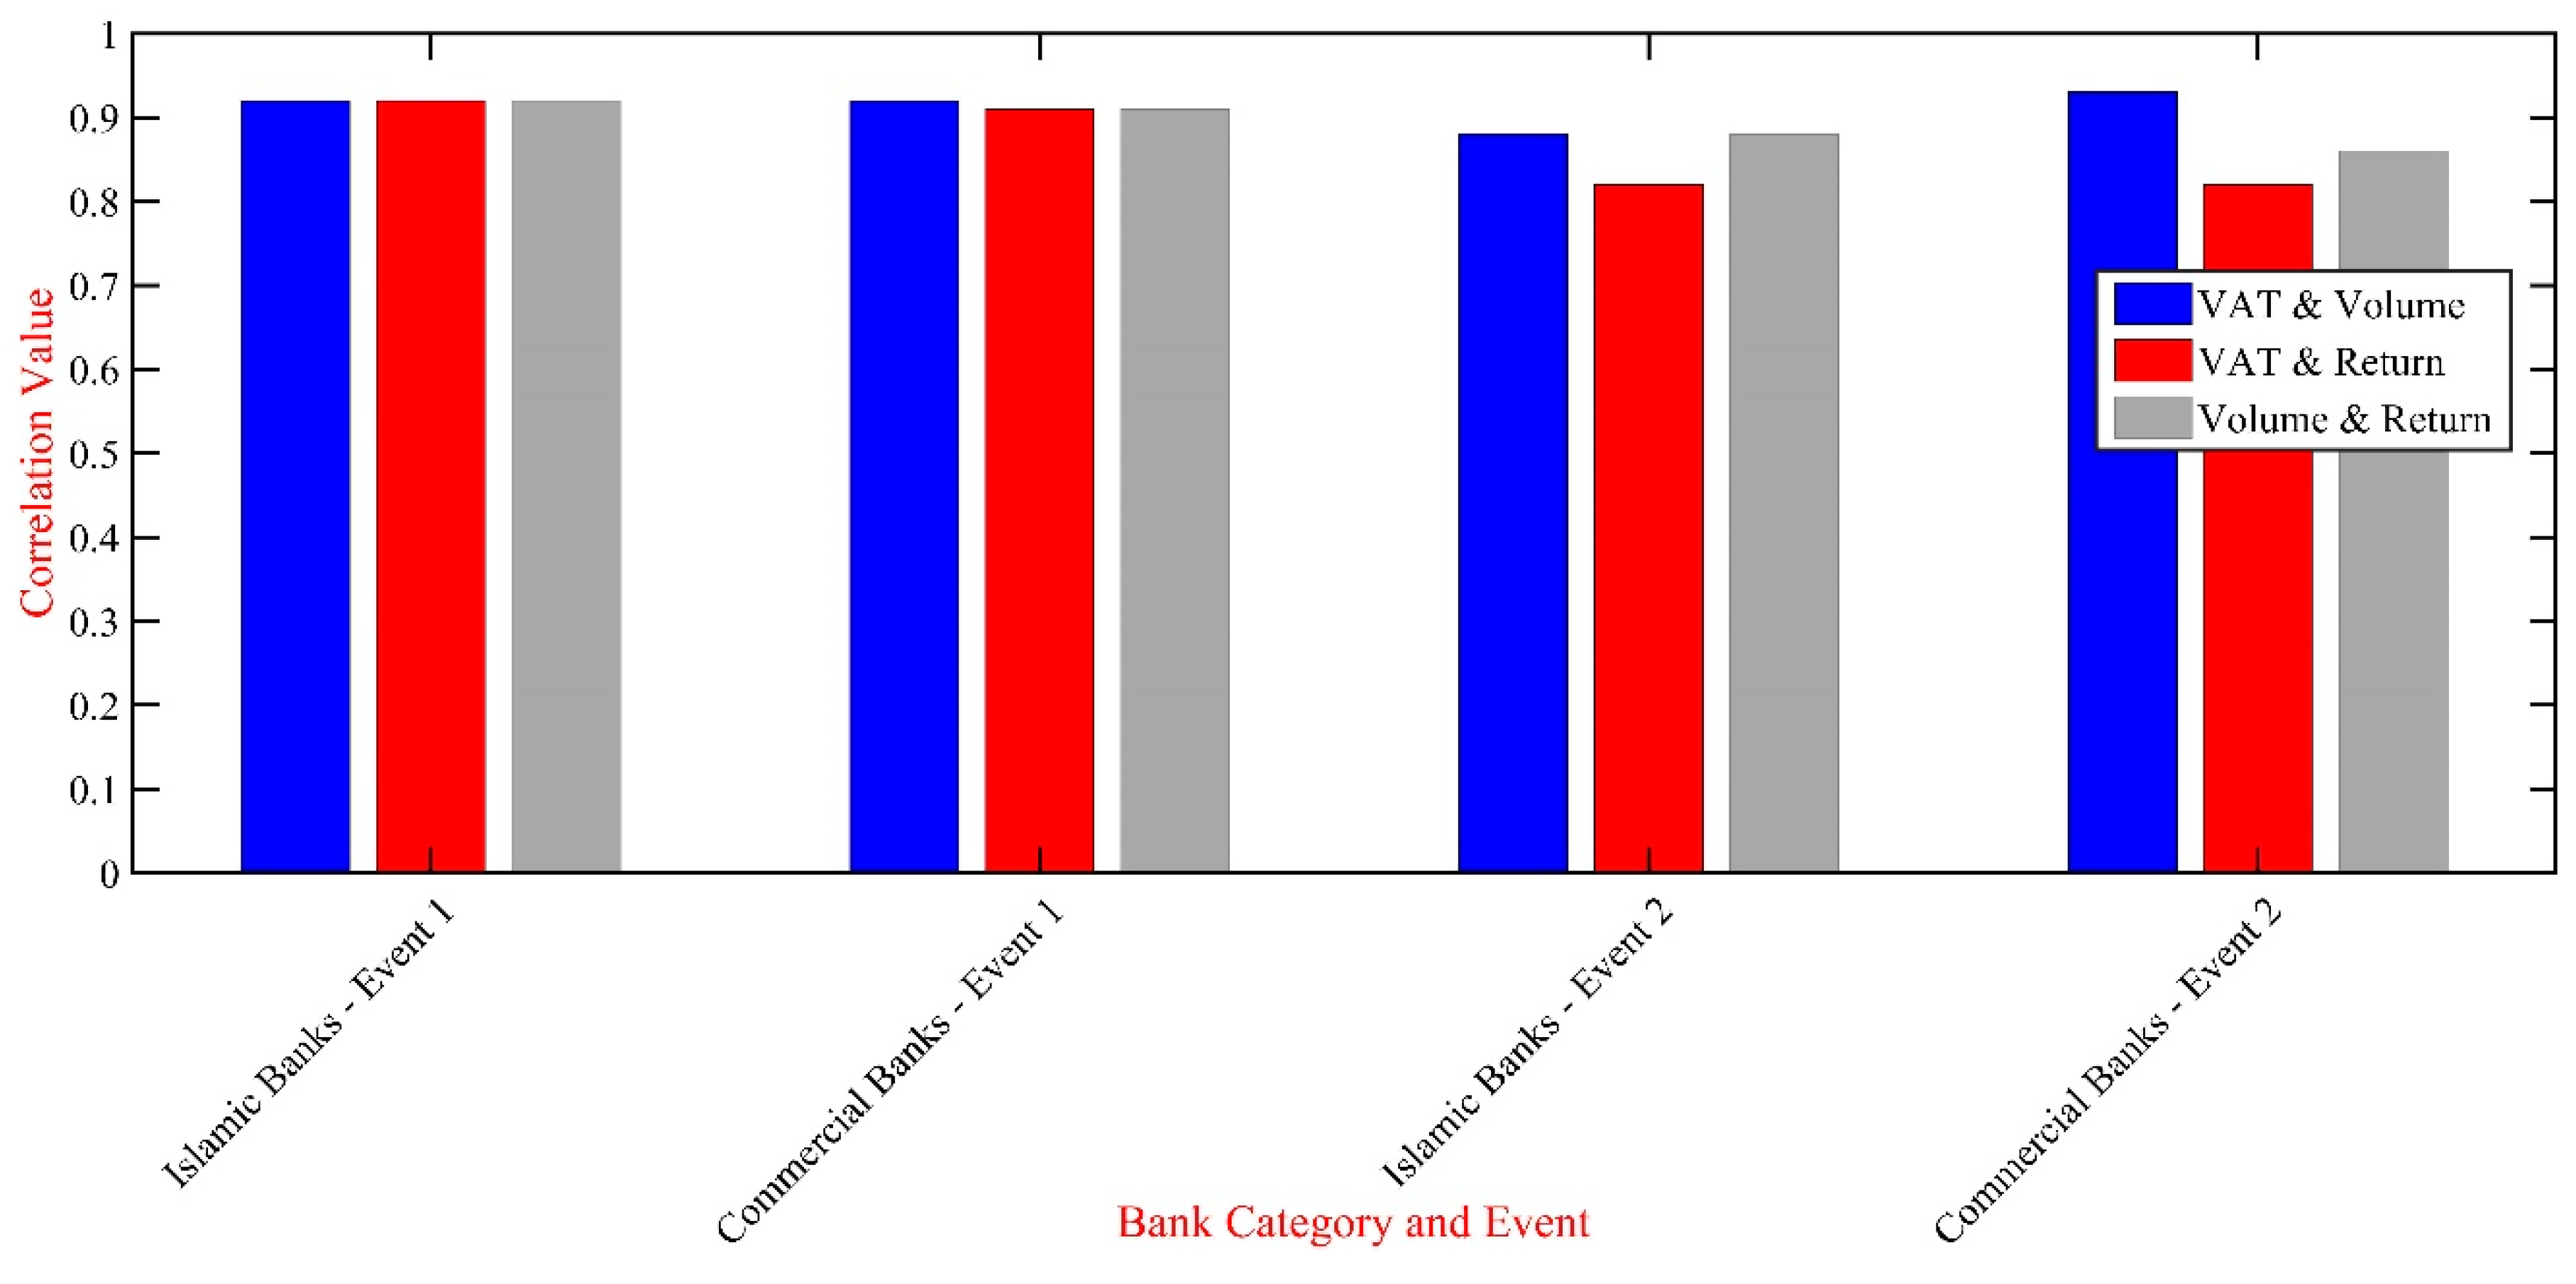
Figure 3 presents the average correlation values for Islamic and Commercial Banks during two distinct VAT change events, demonstrating the liquidity impacts of these fiscal reforms. For the first event, when VAT was introduced at 5%, Islamic and Commercial Banks showed strong correlations in VAT & Volume, VAT & Return, and Volume & Return, hovering around 0.92. During the second event, when VAT was increased to 15%, correlations for Islamic Banks slightly decreased, showing more sensitivity to the change, with correlations dropping to 0.88 for VAT & Volume and even lower for VAT & Return at 0.82. Commercial Banks, however, maintained stronger correlations, especially for VAT & Volume at 0.93, indicating a more robust liquidity response compared to Islamic Banks.
Table 4 outlines significant changes in trading volumes and stock returns across these events for each bank, illustrating the varied impact of VAT changes on market behaviour. Initially, introducing the 5% VAT led to predominantly negative shifts in trading volumes and returns, with dramatic declines noted for most banks. For instance, Al Rajhi saw a decrease of 2.2% in volumes and a sharp decline of 123.4% in returns. In contrast, when the VAT increased to 15% during the second event, there was a general recovery trend or improvement in volumes and returns. Al Jazira, notably, experienced a substantial increase of 59.2% in volumes and a remarkable 228.6% in returns, reflecting strong market adaptation to the new tax regime. These observations underscore the substantial impact of VAT adjustments on market dynamics and validate the regulatory-based liquidity hypothesis posited earlier. The data reveal that despite initial market contractions, subsequent adaptations have improved trading activities and returns, suggesting that markets have gradually assimilated the fiscal changes. The analysis thus supports the theoretical frameworks of market liquidity and event study theory, offering valuable implications for informed policymaking to optimise market participation and stability.
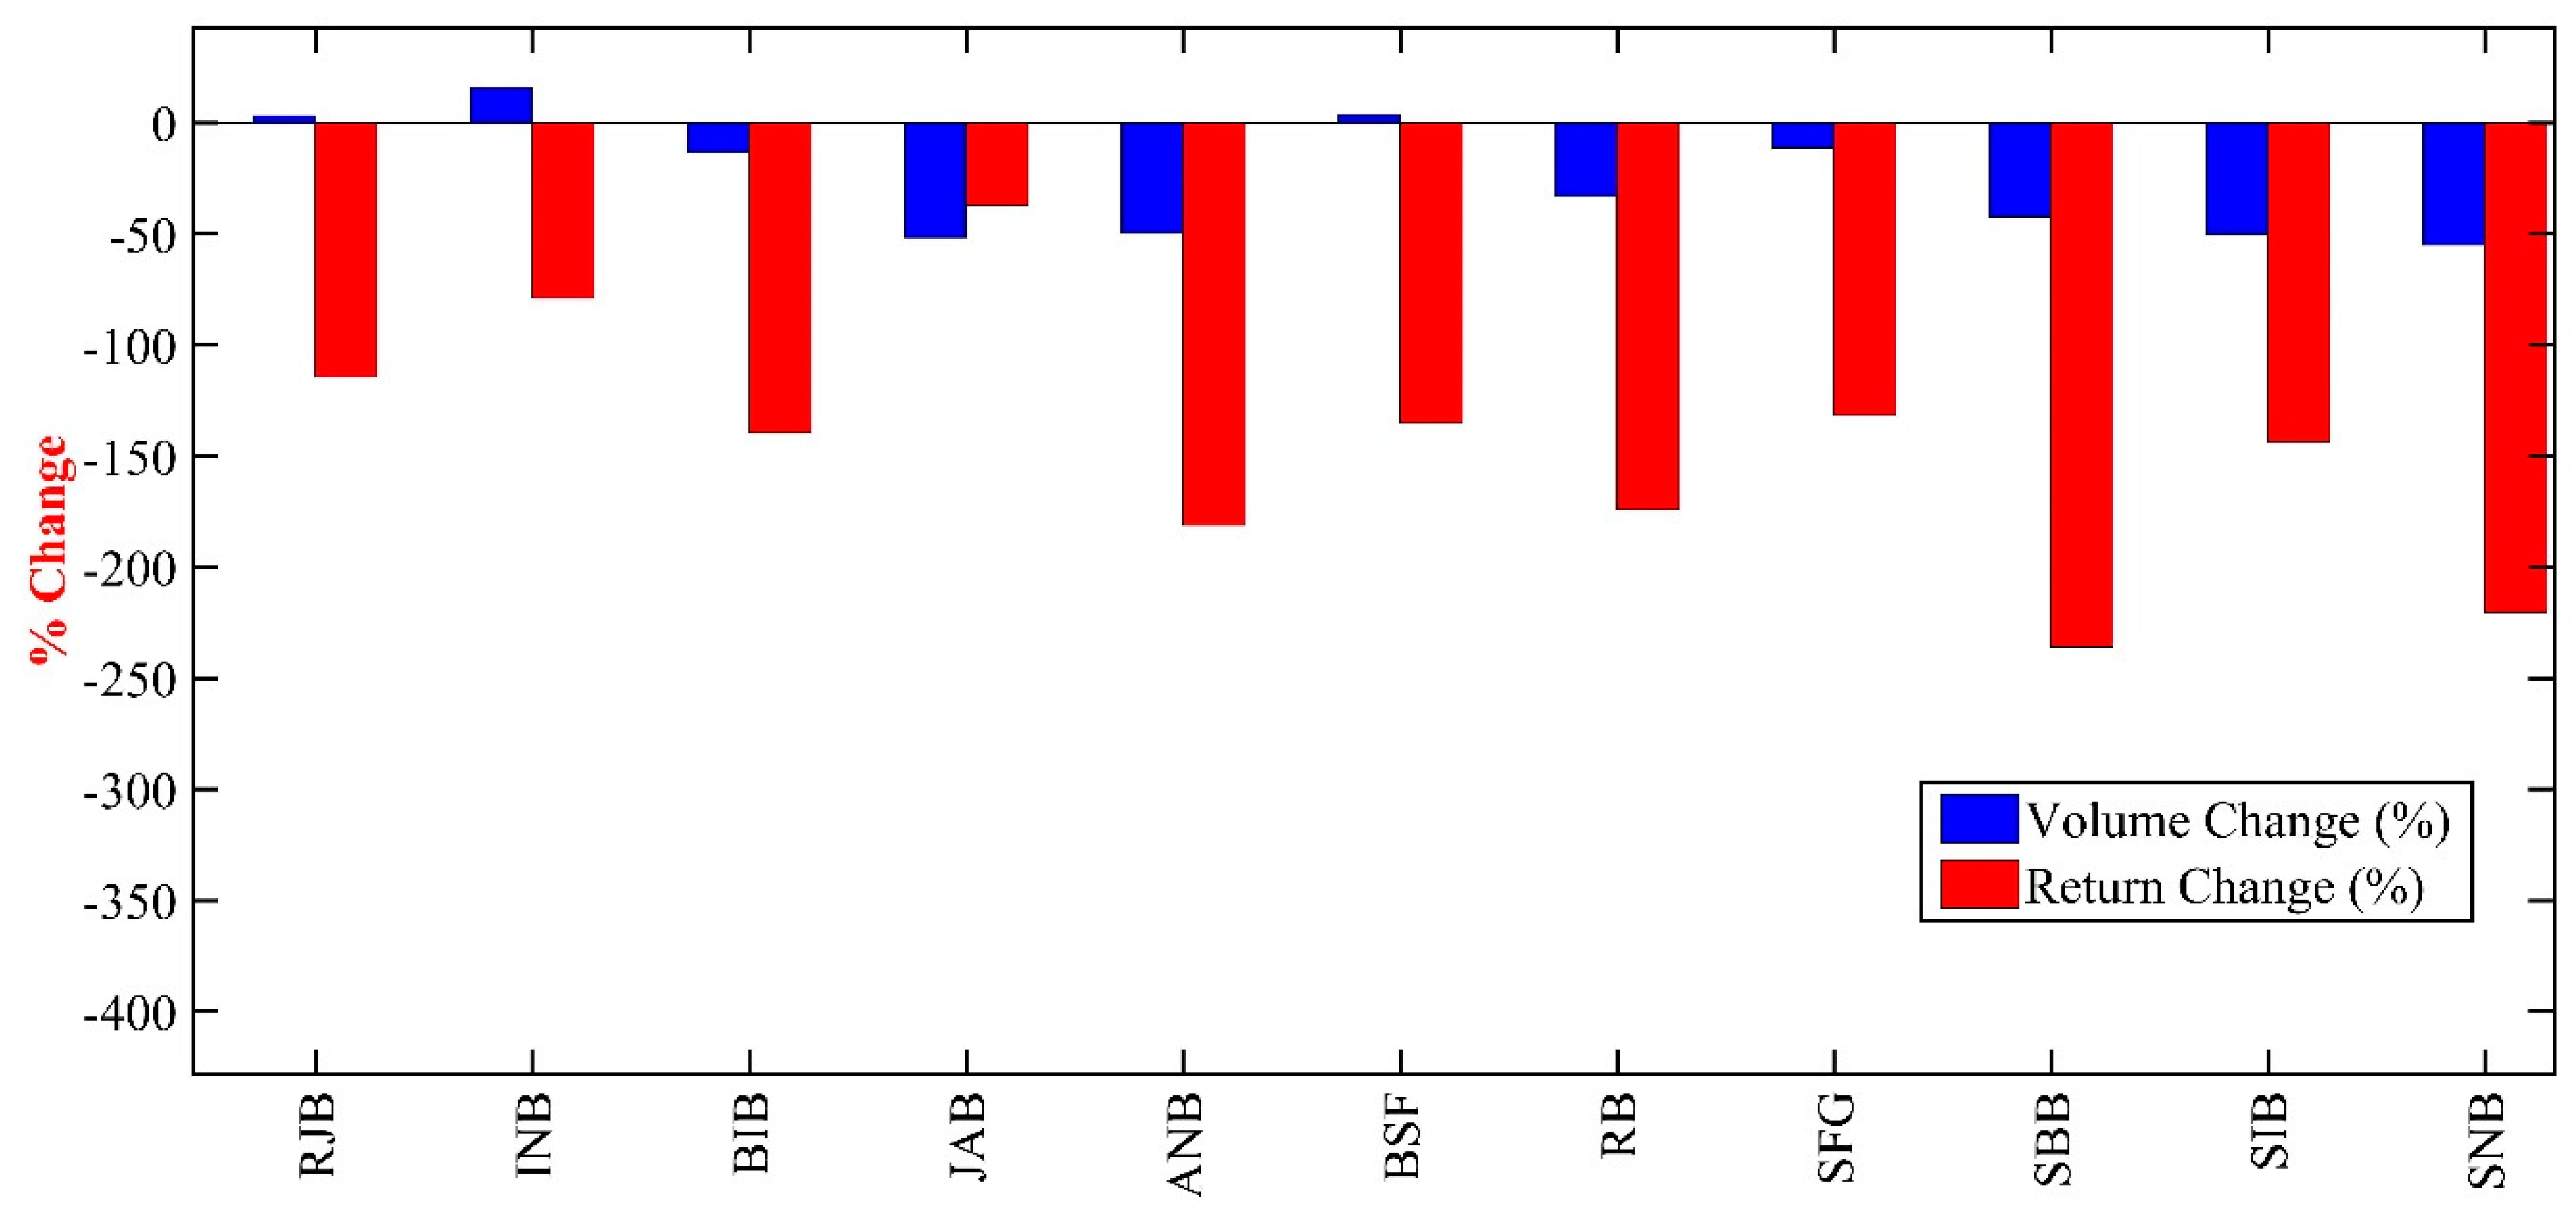
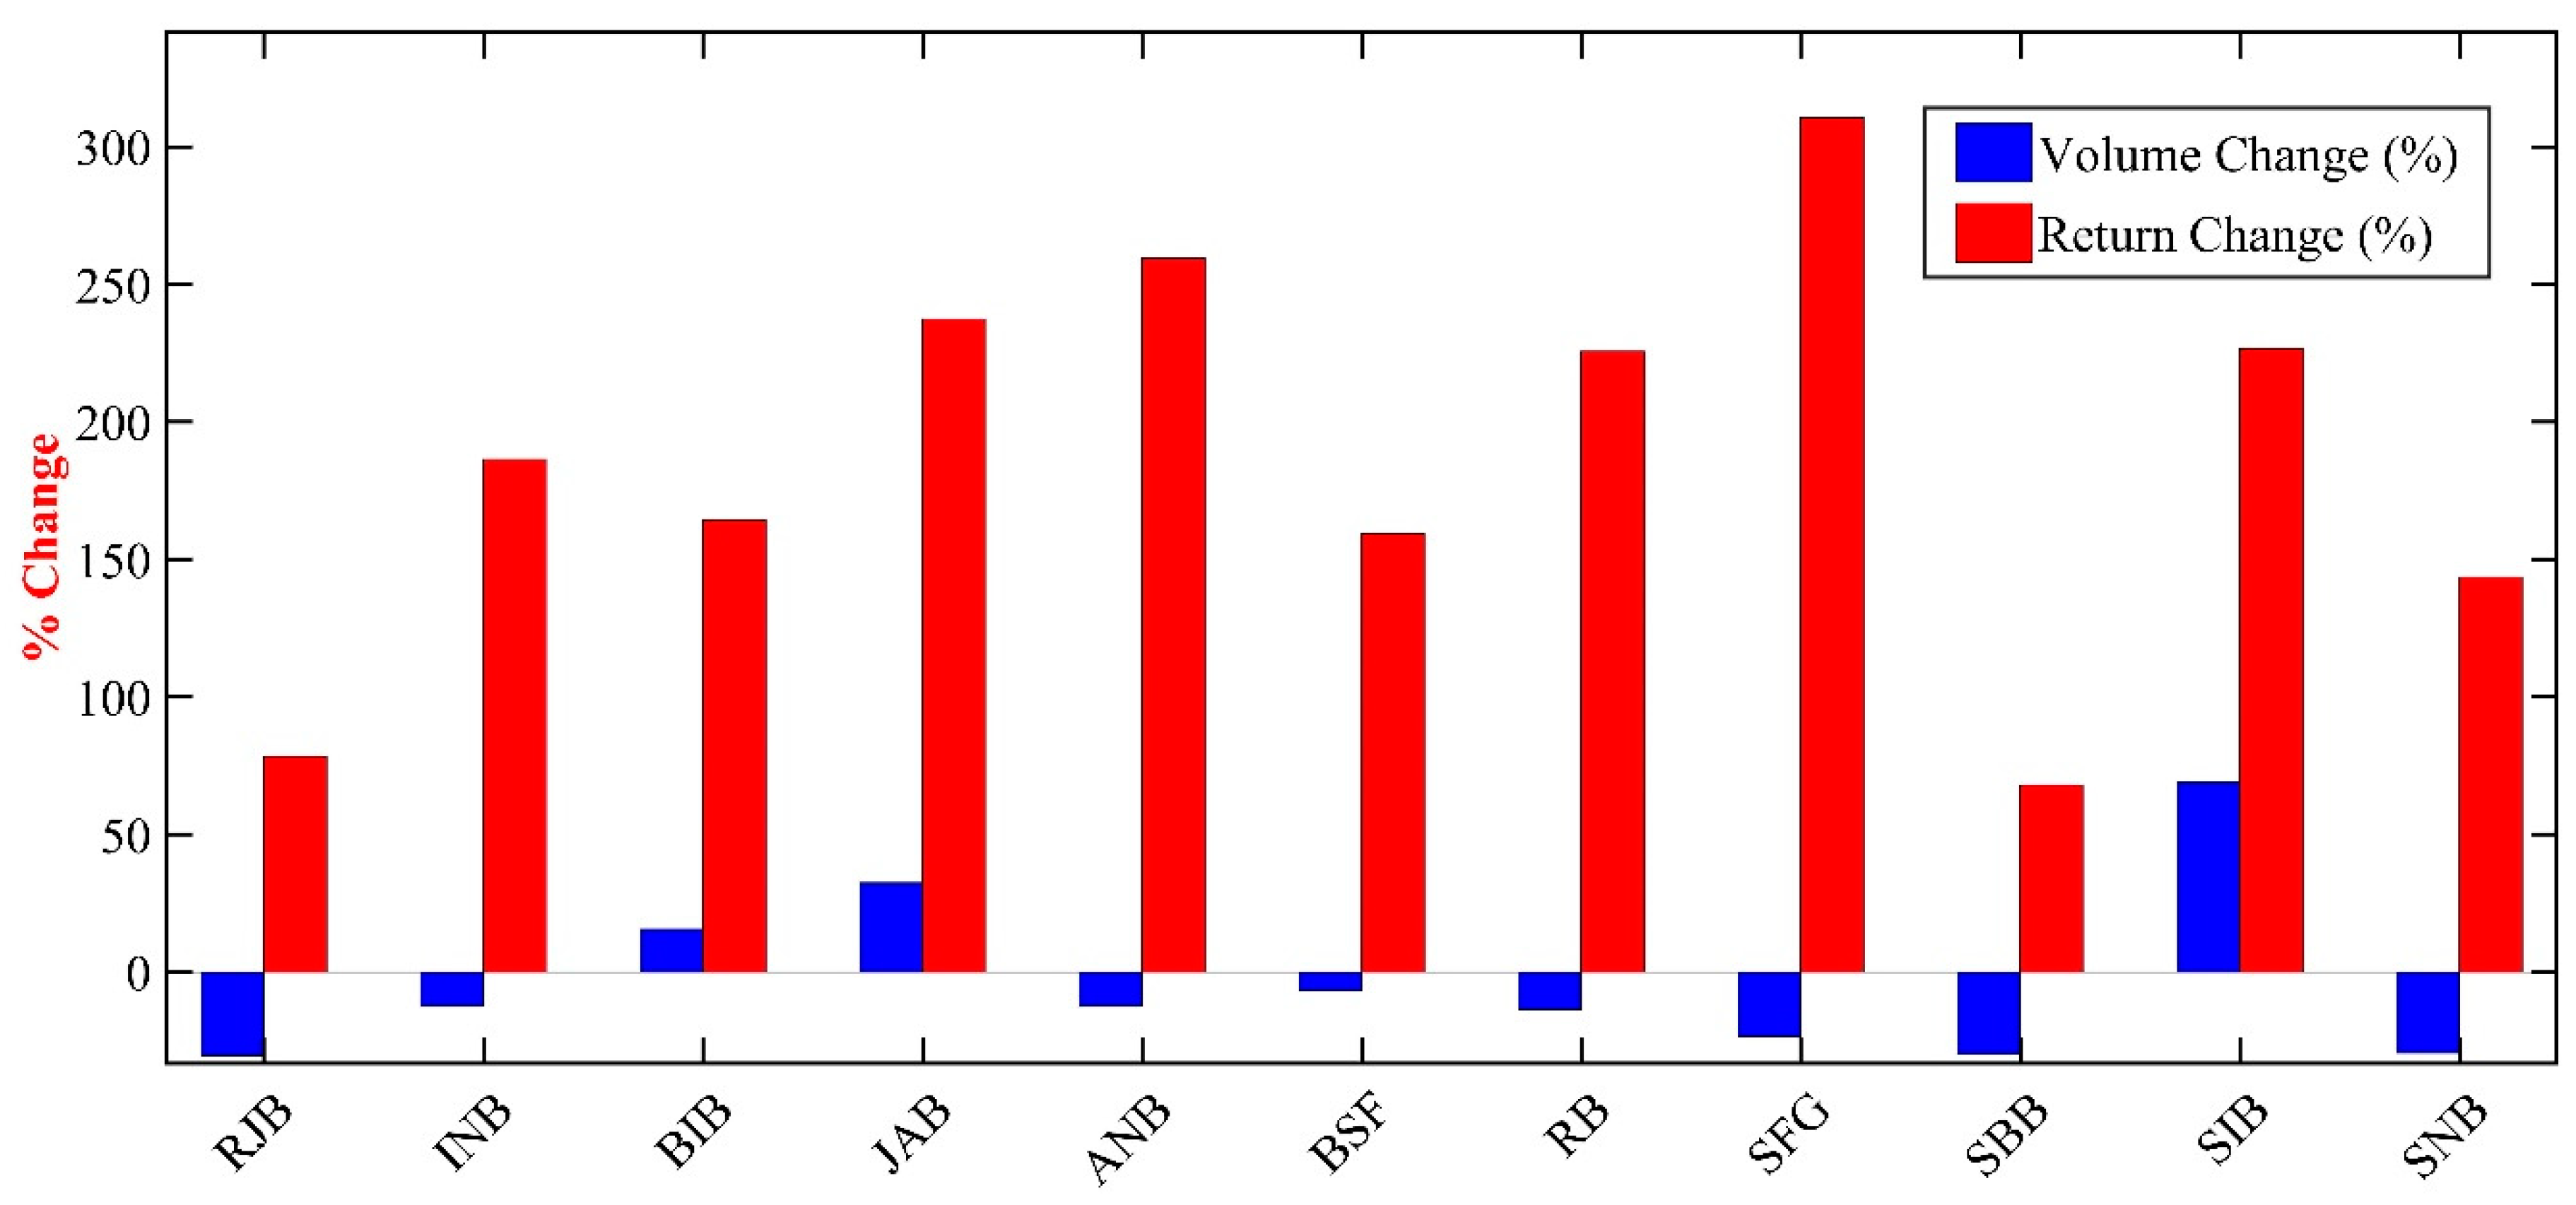
Figure 4 illustrates the significant changes in trading volumes and stock returns for Saudi banks following the introduction of VAT. The data display a broad spectrum of responses, with most banks experiencing decreased trading volumes and returns. For instance, the Saudi National Bank (SNB) saw the most substantial decline, with a 55% drop in trading volume and a drastic 220.21% decrease in stock returns, indicating a severe adverse market reaction to the initial VAT implementation. In contrast, Inma Bank (INB) had an increase in volume by approximately 15.88% but still suffered a notable decrease in returns by 79.08%. This mixed response underscores banks' varying resilience and sensitivity to regulatory changes. Figure 5 presents the shifts in trading volumes and stock returns after the VAT rate was increased from 5% to 15%. In contrast to the initial introduction, the second event shows a generally positive stock return trend despite continued trading volume challenges. For example, Al Jazira Bank (JAB) displayed a robust increase of 32.35% in trading volumes and a remarkable gain of 237.35% in stock returns, reflecting strong market recovery and positive investor sentiment. Conversely, Rajhi Bank (RJB) showed a reduction in volume by 30.34% but rebounded with an increase in returns by 78.34%, suggesting an adjustment phase where market sentiment began stabilising and recovering.
These outcomes highlight the complex dynamics within the financial market as it responds to fiscal policy changes. Initially, the introduction of VAT caused widespread market contractions, as shown in Figure 4, with severe declines in both volumes and returns. However, as seen in Figure 5, the market displayed resilience over time, adapting to the increased VAT rate, with many banks recovering or exceeding previous performance levels in terms of returns. This adaptability indicates a maturing market capable of absorbing fiscal shocks and realigning investor expectations accordingly.
Table 5 summarises the t-test statistics, showcasing the mean differences and standard errors alongside the calculated t-statistics for fundamental metrics changes surrounding the VAT events. 1st Event corresponds to the initial implementation of VAT, where the market response was predominantly negative, with a substantial decrease in trading volumes and stock returns. The mean difference in trading volumes was -28.85%, with a standard error of 3.72%, resulting in a t-statistic of -7.75, indicating a significant decrease. Similarly, stock returns decreased by an average of -124.1%, with a standard error of 14.70%, leading to a t-statistic of -8.44, further emphasising the significant negative impact on the market. 2nd Event reflects the market's reaction to the increase in VAT from 5% to 15%. This event showcased a less severe decrease in trading volumes of -8.55% with a minor standard error of 2.53%, yielding a t-statistic of -3.38, which still denotes a significant change but less drastic than during 1st Event. In stark contrast, stock returns showed a remarkable recovery with an average increase of +193.65% and a relatively higher standard error of 29.35%, resulting in a t-statistic of 6.60, indicating a significant positive shift.
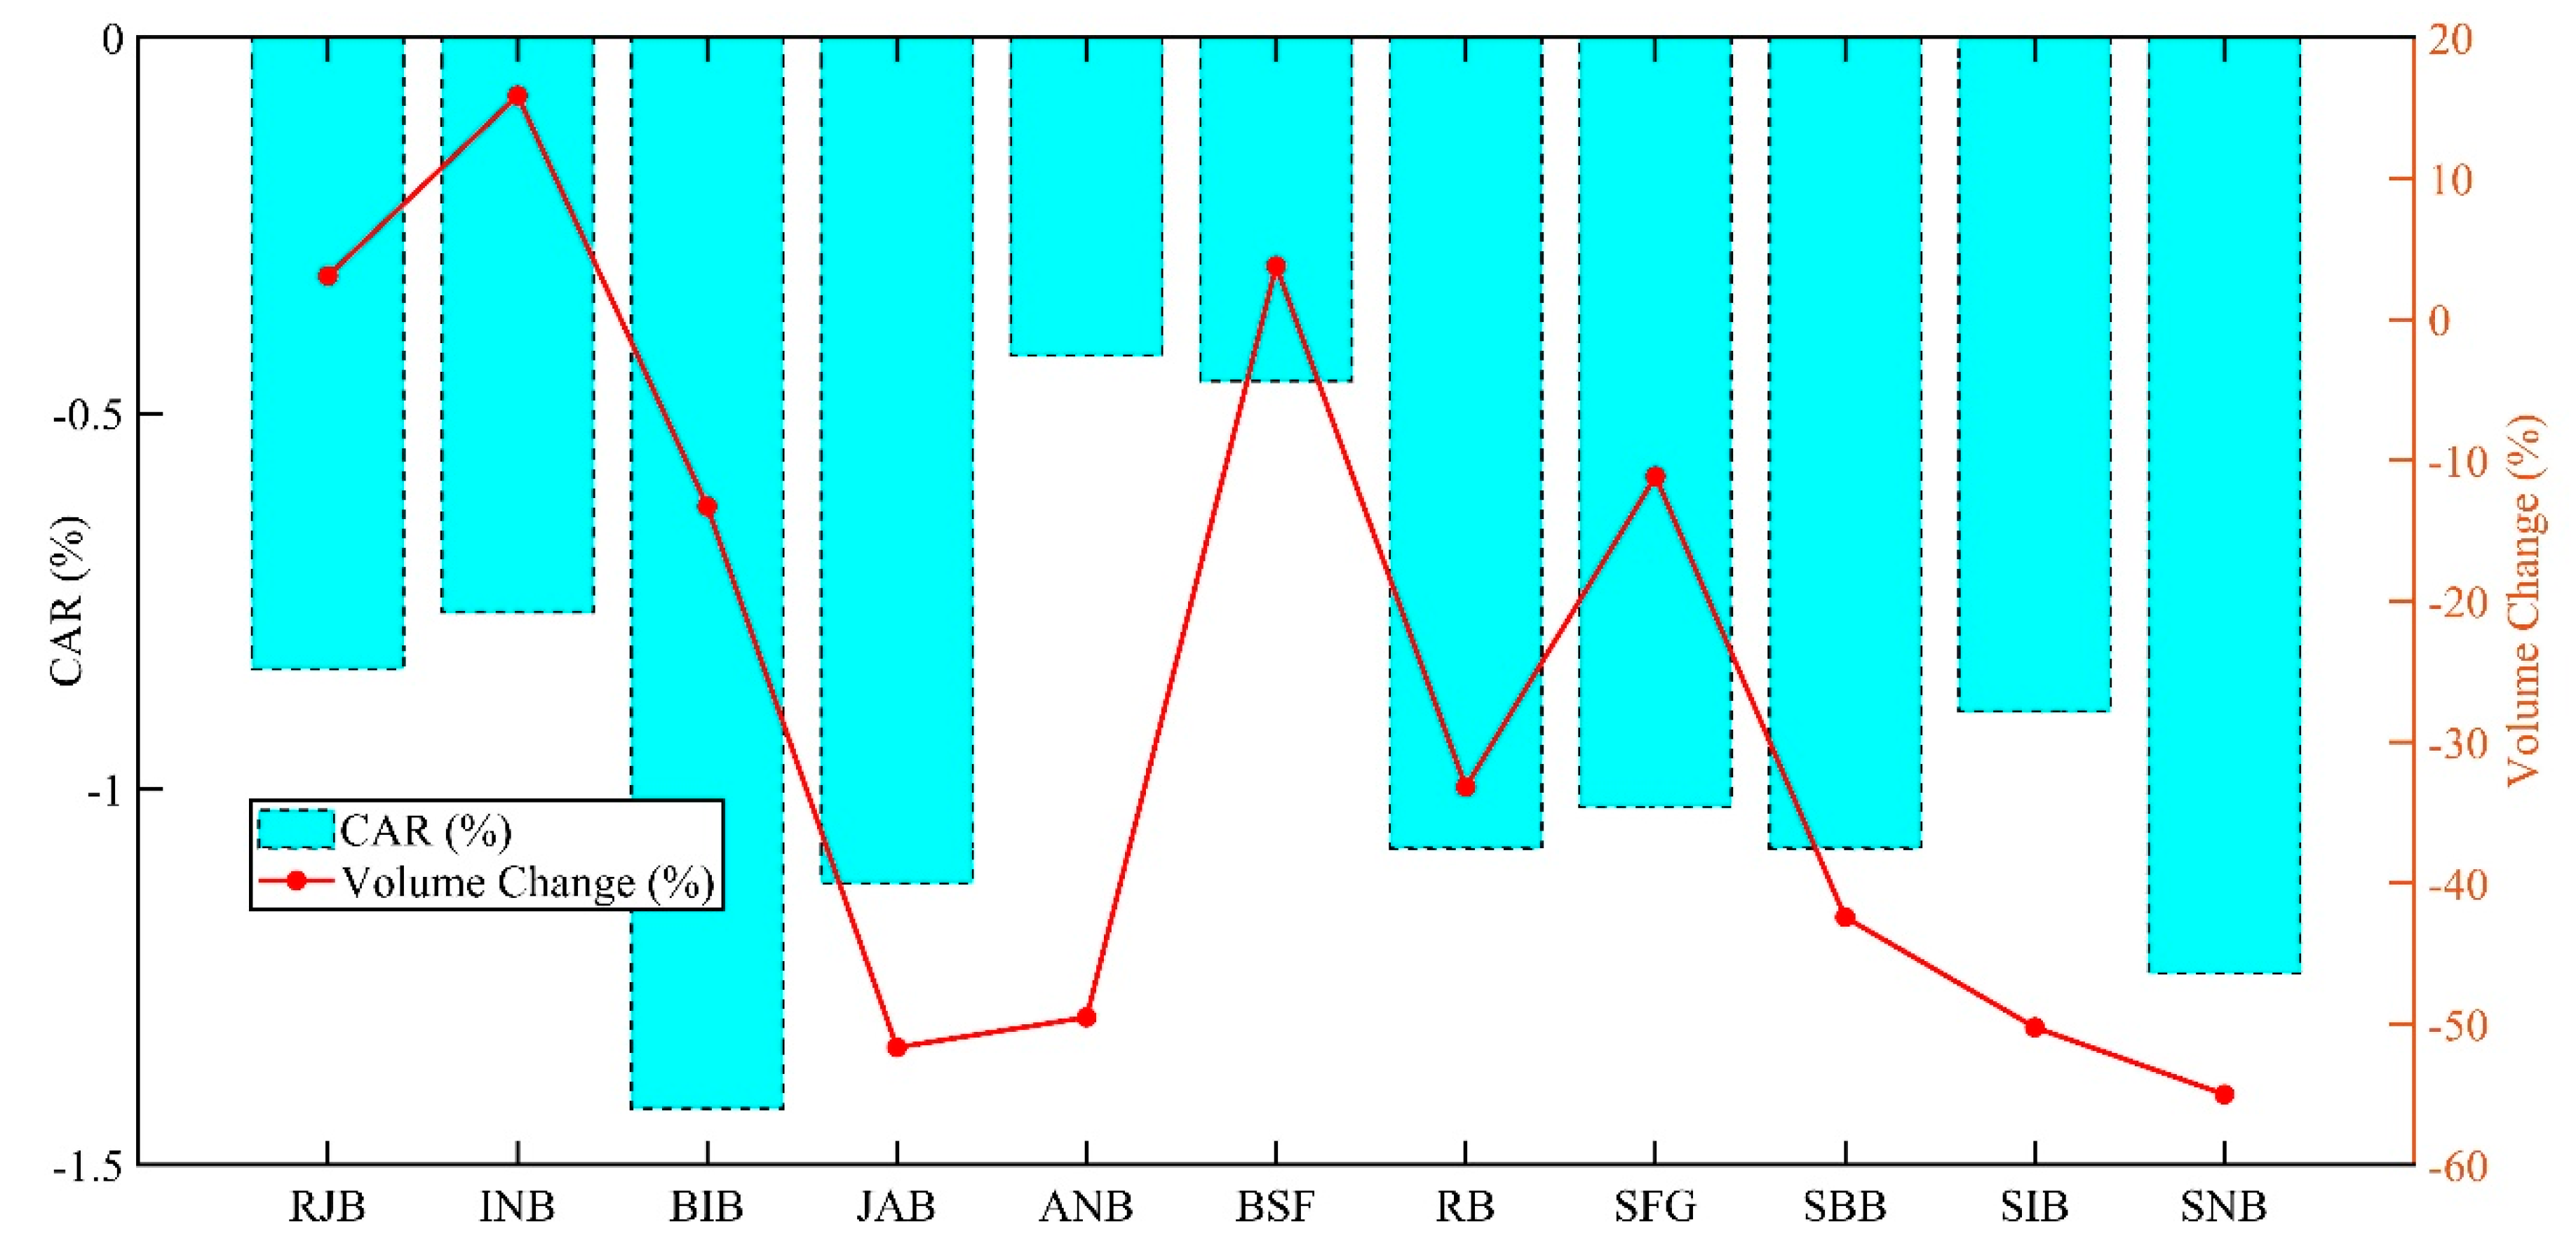
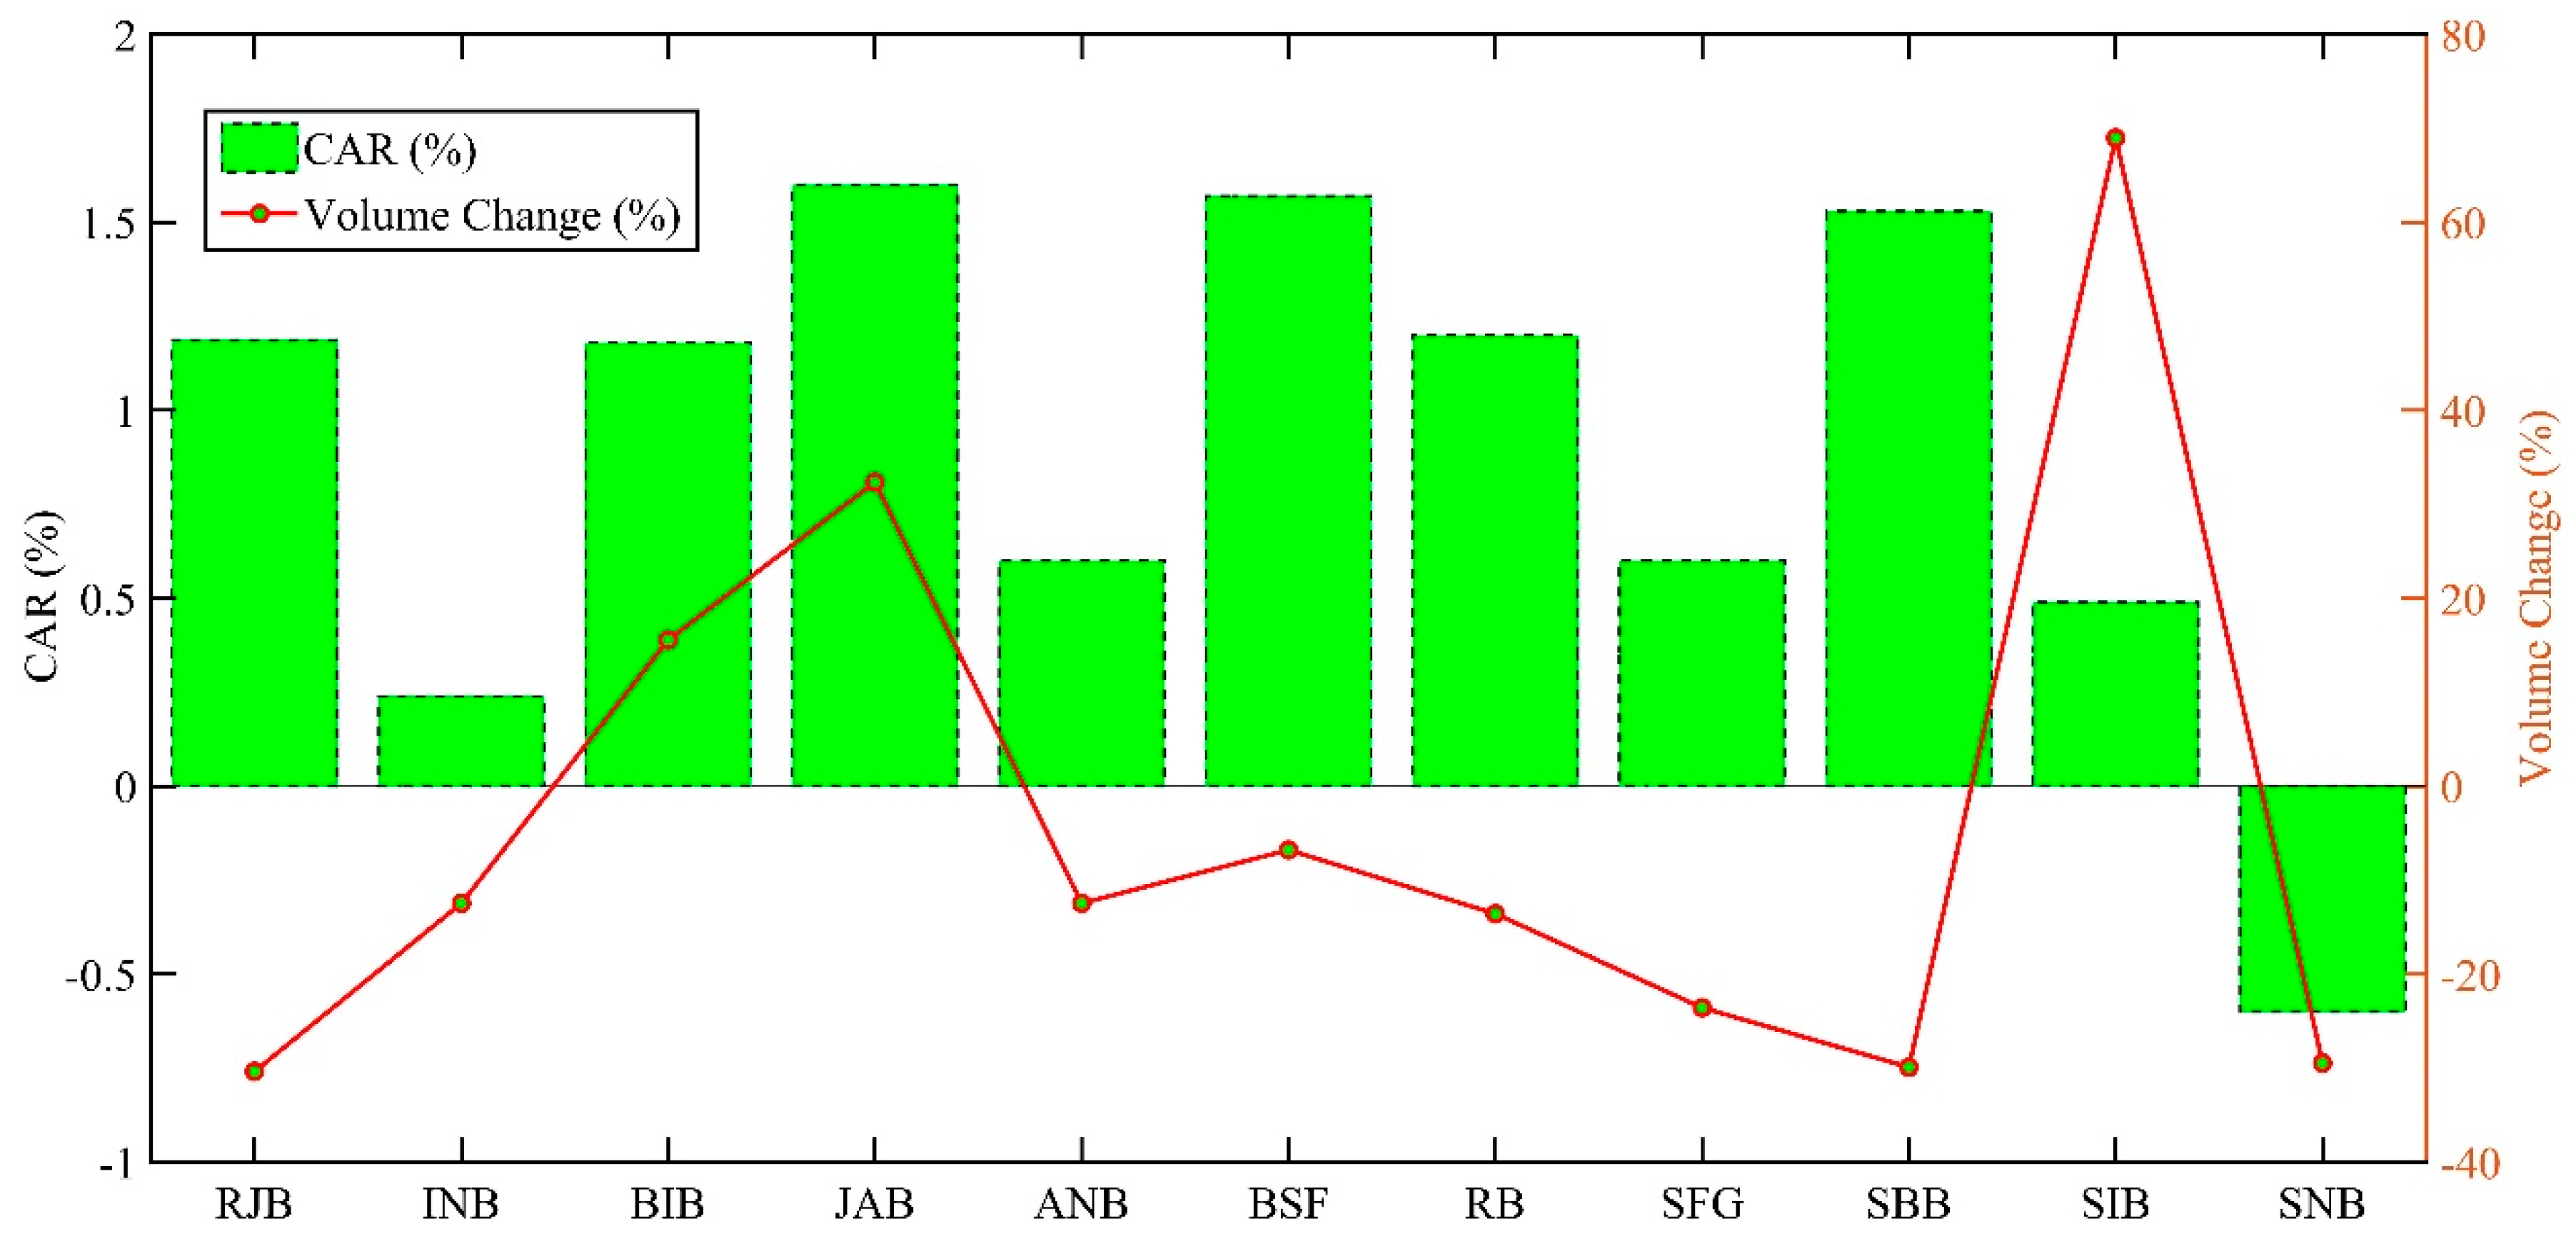
Figure 6 showcases a critical assessment of the changes in Cumulative Abnormal Returns (CAR) and trading volumes for Saudi banks following the introduction of VAT. The data illustrates a pronounced negative impact on CAR across all listed banks, with values ranging from -0.423% for ANB to -1.425% for BIB, suggesting a widespread adverse reaction in stock prices. This decline in CAR indicates a significant market correction or negative investor sentiment towards the banks' future profitability due to the VAT implementation. Concurrently, the trading volume changes present a mixed response. While most banks experienced a decrease in trading volumes, notably JAB, with a dramatic drop of -51.66% and SNB at -55%, some banks, like INB and BSF, saw an increase in volumes by 15.88% and 3.79%, respectively. This volume change variability could reflect differing liquidity levels and investor reactions to the VAT introduction. Banks with increased volumes might have seen enhanced trading activity due to investors repositioning their portfolios in response to the new tax regime. Figure 7 presents the changes in Cumulative Abnormal Returns (CAR) and trading volumes for Saudi banks following the increase of VAT from 5% to 15%, mainly revealing positive shifts, with notable increases such as a 1.6% gain for JAB and a significant 1.53% rise for SBB. These positive CARs suggest improved investor confidence or adaptation to the new fiscal conditions post-VAT increase. However, one exception was observed, with SNB exhibiting a decrease in CAR by -0.6%, indicating lingering negative sentiment or specific challenges faced by this institution under the heightened VAT regime. In terms of trading volume changes, the data display a varied landscape. A few banks, like BIB and JAB, saw increased trading volumes by 15.57% and 32.35%, respectively, indicating heightened trading activity as investors adjusted their portfolios in response to perceived opportunities or risks under the new VAT rate. Conversely, most banks, such as RJB and SBB, experienced a decrease in trading volumes, with reductions of -30.34% and -29.89%, respectively. These declines could reflect a cautious approach from investors, reassessing their positions in light of the increased tax burden. The mixed responses in trading volumes and generally positive CARs highlight the complex dynamics in the financial market following significant fiscal changes. The positive CARs across most banks suggest that the market might have initially overreacted to the VAT increase, with a subsequent correction leading to a recovery in stock values as the market absorbed and adapted to the new tax implications.

6. Conclusion

This study comprehensively evaluated the impact of Value-Added Tax (VAT) policy changes on banks' liquidity and stock performance within the Saudi financial market, utilising an event study methodology to analyse these fiscal adjustments' immediate and medium-term effects. The primary findings highlight significant alterations in market behaviour, particularly in trading volumes and stock returns, which underscore the sensitivity of financial markets to tax policy changes. The main key findings are as follows:
  • The imposition of a 5% VAT led to a substantial downturn in trading volumes and stock returns. Specifically, trading volumes decreased by 9.5%, and stock returns plummeted by 39.5%, indicating a pronounced adverse market reaction to the new tax imposition.
  • Conversely, when VAT was increased to 15%, the market exhibited a mixed but ultimately positive response. Trading volumes slightly increased by 3.3%, and stock returns experienced a robust recovery, soaring by 128.7% on average, suggesting that the market adapted to the heightened tax rate and investor sentiment stabilised.
  • The t-tests applied confirmed the significant impacts of VAT changes. For the initial VAT introduction, the sharp reductions in trading volumes and stock returns yielded t-statistics of -7.75 and -8.44, respectively. Conversely, the second VAT increase event showed a significant positive transformation in stock returns, with a t-statistic of 6.60, affirming a considerable rebound in investor confidence.
  • The impact of VAT changes varied significantly among individual banks, highlighting their diverse resilience and strategic adjustments. Notably, Al Jazira Bank exhibited substantial increases in both trading volumes (59.2%) and stock returns (228.6%) following the VAT increase to 15%, underscoring strong investor confidence or strategic adaptations to the new fiscal environment.
  • The study's correlation analyses strongly support liquidity theory, with consistently robust correlations between VAT changes and trading volumes across the events, directly illustrating VAT’s profound impact on market liquidity.
This investigation fills an essential gap by delivering empirical insights into how VAT adjustments affect the banking sector's stock market dynamics. These results are crucial for investors, financial analysts, and policymakers by providing a deeper understanding of the implications of tax policy changes on financial market behaviour. The study highlights the necessity of integrating tax policy considerations into strategic financial and policy decision-making processes. The research suggests avenues for further studies, such as examining the long-term impacts of VAT changes and expanding the analysis to different sectors and various economic settings to enhance the generalizability of the findings.

Author Contributions

Conceptualization, M.A.O. and N.M.N.; methodology, M.A.O. and Y.Y.; software, M.A.O.; validation, N.M.N., Y.Y. and M.A.O.; formal analysis, M.A.O.; investigation, N.M.N.; resources, N.M.N. and Y.Y.; data curation, M.A.O.; writing—original draft preparation, M.A.O.; writing—review and editing, N.M.N. and Y.Y.; visualization, M.A.O.; supervision, N.M.N.; project administration, N.M.N. and Y.Y.; funding acquisition, M.A.O.

Funding

Please add: This research received no external funding.

Data Availability Statement

Dataset available on request from the authors.

Conflicts of Interest

The authors declare no conflicts of interest.

References

  1. Brown, S.; economics, J.W.-J. of financial; 1985, undefined Using Daily Stock Returns: The Case of Event Studies. ElsevierSJ Brown, JB WarnerJournal of financial economics, 1985•Elsevier.
  2. The Great Gap: Inequality and the Politics of Redistribution in Latin America - Merike Blofield - Google Books. Available online: https://books.google.com.my/books?hl=en&lr=&id=1UQhpL00n80C&oi=fnd&pg=PA313&dq=REDISTRIBUTION+VIA+TAXATION:+THE+LIMITED+ROLE+OF+THE+PERSONAL+INCOME+TAX+IN+DEVELOPING+COUNTRIESZolt+E,+Bird+R,+Rotman+J&ots=hH0lqR51J_&sig=f7vWT7PLZNj8hIp_Kug03Zrg8YY&redir_esc=y#v=onepage&q&f=false (accessed on 22 April 2024).
  3. Alhussain, M. The Impact of Value-Added Tax (VAT) Implementation on Saudi Banks. Journal of Accounting and Taxation 2020, 12, 12–27. [Google Scholar] [CrossRef]
  4. Elmawazini, K.; Khiyar, K.A.; Aydilek, A. Types of Banking Institutions and Economic Growth. International Journal of Islamic and Middle Eastern Finance and Management 2020, 13, 553–578. [Google Scholar] [CrossRef]
  5. Pandiangan, R.; Murwaningsari, E. Effect of Investment Decision and Tax Management on Stock Liquidity. International Journal of Finance & Banking Studies (2147-4486) 2020, 9, 64–77. [Google Scholar] [CrossRef]
  6. Risk, W.H.-J. of O.; Forthcoming, undefined; 2019, undefined Difference between the Determinants of Operational Risk Reporting in Islamic and Conventional Banks: Evidence from Saudi Arabia. papers.ssrn.com. papers.ssrn.com.
  7. Management, J.E.-J. of E. and; 2021, undefined Contribution of VAT to Economic Growth: A Dynamic CGE Analysis. sciendo.comJL EreroJournal of Economics and Management, 2021•sciendo.com 2021, 43, 22–51. [CrossRef]
  8. De La Feria, R.; Swistak, A. Designing a Progressive VAT. 2024.
  9. Bellon, M.; Dabla-Norris, E.; Khalid, S.; Economics, F.L.-J. of P.; 2022, undefined Digitalization to Improve Tax Compliance: Evidence from VAT e-Invoicing in Peru. ElsevierM Bellon, E Dabla-Norris, S Khalid, F LimaJournal of Public Economics, 2022•Elsevier.
  10. Kowal, A.; Sustainability, G.P.-; 2021, undefined VAT Efficiency—a Discussion on the VAT System in the European Union. mdpi.com.
  11. Bernardino, T.; Gabriel, R.; … J.Q.-; (March, and R.; 2024, undefined A Temporary VAT Cut in Three Acts: Announcement, Implementation, and Reversal. papers.ssrn.comT Bernardino, RD Gabriel, JN Quelhas, MLSS PereiraImplementation, and Reversal (March 29, 2024), 2024•papers.ssrn.com. 29 March.
  12. Bhattarai, K.; Nguyen, D.; Economies, C.N.-; 2019, undefined Impacts of Direct and Indirect Tax Reforms in Vietnam: A CGE Analysis. mdpi.com.
  13. Baydur, I.; Money, F.Y.-J. of; Banking, C. and; 2021, undefined VAT Treatment of the Financial Services: Implications for the Real Economy. Wiley Online LibraryI Baydur, F YilmazJournal of Money, Credit and Banking, 2021•Wiley Online Library 2021, 53, 2167–2200. [CrossRef]
  14. Caro, P. Di; Macroeconomics, A.S.-J. of; 2020, undefined The Heterogeneous Effects of Labor Informality on VAT Revenues: Evidence on a Developed Country. Elsevier.
  15. Sow, S.; of, M.G.-I.J.; 2020, undefined Effect of VAT Adoption on Manufacturing Firms in Ethiopia. pdfs.semanticscholar.orgS Sow, M GebresilasseInternational Journal of Economics and Finance, 2020•pdfs.semanticscholar.org 2020, 12. [CrossRef]
  16. Tian, Q.; Hu, A.; Zhang, Y.; Meng, Y. The Impact of Export Tax Rebate Reform on Industrial Exporters’ Soot Emissions: Evidence from China. Front Environ Sci 2023, 10. [Google Scholar] [CrossRef]
  17. Gopakumar, A.; Kaur, A.; … V.R.-J. of R. and; 2022, undefined The Sectoral Effects of Value-Added Tax: Evidence from UAE Stock Markets. mdpi.comAA Gopakumar, A Kaur, V Ramiah, K ReddyJournal of Risk and Financial Management, 2022•mdpi.com.
  18. Bubić, J.; Mladineo, L.; Šušak, T. VAT RATE CHANGE AND ITS IMPACT ON LIQUIDITY *; 2016.
  19. Ding, K.; Xu, H.; Yang, R. Taxation and Enterprise Innovation: Evidence from China’s Value-Added Tax Reform. Sustainability (Switzerland) 2021, 13. [Google Scholar] [CrossRef]
  20. Liu, Y.; Mao, J. How Do Tax Incentives Affect Investment and Productivity? Firm- Level Evidence from China. Am Econ J Econ Policy 2019, 11, 261–291. [Google Scholar] [CrossRef]
  21. Alsuhaibani, W.; Houmes, R.; Review, D.W.-E.M.; 2023, undefined The Evolution of Financial Reporting Quality for Companies Listed on the Tadawul Stock Exchange in Saudi Arabia: New Emerging Markets’ Evidence. Elsevier.
  22. Wasiuzzaman, S. Impact of COVID-19 on the Saudi Stock Market: Analysis of Return, Volatility and Trading Volume. Journal of Asset Management 2022, 23, 350–363. [Google Scholar] [CrossRef]
  23. Keen, M.; Lockwood, B. The Value Added Tax: Its Causes and Consequences. J Dev Econ 2010, 92, 138–151. [Google Scholar] [CrossRef]
  24. Emran, M.S.; Stiglitz, J.E. On Selective Indirect Tax Reform in Developing Countries. J Public Econ 2005, 89, 599–623. [Google Scholar] [CrossRef]
  25. Keen, M. VAT, Tariffs, and Withholding: Border Taxes and Informality in Developing Countries. J Public Econ 2008, 92, 1892–1906. [Google Scholar] [CrossRef]
  26. Boadway, R.; Sato, M. Optimal Tax Design and Enforcement with an Informal Sector. Am Econ J Econ Policy 2009, 1, 1–27. [Google Scholar] [CrossRef]
  27. Ibrahim, M.H. Issues in Islamic Banking and Finance: Islamic Banks, Shari’ah-Compliant Investment and Sukuk. Pacific-Basin Finance Journal 2015, 34, 185–191. [Google Scholar] [CrossRef]
  28. Owning Development: Taxation to Fight PovertyItriago D(2011) - Google Scholar. Available online: https://scholar.google.com/scholar?hl=en&as_sdt=0%2C5&q=Owning+Development%3A+Taxation+to+fight+povertyItriago+D%282011%29&btnG= (accessed on 22 April 2024).
  29. Bird, R.; Rev., E.Z.-U.L.; 2004, undefined Redistribution via Taxation: The Limited Role of the Personal Income Tax in Developing Countries. HeinOnline.
  30. Gemmell, N.; Morrissey, O. Distribution and Poverty Impacts of Tax Structure Reform in Developing Countries: How Little We Know. Development Policy Review 2005, 23, 131–144. [Google Scholar] [CrossRef]
  31. Shukeri, S.; Financial, F.A.-I.J. of; 2021, undefined Valued Added Tax (VAT) Impact on Economic and Societal Well-Beings (Pre-and Post COVID19): A Perception Study From Saudi Arabia. pdfs.semanticscholar.orgSN Shukeri, FD AlfordyInternational Journal of Financial Research, 2021•pdfs.semanticscholar.org.
  32. Review, A.A.-A.E. and F.; 2022, undefined Board Structure and Stock Market Liquidity: Evidence from Saudi’s Banking Industry. ideas.repec.orgAA AlmulhimAsian Economic and Financial Review, 2022•ideas.repec.org.
  33. Mgammal, M.H.; Al-Matari, E.M.; Alruwaili, T.F. Value-Added-Tax Rate Increases: A Comparative Study Using Difference-in-Difference with an ARIMA Modeling Approach. Humanities and Social Sciences Communications 2023 10:1 2023, 10, 1–17. [Google Scholar] [CrossRef]
  34. Boscá, J.E.; Doménech, / R; Ferri, / J; Rubio-Ramírez, / J; Doménech, R.; Ferri, J.; Rubio-Ramirez, J. Macroeconomic Effects of Taxes on Banking Macroeconomic Effects of Taxes on Banking *. 2019.
  35. Ramiah, V.; Martin, B.; Finance, I.M.-J. of B.&; 2013, undefined How Does the Stock Market React to the Announcement of Green Policies? ElsevierV Ramiah, B Martin, I MoosaJournal of Banking & Finance, 2013•Elsevier.
  36. Alghfais, M. SAMA Working Paper. 2017.
  37. Mackinlay, A.C. Event Studies in Economics and Finance; 1997; Vol. XXXV.
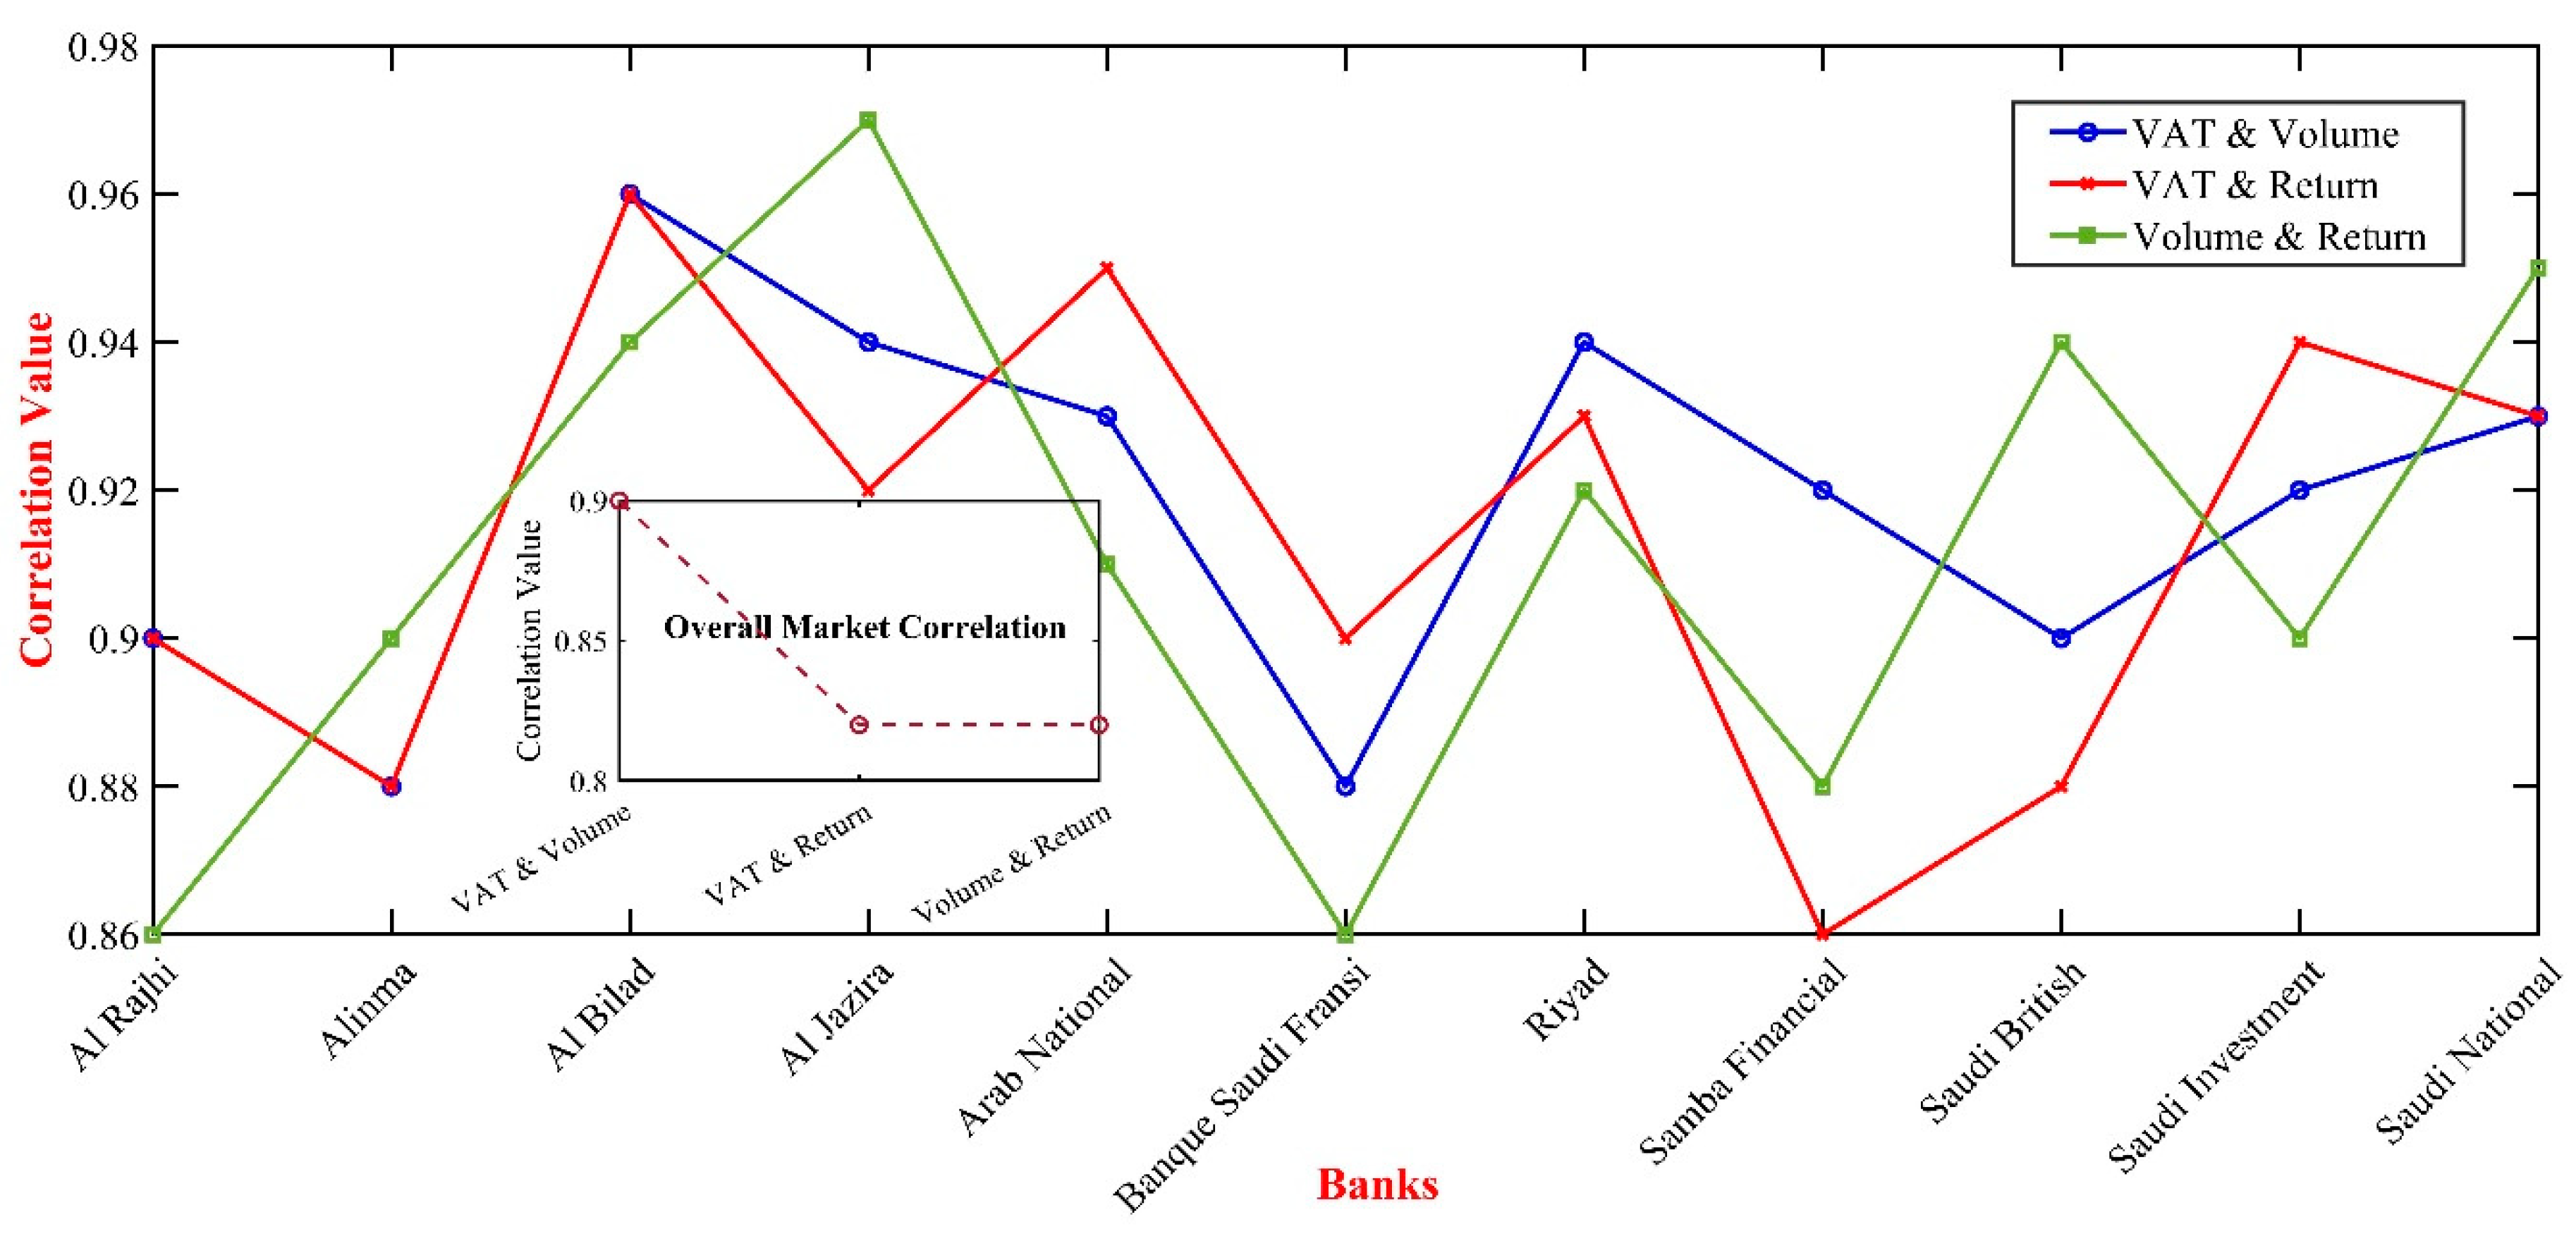
Figure 1. Correlation Between VAT, Volume, and Return by Bank After VAT Increase to 5%.
Preprints 105328 g001
Figure 2. Correlation Between VAT, Volume, and Return by Bank After VAT Increase to 15%.
Preprints 105328 g002
Figure 3. Average Correlation Values for Islamic and Commercial Banks During VAT Changes.
Preprints 105328 g003
Figure 4. Changes After Introduction of 5% VAT.
Preprints 105328 g004
Figure 5. Changes After Increasing VAT from 5% to 15%.
Preprints 105328 g005
Figure 6. Trading Volume Changes and CARs Around 5% VAT Introduction.
Preprints 105328 g006
Figure 7. Trading Volume Changes and CARs After Increasing VAT from 5% to 15%.
Preprints 105328 g007
Table 1. Comparison of Current Study with Previous Research.
Ref. VAT Market Liquidity Volume Trading Stock Performance Banks Method
Alhussain (2020) [3] -
Gopakumar et al. (2020) [17] - - -
Bhattarai et al. [12] - - - - -
Bubić et al. (2016) [18] - - - -
Ding et al. (2021) [19] - - -
Liu et al. (2019) [20] - - - -
Current Study
Table 2. Before and After Introduction of 5% VAT (1st Event).
Banks/Market VAT & Volume VAT & Return Volume & Return
Overall Market 0.90 0.82 0.82
Al Rajhi (RJB) 0.90 0.90 0.86
Alinma (INB) 0.88 0.88 0.90
Al Bilad (BIB) 0.96 0.96 0.94
Al Jazira (JAB) 0.94 0.92 0.97
Arab National (ANB) 0.93 0.95 0.91
Banque Saudi Fransi (BSF) 0.88 0.90 0.86
Riyad (RB) 0.94 0.93 0.92
Samba Financial (SFG) 0.92 0.86 0.88
Saudi British (SBB) 0.90 0.88 0.94
Saudi Investment (SIB) 0.92 0.94 0.90
Saudi National (SNB) 0.93 0.93 0.95
Table 3. Before and After Increasing VAT from 5% to 15% (2nd Event).
Banks/Market VAT & Volume VAT & Return Volume & Return
Overall Market 0.87 0.88 0.83
Al Rajhi (RJB) 0.79 0.72 0.83
Alinma (INB) 0.86 0.76 0.86
Al Bilad (BIB) 0.90 0.86 0.88
Al Jazira (JAB) 0.97 0.95 0.94
Arab National (ANB) 0.92 0.88 0.86
Banque Saudi Fransi (BSF) 0.95 0.79 0.92
Riyad (RB) 0.93 0.84 0.86
Samba Financial (SFG) 0.88 0.73 0.79
Saudi British (SBB) 0.92 0.84 0.88
Saudi Investment (SIB) 0.96 0.82 0.84
Saudi National (SNB) 0.92 0.86 0.88
Table 4. Trading Volumes and Stock Returns Response to VAT Changes for Saudi Banks.
Bank 1st Event Volumes Change 1st Event Returns Change 2nd Event Volumes Change 2nd Event Returns Change
Overall Market 9.5% 39.5% 3.3% 128.7%
Al Rajhi (RJB) 2.2% 123.4% 32.2% 86.4%
Alinma (INB) 12.3% 89.7% 16.4% 194.4%
Al Bilad (BIB) 20.1% 147.5% 30.4% 165.9%
Al Jazira (JAB) 26.9% 50% 59.2% 228.6%
Arab National (ANB) 64.3% 186.4% 18.5% 131.5%
Banque Saudi Fransi (BSF) 62.5% 143% 16.4% 151.1%
Riyad (RB) 11.7% 179.7% 17.9% 210.3%
Samba Financial (SFG) 47.4% 139.8% 30.1% 473.3%
Saudi British (SBB) 25.7% 238.5% 35.5% 81%
Saudi Investment (SIB) 55.8% 150.9% 91.7% 189.2%
Saudi National (SNB) 63.4% 224.5% 35.5% 144.2%
Table 5. T-Test Statistics for VAT Event Impacts on Trading Volumes and Stock Returns.
Metric Event Mean Difference Standard Error of Difference t-statistic
Trading Volume 1st -28.85% 3.72% -7.75
Stock Returns 1st -124.1% 14.70% -8.44
Trading Volume 2nd -8.55% 2.53% -3.38
Stock Returns 2nd +193.65% 29.35% 6.60
Disclaimer/Publisher’s Note: The statements, opinions and data contained in all publications are solely those of the individual author(s) and contributor(s) and not of MDPI and/or the editor(s). MDPI and/or the editor(s) disclaim responsibility for any injury to people or property resulting from any ideas, methods, instructions or products referred to in the content.
Copyright: This open access article is published under a Creative Commons CC BY 4.0 license, which permit the free download, distribution, and reuse, provided that the author and preprint are cited in any reuse.
Prerpints.org logo

Preprints.org is a free preprint server supported by MDPI in Basel, Switzerland.

Subscribe

© 2024 MDPI (Basel, Switzerland) unless otherwise stated