
Submitted:
02 May 2024
Posted:
02 May 2024
You are already at the latest version
Abstract
Brown rice is a familiar whole grain in Japan. We examined national trends in brown rice consumption among Japanese adults aged ≥ 20 years old, using individual-level data from the National Health and Nutrition Surveys conducted between 2012 and 2019. We employed multivariable logistic regression to identify factors associated with brown rice consumption. The 95th percentile of daily brown rice intake remained at 0.0 grams throughout the study period. The percentage of brown rice consumers increased from 1.8% (95% confidence interval: 1.6–2.1) in 2012 to 2.3% (95% confidence interval: 1.8–3.0) in 2019. Compared with individuals who consumed only white rice, brown rice consumers had significantly higher mean intake levels of macronutrients, legumes, vegetables, fruits, and nuts. Brown rice consumption was positively associated with certain sociodemographic characteristics (being female, older age, residing in a major city, living without very young children, and having higher education levels) and health behaviors (lower body mass index, engaging in regular exercise, and being a former or never smoker). Despite its potential nutritional benefits in balanced diets, only a small fraction of adults in Japan consume brown rice, indicating a need for further promotion, particularly among individuals with characteristics associated with brown rice consumption.
Keywords:
brown rice consumption
; National Health and Nutrition Survey
; adults
; Japan
1. Introduction
Whole grains are rich in dietary fiber, vitamins, and minerals, offering protective benefits against non-communicable diseases. Diets that are abundant in whole grains are globally endorsed as a component of Sustainable Healthy Diets [1] and Planetary Health Diets [2], both of which advocate for sustainable and healthful eating practices for the global population. Previous research has indicated an inverse association between whole grain consumption and the risk of noncommunicable diseases [3,4,5,6], highlighting low intake of whole grains as one of the major dietary risk factors contributing to preventable deaths and disabilities worldwide [7].
In 2010, the global average daily intake of whole grains was approximately 38 grams, and Japan was reported to have one of the lowest national daily intake figures, at approximately 8 grams [8]. As Japan’s population continues to age, promoting whole grain consumption has emerged as an effective nutrition policy for extending healthy life expectancy and mitigating the increased healthcare costs associated with noncommunicable diseases. Despite the growing recognition of the importance of whole grain intake, it has yet to be officially recommended by any dietary guidelines in Japan [9,10]. This absence of an official recommendation may be partially attributable to the current lack of sufficient evidence regarding Japan’s national consumption of whole grains.
Brown rice is among the most familiar whole grains in Japan, given that rice serves as the primary staple in the Japanese diet. Renowned for its abundant health benefits, brown rice has been linked to a decreased risk of type 2 diabetes in prospective cohort studies conducted among nurses and health professionals in the United States [5,11,12]. Moreover, a prior study using data from the National Health and Nutrition Examination Survey conducted in the United States in the late 2000s reported that only 3% of adults consumed brown rice [13,14]. Nevertheless, similar to the situation with whole grains overall, there is currently limited knowledge regarding the national-level consumption of brown rice in Japan, primarily because of a lack of data. Previous research on this topic in Japan is confined to a large-scale prospective cohort study, which demonstrated that white rice intake was associated with an increased risk of type 2 diabetes in women [15]. Additionally, a cohort study of factory workers suggested that consumption of brown rice or multigrain rice contributed to weight control [16].
In the current study, we conducted an analysis of brown rice consumption among adults in Japan, using food intake records from the National Health and Nutrition Surveys (NHNS). This study had three primary objectives. First, we aimed to examine national trends in brown rice consumption. Second, we sought to evaluate differences in food and nutrient intakes between consumers of brown and white rice. Third, we aimed to investigate the sociodemographic characteristics and health behaviors of brown rice consumers.
2. Materials and Methods
2.1. Data source
We used individual-level data from the NHNS conducted between 2012 and 2019 [17]. The NHNS is an ongoing cross-sectional household interview and examination survey implemented annually by the Japan Ministry of Health, Labour and Welfare. We limited the study period to 2012–2019 because individual-level data on dietary intake by food items were electronically available only for this period at the time of our study. We obtained official approval to access individual-level data in accordance with the Statistics Act [18]. No ethical review was required for this study because the use of NHNS data is exempt under the Ethical Guidelines for Medical and Biological Research Involving Human Subjects [19].
The methodological details of the NHNS have been documented [17,20]. The sampling frame comprised a list of all residential census enumeration areas, stratified across Japan’s 47 prefectures. Each census enumeration area included approximately 50 households. The surveys employed a stratified two-stage cluster sampling design to obtain nationally representative data from the non-institutionalized Japanese population. In the first sampling stage, census enumeration areas were randomly selected from each prefecture, and this sample was utilized for the Comprehensive Survey of Living conditions conducted every June. Subsequently, in the second sampling stage, the census enumeration areas sampled for the Comprehensive Survey of Living Conditions were subdivided into unit blocks, with each block comprising 20 to 30 households. Unit blocks were then randomly chosen from each prefecture. All individuals aged ≥ 1 year old residing in a household within 300 sampled unit blocks were eligible for inclusion in the NHNS. The large-scale surveys conducted in 2012 and 2016 employed a stratified single-stage cluster sampling design to obtain expanded samples representative at the prefecture level: census enumeration areas were randomly drawn from those in each prefecture, and all individuals aged ≥ 1 year old residing in 475 selected census enumeration areas were eligible for participation in the surveys.
The NHNS comprised a dietary intake survey, a lifestyle survey, and a physical examination. For the dietary intake survey, a semi-weighed household dietary record was employed to assess dietary intake of individuals aged ≥ 1 year old on a single day in November, excluding Sundays and public holidays. Trained fieldworkers, such as registered dietitians, visited households to provide instructions on filling out a self-administered questionnaire. Household members responsible for meal preparation used a scale to weigh and record each food and beverage item consumed in the household, including food waste and leftovers. To estimate individual food intakes from shared dishes, approximate proportions of each food item were assigned across household members. For foods consumed away from home, household members reported portion sizes, amounts consumed, and leftovers. Fieldworkers revisited households to collect and review the questionnaires, clarify entries, fill in missing information, and correct errors. Subsequently, each food item was coded according to food codes of the Standard Tables of Food Composition in Japan 2010 edition (for the surveys from 2012 to 2017) and the 2015 edition (for surveys conducted in 2018 and 2019) [21,22].
2.2. Data preparation
We restricted our study to individuals aged ≥ 20 years old. To estimate the distributions of brown rice and white rice intake, we obtained data from a sample of 84,377 participants aged ≥ 20 years old (45,519 females and 38,858 males) across surveys conducted from 2012 to 2019, after excluding 13,901 participants (14.1%) with missing values regarding food intake. The sample size for this study varied from 26,726 in 2012 to 4,927 in 2019 (Table S1).
To investigate the characteristics of individuals who consume brown rice, we merged individual-level data from the NHNS conducted during 2013–2015 and 2017–2019 with socioeconomic information obtained from the household questionnaire of the Comprehensive Survey of Living Conditions. We excluded the large-scale NHNS in 2012 and 2016 from the record linkage process because their samples were not drawn from the master samples of the Comprehensive Survey of Living Conditions. Employing a two-stage record linkage method, we matched key variables including a prefecture identification number, de-identified codes on census enumeration districts, unit blocks, households, and household members, sex, birth year and month, and age [23]. This yielded a merged dataset comprising 33,570 participants (17,939 females and 15,631 males) out of 35,800 participants aged ≥ 20 years with valid food intake records in 2013–2015 and 2017–2019. The merged sample size ranged from 4,629 in 2019 to 6,408 in 2014 (Table S1).
2.3. Measurement of brown and white rice consumption
To quantify brown and white rice consumption, we utilized individual-level records of dietary intake by food items obtained from the survey. Participants were identified as consumers of brown rice and white rice if they had consumed at least one of the 15 non-glutinous rice items listed in Table S2. We excluded consumption of glutinous rice and other rice products to clarify trends and characteristics of brown rice consumption. Subsequently, we categorized participants into four groups on the basis of their rice intake: (1) consumers of only white rice, (2) consumers of only brown rice, (3) consumers of both types, and (4) non-consumers of either. Participants who exclusively consumed brown rice or combined it with white rice were classified as brown rice consumers. Weight change factors from Table S2 were applied to convert the weights of cooked rice items to their respective dry equivalents.
2.4. Statistical analysis
We examined the percentiles of daily intake of brown and white rice for each survey year. Additionally, we calculated the percentages of the four consumption groups for brown and white rice, adjusting standard errors to account for the multi-stage sampling method involving stratification and clustering. Specifically, using data from the expanded survey in 2016, we compared mean intakes of nutrients between individuals who consumed brown rice and those who exclusively consumed white rice. We also examined differences in mean intakes of food items between the groups over time, including legumes, nuts, vegetables, fruits, fish, red meat, processed meat, and dairy products.
We performed a pooled analysis of data from surveys conducted during 2013–2015 and 2017–2019 to estimate the odds ratios for brown rice consumption using multivariable logistic regression (n = 31,675). Participants who abstained from both brown and white rice consumption were excluded from the regression analysis. The dependent variable was binary, indicating whether an adult consumed brown rice (coded as 1) or only white rice (coded as 0). Independent variables included sociodemographic characteristics (sex, age, municipality of residence, households without children aged under 6 years old, and educational background), health behaviors (body mass index, regular exercise, smoking status, and alcohol consumption), and survey year. Detailed information on the data sources and categories for these independent variables is provided in Table 1. To account for correlations within households, we adjusted for standard errors of odds ratios accordingly. All analyses were performed using Stata/MP 18 (StataCorp LLC, College Station, Texas, USA). Statistical significance was defined as two-sided P-values < 0.05.
3. Results
The 95th percentile of daily brown rice intake among adults aged ≥ 20 years old consistently remained at 0.0 grams throughout the study period (Table 2). The median daily intake of white rice decreased from 151.0 grams (interquartile range: 95.2–214.3) in 2012 to 123.8 grams (interquartile range: 71.4–190.5) in 2019. These trends were observed in both females and males.
Over 90% of adults consumed only white rice, with the percentage significantly declining from 94.1% (95% confidence interval [CI]: 93.6–94.5) in 2012 to 91.2% (95% CI: 89.9–92.2) in 2019 (Table 3). The percentage of brown rice consumers increased from 1.8% (95% CI: 1.6–2.1) in 2012 to 2.3% (95% CI: 1.8–3.0) in 2019, and the majority of this group consumed brown rice in combination with white rice. The percentage of adults who consumed neither type of rice significantly increased from 4.1% (95% CI: 3.8–4.5) in 2012 to 6.2% (95% CI: 5.4–7.1) in 2019. All of these trends were observed in both females and males. The percentage of brown rice consumers was significantly higher among female than male respondents, except in 2013 (P = 0.09), 2015 (P = 0.38), and 2018 (P = 0.06).
In 2016, both female and male consumers of brown rice had significantly higher mean intake levels of macronutrients, compared with white rice consumers, such as plant-based protein, plant-based fat, and omega-6 fatty acids, as well as dietary fibers, and most vitamins and minerals (Table 4). Notably, the mean intake of vitamins A, K, B12, and C, which are scarce in grains, was higher for brown rice consumers compared with those who consumed only white rice.
Brown rice consumers exhibited a significantly higher mean intake of legumes, vegetables, and fruits in both sexes, as well as nuts in female respondents, compared with those who consumed only white rice across all or most of the survey years (Figure 1). However, there was no significant difference in mean fish intake between the groups. Mean intakes of red meat and processed meat tended to be lower in brown rice consumers compared with white rice consumers, although statistical significance was not observed in most of the study period. Similarly, the mean intake of dairy products tended to be higher for brown rice consumers than white rice consumers, but this difference was not statistically significant in most of the study period.
After adjusting for confounding factors, brown rice consumption exhibited significant positive associations with certain sociodemographic characteristics (Table 5). These characteristics included female adults (P = 0.043), older adults (P = 0.003 for the 50–59 years and 60–69 years age groups, and P = 0.006 for the 70–79 years age group), residents of one of 21 major cities (P = 0.011), individuals living in households without children aged under 6 years old (P = 0.005), and those educated at a junior/career college or a university/graduate school (P < 0.001). Additionally, in terms of health behaviors, individuals were significantly more likely to consume brown rice if they had a lower body mass index (P = 0.002 for < 18.5 kg/m2, and P < 0.001 for 18.5 to < 25.0 kg/m2), engaged in regular exercise (P < 0.001), and were former or never smokers (P < 0.001).
4. Discussion
To the best of our knowledge, this study represents the first examination of the national trends and characteristics of brown rice consumption in Japan. Our results revealed that only 2% of the adult population incorporated brown rice either exclusively or alongside white rice in their diet, while approximately 90% consumed exclusively white rice. This level of brown rice consumption was close to national estimates in the United States during the 2000s, which ranged from 1% to 3% [13,14]. However, considering that rice serves as the main staple food in Japan, the adoption of brown rice consumption appears to lag even further behind that in the United States, in which rice is not a primary dietary staple for the majority of the population. The slow progress in embracing one of the most familiar whole grains may underscore the overall limited intake of whole grains in Japan. This evidence will be instrumental in formulating nutrition policies focused on whole grain intake in Japan, where there is currently no specific policy endorsing whole grains, despite the presence of official dietary recommendations in the United States and several other countries [24,25].
The current results support the potential advantages of incorporating brown rice into dietary patterns, because it correlates with increased consumption of plant-based foods such as vegetables, legumes, nuts, and fruits, all of which are essential components of a healthy, environmentally sustainable diet [2]. Notably, individuals who consume brown rice demonstrated a higher intake of vegetables and legumes compared with white rice consumers, highlighting their preference for plant-based nutrition. However, our analysis suggested that brown rice consumption was not consistently correlated with the intake of animal-source foods, including fish, red meat, processed meats, and dairy products. Specifically, brown rice consumers may not necessarily favor fish over red meat as a healthier protein source, which may appear counterintuitive considering the recommended role of fish in promoting cardiovascular health [26]. One plausible explanation is that both brown rice and white rice consumers consume fish to a similar extent, assuming the common dietary practice of pairing rice with fish [27]. This observation may align with broader national trends of declining fish consumption and rising meat consumption per capita in recent decades [28].
Our results revealed correlations between brown rice consumption and increased intake of essential nutrients, some of which are not naturally present in brown rice. Integrating brown rice into one’s diet may promote balanced nutrition by fostering the consumption of other plant-based foods, as mentioned earlier. A prior study conducted in the United States revealed that individuals who consumed either white or brown rice had greater intakes of macronutrients compared with non-rice consumers [13]. The current findings contribute to the existing literature by confirming that consumers of brown rice exhibit even higher intakes of essential nutrients than those who consume only white rice. These results may be helpful for clarifying the mechanism underlying the association between brown rice intake and a reduced risk of type 2 diabetes [11].
Incorporating brown rice into the diet presents a challenge for many Japanese people. For example, cooking brown rice requires more time and attention compared with white rice. Additionally, the texture and flavor of brown rice may not be as universally appealing as those of white rice, posing difficulties for individuals with large families. Previous studies conducted in Asia, Latin America, and Africa have identified various barriers to the acceptance of brown rice, including limited awareness of its nutritional benefits, and its particular sensory attributes [29,30,31,32,33,34,35,36]. Practical constraints related to market availability, price, and cooking requirements also contribute to these barriers. These previous studies suggested various strategies to improve the acceptance of brown rice, such as health education to correct misperceptions regarding the quality of brown rice, introducing it at an early age through school lunches, and efforts to lower costs and increase availability.
Our observations regarding the specific characteristics of brown rice consumers highlight key target groups for effectively increasing the prevalence of brown rice consumption. These groups include females, older individuals, residents of major cities, individuals with higher education levels, and those who lead healthier lifestyles. Disparities may exist across groups in terms of awareness of healthy diets and access to brown rice products. For example, compared with rural residents, residents of major cities may have greater access to nutritional information about brown rice and be able to purchase brown rice products that are readily available at local grocery retailers. Prioritizing the expansion of brown rice consumption within these target groups could facilitate the gradual dissemination of awareness regarding its benefits to other groups that are less informed or knowledgeable. Additionally, it should be noted that individuals living with very young children may tend to avoid brown rice because of concerns about its slower digestion and absorption, and the potential to cause stomach discomfort.
One of the strengths of the current study is the utilization of individual-level food intake records from national surveys, which allowed for the assessment of brown rice consumption across the entire country for the first time in Japan. Previous research on brown rice intake in the general population has been limited in Japan, with one cohort study focusing on employees of a food manufacturing company [16]. Additionally, national intake of brown rice has been examined in only a few studies in the United States using the National Health and Nutrition Examination Surveys [13,14]. Therefore, the current findings are novel, demonstrating the distribution of brown and white rice intake, as well as the sociodemographic characteristics associated with brown rice consumption in Japan.
The current study involved several limitations that should be considered when interpreting the results. First, the response rates of households in the NHNS ranged from 44.4% in 2016 to 67.2% in 2014 [17]. Consequently, the possibility of selection bias cannot be ignored. Second, in investigating the intake of brown rice, we did not consider the consumption of multigrain rice, although it also contains nutrients that may contribute to the prevention of noncommunicable diseases [16,37]. Third, the current findings were derived from cross-sectional data, which did not allow for the establishment of any causal relationships between brown rice intake and individual characteristics or nutrient intake.
In conclusion, although only a small minority of adults in Japan consume brown rice, it is associated with increased intake of plant-based foods and essential nutrients. The initial approach to promoting brown rice consumption should target individuals exhibiting sociodemographic characteristics and health behaviors that are conducive to incorporating it into their diets. Embracing a brown rice-based diet could ultimately contribute to achieving a more sustainable dietary pattern to promote planetary health and the environment.
Supplementary Materials
The following supporting information can be downloaded at the website of this paper posted on Preprints.org.
Funding
This research was funded by Isyoku-Dogen Research Foundation (grant number IDF#220001). The funder had no role in the design, analysis or writing of this article.
Declaration of interests
The authors declare no conflicts of interest.
Authorship
N. I. designed the study, analyzed the data, wrote the manuscript and was primarily responsible for the final content. M. Y. and N. N. interpreted the results and reviewed the drafts. All authors read and approved the final manuscript.
Acknowledgments
We thank Benjamin Knight, MSc., from Edanz (https://jp.edanz.com/ac) for editing a draft of this manuscript.
References
- FAO and WHO. Sustainable healthy diets – Guiding principles; FAO and WHO: Rome, 2019.
- Willett, W.; Rockstrom, J.; Loken, B.; Springmann, M.; Lang, T.; Vermeulen, S.; Garnett, T.; Tilman, D.; DeClerck, F.; Wood, A.; et al. Food in the Anthropocene: the EAT-Lancet Commission on healthy diets from sustainable food systems. Lancet. 2019, 393, 447-492.
- Aune, D.; Keum, N.; Giovannucci, E.; Fadnes, L.T.; Boffetta, P.; Greenwood, D.C.; Tonstad, S.; Vatten, L.J.; Riboli, E.; Norat, T. Whole grain consumption and risk of cardiovascular disease, cancer, and all cause and cause specific mortality: systematic review and dose-response meta-analysis of prospective studies. BMJ. 2016, 353, i2716. [CrossRef]
- Aune, D.; Chan, D.S.; Lau, R.; Vieira, R.; Greenwood, D.C.; Kampman, E.; Norat, T. Dietary fibre, whole grains, and risk of colorectal cancer: systematic review and dose-response meta-analysis of prospective studies. BMJ. 2011, 343, d6617. [CrossRef]
- Hu, Y.; Ding, M.; Sampson, L.; Willett, W.C.; Manson, J.E.; Wang, M.; Rosner, B.; Hu, F.B.; Sun, Q. Intake of whole grain foods and risk of type 2 diabetes: results from three prospective cohort studies. BMJ. 2020, 370, m2206. [CrossRef]
- Juan, J.; Liu, G.; Willett, W.C.; Hu, F.B.; Rexrode, K.M.; Sun, Q. Whole Grain Consumption and Risk of Ischemic Stroke: Results From 2 Prospective Cohort Studies. Stroke. 2017, 48, 3203-3209. [CrossRef]
- GBD Risk Factors Collaborators Global burden of 87 risk factors in 204 countries and territories, 1990-2019: a systematic analysis for the Global Burden of Disease Study 2019. Lancet. 2020, 396, 1223-1249.
- Micha, R.; Khatibzadeh, S.; Shi, P.; Andrews, K.G.; Engell, R.E.; Mozaffarian, D.; Global Burden of Diseases, N.; Chronic Diseases Expert, G. Global, regional and national consumption of major food groups in 1990 and 2010: a systematic analysis including 266 country-specific nutrition surveys worldwide. BMJ Open. 2015, 5, e008705. [CrossRef]
- Yoshiike, N.; Hayashi, F.; Takemi, Y.; Mizoguchi, K.; Seino, F. A New Food Guide in Japan: The Japanese Food Guide Spinning Top. Nutrition Reviews. 2007, 65, 149-154.
- Ministry of Education, Culture, Sports, Science, and Technology; Ministry of Health, Labour and Welfare; Ministry of Agriculture, Forestry and Fisheries. Main points of the revision of "Dietary guidelines for Japanese". 2016. Available online: https://www.maff.go.jp/j/syokuiku/attach/pdf/shishinn-10.pdf (accessed on April 15, 2024).
- Yu, J.; Balaji, B.; Tinajero, M.; Jarvis, S.; Khan, T.; Vasudevan, S.; Ranawana, V.; Poobalan, A.; Bhupathiraju, S.; Sun, Q.; et al. White rice, brown rice and the risk of type 2 diabetes: a systematic review and meta-analysis. BMJ Open. 2022, 12, e065426. [CrossRef]
- Sun, Q.; Spiegelman, D.; van Dam, R.M.; Holmes, M.D.; Malik, V.S.; Willett, W.C.; Hu, F.B. White rice, brown rice, and risk of type 2 diabetes in US men and women. Arch Intern Med. 2010, 170, 961-969. [CrossRef]
- Kennedy, E.; Luo, H. Association between Rice Consumption and Selected Indicators of Dietary and Nutritional Status using National Health and Nutrition Examination Survey 2007–2008. Ecology of Food and Nutrition. 2015, 54, 224-239. [CrossRef]
- Batres-Marquez, S.P.; Jensen, H.H.; Upton, J. Rice consumption in the United States: recent evidence from food consumption surveys. J Am Diet Assoc. 2009, 109, 1719-1727. [CrossRef]
- Nanri, A.; Mizoue, T.; Noda, M.; Takahashi, Y.; Kato, M.; Inoue, M.; Tsugane, S. Rice intake and type 2 diabetes in Japanese men and women: the Japan Public Health Center–based Prospective Study123. The American Journal of Clinical Nutrition. 2010, 92, 1468-1477. [CrossRef]
- Sawada, K.; Takemi, Y.; Murayama, N.; Ishida, H. Relationship between rice consumption and body weight gain in Japanese workers: white versus brown rice/multigrain rice. Applied Physiology, Nutrition, and Metabolism. 2019, 44, 528-532. [CrossRef]
- Ministry of Health, Labour and Welfare. National Health and Nutrition Survey. Available online: http://www.mhlw.go.jp/bunya/kenkou/kenkou_eiyou_chousa.html (accessed on March 12, 2024).
- Government of Japan. Statistics Act. 2007. Available online: https://www.japaneselawtranslation.go.jp/ja/laws/view/148 (accessed on March 12, 2024).
- Ministry of Education, Culture, Sports, Science, and Technology; Ministry of Health, Labour and Welfare; Ministry of Economy, Trade and Industry. Ethical guidelines for medical and biological research involving human subjects. 2021. Available online: https://www.lifescience.mext.go.jp/files/pdf/n2373_01.pdf (accessed on March 12, 2024).
- Ikeda, N.; Takimoto, H.; Imai, S.; Miyachi, M.; Nishi, N. Data Resource Profile: The Japan National Health and Nutrition Survey (NHNS). Int J Epidemiol. 2015, 44, 1842-1849. [CrossRef]
- Ministry of Education, Culture, Sports, Science, and Technology, Standard tables of food composition in Japan - 2010 -. 2010.
- Ministry of Education, Culture, Sports, Science, and Technology. Standard tables of food composition in Japan - 2015 - (Seventh revised edition). 2015. Available online: https://www.mext.go.jp/en/policy/science_technology/policy/title01/detail01/1374030.htm (accessed on March 12, 2024).
- Ikeda, N.; Nishi, N. Key variable combinations for identifying non-participants in the Japan National Health and Nutrition Survey through record linkage with the Comprehensive Survey of Living Conditions. Nihon Koshu Eisei Zasshi. 2019, 66, 210-218.
- Korczak, R.; Slavin, J.L. Definitions, regulations, and new frontiers for dietary fiber and whole grains. Nutrition Reviews. 2020, 78, 6-12. [CrossRef]
- Miller, K.B. Review of whole grain and dietary fiber recommendations and intake levels in different countries. Nutrition Reviews. 2020, 78, 29-36. [CrossRef]
- Lichtenstein, A.H.; Appel, L.J.; Vadiveloo, M.; Hu, F.B.; Kris-Etherton, P.M.; Rebholz, C.M.; Sacks, F.M.; Thorndike, A.N.; Van Horn, L.; Wylie-Rosett, J. 2021 Dietary Guidance to Improve Cardiovascular Health: A Scientific Statement From the American Heart Association. Circulation. 2021, 144, e472-e487. [CrossRef]
- Murakami, K.; Livingstone, M.B.E.; Sasaki, S. Meal-specific dietary patterns and their contribution to overall dietary patterns in the Japanese context: Findings from the 2012 National Health and Nutrition Survey, Japan. Nutrition. 2019, 59, 108-115. [CrossRef]
- Fisheries Agency. Fisheries of Japan - FY 2022 (2021/2023) 2023. Available online: https://www.jfa.maff.go.jp/e/annualreport/attach/pdf/index-1.pdf (accessed on March 28, 2024).
- Adebamowo, S.N.; Eseyin, O.; Yilme, S.; Adeyemi, D.; Willett, W.C.; Hu, F.B.; Spiegelman, D.; Adebamowo, C.A.; , T.G.N.E.T.I. A Mixed-Methods Study on Acceptability, Tolerability, and Substitution of Brown Rice for White Rice to Lower Blood Glucose Levels among Nigerian Adults. Frontiers in Nutrition. 2017, 4.
- Cabral, D.; Moura, A.P.; Fonseca, S.C.; Oliveira, J.C.; Cunha, L.M. Exploring Rice Consumption Habits and Determinants of Choice, Aiming for the Development and Promotion of Rice Products with a Low Glycaemic Index. Foods. 2024, 13, 301. [CrossRef]
- Gondal, T.A.; Keast, R.S.J.; Shellie, R.A.; Jadhav, S.R.; Gamlath, S.; Mohebbi, M.; Liem, D.G. Consumer Acceptance of Brown and White Rice Varieties. Foods. 2021, 10, 1950. [CrossRef]
- Gyawali, P.; Tamrakar, D.; Shrestha, A.; Shrestha, H.; Karmacharya, S.; Bhattarai, S.; Bhandari, N.; Malik, V.; Mattei, J.; Spiegelman, D.; Shrestha, A. Consumer acceptance and preference for brown rice-A mixed-method qualitative study from Nepal. Food Sci Nutr. 2022, 10, 1864-1874. [CrossRef]
- Monge-Rojas, R.; Mattei, J.; Fuster, T.; Willett, W.; Campos, H. Influence of sensory and cultural perceptions of white rice, brown rice and beans by Costa Rican adults in their dietary choices. Appetite. 2014, 81, 200-208. [CrossRef]
- Muhihi, A.; Gimbi, D.; Njelekela, M.; Shemaghembe, E.; Mwambene, K.; Chiwanga, F.; Malik, V.S.; Wedick, N.M.; Spiegelman, D.; Hu, F.B.; Willett, W.C. Consumption and acceptability of whole grain staples for lowering markers of diabetes risk among overweight and obese Tanzanian adults. Globalization and Health. 2013, 9, 26. [CrossRef]
- Sudha, V.; Spiegelman, D.; Hong, B.; Malik, V.; Jones, C.; Wedick, N.M.; Hu, F.B.; Willett, W.; Bai, M.R.; Ponnalagu, M.M.; et al. Consumer Acceptance and Preference Study (CAPS) on Brown and Undermilled Indian Rice Varieties in Chennai, India. Journal of the American College of Nutrition. 2013, 32, 50-57. [CrossRef]
- Zhang, G.; Malik, V.S.; Pan, A.; Kumar, S.; Holmes, M.D.; Spiegelman, D.; Lin, X.; Hu, F.B. Substituting Brown Rice for White Rice to Lower Diabetes Risk: A Focus-Group Study in Chinese Adults. Journal of the American Dietetic Association. 2010, 110, 1216-1221. [CrossRef]
- Ryu, S.H.; Wang, Z.L.; Kim, S.J.; Cho, H.J. Effects of multigrain rice and white rice on periodontitis: an analysis using data from the Korea National Health and Nutrition Examination Survey 2012-2015. Epidemiol Health. 2023, 45, e2023063. [CrossRef]
- National Institutes of Biomedical Innovation, Health and Nutrition. Definitions and assessment criteria for the Physical Status Questionnaire component of of the National Health and Nutrition Survey. Healteh Japan 21 (the second term) Analysis and Assessment Project. Available online: https://www.nibiohn.go.jp/eiken/kenkounippon21/eiyouchousa/annotation_shintai.html (accessed on March 27, 2024).
- National Institutes of Biomedical Innovation, Health and Nutrition. Definitions and assessment criteria for the Lifestyle Habits Questionnaire component of the National Health and Nutrition Survey. Health Japan 21 (the second term) Analysis and Assessment Project. Available online: https://www.nibiohn.go.jp/eiken/kenkounippon21/eiyouchousa/annotation_seikatsu.html#01 (accessed on March 27, 2024).
Figure 1.
Mean daily food intake among adults aged ≥20 years consuming brown rice and those consuming only white rice, based on the National Health and Nutrition Surveys, Japan, 2012–2019. Orange color, brown rice consumers; blue color, white rice consumers. Shaded areas show the 95% confidence interval.
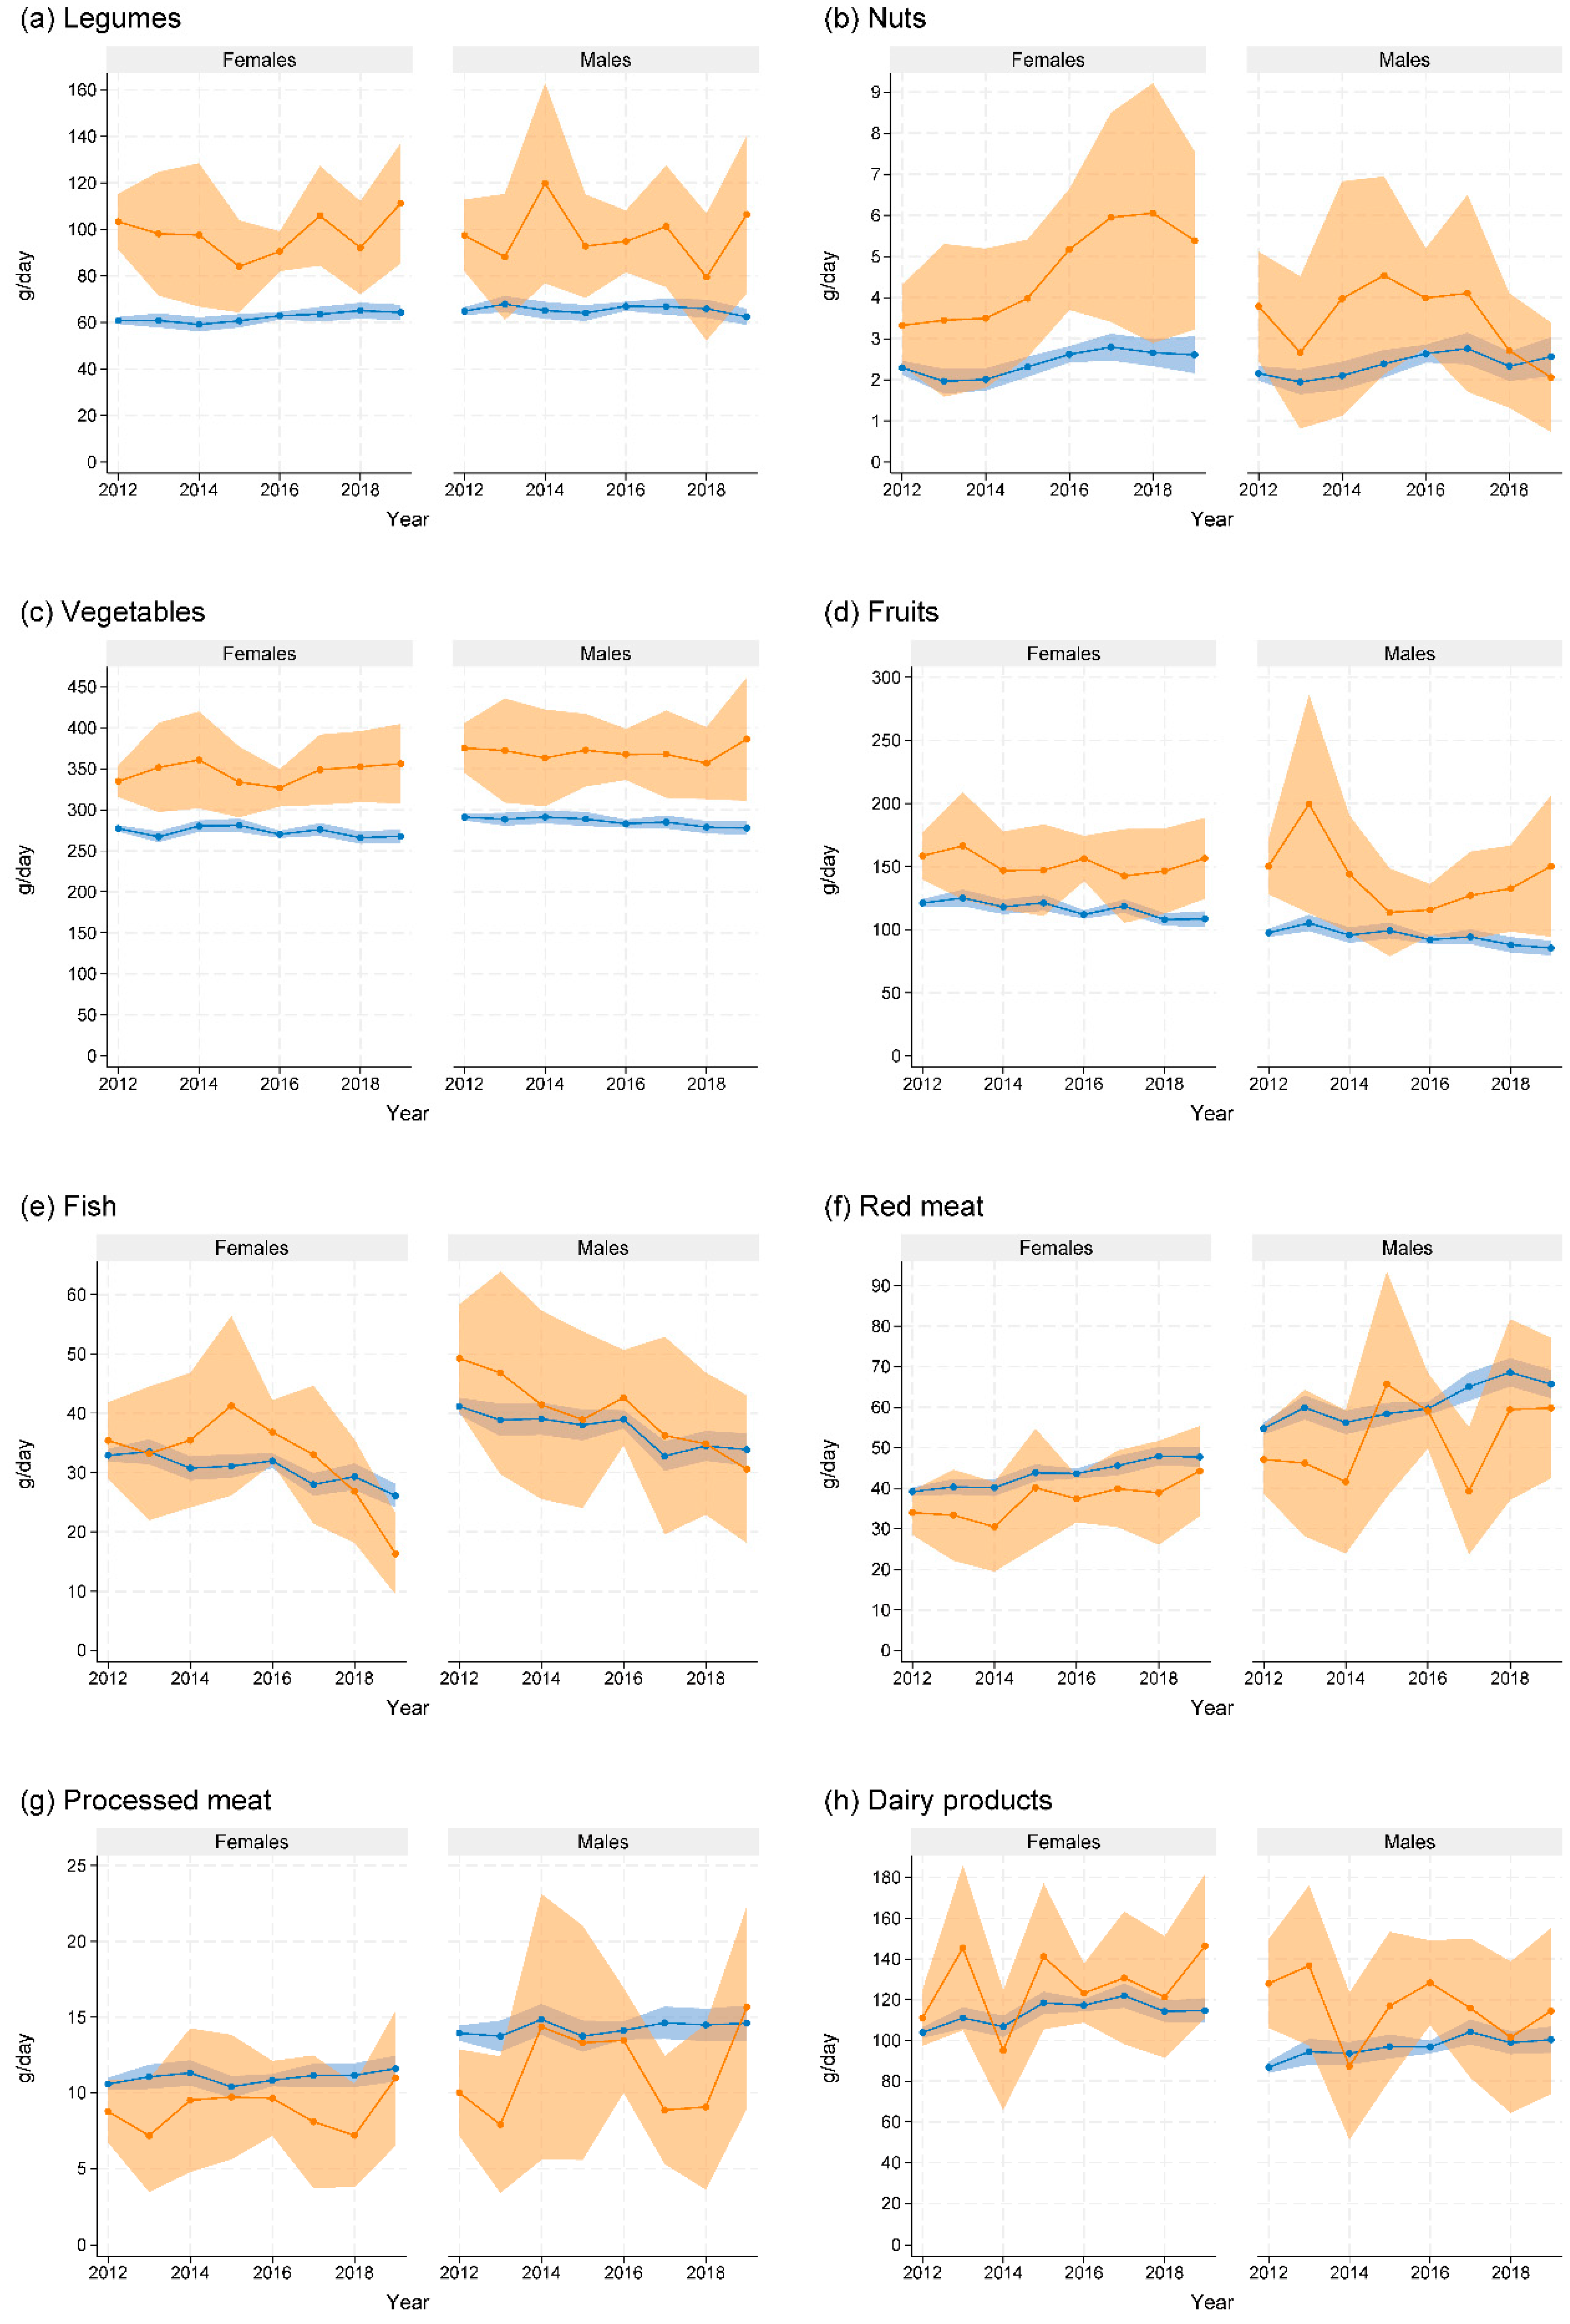

Table 1.
Description of independent variables used in the multivariable logistic regression analysis of brown rice consumption, on the basis of data from the National Health and Nutrition Survey and the Comprehensive Survey on Living Conditions, Japan, 2013–2015 and 2017–2019.
Table 1.
Description of independent variables used in the multivariable logistic regression analysis of brown rice consumption, on the basis of data from the National Health and Nutrition Survey and the Comprehensive Survey on Living Conditions, Japan, 2013–2015 and 2017–2019.
| Data source, characteristics, values | Reference categories |
|---|---|
| National Health and Nutrition Survey | |
| Sex | |
| Females, males | Males |
| Age, years | |
| 20–29; 30–39; 40–49; 50–59; 60–69; 70–79; ≥ 80 | 20–29 years |
| Municipality of residence | |
| 21 major cities; other cities; towns/villages | Other cities |
| Body mass index, kg/m2 a | |
| < 18.5; 18.5 to < 25.0; 25.0 to < 30.0; ≥ 30.0; missing | ≥ 25.0 kg/m2 |
| Regular exercise habit b | |
| Absent; present; missing | Absent |
| Smoking status c | |
| Former/never smoker; daily/occasional smoker; missing | Daily/occasional smoker |
| Alcohol consumption (2014, 2015, 2017–2019) d | |
| Non-drinker; drinker; missing | Drinker |
| Comprehensive Survey on Living Conditions | |
| Educational background | |
| Elementary/junior high school; senior high school; junior/career college; university/graduate school; unknown | Elementary/junior high school |
| Households without children aged < 6 years | |
| Not applicable; applicable | Not applicable |
| Alcohol consumption (2013) d | |
| Non-drinker; drinker; missing | Drinker |
| Survey year | |
| 2013, 2014, 2015, 2017, 2018, 2019 | 2013 |
a In the physical examination, standing height was measured to the nearest millimeter using a stadiometer while participants were barefoot. Weight was measured to the nearest 0.1 kg with participants wearing light clothing. Body mass index was calculated as weight in kilograms divided by the square of height in meters. b Participants in the physical examination were classified as regular exercisers if they reported consistently engaging in exercise sessions of at least 30 minutes, at least twice a week, for over a year [38]. c Participants were categorized as former/never smokers if they selected “Have smoked previously but not smoked for more than one month” or “Have never smoked,” and as daily/occasional smokers if they reported “Smoking daily” or “Smoking on occasion” in response to the question “Do you smoke?” in the lifestyle habits questionnaire. d Participants were classified as drinkers if they reported consuming alcoholic beverages equivalent to one or more cups of Japanese sake, typically containing 15% alcohol by volume and a volume of 180 ml each, for three days per week or more frequently [39]. The National Health and Nutrition Survey in 2013 did not include questions on alcohol consumption. Instead, data on alcohol drinking habits were obtained from the health questionnaire of the Comprehensive Survey on Living Conditions.
Table 2.
Percentiles of daily intake of brown rice and white rice in grams among participants aged ≥ 20 years from the National Health and Nutrition Surveys, Japan, 2012–2019.
Table 2.
Percentiles of daily intake of brown rice and white rice in grams among participants aged ≥ 20 years from the National Health and Nutrition Surveys, Japan, 2012–2019.
| Year | n | Brown rice intake, grams/day | White rice intake, grams/day | ||||||||||||||||
|---|---|---|---|---|---|---|---|---|---|---|---|---|---|---|---|---|---|---|---|
| Percentiles | Percentiles | ||||||||||||||||||
| 1st | 5th | 10th | 25th | 50th | 75th | 90th | 95th | 99th | 1st | 5th | 10th | 25th | 50th | 75th | 90th | 95th | 99th | ||
| Both sexes | |||||||||||||||||||
| 2012 | 26,726 | 0.0 | 0.0 | 0.0 | 0.0 | 0.0 | 0.0 | 0.0 | 0.0 | 57.1 | 0.0 | 16.0 | 51.4 | 95.2 | 151.0 | 214.3 | 285.7 | 314.3 | 417.1 |
| 2013 | 6,481 | 0.0 | 0.0 | 0.0 | 0.0 | 0.0 | 0.0 | 0.0 | 0.0 | 57.1 | 0.0 | 0.0 | 47.6 | 89.0 | 142.9 | 198.1 | 266.7 | 304.2 | 402.9 |
| 2014 | 6,727 | 0.0 | 0.0 | 0.0 | 0.0 | 0.0 | 0.0 | 0.0 | 0.0 | 42.4 | 0.0 | 0.0 | 47.6 | 95.2 | 142.9 | 200.0 | 266.7 | 309.5 | 419.0 |
| 2015 | 6,172 | 0.0 | 0.0 | 0.0 | 0.0 | 0.0 | 0.0 | 0.0 | 0.0 | 71.4 | 0.0 | 0.0 | 45.6 | 81.0 | 138.8 | 190.5 | 261.9 | 297.6 | 400.0 |
| 2016 | 21,851 | 0.0 | 0.0 | 0.0 | 0.0 | 0.0 | 0.0 | 0.0 | 0.0 | 66.7 | 0.0 | 0.0 | 47.6 | 85.7 | 142.9 | 193.8 | 261.9 | 295.2 | 393.3 |
| 2017 | 5,750 | 0.0 | 0.0 | 0.0 | 0.0 | 0.0 | 0.0 | 0.0 | 0.0 | 66.7 | 0.0 | 0.0 | 41.7 | 76.2 | 133.3 | 190.5 | 257.1 | 291.4 | 392.9 |
| 2018 | 5,743 | 0.0 | 0.0 | 0.0 | 0.0 | 0.0 | 0.0 | 0.0 | 0.0 | 71.4 | 0.0 | 0.0 | 42.9 | 81.0 | 133.3 | 190.5 | 261.0 | 295.2 | 397.6 |
| 2019 | 4,927 | 0.0 | 0.0 | 0.0 | 0.0 | 0.0 | 0.0 | 0.0 | 0.0 | 66.7 | 0.0 | 0.0 | 38.1 | 71.4 | 123.8 | 190.5 | 247.6 | 285.7 | 372.9 |
| Females | |||||||||||||||||||
| 2012 | 14,461 | 0.0 | 0.0 | 0.0 | 0.0 | 0.0 | 0.0 | 0.0 | 0.0 | 60.0 | 0.0 | 0.0 | 47.6 | 77.1 | 128.6 | 176.2 | 226.7 | 259.8 | 309.5 |
| 2013 | 3,483 | 0.0 | 0.0 | 0.0 | 0.0 | 0.0 | 0.0 | 0.0 | 0.0 | 66.7 | 0.0 | 0.0 | 42.9 | 71.4 | 116.7 | 166.7 | 214.3 | 247.6 | 290.5 |
| 2014 | 3,615 | 0.0 | 0.0 | 0.0 | 0.0 | 0.0 | 0.0 | 0.0 | 0.0 | 47.6 | 0.0 | 0.0 | 45.0 | 71.4 | 118.6 | 166.7 | 209.5 | 238.1 | 285.7 |
| 2015 | 3,332 | 0.0 | 0.0 | 0.0 | 0.0 | 0.0 | 0.0 | 0.0 | 0.0 | 71.4 | 0.0 | 0.0 | 33.3 | 71.4 | 111.1 | 166.7 | 214.3 | 242.9 | 309.5 |
| 2016 | 11,864 | 0.0 | 0.0 | 0.0 | 0.0 | 0.0 | 0.0 | 0.0 | 0.0 | 65.7 | 0.0 | 0.0 | 38.1 | 71.4 | 114.3 | 166.5 | 214.3 | 238.1 | 285.7 |
| 2017 | 3,054 | 0.0 | 0.0 | 0.0 | 0.0 | 0.0 | 0.0 | 0.0 | 0.0 | 71.4 | 0.0 | 0.0 | 28.6 | 64.3 | 104.0 | 158.6 | 204.8 | 234.3 | 285.7 |
| 2018 | 3,080 | 0.0 | 0.0 | 0.0 | 0.0 | 0.0 | 0.0 | 0.0 | 0.0 | 71.4 | 0.0 | 0.0 | 33.3 | 71.4 | 104.8 | 156.0 | 207.1 | 238.1 | 285.7 |
| 2019 | 2,630 | 0.0 | 0.0 | 0.0 | 0.0 | 0.0 | 0.0 | 0.0 | 0.0 | 71.4 | 0.0 | 0.0 | 23.8 | 60.0 | 97.6 | 152.4 | 200.0 | 228.6 | 285.7 |
| Males | |||||||||||||||||||
| 2012 | 12,265 | 0.0 | 0.0 | 0.0 | 0.0 | 0.0 | 0.0 | 0.0 | 0.0 | 47.6 | 0.0 | 47.6 | 71.4 | 123.8 | 190.5 | 252.4 | 314.3 | 358.6 | 457.1 |
| 2013 | 2,998 | 0.0 | 0.0 | 0.0 | 0.0 | 0.0 | 0.0 | 0.0 | 0.0 | 47.6 | 0.0 | 38.1 | 71.4 | 104.8 | 176.2 | 238.1 | 303.8 | 342.9 | 428.6 |
| 2014 | 3,112 | 0.0 | 0.0 | 0.0 | 0.0 | 0.0 | 0.0 | 0.0 | 0.0 | 14.8 | 0.0 | 47.6 | 71.4 | 114.3 | 185.7 | 238.1 | 309.5 | 357.1 | 457.1 |
| 2015 | 2,840 | 0.0 | 0.0 | 0.0 | 0.0 | 0.0 | 0.0 | 0.0 | 0.0 | 57.1 | 0.0 | 0.0 | 57.1 | 95.2 | 171.4 | 238.1 | 295.2 | 342.9 | 433.3 |
| 2016 | 9,987 | 0.0 | 0.0 | 0.0 | 0.0 | 0.0 | 0.0 | 0.0 | 0.0 | 71.4 | 0.0 | 25.0 | 67.5 | 108.6 | 173.8 | 238.1 | 295.2 | 335.7 | 433.3 |
| 2017 | 2,696 | 0.0 | 0.0 | 0.0 | 0.0 | 0.0 | 0.0 | 0.0 | 0.0 | 58.6 | 0.0 | 0.0 | 57.1 | 95.2 | 166.7 | 228.6 | 290.5 | 333.3 | 442.9 |
| 2018 | 2,663 | 0.0 | 0.0 | 0.0 | 0.0 | 0.0 | 0.0 | 0.0 | 0.0 | 72.0 | 0.0 | 0.0 | 57.1 | 95.2 | 164.3 | 228.6 | 295.2 | 336.7 | 428.6 |
| 2019 | 2,297 | 0.0 | 0.0 | 0.0 | 0.0 | 0.0 | 0.0 | 0.0 | 0.0 | 42.6 | 0.0 | 0.0 | 50.0 | 95.2 | 161.9 | 219.0 | 285.7 | 319.0 | 428.6 |
Table 3.
Percentages of adults aged ≥ 20 years old by combination of brown rice and white rice consumption, estimated from the National Health and Nutrition Surveys, Japan, 2012–2019.
Table 3.
Percentages of adults aged ≥ 20 years old by combination of brown rice and white rice consumption, estimated from the National Health and Nutrition Surveys, Japan, 2012–2019.
| Year | Brown rice | White rice only | Neither | ||
|---|---|---|---|---|---|
| Total | Brown rice only | Combined with white rice | |||
| Both sexes | |||||
| 2012 | 1.8 (1.6, 2.1) | 0.7 (0.6, 0.9) | 1.1 (0.9, 1.3) | 94.1 (93.6, 94.5) | 4.1 (3.8, 4.5) |
| 2013 | 1.7 (1.3, 2.2) | 0.8 (0.5, 1.2) | 0.8 (0.6, 1.2) | 93.7 (92.9, 94.4) | 4.7 (4.1, 5.4) |
| 2014 | 1.6 (1.2, 2.1) | 0.6 (0.4, 0.8) | 1.0 (0.7, 1.4) | 93.8 (93.0, 94.6) | 4.6 (4.0, 5.3) |
| 2015 | 2.4 (1.9, 3.1) | 1.0 (0.7, 1.4) | 1.5 (1.1, 2.0) | 91.7 (90.6, 92.7) | 5.9 (5.1, 6.8) |
| 2016 | 2.3 (2.1, 2.6) | 0.8 (0.7, 1.0) | 1.4 (1.2, 1.7) | 92.7 (92.2, 93.2) | 5.0 (4.7, 5.5) |
| 2017 | 2.2 (1.8, 2.8) | 1.0 (0.7, 1.3) | 1.2 (0.9, 1.6) | 91.7 (90.8, 92.6) | 6.1 (5.4, 6.9) |
| 2018 | 2.4 (1.9, 2.9) | 1.0 (0.8, 1.4) | 1.5 (1.2, 2.1) | 91.6 (90.6, 92.5) | 5.8 (5.0, 6.7) |
| 2019 | 2.3 (1.8, 3.0) | 1.3 (0.9, 1.7) | 1.4 (1.0, 1.9) | 91.2 (89.9, 92.2) | 6.2 (5.4, 7.1) |
| Females | |||||
| 2012 | 2.1 (1.8, 2.4) | 0.9 (0.7, 1.0) | 1.2 (1.0, 1.4) | 93.1 (92.5, 93.6) | 4.9 (4.5, 5.3) |
| 2013 | 1.9 (1.4, 2.5) | 0.9 (0.6, 1.4) | 0.9 (0.6, 1.2) | 92.5 (91.5, 93.4) | 5.7 (4.9, 6.6) |
| 2014 | 1.9 (1.5, 2.5) | 0.8 (0.5, 1.2) | 1.1 (0.7, 1.7) | 92.7 (91.5, 93.7) | 5.4 (4.6, 6.4) |
| 2015 | 2.6 (2.0, 3.2) | 1.1 (0.7, 1.5) | 1.5 (1.1, 2.0) | 90.7 (89.4, 91.8) | 6.8 (5.8, 7.9) |
| 2016 | 2.5 (2.2, 2.8) | 0.9 (0.8, 1.1) | 1.5 (1.3, 1.8) | 91.6 (90.9, 92.1) | 6.0 (5.5, 6.6) |
| 2017 | 2.6 (2.1, 3.3) | 1.2 (0.9, 1.7) | 1.3 (0.9, 1.8) | 90.4 (89.2, 91.5) | 7.1 (6.1, 8.1) |
| 2018 | 2.6 (2.1, 3.3) | 1.3 (0.9, 1.8) | 1.6 (1.2, 2.2) | 90.6 (89.4, 91.7) | 6.5 (5.6, 7.6) |
| 2019 | 2.8 (2.1, 3.6) | 1.6 (1.1, 2.3) | 1.6 (1.1, 2.2) | 89.4 (87.9, 90.8) | 7.4 (6.3, 8.6) |
| Males | |||||
| 2012 | 1.5 (1.3, 1.8) | 0.5 (0.4, 0.7) | 1.0 (0.8, 1.2) | 95.2 (94.8, 95.6) | 3.3 (2.9, 3.6) |
| 2013 | 1.5 (1.1, 2.0) | 0.6 (0.4, 1.0) | 0.8 (0.5, 1.2) | 95.0 (94.1, 95.8) | 3.5 (2.9, 4.3) |
| 2014 | 1.2 (0.9, 1.7) | 0.3 (0.2, 0.6) | 0.9 (0.6, 1.3) | 95.2 (94.3, 95.9) | 3.6 (3.0, 4.4) |
| 2015 | 2.3 (1.7, 3.1) | 0.9 (0.6, 1.4) | 1.4 (1.0, 2.0) | 92.9 (91.7, 93.9) | 4.8 (4.0, 5.8) |
| 2016 | 2.1 (1.8, 2.5) | 0.7 (0.6, 0.9) | 1.4 (1.1, 1.6) | 94.0 (93.4, 94.5) | 3.9 (3.5, 4.4) |
| 2017 | 1.8 (1.3, 2.5) | 0.6 (0.4, 1.0) | 1.1 (0.8, 1.7) | 93.2 (92.2, 94.2) | 5.0 (4.2, 5.9) |
| 2018 | 2.1 (1.6, 2.8) | 0.8 (0.5, 1.2) | 1.5 (1.0, 2.2) | 92.8 (91.6, 93.8) | 5.0 (4.1, 5.9) |
| 2019 | 1.8 (1.3, 2.5) | 0.9 (0.6, 1.4) | 1.1 (0.7, 1.7) | 93.1 (91.9, 94.2) | 4.9 (4.1, 5.9) |
Values in parentheses indicate lower and upper ends of 95% confidence intervals.
Table 4.
Mean daily nutrient intake among adults aged ≥ 20 years old consuming brown rice and those consuming white rice exclusively, on the basis of the National Health and Nutrition Survey, Japan, 2016.
Table 4.
Mean daily nutrient intake among adults aged ≥ 20 years old consuming brown rice and those consuming white rice exclusively, on the basis of the National Health and Nutrition Survey, Japan, 2016.
| Females | Males | |||||||||
|---|---|---|---|---|---|---|---|---|---|---|
| Brown rice | White rice only | P-value a | Brown rice | White rice only | P-value a | |||||
| Total energy, kcal | 1,745.7 | (26.9) | 1,692.5 | (5.1) | 0.049 | 2,161.1 | (40.8) | 2,117.4 | (6.9) | 0.288 |
| Water, g | 1,604.6 | (33.6) | 1,479.7 | (7.5) | < 0.001 | 1,796.3 | (47.9) | 1,723.6 | (8.9) | 0.139 |
| Total protein, g | 69.0 | (1.2) | 63.9 | (0.3) | < 0.001 | 82.8 | (1.9) | 76.2 | (0.3) | < 0.001 |
| Animal-based protein, g | 35.4 | (1.0) | 34.1 | (0.2) | 0.201 | 43.8 | (1.5) | 41.5 | (0.3) | 0.135 |
| Plant-based protein, g | 33.6 | (0.6) | 29.7 | (0.1) | < 0.001 | 39.1 | (0.9) | 34.8 | (0.1) | < 0.001 |
| Total fat, g | 54.8 | (1.4) | 51.7 | (0.3) | 0.029 | 66.4 | (1.9) | 60.6 | (0.3) | 0.002 |
| Animal-based fat, g | 24.9 | (0.9) | 25.7 | (0.2) | 0.344 | 33.1 | (1.5) | 31.1 | (0.2) | 0.181 |
| Plant-based fat, g | 30.0 | (1.0) | 26.0 | (0.2) | < 0.001 | 33.2 | (1.2) | 29.4 | (0.2) | 0.001 |
| Saturated fatty acids, g | 14.2 | (0.4) | 14.0 | (0.1) | 0.552 | 17.2 | (0.6) | 15.9 | (0.1) | 0.024 |
| Monounsaturated fatty acids, g | 18.5 | (0.6) | 17.5 | (0.1) | 0.101 | 23.1 | (0.7) | 21.1 | (0.1) | 0.007 |
| Polyunsaturated fatty acids, g | 12.5 | (0.3) | 11.1 | (0.1) | < 0.001 | 14.8 | (0.5) | 13.2 | (0.1) | 0.001 |
| Omega-3 fatty acids, g | 2.2 | (0.1) | 2.1 | (0.0) | 0.302 | 2.6 | (0.1) | 2.5 | (0.0) | 0.525 |
| Omega-6 fatty acids, g | 10.1 | (0.3) | 8.8 | (0.0) | < 0.001 | 12.0 | (0.4) | 10.5 | (0.1) | < 0.001 |
| Cholesterol, mg | 305.5 | (10.0) | 290.1 | (1.8) | 0.127 | 376.0 | (16.7) | 344.2 | (2.2) | 0.061 |
| Carbohydrates, g | 238.9 | (4.1) | 234.3 | (0.7) | 0.269 | 285.4 | (6.3) | 286.7 | (1.0) | 0.848 |
| Total dietary fiber, g | 19.5 | (0.5) | 14.3 | (0.1) | < 0.001 | 21.3 | (0.6) | 15.0 | (0.1) | < 0.001 |
| Soluble dietary fiber, g | 4.5 | (0.1) | 3.3 | (0.0) | < 0.001 | 4.8 | (0.2) | 3.4 | (0.0) | < 0.001 |
| Insoluble dietary fiber, g | 14.3 | (0.3) | 10.5 | (0.1) | < 0.001 | 15.7 | (0.5) | 11.0 | (0.1) | < 0.001 |
| Vitamins | ||||||||||
| Vitamin A, mcg RAE | 642.9 | (33.0) | 502.1 | (8.3) | < 0.001 | 710.7 | (57.8) | 538.8 | (9.8) | 0.004 |
| Vitamin D, mcg | 9.3 | (0.6) | 7.6 | (0.1) | 0.004 | 9.1 | (0.7) | 8.4 | (0.1) | 0.254 |
| Vitamin E, mg | 8.0 | (0.2) | 6.3 | (0.0) | < 0.001 | 8.7 | (0.3) | 6.8 | (0.0) | < 0.001 |
| Vitamin K, mcg | 303.1 | (13.6) | 228.6 | (2.1) | < 0.001 | 347.4 | (19.0) | 247.3 | (2.5) | < 0.001 |
| Vitamin B1, mg | 1.0 | (0.0) | 0.8 | (0.0) | < 0.001 | 1.3 | (0.0) | 0.9 | (0.0) | < 0.001 |
| Vitamin B2, mg | 1.2 | (0.0) | 1.1 | (0.0) | < 0.001 | 1.4 | (0.0) | 1.2 | (0.0) | < 0.001 |
| Niacin equivalents, mg | 18.6 | (0.4) | 13.5 | (0.1) | < 0.001 | 22.6 | (0.7) | 16.5 | (0.1) | < 0.001 |
| Vitamin B6, mg | 1.5 | (0.0) | 1.1 | (0.0) | < 0.001 | 1.8 | (0.1) | 1.2 | (0.0) | < 0.001 |
| Vitamin B12, mcg | 6.7 | (0.4) | 5.8 | (0.1) | 0.030 | 8.2 | (0.6) | 7.0 | (0.1) | 0.043 |
| Folate, mcg | 337.1 | (8.2) | 282.8 | (1.9) | < 0.001 | 365.9 | (11.9) | 300.3 | (2.1) | < 0.001 |
| Pantothenic acid, mg | 6.3 | (0.1) | 5.1 | (0.0) | < 0.001 | 7.4 | (0.2) | 5.8 | (0.0) | < 0.001 |
| Vitamin C, mg | 120.5 | (4.8) | 97.6 | (1.0) | < 0.001 | 116.5 | (5.8) | 93.4 | (1.0) | < 0.001 |
| Minerals | ||||||||||
| Sodium, mg | 3,652.3 | (88.5) | 3,630.0 | (17.0) | 0.805 | 4,279.0 | (121.9) | 4,273.9 | (21.3) | 0.967 |
| Potassium, mg | 2,704.3 | (55.4) | 2,206.1 | (11.0) | < 0.001 | 2,960.0 | (81.8) | 2,366.5 | (12.0) | < 0.001 |
| Calcium, mg | 580.6 | (15.2) | 491.2 | (2.9) | < 0.001 | 621.5 | (20.9) | 502.5 | (3.2) | < 0.001 |
| Magnesium, mg | 332.6 | (6.6) | 231.3 | (1.0) | < 0.001 | 386.2 | (10.2) | 260.2 | (1.2) | < 0.001 |
| Phosphorus, mg | 1,147.3 | (20.4) | 918.7 | (3.8) | < 0.001 | 1,352.2 | (29.9) | 1,054.3 | (4.4) | < 0.001 |
| Iron, mg | 9.2 | (0.2) | 7.3 | (0.0) | < 0.001 | 10.4 | (0.3) | 8.1 | (0.0) | < 0.001 |
| Zinc, mg | 8.1 | (0.1) | 7.3 | (0.0) | < 0.001 | 9.9 | (0.2) | 8.9 | (0.0) | < 0.001 |
| Copper, mg | 1.3 | (0.0) | 1.1 | (0.0) | < 0.001 | 1.4 | (0.0) | 1.3 | (0.0) | < 0.001 |
Values in parentheses represent standard errors. a P-values for the difference in means between groups.
Table 5.
Odds ratios for brown rice consumption among adults aged ≥ 20 years old, on the basis of data from the National Health and Nutrition Surveys and the Comprehensive Survey on Living Conditions, Japan, 2013–2015 and 2017–2019.
Table 5.
Odds ratios for brown rice consumption among adults aged ≥ 20 years old, on the basis of data from the National Health and Nutrition Surveys and the Comprehensive Survey on Living Conditions, Japan, 2013–2015 and 2017–2019.
| Characteristics | n | Bown rice consumers, n (%) | Odds ratio (95% confidence interval) |
|---|---|---|---|
| Total | 31,675 | 721 (2.3) | |
| Sociodemographic characteristics | |||
| Sex | |||
| Females | 16,754 | 437 (2.6) | 1.17 (1.00, 1.35) |
| Males | 14,921 | 284 (1.9) | Reference |
| Age | |||
| 20–29 years | 2,267 | 37 (1.6) | Reference |
| 30–39 years | 3,497 | 64 (1.8) | 1.45 (0.92, 2.28) |
| 40–49 years | 4,969 | 95 (1.9) | 1.32 (0.85, 2.04) |
| 50–59 years | 4,881 | 127 (2.6) | 1.76 (1.22, 2.56) |
| 60–69 years | 6,949 | 185 (2.7) | 1.87 (1.23, 2.85) |
| 70–79 years | 6,103 | 164 (2.7) | 1.85 (1.19, 2.87) |
| ≥ 80 years | 3,009 | 49 (1.6) | 1.19 (0.71, 1.98) |
| Municipality of residence | |||
| 12 major cities | 6,196 | 185 (3.0) | 1.36 (1.07, 1.72) |
| Other cities | 21,843 | 463 (2.1) | Reference |
| Towns/villages | 3,636 | 73 (2.0) | 1.03 (0.74, 1.44) |
| Households without children aged < 6 years | |||
| Not applicable | 3,035 | 38 (1.3) | Reference |
| Applicable | 28,640 | 683 (2.4) | 1.91 (1.22, 2.99) |
| Educational background | |||
| Elementary/junior high school | 4,629 | 74 (1.6) | Reference |
| Senior high school | 12,853 | 249 (1.9) | 1.19 (0.87, 1.63) |
| Junior/career college | 5,406 | 164 (3.0) | 1.90 (1.34, 2.70) |
| University/graduate school | 6,488 | 199 (3.1) | 2.13 (1.49, 3.04) |
| Unknown | 2,299 | 35 (1.5) | 0.90 (0.55, 1.47) |
| Health behaviors | |||
| Body mass index | |||
| < 18.5 kg/m2 | 2,045 | 58 (2.8) | 1.71 (1.21, 2.41) |
| 18.5 to < 25.0 kg/m2 | 17,487 | 451 (2.6) | 1.52 (1.20, 1.92) |
| 25.0 to < 30.0 kg/m2 | 5,556 | 92 (1.7) | Reference |
| ≥ 30.0 kg/m2 | 1,053 | 16 (1.5) | 0.96 (0.55, 1.68) |
| Missing | 5,534 | 104 (1.9) | 1.48 (1.02, 2.15) |
| Regular exercise habit | |||
| Absent | 13,241 | 289 (2.2) | Reference |
| Present | 5,434 | 191 (3.5) | 1.46 (1.19, 1.79) |
| Missing | 13,000 | 241 (1.9) | 0.83 (0.65, 1.07) |
| Smoking status | |||
| Former/never smoker | 25,100 | 668 (2.7) | 2.74 (1.96, 3.82) |
| Daily/occasional smoker | 5,472 | 44 (0.8) | Reference |
| Missing | 382 | 9 (2.4) | 4.56 (1.90, 10.92) |
| Alcohol consumption | |||
| Non-drinker | 24,984 | 598 (2.4) | 1.14 (0.92, 1.42) |
| Drinker | 6,199 | 114 (1.8) | Reference |
| Missing | 492 | 9 (1.8) | 0.72 (0.31, 1.66) |
| Survey year | |||
| 2013 | 5,818 | 103 (1.8) | Reference |
| 2014 | 6,098 | 102 (1.7) | 0.92 (0.64, 1.33) |
| 2015 | 5,502 | 144 (2.6) | 1.39 (0.98, 1.98) |
| 2017 | 4,966 | 113 (2.3) | 1.23 (0.86, 1.77) |
| 2018 | 4,956 | 137 (2.8) | 1.51 (1.07, 2.14) |
| 2019 | 4,335 | 122 (2.8) | 1.57 (1.10, 2.23) |
Disclaimer/Publisher’s Note: The statements, opinions and data contained in all publications are solely those of the individual author(s) and contributor(s) and not of MDPI and/or the editor(s). MDPI and/or the editor(s) disclaim responsibility for any injury to people or property resulting from any ideas, methods, instructions or products referred to in the content. |
© 2024 by the authors. Licensee MDPI, Basel, Switzerland. This article is an open access article distributed under the terms and conditions of the Creative Commons Attribution (CC BY) license (http://creativecommons.org/licenses/by/4.0/).
Copyright: This open access article is published under a Creative Commons CC BY 4.0 license, which permit the free download, distribution, and reuse, provided that the author and preprint are cited in any reuse.


