Submitted:
01 May 2024
Posted:
02 May 2024
You are already at the latest version
Abstract
Keywords:
1. Introduction
2. Methods
2.1. Data Description
2.2. Endpoints and Events
2.3. Statistical Analysis
2.3.1. Modified CHA2DS2-VASc Risk (MCR) Score
2.3.2. Statistical Analysis Using CHA2DS2-VASc Risk Score as Predictor
2.3.3. Model Evaluation
3. Results
3.1. Baseline Demographic and Clinico-Pathologic Variable Analysis
3.2. Modified CHA2DS2-VASc Risk (MCR) Score and Its Association with the Three Endpoints: MALE, MACE and MALE+MACE
3.3. Survival Analysis with Modified CHA2DS2-VASc Risk (MCR) Score as Predictor
3.4. Evaluation of MCR as a Legitimate Predictor for MALE, MACE and MALE+MACE
4. Discussion
5. Conclusions
Supplementary Materials
Funding
Authors Contributions
Institutional Review Board Statement
Informed Consent Statement
Data Availability Statement
Acknowledgments
Consent for publication
Conflicts of Interest
Abbreviations
- PAD: peripheral artery disease
- MACE: major adverse cardiovascular events
- MALE: major adverse limb events
- ALI: acute limb ischemia
- PCI: percutaneous coronary intervention
- CHF: congestive heart failure
- HTN: hypertension
- DM: Diabetes Mellitus
- AF: atrial fibrillation
- ABI: ankle brachial index
- HPL: hyperlipidemia
- LDL: low-density lipoprotein
- CAD: coronary artery disease
- CABG: coronary artery bypass graft
- MI: myocardial infarction
- COPD: chronic obstructive pulmonary disease
- CKD: chronic kidney disease
- CCr: creatinine clearance test
- HD: hemodialysis
- PD: peritoneal dialysis
- HDL: high-density lipoprotein
- TG: triglyceride
- ASA: aspirin
- DOAC: direct oral anticoagulant
- ACEI: angiotensin-converting enzyme inhibitors
- ARB: angiotensin receptor blockers
- CCB: calcium channel blockers
- CLI: critical limb ischemia
- BTK: below-the-knee
- DAPT: Dual antiplatelet therapy
References
- Polonsky, T.S.; McDermott, M.M. Lower extremity peripheral artery disease without chronic limb-threatening ischemia: A review. JAMA 2021, 325, 2188–2198. [Google Scholar] [CrossRef] [PubMed]
- Aday, A.W.; Matsushita, K. Epidemiology of peripheral artery disease and polyvascular disease. Circ. Res. 2021, 128, 1818–1832. [Google Scholar] [CrossRef] [PubMed]
- Shu, J.; Santulli, G. Update on peripheral artery disease: Epidemiology and evidence-based facts. Atherosclerosis 2018, 275, 379–381. [Google Scholar] [CrossRef] [PubMed]
- Szarek, M.; Hess, C.; Patel, M.R.; Jones, W.S.; Berger, J.S.; Baumgartner, I.; Katona, B.; Mahaffey, K.W.; Norgren, L.; Blomster, J. Total Cardiovascular and Limb Events and the Impact of Polyvascular Disease in Chronic Symptomatic Peripheral Artery Disease. J. Am. Heart Assoc. 2022, e025504. [Google Scholar] [CrossRef] [PubMed]
- Tsai, I.; Wang, C.-P.; Lu, Y.-C.; Hung, W.-C.; Wu, C.-C.; Lu, L.-F.; Chung, F.-M.; Hsu, C.-C.; Lee, Y.-J.; Yu, T.-H. The burden of major adverse cardiac events in patients with coronary artery disease. BMC Cardiovasc. Disord. 2017, 17, 1–13. [Google Scholar] [CrossRef] [PubMed]
- Mahoney, E.M.; Wang, K.; Keo, H.H.; Duval, S.; Smolderen, K.G.; Cohen, D.J.; Steg, G.; Bhatt, D.L.; Hirsch, A.T. Vascular hospitalization rates and costs in patients with peripheral artery disease in the United States. Circ. Cardiovasc. Qual. Outcomes 2010, 3, 642–651. [Google Scholar] [CrossRef] [PubMed]
- Anand, S.S.; Caron, F.; Eikelboom, J.W.; Bosch, J.; Dyal, L.; Aboyans, V.; Abola, M.T.; Branch, K.R.; Keltai, K.; Bhatt, D.L. Major adverse limb events and mortality in patients with peripheral artery disease: The COMPASS trial. J. Am. Coll. Cardiol. 2018, 71, 2306–2315. [Google Scholar] [CrossRef] [PubMed]
- Lip, G.Y.; Nieuwlaat, R.; Pisters, R.; Lane, D.A.; Crijns, H.J. Refining clinical risk stratification for predicting stroke and thromboembolism in atrial fibrillation using a novel risk factor-based approach: The euro heart survey on atrial fibrillation. Chest 2010, 137, 263–272. [Google Scholar] [CrossRef] [PubMed]
- Olesen, J.B.; Torp-Pedersen, C.; Hansen, M.L.; Lip, G.Y. The value of the CHA2DS2-VASc score for refining stroke risk stratification in patients with atrial fibrillation with a CHADS2 score 0–1: A nationwide cohort study. Thromb. Haemost. 2012, 107, 1172–1179. [Google Scholar] [CrossRef] [PubMed]
- Yalim, Z.; Aldemir, M.; Yalim, S.A. Assessment of the relationship between death and CHA2DS2-VASc score in peripheral artery disease. Int Angiol 2020, 39, 509–516. [Google Scholar] [CrossRef] [PubMed]
- Chen, P.-S.; Lee, M.; Tang, S.-C.; Huang, P.-H.; Yeh, H.-I.; Hou, C.J.-Y.; Hsieh, I.-C.; Lee, J.-T.; Jeng, J.-S.; Li, Y.-H. 2022 focused update of the 2017 Taiwan lipid guidelines for high risk patients: Coronary artery disease, peripheral artery disease and ischemic stroke. J. Formos. Med. Assoc. 2022, 121, 1363–1370. [Google Scholar] [CrossRef] [PubMed]
- Kumar, D.; Klefsjö, B. Proportional hazards model: A review. Reliab. Eng. Syst. Saf. 1994, 44, 177–188. [Google Scholar] [CrossRef]
- Therneau, T.; Lumley, T. R survival package. R Core Team 2013. [Google Scholar]
- Dudley, W.N.; Wickham, R.; Coombs, N. An introduction to survival statistics: Kaplan-Meier analysis. J. Adv. Pract. Oncol. 2016, 7, 91. [Google Scholar] [PubMed]
- Krstajic, D.; Buturovic, L.J.; Leahy, D.E.; Thomas, S. Cross-validation pitfalls when selecting and assessing regression and classification models. J. Cheminformatics 2014, 6, 1–15. [Google Scholar] [CrossRef] [PubMed]
- Pencina, M.J.; D’Agostino, R.B. Overall C as a measure of discrimination in survival analysis: Model specific population value and confidence interval estimation. Stat. Med. 2004, 23, 2109–2123. [Google Scholar] [CrossRef] [PubMed]
- D’Agostino, R.B.; Nam, B.-H. Evaluation of the performance of survival analysis models: Discrimination and calibration measures. Handb. Stat. 2003, 23, 1–25. [Google Scholar]
- Hardman, R.L.; Jazaeri, O.; Yi, J.; Smith, M.; Gupta, R. Overview of classification systems in peripheral artery disease. In Proceedings of the Seminars in interventional radiology; 2014; pp. 378–388. [Google Scholar]
- Dopheide, J.F.; Ramadani, H.; Adam, L.; Gahl, B.; Papac, L.; Veit, J.; Kaspar, M.; Schindewolf, M.; Baumgartner, I.; Drexel, H. Development of a 3-Dimensional Prognostic Score for Patients With Symptomatic Peripheral Artery Disease: PAD3D Score. Angiology 2020, 71, 658–665. [Google Scholar] [CrossRef] [PubMed]
- Lin, T.-C.; Su, H.-M.; Lee, W.-H.; Chiu, C.-A.; Chi, N.-Y.; Tsai, W.-C.; Lin, T.-H.; Voon, W.-C.; Lai, W.-T.; Sheu, S.-H. CHA2DS2-VASc Score and Risk of New-Onset Peripheral Arterial Occlusive Disease in Patients without Atrial Fibrillation. Acta Cardiol. Sin. 2021, 37, 261. [Google Scholar] [PubMed]
- Chen, J.-Y.; Zhang, A.-D.; Lu, H.-Y.; Guo, J.; Wang, F.-F.; Li, Z.-C. CHADS2 versus CHA2DS2-VASc score in assessing the stroke and thromboembolism risk stratification in patients with atrial fibrillation: A systematic review and meta-analysis. J. Geriatr. Cardiol. JGC 2013, 10, 258. [Google Scholar] [PubMed]
- Chao, T.-F.; Liu, C.-J.; Tuan, T.-C.; Chen, S.-J.; Wang, K.-L.; Lin, Y.-J.; Chang, S.-L.; Lo, L.-W.; Hu, Y.-F.; Chen, T.-J. Comparisons of CHADS2 and CHA2DS2-VASc scores for stroke risk stratification in atrial fibrillation: Which scoring system should be used for Asians? Heart Rhythm 2016, 13, 46–53. [Google Scholar] [CrossRef] [PubMed]
- Lee, Y.; Kim, B.-S.; Shin, J.-H.; Kim, W.; Kook, H.; Park, H.-C.; Park, M.; Park, S.; Lim, Y.-H. Influence of concomitant percutaneous transluminal angioplasty with percutaneous coronary intervention on clinical outcomes of stable lower extremity artery diseases. Sci. Rep. 2022, 12, 1–11. [Google Scholar]
- Svendsen, J.H.; Nielsen, J.C.; Darkner, S.; Jensen, G.V.H.; Mortensen, L.S.; Andersen, H.R.; Investigators, D. CHADS2 and CHA2DS2-VASc score to assess risk of stroke and death in patients paced for sick sinus syndrome. Heart 2013, 99, 843–848. [Google Scholar] [CrossRef] [PubMed]
- Norgren, L.; Hiatt, W.R.; Dormandy, J.A.; Nehler, M.R.; Harris, K.A.; Fowkes, F.G.R.; Group, T.I.W. Inter-society consensus for the management of peripheral arterial disease (TASC II). J. Vasc. Surg. 2007, 45, S5–S67. [Google Scholar] [CrossRef] [PubMed]
- Chan, Y.-H.; Wu, L.-S.; Chang, S.-H.; Lee, H.-F.; Liu, J.-R.; See, L.-C.; Yeh, Y.-H.; Kuo, C.-T. Young male patients with atrial fibrillation and CHA2DS2-VASc score of 1 may not need anticoagulants: A nationwide population-based study. PLoS ONE 2016, 11, e0151485. [Google Scholar] [CrossRef] [PubMed]
- Capell, W.H.; Bonaca, M.P.; Nehler, M.R.; Chen, E.; Kittelson, J.M.; Anand, S.S.; Berkowitz, S.D.; Debus, E.S.; Fanelli, F.; Haskell, L. Rationale and design for the Vascular Outcomes study of ASA along with rivaroxaban in endovascular or surgical limb revascularization for peripheral artery disease (VOYAGER PAD). Am. Heart J. 2018, 199, 83–91. [Google Scholar] [CrossRef] [PubMed]
- Evans, G.W.; Li, D.; Whipple, S.S. Cumulative risk and child development. Psychol. Bull. 2013, 139, 1342. [Google Scholar] [CrossRef] [PubMed]
- Flouri, E.; Tzavidis, N.; Kallis, C. Area and family effects on the psychopathology of the Millennium Cohort Study children and their older siblings. J. Child Psychol. Psychiatry 2010, 51, 152–161. [Google Scholar] [CrossRef] [PubMed]
- Smolderen, K.; Wang, K.; De Pouvourville, G.; Brüggenjürgen, B.; Röther, J.; Zeymer, U.; Parhofer, K.; Steg, P.; Bhatt, D.; Magnuson, E. Two-year vascular hospitalisation rates and associated costs in patients at risk of atherothrombosis in France and Germany: Highest burden for peripheral arterial disease. Eur. J. Vasc. Endovasc. Surg. 2012, 43, 198–207. [Google Scholar] [CrossRef] [PubMed]
- Aboyans, V.; Desormais, I.; Lacroix, P.; Salazar, J.; Criqui, M.H.; Laskar, M. The general prognosis of patients with peripheral arterial disease differs according to the disease localization. J. Am. Coll. Cardiol. 2010, 55, 898–903. [Google Scholar] [CrossRef] [PubMed]


| Characteristics (units) |
Measurement N=503 |
| Age (years) | 70.77 ± 12.39 |
| Sex = Male | 326 (64.81) |
| = Female | 177 (35.19) |
| BMI (Kg/m2) | 23.97 ± 3.91 |
| CHF (C) | 238 (47.32) |
| HTN | 403 (86.68) |
| DM | 376 (74.75) |
| Stroke (S)/TIA | 91 (18.09) |
| Vascular Disease | 503 (100) |
| HPL | 241 (47.91) |
| SMK | 195 (38.77) |
| CAD | 263 (52.29) |
| CABG | 53 (10.54) |
| PCI | 239 (47.51) |
| Old MI | 79 (15.71) |
| COPD | 21 (4.17) |
| CKD | 319 (63.42) |
| HD/PD | 181 (35.98) |
| Cr (mg/dL) | 3.26 ± 3.04 |
| Af | 120 (23.86) |
| Imd | 21 (4.03) |
| HbA1C (%) | 7.32 ± 1.86 |
| Cholesterol (mg/dL) | 149.65 ± 39.42 |
| LDL (mg/dL) | 83.37 ± 33.35 |
| HDL (mg/dL) | 42.94 ± 15.21 |
| TG (mg/dL) | 130.87 ± 83.79 |
| Glu (mg/dL) | 145.60 ± 69.49 |
| TG/HDL | 3.69 ± 3.86 |
| ASA | 385 (76.54) |
| clopidgrel | 427 (84.89) |
| cilostazol | 301 (59.84) |
| pentoxyphilline | 1 9 (0.19) |
| direct oral anticoagulant (DOAC) | 73 (14.51) |
| ACEIARB | 220 (43.74) |
| statin | 283 (56.26) |
| Betablocker | 189 (37.57) |
| CCB | 201 (39.96) |
| Insulin | 106 (21.07) |
| Rutherford =1 | 0 (0) |
| Rutherford = 2 | 0 (0) |
| Rutherford = 3 | 0 (0) |
| Rutherford = 4 | 130 (25.84) |
| Rutherford = 5 | 316 (62.82) |
| Rutherford = 6 | 57 (11.33) |
| Target vessel CIA | 41 (8.15) |
| Target vessel EIA | 45 (8.95) |
| Target vessel CFA | 27 (5.37) |
| Target vessel SFA | 285 (56.66) |
| Target vessel ATA | 248 (49.30) |
| Target vessel Popliteal | 107 (21.27) |
| Target vessel Peroneal artery | 96 (19.09) |
| Target vessel Tibiofibular TP trunk | 64 (12.72) |
| Target vessel PTA | 196 (38.97) |
| Target vessel DPA | 15 (2.98) |
| Target vessel Plantar artery | 23 (4.57) |
| Variables | score =3 (N = 100) |
score = 4 (N= 115) |
score = 5 (N = 140) |
score = 6 (N = 148) |
P value |
|---|---|---|---|---|---|
| Age | 59.14 ± 12.07 | 67.76 ± 11.06 | 72.2 ± 10.54 | 79.60 ± 6.800 | <0.0001* |
| Sex (Male) | 86 (86) | 93 (80.87) | 84 (60) | 63 (42.57) | <0.0001* |
| BMI | 23.96 ± 3.85 | 24.48 ± 4.414 | 23.59 ± 3.503 | 23.93 ± 3.881 | 0.341 |
| CHF (C) | 13 (13) | 50 (43.48) | 67 (47.86) | 108 (72.97) | <0.0001* |
| HTN | 52 (52) | 101 (87.82) | 136 (97.14) | 147 (99.32) | <0.0001* |
| DM | 44 (44) | 89 (77.39) | 107 (76.43) | 136 (91.89) | <0.0001* |
| Stroke (S)/TIA | 3 (3) | 7 (6.09) | 28 (20) | 53 (35.81) | <0.0001* |
| Vascular Disease | 100 (100) | 115 (100) | 140 (100) | 148 (100) | 1 |
| Hyperlipidemia | 36 (36) | 51 (44.53) | 69 (49.28) | 85 (57.43) | 0.008* |
| SMK (smoking) | 63 (63) | 60 (52.17) | 44 (31.43) | 28 (18.92) | <0.0001* |
| Coronary Artery disease | 28 (28) | 60 (52.17) | 85 (60.71) | 90 (60.81) | <0.0001* |
| Coronary Artery Bypass Graft (CABG) | 3 (3) | 15 (13.04) | 15 (10.71) | 20 (13.51) | 0.022* |
| PCI (Percutaneous coronary intervention) | 22 (22) | 57 (49.57) | 77 (55) | 83 (56.08) | <0.0001* |
| Old MI (myocardial infarction) | 5 (5) | 19 (16.52) | 26 (18.57) | 29 (19.59) | 0.004* |
| COPD | 2 (2) | 2 (1.74) | 9 (6.43) | 8 (5.4) | 0.168 |
| CKD | 35 (35) | 70 (60.87) | 109 (77.86) | 105 (70.95) | <0.0001* |
| HD/PD | 25 (25) | 42 (36.52) | 55 (39.29) | 59 (39.86) | 0.069 |
| Cr (cardiac rehabilitation) score | 2.65 ± 3.24 | 3.493 ± 3.569 | 3.536 ± 2.898 | 3.226 ± 2.553 | 0.136 |
| Af (atrial fibrillation) | 10 (10) | 19 (16.52) | 40 (28.47) | 51 (34.46) | <0.0001* |
| Imd (Immune related disease) | 10 (10) | 3 (2.61) | 4 (2.86) | 4 (2.70) | 0.033* |
| HbA1C | 7.013 ± 1.928 | 7.675 ± 2.129 | 7.285 ± 1.600 | 7.298 ± 1.799 | 0.072 |
| Cholesterol | 163.65 ± 40.72 | 149.50 ± 42.07 | 147.81 ± 40.29 | 142.05 ± 32.99 | 0.0003* |
| LDL | 93 ± 34.675 | 82.03 ± 32.08 | 83.22 ± 36.68 | 78.01 ± 28.69 | 0.006* |
| HDL | 43.76 ± 18.288 | 43.02 ± 16.36 | 41.53 ± 12.31 | 43.770 ± 14.486 | 0.542 |
| TG | 147.31 ± 99.34 | 131.71 ± 93.15 | 129.2 ± 72.41 | 120.67 ± 73.13 | 0.106 |
| Glu | 135.29 ± 65.37 | 154.71 ± 80.44 | 147.75 ± 68.83 | 143.44 ± 63.002 | 0.216 |
| Medications | |||||
| ASA | 79 (79) | 88 (76.52) | 111 (79.29) | 107 (72.30) | 0.504 |
| clopidgrel | 76 (79) | 97 (84.35) | 124 (88.57) | 130 (87.84) | 0.0428 |
| cilostazol | 62 (62) | 77 (66.96) | 79 (56.43) | 83 (56.08) | 0.242 |
| pentoxyphilline | 0 (0) | 0 (0) | 0 (0) | 1 (0.67) | 1 |
| direct oral anticoagulant (DOAC) | 15 (15) | 11 (9.56) | 24 (17.14) | 23 (15.54) | 0.349 |
| ACEIARB | 35 (35) | 54 (46.96) | 67 (47.86) | 64 (43.24) | 0.204 |
| statin | 57 (57) | 63 (54.78) | 81 (57.86) | 82 (55.41) | 0.958 |
| Betablocker | 22 (22) | 48 (41.74) | 58 (41.43) | 61 (41.22) | 0.003* |
| CCB | 37 (37) | 43 (37.39) | 66 (47.14) | 55 (37.16) | 0.251 |
| Insulin | 13 (13) | 26 (22.61) | 28 (20) | 39 (26.35) | 0.076 |
| Rutherford classification | |||||
| 1 | 0 (0) | 0 (0) | 0 (0) | 0 (0) | 1 |
| 2 | 0 (0) | 0 (0) | 0 (0) | 0 (0) | 1 |
| 3 | 0 (0) | 0 (0) | 0 (0) | 0 (0) | 1 |
| 4 | 36 (36) | 28 (24.34) | 34 (24.29) | 32 (21.62) | 0.079 |
| 5 | 55 (55) | 72 (62.61) | 86 (61.43) | 103 (69.59) | 0.129 |
| 6 | 9 (9) | 15 (13.04) | 20 (14.29) | 13 (8.78) | 0.394 |
| Target vessel | |||||
| CIA | 8 (8) | 11 (9.56) | 15 (10.71) | 7 (4.73) | 0.249 |
| EIA | 11 (11) | 11 (9.56) | 13 (9.29) | 10 (6.76) | 0.677 |
| CFA | 10 (10) | 4 (3.48) | 8 (5.71) | 5 (3.38) | 0.128 |
| SFA | 42 (42) | 59 (51.30) | 86 (61.43) | 98 (66.22) | 0.0007* |
| ATA | 49 (49) | 62 (53.91) | 70 (50) | 67 (45.27) | 0.581 |
| Popliteal | 19 (19) | 19 (16.52) | 33 (23.57) | 36 (24.32) | 0.375 |
| Peroneal artery | 12 (12) | 22 (19.13) | 27 (19.29) | 35 (23.65) | 0.147 |
| Tibiofibular TP trunk | 9 (9) | 6 (5.21) | 23 (16.43) | 26 (17.57) | 0.005* |
| PTA | 44 (44) | 46 (40) | 50 (35.71) | 56 (37.84) | 0.613 |
| DPA | 4 (4) | 4 (3.48) | 3 (2.14) | 4 (2.70) | 0.825 |
| Plantar artery | 2 (2) | 8 (6.96) | 8 (5.71) | 5 (3.38) | 0.269 |
| Events | Low risk (N = 100) |
Moderate risk (N= 115) |
High Risk (N = 140) |
Very high risk (N = 148) |
|---|---|---|---|---|
| Major adverse cardiovascularevents (MACE) | ||||
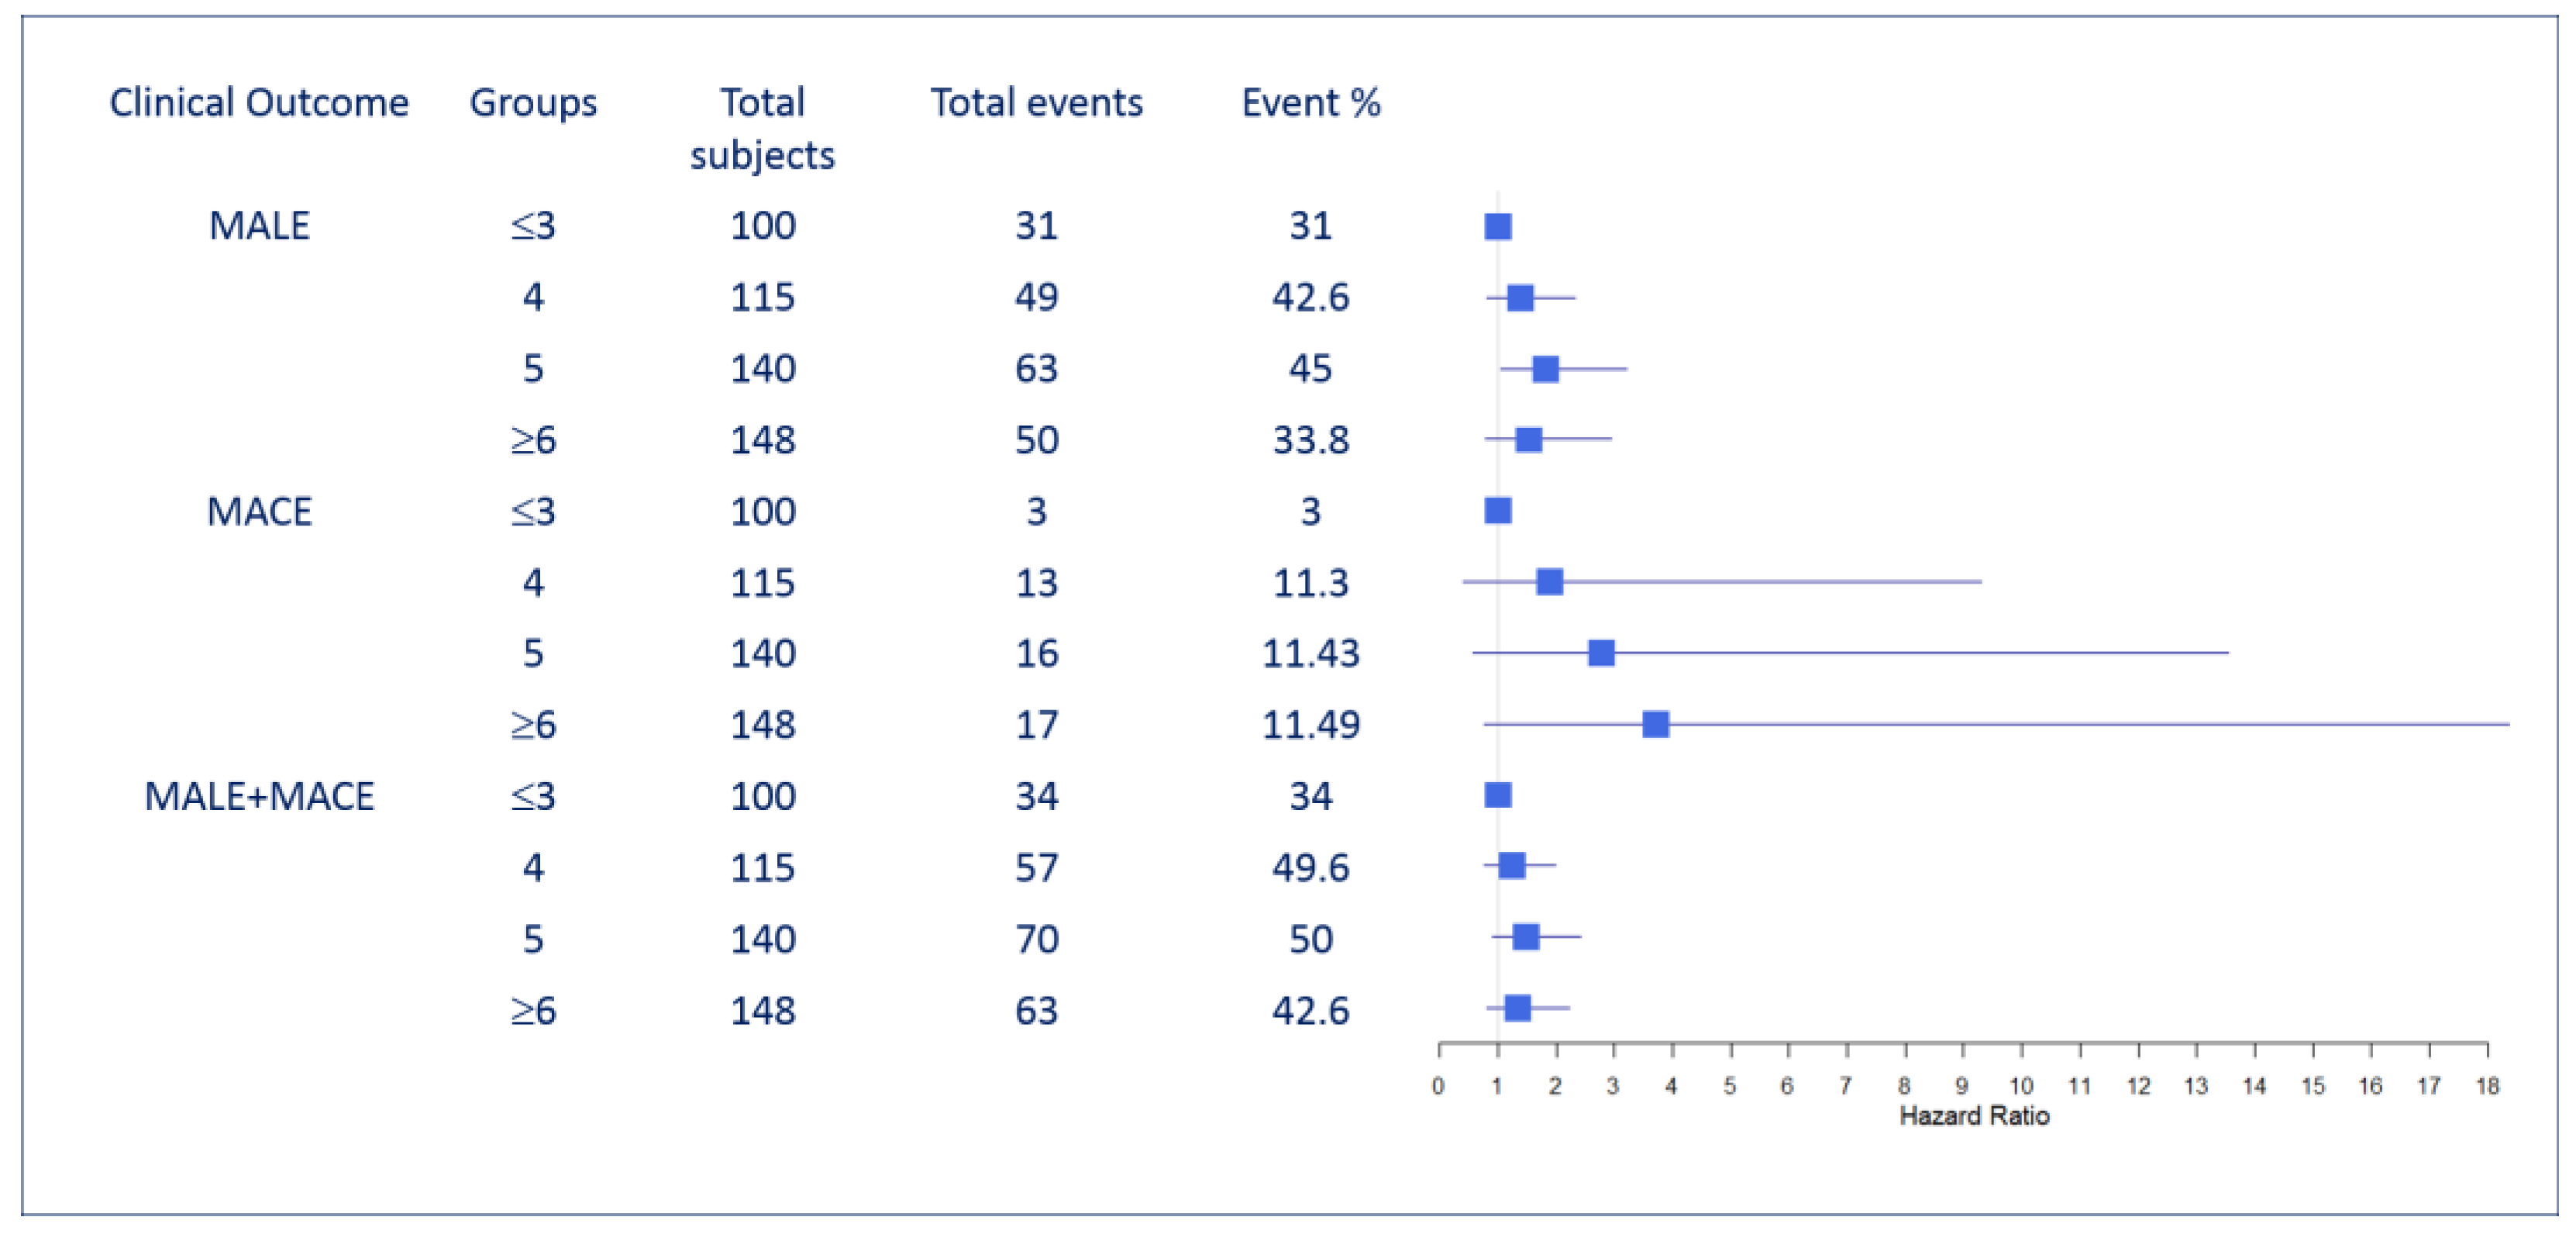
| #MACE (%) | 3(3) | 13 (11.30) | 16 (11.43) | 17 (11.49) |
| Crude HR (95% CI) | 1 | 3.47 (0.99 - 12.18) | 4.12 (1.19 - 14.14) | 5.06 (1.48 - 17.28) |
| P-value | 0.052* | 0.024* | 0.009* | |
| Multivariate adjusted HR (95% CI) | 1 | 1.89 (0.39 - 9.31) | 2.78 (0.57 - 13.55) | 3.72 (0.75 - 18.42) |
| P-value | 0.21 | 0.13 | 0.049* | |
| Major adverse limb events (MALE) | ||||
| # MALE (%) | 31 (31) | 49 (42.60) | 63 (45) | 50 (33.78) |
| Crude HR (95% CI) | 1 | 1.33 (0.85 - 2.09) | 1.55 (1.01 - 2.38) | 1.21 (0.77 - 1.89) |
| P-value | 0.213 | 0.046* | 0.398 | |
| Multivariate adjusted HR (95%CI) | 1 | 1.38 (0.81 - 2.33) | 1.82 (1.04 - 3.2) | 1.53 (0.79 - 2.94) |
| P-value | 0.23 | 0.037* | 0.202 | |
|
Major adverse limb and cardiac events (MALE + MACE) |
||||
| #MALE + MACE (%) | 34 (34) | 57 (49.57) | 70 (50) | 63 (42.57) |
| Crude HR (95% CI) | 1 | 1.37 (0.89 - 2.09) | 1.58 (1.05 - 2.37) | 1.41 (0.93 - 2.14) |
| P-value | 0.145 | 0.029* | 0.107 | |
| Multivariate adjusted HR (95%CI) | 1 | 1.24 (0.77 - 1.98) | 1.48 (0.91 - 2.41) | 1.34 (0.81 - 2.22) |
| P-value | 0.18 | 0.04* | 0.09 |
| MALE | MACE | MALE+MACE | ||||
| Avg. C-Index | Std. Dev. C-Index | Avg. C-Index | Std. Dev. C-Index | Avg. C-Index | Std. Dev. C-Index | |
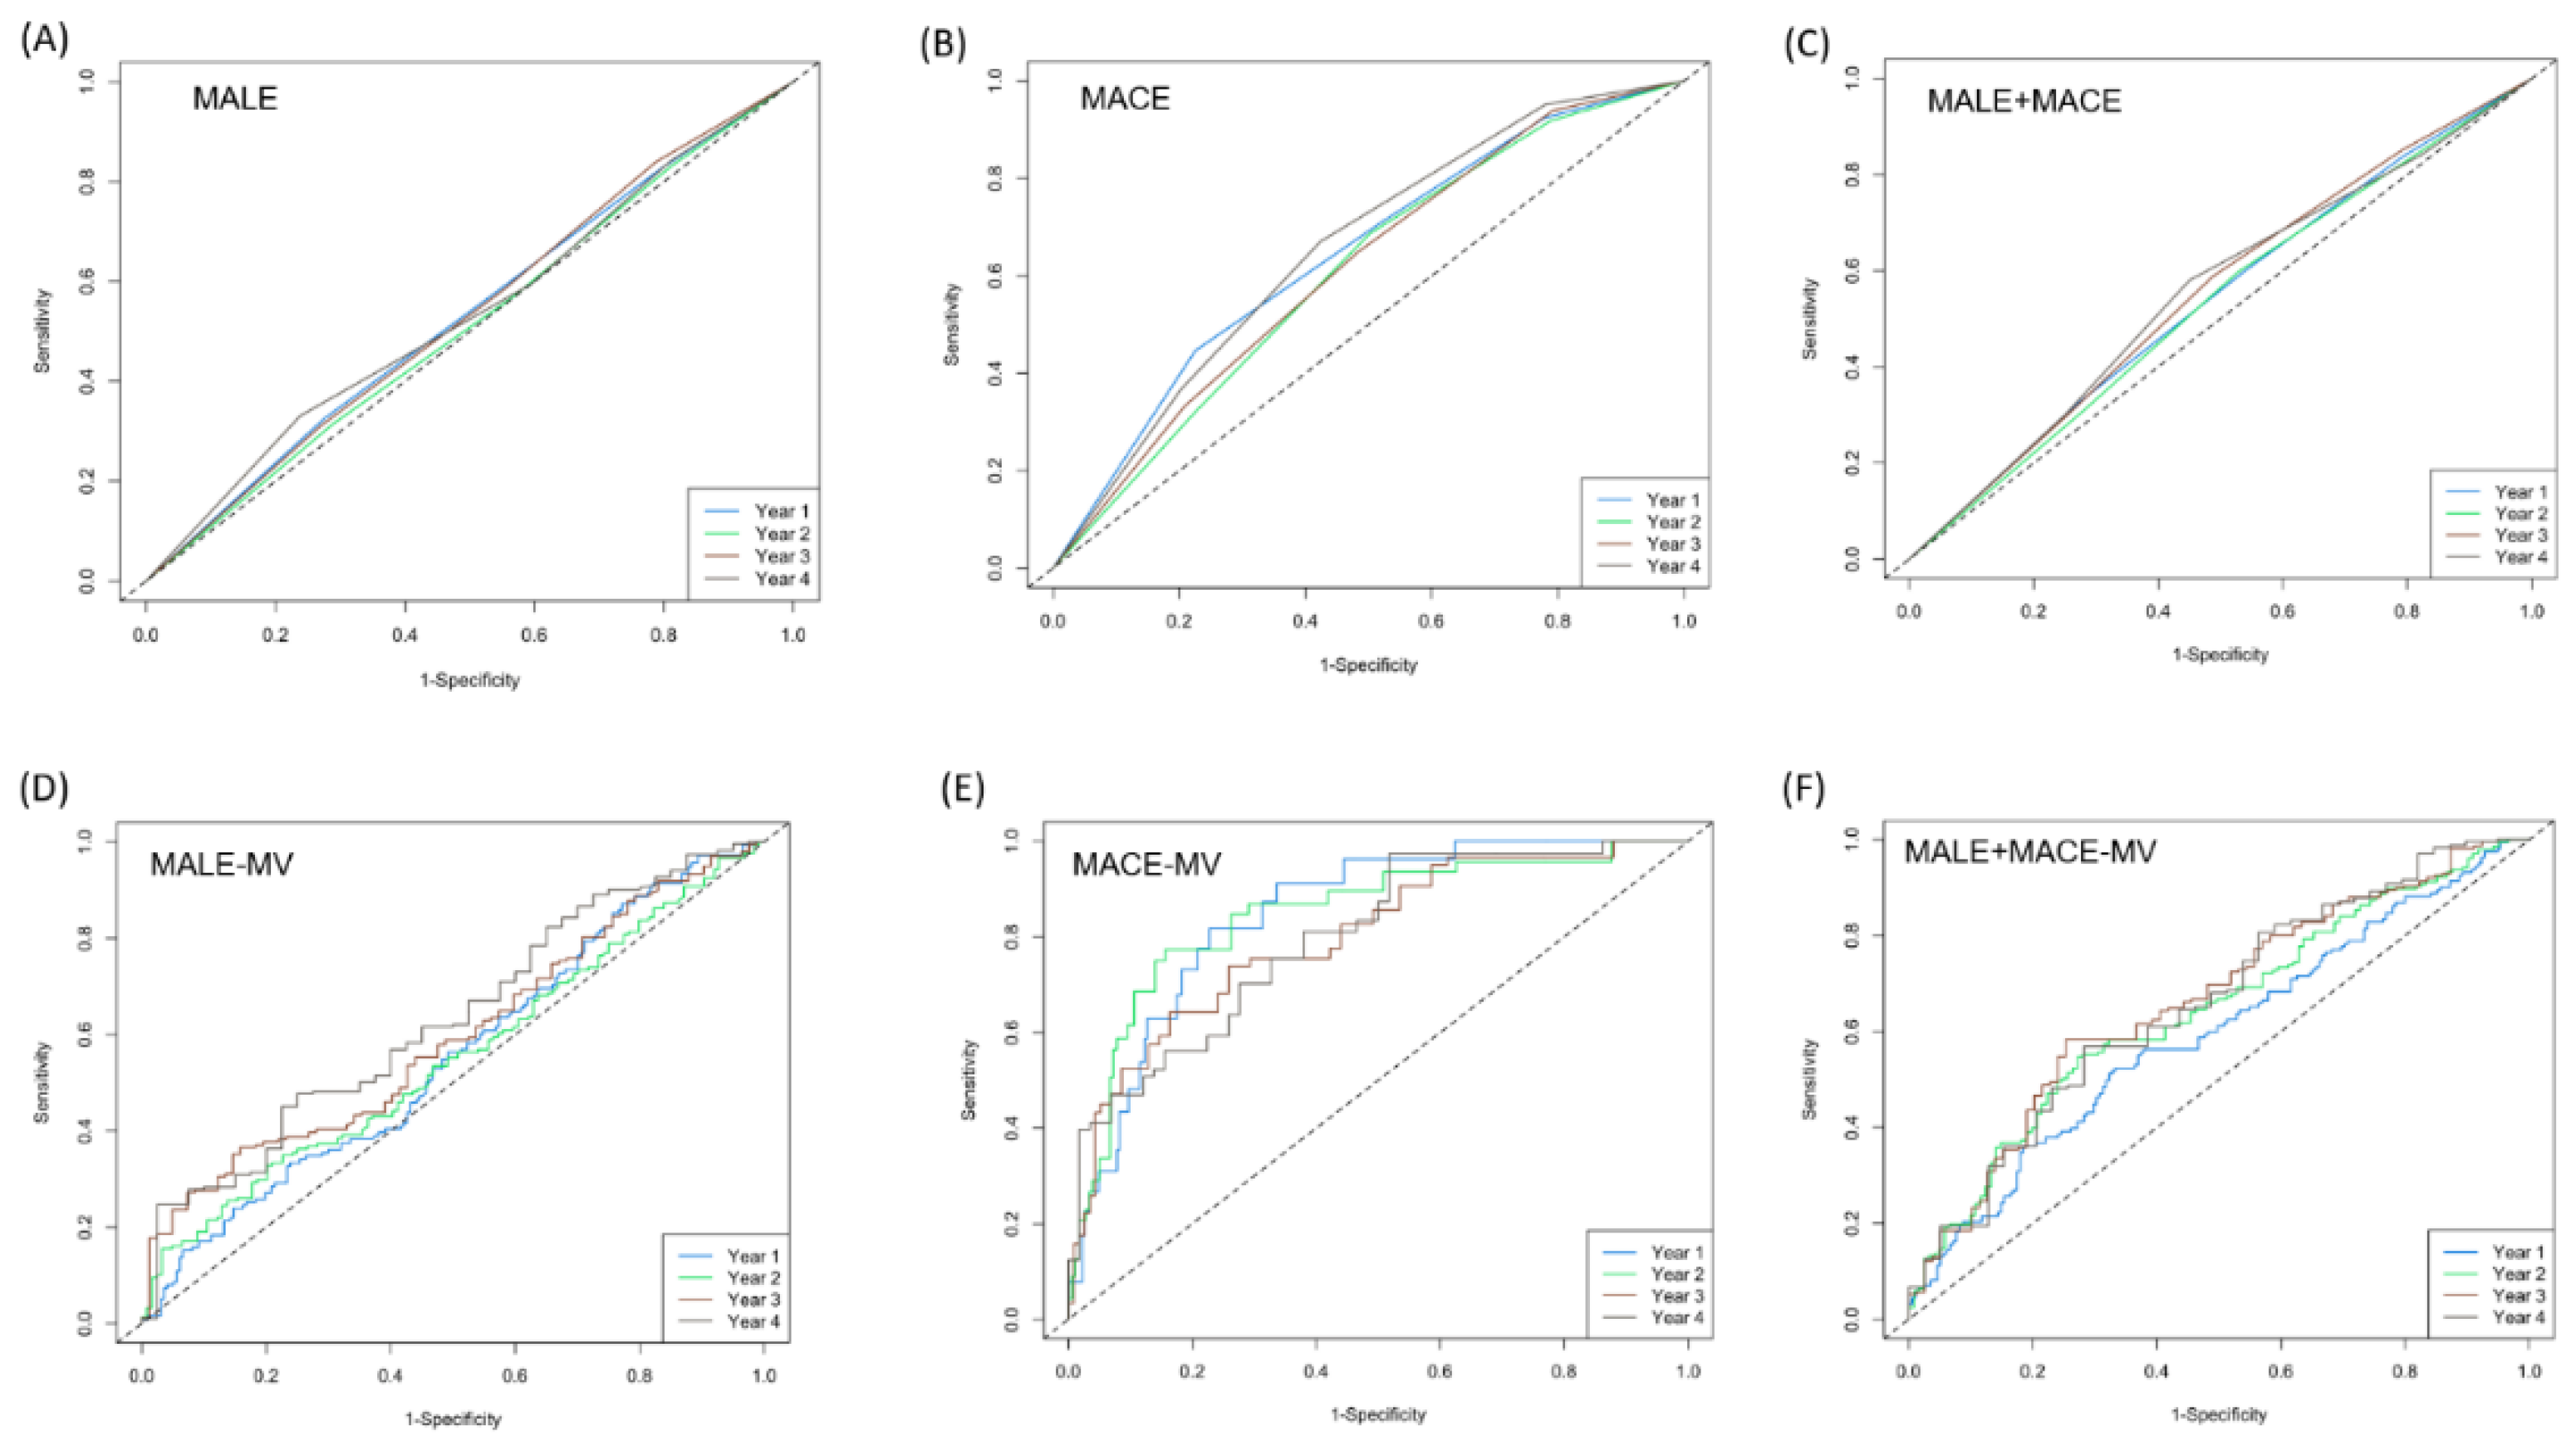
| Crude MCR model | 0.54 | 0.009 | 0.63 | 0.02 | 0.54 | 0.009 |
| Multivariate-adjusted MCR model | 0.57 | 0.009 | 0.81 | 0.014 | 0.56 | 0.009 |
| Traditional model | 0.55 | 0.01 | 0.81 | 0.01 | 0.54 | 0.007 |
Disclaimer/Publisher’s Note: The statements, opinions and data contained in all publications are solely those of the individual author(s) and contributor(s) and not of MDPI and/or the editor(s). MDPI and/or the editor(s) disclaim responsibility for any injury to people or property resulting from any ideas, methods, instructions or products referred to in the content. |
© 2024 by the authors. Licensee MDPI, Basel, Switzerland. This article is an open access article distributed under the terms and conditions of the Creative Commons Attribution (CC BY) license (https://creativecommons.org/licenses/by/4.0/).


