Preprint
Article

On the Impact of Geospace Weather on the Occurrence of M7.8 /M7.5 Earthquakes of 02.06.2023 (Turkey), Possibly Associated with the Geomagnetic Storm of 11.07.2022

Altmetrics

Downloads

107

Views

203

Comments

0

This version is not peer-reviewed

Submitted:

01 May 2024

Posted:

02 May 2024

You are already at the latest version

Alerts
Abstract
A joint analysis of solar wind, geomagnetic field, and earthquake catalog data showed that before the catastrophic M7.8 and M7.5 Kahramanmaras earthquake sequence on February 6, 2023, the closed strong magnetic storm occurred on November 7, 2022, SYM/H=-117 nT. Storm started at 08:04 UT. At this time, the high latitudinal part of Turkey's longitudinal region of future epicenters was located under the polar cusp, where the solar wind plasma would directly access the Earth's environment. The time delay between storm onset and earthquake occurrence was ~91 days. We analyzed all seven strong (M7+) earthquakes from 1967 to 2020 to verify the initial findings. A similar pattern has been revealed for all events. The time delay between magnetic storm onset and earthquake occurrence varies from some days to some months. To continue these investigations, a retrospective analysis of seismic and other geophysical parameters just after preceded geomagnetic storms in the epicenter areas is desirable.
Keywords: 
Subject: Environmental and Earth Sciences  -   Geophysics and Geology

1. Introduction

It is found in some papers, for example ([1,2,3,4,5], and references herein), that earthquake occurrence may be preceded by a geomagnetic storm, which is one of Earth's most striking manifestations of solar wind activity. A lag time between a magnetic storm onset and an earthquake occurrence varies; it could be about 2 - 6 days [1], 12-14 days [2], 26–27 days [3], some months [5], and for very large earthquakes (M7.5+) it may reach up to some years [4]. Nevertheless, the idea of a relationship between earthquake occurrence and a magnetic storm is considered up to now controversial [6]. For example, it was studied in [7] the ratio of earthquakes that happened on geomagnetically disturbed days (Dst≤ - 30 nT) to those that occurred on geomagnetically quiet days using data on 122 838 events with magnitudes from 3.0 to 7.9 that occurred from 1965 to 2005 in the Anatolian peninsula. It was concluded: “As a result of all these data, a hypothesis cannot be put forward which suggests that geomagnetic storms trigger earthquakes in the Anatolian peninsula. However, these results should not hinder the conduct of further research. A global study on this subject can potentially provide new approaches”. Our paper presents the results, which were obtained with a new, to some extent, approach. So, it was revealed in [5] that strong earthquakes prefer to occur at those longitudes after geomagnetic storms. Their high-latitudinal part was located under the polar cusp during storm onset (storm sudden commencement - SSC). From a magnetic field point of view, the polar cusp is a funnel-shaped region where the high-latitude dayside (compressed) and night side (elongated) magnetic field lines converge toward the geomagnetic poles [8]. Under the polar cusp, the solar wind plasma would directly access the Earth's environment. According to [9], most of the time, the polar cusp is between 10h and 14h of the Magnetic Local Time (MLT), but depending on solar wind and magnetosphere conditions, it may be between 08–16h [10]. In a present paper, we applied an approach [5] to investigate a possible relationship between the two catastrophic M7.8 and M7.5 Kahramanmaras earthquake sequence on February 6, 2023, with a preceded geomagnetic storm, which satisfied a condition: at the time of storm onset, the MLT in the area of the future epicenters should have been within 10h-14h [9] or 08h-16h [10]. To verify an approach once more, we analyzed, in the same way, all strong earthquakes (M≥7.0) that occurred here since 1967. The obtained results support our suggestion.

2. Materials and Methods

This study investigates earthquakes from the United States Geological Survey (USGS) global seismological catalog(https://earthquake.usgs.gov/earthquakes/search/). The data on the solar wind parameters are taken from the OMNI database (http://cdaweb.gsfc.nasa.gov), which was obtained from current and past space missions and projects. From the World Data Center for Geomagnetism, Kyoto (https://wdc.kugi.kyoto-u.ac.jp/), the onset and intensity of the geomagnetic storms were revealed using the 1-hour Dst (Disturbance Storm Time Index) before 1981, while the 1-min SYM-H index after 1981, since the last one is absent before 1981. The SYM-H index is, in fact, the high-resolution Dst index [11], allowing one to determine the onset and intensity of a magnetic storm correctly. According to [12], depending on the Dst value, geomagnetic storms are classified into weak (Dst from −30 to −50 nT), moderate (Dst from −50 to −100 nT), strong (Dst from −100 to −200 nT), powerful (Dst from −200 to −350 nT) and extreme (Dst below −350 nT). Also, we used data on the storm sudden commencement - SSC, which were obtained by the Observatorio del Ebro, Roquetes, Spain, from the web page (ftp://ftp.ngdc.noaa.gov/STP/SOLARDATA/sudden commencements/storm2.SSC). Since we have revealed [5] that the occurrence of strong earthquake may follow a particular magnetic storm in only a specific longitudinal region (depending on the time of geomagnetic storm onset), and since the time delay between storm onset and earthquake occurrence may enormously vary, at this step, a method of investigation was a manual. For each selected earthquake, the closest preceding geomagnetic storm was identified, which satisfied the condition: at the time of storm onset, the Magnetic Local Time (MLT) around the future epicenter should have been within 08h-16h. The MLT values were estimated using the online program (https://omniweb.gsfc.nasa.gov/vitmo/cgm.html).

3. Results

3.1. Case Study for M7.8 and M7.5 of February 6, 2023

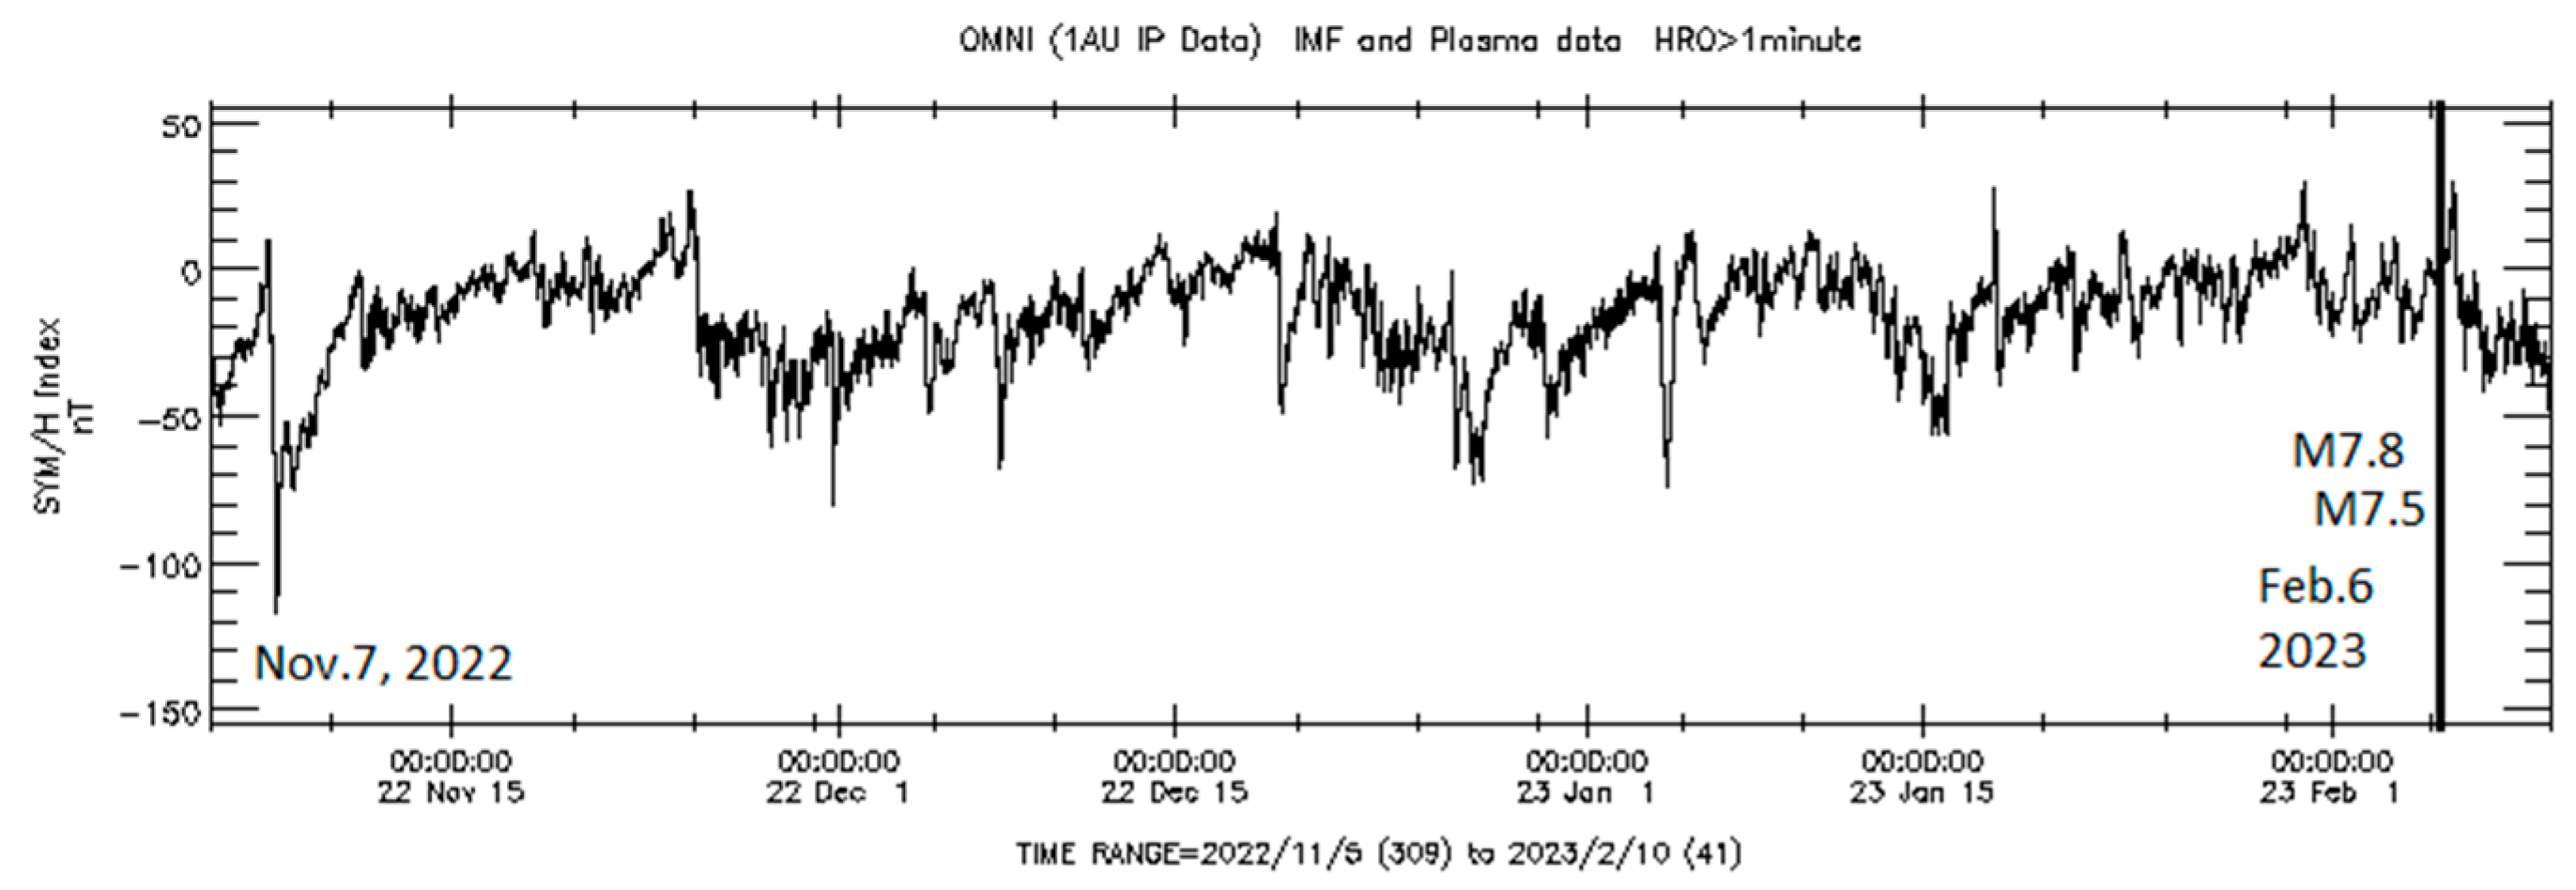
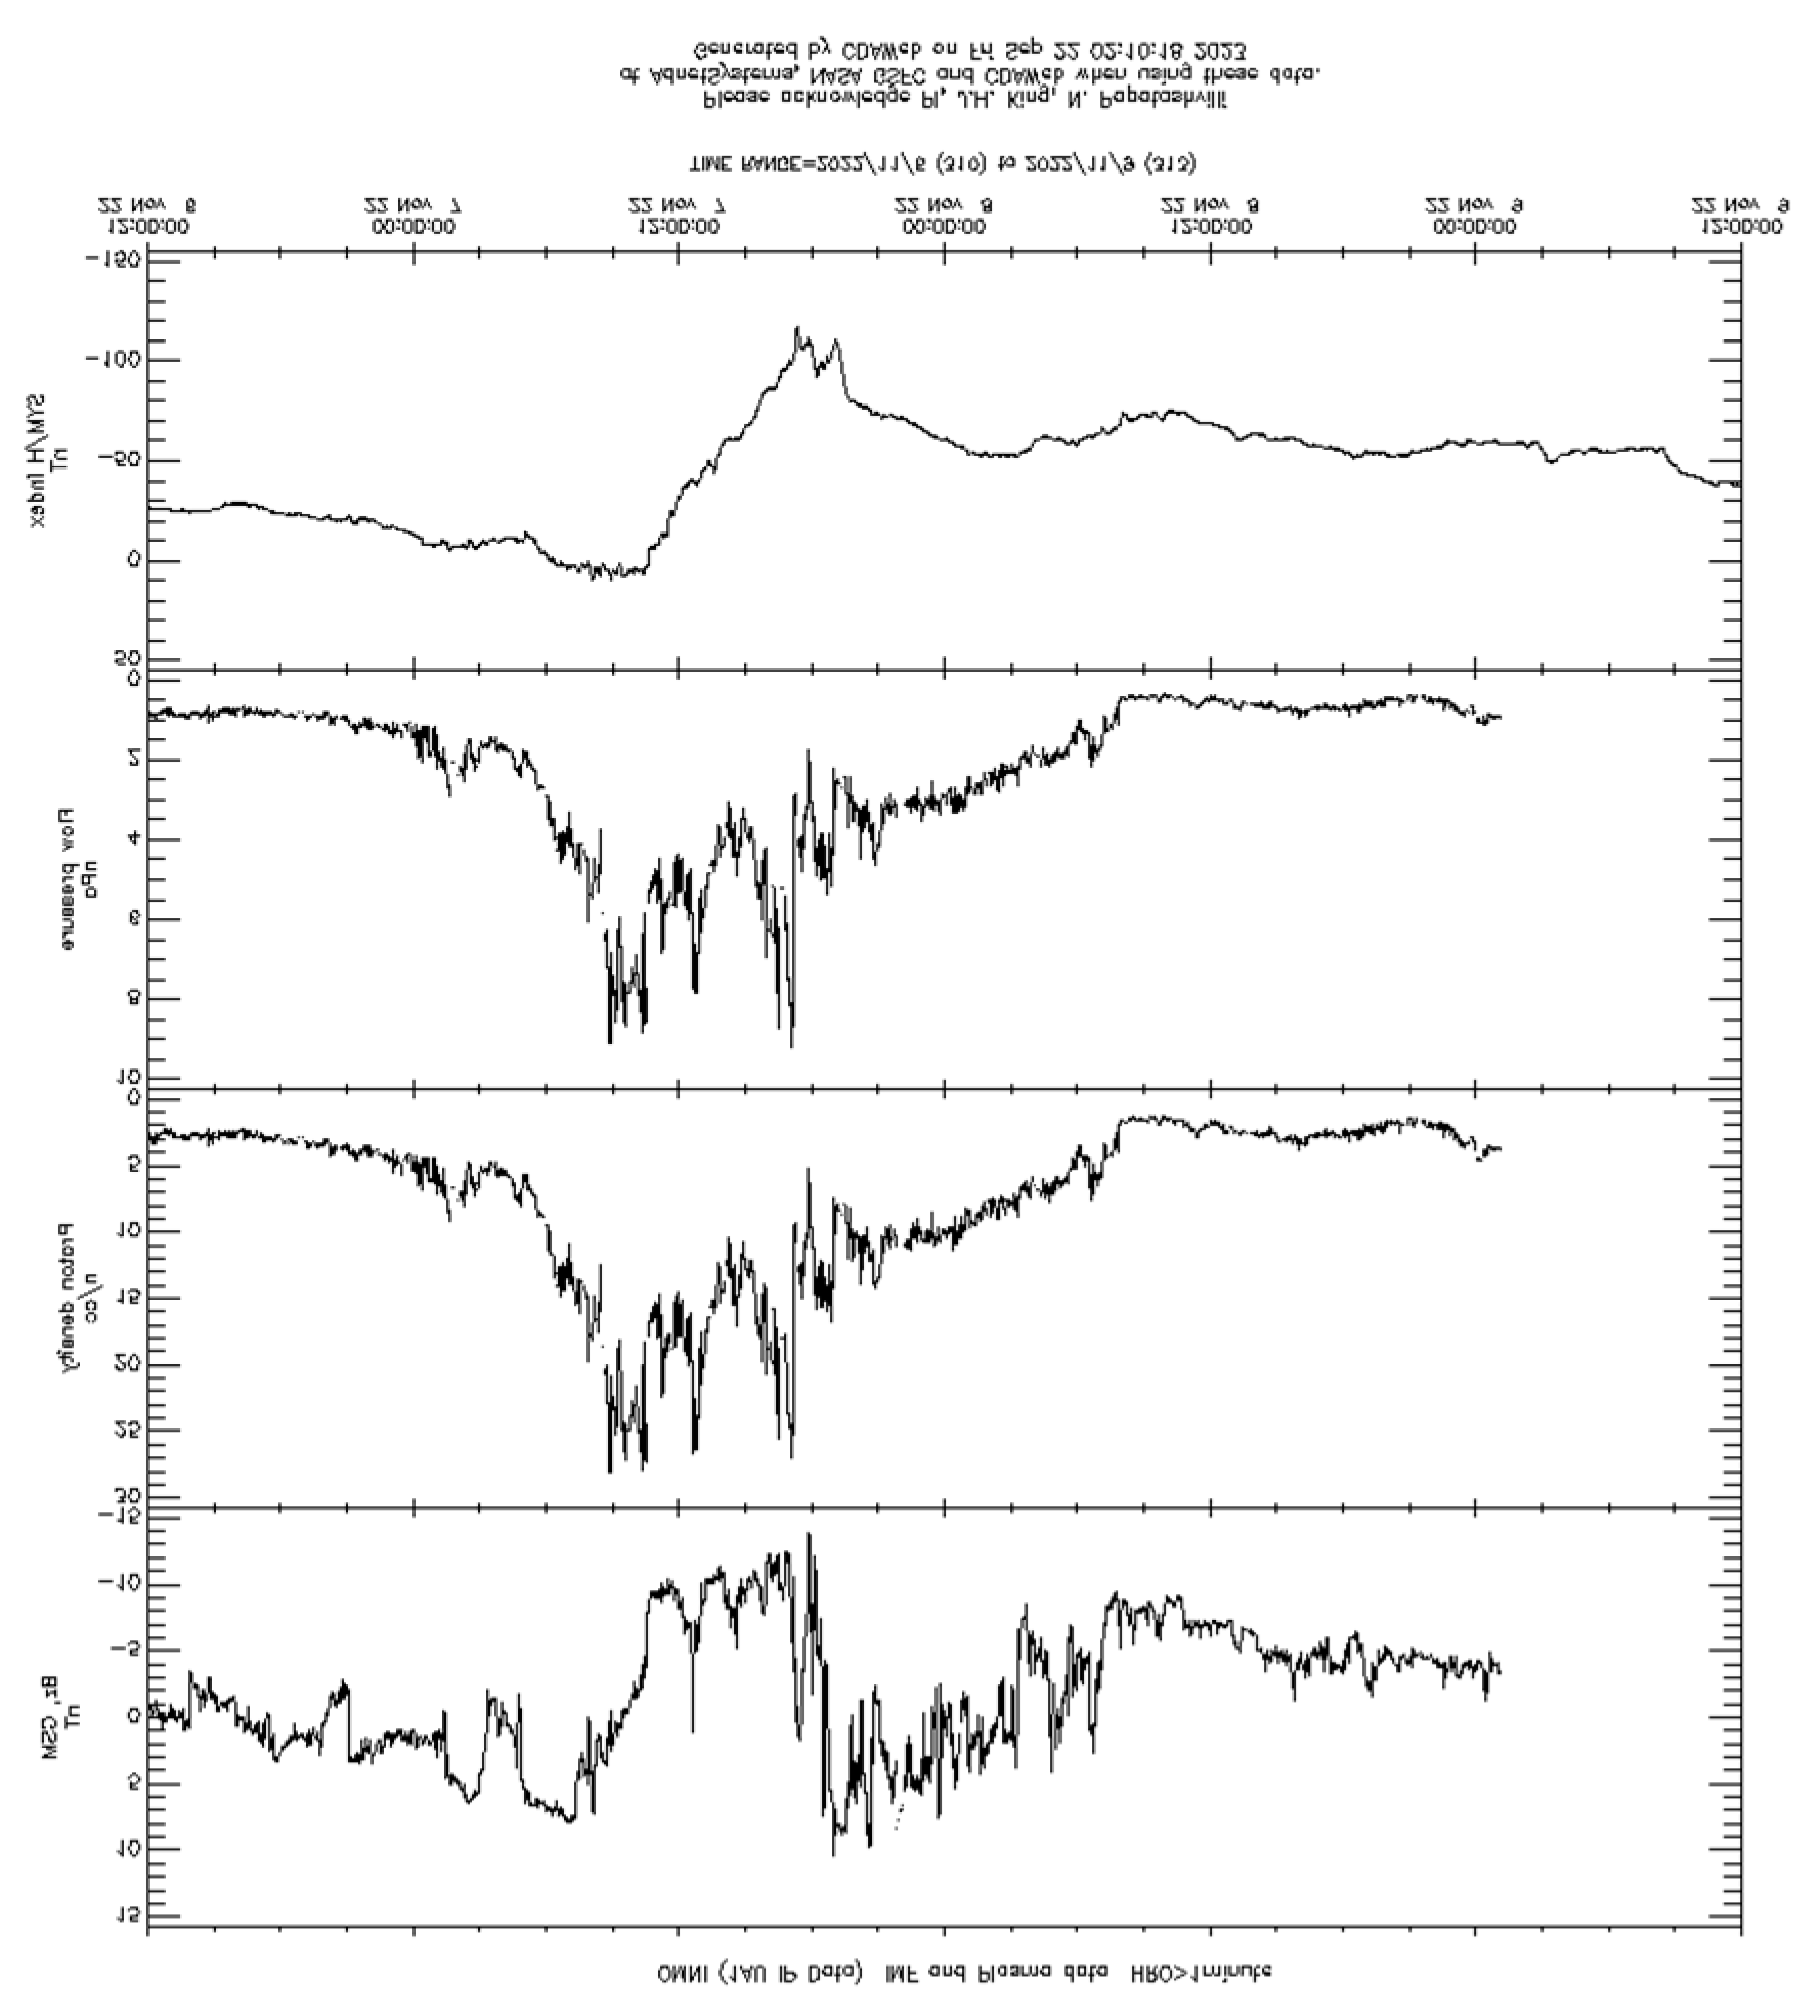
Two catastrophic earthquakes in Turkey on February 6, 2023: M7.8 at 01:17:34 UT with epicenter 37.226°N, 37.014°E, 10.0 km depth, and M7.5 at 10:24:48 UT with epicenter 38.011°N, 37.196°E, 7.4 km depth, were preceded by a strong geomagnetic storm on November 7, 2022 with the most significant negative SYM/H = -117 nT (Figure 1). This storm started at 08:04 UT with positive peak SYM/H= +10 nT. At this moment, in the area of the future M7.8 earthquake epicenter (37.226°N 37.014°E), the magnetic local time was equal to MLT = ~10.96h, and in the area of the future M7.5 earthquake epicenter (38.011°N, 37.196°E), it was equal to MLT = ~10.98h. Thus, this storm met a given criterion: at the time of its onset, the high-latitude part of the longitudinal region where in the future the Kahramanmaras earthquake sequence occurred was located under the polar cusp (MLT= 10-14 h [9]). To consider in more detail the solar wind (space weather) parameters that provoked this geomagnetic storm and then earthquakes (as we suppose), let us consider Figure 2, which presents not only the SYM/H index but also the solar wind proton density, solar wind dynamic pressure at the magnetopause, and the vertical component of the solar wind magnetic field (Interplanetary Magnetic Field) in the GSM coordinate system (Bz_GSM), that is a critical parameter for development of a magnetic storm. In this plot, we show data from the OMNI database for only a short time interval (November 6-9, 2022) for better visualization. It is seen from Figure 2 that on November 7, 2022, at 06:25 UT, the SYM/H-index changed its value from negative to positive and reached its positive peak at 08:04 UT. The solar wind flux density (n) and, accordingly, the dynamic pressure of the solar wind on the dayside magnetopause (P) also started to increase and reached their peaks on November 7, 2022, at 10:23 UT (n=27.88 cm-3, P = 8.81 nPa). A change in the orientation of the vertical component of the interplanetary magnetic field Bz_GSM from positive to negative (at which an effective reconnection of the solar wind magnetic lines with geomagnetic lines occurs with penetration of the solar wind energy into the near-Earth space) began at 09:31 UT. At 10:37 UT, the SYM/H-index changed its value from positive to negative (the main phase of the geomagnetic storm started). Thus, the initial phase of the magnetic storm on November 7, 2022, lasted from ~ 08:04 UT to ~ 10:37 UT. At 10:37 UT, the magnetic local time in the areas of the future Kahramanmaras earthquake sequence was equal to 13.36h and 13.38h, respectively. Thus, during the initial storm phase, the high-latitudinal area of Turkey’s longitudinal region was located under the polar cusp. The time delay between geomagnetic storm onset and earthquake occurrence equals ~ 91 days (Table 1).

3.2. Case Study of M7.0 of October 30, 2020

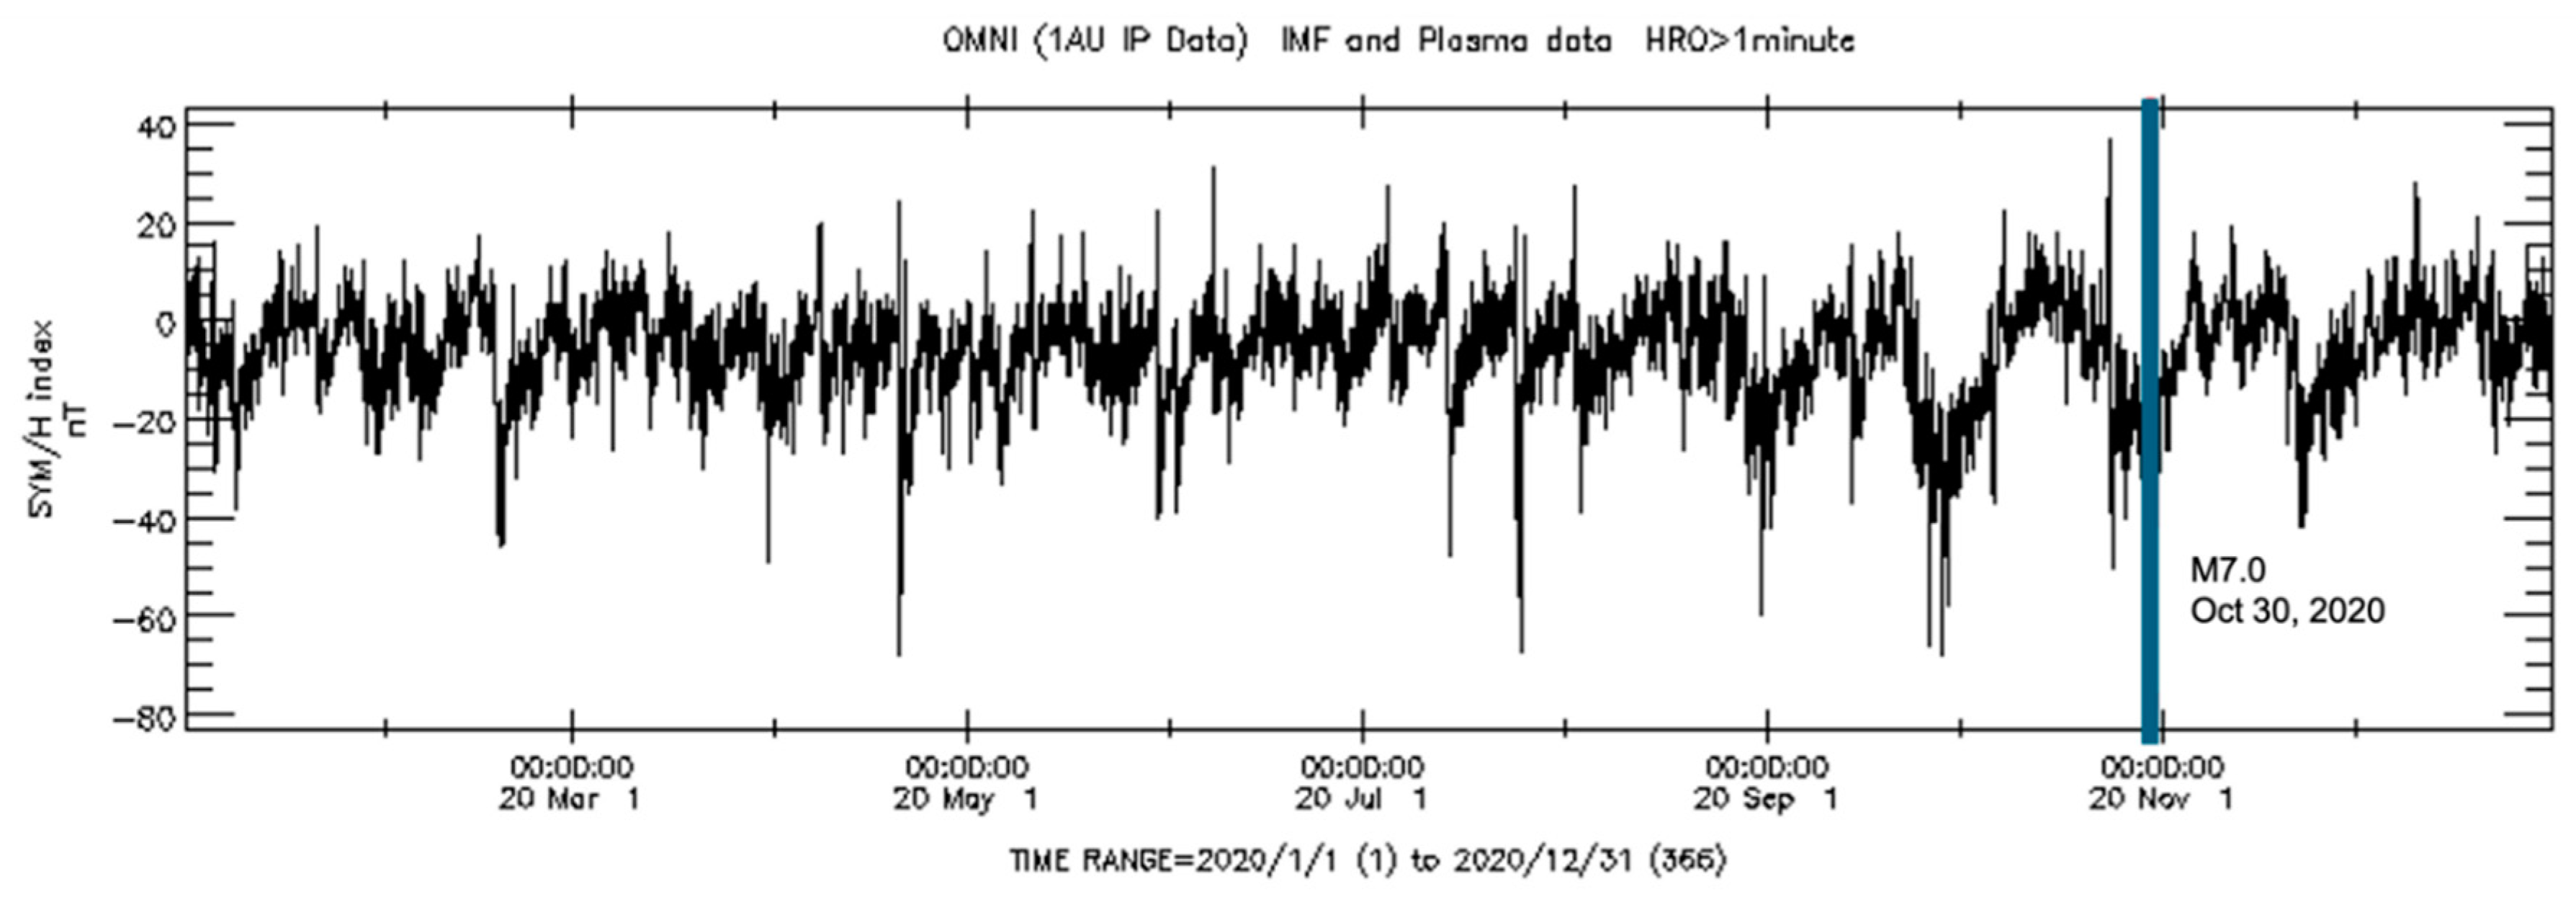
On October 30, 2020, a strong M7.2 earthquake occurred in the Aegean Sea at 11:51:27 UT with coordinates of the epicenter 37.897°N, 26.784°E on a depth of 21.0 km. The epicenter was located on the northeast of the Greek island of Samos. Although Samos was closest to the epicenter, it was the Turkish city İzmir, 70 km northeast, that was heavily affected—more than 700 residential and commercial structures were seriously damaged or destroyed. In 2020, there were no strong geomagnetic storms, only small and moderate (Figure 3).
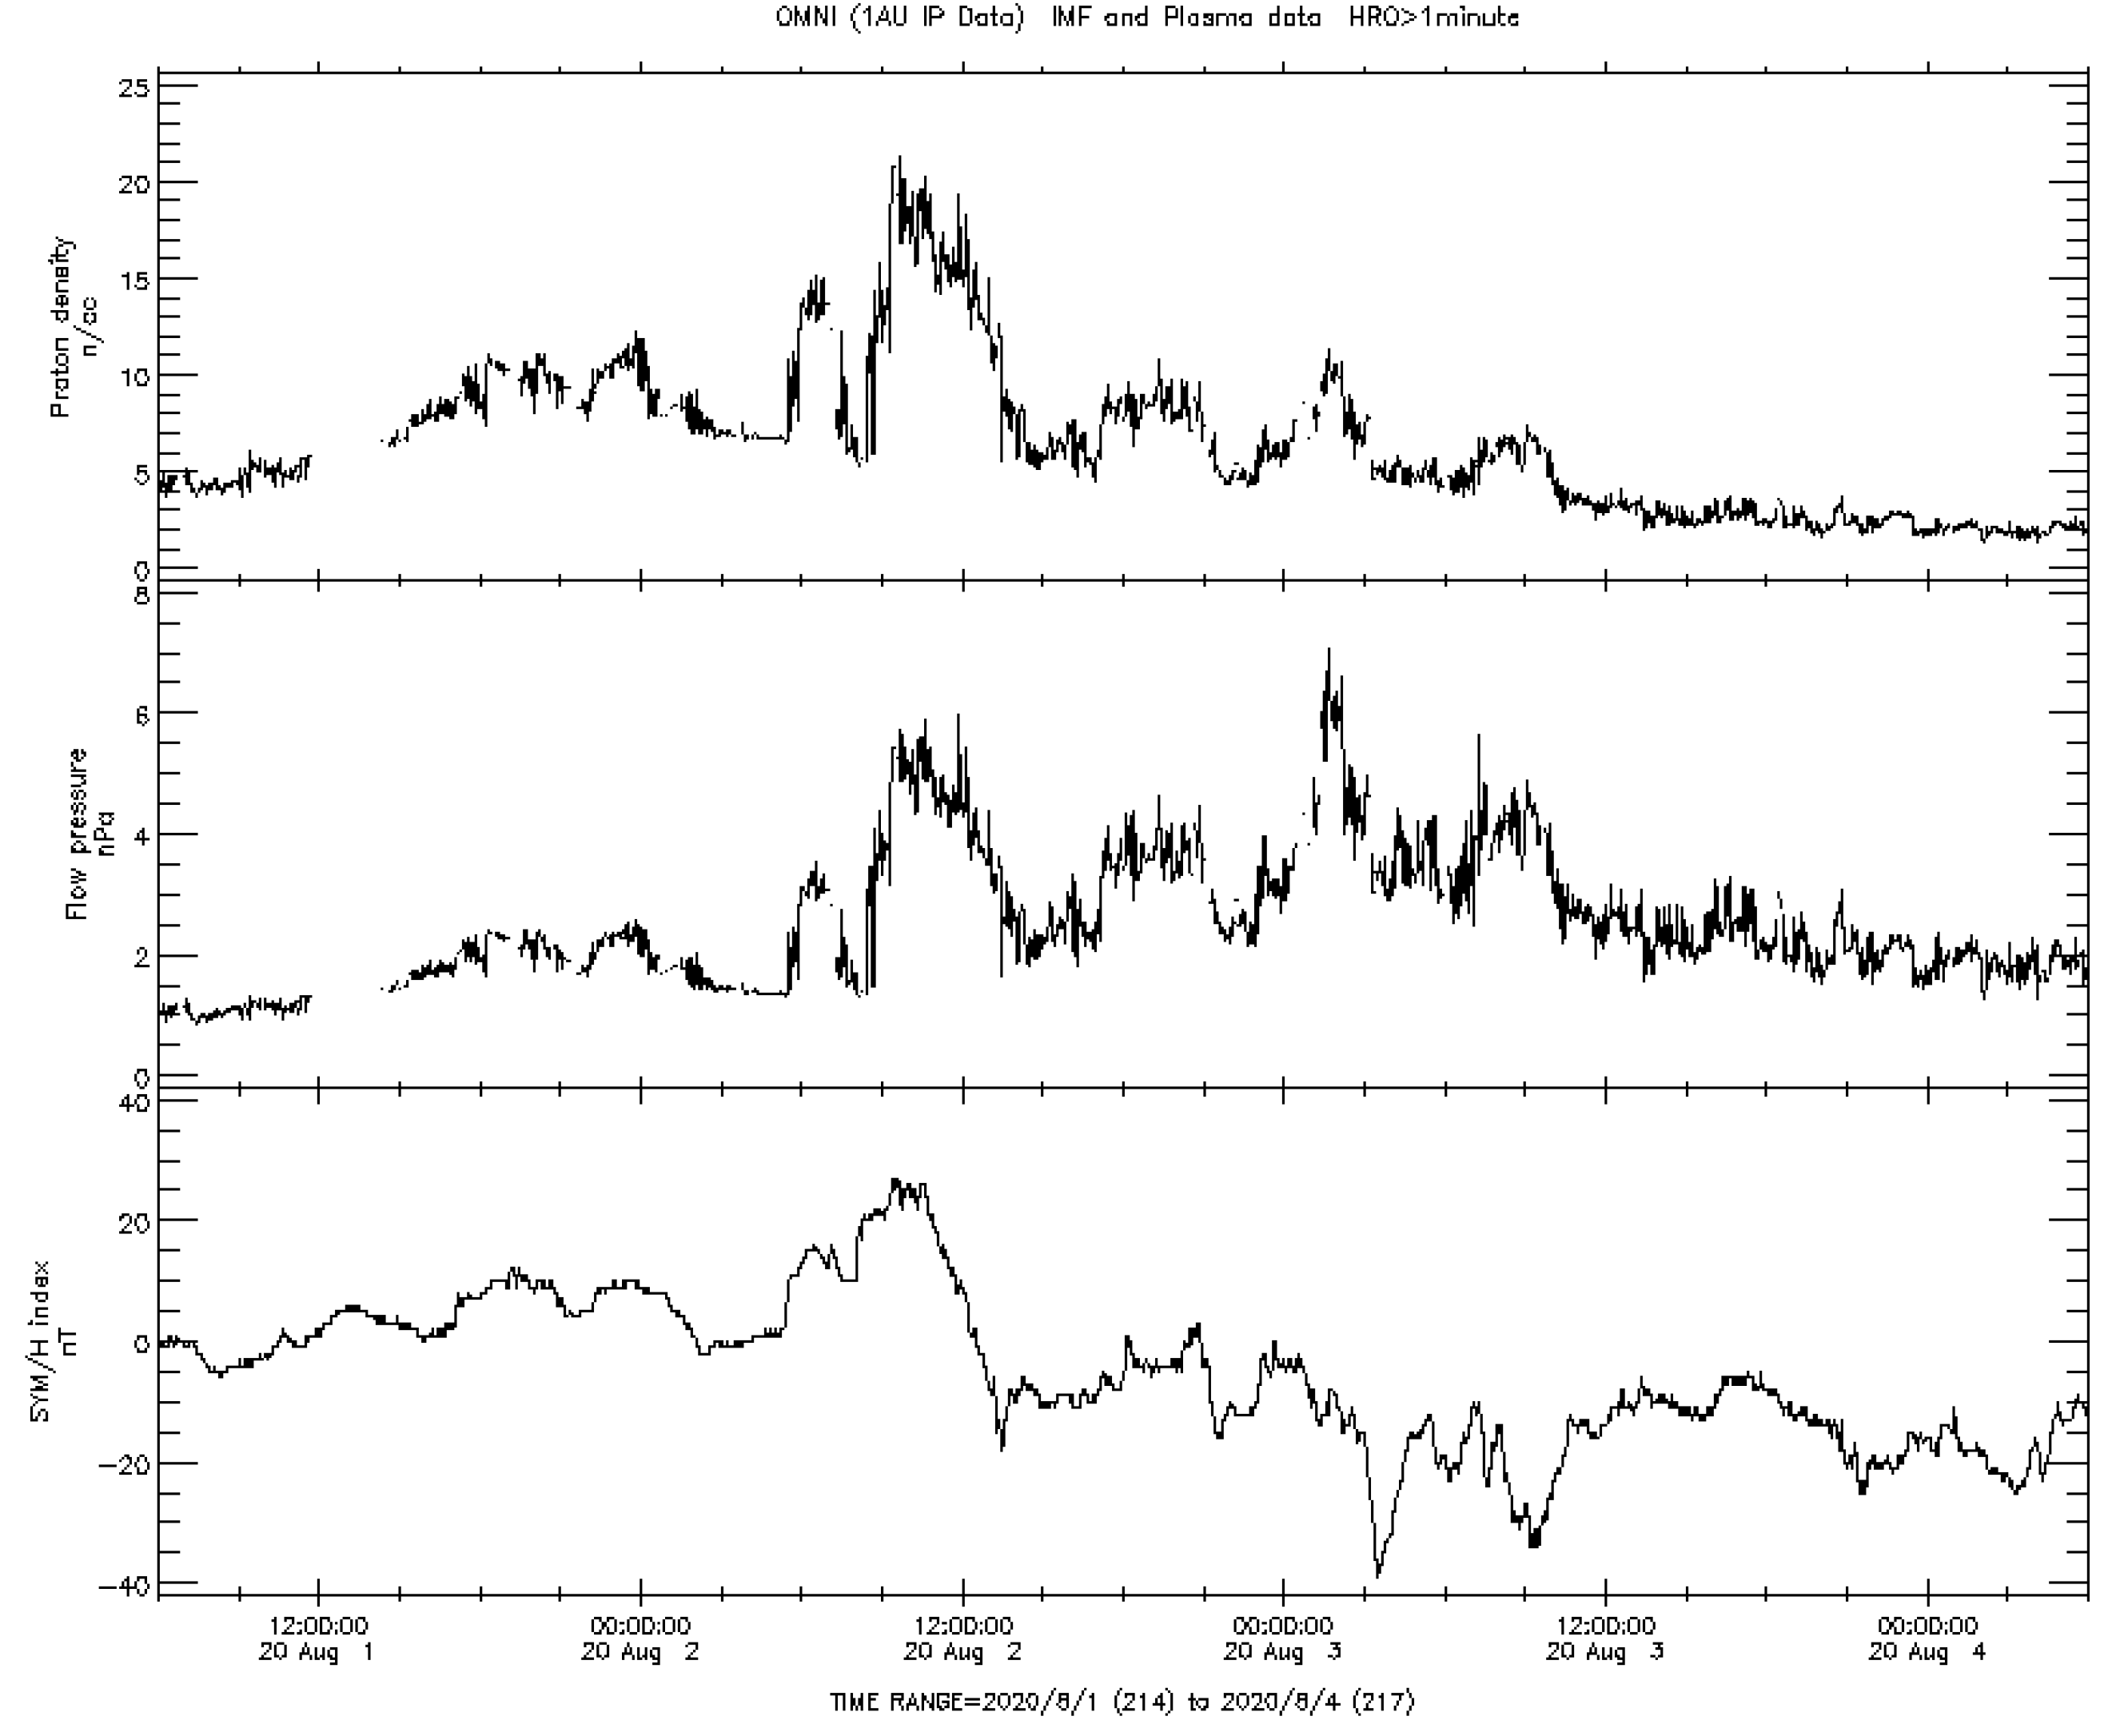
An analysis of geomagnetic storms, which preceded the M7.0 earthquake in the Aegean Sea on October 30, 2020, showed that there were two nearest small magnetic storms, which satisfied a chosen criteria: at the time of geomagnetic storm onset, the high-latitude area of the longitude 26.784°E, at which the M7.0 earthquake occurred, was located under the polar cusp (magnetic local time in the area of the future epicenter was between 10-14h in accordance with [9], or 08-16h in accordance with [10]. The first such a small geomagnetic storm (Sym/H = - 39 nT) started on August 2, 2020, at 09:23UT with positive Sym/H = + 27 nT (Figure 4). In the initial phases of this storm, the magnetic local time in the area of the future epicenter (37.897°N, 26.784°E) was equal to MLT=~ 10.8h. Thus, this storm met a given criterion: at the time of its onset, the high-latitude part of the longitudinal region, where in the future the M7.0 earthquake occurred, was located under the polar cusp (10-14h [9]). The delay between this magnetic storm onset and earthquake occurrence equals ~ 89 days (Table 1).
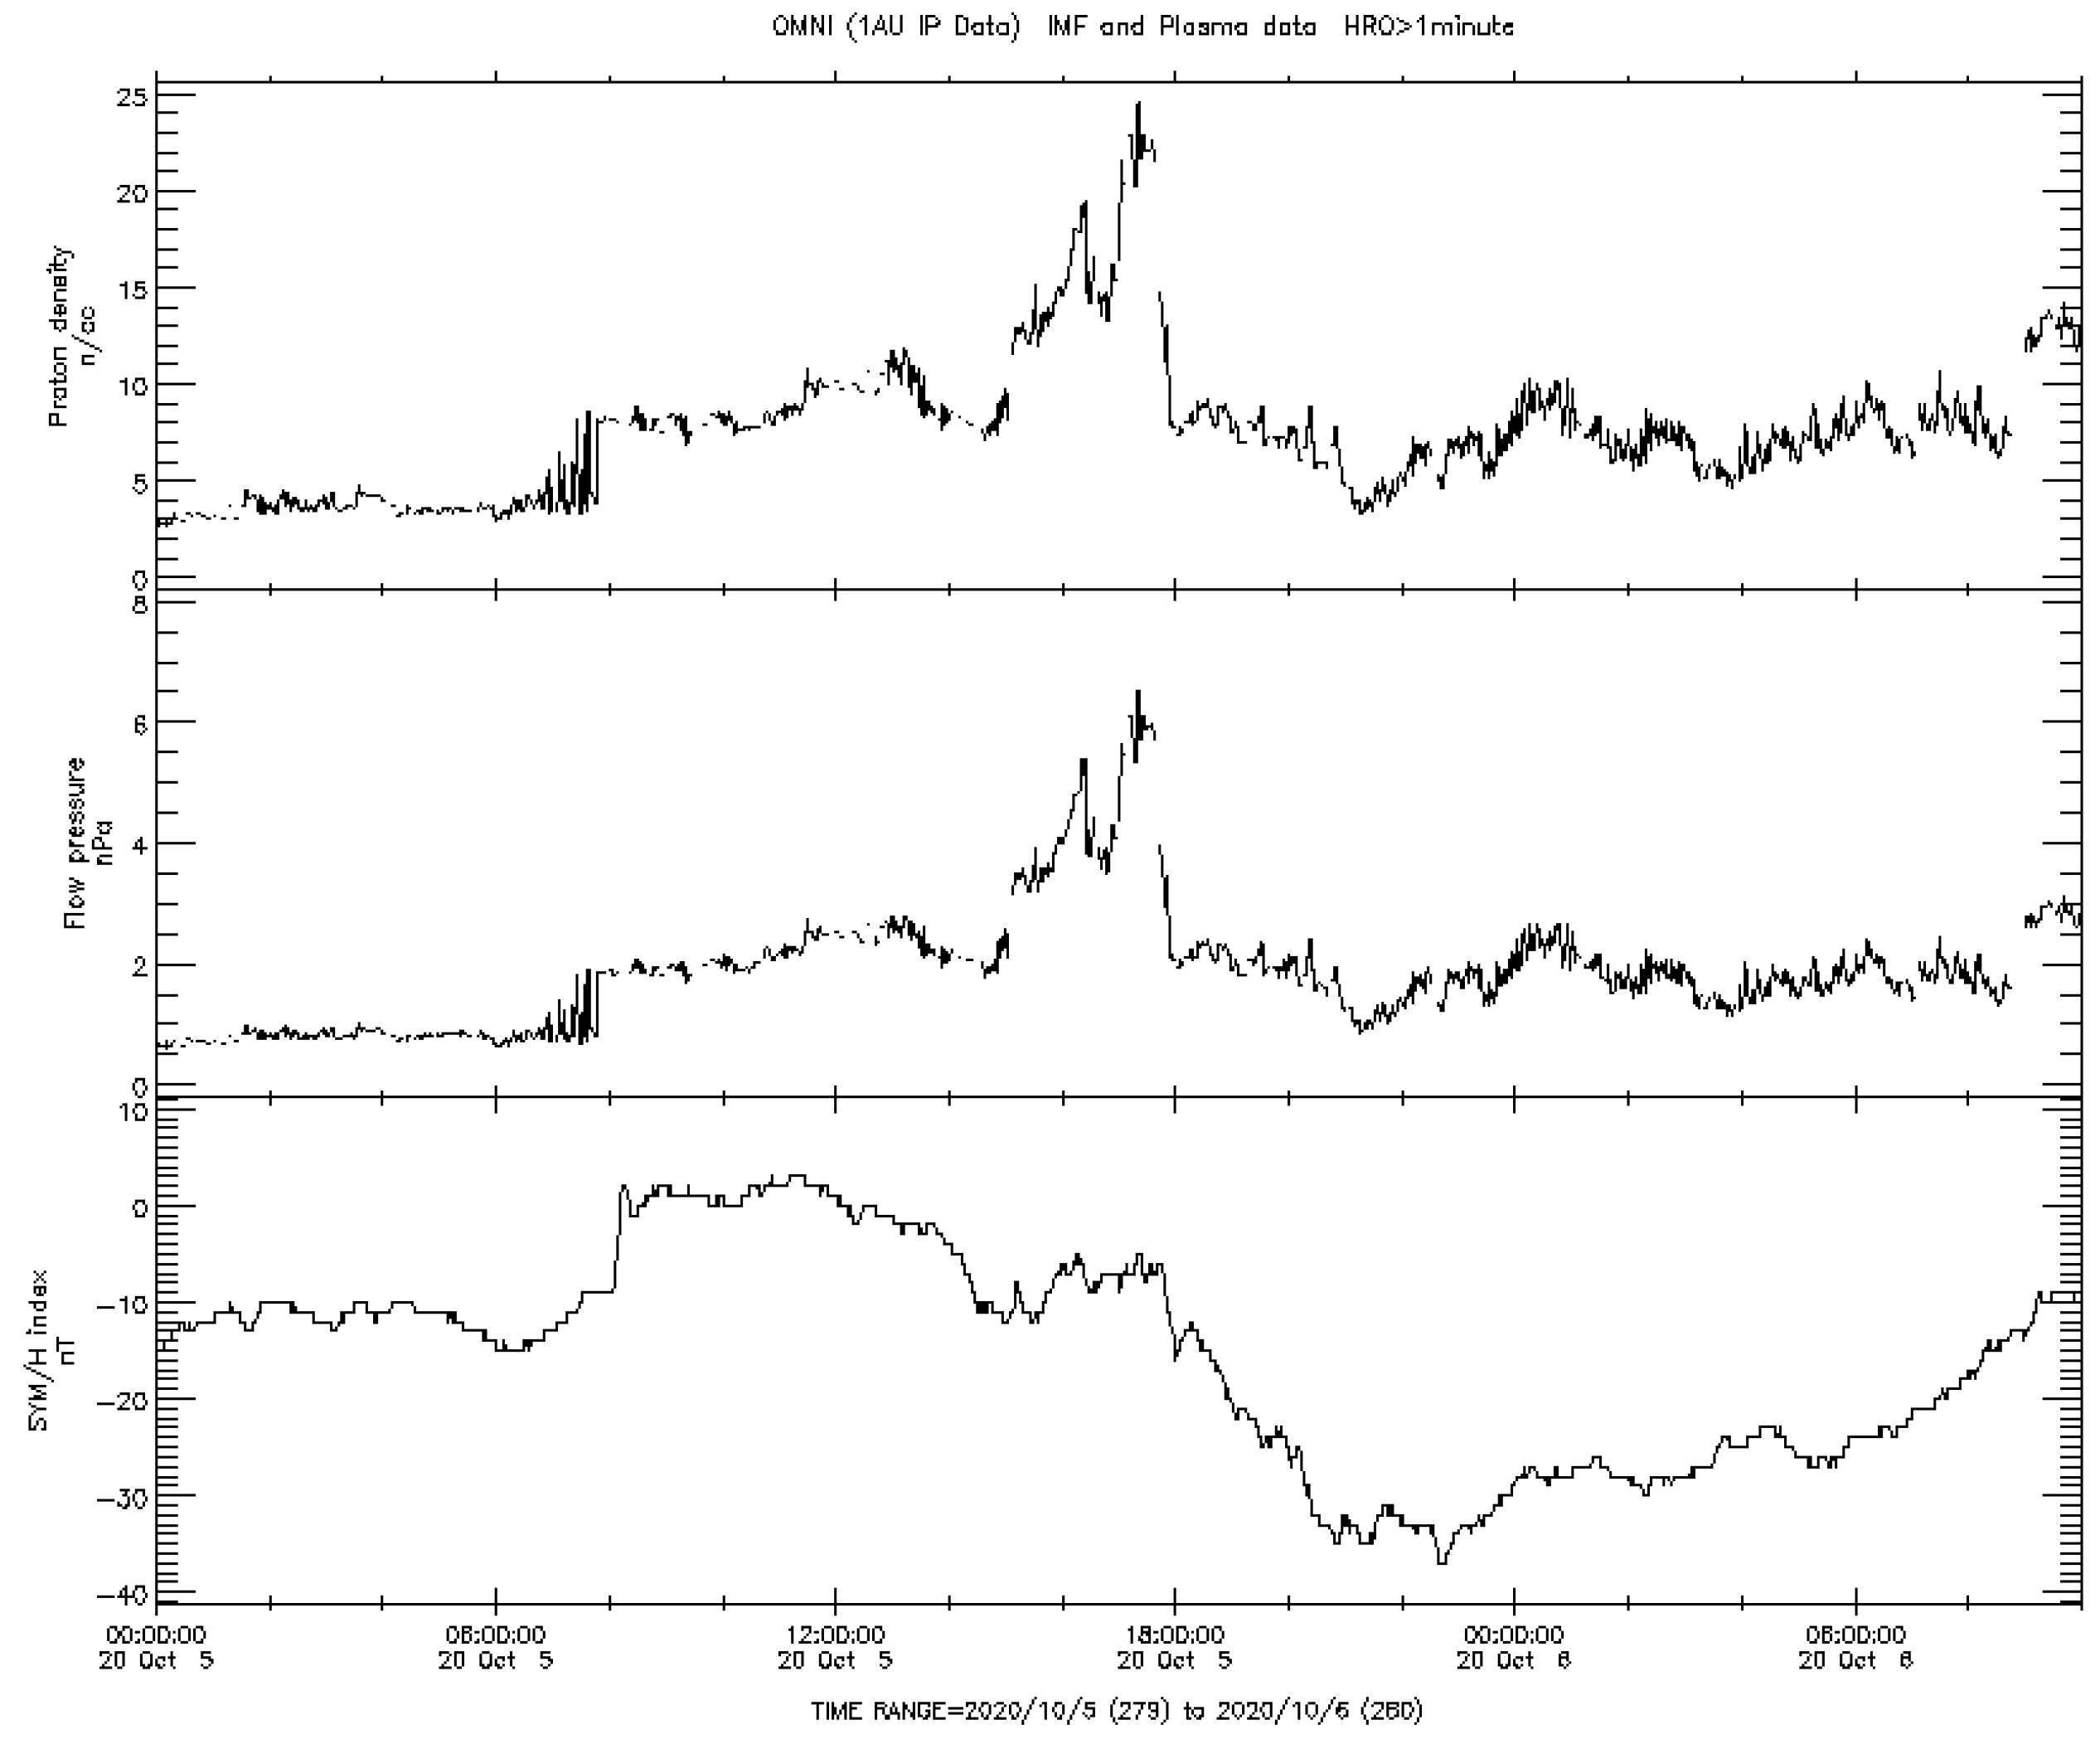
The second small storm (SYM/H = - 37 nT) started on October 5, 2020, at 08:12UT, with a sudden jump in the SYM/H index from -9 nT to +1 nT (Figure 5). In the initial phases of this storm, the magnetic local time in the area of the future epicenter (37.897°N, 26.784°E) was equal to MLT=~ 9.6h. Thus, this storm met a given criterion: at the time of its onset, the high-latitude part of the longitudinal region, where in the future the M7.0 earthquake occurred, was located under the polar cusp (8-16h [10]). The delay between this magnetic storm onset and earthquake occurrence equals ~ 25 days (Table 1).

3.3. Case Study of M7.1 of October 23, 2011

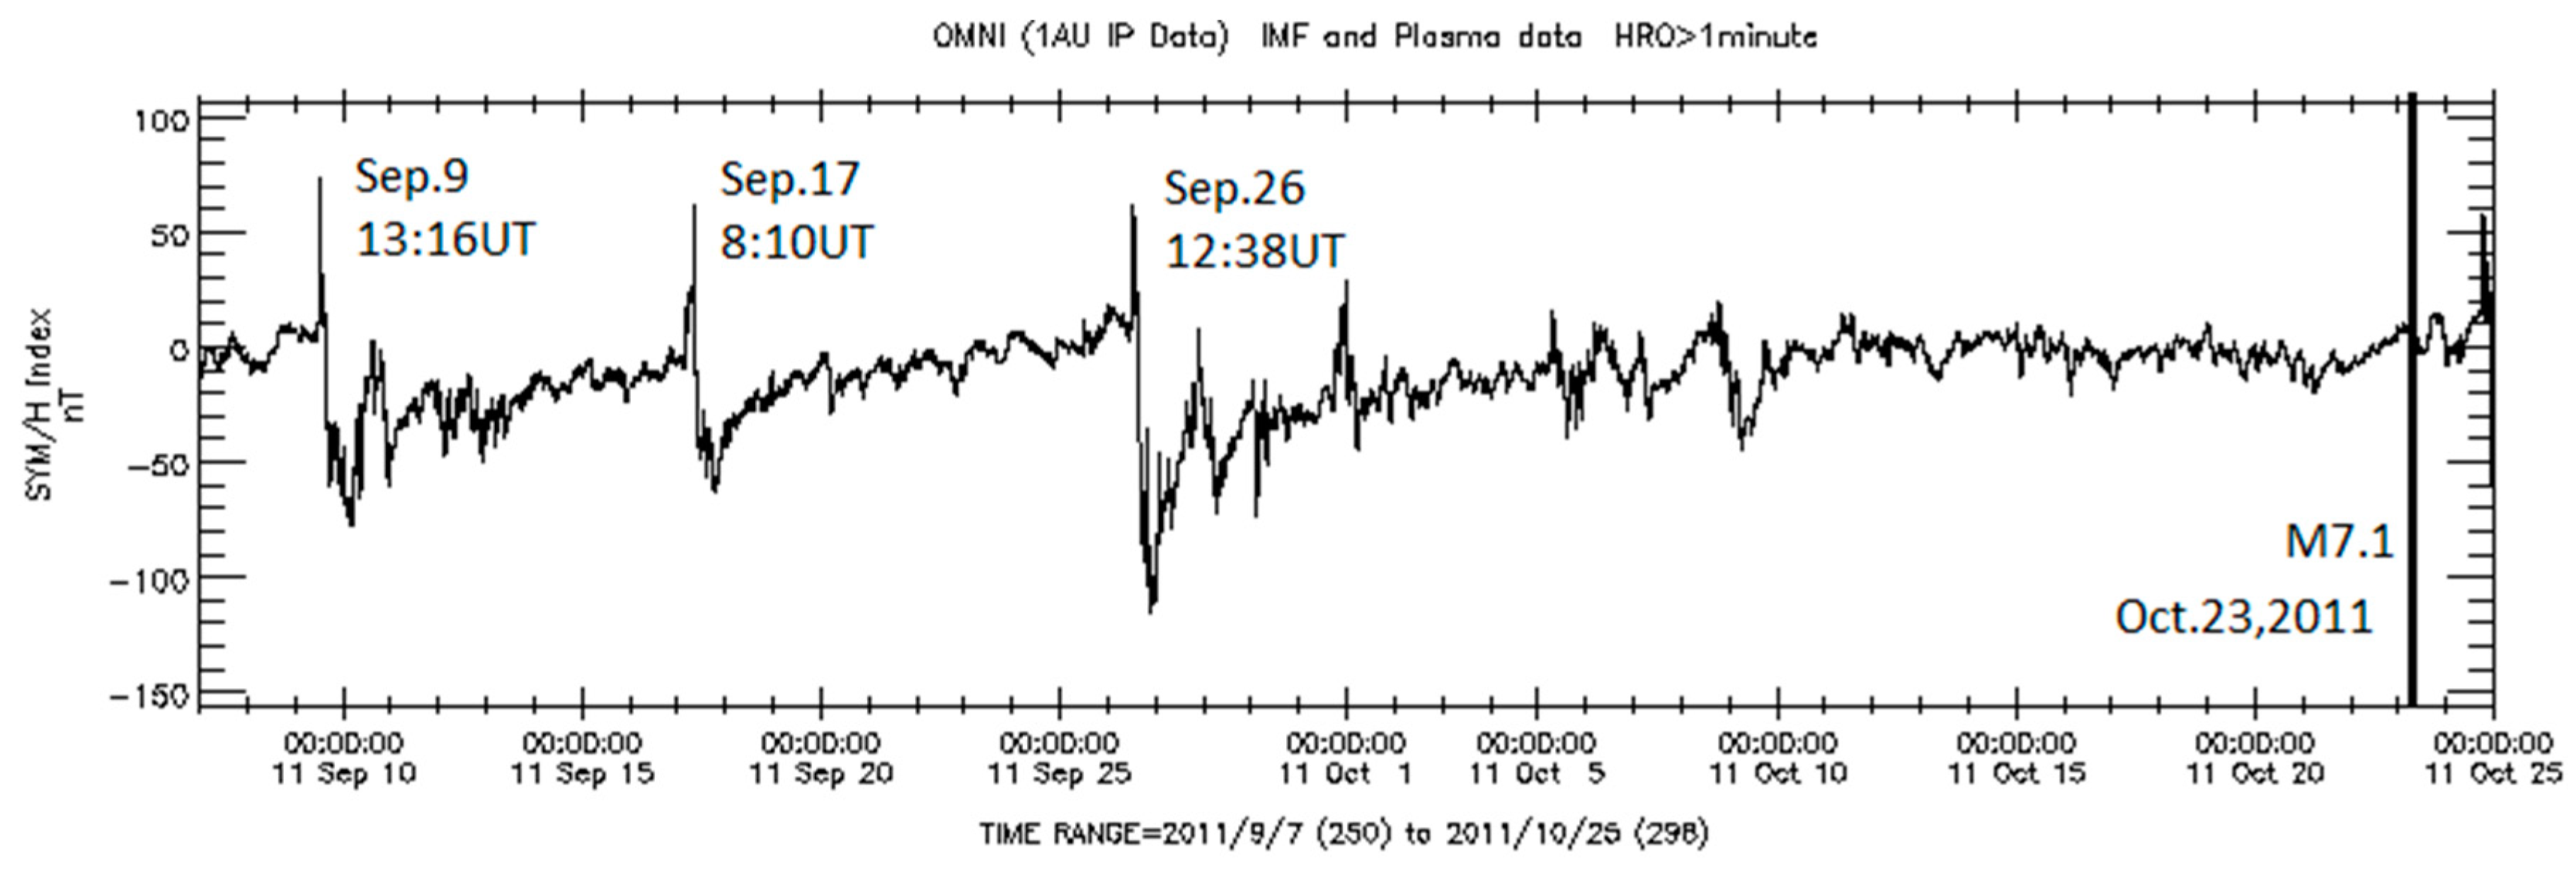
On October 23, 2011, a strong M7.1 earthquake occurred in Turkey at 10:41:23 UT with coordinates of the epicenter 38.721°N, 43.508°E, at a depth of 18.0 km. This event was preceded by three geomagnetic storms in September 2011 with the sudden onsets (Figure 6). The first moderate storm (SYM/H= -77 nT) started on September 9 at 13:16 UT (positive SYM/H= + 74 nT), the second weak storm (SYM/H= - 43 nT) began on September 17 at 08:10 UT (positive SYM/H= + 61 nT), and the third strong storm (SYM/H= - 111 nT ) started on September 26 at 12:38 UT (positive SYM/H= + 62 nT). In the initial phase of the geomagnetic storms, the magnetic local times (MLT) in the area of the future epicenter (38.721°N, 43.508°E) were equal to ~15.7h, 10.6h, and 15.1h, respectively. In the initial phase of each of the three storms, the high-latitude area of longitudinal regions where the M7.1 earthquake occurred was located under the polar cusp if it is between MLT=08h -16 h [10]. The delay times between the magnetic storm onset and earthquake occurrence are equal to ~ 44, ~36, and ~27 days, respectively (Table 1).

3.4. Case Study for M7.2 of November 12, 1999

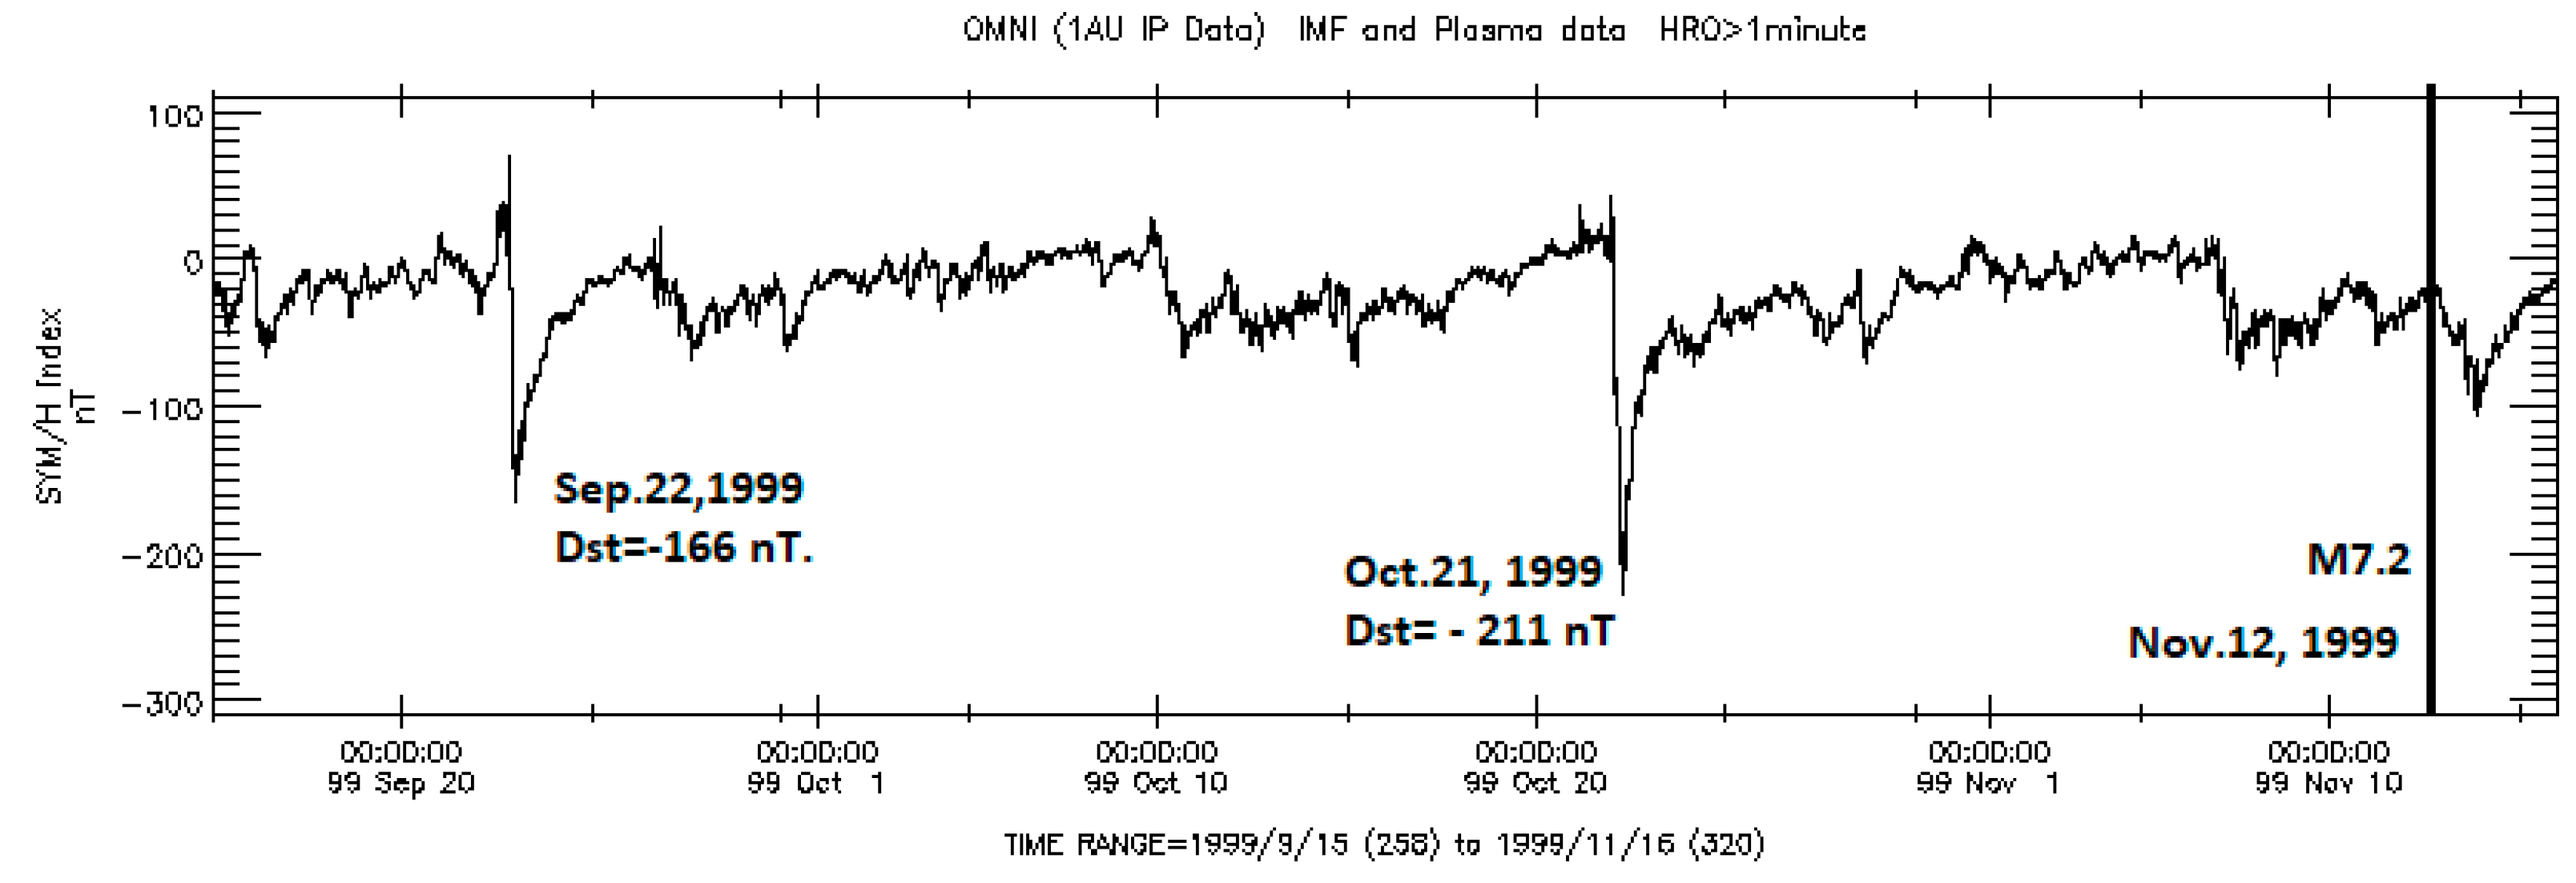
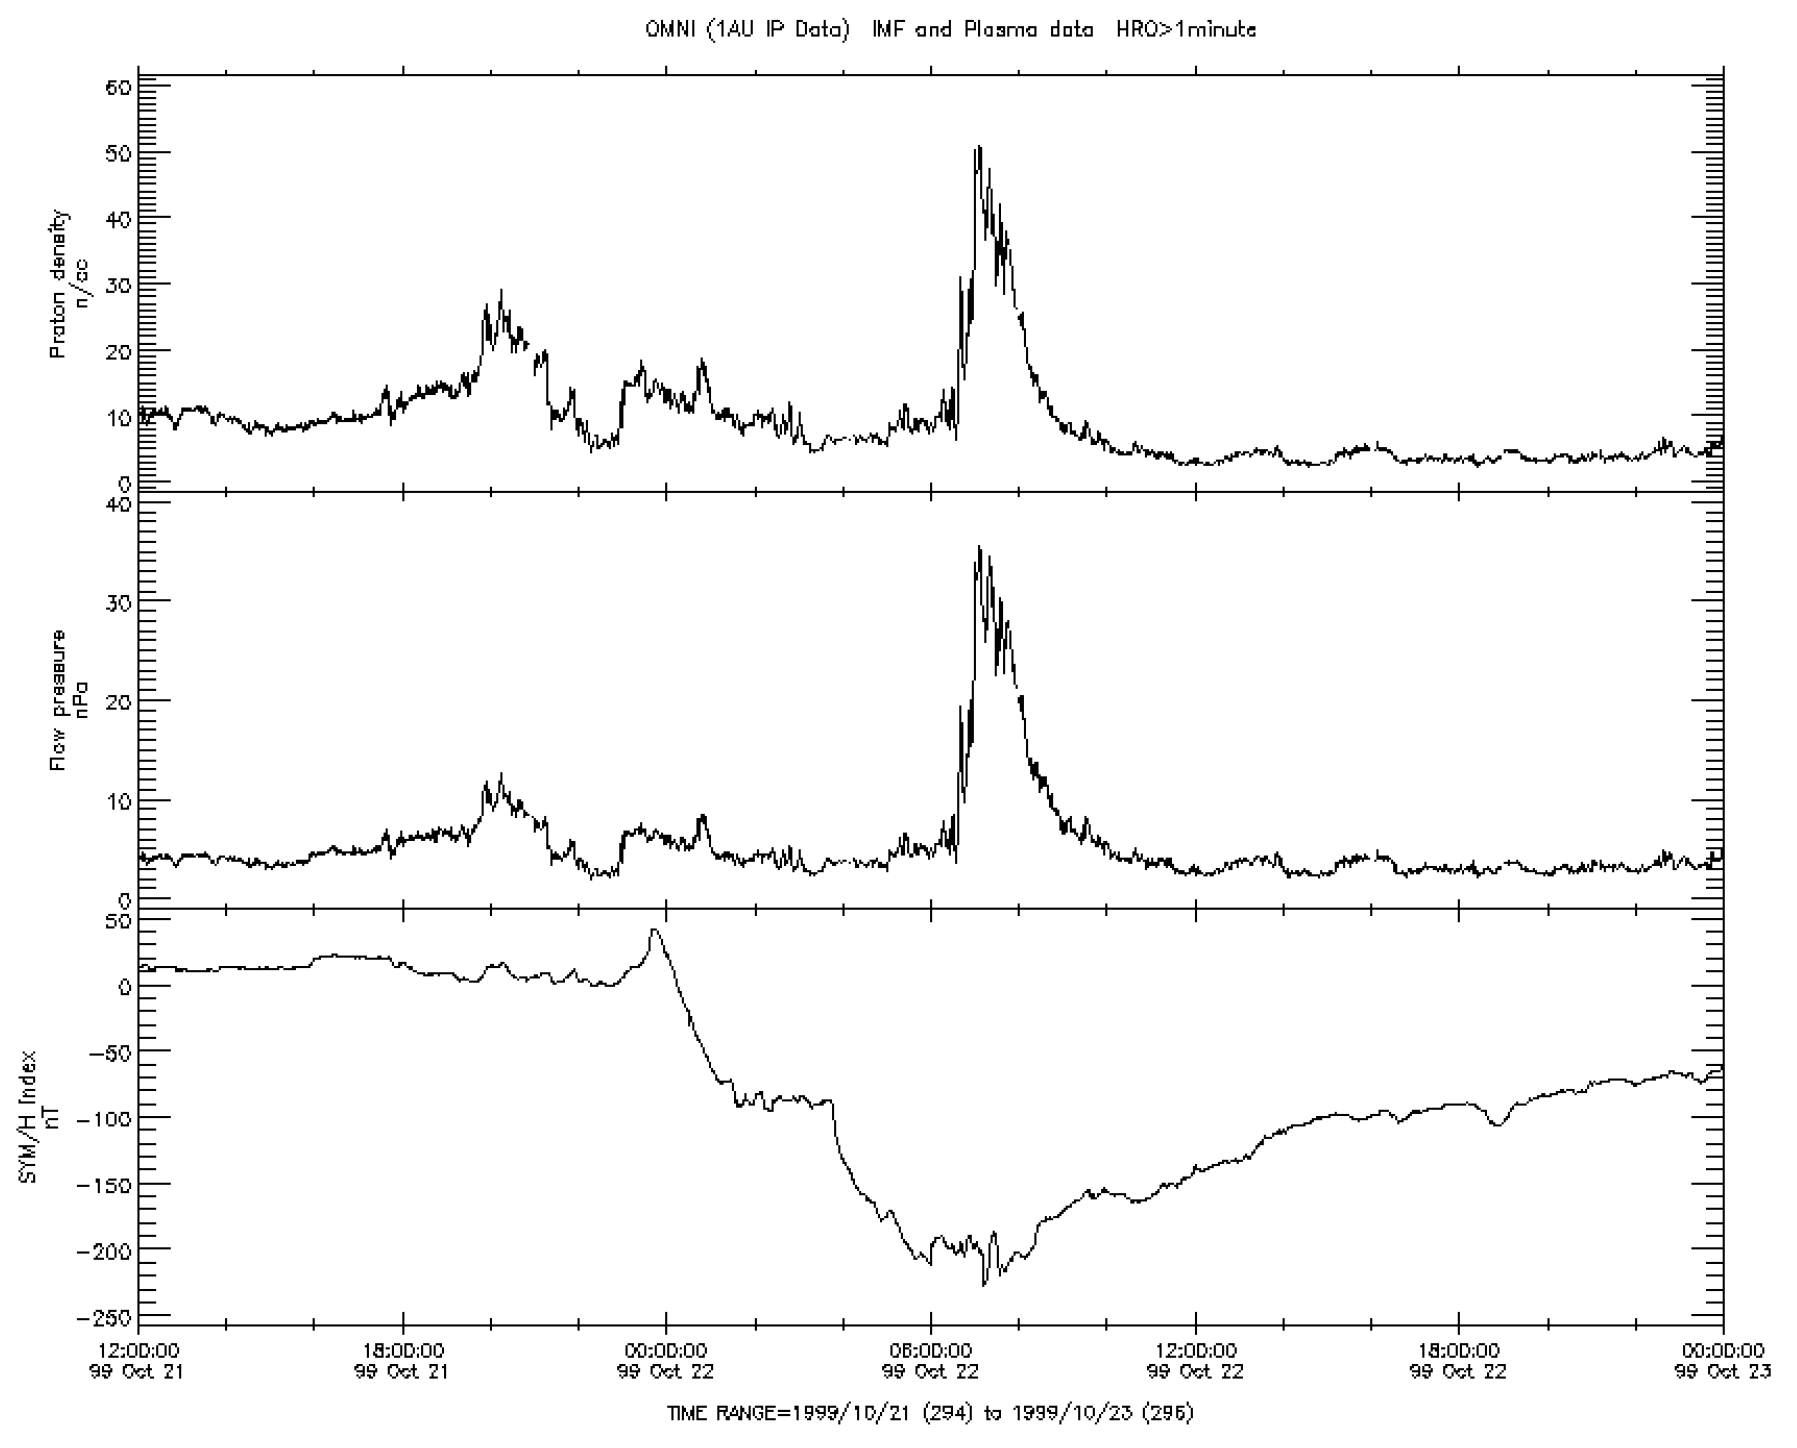
On November 12, 1999, a strong M7.2 earthquake occurred in Turkey at 16:57:19 UT with coordinates of the epicenter 40.758°N, 31.161°E at a depth of 10.0 km. It was preceded by a strong magnetic storm on September 22, 1999, SYM/H = -166 nT, and a powerful one on October 21, 1999, SYM/H = -211 nT (Figure 7).
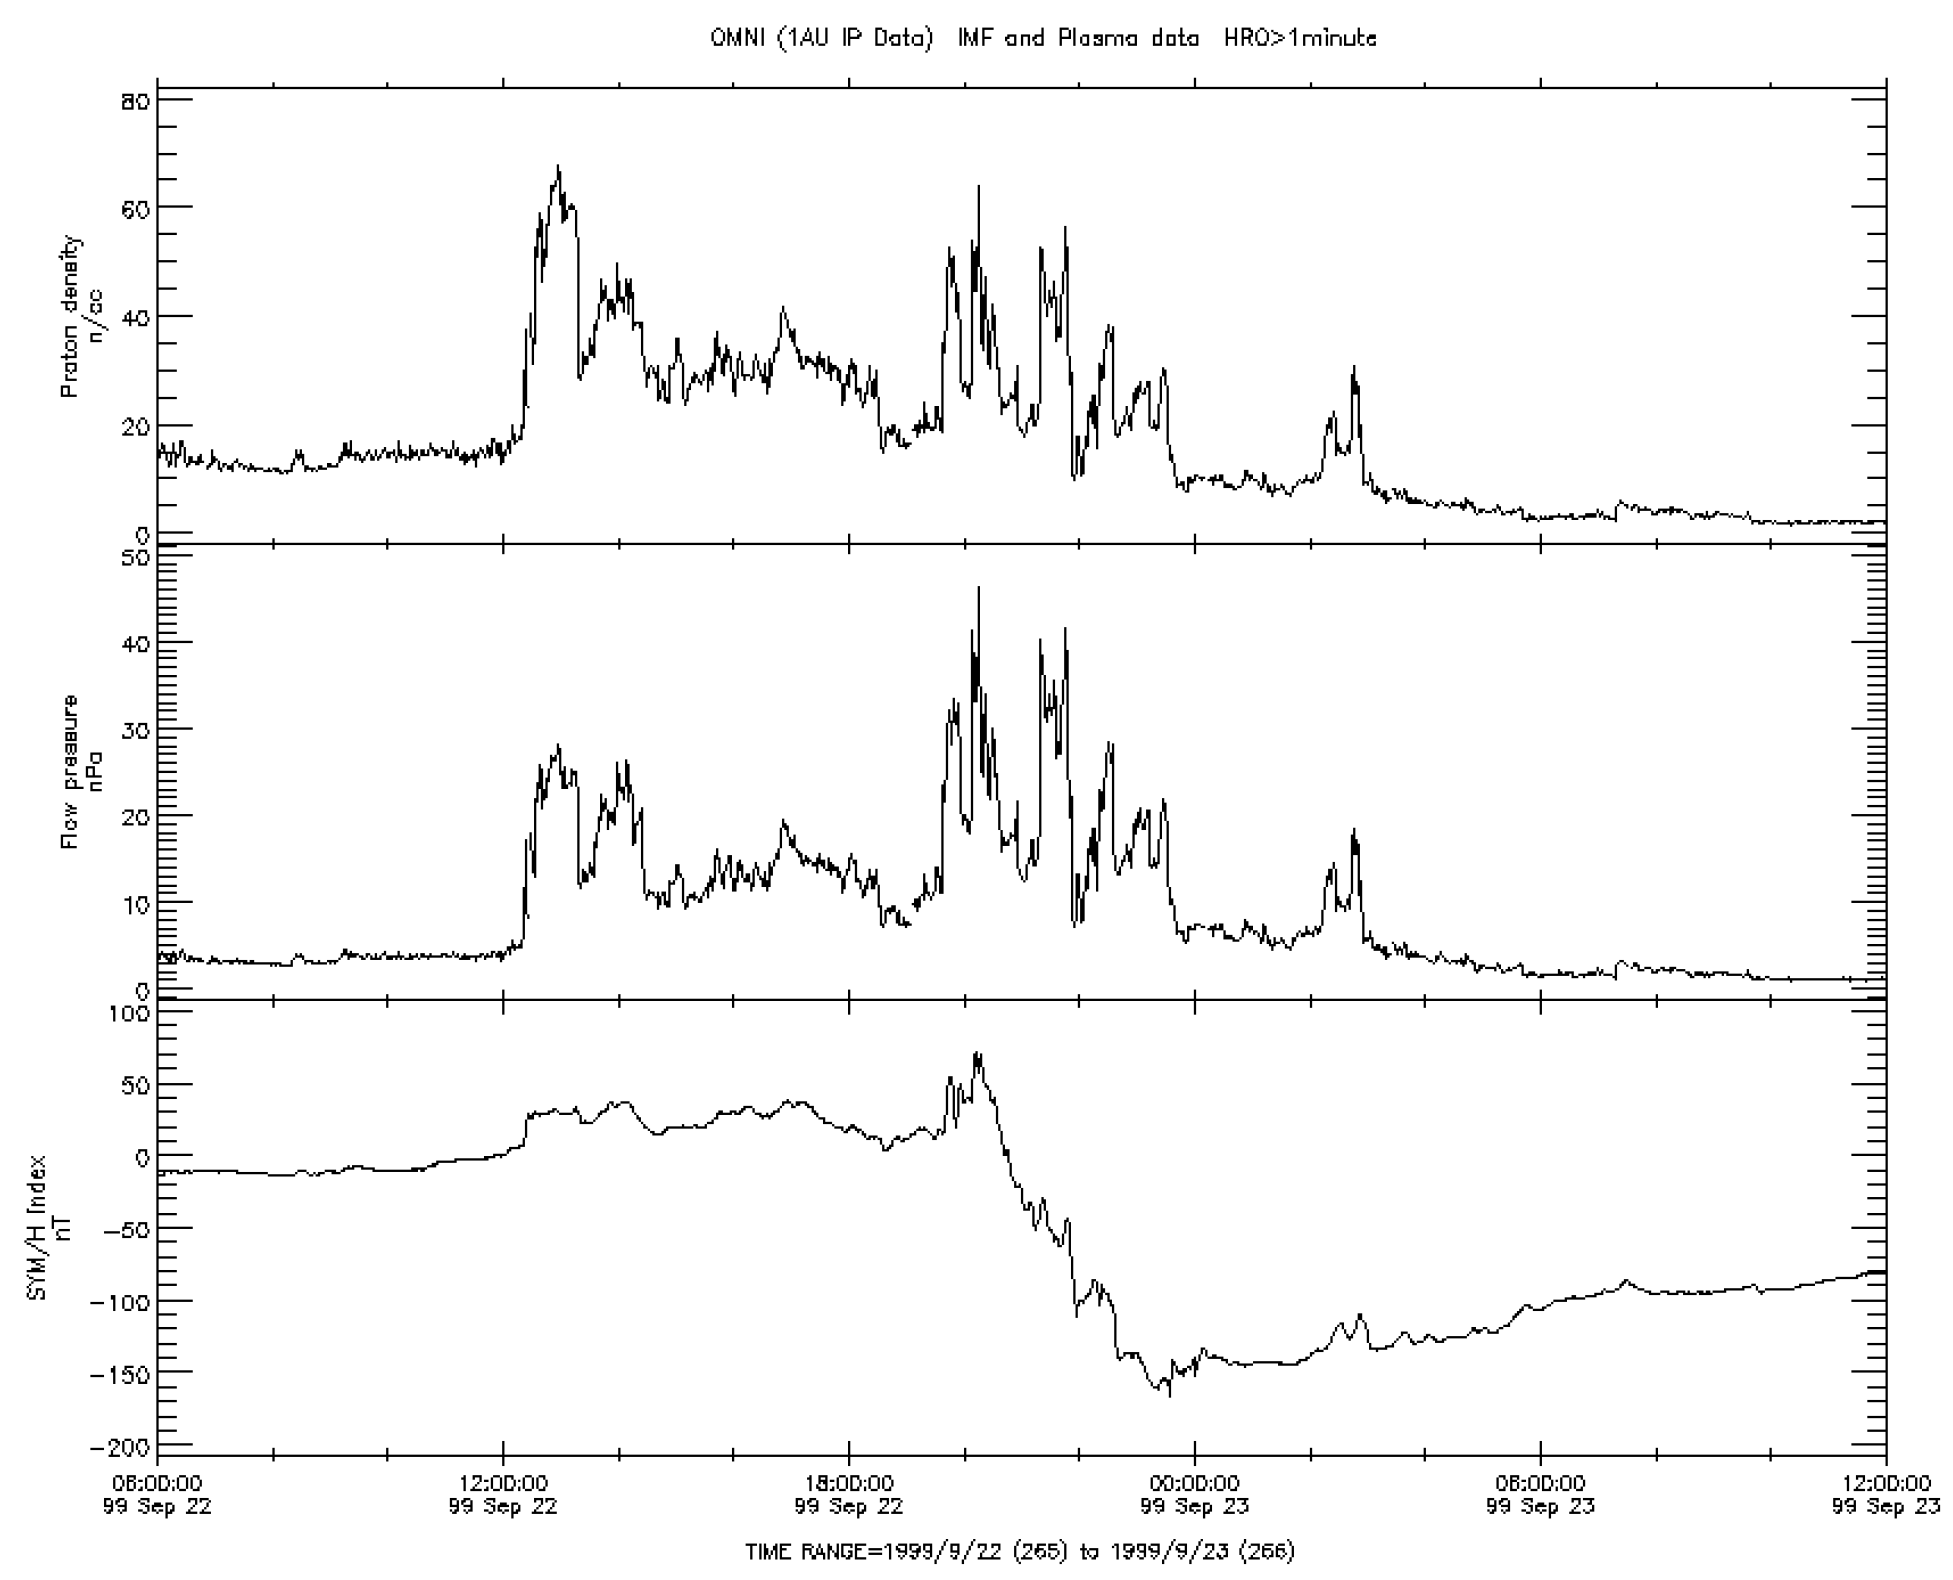
In Figure 8 and Figure 9, we present the solar wind parameters for these storms in more detail. It is seen from Figure 8 that a strong geomagnetic storm on September 22, 1999, started at 12:57UT due to the arrival of a dense solar wind proton flux (upper panel), which increased dynamic pressure at the magnetopause (middle panel). At this time (12:57UT), a magnetic local time in the area of the future epicenter (40.758°N, 31.161°E) was equal to MLT=14.4h, that is, the high-latitude part of the M7.2 epicenter longitudinal region (31.161°E) was under the polar cusp. The delay time between the magnetic storm onset and earthquake occurrence equals ~ 51 days (Table 1). Besides this, Figure 9 shows that during this storm, the second arrival of a dense solar wind flux occurred, which resulted in increasing positive SYM/H value up to +71 nT at 20:12 UT.
It is not difficult to estimate that this time, the high-latitude part of a longitudinal region ~930W–1530W was under the polar cusp, and one could expect an occurrence of a strong earthquake in this region. Indeed, according to the USGS seismic catalog, three such events occurred here, namely, M7.5 in Mexico (16.059°N, 96.931°W) on September 30, 1999, with a time lag ~ 8 days; M7.1 in California (34.603°N, 116.265°W) on October 16 1999 (Hector Mine) with a time lag ~ 24 days, and M7.0 at Alaska (57.342°N, 154.347°W) on December 6 1999 with a time lag ~75 days. 8
In Figure 9, we show the solar wind parameters for geomagnetic solid storms with the SYM/H = -211 nT, which started on October 21, 1999, at 23:41 UT with positive SYM/H = +42 nT. It is not difficult to calculate that at this time (23:41 UT), the high latitude part of the longitudinal region ~ 154.8E-214.8E should be under the polar cusp if it is between 10-14h [9], while 124.8E-244.8E, if a cusp is between 08-16h [10]. Again, one could expect strong earthquakes in this region, which is a fact. According to the USGS seismological catalog, on November 19, 1999, the M7.0 event occurred in Papua New Guinea (6.351°S, 148.763°E), a time lag of ~29 days; on November 26, 1999, the M7.5 event occurred in Vanuatu (16.423°S, 168.214°E), a time lag ~36 days; and on December 6 1999, the M7.0 event occurred in Alaska (57.342°N, 154.347°W=205.653E), a time lag ~46 days. Besides this, Figure 6 shows that at the recovery phase of the magnetic storm, the arrival of a dense solar wind flux occurred, which resulted in a sharp increase of the solar wind dynamic pressure at the magnetopause up to 35 nPa on October 22, 1999, at 07:06UT. At this moment, a magnetic local time in the area of the future epicenter (40.758°N, 31.161°E) was equal to MLT=8.6h, that is, the high-latitude part of the M7.2 epicenter longitudinal region (31.161°E) was under the polar cusp (MLT= 08h-16h [10]). The delay between the arrival of a dense solar wind flux on October 22, 1999, at 07:06UT, and the M7.2 earthquake occurrence on November 12, 1999, was equal to ~ 21 days (Table 1).

3.5. Case Study for M7.6 of August 17, 1999

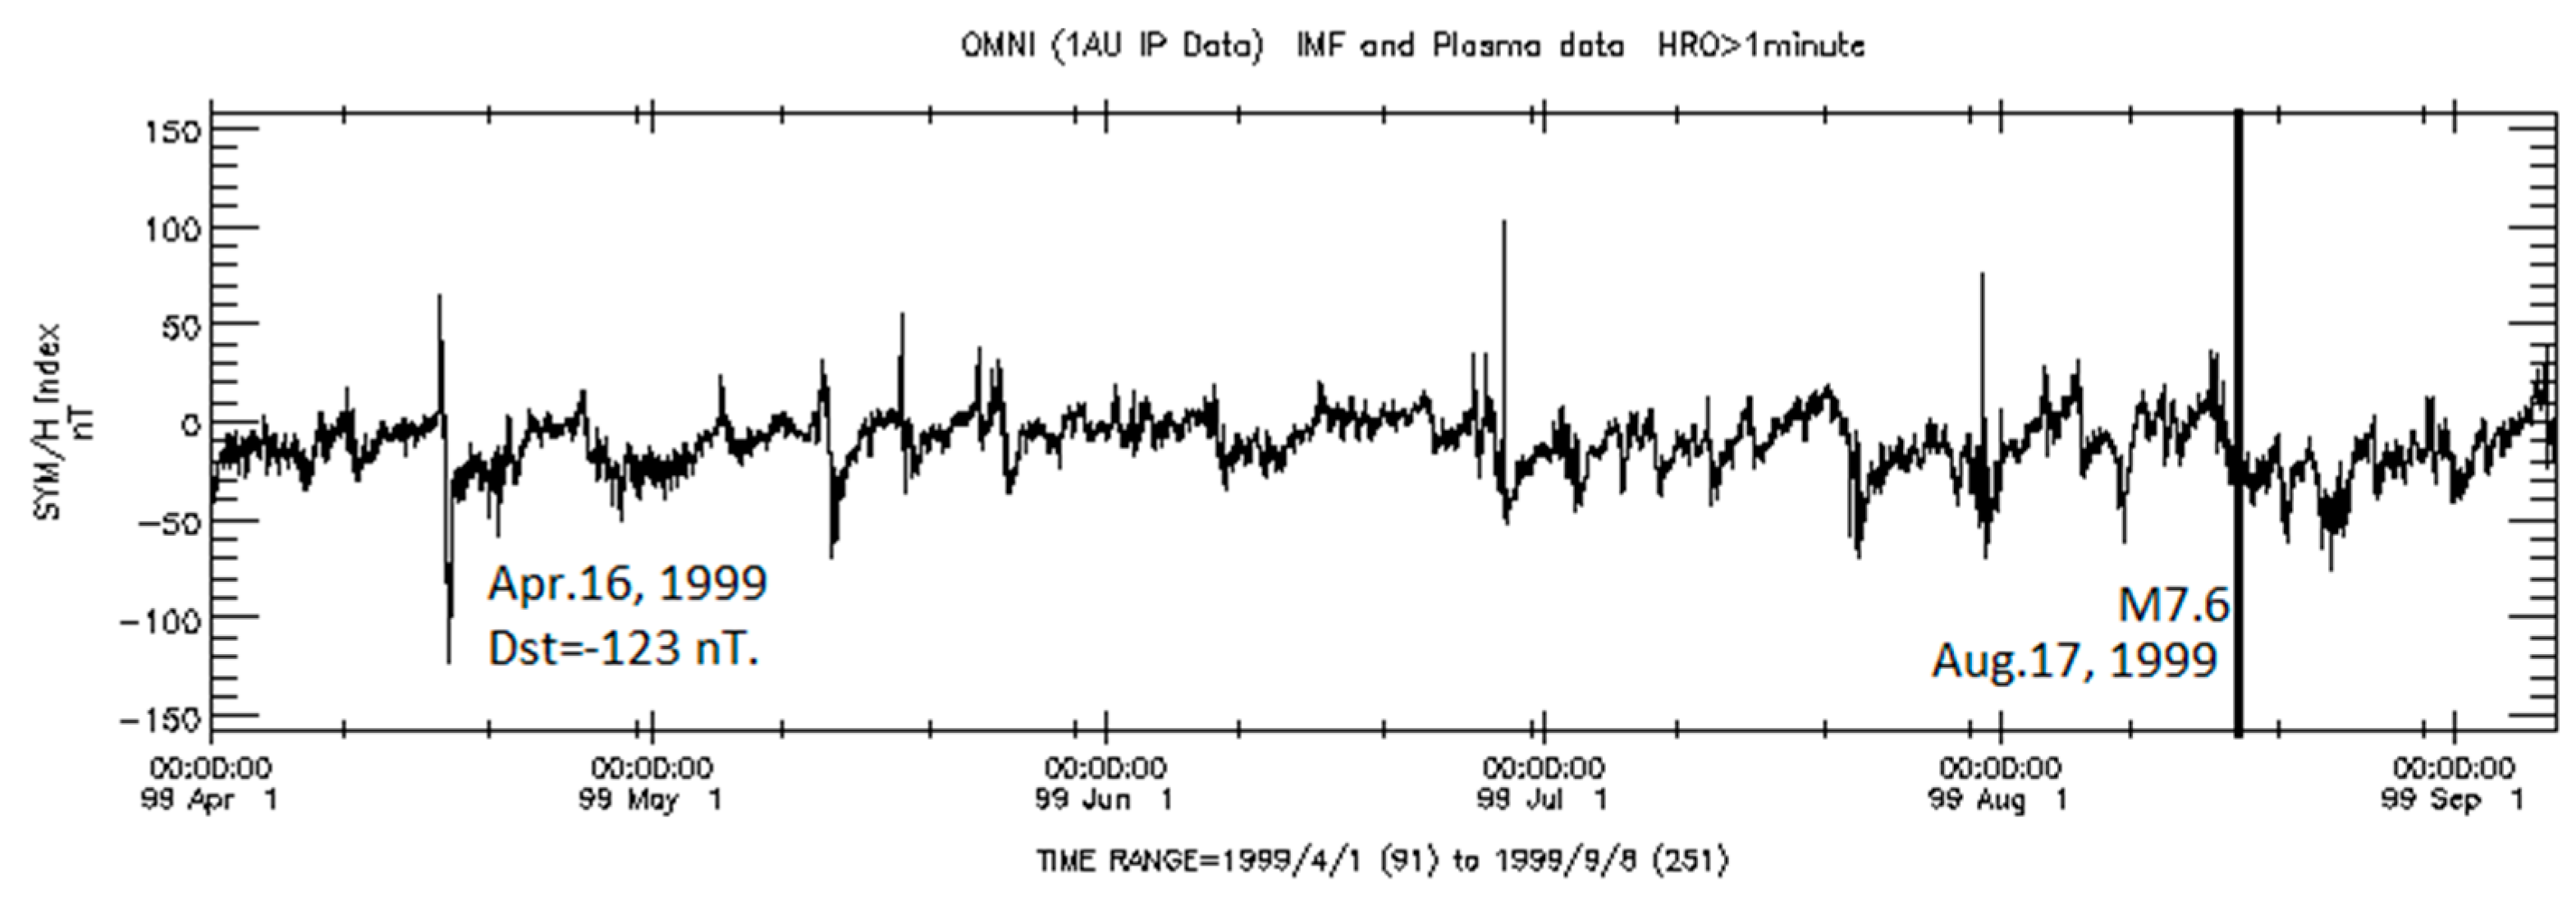
On August 17, 1999, a catastrophic M7.6 earthquake occurred in Kocaeli at 00:01:39 UT with epicenter coordinates 40.748°N, 29.864°E at a depth of 17 km. This earthquake was preceded by a strong magnetic storm (SYM/H index = -123 nT) on April 16, 1999. According to the Observatorio del Ebro, Roquetes, Spain, the sudden onset of this storm (SSC) occurred at ~11:25 UT on April 16, 1999, with a positive SYM/H =+10 nT (Figure 10). The SSC marks the time of effective solar wind-magnetosphere coupling and intense solar wind energy penetration into the Earth’s environment. Figure 10 shows that the increase of positive SYM/H value continued from ~11:25UT up to ~14:49UT when it reached SYM/H= +63 nT. This resulted from the simultaneous growth of the solar wind flux density (upper panel) and solar wind dynamic pressure at the magnetopause (middle panel). During this time interval, the magnetic local time at the territory of the future epicenter (40.748°N, 29.864°E) has varied from MLT=~ 12.8h to MLT=~15.9 h. The high-latitude zone of the longitudinal region in which the M7.6 occurred was under the polar cusp (MLT=08-16h [10]).
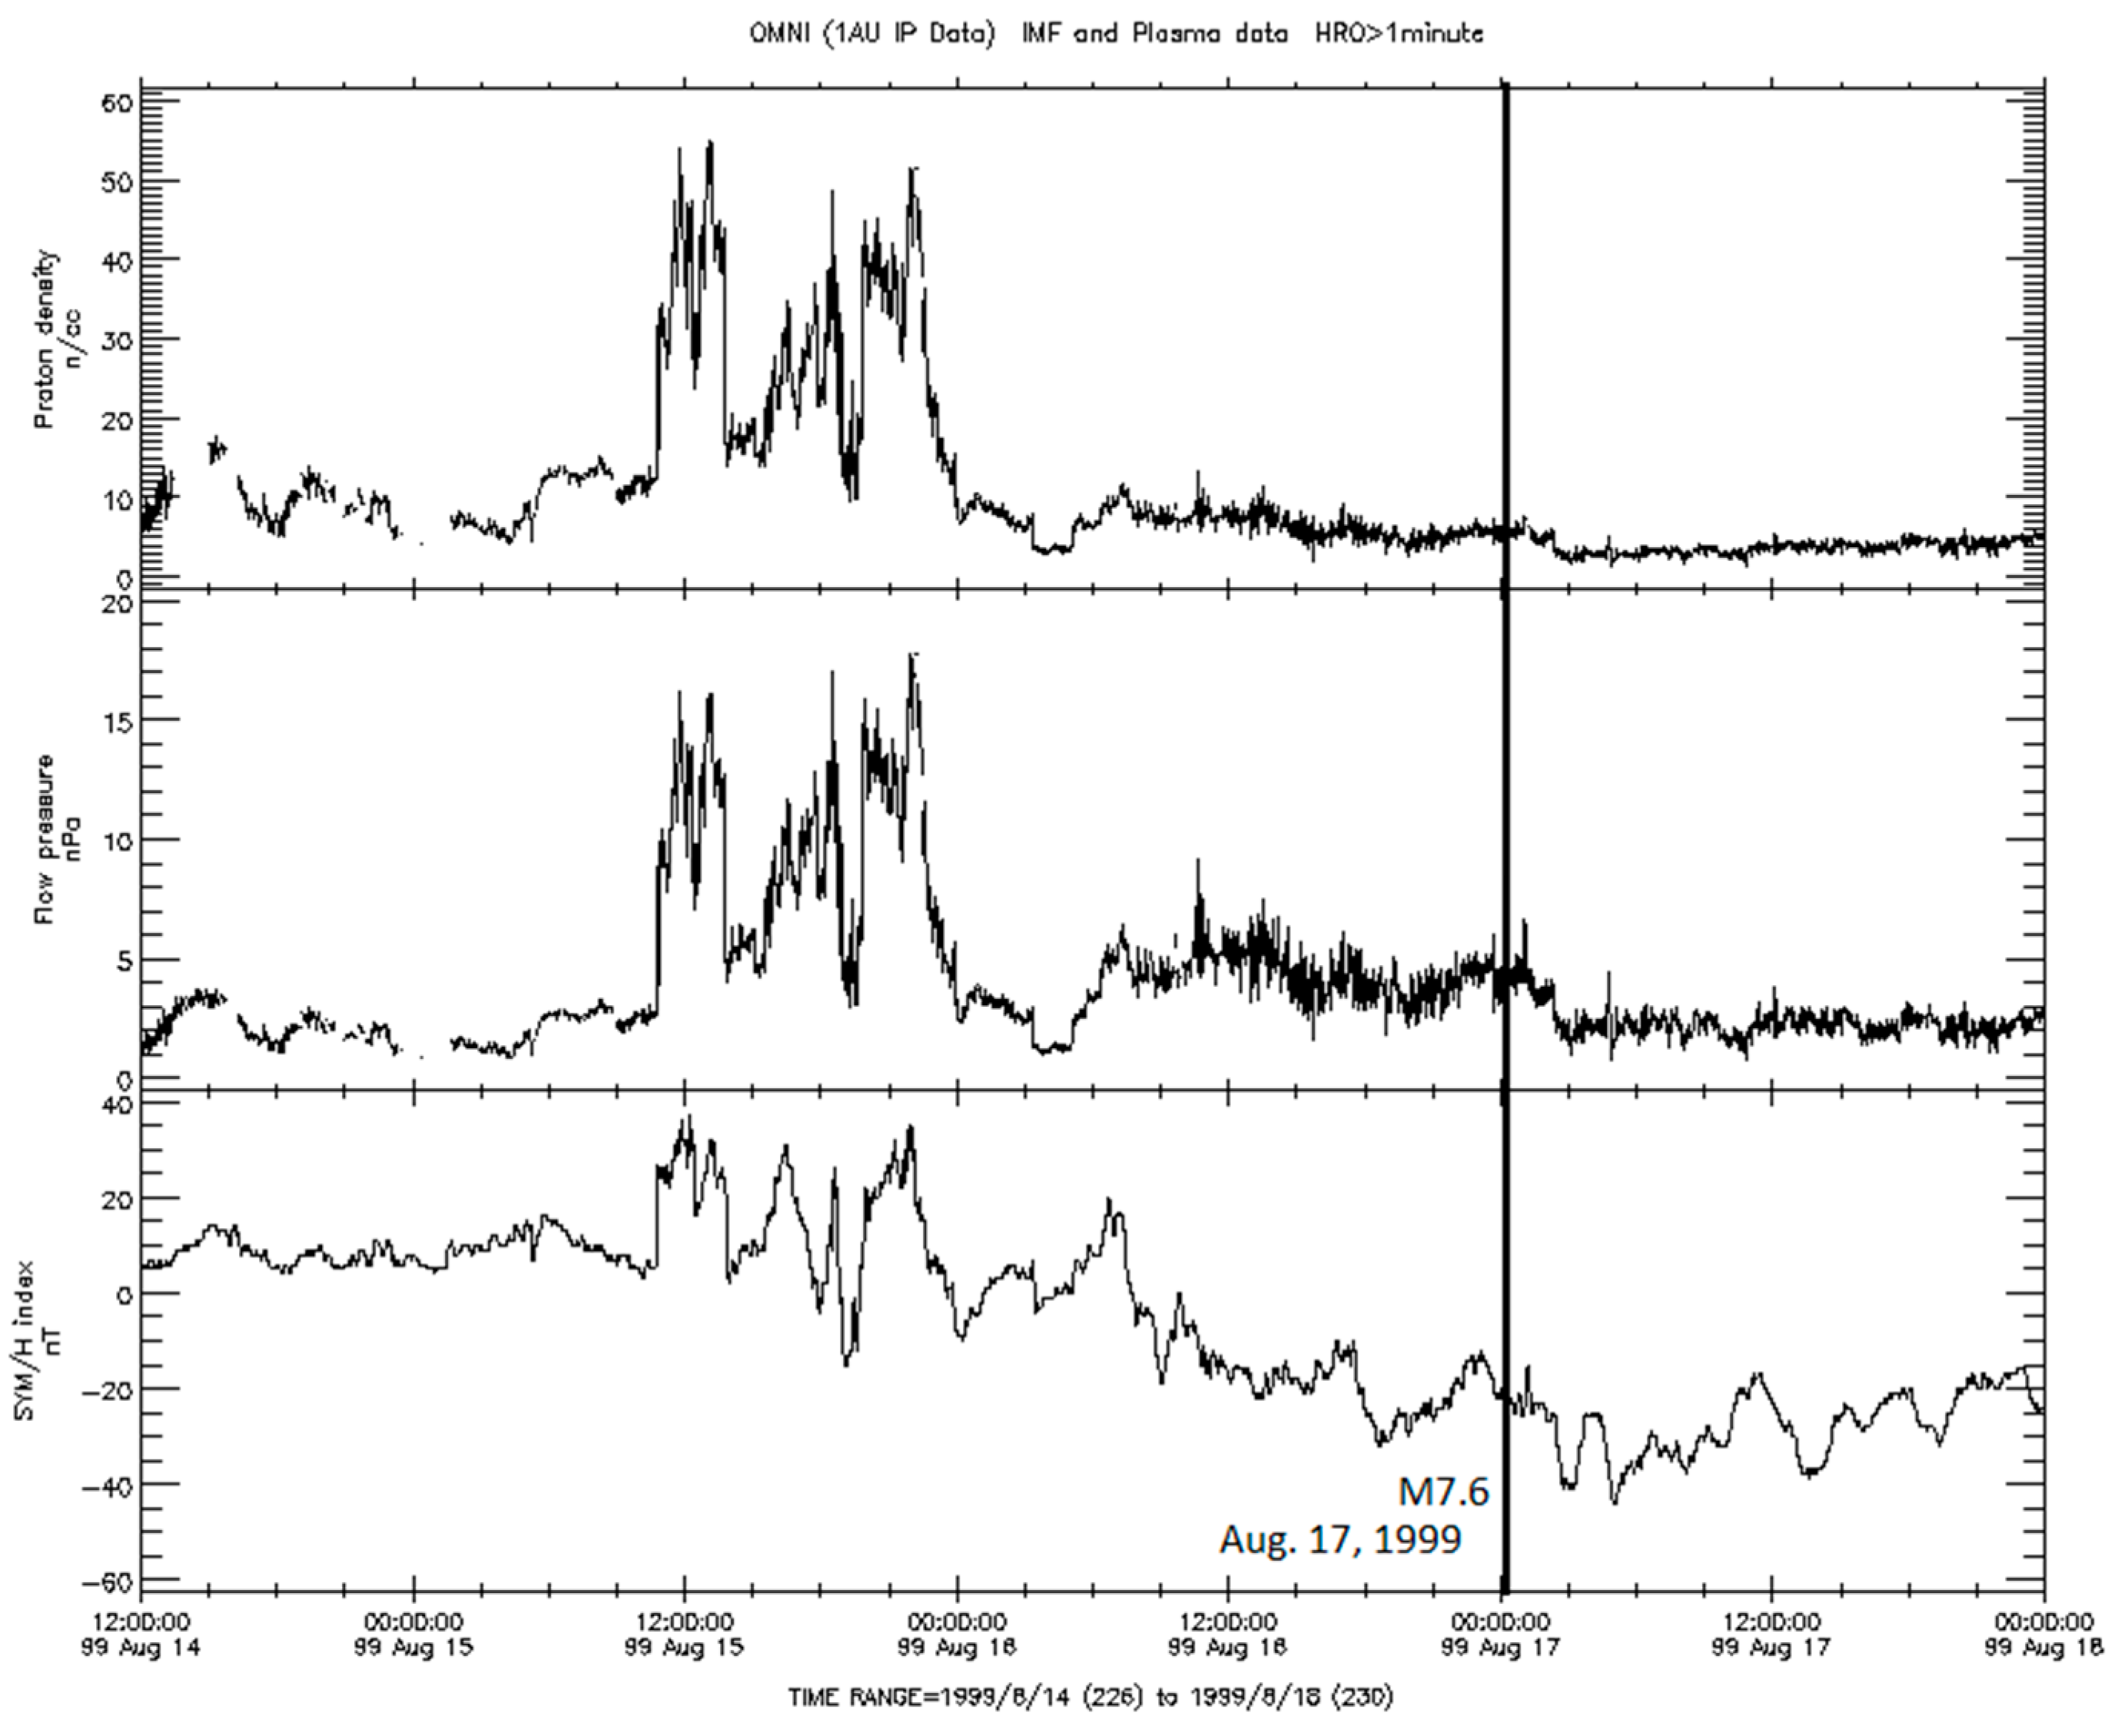
An analysis of Figure 10 in more detail allows one to see that on the eve of the M7.6 earthquake, the positive value of the SYM/H- index sharply increased up to 36 nT on August 15, 1999, at 11:52 UT. This was the onset of a minor geomagnetic storm with the largest negative SYM/H= -44 nT. This storm resulted from the arrival of a dense solar wind flux, which increased solar wind dynamic pressure at the magnetopause (Figure 11). At 11:52 UT, the magnetic local time at the territory of the future epicenter (40.748°N, 29.864°E) was equal to MLT=~13.2h that is, the high-latitude area of the epicenter longitudinal region was under the polar cusp. Considering two geomagnetic storms preceded the Kocaeli earthquake, one may conclude that the delay times between storm onsets and Kocaeli earthquake occurrence were equal to ~123 and ~1.5 days, respectively (Table 1).

3.6. Case Study for M7.3 of November 24, 1976

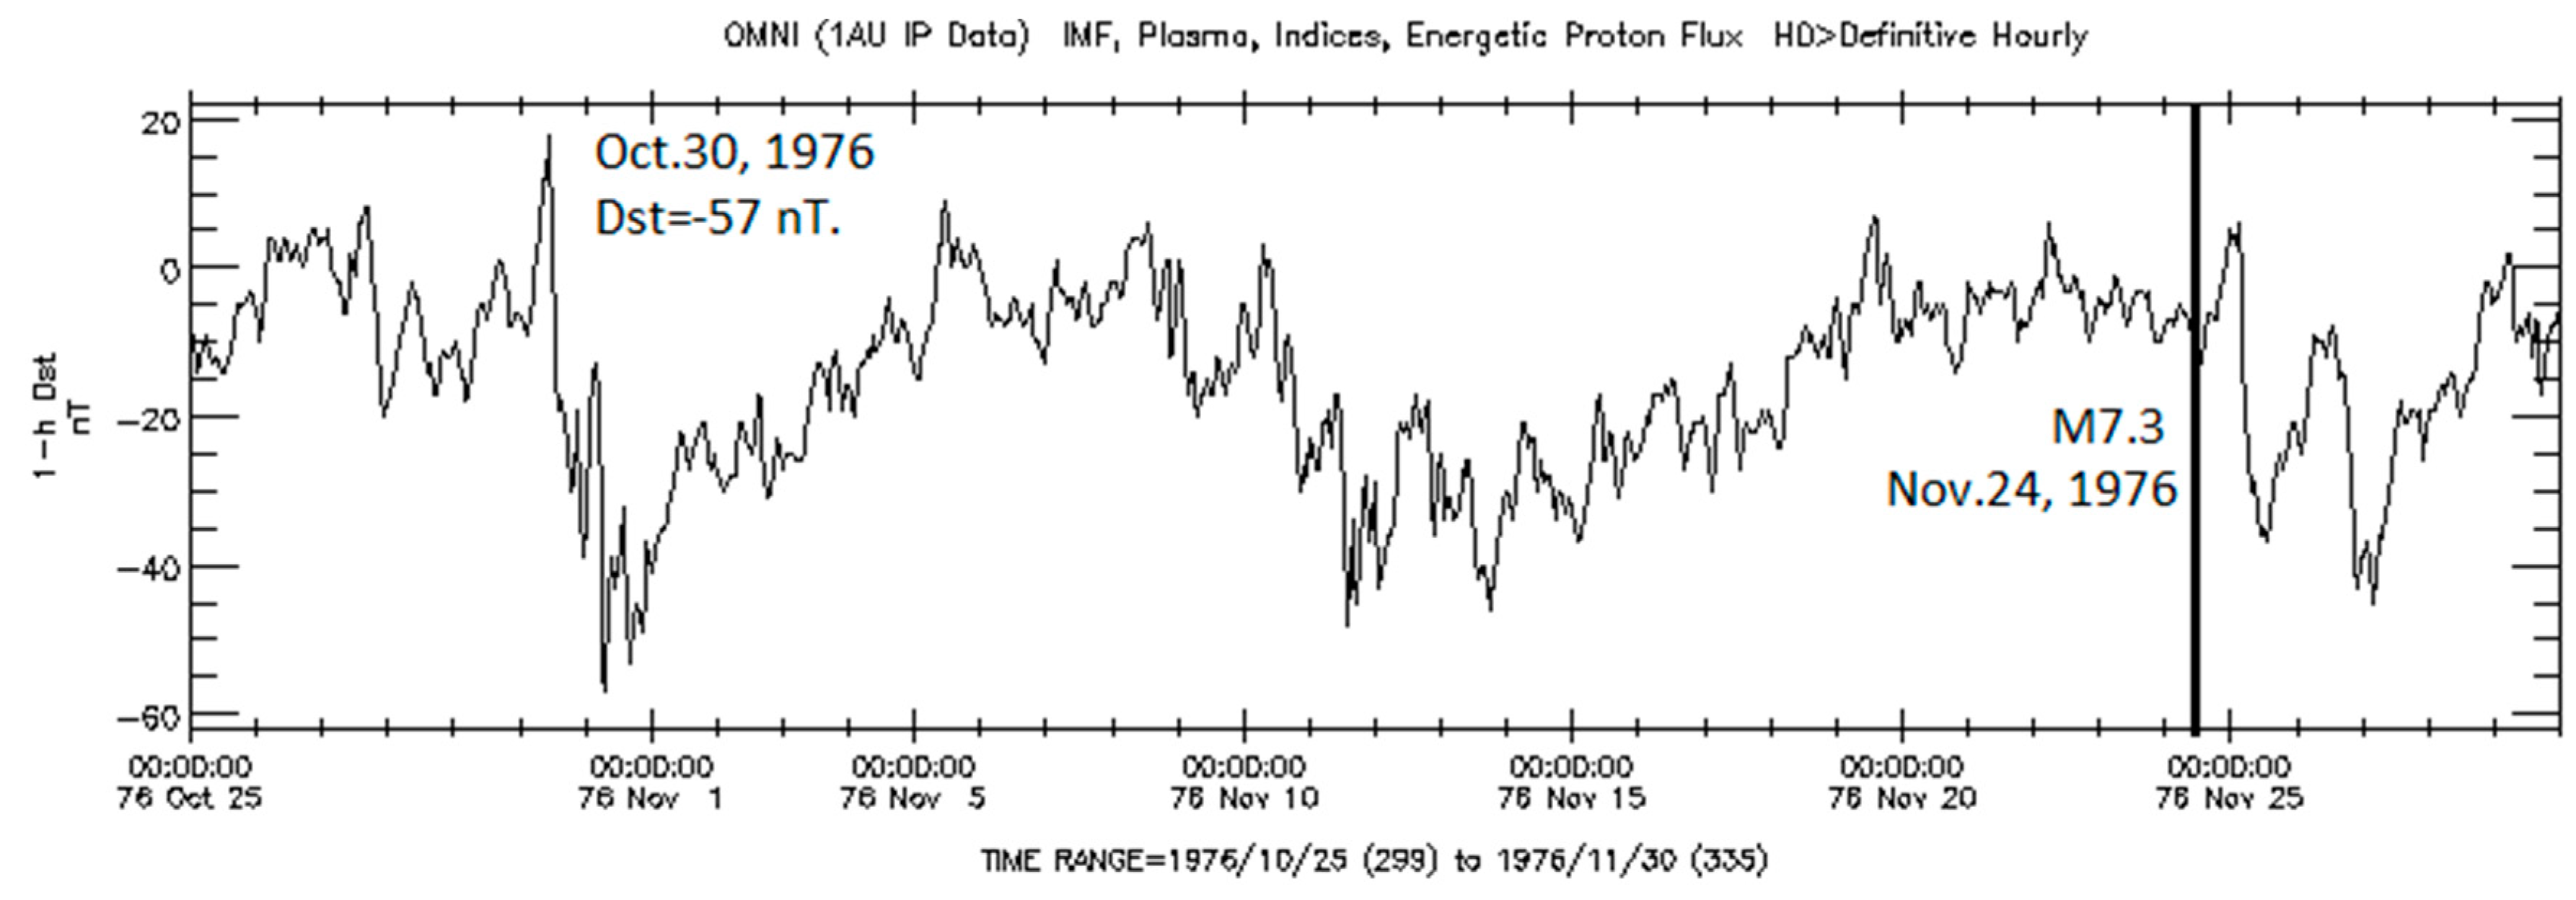
On November 24, 1976, a strong M7.3 earthquake occurred in Turkey at 12:22:18 UT with coordinates of the epicenter 39.121°N, 44.029°E, at a depth of 36.0 km. This event was preceded by a moderate geomagnetic storm (Dst= - 57 nT) started on October 30, 1976, at 10:30UTwith positive Dst = + 18 nT (Figure 12). At this time, the magnetic local time in the area of the future epicenter (39.121°N, 44.029°E) was equal to MLT=12.81h. Thus, the high-latitude zone of a longitudinal region where the M7.3 earthquake occurred was located under the polar cusp. The delay between the magnetic storm onset and earthquake occurrence equals ~ 25 days (Table 1).

3.7. Case Study for M7.2 March 28, 1970

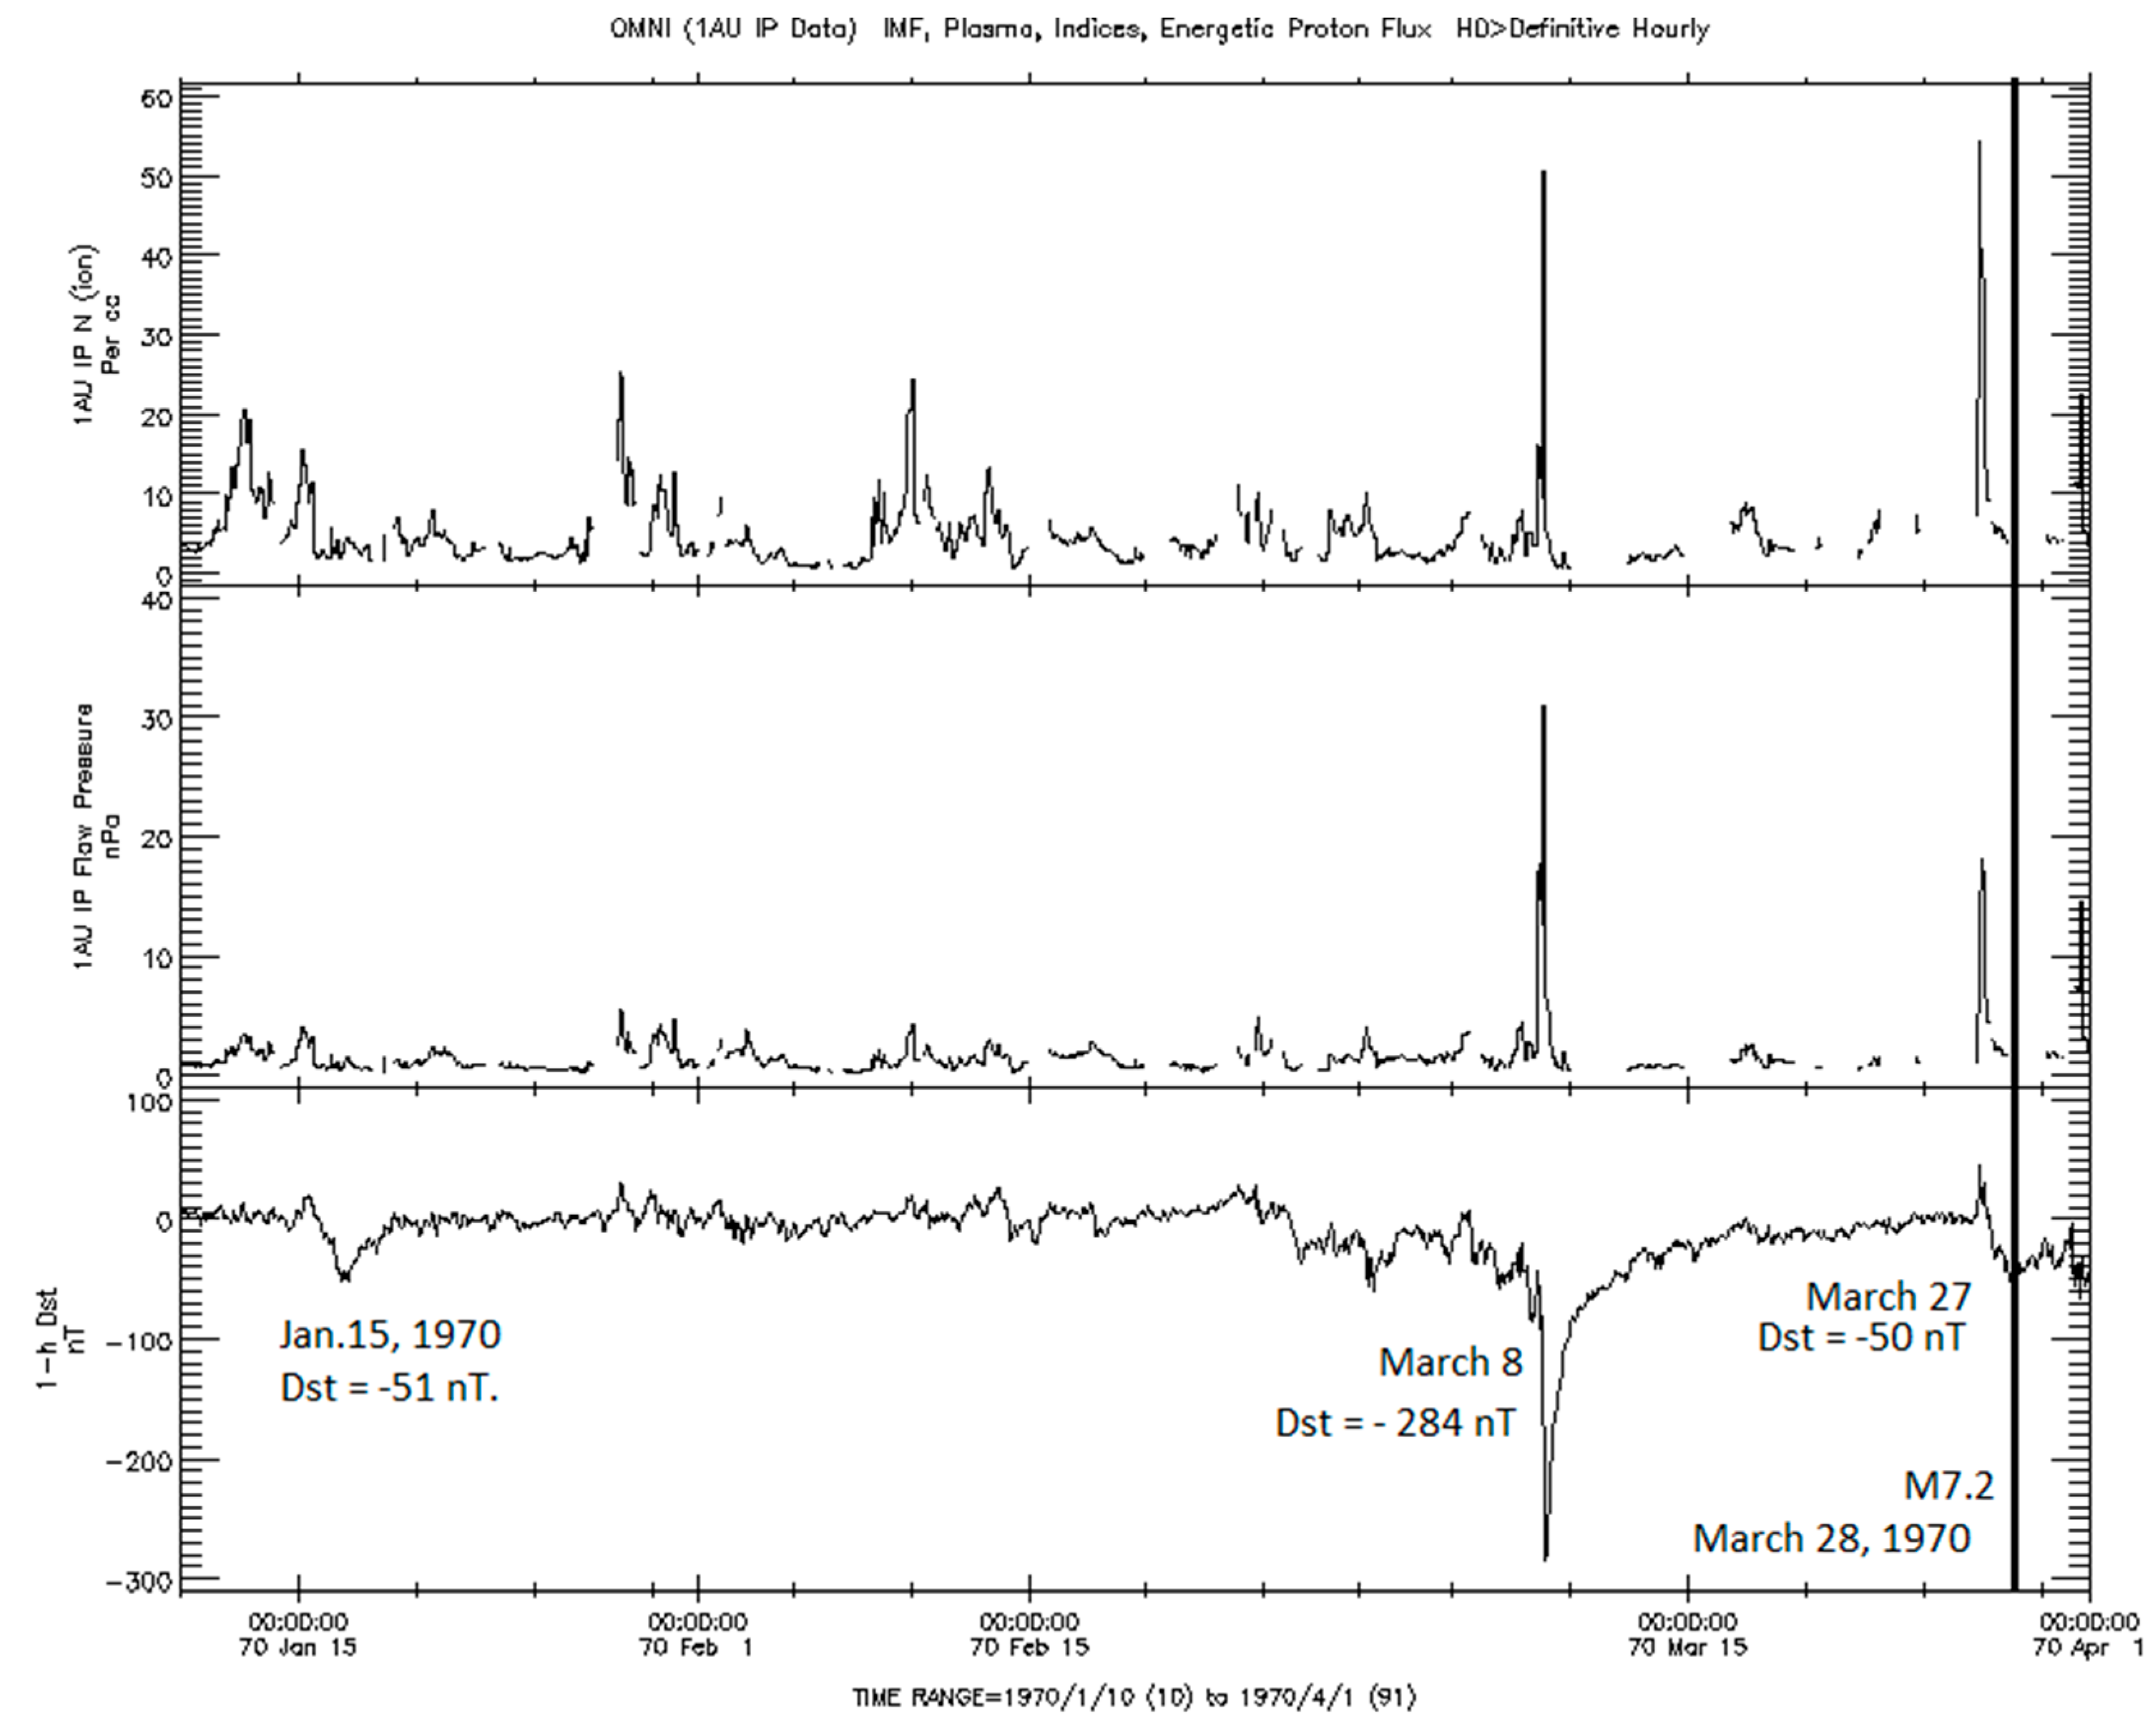
On March 28, 1970, a strong M7.2 earthquake occurred in Turkey at 21:02:26 UT with coordinates of the epicenter 39.098°N, 29.570°E on a depth of 25.0 km. This event was preceded by three geomagnetic storms in January-March 1970 (Figure 13). The first small geomagnetic storm (Dst = - 51 nT) started on January 15 at about 09:30UT (positive Dst = + 20 nT). In the initial phases of this storm, the magnetic local time in the area of the future epicenter (39.098°N 29.570°E) was equal to MLT=~ 10.8h. Thus, this storm met a given criterion: at the time of its onset, the high-latitude part of the longitudinal region, where in the future the M7.2 earthquake occurred, was located under the polar cusp (10-14h [9]). The delay between this magnetic storm onset and earthquake occurrence equals ~ 72 days. The second powerful storm (Dst = - 284 nT) had no clear initial phase, but the time of arrival of a dense solar wind flux (upper panel), which produced an impulse increasing dynamic pressure at the magnetopause (middle panel), occurred on March 8 at 19:30 UT. It is not difficult to understand that, at this time, the high-latitude area of the American longitudinal region was under the polar cusp. Indeed, four strong events occurred here with a time lag of 52, 84, 145, and 277 days. The first M7.3 earthquake occurred in Mexico on April 29, 1970, and the three occurred in Peru: M7.9 on May 31, M8.0 on July 31, and M7.2 on December 10. A significant time delay (~277 days) is not surprising because statistical studies [4] revealed that after a magnetic storm, the anticipation time of large earthquakes may reach up to several years before an event occurrence. The third small magnetic storm (Dst= - 50 nT) started on March 27 at 08:30 UT (positive Dst = + 44 nT). At this time, the magnetic local time in the area of the future epicenter (39.098°N, 29.570°E) was equal to MLT=~9.8h. We see that in this case, the high-latitude area of a longitudinal region in which the M7.2 earthquake occurred was located under the polar cusp (MLT=10-14h [9]). Thus, the delay times between two small magnetic storms onset (January 15 and March 27) and earthquake occurrence on March 28 are equal to ~72 and ~1.5 days, respectively (Table 1).

3.8. Case Study for M7.3 of July 22, 1967

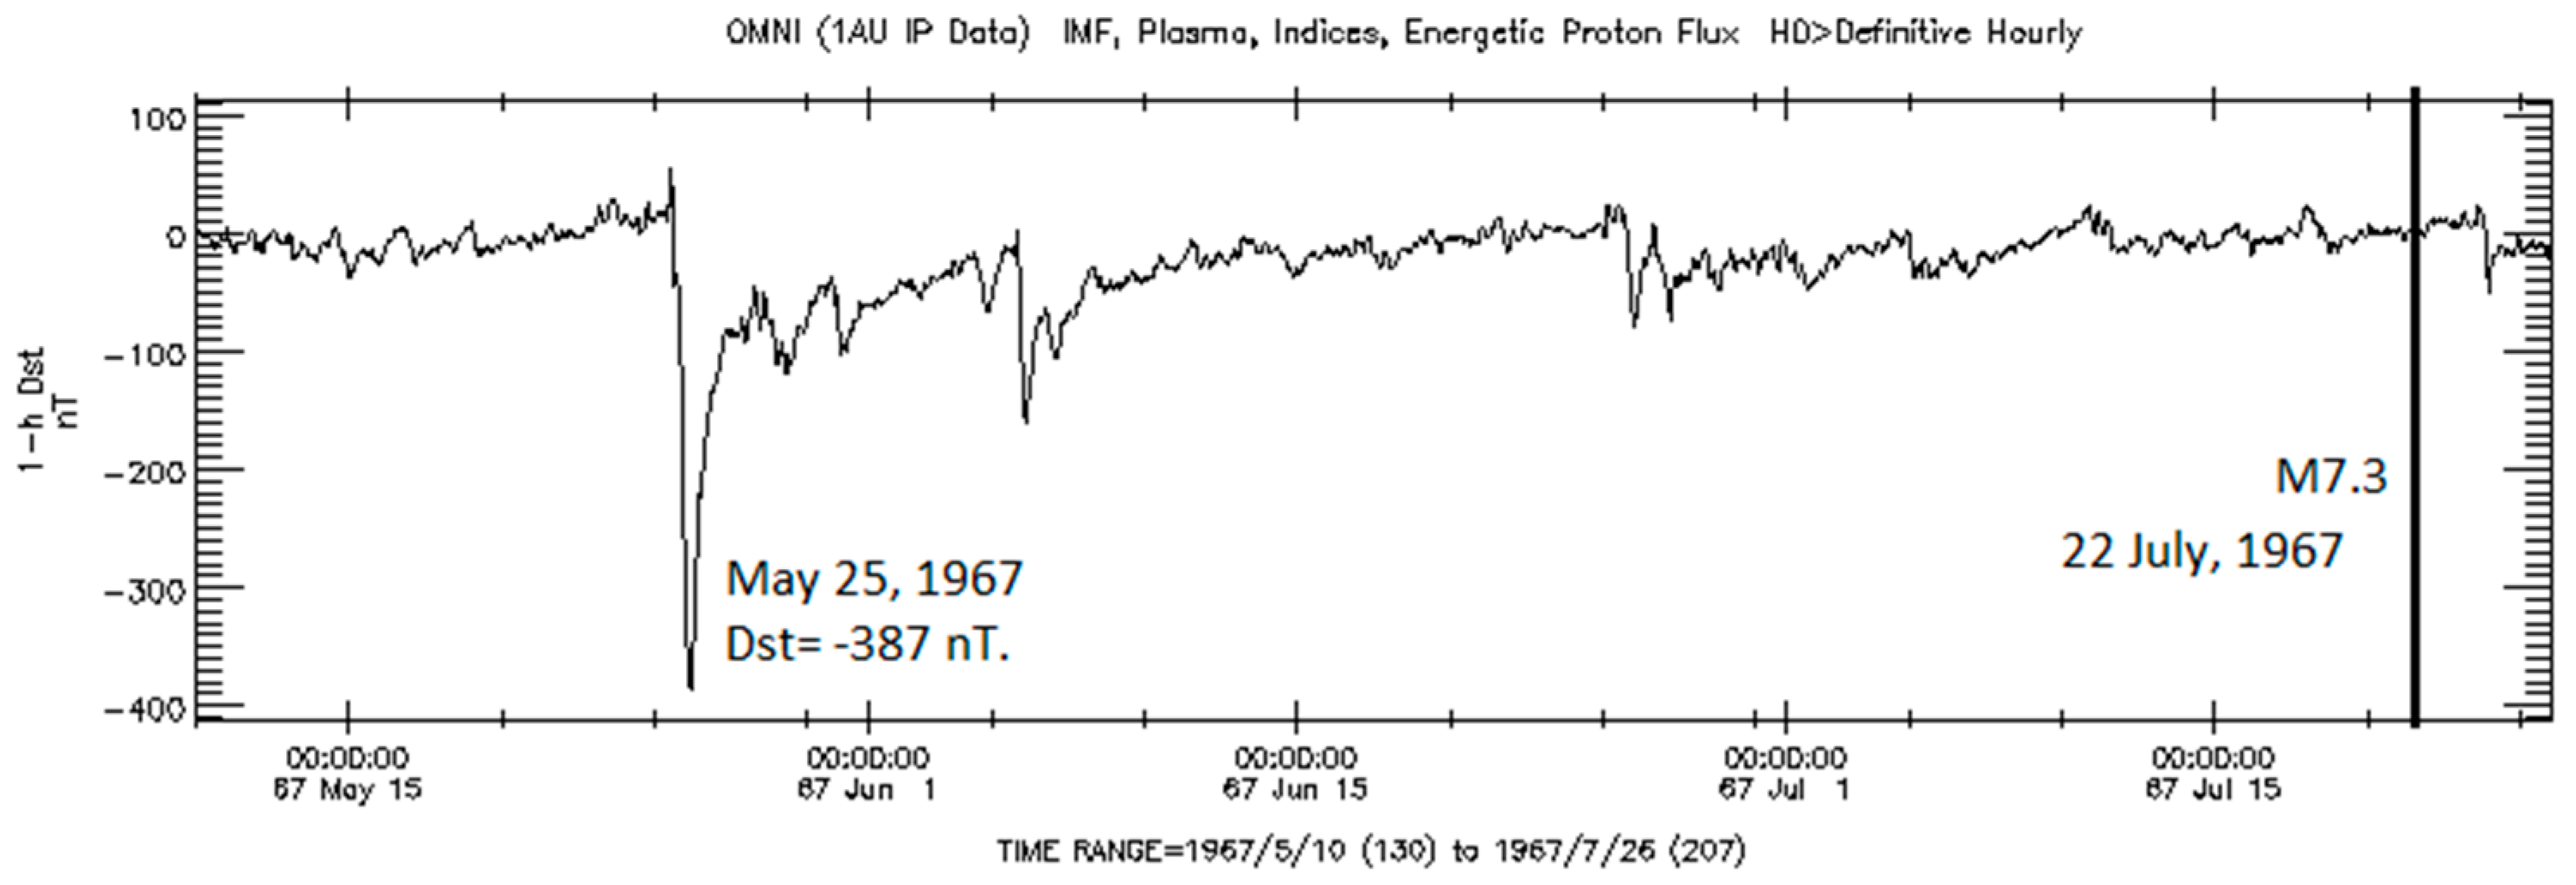
On July 22, 1967, a strong M7.3 earthquake occurred in Turkey at 16:57 UT with coordinates of the epicenter 40.751°N, 30.8°E, at a depth of 30.0 km. This seismic event was preceded by an extreme geomagnetic storm (Dst = -387 nT) starting on May 25, 1967, at 12:30UT, from a sudden positive increase of the Dst-index to +55 nT. In Figure 14, we present the 1-hour Dst data for May 10, 1967, to July 25, 1967from the OMNI database. In the time of the magnetic storm onset (12:30UT), the magnetic local time in the area of the future epicenter (40.751°N, 30.8°E) was equal to MLT=~14.55h. Thus, this storm met a given criterion: at the time of its onset, the high-latitude part of the longitudinal region, where in the future the M7.3 earthquake occurred, was located under the polar cusp(MLT= 08-16 h [10]). The time delay between an extreme magnetic storm on May 25, 1967, and the Mw7.3 earthquake on July 22, 1967, in Turkey, was equal to ~ 58 days (Table 1).

4. Discussion

One of the still open questions to the Earth and space community is how the energy of the geospace environment impacts the lithospheric processes. Some papers show that the solar flare X-ray radiation, coronal mass ejections, and geomagnetic storms may precede the occurrence of earthquakes ([1,2,3,4,5,13,14,15,16,17], and references herein). Many years of statistical searching in this direction led to a mathematical model [18] that considers a hypothesis of electromagnetic earthquakes being triggered by a sharp rise of telluric currents in the lithosphere, including crust faults, due to the interaction of solar flare X-ray radiation with the ionosphere–atmosphere–lithosphere system. A critical point in the model [18] is the increase in the ionosphere's radiation and conductivity. Besides this, it is believed that global seismic activity tends to increase in a solar minimum (e.g., [14,15,16,17], and references herein). Again, a critical point in this effect may be an increase in radiation and conductivity of the upper troposphere and lower stratosphere, produced by the galactic cosmic rays [19,20], whose intensity increases in solar minimums. It has been found recently [17] that strong earthquakes may look as addressed (targeted) because they occur near the footprints of certain geomagnetic lines belonging to a newly created radiation belt into the lower magnetosphere when the high-energy electrons in the outer radiation belt spill down due to geomagnetic storm. Again, a critical point for this effect may be an increase in radiation and conductivity in the mesosphere and upper stratosphere due to the precipitation of energetic electrons from the radiation belt up to the stratopause, as shown in [21]. Considering the above, it seems that active space weather can provoke strong earthquakes in those longitudinal regions above which a near-space environment, including geomagnetic lines, can be sufficiently populated with charged particles (be conductive). At the globe, there are two places where geomagnetic lines may constantly be filling with charged particles. These are the polar cusps where the solar wind plasma would directly access the inner magnetosphere and upper atmosphere [8,9,10]. The length of the polar cusps in longitude is determined by the Magnetic Local Time and is within the range of 10h-14h [9] or 8h-16h [10]. Due to the Earth's rotation, different longitudinal regions are located under the polar cusps during the arrival of the shocked solar wind flows. In the present paper, we considered nine strong (M≥7.0) earthquakes in Turkey, including the M7.8 and M7.5 Kahramanmaras earthquake sequence on February 6, 2023. For each earthquake, we identified a preceding geomagnetic storm that met a given criterion: a magnetic local time (MLT) at an area of a future epicenter was between 08h-16h in a time of geomagnetic storm onset. The results showed (Table 1) that before four earthquakes (M7.8 and M7.5 on February 6 of 2023, M7.3 on November 24 of 1976, and M7.3 on July 22 of 1967) there was only one geomagnetic storm with a given criterion (strong, moderate, and extreme, respectively); before three earthquakes (M7.2 on November 12 of 1999, M7.6 on August 17 of 1999, and M7.3 on March 28 of 1970) there were two magnetic storms with a given criterion (strong + powerful, strong + small, and small + small, respectively). Before one seismic event (M7.1 on October 23 2011), there were three consecutive magnetic storms with a given criterion (moderate, small, and strong). Interestingly, the 2011 year belongs to the 24 solar cycle, whose amplitude was very small. The lag time between a magnetic storm onset and earthquake occurrence varied from ~1.5 days (two cases after a series of consecutive magnetic storms) to 123 days (one case for the M7.6 Kocaeli earthquake on August 17 1999). However, on average, it is equal to ~ 49 days. It is expected to suggest that the response of seismicity to geomagnetic storms could be instantaneous if electric and electromagnetic fields interact with rocks and faults in the Earth’s crust under critical stress-strain conditions. Nevertheless, observed long lag times may tell us that the space weather phenomena do not trigger earthquakes immediately. However, they somehow deliver solar wind energy into the lithosphere, which some weeks or months later is realized in a kind of earthquake. Thus, further investigations in this area are desirable, including a retrospective analysis of the solid earth parameters in epicenter areas that were considered epicenters just after the preceding geomagnetic storms.

Author Contributions

D.O. and G.K. provided the concepts for the manuscript. G.K. organized and wrote the manuscript. All authors provided critical feedback and helped shape the research, analysis, and manuscript. All authors have read and agreed to the published version of the manuscript.

Funding

The research of G.K. is partly funded by the Science Committee of the Ministry of Science and Higher Education of the Republic of Kazakhstan (Grant No. AP19677977)

Data Availability Statement

The original contributions presented in the study are included in the article: further inquiries can be directed to the corresponding author.

Acknowledgments

We thank the US Geological Survey and European–Mediterranean Seismological Centre for providing earthquake information services and data. We acknowledge the use of the NASA/GSFC’s Space Physics Data Facility’s CDAWeb service, OMNIdata

Conflicts of Interest

The authors declare that the research was conducted without any commercial or financial relationships that could be construed as a potential conflict of interest.

References

  1. Sobolev, G. A. , Zakrzhevskaya, N. A., Kharin, E. P.: On the relation between seismicity and magnetic storms. Phys. Solid Earth 2001, 37, 917–927. [Google Scholar]
  2. Urata, N.; Duma, G.; Freund, F. Geomagnetic Kp Index and Earthquakes. Open J. Earthq. Res. 2018, 07, 39–52. [Google Scholar] [CrossRef]
  3. Chen, H. , Wang, R., Miao, M., Liu, X., Ma, Y., Hattori, K., Han, P.: A Statistical Study of the Correlation between Geomagnetic Storms and M ≥ 7.0 Global Earthquakes during 1957–2020. 1270. [Google Scholar] [CrossRef]
  4. Marchetti, D, De Santis, A., Campuzano, S.A., Zhu, K., Soldani, M., et al.: Worldwide Statistical Correlation of Eight Years of Swarm Satellite Data with M5.5+ Earthquakes: New Hints about the Preseismic Phenomena from Space Remote Sens. 2649. [CrossRef]
  5. Ouzounov, D. , Khachikyan, G.: A similarity in patterns of global seismicity after St. Patrick's Day geomagnetic storms of 2013 and 2015. arXiv[physics.geo-ph] 27 February. [CrossRef]
  6. Love, J.J.; Thomas, J.N. Insignificant solar-terrestrial triggering of earthquakes. Geophys. Res. Lett. 2013, 40, 1165–1170. [Google Scholar] [CrossRef]
  7. Yesugey, S. C. : Comparative evaluation of the influencing effects of geomagnetic solar storms on earthquakes in Anatolian peninsula. Earth Sci. Res. J. 13 (1), 82-89 (2009).
  8. Pitout, F., Bogdanova, Y. V.: The polar cusp seen by Cluster. Journal of Geophysical Research: Space Physics. 126, e2021JA029582. Veh. Syst. Dyn. 2018, 56, 55–77. [CrossRef]
  9. Pitout, F. , Escoubet, C. P., Klecker, B., Rème, H.: Cluster survey of the middle altitude cusp: 1. size, location, and dynamics. Annals of Geophysics 2021, 24, 3011–3026. [CrossRef]
  10. Russell, C.T. : Polar Eyes the Cusp Cluster-II Workshop: Multiscale/Multipoint Plasma Measurements. In: Proceedings of the Workshop held at Imperial College. London, UK, 22-. Paris: European Space Agency (ESA),ESA-SP, (449), ISBN: 9290927968, p.47. https://articles.adsabs.harvard.edu//full/2000ESASP.449...47R/0000050.000.html(2000). 24 September.
  11. Wanliss, J.A.; Showalter, K.M. High-resolution global storm index: Dst versus SYM-H. J. Geophys. Res. 2006, 111. [Google Scholar] [CrossRef]
  12. Loewe, C.A.; Prölss, G.W. Classification and mean behavior of magnetic storms. J. Geophys. Res. 1997, 102, 14209–14213. [Google Scholar] [CrossRef]
  13. Novikov, V.; Ruzhin, Y.; Sorokin, V.; Yaschenko, A. Space weather and earthquakes: possible triggering of seismic activity by strong solar flares. Ann. Geophys. 2020, 63, 554. [Google Scholar] [CrossRef]
  14. Shestopalov, I.P.; Kharin, E.P. Secular variations of solar activity and seismicity of the Earth. Geophys. J. 2006, 28, 59–70. [Google Scholar]
  15. Zhang, G.-Q. Relationship between global seismicity and solar activities. Acta Seism. Sin. 1998, 11, 495–500. [Google Scholar] [CrossRef]
  16. Huzaimy, J.M.; Yumoto, K. Possible correlation between solar activity and global seismicity. In Proceeding of the 2011 IEEE International Conference on Space Science and Communication (IconSpace), Penang, Malaysia, 12–13 July 2011; pp. 138–141. [Google Scholar]
  17. Ouzounov, D.; Khachikyan, G. Studying the Impact of the Geospace Environment on Solar Lithosphere Coupling and Earthquake Activity. Remote. Sens. 2023, 16, 24. [Google Scholar] [CrossRef]
  18. Sorokin, V.; Yaschenko, A.; Mushkarev, G.; Novikov, V. Telluric Currents Generated by Solar Flare Radiation: Physical Model and Numerical Estimations. Atmosphere 2023, 14, 458. [Google Scholar] [CrossRef]
  19. Bazilevskaya, G.A.; Usoskin, I.G.; Flückiger, E.O.; Harrison, R.G.; Desorgher, L.; Bütikofer, R.; Krainev, M.B.; Makhmutov, V.S.; Stozhkov, Y.I.; Svirzhevskaya, A.K.; et al. Cosmic ray induced ion production in the atmosphere. Space Sci. Rev. 2008, 137, 149–173. [Google Scholar] [CrossRef]
  20. Phillips, T.; Johnson, S.; Koske-Phillips, A.; White, M.; Yarborough, A.; Lamb, A.; Herbst, A.; Molina, F.; Gilpin, J.; Grah, O.; et al. Space Weather Ballooning. Space Weather. 2016, 14, 697–703. [Google Scholar] [CrossRef]
  21. Kavanagh, A.J.; Cobbett, N.; Kirsch, P. Radiation Belt Slot Region Filling Events: Sustained Energetic Precipitation Into the Mesosphere. J. Geophys. Res. Space Phys. 2018, 123, 7999–8020. [Google Scholar] [CrossRef]
Figure 1. The 1-minute data on the geomagnetic SYM/H index from November 1, 2022, to February 10, 2023; on the right, a black line marks the date of the M7.8 and 7.5 Kahramanmaras earthquake sequence on February 6, 2023; on the left, a preceded geomagnetic storm on November 7, 2022, is indicated.
Preprints 105411 g001
Figure 2. (from bottom to top): The 1-minute data on the geomagnetic SYM/H index, the pressure of the solar wind at the magnetopause, solar wind protons density, and the vertical component of the Interplanetary Magnetic Field in the GSM coordinate system (Bz_GSM) at the Earth’s orbit for November 6-9, 2022 from the OMNI database.
Preprints 105411 g002
Figure 3. The 1-minute data on the geomagnetic SYM/H index in 2020; a red line marked the date of the M7.0 earthquake in the Aegean Sea on October 30, 2020.
Preprints 105411 g003
Figure 4. (from bottom to top) - The 1-minute data on the geomagnetic SYM/H- index, the dynamic pressure of the solar wind at the magnetopause, and the solar wind proton density for August 1 – 4, 2020.
Preprints 105411 g004
Figure 5. (from bottom to top) - The 1-minute data on the geomagnetic SYM/H- index, the dynamic pressure of the solar wind at the magnetopause, and the solar wind proton density for October 5-6, 2020.
Preprints 105411 g005
Figure 6. The 1-minute data on the geomagnetic SYM/H index from September 7, 2011, to October 24, 2011; on the right, a black line marked the date of the M7.1 earthquake in Turkey on October 23, 2011; on the left, sudden onsets of the three preceded geomagnetic storms are indicated.
Preprints 105411 g006
Figure 7. The 1-minute data on the geomagnetic SYM/H index from September 15, 1999, to November 15, 1999; on the right, a black line marked the date of the M7.2 earthquake in Turkey on November 12, 1999; on the left, two preceded geomagnetic storms are indicated.
Preprints 105411 g007
Figure 8. (from bottom to top) - The 1-minute data on the geomagnetic SYM/H index, the dynamic pressure of the solar wind at the magnetopause, the solar wind proton density, and the vertical component of the Interplanetary Magnetic Field in the GSM coordinate system (Bz_GSM) at the Earth’s orbit for 22-23 September of 1999.
Preprints 105411 g008
Figure 9. (from bottom to top) shows the 1-minute data on the geomagnetic SYM/H index, the dynamic pressure of the solar wind at the magnetopause, and the solar wind proton density at the Earth’s orbit for 20-23 October 1999.
Preprints 105411 g009
Figure 10. The 1-minute data on the geomagnetic SYM/H index from April 1, 1999, to September 8, 1999; on the right, a black line marked the date of M7.6Kocaeli earthquake on August 17, 1999; on the left, a preceded geomagnetic storm on April 16, 1999, is indicated.
Preprints 105411 g010
Figure 11. (from bottom to top) shows the 1-minute data on the SYM/H index, the dynamic pressure of the solar wind at the magnetopause, and the solar wind proton density at the Earth’s orbit for 14-17 August 1999.
Preprints 105411 g011
Figure 12. The 1-hour data on the Dst index in 1976 from October 28 to November 24, 12:22:18 UT, when the M7.3 earthquake occurred in Turkey; on the right, a black line marked the date of the M7.3 Earthquake on November 24, 1976; in the left, a preceded geomagnetic storm on October 30, 1976, is indicated.
Preprints 105411 g012
Figure 13. (from bottom to top) shows the 1-hour data on the geomagnetic Dst index, the dynamic pressure of the solar wind at the magnetopause, and the solar wind proton density from January 10 to April 1, 1970. On the right, a black line marks the date of the M7.2 earthquake on March 28, 197j; on the left, a preceded geomagnetic storm on January 15, 1970, is indicated.
Preprints 105411 g013
Figure 14. The 1-hour data on the geomagnetic Dst—index from May 10, 1967, to July 25, 1967, from the OMNI database; on the right, a black line marked the date of the M7.3 earthquake on July 22, 1967; on the left, a preceded geomagnetic storm on May 25, 1967, is indicated.
Preprints 105411 g014
Table 1. Data on strong M≥7.0 earthquakes in Turkey in 1967-2023 preceded geomagnetic storms, magnetic local time at the area of the future epicenter in the time of geomagnetic storm onset, and lag time between storm onset and earthquake occurrence.
Earthquake Catalog (USGS) Geomagnetic storm (Date, intensity, time of storm onset, and positive SYM/H- index (nT) Magnetic local time in the epicenter at time of storm onset (hour) Time Lag between storm onset and EQ(days)
DateTime (UTC) Lat/Long H (km) M Date Intensity (nT) Class Onset (UTC)
1 2023-02-06 01:17:34 37.226°N, 37.014°E 10 7.8 11-07-2022 -117 Strong +10 nT at 08:04 10.96 91
2 2023-02-06 10:24:48 38.011°N, 37.196°E 7.4 7.5 11-07-2022 -117 Strong +10 nT at 08:04 10.98 91
3 2020-10-30 11:51:27 37.897°N 26.784°E 21 7 08.02.2020 -39 Small +27nT at 09:23 10.8 89
10.05.2020 -37 Small +1nT at 08.12 9.6 25
4 2011-10-23 10:41:23 38.721°N, 43.508°E 18 7.1 09-09-2011 -77 Moderate + 74nT at 13:16 15.7 44
09-17-2011 -43 Small + 61 nT at 8:10 10.6 36
09-26-2011 -111 Strong + 62 nT at12:38 15.1 27
5 1999-11-12 16:57:19 40.758°N, 31.161°E 10 7.2 09-22- 1999 -162 Strong +33 nT at 13:15 14.7 51
10-21-1999 -211 Powerful +42 nT at 7:06* 8.6 21
6 1999-08-17, 00:01:39 40.748°N, 29.864°E 17 7.6 04-16-1999 -123 Strong +10 nT at 11:25 12.8 123
08-15-1999 -44 Small +36 nT at 11:52 13.2 1.5
7 1976-11-24, 12:22:18 39.121°N, 44.029°E 36 7.3 10-30- 1976 -57 Moderate +18 nT at 10:30 12.8 25
8 1970-03-28, 21:02:26 39.098°N 29.570°E 25 7.2 01-15-1970 -51 Small + 20 nT at 9:30 10.8 72
03-27-1970 -52 Small + 44 nT at 8:30 9.8 1.5
9 1967-07-22, 16:57:00 39.098°N 29.570°E 30 7.3 05-25- 1967 -387 Extreme + 55 nT at12:30 14.5 58
* marks the time of a dense solar wind flux arrival that resulted in a sharp increase in the solar wind dynamic pressure at the magnetopause.
Disclaimer/Publisher’s Note: The statements, opinions and data contained in all publications are solely those of the individual author(s) and contributor(s) and not of MDPI and/or the editor(s). MDPI and/or the editor(s) disclaim responsibility for any injury to people or property resulting from any ideas, methods, instructions or products referred to in the content.
Copyright: This open access article is published under a Creative Commons CC BY 4.0 license, which permit the free download, distribution, and reuse, provided that the author and preprint are cited in any reuse.
Prerpints.org logo

Preprints.org is a free preprint server supported by MDPI in Basel, Switzerland.

Subscribe

© 2024 MDPI (Basel, Switzerland) unless otherwise stated