Submitted:
02 May 2024
Posted:
02 May 2024
Read the latest preprint version here
Abstract
Keywords:
1. Introduction
2. Results and Discussion
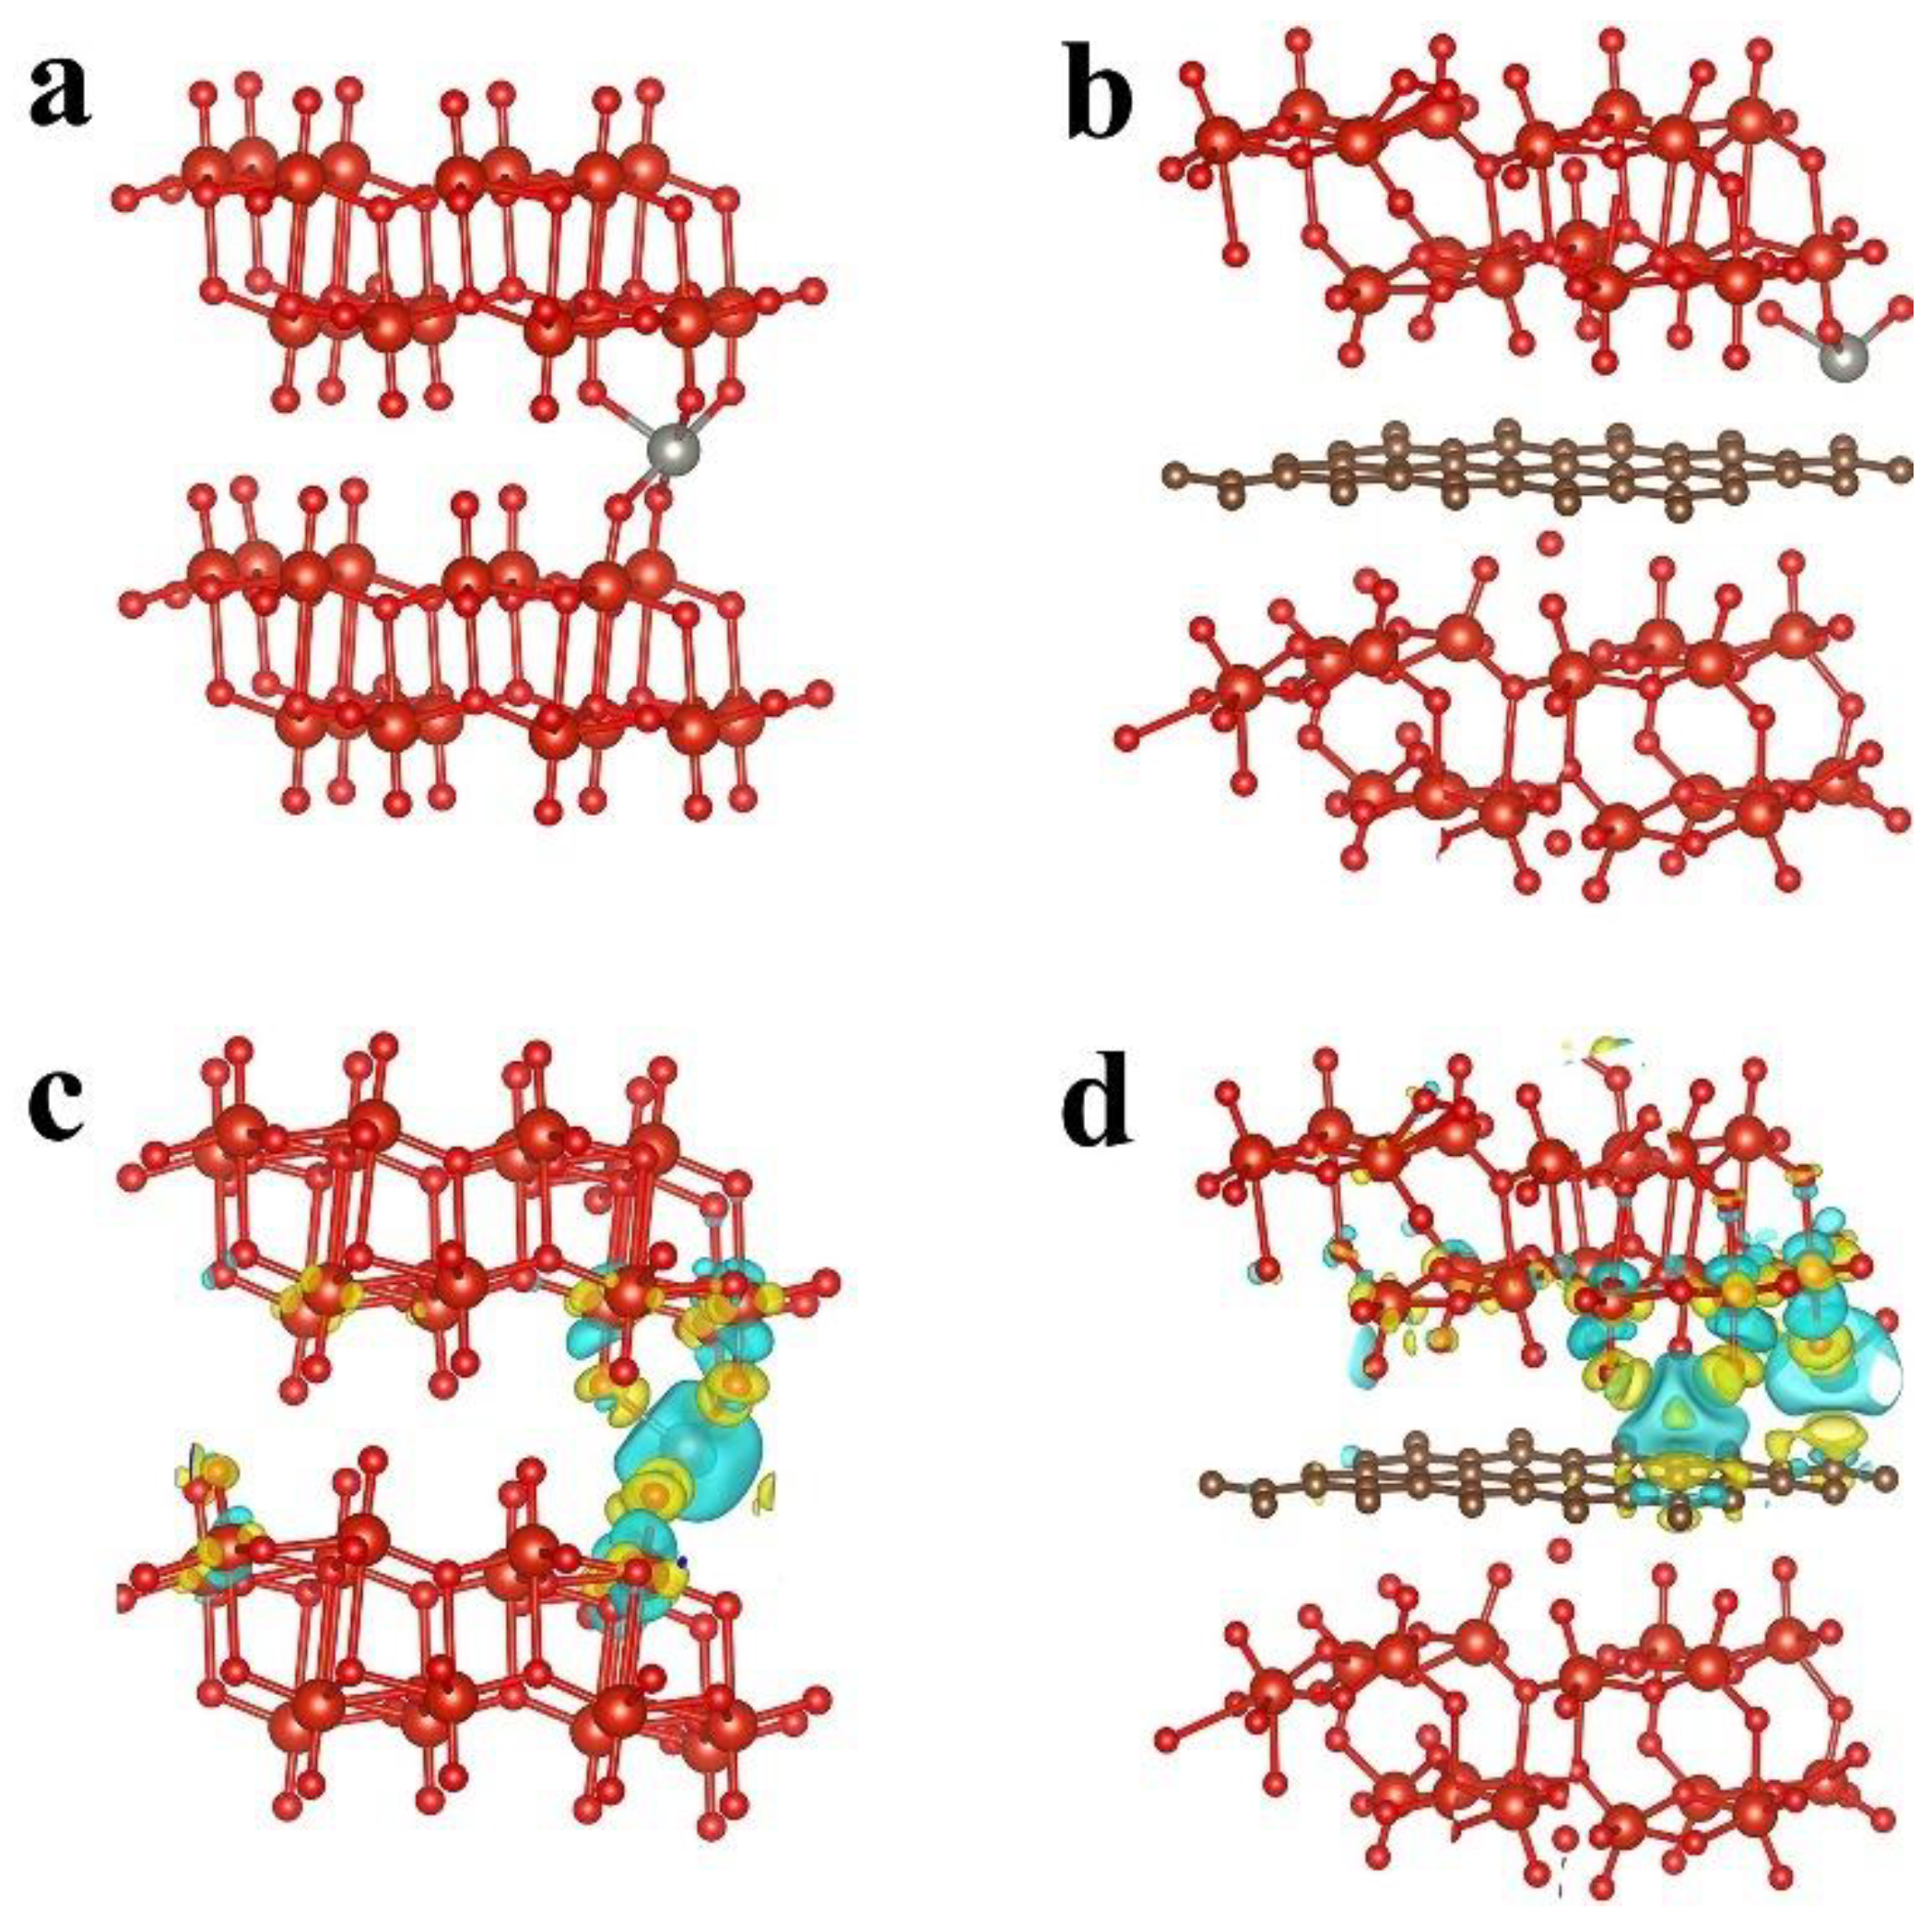
2.1. DFT Calculations
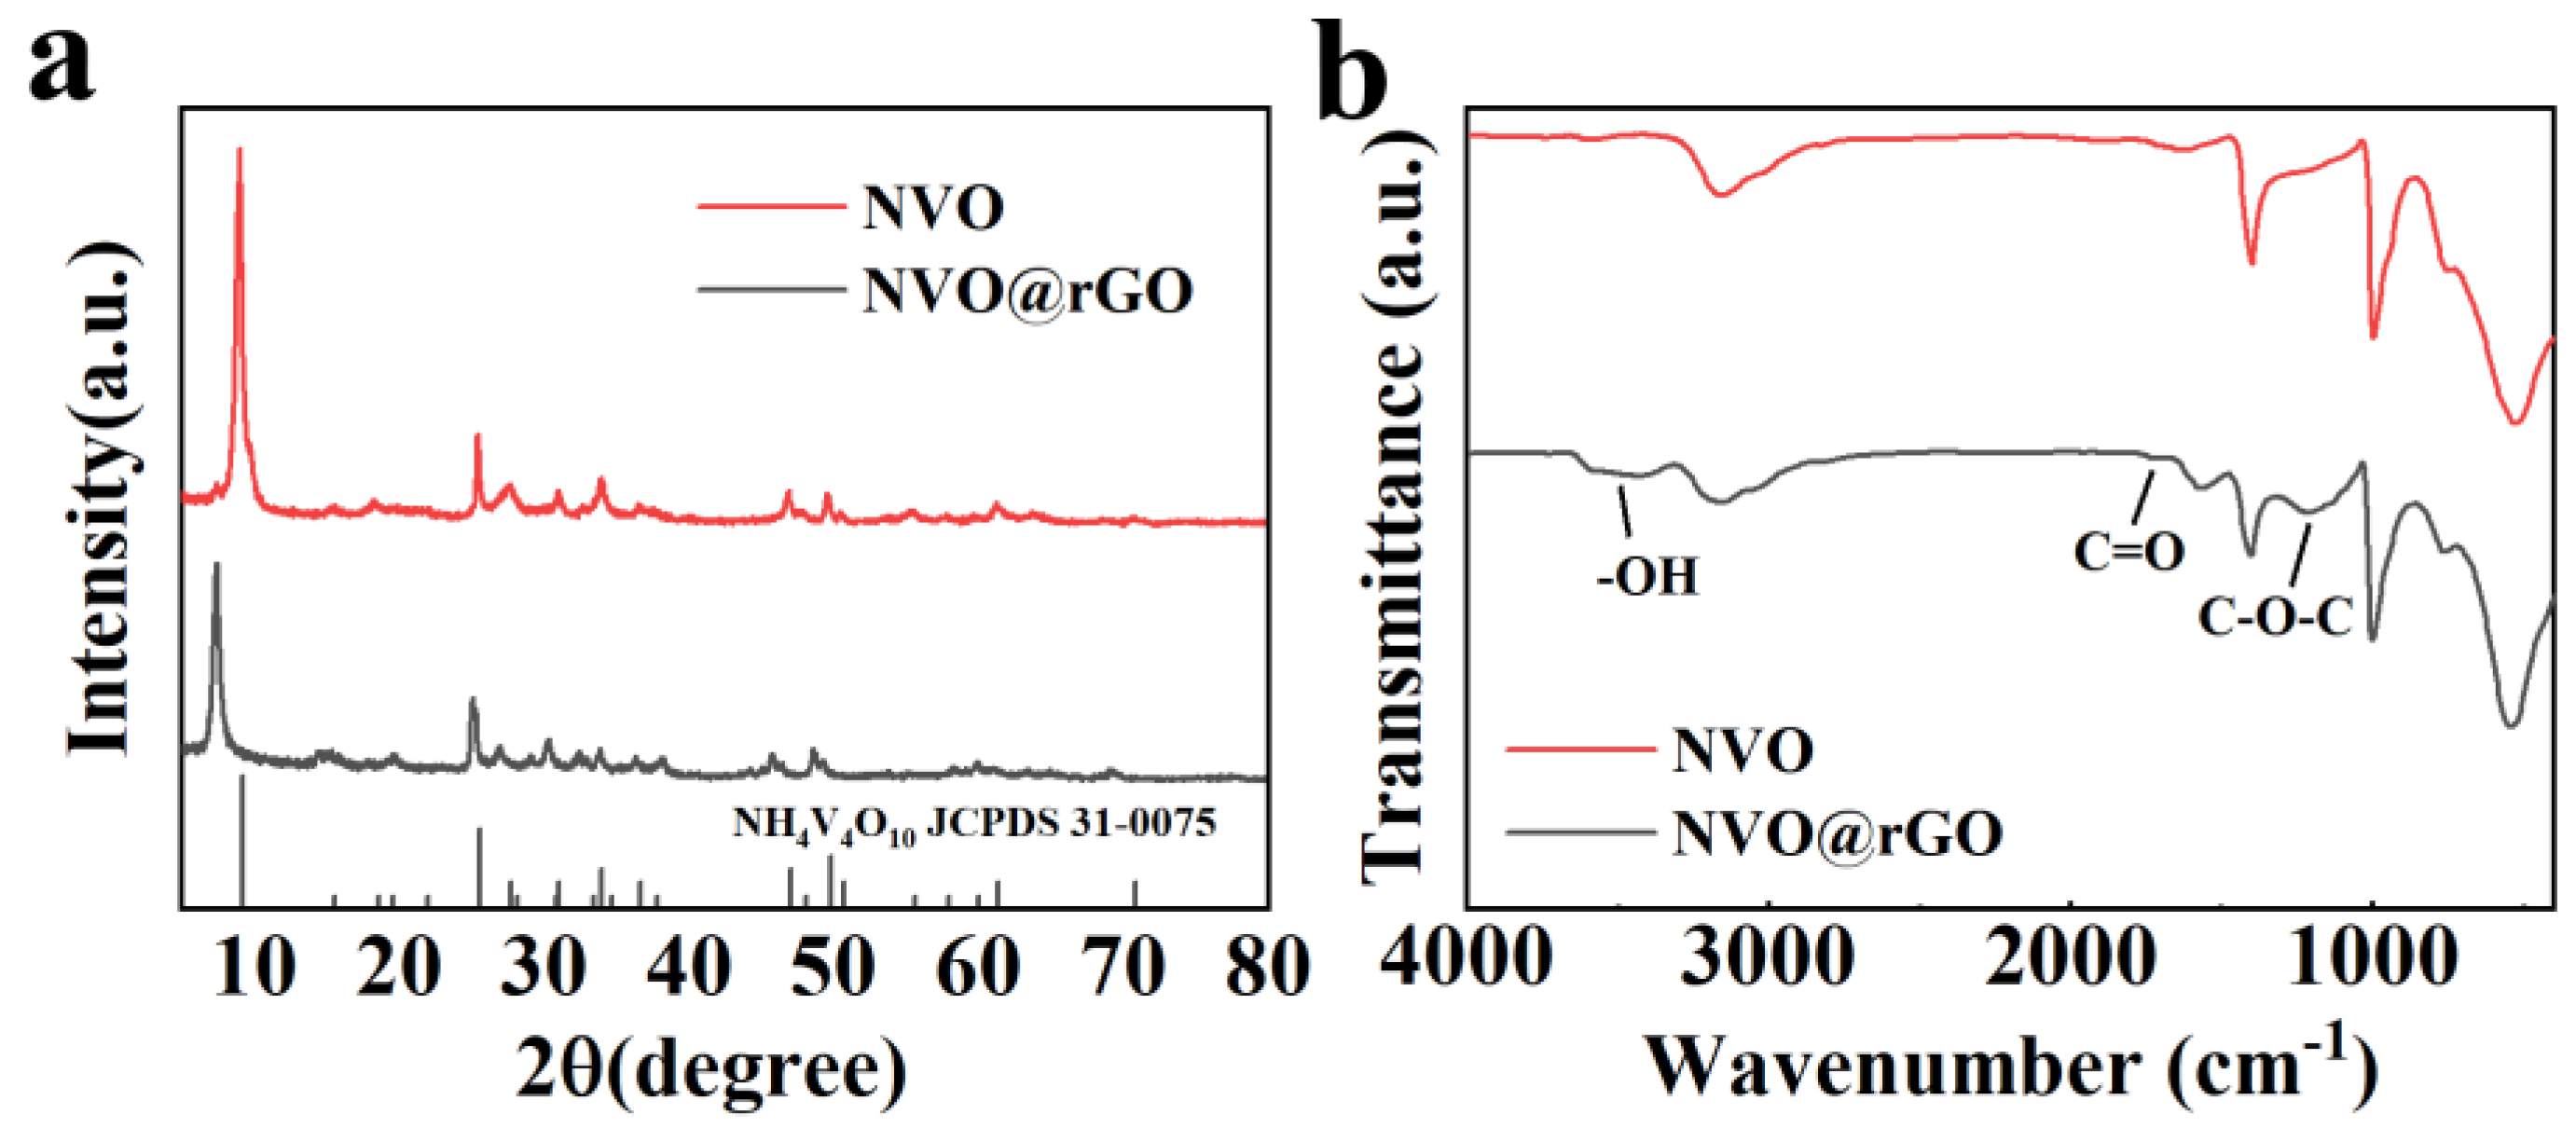
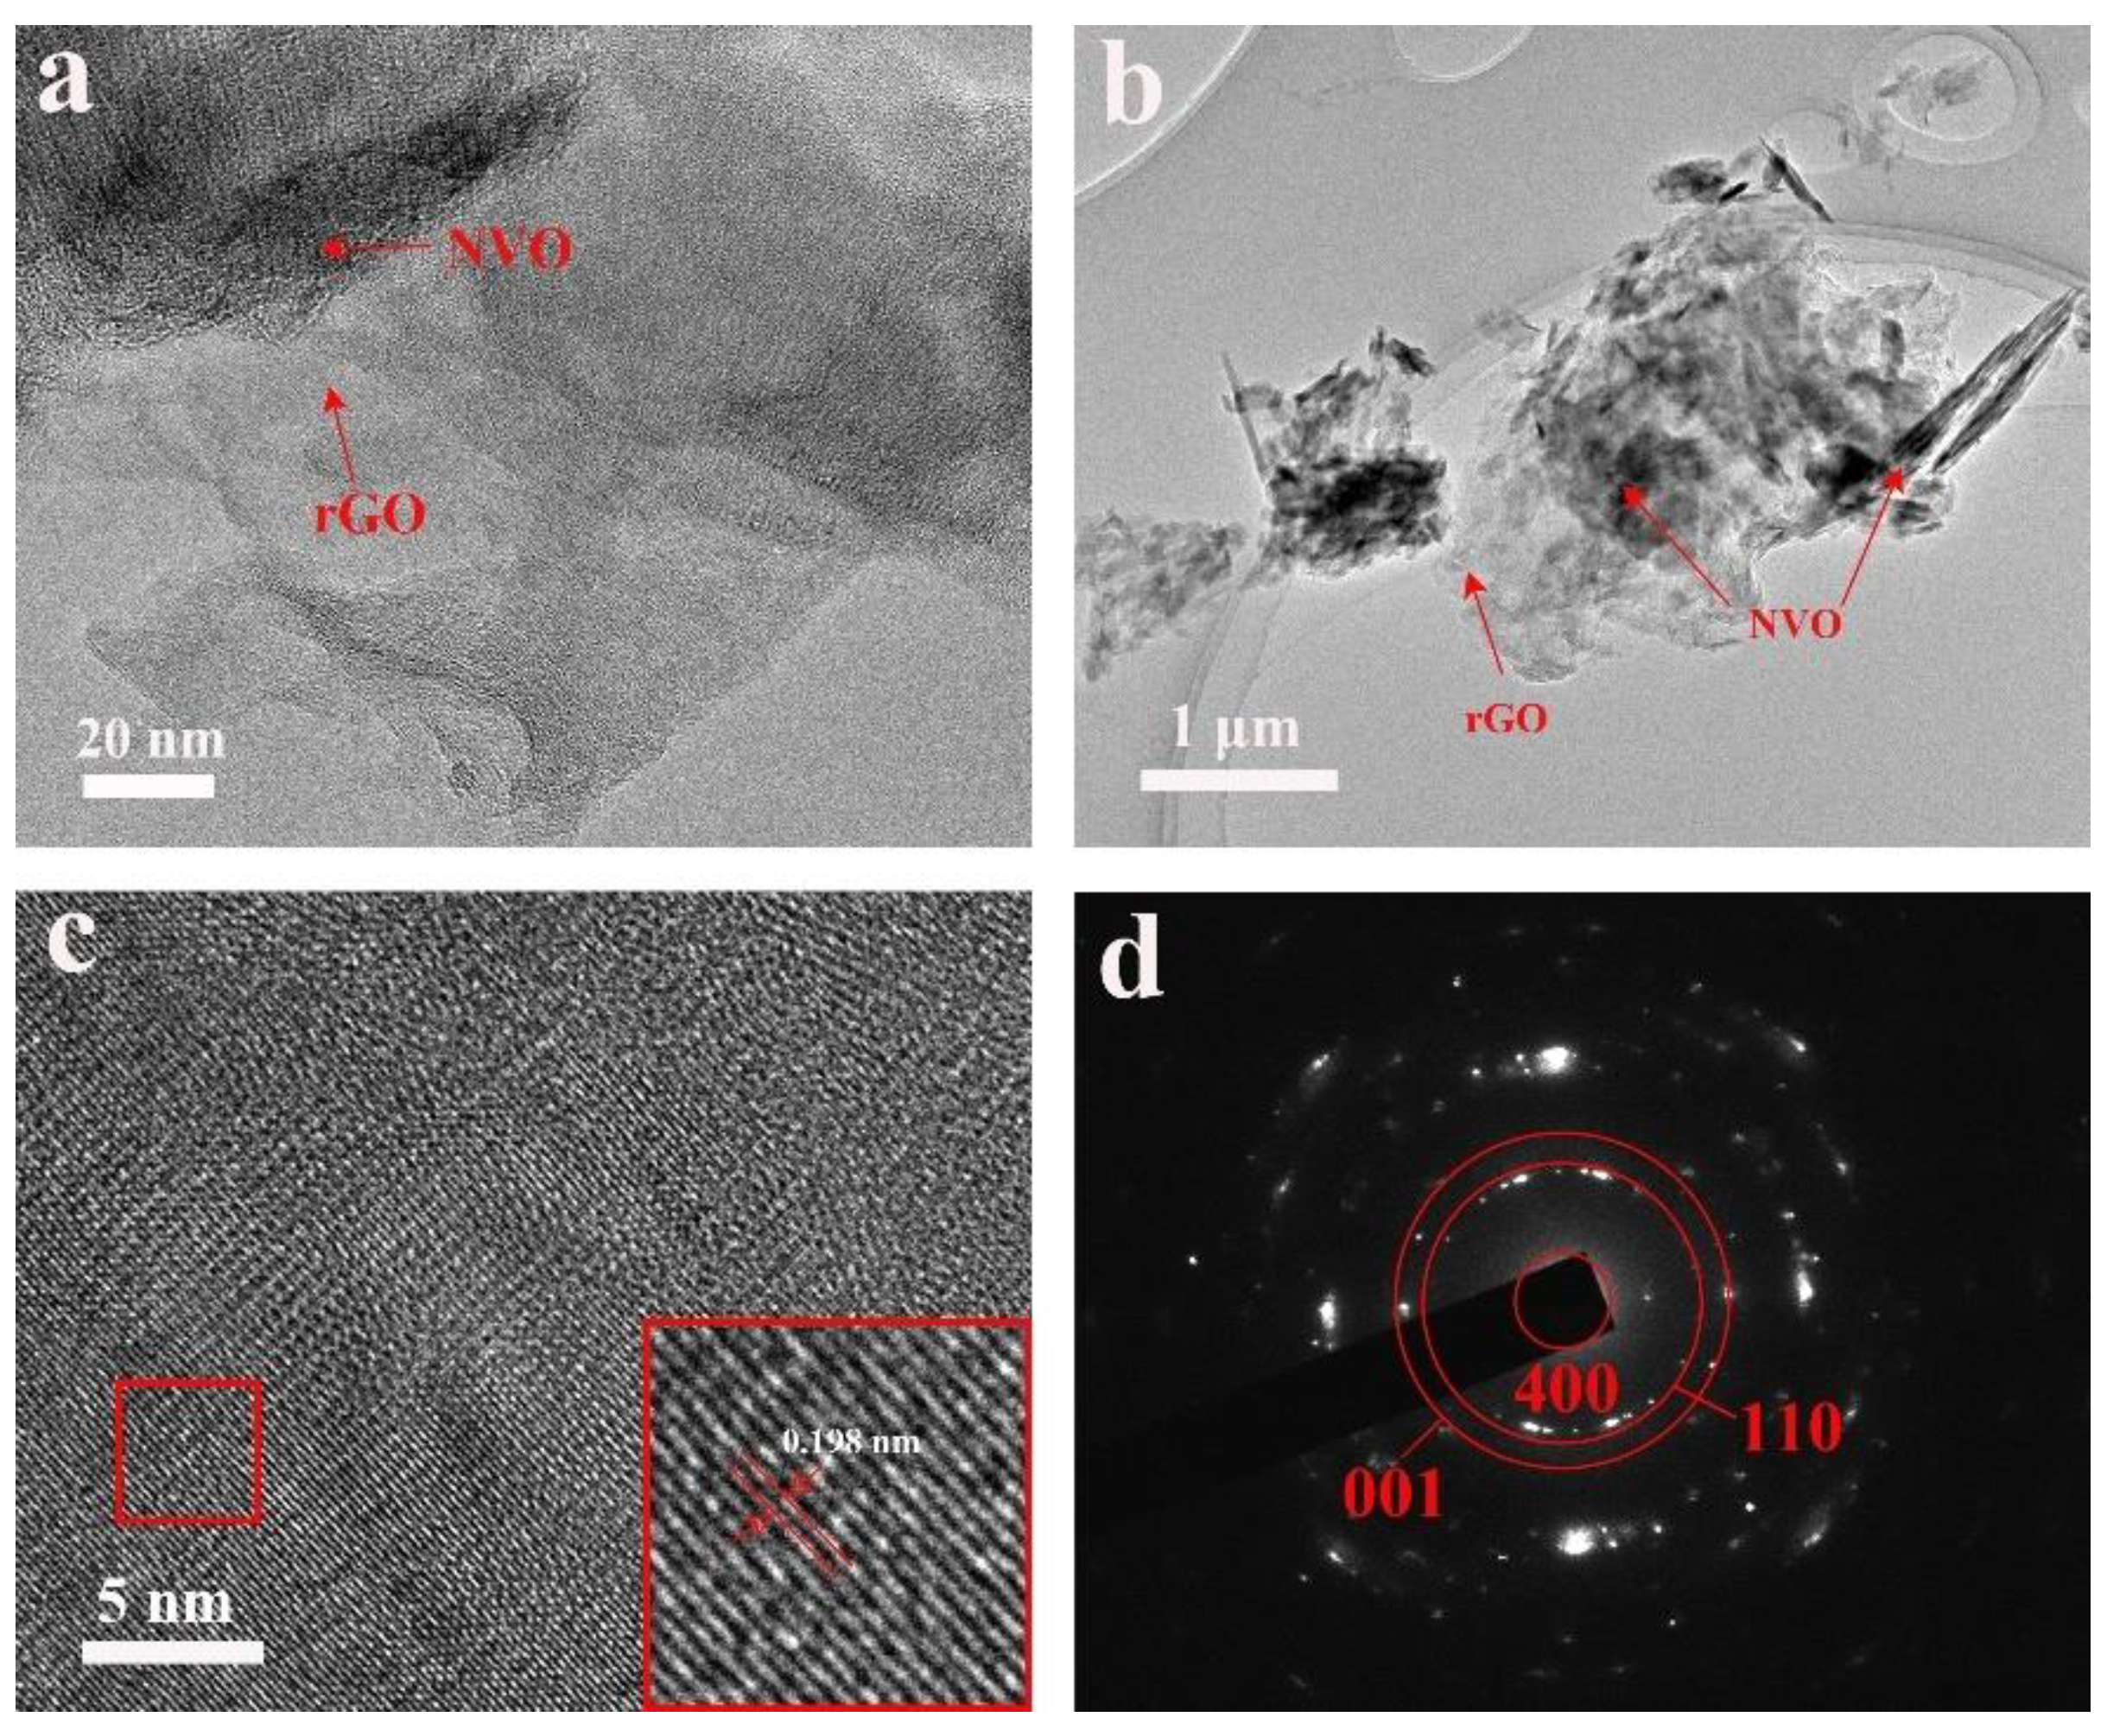
2.2. Morphological Characterization
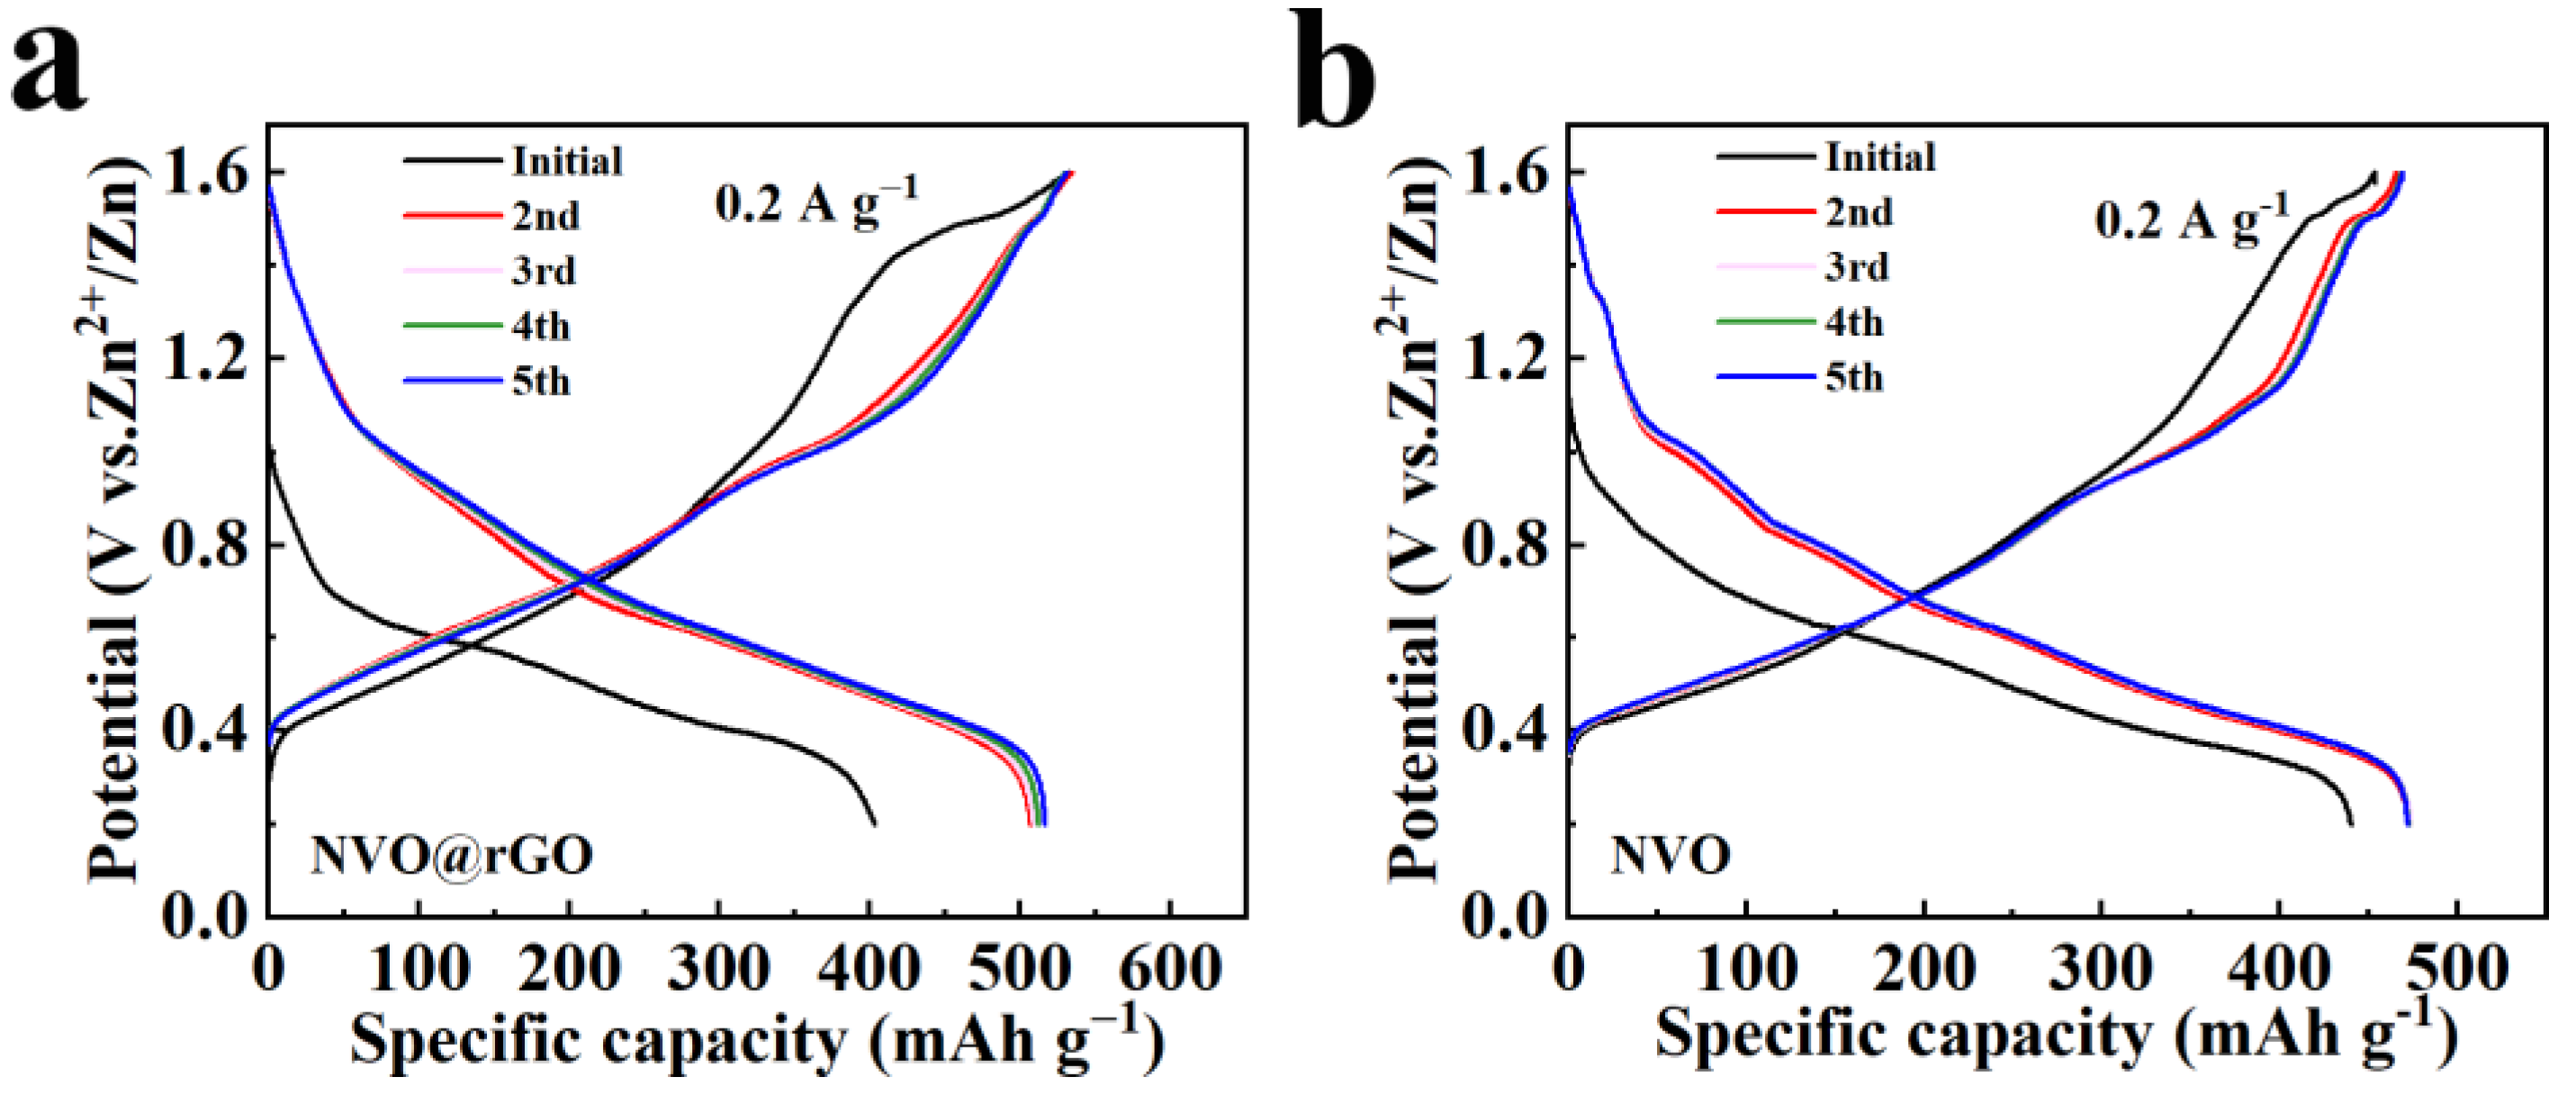
2.3. Electrochemical Properties Characterization
2.4. Storage Mechanism of Zn2+
3. Materials and Methods
3.1. Calculation Method
3.2. Preparation of Material
3.3. Electrode Fabrication
3.4. Structure and Morphology Characterization
3.5. Electrochemical Measurements
4. Conclusions
Author Contributions
Funding
Data Availability Statement
Acknowledgments
Conflicts of Interest
References
- Jia, X.; Liu, C.; Neale, Z.G.; Yang, J.; Cao, G. Active materials for aqueous zinc ion batteries: synthesis, crystal structure, morphology, and electrochemistry. Chem. Rev. 2020, 120, 7795–7866. [Google Scholar] [CrossRef]
- Wan, F.; Niu, Z. Design strategies for vanadium-based aqueous zinc-ion batteries. Angew. Chem. Int. Edit. 2019, 131, 16508–16517. [Google Scholar] [CrossRef]
- Chen, S.P.; Lv, D.; Chen, J.; Zhang, Y.H.; Shi, F.N. Review on defects and modification methods of LiFePO4 cathode material for lithium-ion batteries. Energy Fuels 2022, 36, 1232–1251. [Google Scholar] [CrossRef]
- Jin, Y.; Zhang, T.; Zhang, M. Advances in intelligent regeneration of cathode materials for sustainable lithium-ion batteries. Adv. Energy Mater. 2022, 12, 2201526. [Google Scholar] [CrossRef]
- Zhang, Y.; Xu, J.; Liu, C.; Cheng, H.; Cai, X.; Jia, D.; Lin, H. Ion-exchange-induced high-performance of inverse spinel Mg2VO4 for aqueous zinc-ion batteries. J. Power Sources 2022, 549, 232075. [Google Scholar] [CrossRef]
- Yimtrakarn, T.; Liao, Y.-C.; MV, A.S.; Chen, J.-L.; Chuang, Y.-C.; Lerkkasemsan, N.; Kaveevivitchai, W. Mn-Fe prussian blue analogue as low-cost robust cathode for non-aqueous Zn-ion batteries. Mater. Today Commun. 2023, 34, 105231. [Google Scholar] [CrossRef]
- Wu, B.; Zhang, G.; Yan, M.; Xiong, T.; He, P.; He, L.; Xu, X.; Mai, L. Graphene scroll-coated α-MnO2 nanowires as high-performance cathode materials for aqueous Zn-ion battery. Small 2018, 14, 1703850. [Google Scholar] [CrossRef]
- Wang, J.; Liu, Z.; Wang, H.; Cui, F.; Zhu, G. Integrated pyrazine-based porous aromatic frameworks/carbon nanotube composite as cathode materials for aqueous zinc ion batteries. Chem. Eng. J. 2022, 450, 138051. [Google Scholar] [CrossRef]
- Guo, C.; Yi, S.; Si, R.; Xi, B.; An, X.; Liu, J.; Li, J.; Xiong, S. Advances on defect engineering of vanadium-based compounds for high-energy aqueous zinc-ion batteries. Adv. Energy Mater. 2022, 12, 2202039. [Google Scholar] [CrossRef]
- Ding, Y.; Zhang, L.; Wang, X.; Han, L.; Zhang, W.; Guo, C. Vanadium-based cathodes for aqueous zinc ion batteries: structure, mechanism and prospects. Chin. Chem. Lett. 2023, 34, 107399. [Google Scholar] [CrossRef]
- Zhang, N.; Wang, J.-C.; Guo, Y.-F.; Wang, P.-F.; Zhu, Y.-R.; Yi, T.-F. Insights on rational design and energy storage mechanism of Mn-based cathode materials towards high performance aqueous zinc-ion batteries. Coord. Chem. Rev. 2023, 479, 215009. [Google Scholar] [CrossRef]
- Chen, D.; Lu, M.; Cai, D.; Yang, H.; Han, W. Recent advances in energy storage mechanism of aqueous zinc-ion batteries. J. Energy Chem. 2021, 54, 712–726. [Google Scholar] [CrossRef]
- Wang, X.; Zhang, Z.; Xi, B.; Chen, W.; Jia, Y.; Feng, J.; Xiong, S. Advances and perspectives of cathode storage chemistry in aqueous zinc-ion batteries. ACS Nano 2021, 15, 9244–9272. [Google Scholar] [CrossRef]
- Chen, D.; Lu, M.; Wang, B.; Cheng, H.; Yang, H.; Cai, D.; Han, W.; Fan, H.J. High-mass loading V3O7⸱H2O nanoarray for Zn-ion battery: New synthesis and two-stage ion intercalation chemistry. Nano Energy 2021, 83, 105835. [Google Scholar] [CrossRef]
- Zhang, N.; Jia, M.; Dong, Y.; Wang, Y.; Xu, J.; Liu, Y.; Jiao, L.; Cheng, F. Hydrated layered vanadium oxide as a highly reversible cathode for rechargeable aqueous zinc batteries. Adv. Funct. Mater. 2019, 29, 1807331. [Google Scholar] [CrossRef]
- Zampardi, G.; Mantia, F.L. Prussian blue analogues as aqueous Zn-ion batteries electrodes: Current challenges and future perspectives. Curr. Opin. Electrochem. 2020, 21, 84–92. [Google Scholar] [CrossRef]
- Zhou, T.; Zhu, L.; Xie, L.; Han, Q.; Yang, X.; Chen, L.; Wang, G.; Cao, X. Cathode materials for aqueous zinc-ion batteries: A mini review. J. Colloid. Interf. Sci. 2022, 605, 828–850. [Google Scholar] [CrossRef]
- Zhou, J.; Shan, L.; Wu, Z.; Guo, X.; Fang, G.; Liang, S. Investigation of V2O5 as a low-cost rechargeable aqueous zinc ion battery cathode. Chem. Commun. 2018, 54, 4457–4460. [Google Scholar] [CrossRef]
- Chen, L.; Yue, H.; Zhang, Z.; Ma, Y.; Wang, Y.; Xu, M.; Huang, Y.; Yuan, G. Pre-removing partial ammonium ions from the interlayer of ammonium vanadate with acid treating for quasi-solid-state flexible zinc ion batteries. Chem. Eng. J. 2023, 455, 140679. [Google Scholar] [CrossRef]
- Yin, B.; Zhang, S.; Ke, K.; Lee, W.S.V.; Wang, Z. Effects of small molecule interlayer engineering in vanadium oxide for zinc ion battery. ChemistrySelect 2020, 5, 8951–8958. [Google Scholar] [CrossRef]
- Tang, B.; Zhou, J.; Fang, G.; Liu, F.; Zhu, C.; Wang, C.; Pan, A.; Liang, S. Engineering the interplanar spacing of ammonium vanadates as a high-performance aqueous zinc-ion battery cathode. J. Mater. Chem. A 2019, 7, 940–945. [Google Scholar] [CrossRef]
- He, P.; Quan, Y.; Xu, X.; Yan, M.; Yang, W.; An, Q.; He, L.; Mai, L. High-performance aqueous zinc-ion battery based on layered H2V3O8 nanowire cathode. Small 2017, 13, 1702551. [Google Scholar] [CrossRef]
- Li, K.; Liu, Y.; Wu, X. Ammonium vanadate electrode materials with stable layered structures for rechargeable zinc ion batteries. CrystEngComm 2022, 24, 5421–5427. [Google Scholar] [CrossRef]
- Xu, L.; Zhang, Y.; Zheng, J.; Jiang, H.; Hu, T.; Meng, C. Ammonium ion intercalated hydrated vanadium pentoxide for advanced aqueous rechargeable Zn-ion batteries. Mater. Today Energy 2020, 18, 100509. [Google Scholar] [CrossRef]
- Xu, J.; Zhang, Y.; Liu, C.; Cheng, H.; Cai, X.; Jia, D.; Lin, H. Al3+ introduction hydrated vanadium oxide induced high performance for aqueous zinc-ion batteries. Small 2022, 18, 2204180. [Google Scholar] [CrossRef] [PubMed]
- Tamilselvan, M.; Sreekanth, T.V.M.; Yoo, K.; Kim, J. Wide interlayer spacing ammonium vanadate (NH4)0.37V2O5·0.15(H2O) cathode for rechargeable aqueous zinc-ion batteries. J. Ind. Eng. Chem. 2021, 93, 176–185. [Google Scholar] [CrossRef]
- He, D.; Sun, T.; Wang, Q.; Ma, T.; Zheng, S.; Tao, Z.; Jiang, J. Multi-functional potassium ion assists ammonium vanadium oxide cathode for high-performance aqueous zinc-ion batteries. Batteries 2022, 8, 84. [Google Scholar] [CrossRef]
- Qi, Y.; Huang, J.; Yan, L.; Cao, Y.; Xu, J.; Bin, D.; Liao, M.; Xia, Y. Towards high-performance aqueous zinc-ion battery via cesium ion intercalated vanadium oxide nanorods. Chem. Eng. J. 2022, 442, 136349. [Google Scholar] [CrossRef]
- Xu, L.; Zhang, Y.; Zheng, J.; Jiang, H.; Hu, T.; Meng, C. Ammonium ion intercalated hydrated vanadium pentoxide for advanced aqueous rechargeable Zn-ion batteries. Mater. Today Energy 2020, 18, 100509. [Google Scholar] [CrossRef]
- Wang, G.; Kuang, Q.; Jiang, P.; Fan, Q.; Dong, Y.; Zhao, Y. Integrating molybdenum into zinc vanadate enables Zn3V2MoO8 as a high-capacity Zn-supplied cathode for Zn-metal free aqueous batteries. Nanoscale 2023, 15, 6722–6731. [Google Scholar] [CrossRef]
- Fan, L.; Li, Z. Highly stable cathode materials for aqueous Zn ion batteries: synergistic effect of pre-inserted bimetallic ions in vanadium oxide layer. J. Alloy. Compd. 2022, 910, 164872. [Google Scholar] [CrossRef]
- Cui, F.; Hu, F.; Yu, X.; Guan, C.; Song, G.; Zhu, K. In-situ tuning the NH4+ extraction in (NH4)2V4O9 nanosheets towards high performance aqueous zinc ion batteries. J. Power Sources 2021, 492, 229629. [Google Scholar] [CrossRef]
- Wang, W.; Liu, D.; Jiang, Y.; Zhang, D.; Shen, X.; Li, S.; Liang, J.; Xu, H. Mechanism enhancement of V3O7/V6O13 heterostructures to achieve high-performance aqueous Zn-Ion batteries. Chem. Eng. J. 2023, 463, 142309. [Google Scholar] [CrossRef]
- Li, S.; Xu, X.; Wang, K.; Chen, W.; Lu, X.; Song, Z.; Hwang, J.Y.; Kim, J.; Bai, Y.; Liu, Y.; Xiong, S. Textured Na2V6O16·3H2O cathode tuned via crystal engineering endows aqueous Zn-ion batteries with high rate capability and adequate lifespan. ACS Energy Lett. 2022, 7, 3770–3779. [Google Scholar] [CrossRef]
- Wu, J.; Yang, Z.; Chen, H. Oxygen-deficient HNaV6O16·4H2O@reduced graphene oxide as a cathode for aqueous rechargeable zinc-ion batteries. Ind. Eng. Chem. Res. 2022, 61, 10640–10649. [Google Scholar] [CrossRef]
- Wu, Q.; Li, X.; Fan, H.; Cao, J.; Liu, X.; Wei, M.; Yang, L. Synergistic interlayer and structure engineering construction of layered hydrated vanadates/graphene for stable aqueous zinc-ion batteries. J. Alloy. Compd. 2023, 941, 168936. [Google Scholar] [CrossRef]
- Yi, T.F.; Qiu, L.; Qu, J.P.; Liu, H.; Zhang, J.H.; Zhu, Y.R. Towards high-performance cathodes: design and energy storage mechanism of vanadium oxides-based materials for aqueous Zn-ion batteries. Coordin. Chem. Rev. 2021, 446, 214124. [Google Scholar] [CrossRef]
- Ren, H.Z.; Zhang, J.; Wang, B.; Luo, H.; Jin, F.; Zhang, T.R.; Ding, A.; Cong, B.W.; Wang, D.L. A V2O3@N–C cathode material for aqueous zinc-ion batteries with boosted zinc-ion storage performance. Rare Metals 2022, 41, 1605–1615. [Google Scholar] [CrossRef]
- Xing, Z.; Xu, G.; Xie, X.; Chen, M.; Lu, B.; Zhou, J.; Liang, S. Highly reversible zinc-ion battery enabled by suppressing vanadium dissolution through inorganic Zn2+ conductor electrolyte. Nano Energy 2021, 90, 106621. [Google Scholar] [CrossRef]
- Kresse, G.; Furthmüller, J. Efficient iterative schemes for ab initio total-energy calculations using a plane-wave basis set. Phys. Rev. B 1996, 54, 11169–11186. [Google Scholar] [CrossRef]
- Perdew, J.P.; Burke, K.; Ernzerhof, M. Generalized gradient approximation made simple. Phys. Rev. Lett. 1996, 77, 3865–3868. [Google Scholar] [CrossRef] [PubMed]
- Kresse, G.; Joubert, D. From ultrasoft pseudopotentials to the projector augmented-wave method. Phys. Rev. B 1999, 59, 1758–1775. [Google Scholar] [CrossRef]
- Blöchl, P.E. Projector augmented-wave method. Phys. Rev. B 1994, 50, 17953–17979. [Google Scholar] [CrossRef]


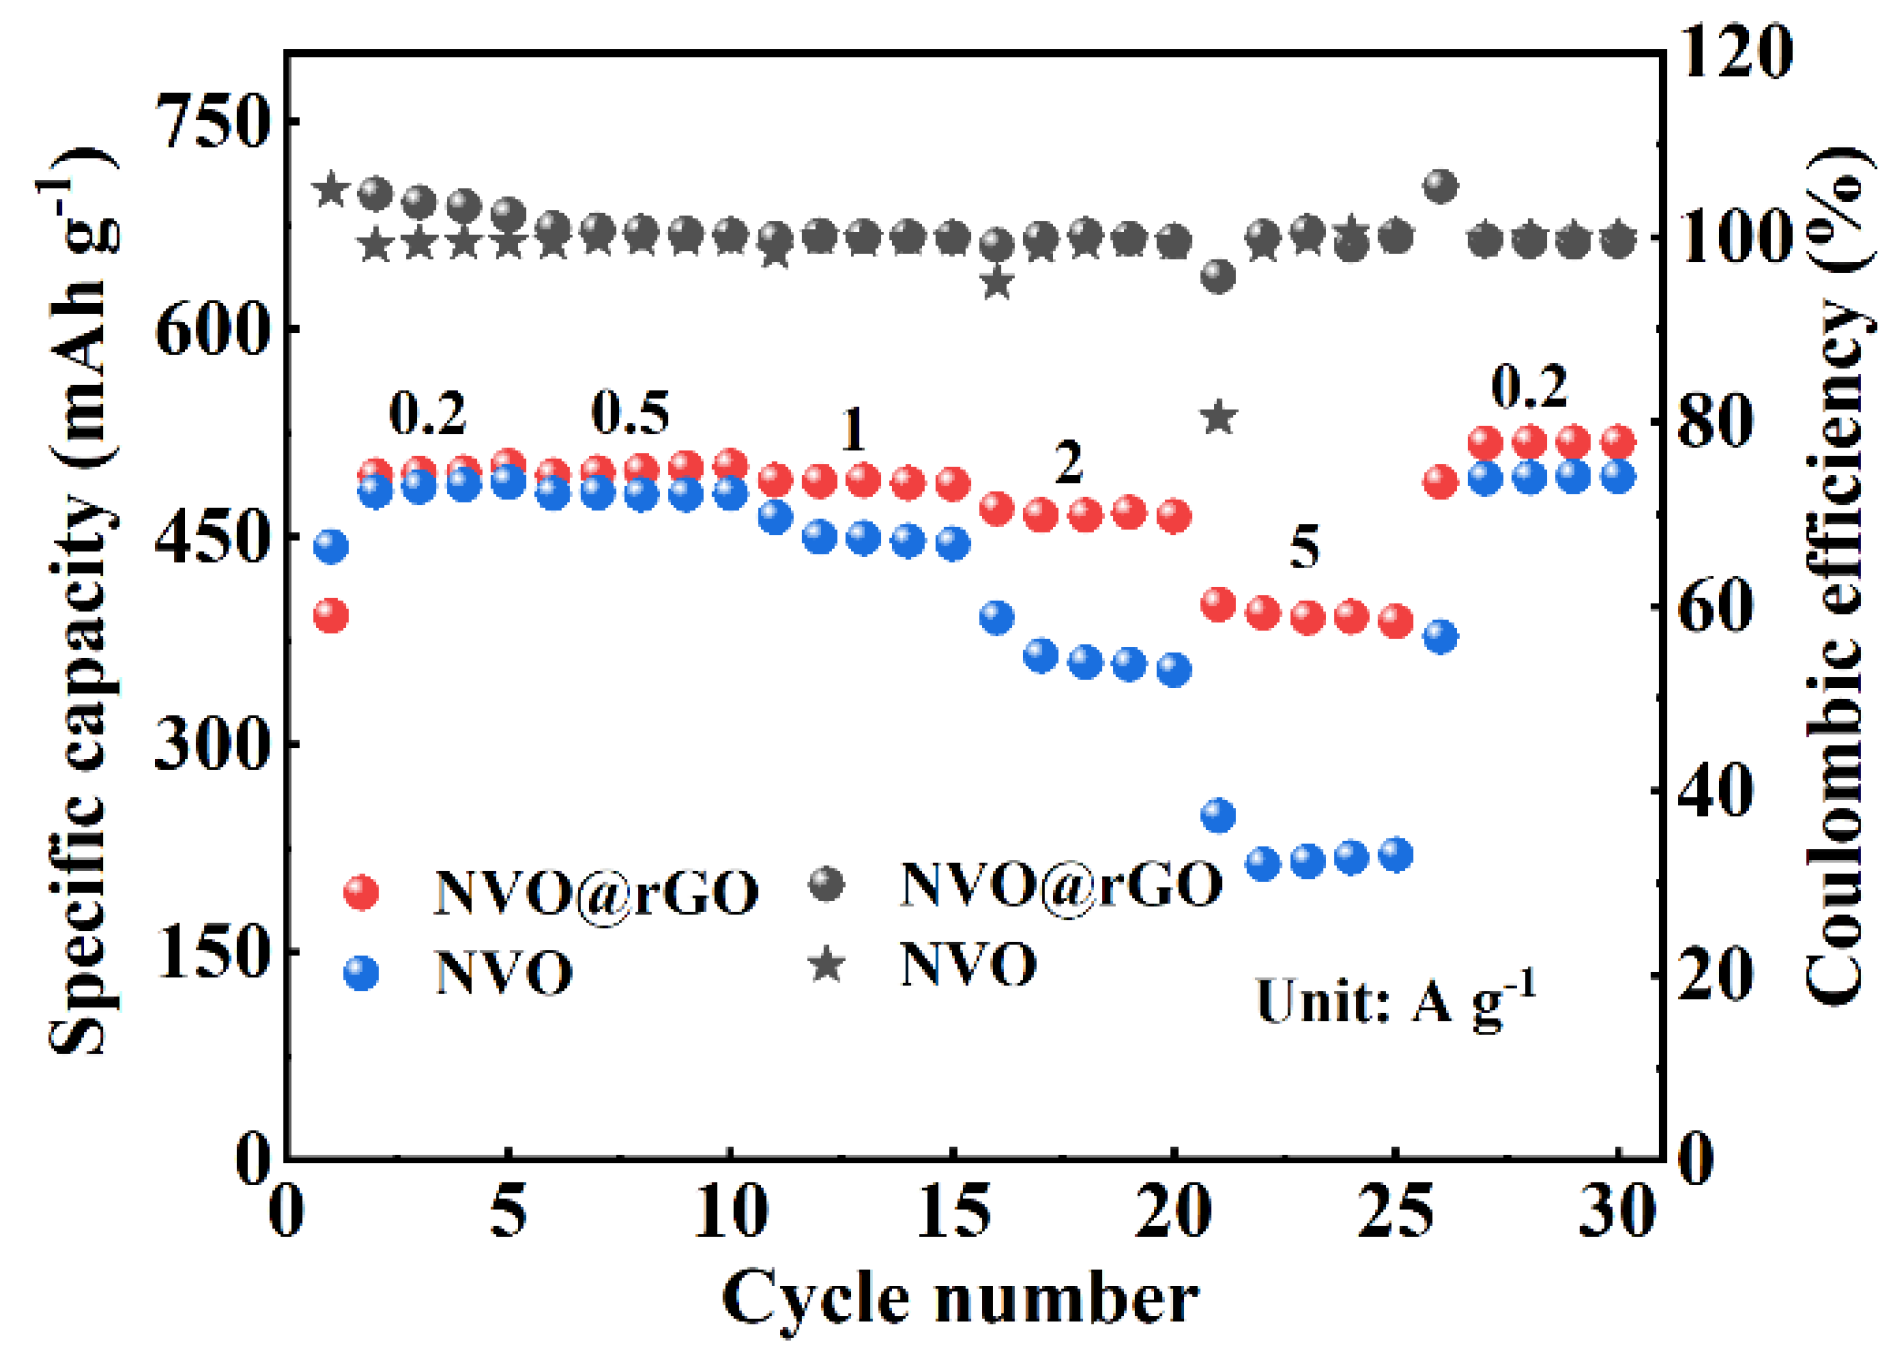
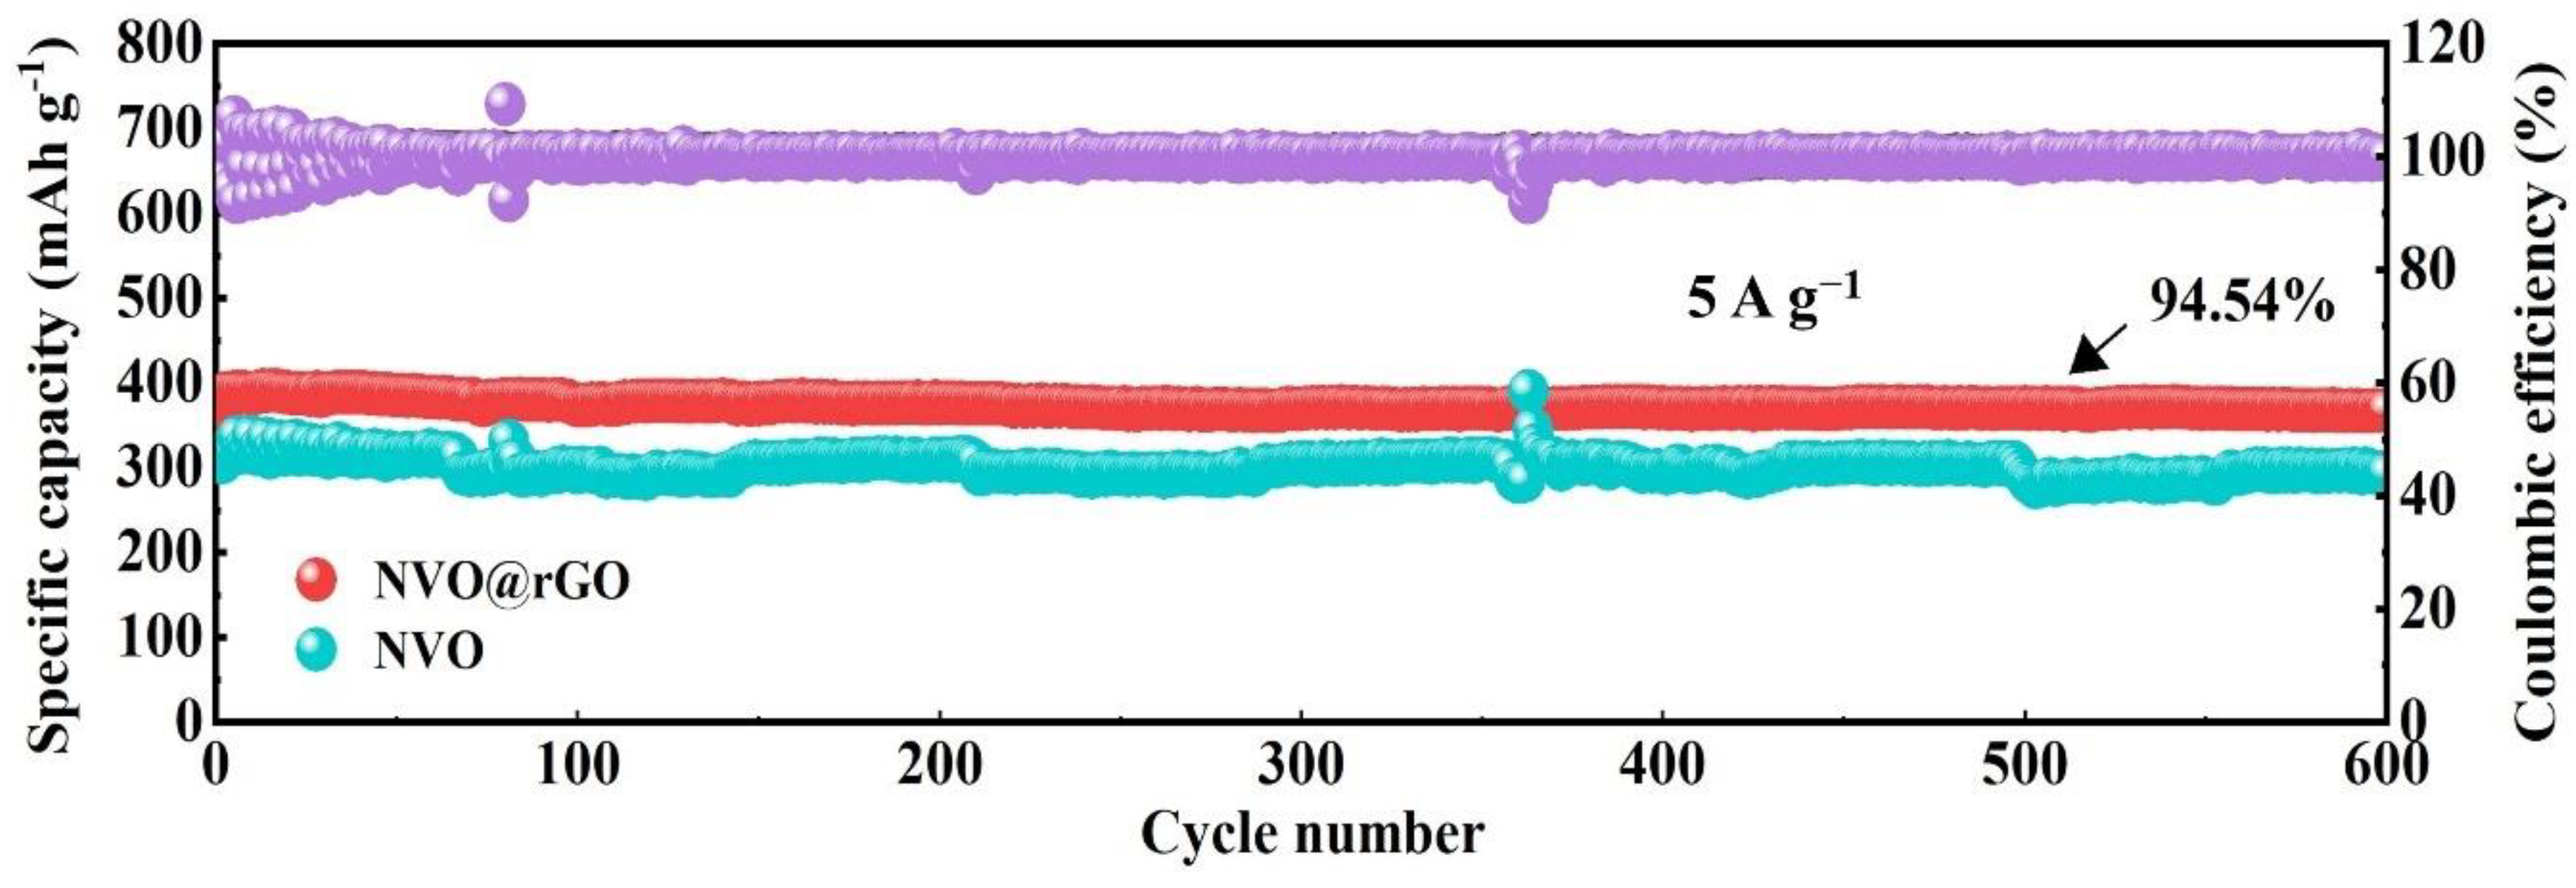
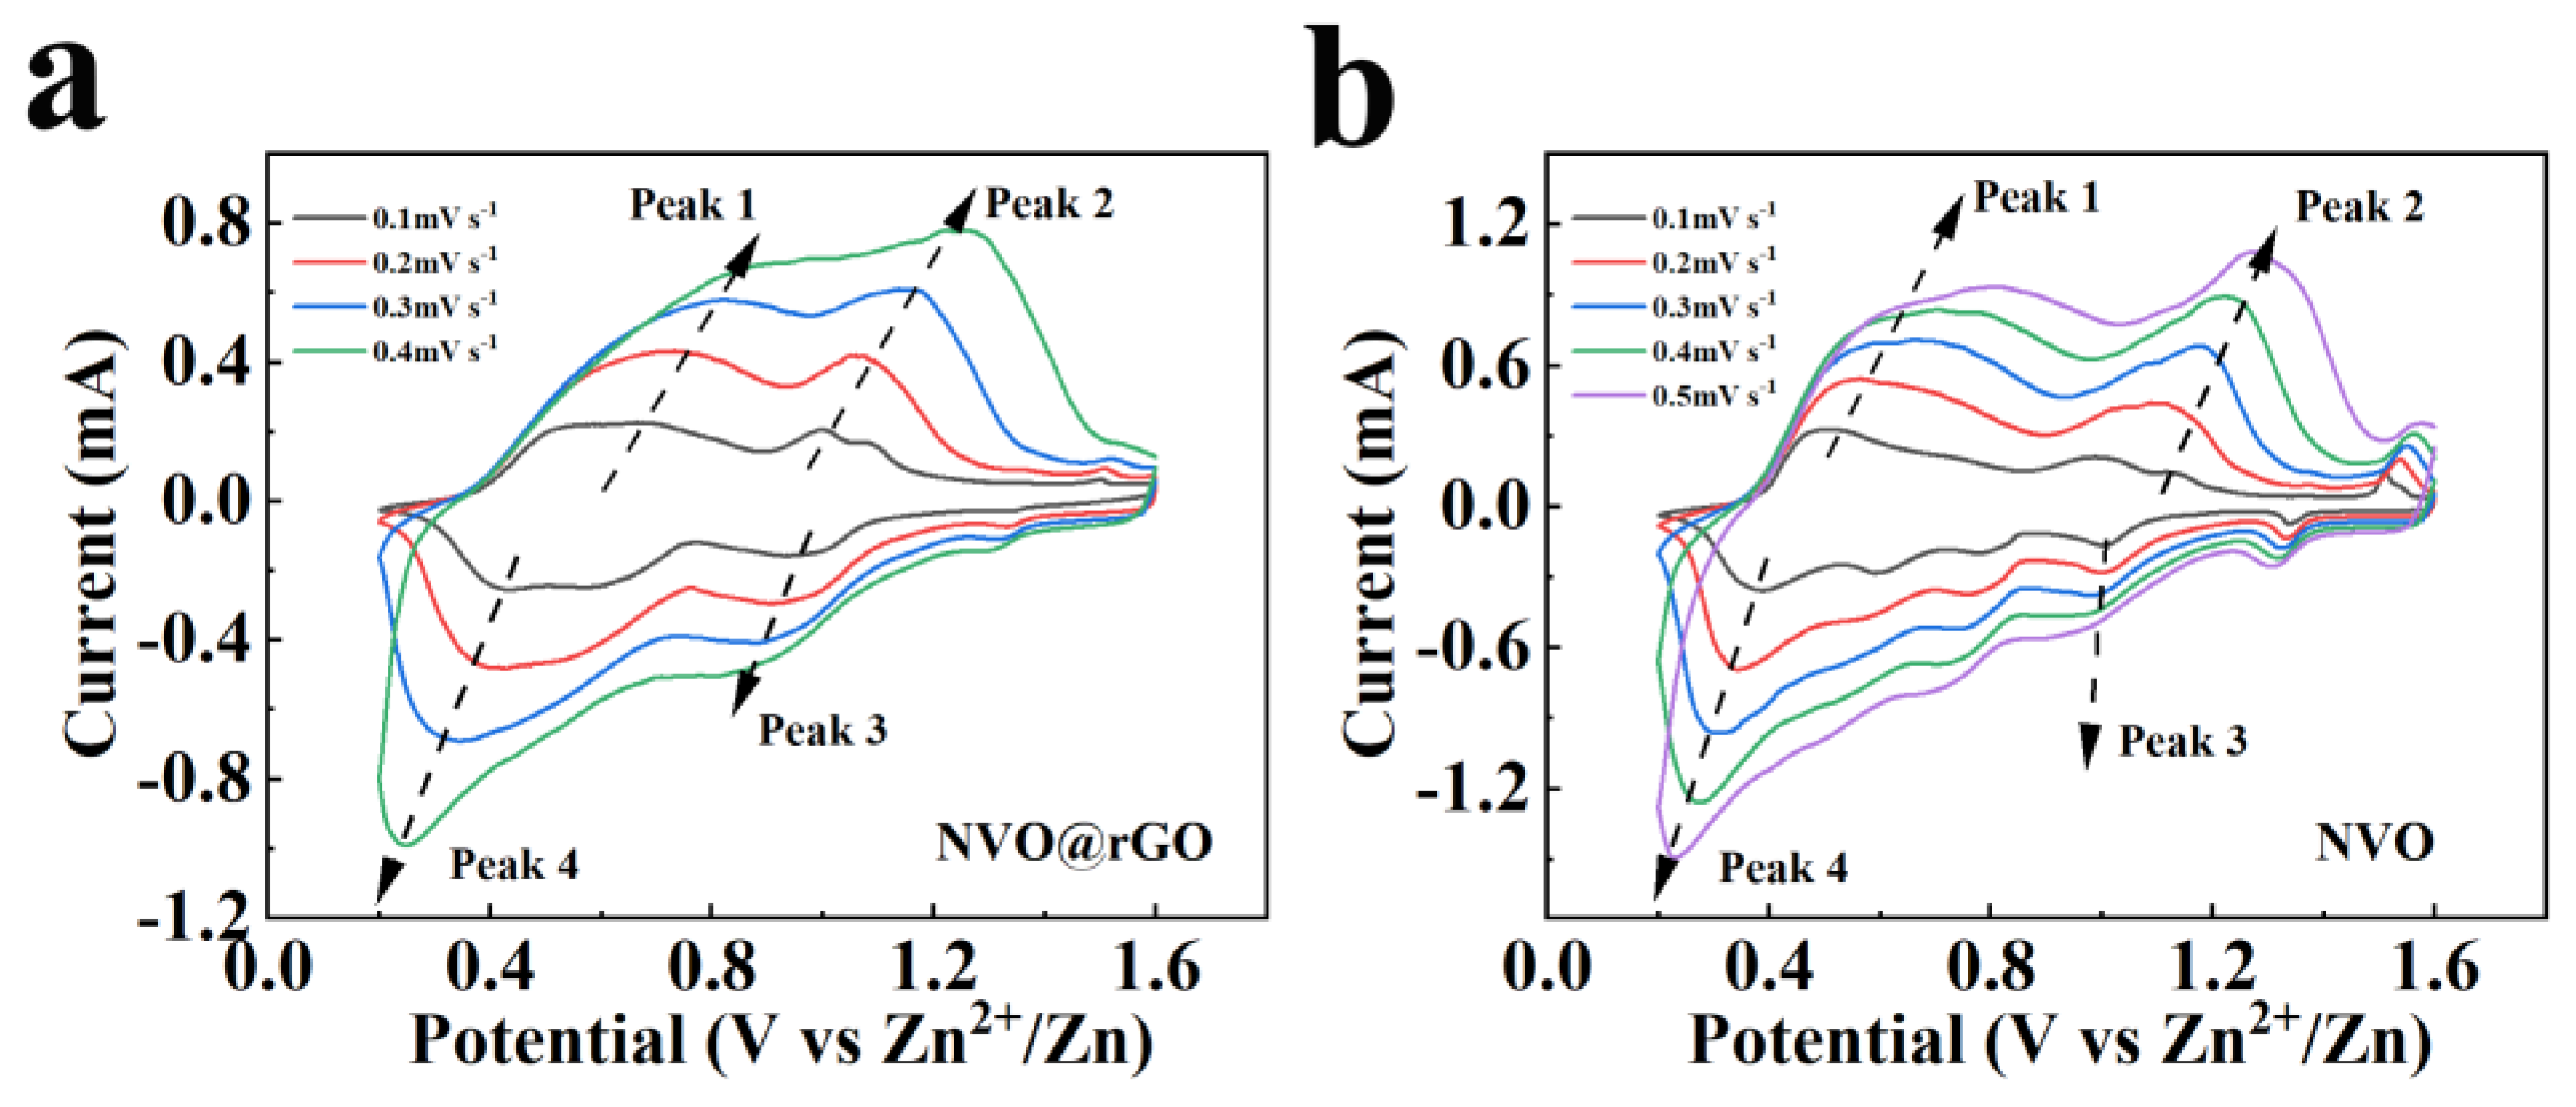
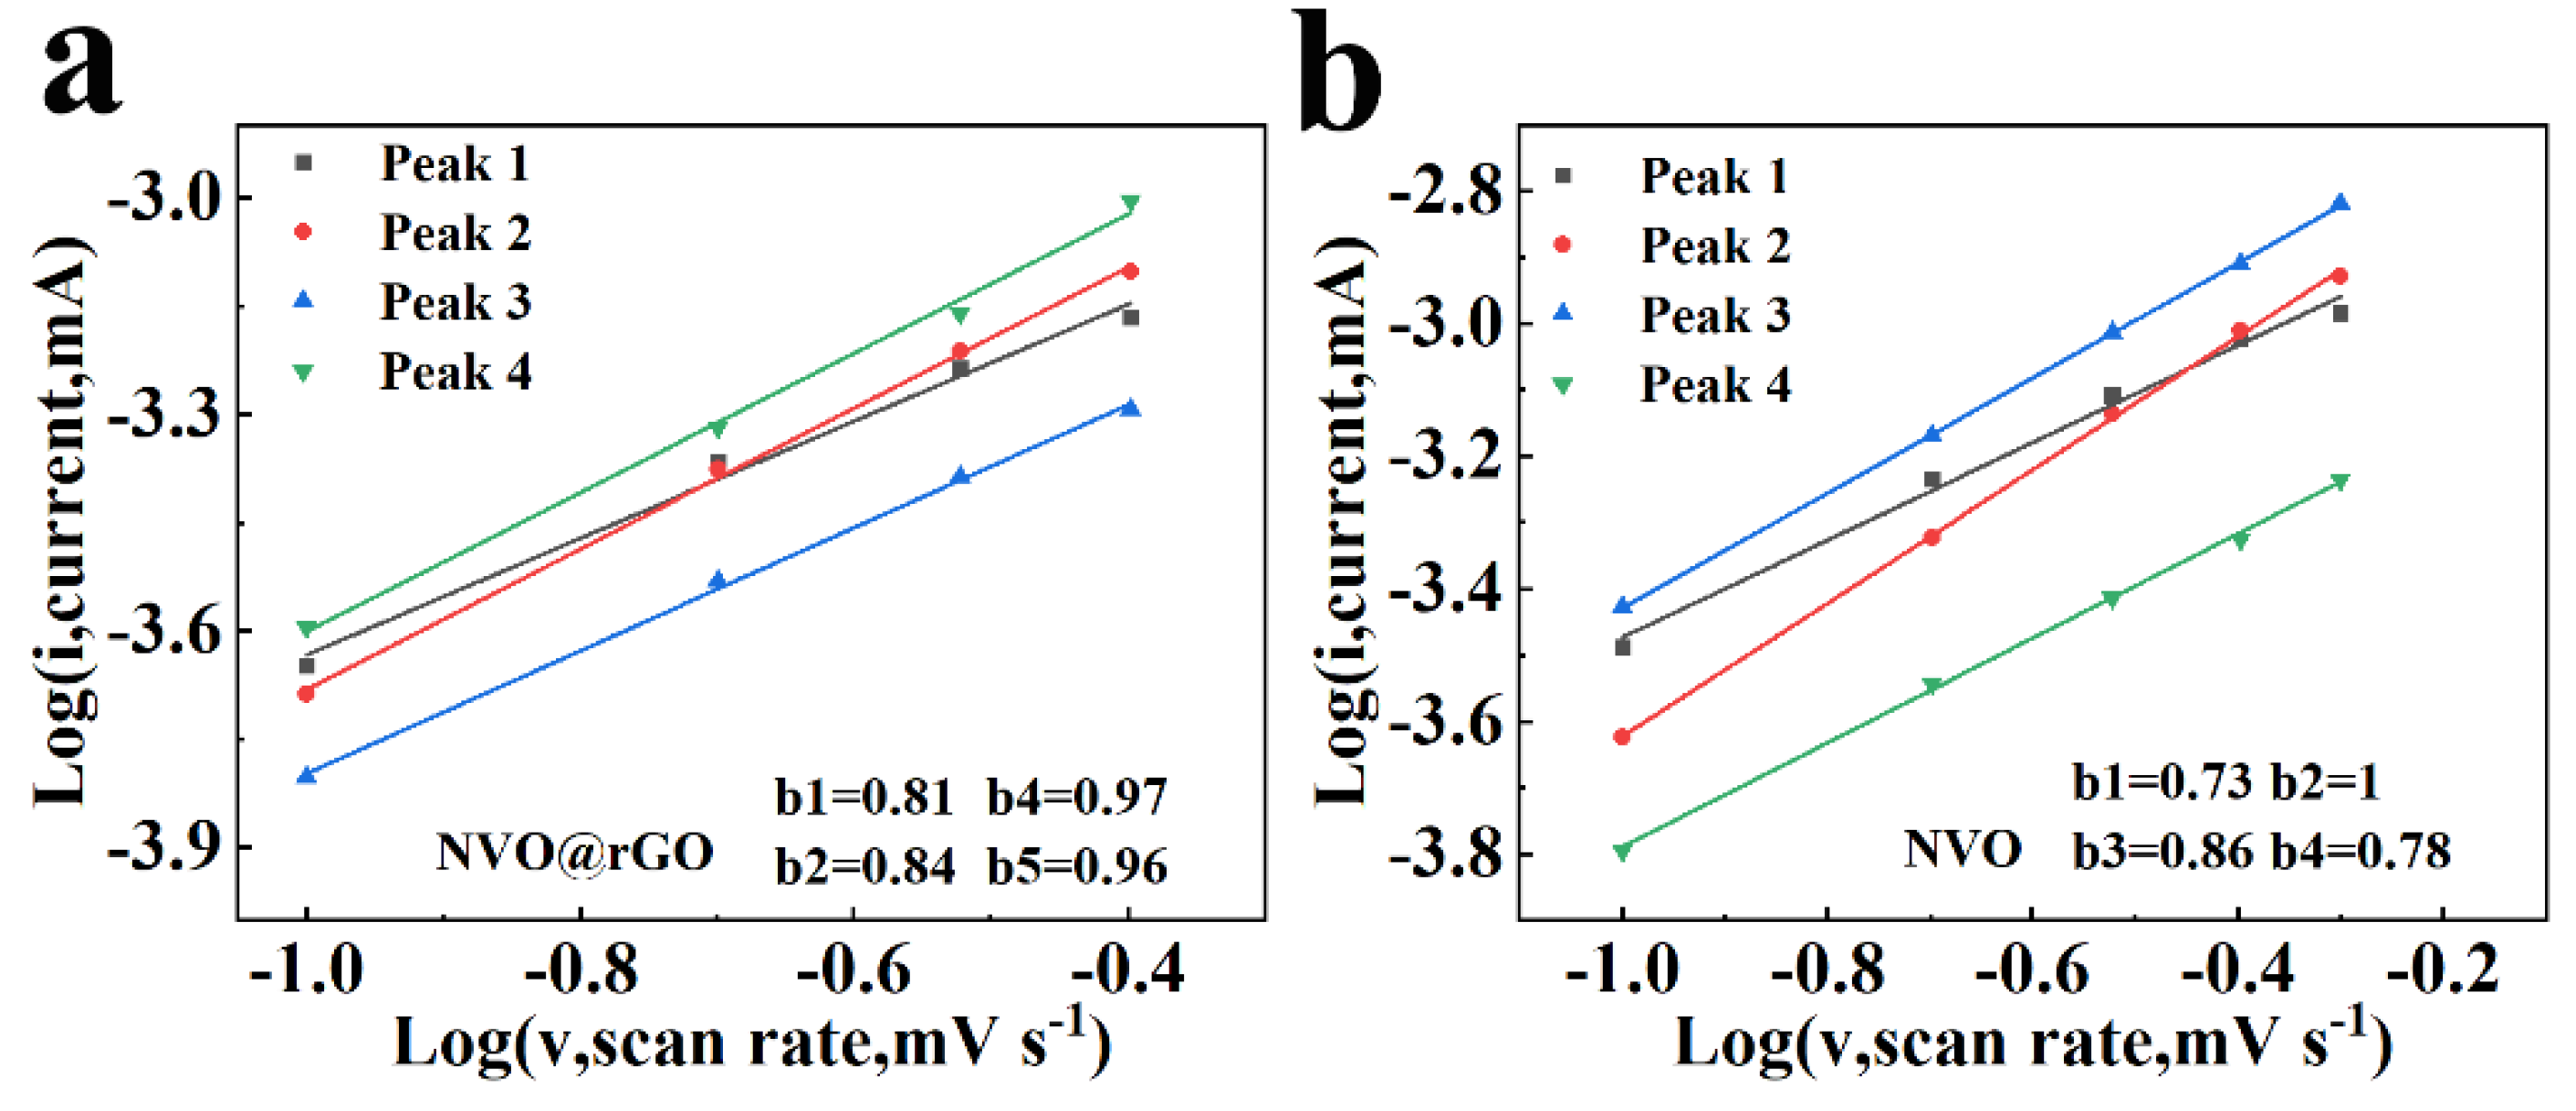
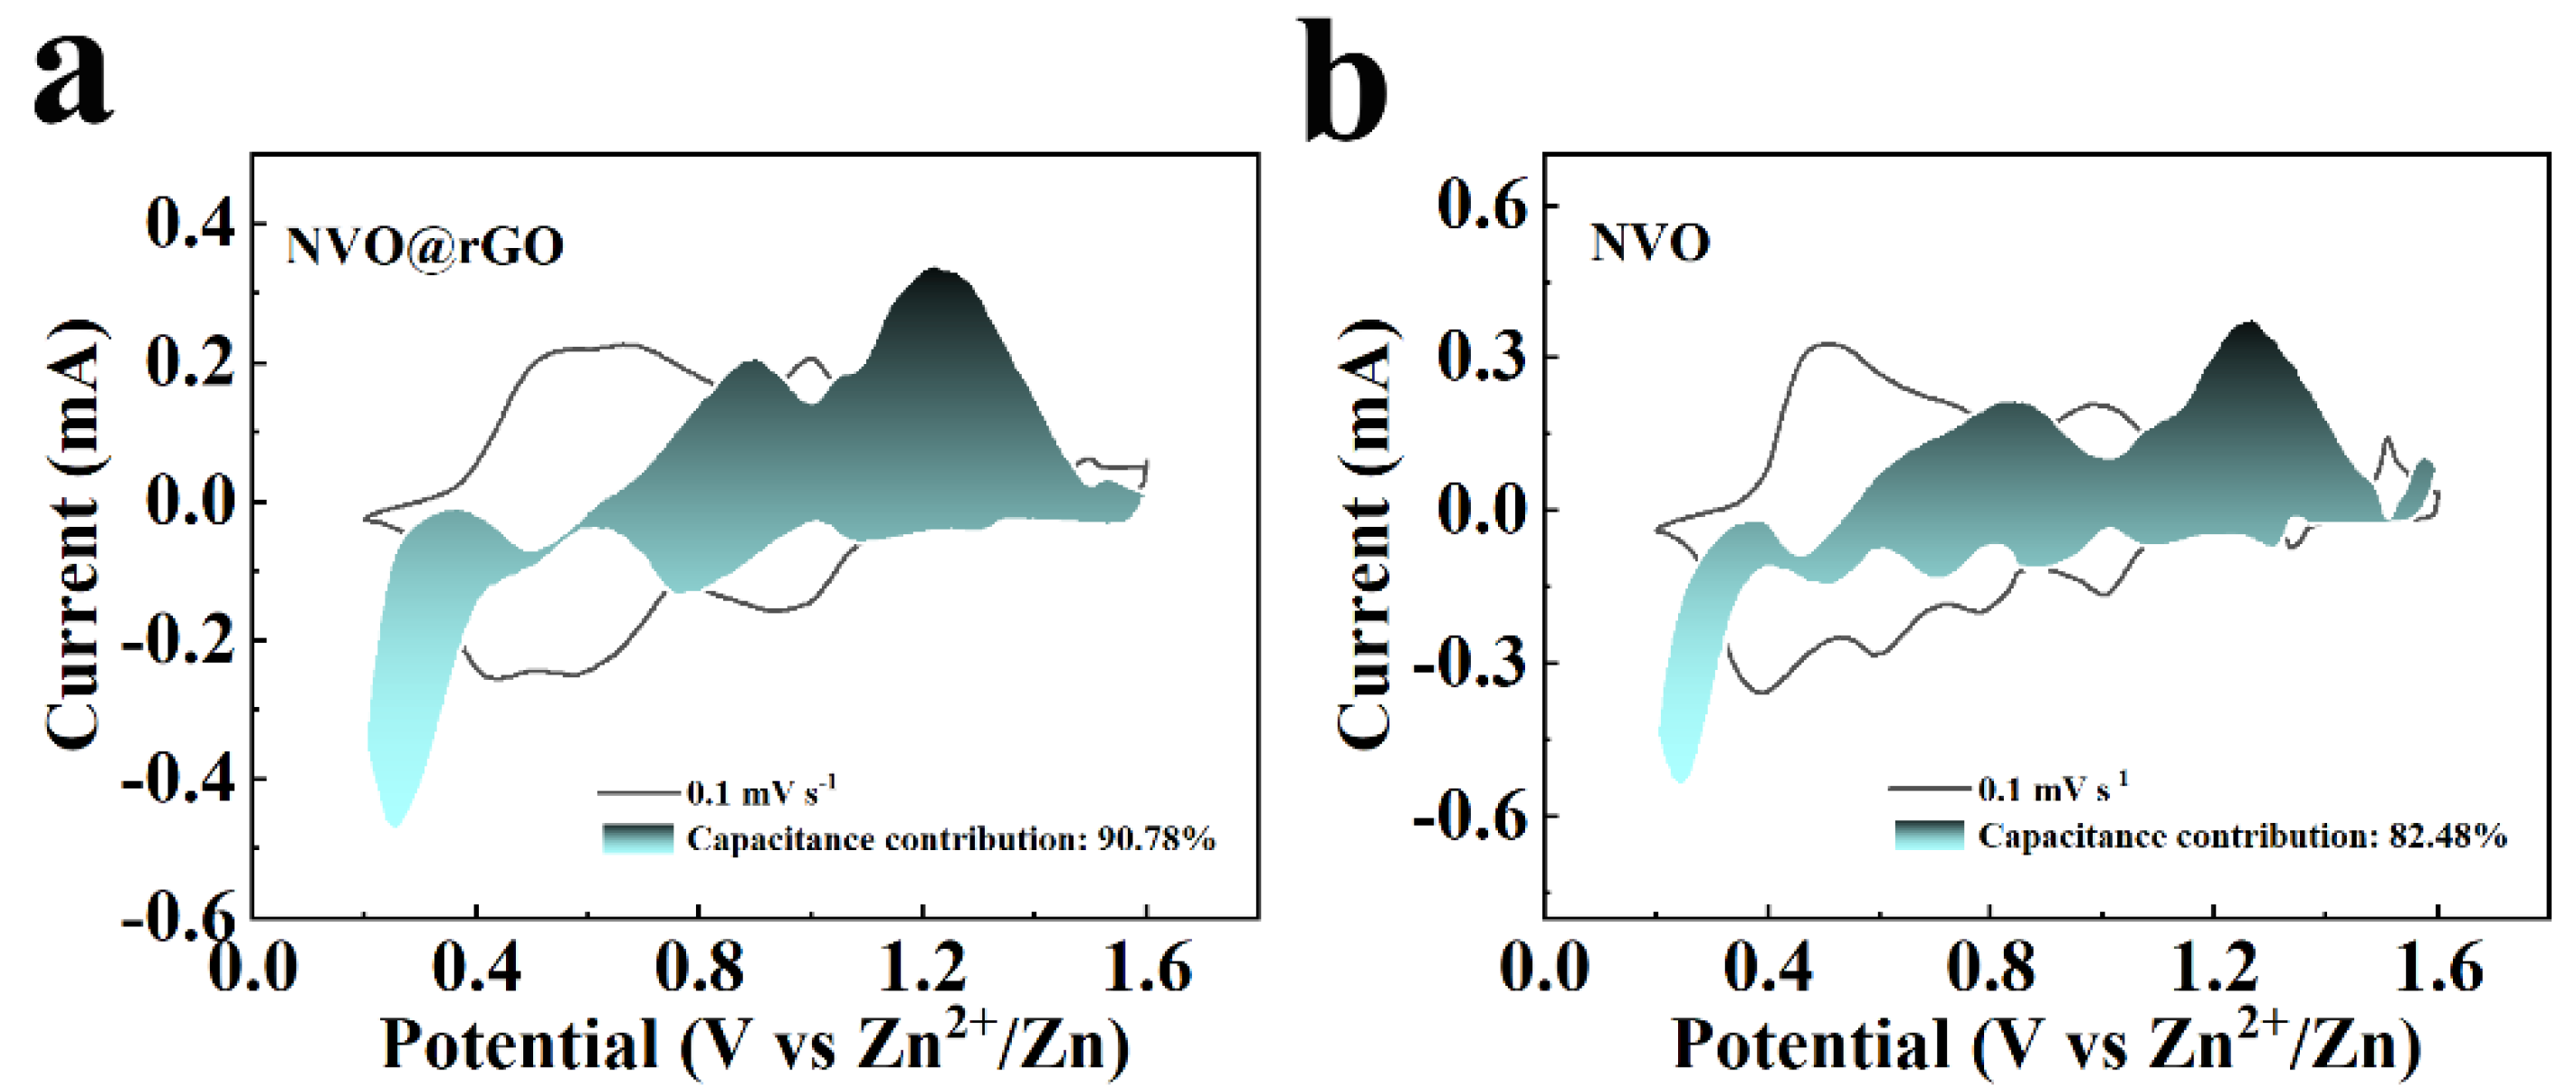
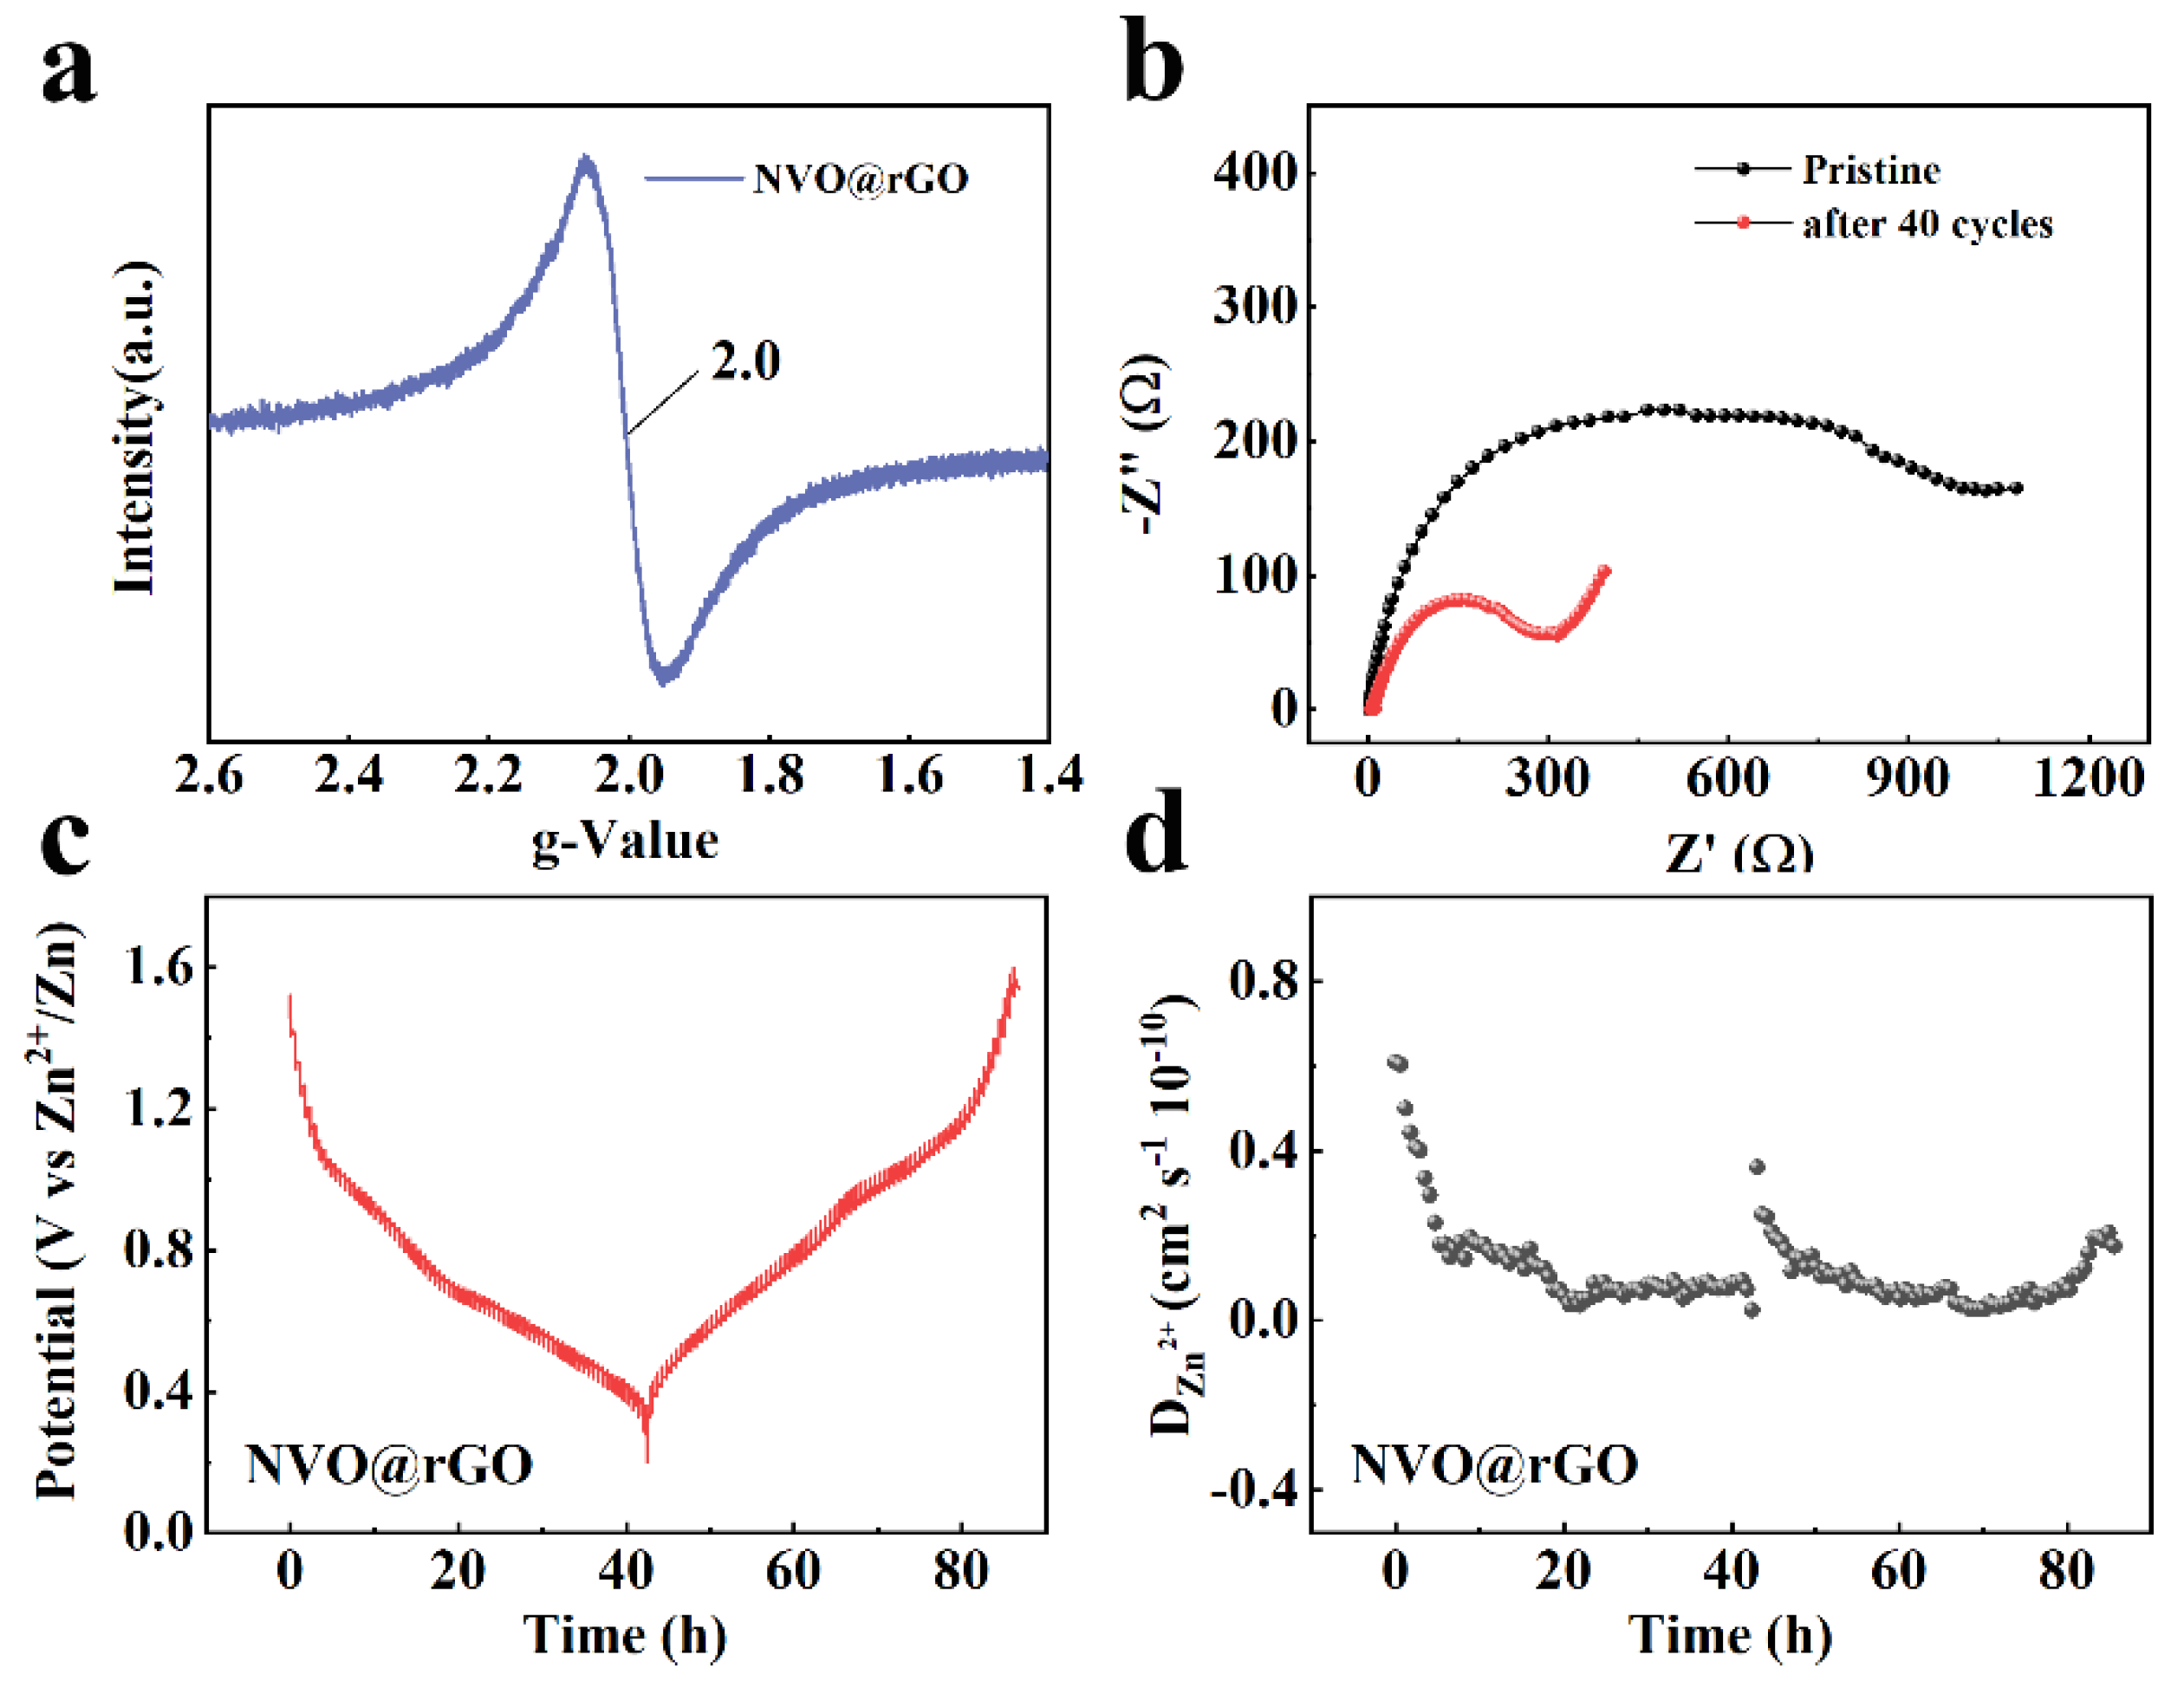
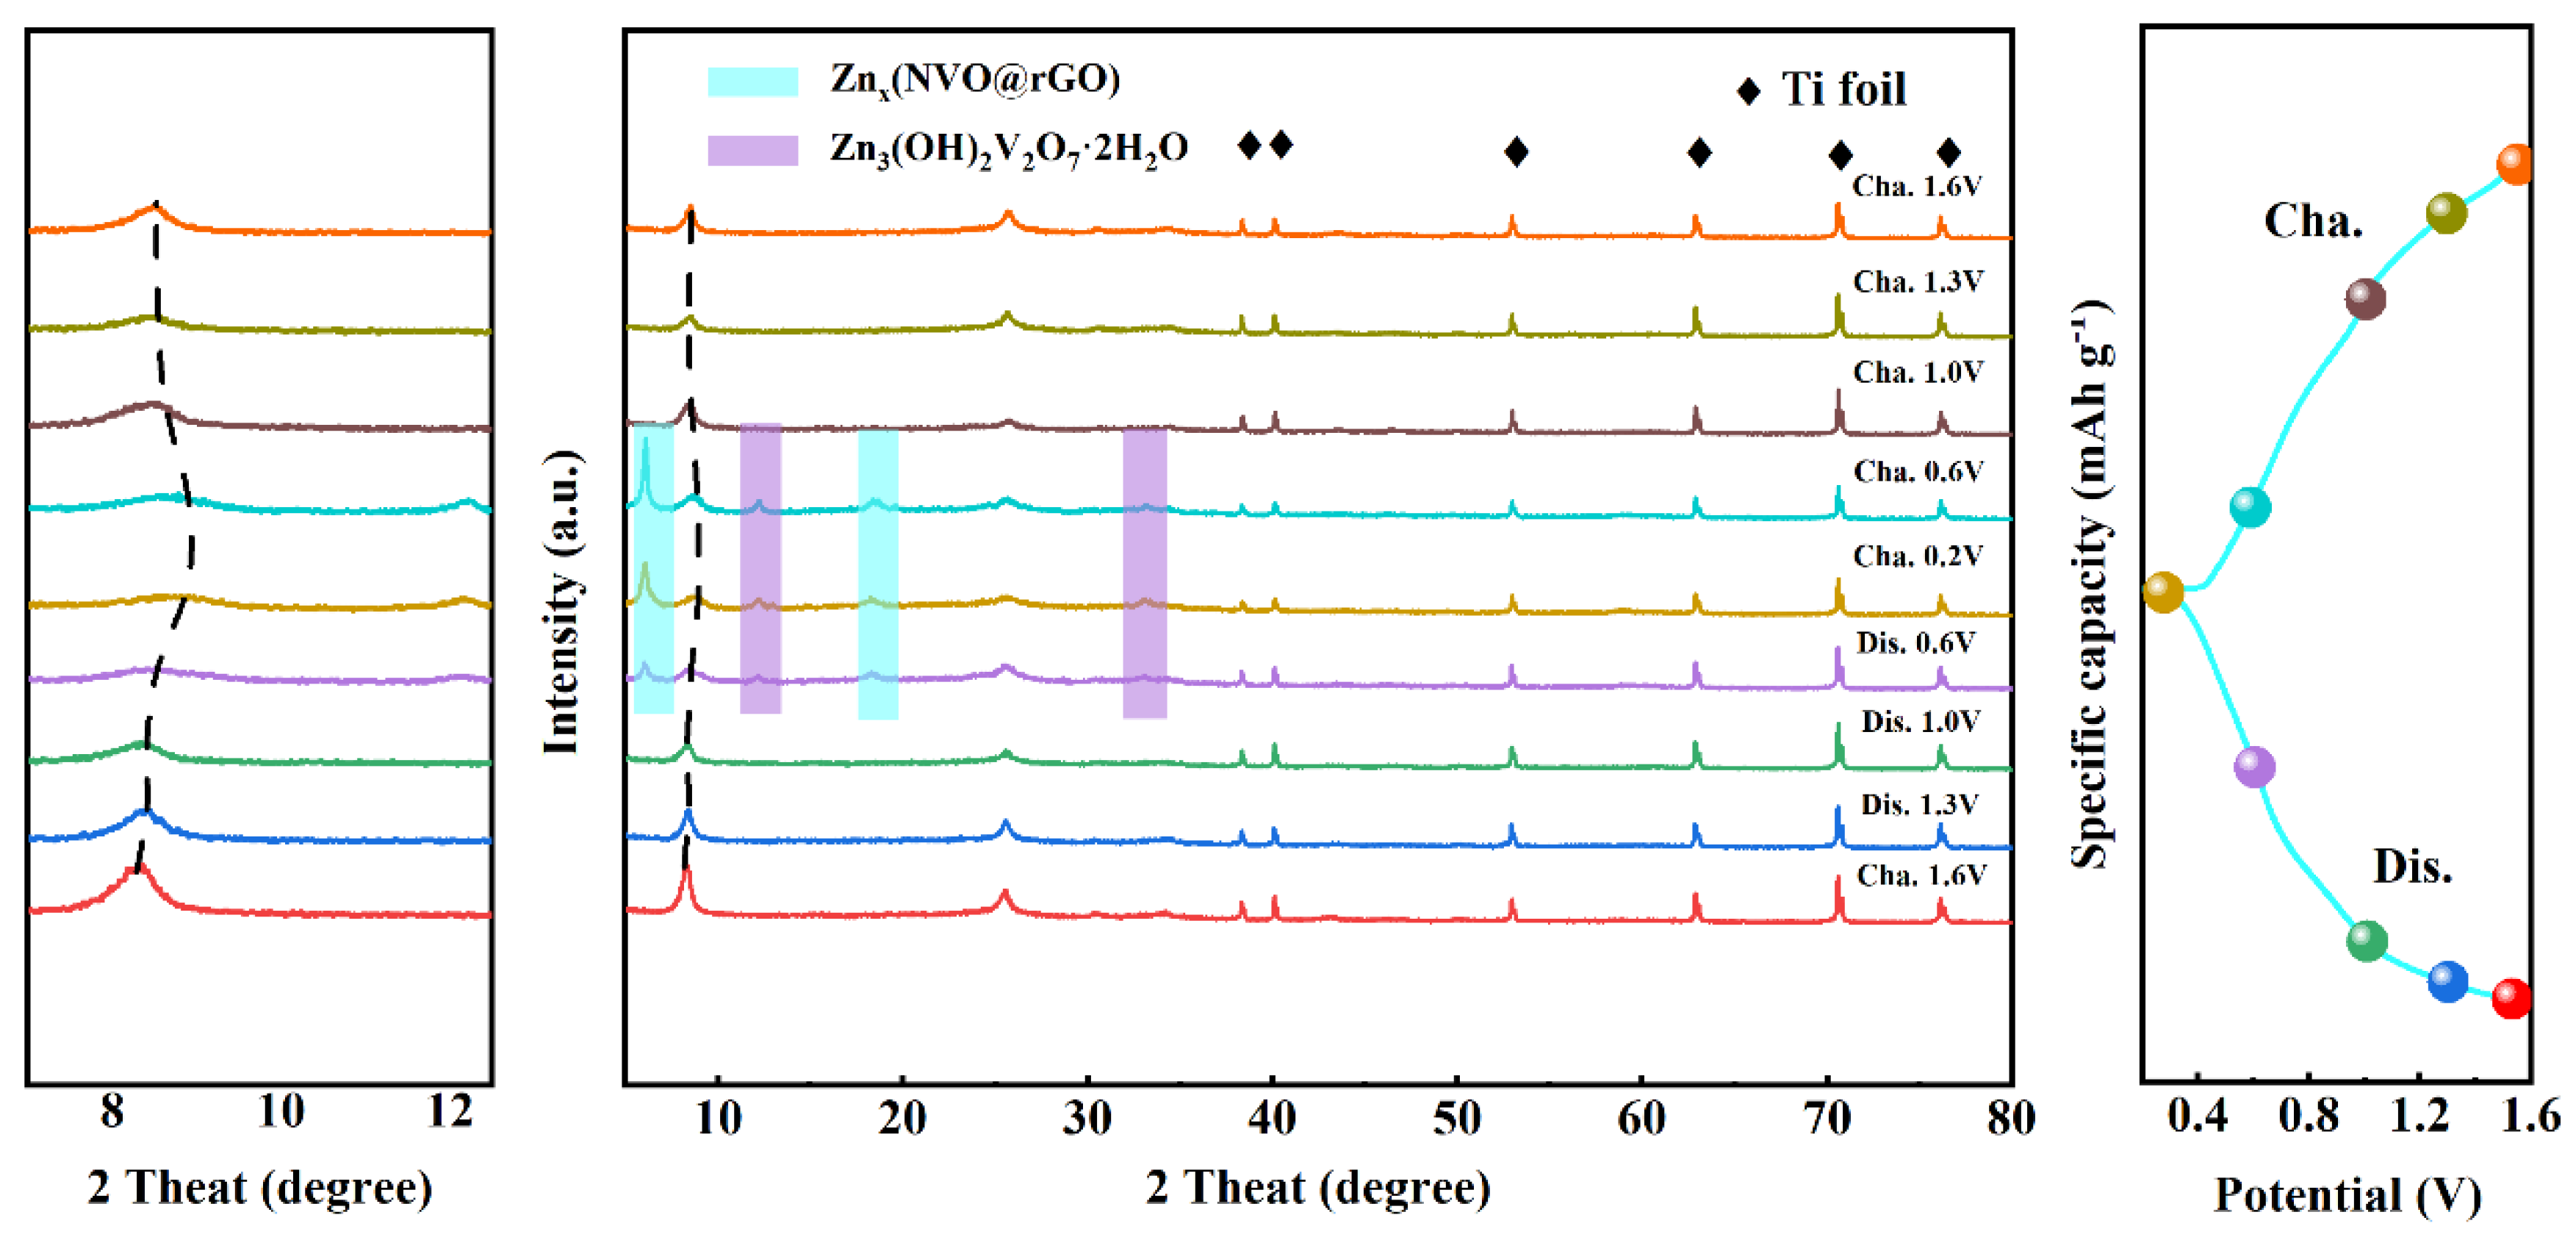
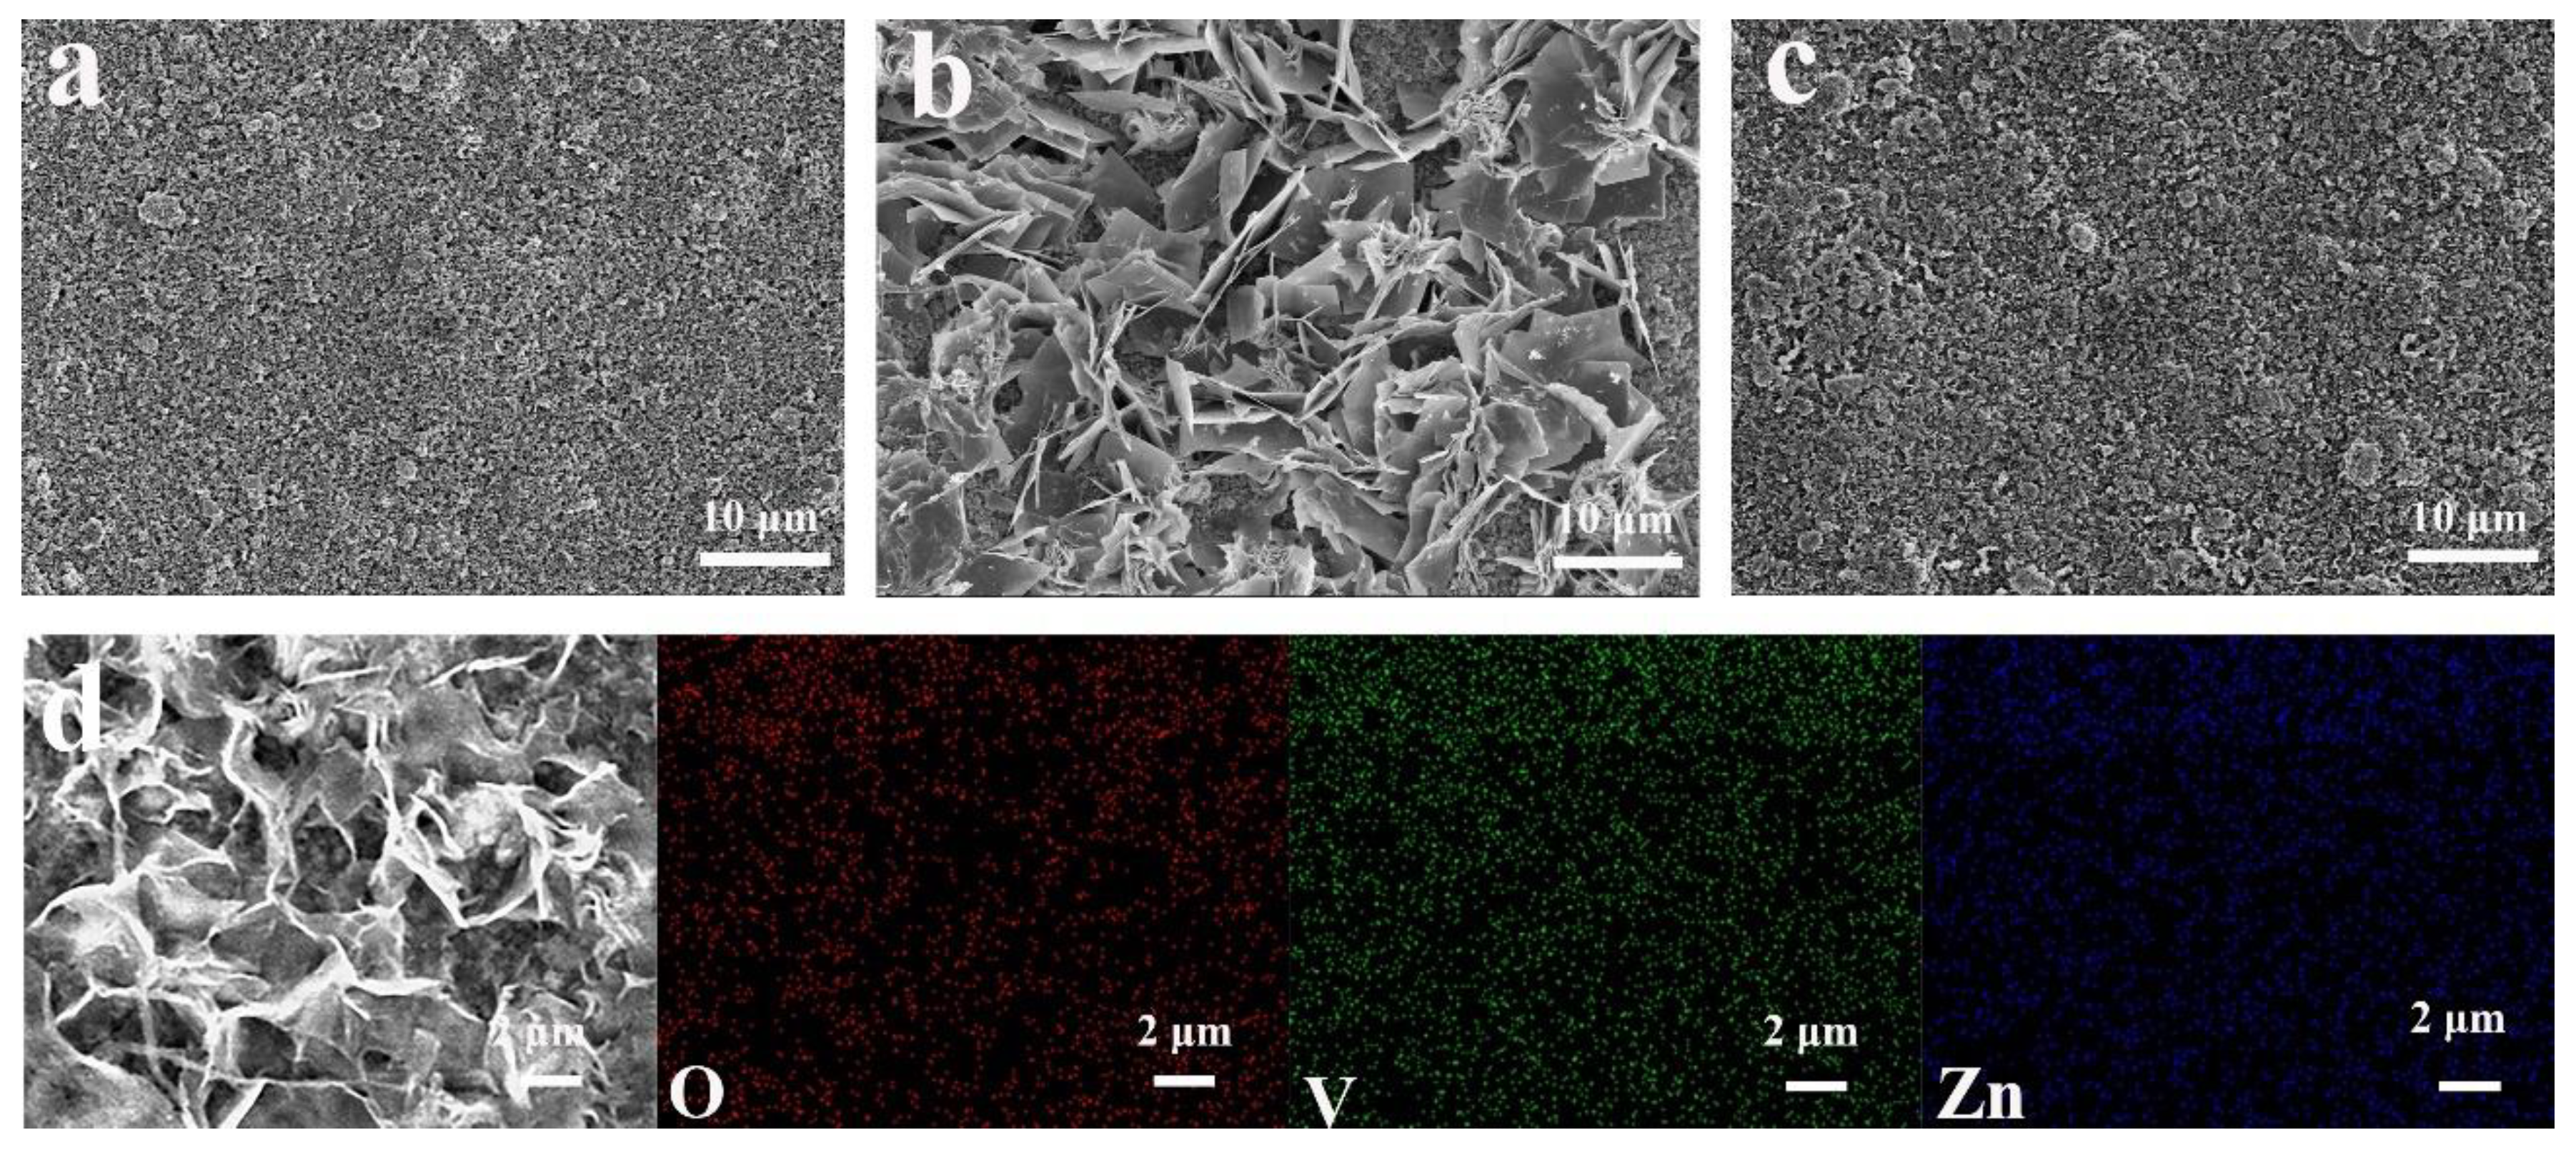
| Cathode materials | Electrochemical performance (Capacity retention, cycle numbers) |
Reference |
|---|---|---|
| NVO@rGO | 506.9mAh g–1 at 0.2 A g–1 (100%, 50 cycles) | This work |
| (NH4)0.37V2O5·0.15H2O | 398 mAh g–1 at 0.5 A g–1 (90%, 50 cycles) | [26] |
| KNH4V4O10 | 405 mAh g–1 at 0.4 A g–1 (92.1%, 100 cycles) | [27] |
| Cs-V2O5 | 368.5 mAh g–1 at 0.1 A g–1 (90%, 200 cycles) | [28] |
| (NH4)xV2O5·nH2O | 372 mAh g–1 at 0.1 A g–1 (63%, 50 cycles) | [29] |
| Zn3V2MoO8 | 336.7 mAh g–1 at 0.2 A g–1 (90%, 70 cycles) | [30] |
| NaCaV2O5 | 310 mAh g–1 at 0.5A g–1 (100%, 200 cycles) | [31] |
| (NH4)2V4O9 | 493 mAh g–1 at 0.2 A g–1 (83.2%, 100 cycles) | [32] |
| V3O7/V6O13 | 415 mAh g–1 at 0.1 A g–1 (73%, 100 cycles) | [33] |
| Na2V6O16·3H2O | 401.1 mAh g–1 at 0.3 A g–1 (91.8%, 300 cycles) | [34] |
| Od-HNaVO@rGO | 380.4 mAh g–1 at 0.5 A g–1 (97.4%, 200 cycles) | [35] |
Disclaimer/Publisher’s Note: The statements, opinions and data contained in all publications are solely those of the individual author(s) and contributor(s) and not of MDPI and/or the editor(s). MDPI and/or the editor(s) disclaim responsibility for any injury to people or property resulting from any ideas, methods, instructions or products referred to in the content. |
© 2024 by the authors. Licensee MDPI, Basel, Switzerland. This article is an open access article distributed under the terms and conditions of the Creative Commons Attribution (CC BY) license (http://creativecommons.org/licenses/by/4.0/).


