
Submitted:
02 May 2024
Posted:
03 May 2024
Read the latest preprint version here
Abstract
Abstract
Background: Analysis of different type of consolidation in dogs and cats relay on parenchymal and vascular criteria.
Hypothesis: the vascular criteria of the consolidation it’s possible to perform in dogs and cats and vascularisation is different in shred, tissue, nodule, wedge sign and mass.
Animals: 347 cats and 634 dogs with different types of consolidations.
Methods: Retrospective study between 2018-2023. Lung ultrasound performed in dogs and cats with different types of consolidations. Characteristic of bronchogram: air dynamic and static bronchogram, fluid bronchogram or absence of bronchogram. Types of vascularisations in consolidation: tree like type, residual, chaotic vascularisation and penetrating from the chest wall to consolidation and “vascular sign”.
Conclusion and Clinical Importance: Analysis of bronchogram and type of vascularisation in consolidation is possible to perform in dogs and cat. The analysis of mentioned criteria had an impact on subsequent diagnostic and therapeutic decisions
Keywords:
consolidation
; color doppler
; bronchogram
; vascularity
Introduction
Universality of ultrasound examination and the availability of devices, as well as the popularization of the point of care ultrasonography (POCUS) examination lung ultrasound (LUS) is rapidly evolving diagnostic modality available for the diagnosis of the most common pathologies in the lungs. In veterinary medicine LUS is not well studied, and there are only a few studies describing the utility of LUS for the diagnosis of parenchymal lung diseases associated with lung consolidations in small animal patient [1,2,3,4]. There is no information in veterinary medicine about color doppler analysis of the consolidation and the impact of doppler findings to clinical decision except one case report [5]. This imaging modality has been thoroughly studied in human medicine and is considered an important tool for increasing the diagnostic accuracy in dyspneic patients [6]. According to newly published guidelines, LUS it’s the first diagnostic approach in patients with acute dyspnea, should include thoracic ultrasound [7,8,9]. It allows differential diagnosis between potentially life-threatening conditions such as pulmonary edema and bronchopneumonia, including moderate, severe, and critical lung injury[6,10,11]. LUS plays an important role in many fields, from emergency and intensive care through cardiology, internal medicine, pediatrics, and neonatology [12,13]. Its sensitivity and specificity are comparable with computed tomography (CT) of the chest and exceed that of thoracic radiography (TXR) [13]. Guidelines and publication about adults and children suggest that color doppler analysis can be beneficial if it’s possible to perform [8,14,15,16,17]. In veterinary medicine LUS is used as a POCUS and it’s a part of an emergency protocols for cats and dogs like VETBLUE ®, TFAST® or CALGARY PLUS and rodents RATTUS [18,19,20,21]. The emergency protocols are based on the shape of the consolidation and presence or absence of vertical artefacts without Doppler analysis of the consolidation [18]. In this retrospective study consolidation was analyzed using color Doppler, the so-called vascular criterion and the parenchymal criteria [13]. The analysis of mentioned criteria had an impact on subsequent diagnostic and therapeutic decisions [15].
Materials and Methods.
Between May 2018-2023 in “Vetcardia” veterinary cardiology clinic in Warsaw 45148 echocardiography and non-cardiac thoracic ultrasound was performed. In those examination lung consolidations were find 2157 cases of dogs, cats, guinea pigs, ferrets, and rabbits. From all cases 1066 with the best quality descriptions of consolidation and confirmed diagnosis was chosen. We exclude rabbits, ferrets and guinea pigs to have more homogeneous group and analysis was made on 981 animals, 347 cats and 634 dogs different breeds presented in Table 1. Echocardiography and LUS were performed by 6 veterinarians, 3 investigators with >15 years of experience in echocardiography (including KK, MG) and trained in LUS by human specialist (NB) 2 investigators >5 years in echocardiography and 1 investigator >2 years also trained by human specialist (NB).
All examinations we performed on machine GE VIVID IQ. Consolidations were examine using multifrequency linear probe. Two presets were used during the examination, first special “lung preset”. This preset has harmonics turned off, uses the lowest frequency of the probe (6 MHz) with persistence turned to zero, has a focal position set at the level of the pleural line, and uses an increased time gain compensation (TGC) at the distal (far) field of the screen [22,23,24]. Such settings create a “coarser” picture color doppler analysis of the consolidations was performed on this preset, with the Nyquist limit set at the level of 0.7m/s. For better visualization of consolidations, the preset was switched to a default “thyroid” preset. “Thyroid” preset has harmonics turned on, uses a higher dynamic range, and has spatial compound imaging turned on, resulting in a “smoother” image for a better depiction of the consolidation; the focus was set at the center of the consolidation. When using color doppler, the sector size was adjusted to the size of consolidation or its selected fragment to eliminate noise resulting from respiratory artifacts.
The lung ultrasound examination followed VetLus protocol [5]. It utilizes a horizontal sliding technique with the transducer placed at three different vertical locations on each side of the thorax at a level in line with: the middle of the scapula below the rib heads and epaxial muscles (dorsal line); the shoulder joint (at the level of the heart base, middle line); and just dorsal to sternebrae (ventral line). In this protocol the probe was rotated 90 degrees into a transverse plane to give an image of a continuous pleural line without rib shadows, which were visible in the frontal plane [25]. That can be beneficial if part of the consolidation hides in the area where the ultrasonic beam is attenuated by the shadows of the ribs [5,25,26].
The animals were examined in the sternal or side lying position, standing or sitting, depending on the severity of dyspnea. The alcohol and gel were used as a coupling agent. All consolidation were classified using two criteria: parenchymal and vascular [5,27,28]. The consolidation was classified by size - width and depth. Width was the diameter parallel to the pleura line and depth was the distance between the pleura line and the far border of consolidation. The consolidations were classified by operators to different category of shape relay on previous publication from the human and veterinary medicine: shred (S), tissue (T), wedge (W), nodule (N) and additional category mass (M)[18,29]. Nodule we described as round hypoechogenic consolidation in contrast to mass which was also the same shape consolidation but with heterogeneous echogenicity. In some cases, where few types of consolidation were found and they were classified as complex findings for example: tissue and mass (T/M), shred and nodule (S/N) and other combinations presented in Table 2. Consolidations were described with presence and type of bronchograms. Types of bronchogram include dynamic air bronchogram (Db), static air bronchogram (Sb) and fluid bronchogram (Fb) additional type was absence of bronchogram (Ab). Dynamic air bronchogram is visible in inspiration and disappears on expiration, static air bronchogram represents the presence of air in the bronchial tree and is visible though all breathing phase, fluid bronchogram presence the fluid in bronchial tree [8]. Absence of bronchogram was described when there was no visible anatomical structure of the bronchus in the consolidation. In some cases, were few types of bronchogram were described in one consolidation then in the statistical analysis they were described like complex findings for example: dynamic and static air bronchogram (Db/Sb), fluid and absence of bronchogram (Fb/Ab) and other combinations presented in Table 3.
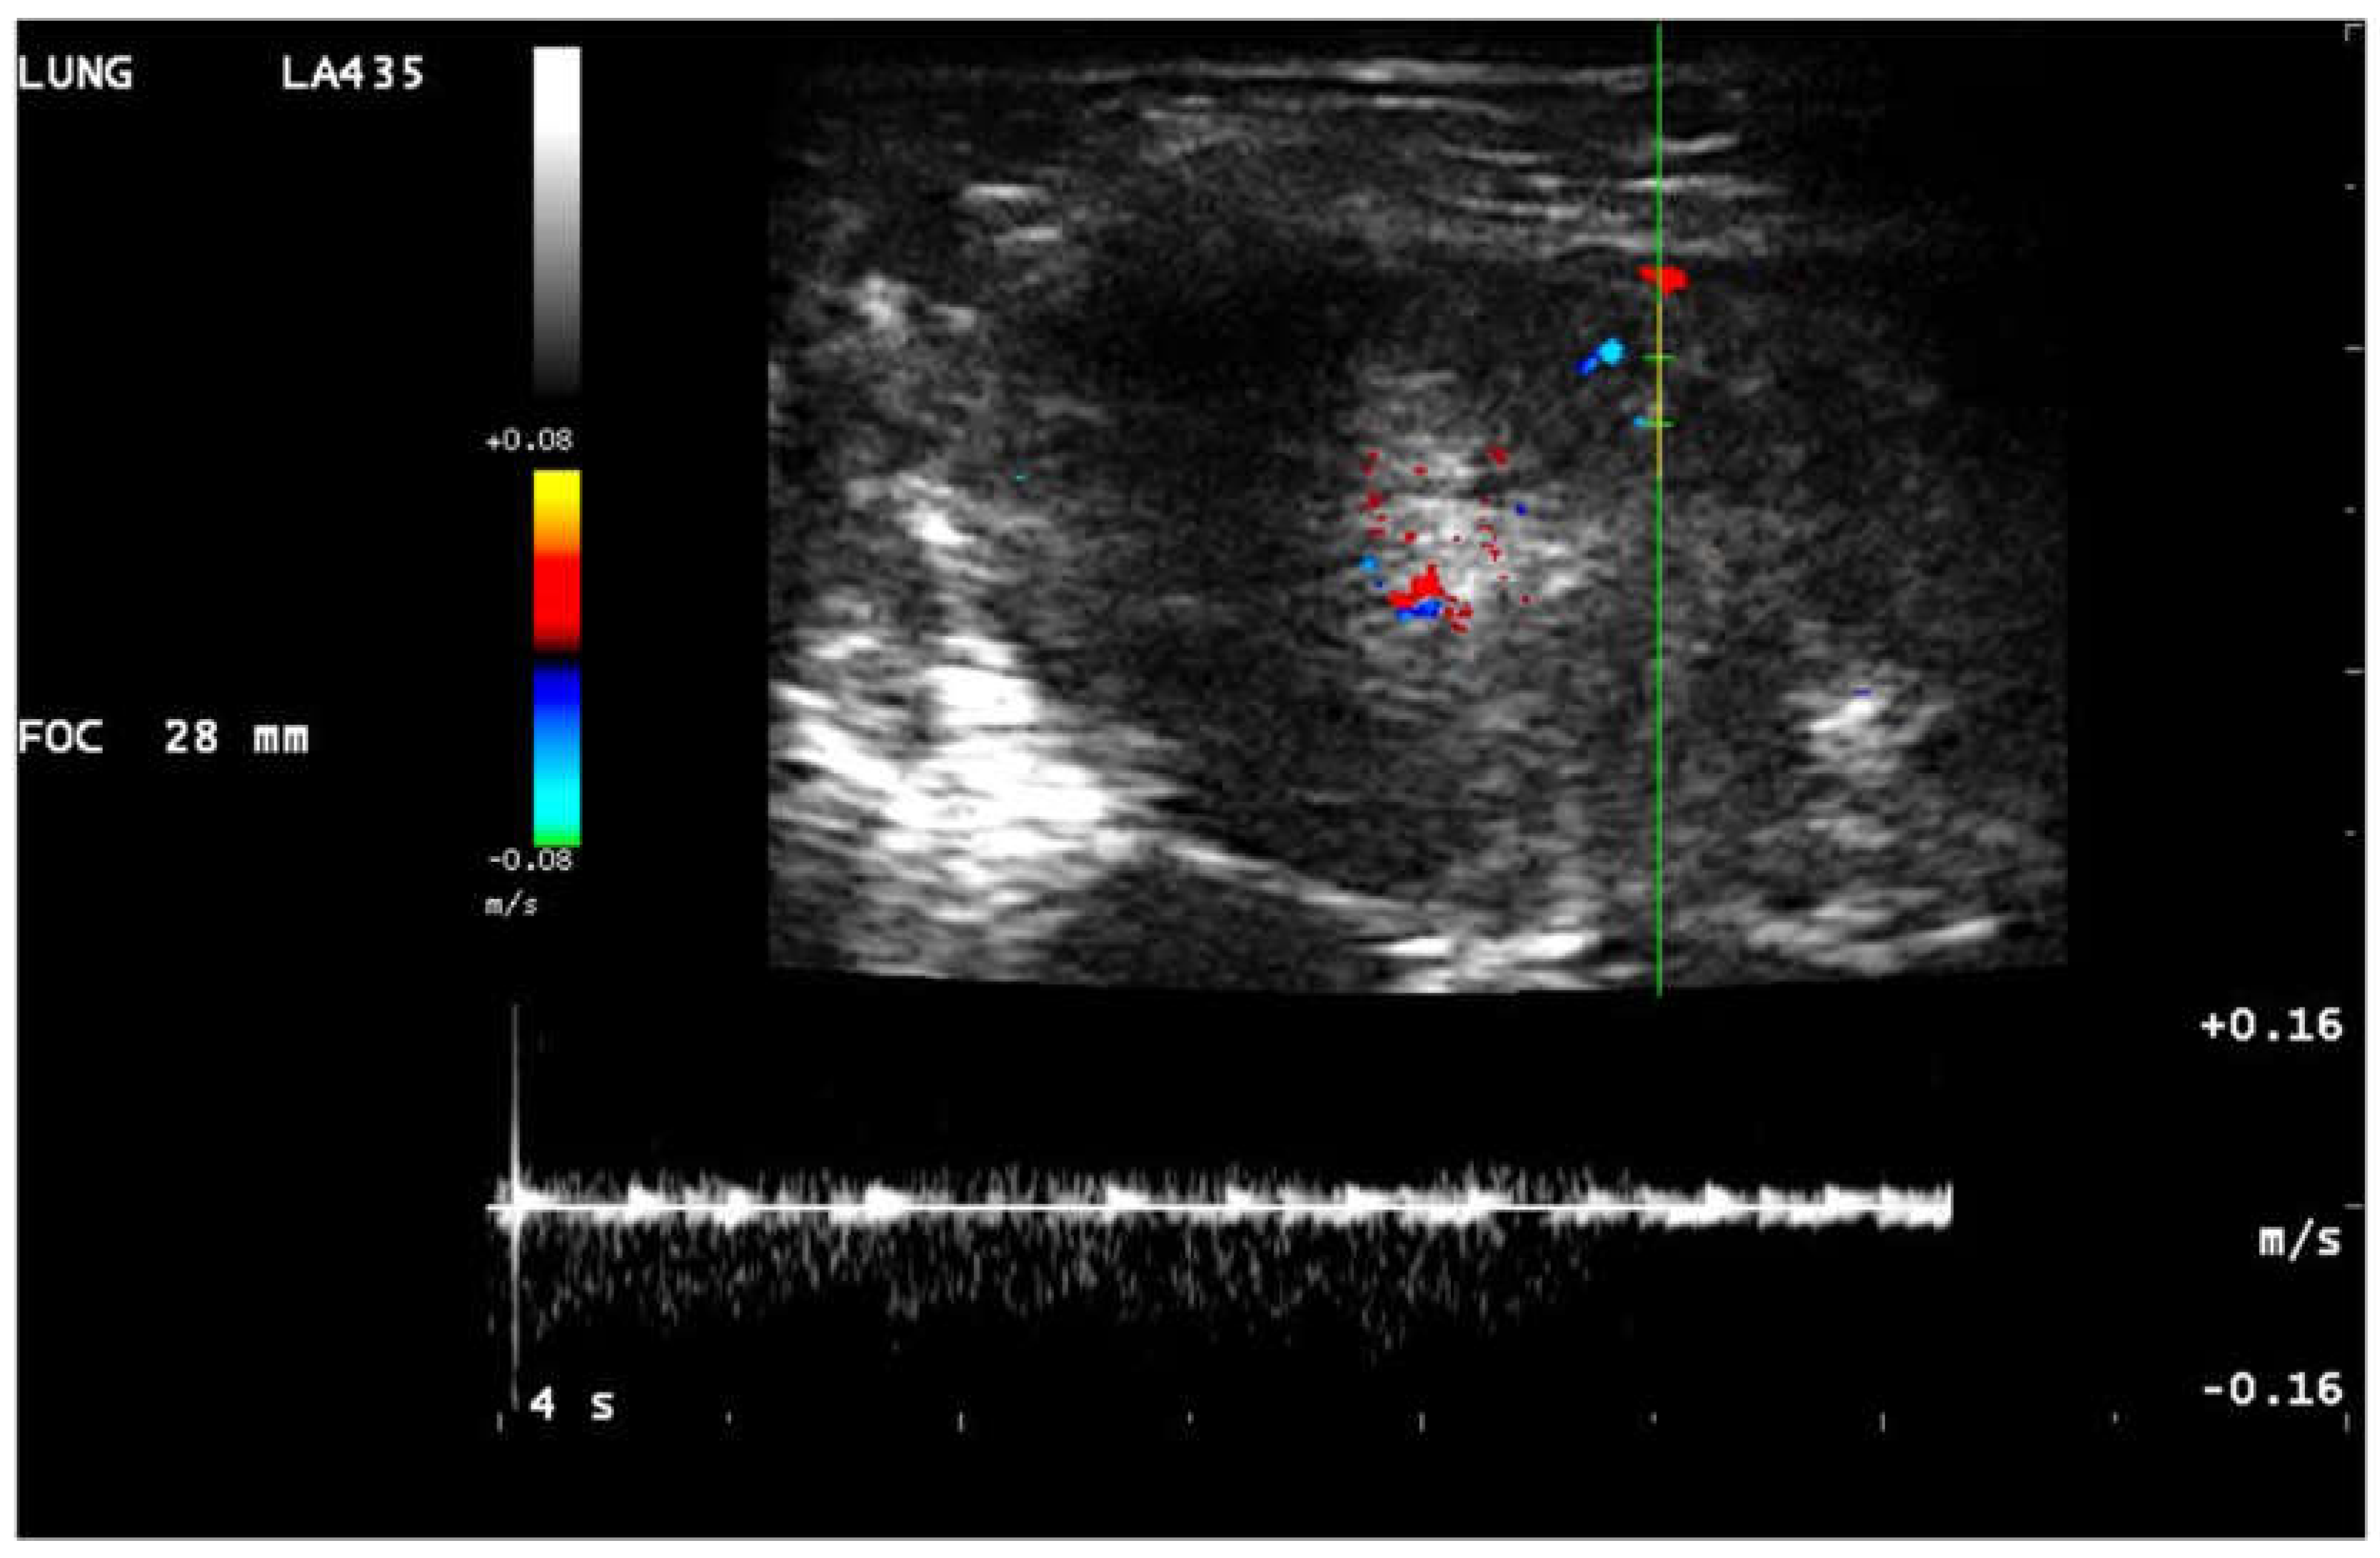
The color doppler analysis based on the presence or absence of the blood flow in consolidation and the shape of the vascularization [30,31]. In consolidations five types of vascularization was found: anatomical tree (Tv) like vascularization - Figure 1, Movie 1, residual vascularization (Rv) - Figure 2, Movie 2, chaotic (Hv) vascularization – Figure 3, vascularization penetrating (Pv) inside the consolidation from the chest wall – Movie 3 and amputation of the blood flow so called “vascular sign” (Vs) – Movie 4 [5,15,17,27,28,31]. The “vascular sign” is believed to result from the occlusion of a vessel by embolic material [5,31,32]. Abrupt cessation of blood flow at the “tip” of the consolidation can be seen in color doppler. For differentiation the residual from the chaotic vascularization in some cases the pulsed wave doppler was performed [17]. Chaotic vascularization in pulsed wave doppler in human medicine is low resistant continuous flow (Figure 4), pulmonary artery or bronchial artery flow is high resistant and coordinated with the heart rate [16,28,30] (Figure 5).
Figure 1. Linear probe, lung preset. Still image, color doppler imaging of the anatomical tree like vascularisation (→) in dog with pneumonia.
Figure 2.
Linear probe, lung preset. Still image, color doppler imaging of the residual vascularisation (→) in consolidation.
Figure 2.
Linear probe, lung preset. Still image, color doppler imaging of the residual vascularisation (→) in consolidation.
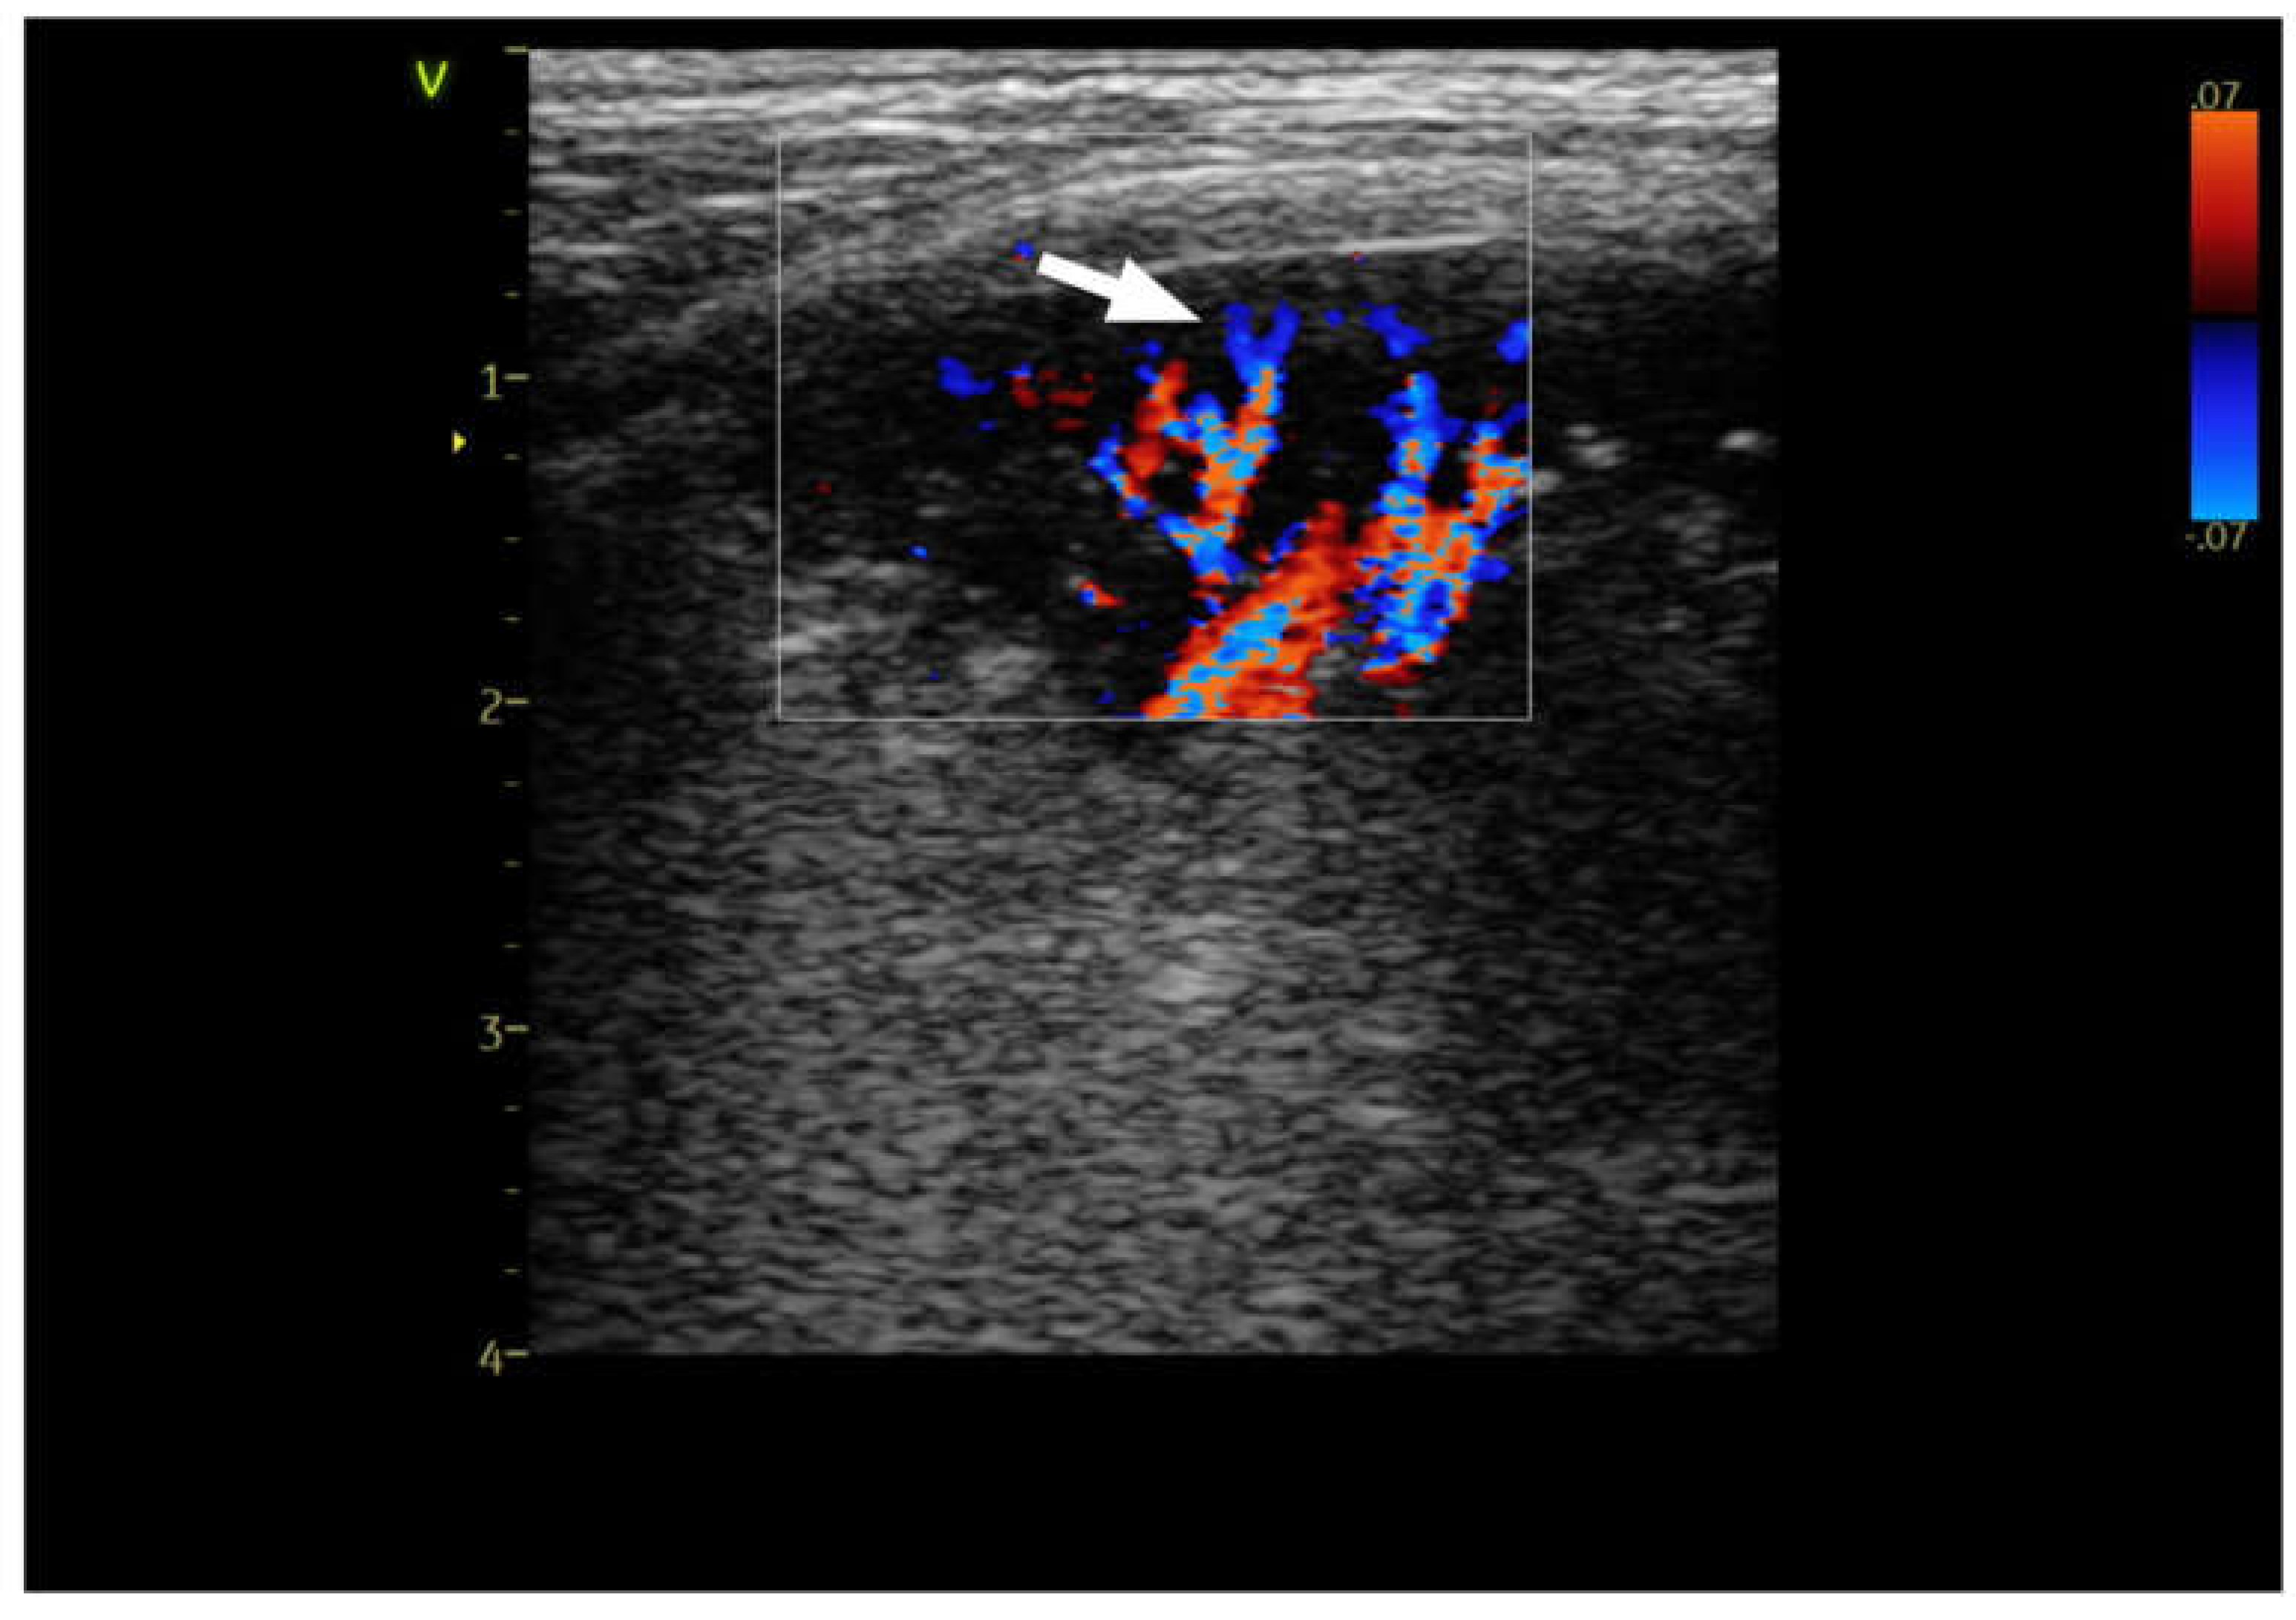
Figure 3.
Linear probe, thyroid preset. Still image, color doppler imaging of the chaotic vascularisation (→) in consolidation.
Figure 3.
Linear probe, thyroid preset. Still image, color doppler imaging of the chaotic vascularisation (→) in consolidation.
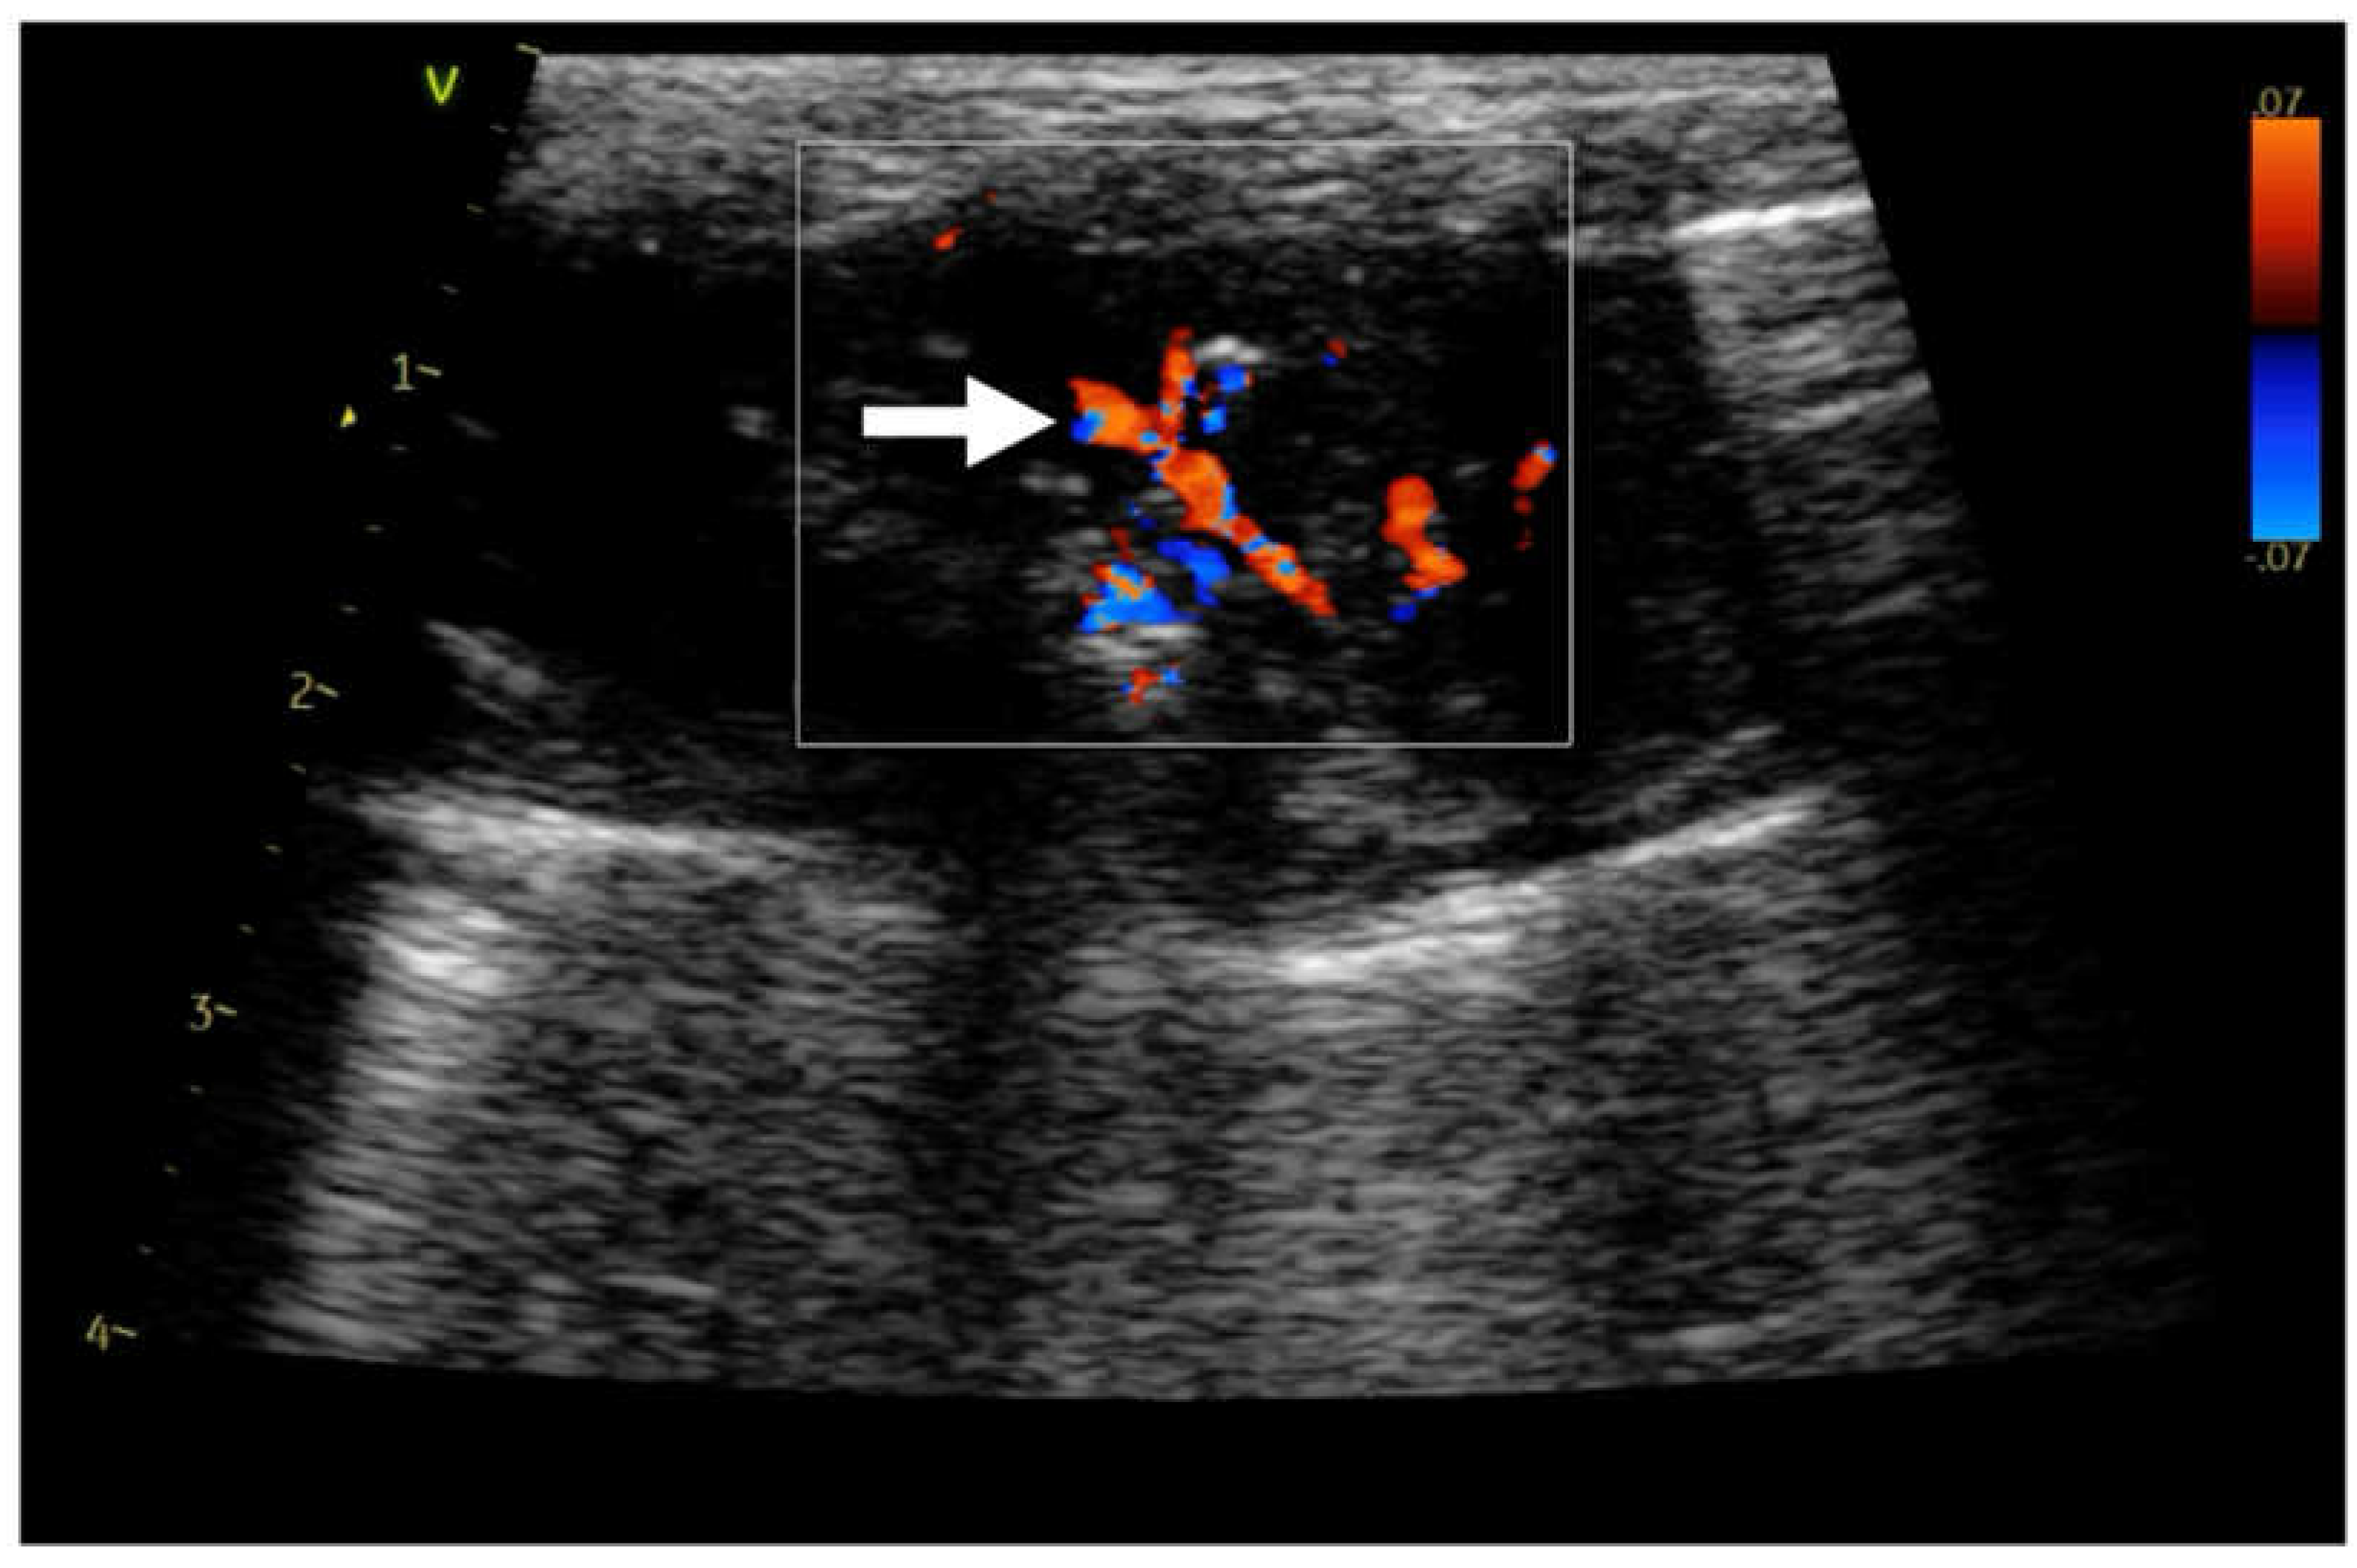
Figure 4.
Linear probe, lung preset. Still image, color doppler and pulsed wave doppler imaging of the flow in consolidation. Neovascularisation.
Figure 4.
Linear probe, lung preset. Still image, color doppler and pulsed wave doppler imaging of the flow in consolidation. Neovascularisation.
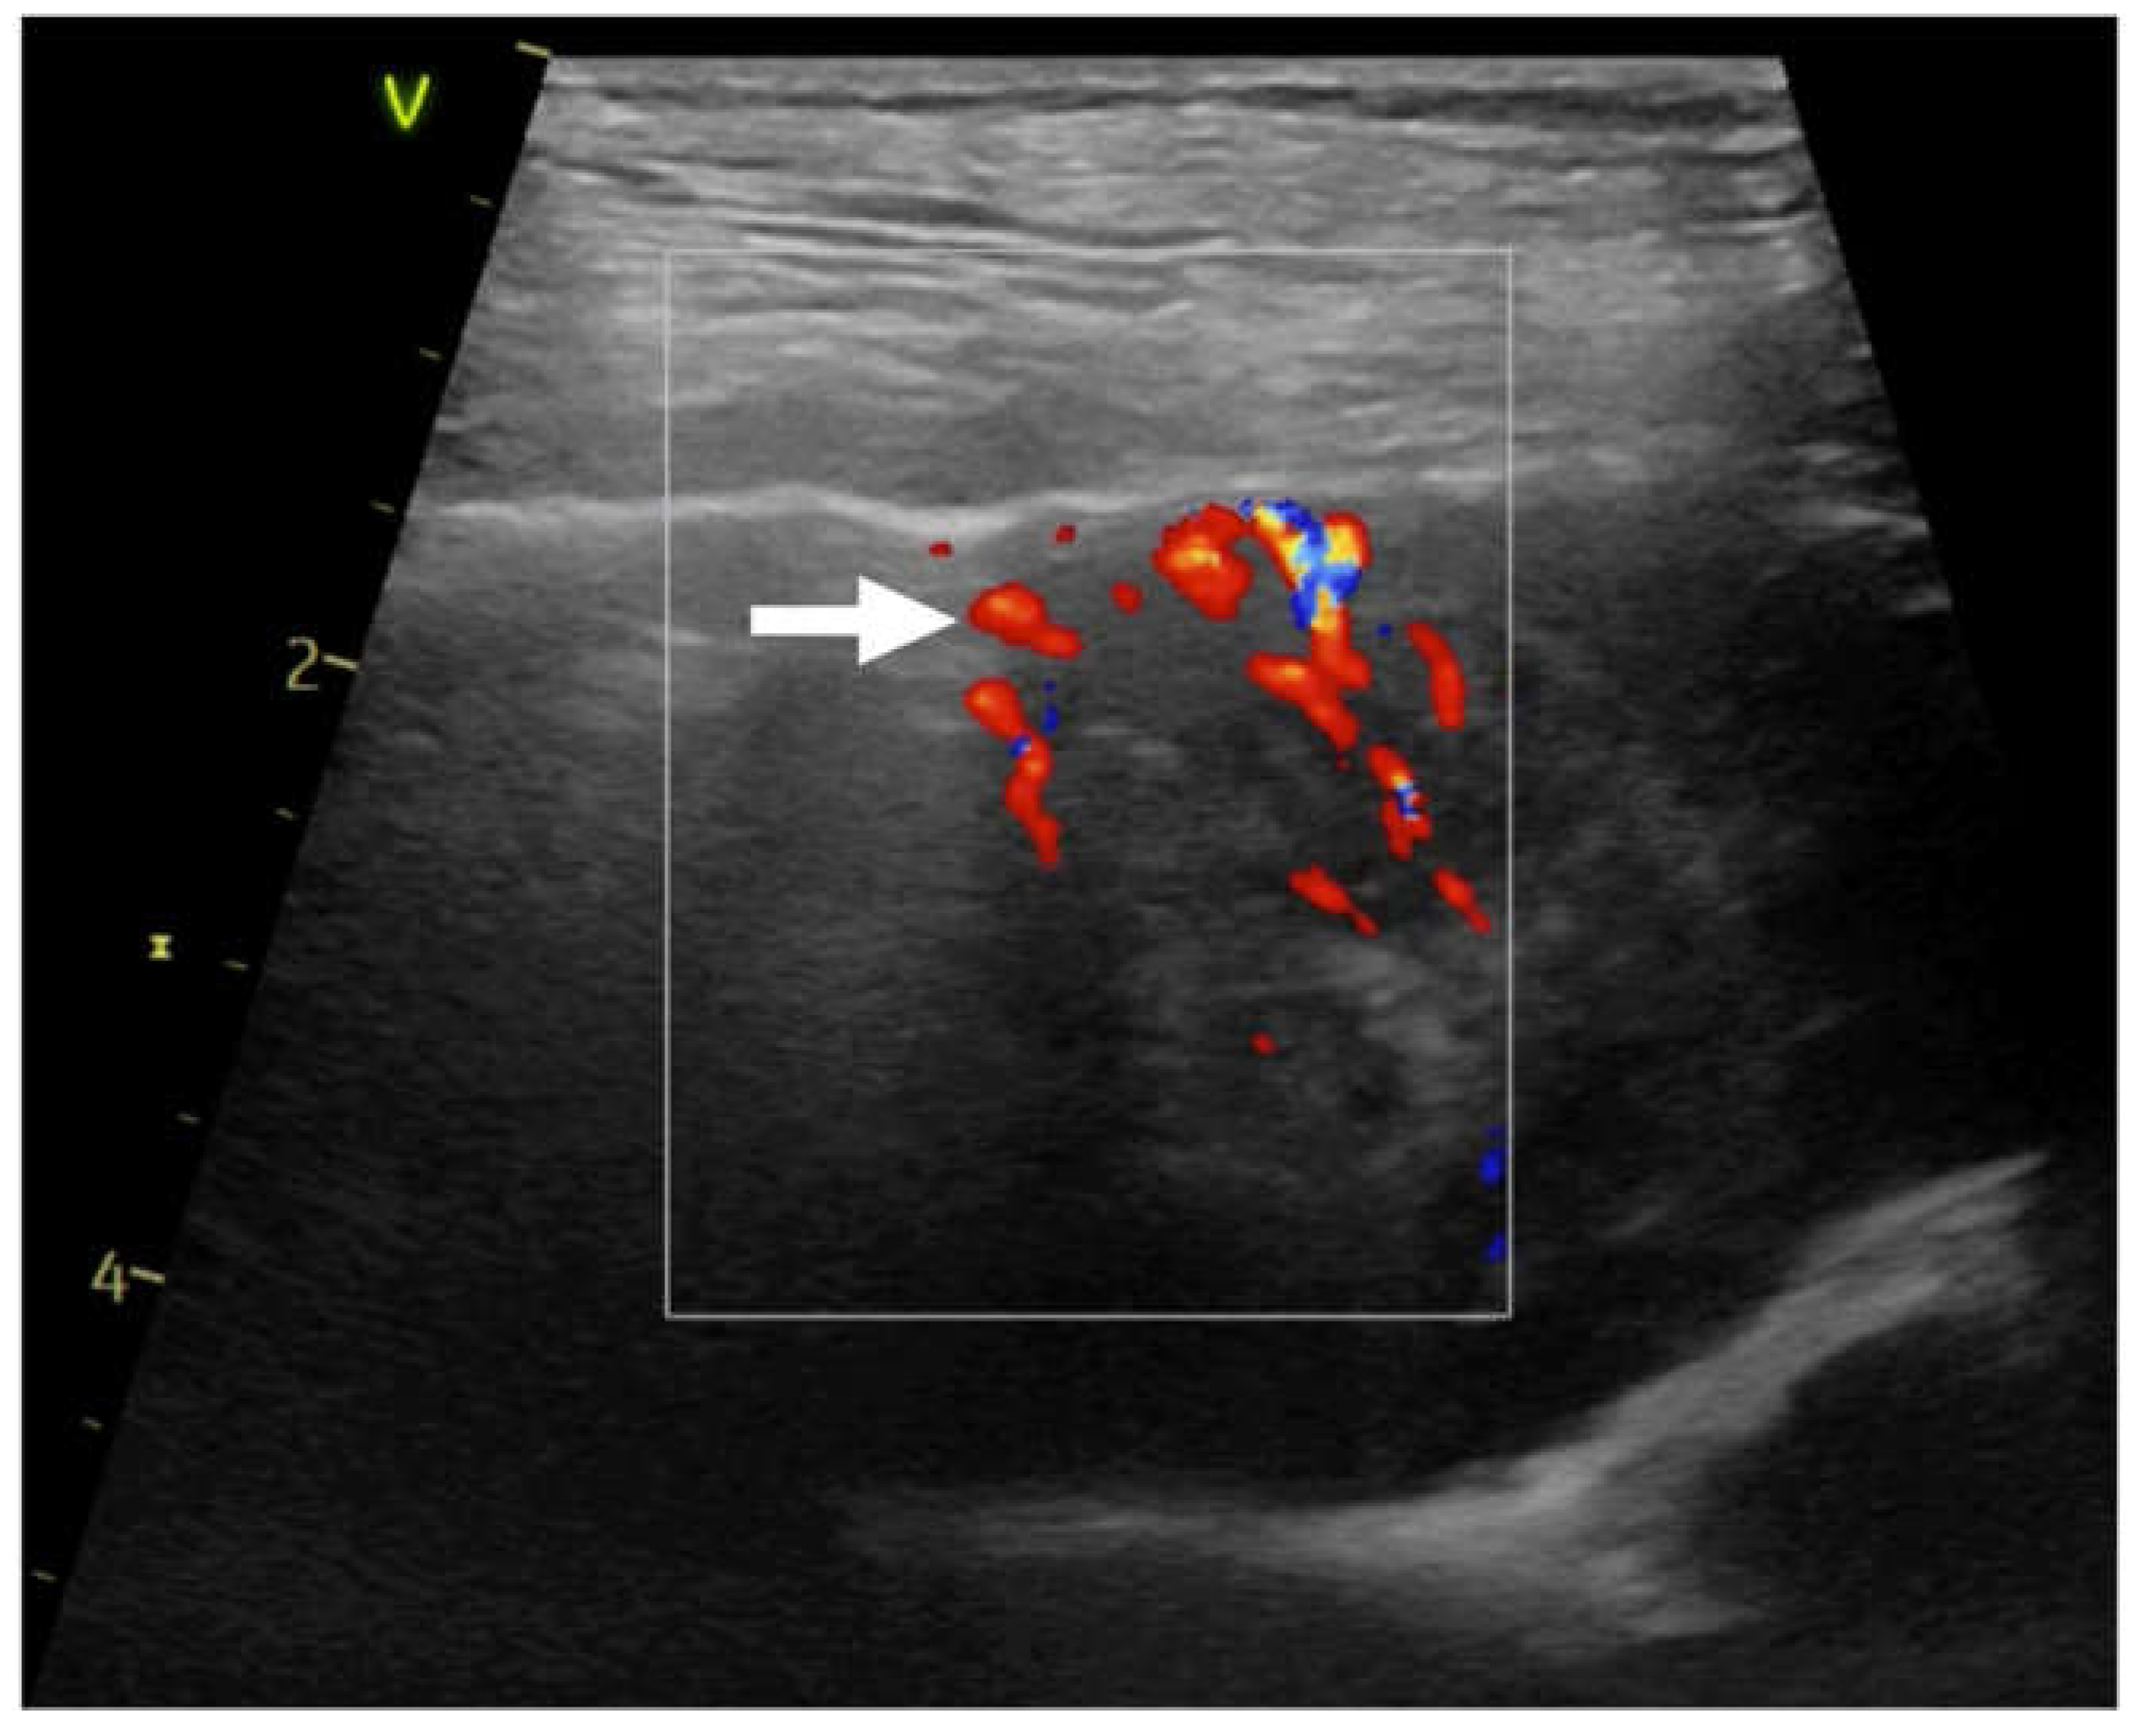
Figure 5.
Linear probe, lung preset. Still image, color doppler and pulsed wave doppler imaging of the flow in consolidation. Arterial type of vascularisation.
Figure 5.
Linear probe, lung preset. Still image, color doppler and pulsed wave doppler imaging of the flow in consolidation. Arterial type of vascularisation.
Movie 1.
Linear probe, lung preset. Color doppler imaging of the anatomical tree like vascularisation in dog with pneumonia.
Movie 1.
Linear probe, lung preset. Color doppler imaging of the anatomical tree like vascularisation in dog with pneumonia.

Movie 2. Linear probe, lung preset. Color doppler imaging of the residual vascularisation in consolidation.
Movie 3. Linear probe, thyroid preset. Color doppler imaging of the vascularisation penetrating from the chest wall.
Movie 4. Linear probe, Lung preset. Color doppler imaging abrupt cessation of blood flow at the “tip” of the consolidation “vascular sign” (→), C-line (←) hypoechoic triangular shape consolidation (↓).
The localization of the consolidations was also described by operators - left or right side of the chest and to the statistical analysis the lung area was divided in three zones: cranial, medial and caudal. The final diagnosis like pneumonia, parenchymal lung disease (PLD), tumor, metastasis, granuloma, abscess, acute respiratory distress syndrome (ARDS), pulmonary thromboembolic (PTE) congestive heart failure (CHF), atelectasis was confirmed by one or combination of the additional test or different diagnostic imaging method like: echocardiography, TXR, CT, bronchoscopy, biopsy, histopathology, bacteriology, complete blood count, C-reactive protein-dimer, positive reaction for antibiotic and autopsy.
Results
Statistical analyzes were performed using the IBM SPSS Statistics 29 package. It was used to perform frequency analysis and basic descriptive statistics for variables describing the study group, as well as the chi-square test of independence for comparing groups in terms of nominal variables and the Kruskal-Wallis test for comparing more than two groups in terms of quantitative variables. The level of significance in this chapter was α = 0.05.
Characteristics of the study group
981 dogs and cats were included in the study, the majority were dogs (64.6%) and the cats (35,4 %). The dominant sex weas male (55.1%), and the animals' ages ranged from 1 month to 20.3 years (M = 10.63; SD = 4.44). The most common breeds among dogs were mix breeds (28.2%) and Yorkshire Terriers (14.7%), while among cats the Domestic Shorthair (DSH) (38.9%) and mix breeds (26.5%). Detailed percentage distributions of breeds are presented in Table 1.
Analysis of the Consolidations
In the next step of the analysis, the distribution of occurrence of individual types of consolidation was checked. For this purpose, a frequency analysis was performed, the results of which are presented in Table 2. The analysis showed that the most common type of consolidation was type S (47.1%) and type S/T (14.8%), while the least common types were N/T (0.3%), T/W (0.3 %) and N/W (0.1%).
Then, individual types of consolidation were compared in terms of vascularity, bronchogram, diagnosis, depth and width. For this purpose, a series of chi tests were performed independence square and Kruskal-Wallis. Types constituting more than 1% of the total number of observations were included in the analysis. First, the types of consolidation were compared in their depth and width.
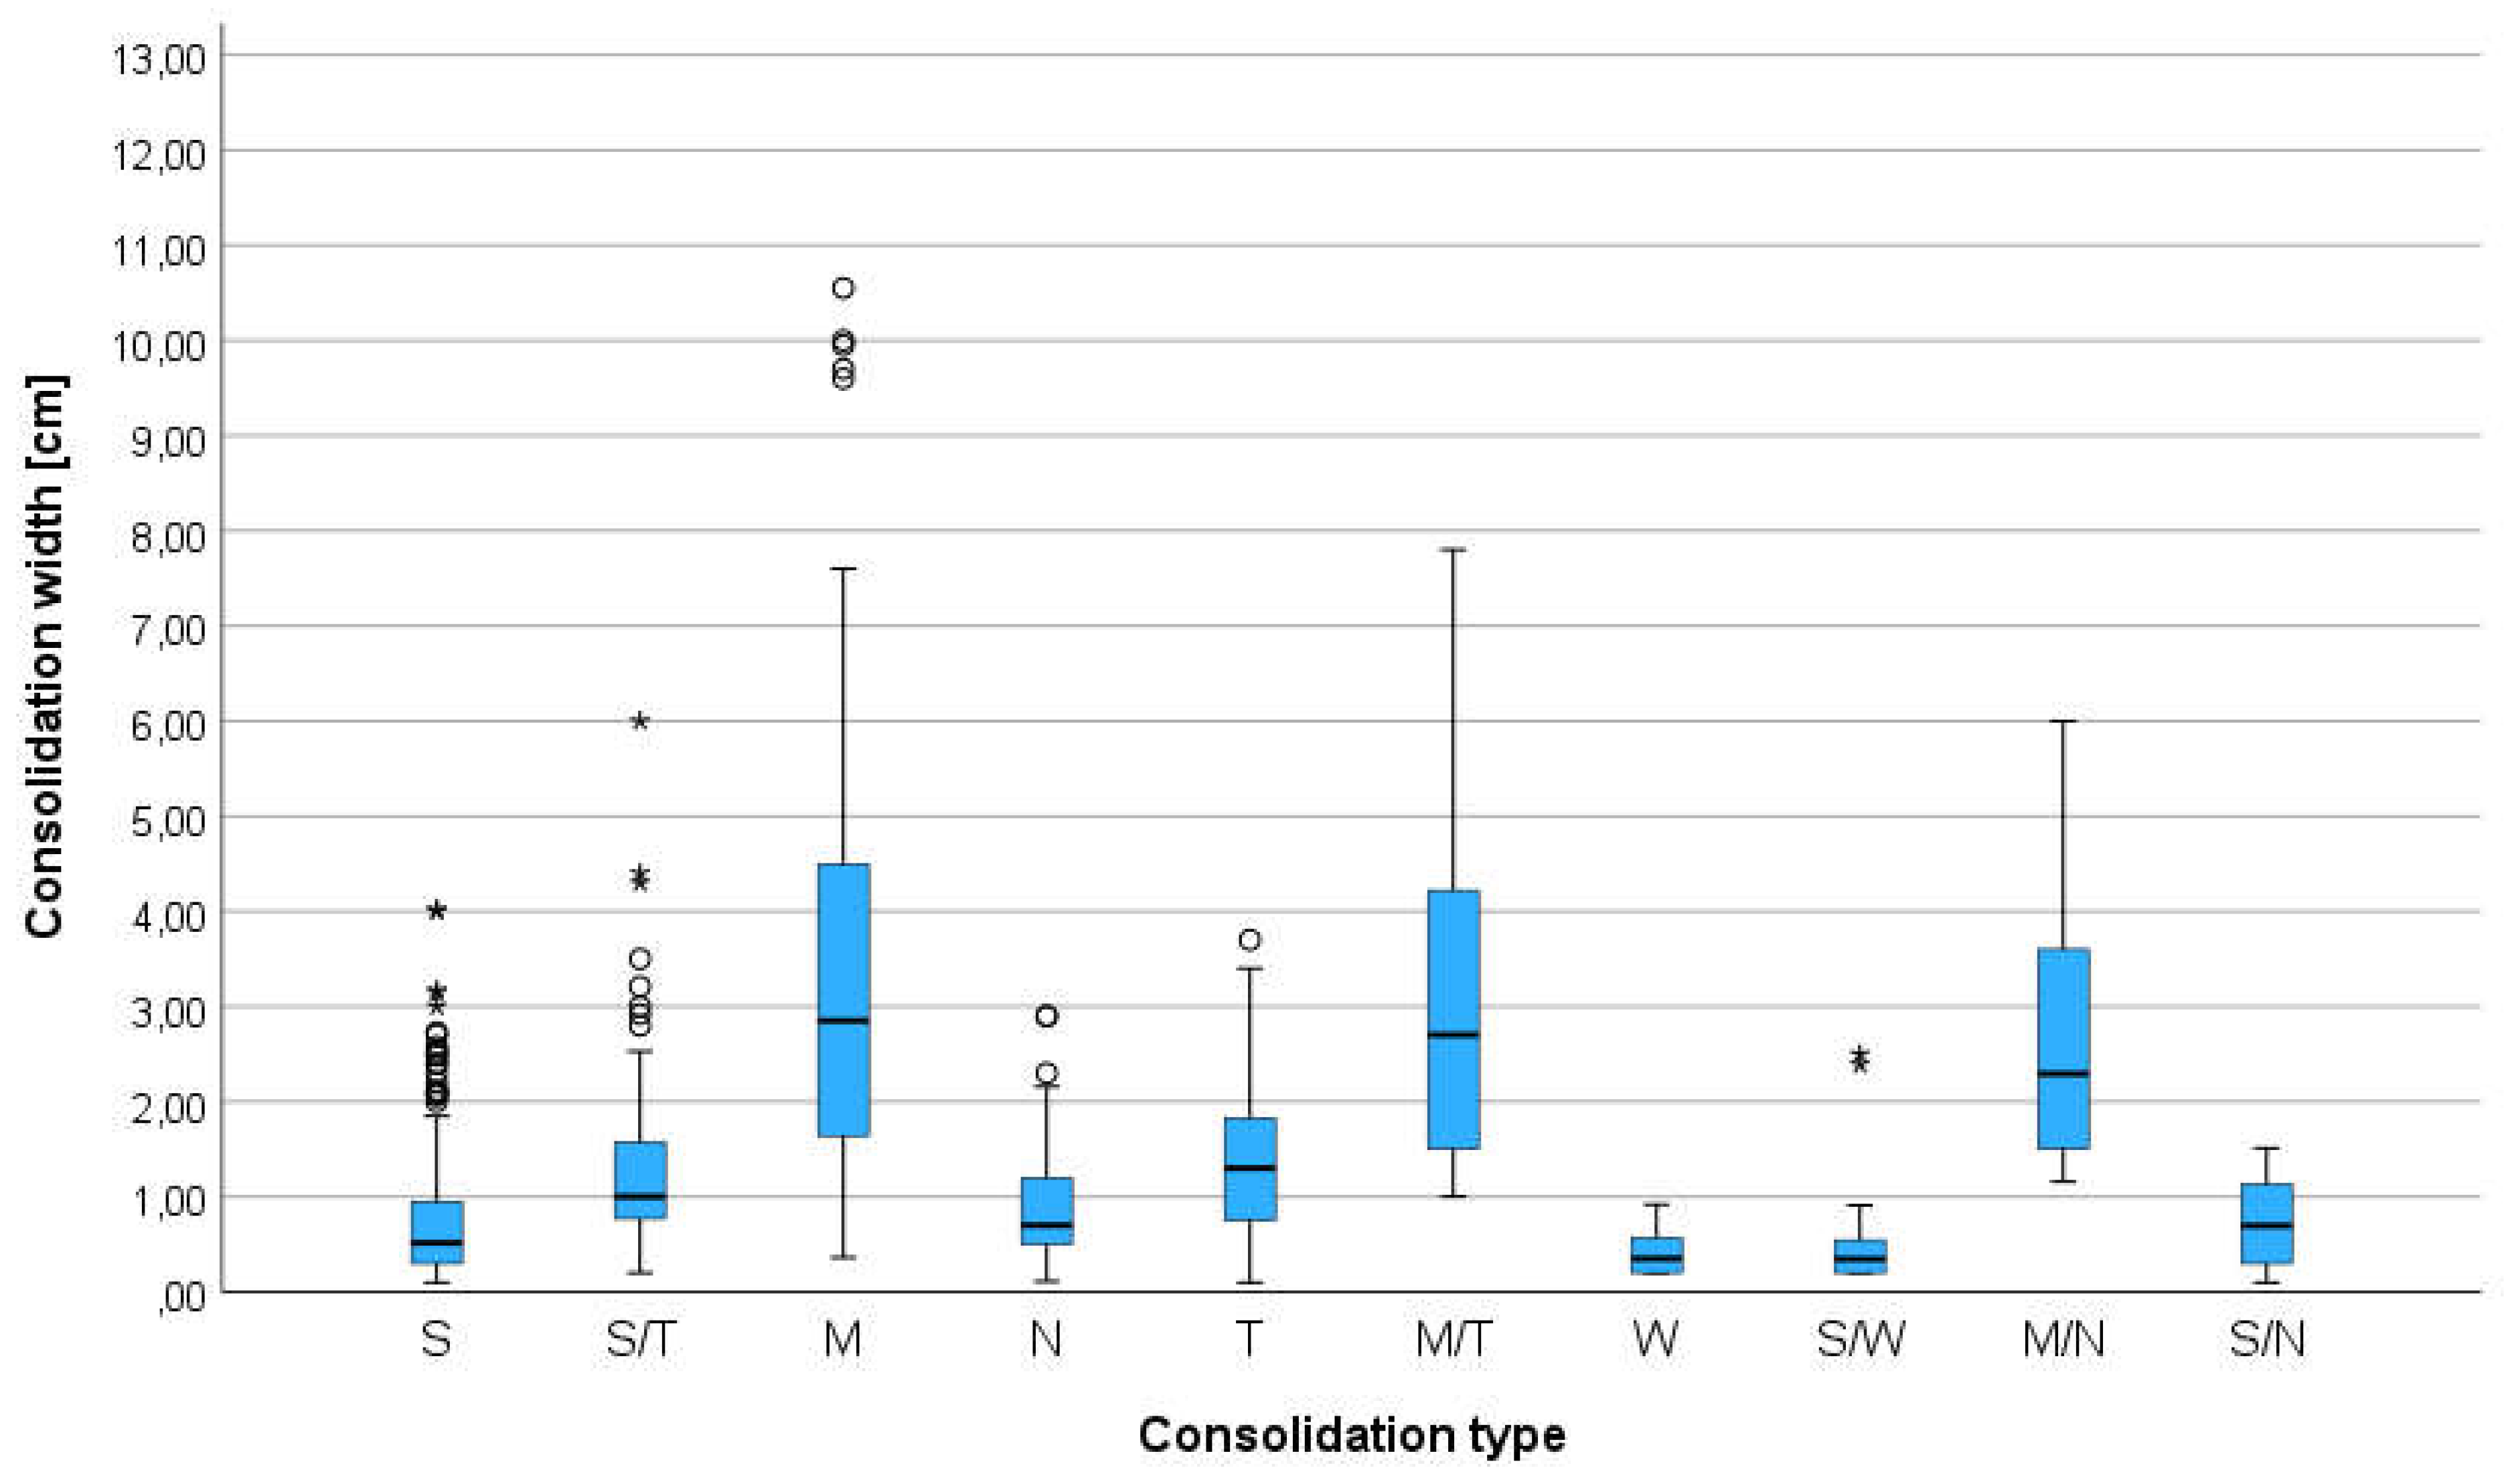
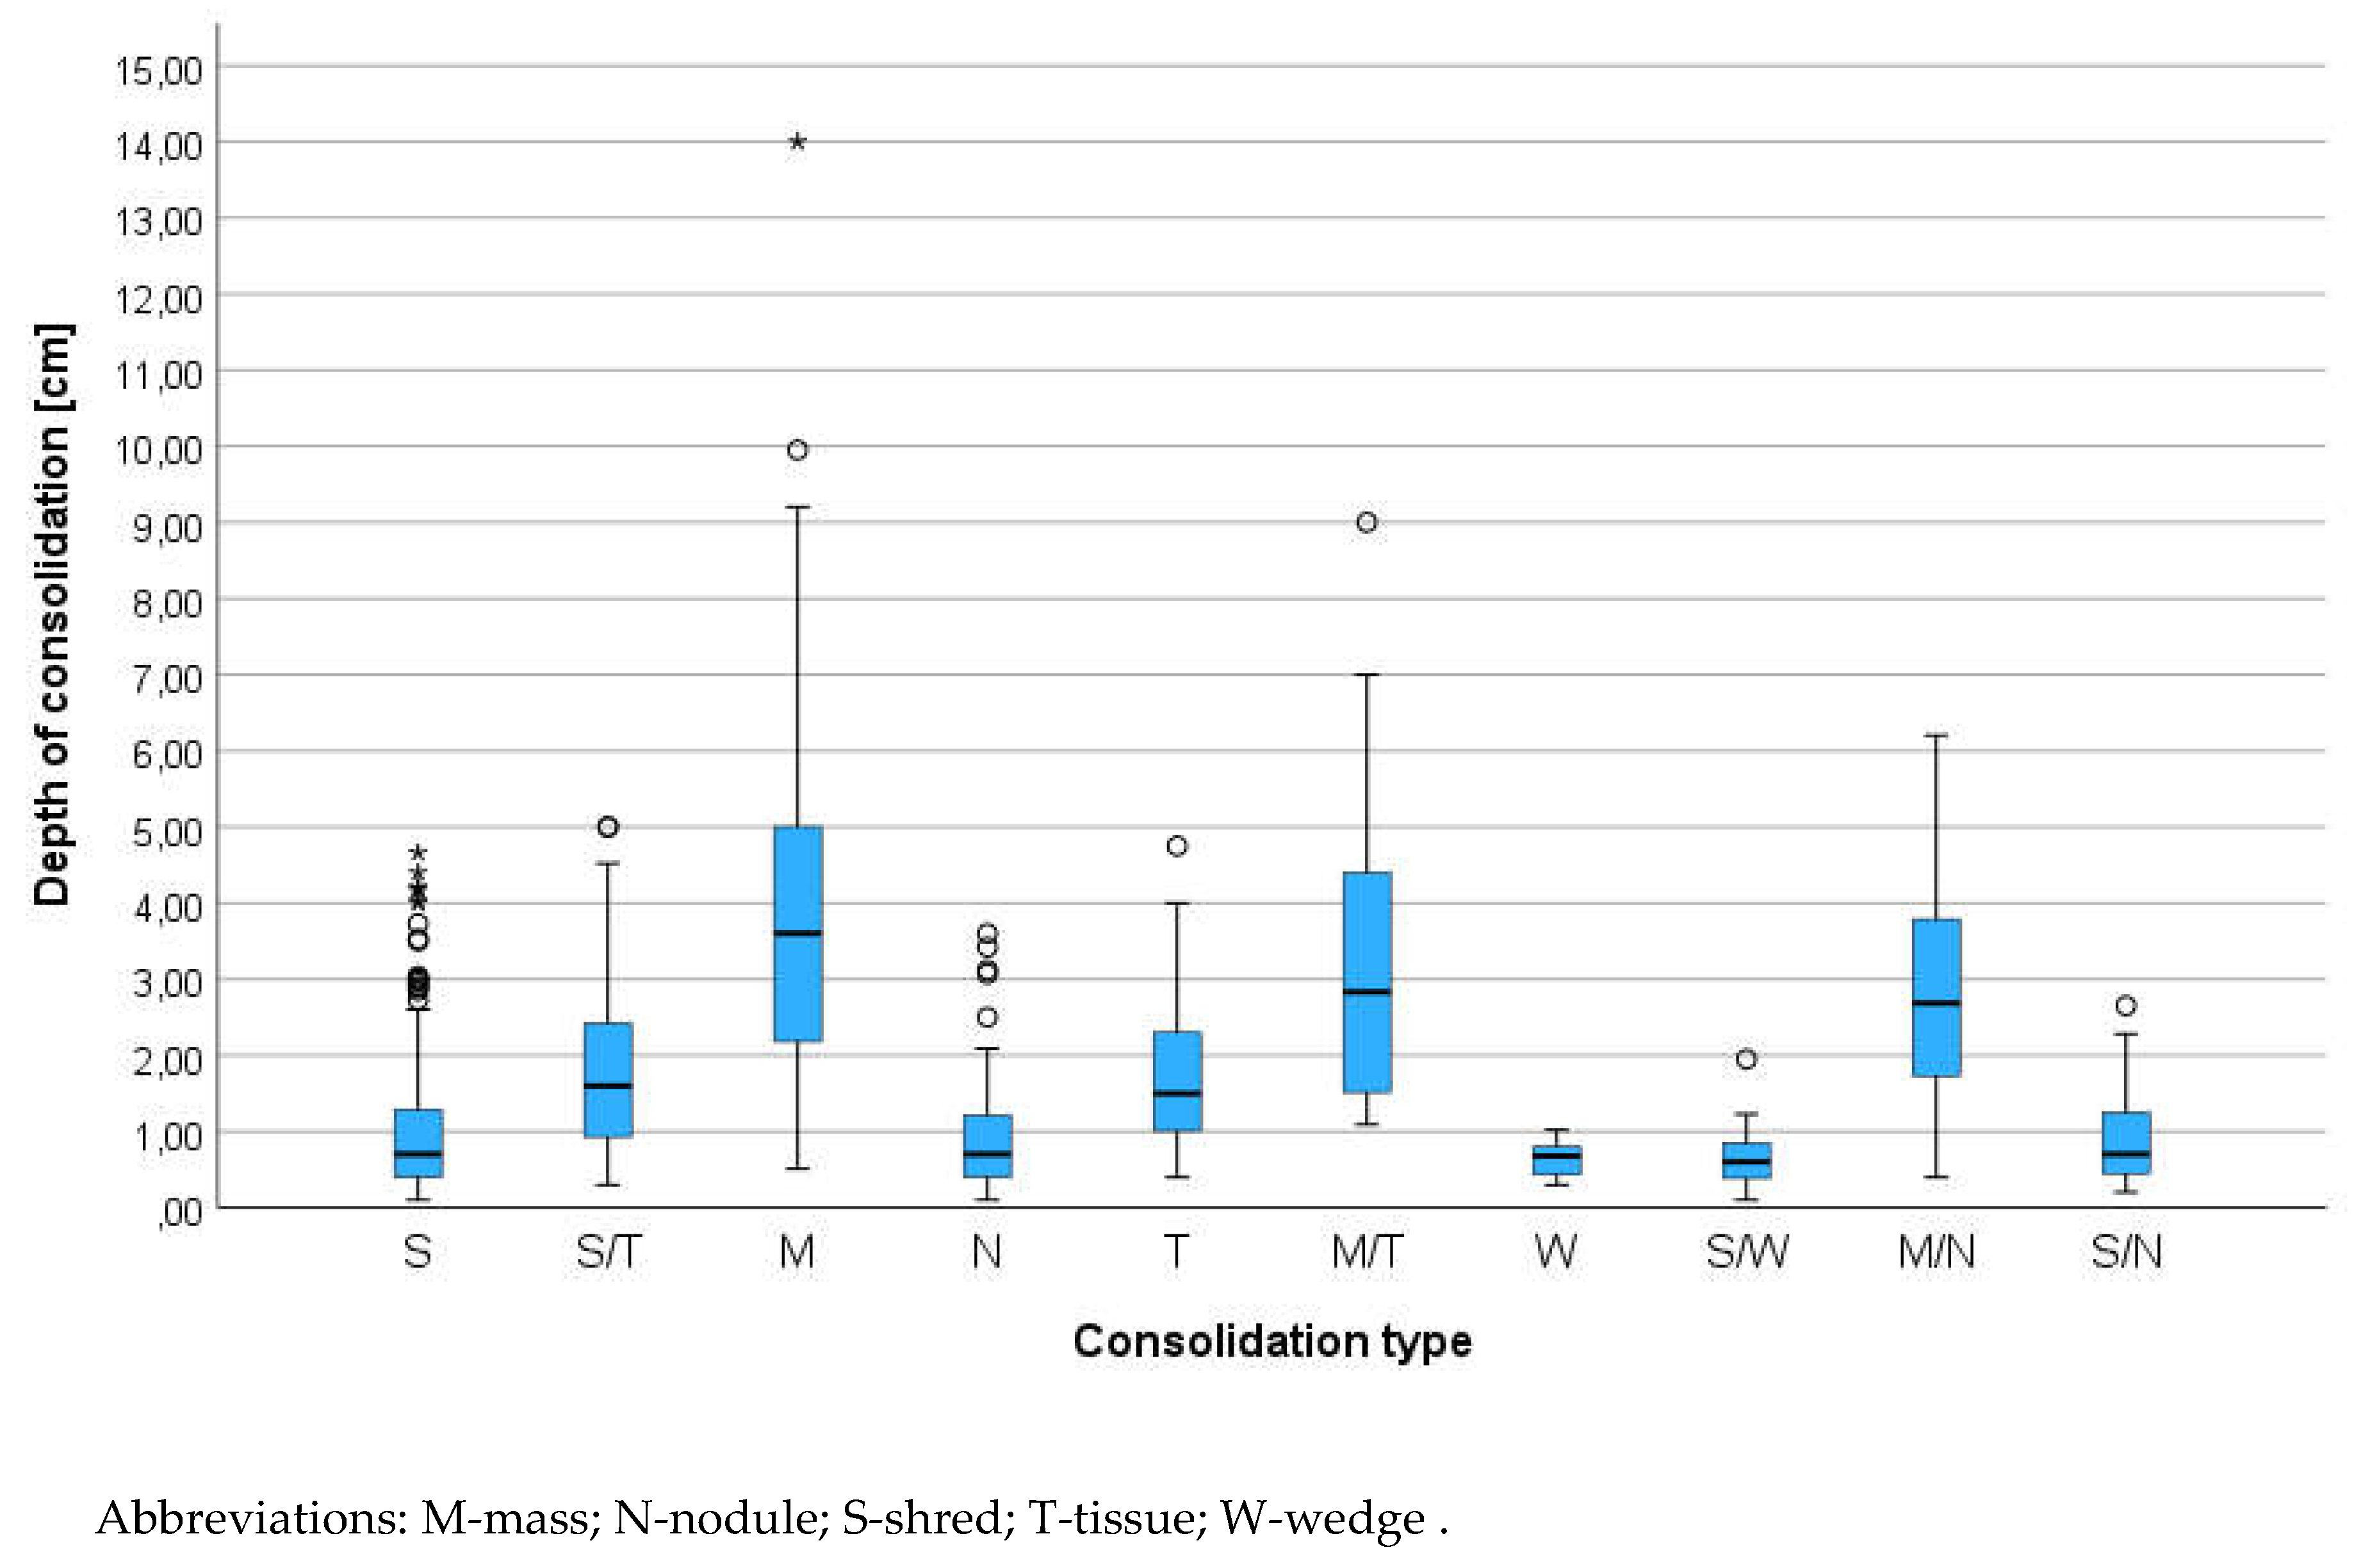
The analysis showed statistically significant differences between the compared types of consolidation in terms of depth and width, and the observed effects turned out to be strong (η2 > 0.14). The consolidation types M, M/T and M/N had the greatest depth, while the W and S/W consolidations had the smallest depth. In terms of width, the highest values were also recorded in the case of consolidations of the M, M/T and M/N types, while the lowest were recorded in the case of the W type consolidations. The results of the analyzes are presented in box plots Figure 6 and 7.
Figure 6. Boxplot for the width of each consolidation type.
Figure 7.
Boxplot for the depth of each consolidation type. Abbreviations: M-mass; N-nodule; S-shred; T-tissue; W-wedge .
Figure 7.
Boxplot for the depth of each consolidation type. Abbreviations: M-mass; N-nodule; S-shred; T-tissue; W-wedge .
The types of consolidation were then compared in terms of bronchogram. The results are presented in Table 3. The analysis showed a statistically significant difference between the compared types of consolidation in terms of the bronchogram. The observed effect was strong (Vc > 0.50). In type S consolidation Db was observed significantly more often, and Ab, Fb, Sb/Fb, Db/Sb/Fb and Sb/Ab were significantly less frequently observed. In S/T consolidation, Db/Sb and Db/Sb/Fb were observed significantly more often, and Ab, Db and Sb/Ab were observed significantly less frequently. In the M type of consolidation, Ab was observed significantly more often, and Db, Sb, Db/Sb, Sb/Fb and Db/Sb/Fb were observed significantly less frequently. In type N consolidation, Ab was observed significantly more often, and Db, Sb, Ds/Sb, Sb/Fb and Db/Sb/Fb were observed significantly less frequently. In T-type consolidation, Sb, Fb and Sb/Fb were observed significantly more often, and Ab, Db, Db/Sb, Db/Sb/Fb were observed significantly less frequently. In S/T consolidation, Sb/Ab was observed significantly more often, as well as Db was significantly less common. In type W consolidation, Ab was observed significantly more often, and Db was significantly less frequently observed. In S/W consolidation, Db/Ab and Sb/Ab were observed significantly more often. In the M/N type of consolidation, Ab was observed significantly more often, and Db was significantly less frequently observed. In S/N consolidation, Sb/Ab was observed significantly more often.
The types of consolidation were compared in terms of vascularity. The results are presented in Table 4. The analysis showed a statistically significant difference between the compared types of consolidation in terms of vascularization of the lesions, and the observed effect turned out to be strong (Vc > 0.50). In S-type consolidation Tv was observed significantly more often, and Rv, Hv and Vs were observed significantly less frequently. In S/T consolidation, Rv was observed significantly more often, and Hv and Vs were observed significantly less frequently. In M type consolidation, Hv, Hv/Pv and Pv was observed significantly more often, and Tv, Rv and Vs were observed significantly less frequently. In type N consolidation, Hv was observed significantly more often. In T-type consolidation, RV was observed significantly more often, and Tv and Hv was observed significantly less frequently. In M/T consolidation Hv, Hv/Pv and Pv were observed significantly more often, and Tv was observed significantly less frequently. In type W consolidation, Vs was observed significantly more often, and Tv and Rv were observed significantly less frequently. In S/W consolidation, Vs was observed significantly more often, and Tv was observed significantly less frequently. In the M/N type of consolidation, Hv was observed significantly more often, and Tv was observed significantly less often.
Finally, the types of consolidation were compared in terms of diagnosis. The results are presented in Table 5. The analysis showed a statistically significant difference between the compared types of consolidation in terms of diagnosis. Moreover, the obtained effect turned out to be strong (Vc > 0.50). In S-type of consolidation the significantly more often acute respiratory distress syndrome (ARDS), parenchymal lung disease (PLD), pneumonia, pneumonia and PLD, and pneumonia with congestive heart failure (CHF) was diagnosed. In S/T consolidation, atelectasis with CHF and PLD, pneumonia with atelectasis and pneumonia with atelectasis and CHF were observed significantly more often. In the M- type of consolidation, tumor, tumor with atelectasis and tumor with CHF were observed significantly more often. In type N consolidation, tumor and granuloma, metastases and granuloma were observed significantly more often. In T-type consolidation, atelectasis, atelectasis with CHF and CHF were observed significantly more often. In M/T consolidation, tumor with atelectasis and tumor with CHF were observed significantly more often. In type W consolidation, pulmonary thromboembolic (PTE), pneumonia with PTE, PTE with ARDS and PTE with CHF were observed significantly more often. In S/W consolidation, PTE, pneumonia with PTE, pneumonia with PTE and ARDS, and PTE with CHF were observed significantly more often. In M/N consolidation, tumors with metastases were observed significantly more often. In S/N consolidation, tumor with metastases and pneumonia with abscess were observed significantly more often.
In the next step of the analysis, individual animal breeds were compared (separately within species) in terms of the frequency of occurrence of individual simple and complex lesions. Only those breeds whose number constituted more than 1% of a given study group were included in the analysis. Dogs were analyzed first. The results are presented in Table 6 and Table 7. The analysis showed statistically significant differences between the compared groups in terms of the frequency of simple and complex lesions. In the case of simple lesions, ARDS was observed significantly more often in Chihuahuas, Shih Tzus and Yorkshire Terriers; PLD was observed significantly more often in the Maltese; tumors were significantly more frequently observed in Labrador Retrievers; atelectasis was observed significantly more often in French Bulldogs and Pugs; pulmonary edema (PE) was observed significantly more often in Yorkshire Terriers; PTE was observed significantly more often in Dachshunds; granuloma was observed significantly more often in Beagles. In terms of complex lesions, tumor with atelectasis was observed significantly more often in German Shepard; tumor with metastases was observed significantly more often in mixed breeds and Labrador Retrievers; atelectasis with CHF was observed significantly more often in Beagles; metastases with atelectasis were observed significantly more often in Jack Russell Terriers and Pugs; pneumonia with ARDS was observed significantly more often in Yorkshire Terriers; pneumonia with PLD was observed significantly more often in Jack Russell Terriers, Maltipoos and Yorkshire Terriers; pneumonia with atelectasis was observed significantly more often in French Bulldogs; pneumonia with atelectasis and CHF were observed significantly more often in Miniature Schnauzers; pneumonia with PTE was observed significantly more often in Maltipoos and Miniature Pinschers; pneumonia with CHF was observed significantly more often in Cavalier King Charles Spaniels, Maltese and Shih Tzu, and significantly less often in Yorkshire Terriers; PTE with ARDS was observed significantly less frequently in Chihuahuas; PTE with atelectasis was observed significantly more often in Chihuahuas. The effect observed in the case of simple changes turned out to be weak (Vc < 0.30), while the effect observed in the case of complex changes turned out to be moderate (0.30 < Vc < 0.50).
Then the cats were analyzed. The results are presented in Table 8 and Table 9. The analysis did not reveal statistically significant differences between the compared different breeds, both in terms of simple and complex changes.
As all the animals had made echocardiography examination in the final step of the analysis was to check correlation between heart diseases classified as B2, C, D according to the ACVIM guidelines for dogs and cats or heart tumor (HT), with the lung ultrasound diagnosis[33,34]. For this purpose, a chi-square test of independence was performed, the results of which are presented in Table 10. The analysis showed a statistically significant difference between the compared groups in terms of diagnosis, and the effect obtained was strong (Vc > 0.50). It turned out that ARDS, tumor and pneumonia with atelectasis were significantly more common in animals with classified as ACVIM B2. In animals ACVIM C heart disease, pneumonia with CHF was observed significantly more often. In animals ACVIM D, atelectasis with CHF, PTE and PTE with CHF were significantly more frequently observed. In animals with HT, tumor with atelectasis, metastases, tumor with metastases and metastases with atelectasis were observed significantly more often.
Discussion
The etiologies of pulmonary consolidation are diverse, and a vascular morphological and hemodynamic changes had been investigated in human medicine. Pulmonary vascularization in animals and humans has organ-specific characteristic due to dual arterial supply of the lung [30,35]. Pulmonary arteries show a treelike pattern, their branches centrifugally course, and react to hypoxia by vasoconstriction induced by the Euler-Liljestrand reflex [30] what can explain residual blood flow in atelectasis [35,36]. The TXR cannot demonstrate the vessel in consolidated lung and CT is still expensive and difficult-to-access method compared to common ultrasonography. In this retrospective study the different hemodynamic changes seen in different types of consolidations plus the bronchogram findings make it possible to distinguish pneumonia from atelectasis, tumor or PTE. From the clinical point of view information about vascularity, type of bronchogram or its absence in consolidation have clinical impact and often influence further diagnostic decisions.
Retrospective analysis of changes in the lungs show us that we can have more than one type of consolidations and some of them especially this one with bigger diameter can be not homogenic in their structure. This echo structure sometimes can be more helpful for clinician than TRX.
Anatomical tree like vascularization was found in animals with suspicion on pneumonia. The shape of the consolidation was irregular with presence of the C-line - comet-tail artifacts, extending from the far edge of these consolidations. The blood flow in color doppler appears and disappears with the breathing faze. Residual vascularization was found in atelectasis. The vascularization was reduced because of the mass above the atelectasis what compress the vessels, vasoconstriction in long term pneumonia or big amount of the fluid in chest. In consolidation the fragment of the anatomical tree was visible and disappears. In tumors the residual vascularization or chaotic neovascularization was present but there was no air or fluid bronchogram. The high oxygen blood is often used by tumors for better nutrition [35]. In our findings some of the tumors had residual vascularization and high resistance flow but it was difficult to differentiate the origin from pulmonary artery or bronchial artery. Similar findings were published in contrast inhaled ultrasonography [35,36].The anatomical structures in tumors were destroyed in some individuals with presence of small hyperechoic round dots – calcifications. The fourth type is present when the consolidation in lung infiltrates the chest wall. The vessels from the chest wall penetrating to the consolidation as the intercostal arteries are high oxygenate blood [37]. This type was observed in tumors infiltrate the chest wall. The last observe patten is a “vascular sign.” The “vascular sign” is believed to result from the occlusion of a vessel by embolic material. Abrupt cessation of blood flow at the “tip” of the consolidation can be seen using color doppler. The consolidation is usually triangular or basket shape and hypoechogenic in literature called “wedge sign”. The “vascular sign” was present in dogs with infection of Angiostrongylus vasorum [5], cats with deferent types cardiomyopathy with spontaneous echocontrast in right atrium. In 1 case the thromboembolic lung disease was confirmed on postmortem examination. “Vascular sign” was present also in 7 Yorkshire terriers with severe dyspnea without final diagnosis as the dogs were euthanized because of no response for treatment. All the dogs were treated also for Cushing disease.
A general disadvantage of LUS is that lesions that fail to reach the lung periphery will not be detected, because lung pathology separated from the lung surface by air will be obscured and only reverberation artifact will be seen. Therefore, LUS cannot rule out some of the pathologies and examination must supportive clinical findings is always considered an indication to perform additional tests [8,38]. Otherwise for example metastatic changers usually are seen close to the pleura line. In human medicine finding even one wedge sign is an indication for further diagnosis of PTE.
A general drawback of color doppler sonography for lung ultrasound is that motion artifact as a result of the respirations may interfere with the quality of color doppler sonography. Good ultrasound settings, and doppler velocity scale adjustment are important to visualize small vessels within lung consolidations. For less experienced operators doppler analysis can be difficult to perform. Nevertheless, lung consolidation should be evaluated for bronchogram and vascularity whenever possible. If the patient is in severe dyspnea or panting, LUS can be performed after stabilization of the patient and sedation is administered. Sedatives should not directly influence the results of the examination, but LUS should be performed as soon as possible after achieving sedation to avoid atelectasis which may occur because of prolonged lateral recumbency.
As experienced with echocardiography clinicians we also could exclude the cardiogenic background of consolidated lung in progression of pulmonary edema what can be difficult for less experienced veterinarians or general practitioners and relay not only on left atrium size, but also on diastology parameters like mitral inflow or tissue doppler. In animals’ stage B2 according to ACVIM classification ARDS, pneumonia with atelectasis was significant more common probably because most of the animals were small breed dogs and in population were 22.6% of dogs with common disease of respiratory tract like Yorkshire Terriers (14.7%), WHWT (4.6%) and French Bulldog (3.3%). Consolidated lung was observed only in one case of PE in very server stadium in other cases the animals with CHF and consolidations in lung had also signs of inflammation confirmed by other diagnostic tests. In analysis W type of consolidation and diagnosis of PTE was significant mor often observed possibly because of cat’s patient with spontaneous echo contrast in right atrium as a risk factor of PTE. In animals’ stage ACVIM D more often atelectasis was observed as a result of pleural effusion in right sided heart failure. In animals with different types of heart tumor the atelectasis was significant more common as a consequence of pleural effusion in progression of oncology disease.
Conclusions
The analysis of the shape, bronchogram and vascularity of the consolidation showed that combination of this criteria has important influence and should be perform during the lung ultrasound examination. Finally, analysis of the heart disease and lung ultrasound findings proof that the animals with dyspnea had multi-disease background of the breathing problem and the inflammation or pneumonia should be consider as a risk factor of developing CHF.
Supplementary Materials
The following supporting information can be downloaded at the website of this paper posted on Preprints.org.
Abbreviation Table
| Ab | absence of bronchogram | |
| ARDS | acute respiratory distress syndrom | |
| CD | color doppler | |
| CHF | congestive heart failure | |
| Fb | fluid bronchogram | |
| Db | dynamic air bronchogram | |
| Hv | chaotic type vascularity | |
| LUS | lung ultrasound | |
| M | mass | |
| N | nodule type consolidation | |
| PTE | pulmonary thromboembolism | |
| Pv | penetrating type vascularity | |
| Rv | residual type vascularity | |
| S | shred type vascularity | |
| Sb | static air bronchogram | |
| T | tissue type consolidation | |
| Tv | tree-like vascularity | |
| W | wedge type consolidation | |
References
- Fernandes Rodrigues, N.; Giraud, L.; Bolen, G.; et al. Comparison of lung ultrasound, chest radiographs, C-reactive protein, and clinical findings in dogs treated for aspiration pneumonia. J Vet Intern Med 2022, 36, 743–752. [Google Scholar] [CrossRef] [PubMed]
- Venco, L.; Colaneri, G.; Formaggini, L.; et al. Utility of thoracic ultrasonography in a rapid diagnosis of angiostrongylosis in young dogs presenting with respiratory distress. Vet J 2021, 271, 105649. [Google Scholar] [CrossRef] [PubMed]
- Łobaczewski, A.; Czopowicz, M.; Moroz, A.; et al. Integrated Basic Heart and Lung Ultrasound Examination for the Differentiation between Bacterial Pneumonia and Lung Neoplasm in Dogs-A New Diagnostic Algorithm. Animals (Basel) 2022, 12. [Google Scholar] [CrossRef] [PubMed]
- Lin, C.H.; Lo, P.Y.; Lam, M.C.; et al. Usefulness of Chest Ultrasonography in Predicting Diagnosis in Non-emergency Small Animal Patients With Lung Parenchymal and Pleural Disease. Front Vet Sci 2020, 7, 616882. [Google Scholar] [CrossRef] [PubMed]
- Kraszewska, K.G.M.; Boysen, S. Case report: Application of color Doppler sonography for the assessment of pulmonary consolidations in a dog. Frontiers in Veterinary Science 2023, 10. [Google Scholar] [CrossRef]
- Copetti, R.; Soldati, G.; Copetti, P. Chest sonography: a useful tool to differentiate acute cardiogenic pulmonary edema from acute respiratory distress syndrome. Cardiovasc Ultrasound 2008, 6, 16. [Google Scholar] [CrossRef] [PubMed]
- Demi, L.; Wolfram, F.; Klersy, C.; et al. New International Guidelines and Consensus on the Use of Lung Ultrasound. J Ultrasound Med 2023, 42, 309–344. [Google Scholar] [CrossRef] [PubMed]
- Buda, N.; Kosiak, W.; Radzikowska, E.; et al. Polish recommendations for lung ultrasound in internal medicine (POLLUS-IM). J Ultrason 2018, 18, 198–206. [Google Scholar] [CrossRef] [PubMed]
- Buda, N.; Piskunowicz, M.; Porzezinska, M.; et al. Lung Ultrasonography in the Evaluation of Interstitial Lung Disease in Systemic Connective Tissue Diseases: Criteria and Severity of Pulmonary Fibrosis - Analysis of 52 Patients. Ultraschall Med 2016, 37, 379–385. [Google Scholar] [CrossRef]
- Huang, D.; Ma, H.; Xiao, Z.; et al. Diagnostic value of cardiopulmonary ultrasound in elderly patients with acute respiratory distress syndrome. BMC Pulm Med 2018, 18, 136. [Google Scholar] [CrossRef]
- Volpicelli, G.; Cardinale, L.; Garofalo, G.; et al. Usefulness of lung ultrasound in the bedside distinction between pulmonary edema and exacerbation of COPD. Emergency Radiology 2008, 15, 145–151. [Google Scholar] [CrossRef] [PubMed]
- Liu, J.; Copetti, R.; Sorantin, E.; et al. Protocol and Guidelines for Point-of-Care Lung Ultrasound in Diagnosing Neonatal Pulmonary Diseases Based on International Expert Consensus. J Vis Exp 2019.
- Buda, N.; Kosiak, W.; Welnicki, M.; et al. Recommendations for Lung Ultrasound in Internal Medicine. Diagnostics (Basel) 2020, 10. [Google Scholar] [CrossRef] [PubMed]
- Dietrich, C.F.; Buda, N.; Ciuca, I.M.; et al. Lung ultrasound in children, WFUMB review paper (part 2). Med Ultrason 2021, 23, 443–452. [Google Scholar] [CrossRef] [PubMed]
- Yang, P.C. Color doppler ultrasound of pulmonary consolidation. European Journal of Ultrasound 1996, 3, 169–178. [Google Scholar] [CrossRef]
- Yuan, A.; Yang, P.C.; Lee, L.; et al. Reactive pulmonary artery vasoconstriction in pulmonary consolidation evaluated by color Doppler ultrasonography. Ultrasound Med Biol 2000, 26, 49–56. [Google Scholar] [CrossRef]
- Sripathi, S.; Mahajan, A. Comparative study evaluating the role of color Doppler sonography and computed tomography in predicting chest wall invasion by lung tumors. J Ultrasound Med 2013, 32, 1539–1546. [Google Scholar] [CrossRef]
- Lisciandro, G.R.; Lisciandro, S.C. Lung Ultrasound Fundamentals, "Wet Versus Dry" Lung, Signs of Consolidation in Dogs and Cats. Vet Clin North Am Small Anim Pract 2021, 51, 1125–1140. [Google Scholar] [CrossRef] [PubMed]
- Armenise, A.; Boysen, R.S.; Rudloff, E.; et al. Veterinary-focused assessment with sonography for trauma-airway, breathing, circulation, disability and exposure: a prospective observational study in 64 canine trauma patients. J Small Anim Pract 2019, 60, 173–182. [Google Scholar] [CrossRef]
- Boysen, S.; McMurray, J.; Gommeren, K. Abnormal Curtain Signs Identified With a Novel Lung Ultrasound Protocol in Six Dogs With Pneumothorax. Front Vet Sci 2019, 6, 291. [Google Scholar] [CrossRef]
- Piskovska, A.; Kraszewska, K.; Hauptman, K.; et al. The Rat Thoracic Ultrasound protocol: scanning technique and normal findings. Front Vet Sci 2024, 11, 1286614. [Google Scholar] [CrossRef] [PubMed]
- Schmickl, C.N.; Menon, A.A.; Dhokarh, R.; et al. Optimizing B-lines on lung ultrasound: an in-vitro to in-vivo pilot study with clinical implications. J Clin Monit Comput 2020, 34, 277–284. [Google Scholar] [CrossRef] [PubMed]
- Kameda, T.; Kamiyama, N.; Taniguchi, N. The Mechanisms Underlying Vertical Artifacts in Lung Ultrasound and Their Proper Utilization for the Evaluation of Cardiogenic Pulmonary Edema. Diagnostics (Basel) 2022, 12. [Google Scholar] [CrossRef] [PubMed]
- Matthias, I.; Panebianco, N.L.; Maltenfort, M.G.; et al. Effect of Machine Settings on Ultrasound Assessment of B-lines. J Ultrasound Med 2020, 40, 2039–2046. [Google Scholar] [CrossRef]
- Mongodi, S.; Bouhemad, B.; Orlando, A.; et al. Modified Lung Ultrasound Score for Assessing and Monitoring Pulmonary Aeration. Ultraschall Med 2017, 38, 530–537. [Google Scholar] [CrossRef] [PubMed]
- Kraszewska K GM. USG płuc małych zwierząt w praktyce. Atlas przypadków. , 1 ed. Poland: EDRA Urban & Partner; 2023;176.
- Yang, P. Applications of colour Doppler ultrasound in the diagnosis of chest diseases. Respirology 1997, 2, 231–238. [Google Scholar] [CrossRef] [PubMed]
- Gorg, C.; Bert, T. Transcutaneous colour Doppler sonography of lung consolidations: review and pictorial essay. Part 1: pathophysiologic and colour Doppler sonographic basics of pulmonary vascularity. Ultraschall Med 2004, 25, 221–226. [Google Scholar] [CrossRef] [PubMed]
- Lichtenstein DA. Lung Ultrasound in the Critically III. London Springer 2016;376.
- Gorg, C.; Seifart, U.; Gorg, K.; et al. Color Doppler sonographic mapping of pulmonary lesions: evidence of dual arterial supply by spectral analysis. J Ultrasound Med 2003, 22, 1033–1039. [Google Scholar] [CrossRef] [PubMed]
- Yuan, A.; Yang, P.C.; Chang, D.B. Pulmonary infarction: use of color Doppler sonography for diagnosis and assessment of reperfusion of the lung. AJR Am J Roentgenol 1993, 160, 419–420. [Google Scholar] [CrossRef]
- Buda, N.; Kosiak, W. Is a linear probe helpful in diagnosing diseases of pulmonary interstitial spaces? J Ultrason 2017, 17, 136–141. [Google Scholar] [CrossRef]
- Luis Fuentes, V.; Abbott, J.; Chetboul, V.; et al. ACVIM consensus statement guidelines for the classification, diagnosis, and management of cardiomyopathies in cats. J Vet Intern Med 2020, 34, 1062–1077. [Google Scholar] [CrossRef] [PubMed]
- Keene, B.W.; Atkins, C.E.; Bonagura, J.D.; et al. ACVIM consensus guidelines for the diagnosis and treatment of myxomatous mitral valve disease in dogs. J Vet Intern Med 2019, 33, 1127–1140. [Google Scholar] [CrossRef] [PubMed]
- Rick, T.; Kleiter, M.; Schwendenwein, I.; et al. Contrast-enhanced ultrasonography characteristics of intrathoracic mass lesions in 36 dogs and 24 cats. Vet Radiol Ultrasound 2019, 60, 56–64. [Google Scholar] [CrossRef] [PubMed]
- Linta, N.; Baron Toaldo, M.; Bettini, G.; et al. The feasibility of contrast enhanced ultrasonography (CEUS) in the diagnosis of non-cardiac thoracic disorders of dogs and cats. BMC Vet Res 2017, 13, 141. [Google Scholar] [CrossRef] [PubMed]
- Mathis, G.; Gehmacher, O. Ultrasound-guided diagnostic and therapeutic interventions in peripheral pulmonary masses. Wien Klin Wochenschr 1999, 111, 230–235. [Google Scholar]
- Buda, N.; Kosiak, W.; Wełnicki, M.; et al. Recommendations for Lung Ultrasound in Internal Medicine. Diagnostics (Basel) 2020, 10. [Google Scholar] [CrossRef]

Table 1.
Percentage distribution of dog and cat breeds.
| Species | Breed | n | % |
| Dogs | Mix breed | 179 | 28.20% |
| Yorkshire Terrier | 93 | 14.70% | |
| Cavalier King Charles Spaniel | 35 | 5.50% | |
| West Highland White Terrier | 29 | 4.60% | |
| Miniatura Shnauzer | 23 | 3.60% | |
| French Buldog | 21 | 3.30% | |
| Chihuahua | 20 | 3,20% | |
| Shih Tzu | 19 | 3.00% | |
| Dachshund | 18 | 2.80% | |
| Jack Russell Terrier | 17 | 2.70% | |
| Border Collie | 15 | 2.40% | |
| Maltanise | 15 | 2.40% | |
| Beagle | 11 | 1.70% | |
| German Shepard | 11 | 1.70% | |
| Labrador Retriever | 10 | 1.60% | |
| Pug | 10 | 1.60% | |
| Maltipoo | 8 | 1.30% | |
| Miniaturę Pincher | 8 | 1.30% | |
| Other breeds | 92 | 14.5% | |
| Cats | DSH | 135 | 38.90% |
| Mix breed | 92 | 26.50% | |
| Maine Coon | 31 | 8.90% | |
| BSH | 24 | 6.90% | |
| Persian | 20 | 5.80% | |
| Syberian | 14 | 4.00% | |
| Oriental | 5 | 1.40% | |
| Ragdoll | 5 | 1.40% | |
| NFC | 5 | 1.40% | |
| Sphinx | 5 | 1.40% | |
| RBC | 4 | 1.20% | |
| Other breeds | 9 | 2.10% |
Abbreviations: BSH- British shorthair; DSH- domestic shorthair; n - number of observations; NFC – Norwegian forest cat; p - statistical significance; other breeds - breeds with 6 or less individuals; RBC - Russian blue cat.
Table 2.
Percentage distribution of individual types of consolidation.
| Consolidation type | n | % |
| Shred | 460 | 47.10% |
| Shred/Tissue | 145 | 14.80% |
| Mass | 99 | 10.10% |
| Nodule | 82 | 8.40% |
| Tissue | 77 | 7.90% |
| Mass/Tissue | 32 | 3.30% |
| Wedge | 25 | 2.60% |
| Shred/Wdge | 19 | 1.90% |
| Mass/Nodule | 18 | 1.80% |
| Shred/Nodule | 13 | 1.30% |
| Nodule/Tissue | 4 | 0.30% |
| Tissue/Wedge | 4 | 0.30% |
| Nodule/Wedge | 2 | 0.10% |
| All | 981 | 100.0% |
Table 3.
Comparison of consolidation types in terms of bronchogram.
| Consolidation type | ||||||||||||||
| Bronchogram type | S | S/T | M | N | T | M/T | W | S/W | MN | S/N | χ2 | p | Vc | |
| Ab | n | 3 | 1 | 89 | 76 | 0 | 11 | 17 | 4 | 15 | 3 | 2073.85 | <0.001 | 0.57 |
| % | 1.0% | 0.7% | 93.7% | 97.4% | 0.0% | 34.4% | 94.4 % | 30.8% | 93.8% | 27.3% | ||||
| Rest | -8.99 | -6.16 | 12.23 | 11.71 | -4.43 | 0.72 | 5.38 | 0.21 | 5.02 | -0.03 | ||||
| Db | n | 229 | 1 | 0 | 0 | 0 | 0 | 0 | 0 | 0 | 0 | |||
| % | 73.2% | 0.7% | 0.0% | 0.0% | 0.0% | 0.0% | 0.0% | 0.0% | 0.0% | 0.0% | ||||
| Rest | 14.46 | -6.32 | -5.26 | -4.76 | -4.54 | -3.05 | -2.29 | -1.94 | -2.16 | -1.79 | ||||
| Sb | n | 18 | 5 | 0 | 0 | 17 | 0 | 0 | 1 | 0 | 1 | |||
| % | 5.8% | 3.5% | 0.0% | 0.0% | 23.9% | 0.0% | 0.0% | 7.7% | 0.0% | 9.1% | ||||
| Rest | 0.34 | -0.96 | -2.25 | -2.04 | 6.81 | -1.3 | -0.98 | 0.37 | -0.92 | 0.54 | ||||
| Fb | n | 1 | 0 | 0 | 0 | 13 | 2 | 0 | 0 | 0 | 0 | |||
| % | 0.3% | 0.0% | 0.0% | 0.0% | 18.3% | 6.3% | 0.0% | 0.0% | 0.0% | 0.0% | ||||
| Rest | -2.12 | -1.71 | -1.39 | -1.26 | 9.65 | 1.68 | -0.6 | -0.51 | -0.57 | -0.47 | ||||
| Db/Sb | n | 59 | 73 | 1 | 0 | 1 | 1 | 0 | 0 | 0 | 2 | |||
| % | 18.8% | 50.7% | 1.1% | 0.0% | 1.4% | 3.1% | 0.0% | 0.0% | 0.0% | 18.2% | ||||
| Rest | 0.65 | 9.62 | -3.81 | -3.68 | -3.22 | -1.93 | -1.77 | -1.5 | -1.66 | 0.07 | ||||
| Sb/Fb | n | 3 | 11 | 0 | 0 | 38 | 0 | 0 | 0 | 0 | 0 | |||
| % | 1.0% | 7.6% | 0.0% | 0.0% | 53.5% | 0.0% | 0.0% | 0.0% | 0.0% | 0.0% | ||||
| Rest | -3.87 | 0.5 | -2.5 | -2.26 | 15.43 | -1.45 | -1.09 | -0.92 | -1.03 | -0.85 | ||||
| Db/Sb/Fb | n | 0 | 53 | 0 | 0 | 0 | 0 | 0 | 0 | 0 | 1 | |||
| % | 0.0% | 36.8% | 0.0% | 0.0% | 0.0% | 0.0% | 0.0% | 0.0% | 0.0% | 9.1% | ||||
| Rest | -4.62 | 13.77 | -2.55 | -2.31 | -2.2 | -1.48 | -1.11 | -0.94 | -1.05 | 0.29 | ||||
| Db/Ab | n | 0 | 0 | 0 | 1 | 0 | 1 | 1 | 5 | 0 | 3 | |||
| % | 0.0% | 0.0% | 0.0% | 1.3% | 0.0% | 3.1% | 5.6% | 38.5% | 0.0% | 27.3% | ||||
| Rest | -2.09 | -1.42 | -1.15 | -0.08 | -0.99 | 0.83 | 1.5 | 11.33 | -0.47 | 7.28 | ||||
| Sb/Ab | n | 0 | 0 | 5 | 1 | 2 | 17 | 0 | 3 | 1 | 1 | |||
| % | 0.0% | 0.0% | 5.3% | 1.3% | 2.8% | 53.1% | 0.0% | 23.1% | 6.3% | 9.1% | ||||
| Rest | -3.45 | -2.34 | 0.74 | -1.14 | -0.42 | 14.33 | -0.83 | 3.57 | 0.5 | 0.9 | ||||
Abbreviations: Ab - absence of bronchogram; Db - dynamic bronchogram; Fb - fluid bronchogram; M- mass; N- nodule; n- number of animals; p - statistical significance; S- shred; Sb - static bronchogram; T- tissue; W- wedge; Vc - effect size; χ2 - chi square test result.
Table 4.
Comparison of consolidation types in terms of vascularity.
| Consolidation type | ||||||||||||||
| Vascularisation type | S | S/T | M | N | T | M/T | W | S/W | M/N | S/N | χ2 | p | Vc | |
| Tv | n | 146 | 24 | 0 | 0 | 1 | 0 | 0 | 0 | 0 | 2 | 1011.32 | <0.001 | 0.69 |
| % | 88.0% | 30.0% | 0.0% | 0.0% | 2.7% | 0.0% | 0.0% | 0.0% | 0.0% | 33.3% | ||||
| Rest | 9.6 | -1.48 | -5.25 | -1.68 | -3.61 | -3.05 | -2.62 | -2.2 | -2.11 | -0.28 | ||||
| Rv | n | 19 | 56 | 0 | 1 | 35 | 3 | 0 | 0 | 1 | 4 | |||
| % | 11.4% | 70.0% | 0.0% | 14.3% | 94.6% | 13.0% | 0.0% | 0.0% | 9.1% | 66.7% | ||||
| Rest | -4.01 | 7.14 | -4.35 | -0.68 | 7.69 | -1.35 | -2.18 | -1.83 | -1.18 | 1.8 | ||||
| Hv | n | 0 | 0 | 59 | 6 | 0 | 16 | 0 | 0 | 10 | 0 | |||
| % | 0.0% | 0.0% | 86.8% | 85.7% | 0.0% | 69.6% | 0.0% | 0.0% | 90.9% | 0.0% | ||||
| Rest | -5.95 | -4.13 | 11.69 | 3.69 | -2.81 | 5.01 | -1.9 | -1.6 | 5 | -1.13 | ||||
| Hv/Pv | n | 0 | 0 | 6 | 0 | 0 | 2 | 0 | 0 | 0 | 0 | |||
| % | 0.0% | 0.0% | 8.8% | 0.0% | 0.0% | 8.7% | 0.0% | 0.0% | 0.0% | 0.0% | ||||
| Rest | -1.76 | -1.22 | 4.19 | -0.36 | -0.83 | 2.39 | -0.56 | -0.47 | -0.45 | -0.34 | ||||
| Pv | n | 0 | 0 | 3 | 0 | 0 | 2 | 0 | 0 | 0 | 0 | |||
| % | 0.0% | 0.0% | 4.4% | 0.0% | 0.0% | 8.7% | 0.0% | 0.0% | 0.0% | 0.0% | ||||
| Rest | -1.39 | -0.97 | 2.47 | -0.29 | -0.66 | 3.33 | -0.45 | -0.37 | -0.36 | -0.27 | ||||
| Vs | n | 1 | 0 | 0 | 0 | 1 | 0 | 17 | 12 | 0 | 0 | |||
| % | 0.6% | 0.0% | 0.0% | 0.0% | 2.7% | 0.0% | 100.0% | 100.0% | 0.0% | 0.0% | ||||
| Rest | -3.18 | -2.41 | -2.22 | -0.71 | -1.03 | -1.29 | 14.19 | 11.92 | -0.89 | -0.66 | ||||
Abbreviations: Hv - chaotic vascularization; M-mass; n - number of observations; N- nodule; p - statistical significance; Pv - vascularization penetrating inside the consolidation from the chest wall; Rv - residual vascularization; S- shred; T-tissue; Tv - tree like vascularization; W-wedge; Vc - effect size; Vs - vascular sign; χ2 - chi square test result.
Table 5.
Comparison of consolidation types in terms of diagnosis.
| Consolidation type | ||||||||||||||
| Diagnosis | S | S/T | M | N | T | M/T | W | S/W | M/N | S/N | χ2 | p | Vc | |
| ARDS | n | 29 | 0 | 0 | 0 | 2 | 0 | 1 | 0 | 0 | 0 | 5040.92 | <0.001 | 0.76 |
| % | 6.3% | 0.0% | 0.0% | 0.0% | 2.6% | 0.0% | 4.0% | 0.0% | 0.0% | 0.0% | ||||
| Rest | 3.58 | -2.18 | -1.79 | -1.64 | -0.33 | -1.01 | 0.2 | -0.79 | -0.77 | -0.65 | ||||
| PLD | n | 33 | 2 | 0 | 0 | 0 | 0 | 1 | 0 | 0 | 0 | |||
| % | 7.2% | 1.4% | 0.0% | 0.0% | 0.0% | 0.0% | 4.0% | 0.0% | 0.0% | 0.0% | ||||
| Rest | 3.89 | -1.45 | -1.9 | -1.74 | -1.69 | -1.07 | 0.08 | -0.84 | -0.82 | -0.69 | ||||
| Tumor | n | 1 | 0 | 80 | 5 | 2 | 4 | 0 | 0 | 1 | 1 | |||
| % | 0.2% | 0.0% | 81.6% | 6.1% | 2.6% | 12.9% | 0.0% | 0.0% | 5.6% | 7.7% | ||||
| Rest | -6.51 | -3.74 | 22.95 | -1.03 | -1.99 | 0.58 | -1.55 | -1.35 | -0.56 | -0.23 | ||||
| Tumor/Atelectasis | n | 0 | 1 | 11 | 1 | 3 | 25 | 0 | 0 | 1 | 0 | |||
| % | 0.0% | 0.7% | 11.2% | 1.2% | 3.9% | 80.6% | 0.0% | 0.0% | 5.6% | 0.0% | ||||
| Rest | -4.45 | -2.1 | 3.3 | -1.35 | -0.17 | 20.48 | -1.04 | -0.9 | 0.26 | -0.75 | ||||
| Tumor/Metastasis | n | 0 | 0 | 3 | 5 | 0 | 0 | 0 | 0 | 16 | 2 | |||
| % | 0.0% | 0.0% | 3.1% | 6.1% | 0.0% | 0.0% | 0.0% | 0.0% | 88.9% | 15.4% | ||||
| Rest | -3.5 | -1.97 | 0.24 | 1.9 | -1.43 | -0.91 | -0.82 | -0.71 | 22.4 | 2.81 | ||||
| Tumor/Granuloma | n | 0 | 0 | 0 | 1 | 0 | 0 | 0 | 0 | 0 | 0 | |||
| % | 0.0% | 0.0% | 0.0% | 1.2% | 0.0% | 0.0% | 0.0% | 0.0% | 0.0% | 0.0% | ||||
| Rest | -0.69 | -0.39 | -0.32 | 3.16 | -0.28 | -0.18 | -0.16 | -0.14 | -0.14 | -0.12 | ||||
| Tumor/CHF | n | 0 | 0 | 2 | 0 | 0 | 1 | 0 | 0 | 0 | 0 | |||
| % | 0.0% | 0.0% | 2.0% | 0.0% | 0.0% | 3.2% | 0.0% | 0.0% | 0.0% | 0.0% | ||||
| Rest | -1.19 | -0.67 | 3.09 | -0.5 | -0.49 | 2.93 | -0.28 | -0.24 | -0.24 | -0.2 | ||||
| Atelectasis | n | 1 | 8 | 0 | 0 | 30 | 0 | 0 | 0 | 0 | 1 | |||
| % | 0.2% | 5.5% | 0.0% | 0.0% | 39.0% | 0.0% | 0.0% | 0.0% | 0.0% | 7.7% | ||||
| Rest | -4.11 | 0.84 | -2.01 | -1.83 | 15.1 | -1.13 | -1.01 | -0.88 | -0.86 | 0.64 | ||||
| Atelectasis?CHF | n | 0 | 1 | 0 | 0 | 23 | 0 | 0 | 0 | 0 | 0 | |||
| % | 0.0% | 0.7% | 0.0% | 0.0% | 29.9% | 0.0% | 0.0% | 0.0% | 0.0% | 0.0% | ||||
| Rest | -3.36 | -1.36 | -1.55 | -1.42 | 15.33 | -0.87 | -0.78 | -0.68 | -0.67 | -0.57 | ||||
| Atelectasis/CHF/Parenchymal lung disease | n | 0 | 1 | 0 | 0 | 0 | 0 | 0 | 0 | 0 | 0 | |||
| % | 0.0% | 0.7% | 0.0% | 0.0% | 0.0% | 00% | 0.0% | 0.0% | 0.0% | 0.0% | ||||
| Rest | -0.69 | 2.21 | -0.32 | -0.29 | -0.28 | -0.18 | -0.16 | -0.14 | -0.14 | -0.12 | ||||
| Pulmonary edema | n | 1 | 0 | 0 | 0 | 0 | 0 | 0 | 0 | 0 | 0 | |||
| % | 0.2% | 0.0% | 0.0% | 0.0% | 0.0% | 0.0% | 0.0% | 0.0% | 0.0% | 0.0% | ||||
| Rest | 0.77 | -0.39 | -0.32 | -0.29 | -0.28 | -0.18 | -0.16 | -0.14 | -0.14 | -0.12 | ||||
| Metastasis | n | 0 | 0 | 0 | 64 | 0 | 0 | 0 | 0 | 0 | 1 | |||
| % | 0.0% | 0.0% | 0.0% | 78.0% | 0.0% | 0.0% | 0.0% | 0.0% | 0.0% | 7.7% | ||||
| Rest | -5.54 | -3.11 | -2.56 | 25.03 | -2.27 | -1.44 | -1.29 | -1.13 | -1.1 | 0.14 | ||||
| Metastasis/Atelectasis | n | 0 | 0 | 0 | 2 | 0 | 0 | 0 | 0 | 0 | 3 | |||
| % | 0.0% | 0.0% | 0.0% | 2.4% | 0.0% | 0.0% | 0.0% | 0.0% | 0.0% | 23.1% | ||||
| Rest | -1.82 | -1.02 | -0.84 | 1.84 | -0.74 | -0.47 | -0.42 | -0.37 | -0.36 | 9.51 | ||||
| Pneumonia/ARDS | n | 10 | 3 | 0 | 0 | 0 | 0 | 1 | 1 | 0 | 0 | |||
| % | 2.2% | 2.1% | 0.0% | 0.0% | 0.0% | 0.0% | 4.0% | 5.3% | 0.0% | 0.0% | ||||
| Rest | 1.1 | 0.52 | -1.23 | -1.12 | -1.09 | -0.69 | 0.99 | 1.31 | -0.53 | -0.45 | ||||
| Pneumonia | n | 248 | 30 | 0 | 0 | 2 | 0 | 0 | 0 | 0 | 1 | |||
| % | 53.9% | 20.7% | 0.0% | 0.0% | 2.6% | 0.0% | 0.0% | 0.0% | 0.0% | 7.7% | ||||
| Rest | 10.02 | -1.82 | -5.31 | -4.86 | -4.29 | -2.99 | -2.68 | -2.34 | -2.28 | -1.42 | ||||
| Pneumonia/PLD | n | 19 | 4 | 0 | 0 | 0 | 0 | 0 | 0 | 0 | 0 | |||
| % | 4.1% | 2.8% | 0.0% | 0.0% | 0.0% | 0.0% | 0.0% | 0.0% | 0.0% | 0.0% | ||||
| Rest | 2.28 | 0.23 | -1.55 | -1.42 | -1.38 | -0.87 | -0.78 | -0.68 | -0.67 | -0.57 | ||||
| Pneumonia/Atelectasis | n | 17 | 84 | 1 | 0 | 6 | 1 | 0 | 0 | 0 | 2 | |||
| % | 3.7% | 57.9% | 1.0% | 0.0% | 7.8% | 3.2% | 0.0% | 0.0% | 0.0% | 15.4% | ||||
| Rest | -4.89 | 16.61 | -3.04 | -3.06 | -0.93 | -1.35 | -1.69 | -1.47 | -1.43 | 0.43 | ||||
| Pneumonia/Atelectasis/CHF | n | 0 | 8 | 0 | 0 | 2 | 0 | 0 | 0 | 0 | 0 | |||
| % | 0.0% | 5.5% | 0.0% | 0.0% | 2.6% | 0.0% | 0.0% | 0.0% | 0.0% | 0.0% | ||||
| Rest | -2.17 | 5.34 | -1 | -0.92 | 1.36 | -0.56 | -0.51 | -0.44 | -0.43 | -0.37 | ||||
| Pneumonia/Abscess | n | 0 | 0 | 1 | 0 | 1 | 0 | 0 | 0 | 0 | 1 | |||
| % | 0.0% | 0.0% | 1.0% | 0.0% | 1.3% | 0.0% | 0.0% | 0.0% | 0.0% | 7.7% | ||||
| Rest | -1.19 | -0.67 | 1.27 | -0.5 | 1.57 | -0.31 | -0.28 | -0.24 | -0.24 | 4.8 | ||||
| Pneumonia/PTE | n | 0 | 0 | 0 | 0 | 0 | 0 | 3 | 12 | 0 | 0 | |||
| % | 0.0% | 0.0% | 0.0% | 0.0% | 0.0% | 0.0% | 12.0% | 63.2% | 0.0% | 0.0% | ||||
| Rest | -2.66 | -1.49 | -1.23 | -1.12 | -1.09 | -0.69 | 4.22 | 21.65 | -0.53 | -0.45 | ||||
| Pneumonia/ PTE ARDS | n | 0 | 0 | 0 | 0 | 0 | 0 | 0 | 2 | 0 | 0 | |||
| % | 0.0% | 0.0% | 0.0% | 0.0% | 0.0% | 0.0% | 0.0% | 10.5% | 0.0% | 0.0% | ||||
| Rest | -0.97 | -0.55 | -0.45 | -0.41 | -0.4 | -0.25 | -0.23 | 9.93 | -0.19 | -0.16 | ||||
| Pneumonia/Granuloma | n | 0 | 0 | 0 | 0 | 0 | 0 | 0 | 0 | 0 | 1 | |||
| % | 0.0% | 0.0% | 0.0% | 0.0% | 0.0% | 0.0% | 0.0% | 0.0% | 0.0% | 7.7% | ||||
| Rest | -0.97 | -0.55 | -0.45 | -0.41 | -0.4 | -0.25 | -0.23 | -0.2 | -0.19 | 5.96 | ||||
| Pneumonia/CHF | n | 98 | 3 | 0 | 0 | 2 | 0 | 0 | 0 | 0 | 0 | |||
| % | 21.3% | 2.1% | 0.0% | 0.0% | 2.6% | 0.0% | 0.0% | 0.0% | 0.0% | 0.0% | ||||
| Rest | 7.09 | -3.15 | -3.22 | -2.94 | -2.15 | -1.81 | -1.63 | -1.42 | -1.38 | -1.17 | ||||
| Pneumonia/ CHF/ARDS | n | 1 | 0 | 0 | 0 | 0 | 0 | 0 | 0 | 0 | 0 | |||
| % | 0.2% | 0.0% | 0.0% | 0.0% | 0.0% | 0.0% | 0.0% | 0.0% | 0.0% | 0.0% | ||||
| Rest | 0.77 | -0.39 | -0.32 | -0.29 | -0.28 | -0.18 | -0.16 | -0.14 | -0.14 | -0.12 | ||||
| PTE | n | 1 | 0 | 0 | 0 | 0 | 0 | 14 | 3 | 0 | 0 | |||
| % | 0.2% | 0.0% | 0.0% | 0.0% | 0.0% | 0.0% | 56.0% | 15.8% | 0.0% | 0.0% | ||||
| Rest | -2.57 | -1.64 | -1.35 | -1.23 | -1.19 | -0.76 | 19.93 | 4.47 | -0.58 | -0.49 | ||||
| Metastasis/ARDS | n | 0 | 0 | 0 | 0 | 1 | 0 | 4 | 0 | 0 | 0 | |||
| % | 0.0% | 0.0% | 0.0% | 0.0% | 1.3% | 0.0% | 16.0% | 0.0% | 0.0% | 0.0% | ||||
| Rest | -1.54 | -0.86 | -0.71 | -0.65 | 0.96 | -0.4 | 10.81 | -0.31 | -0.3 | -0.26 | ||||
| PTE/Metastasis | n | 0 | 0 | 0 | 0 | 0 | 0 | 0 | 0 | 0 | 0 | |||
| % | 0.0% | 0.0% | 0.0% | 0.0% | 0.0% | 0.0% | 0.0% | 0.0% | 0.0% | 0.0% | ||||
| Rest | -0.69 | -0.39 | -0.32 | -0.29 | -0.28 | -0.18 | -0.16 | -0.14 | -0.14 | -0.12 | ||||
| PTE/CHF | n | 0 | 0 | 0 | 0 | 0 | 0 | 1 | 1 | 0 | 0 | |||
| % | 0.0% | 0.0% | 0.0% | 0.0% | 0.0% | 0.0% | 4.0% | 5.3% | 0.0% | 0.0% | ||||
| Rest | -0.97 | -0.55 | -0.45 | -0.41 | -0.4 | -0.25 | 4.19 | 4.87 | -0.19 | -0.16 | ||||
| Granuloma | n | 0 | 0 | 0 | 4 | 0 | 0 | 0 | 0 | 0 | 0 | |||
| % | 0.0% | 0.0% | 0.0% | 4.9% | 0.0% | 0.0% | 0.0% | 0.0% | 0.0% | 0.0% | ||||
| Rest | -1.37 | -0.77 | -0.63 | 6.32 | -0.56 | -0.36 | -0.32 | -0.28 | -0.27 | -0.23 | ||||
| CHF | n | 1 | 0 | 0 | 0 | 3 | 0 | 0 | 0 | 0 | 0 | |||
| % | 0.2% | 0.0% | 0.0% | 0.0% | 3.9% | 0.0% | 0.0% | 0.0% | 0.0% | 0.0% | ||||
| Rest | -0.65 | -0.77 | -0.63 | -0.58 | 4.78 | -0.36 | -0.32 | -0.28 | -0.27 | -0.23 | ||||
Abbreviations: CHF- congestive heart failure; M-mass; N-nodule; p - statistical significance; PLD – parenchymal lung disease; PTE – pulmonary thromboembolic disease; S-shred; T-tissue; W-wedge; Vc - effect size; χ2 - chi square test result.
Table 6.
Comparison of dog breeds in terms of the frequency of occurrence of individual simple lesions.
Table 6.
Comparison of dog breeds in terms of the frequency of occurrence of individual simple lesions.
| Dogs breeds | |||||||||||||||||||||
| Diagnoza | 1. | 2. | 3. | 4. | 5. | 6. | 7. | 8. | 9. | 10. | 11. | 12. | 13. | 14. | 15. | 16. | 17. | χ2 | p | Vc | |
| ARDS | n | 3 | 0 | 0 | 0 | 0 | 4 | 1 | 1 | 0 | 0 | 0 | 0 | 0 | 1 | 2 | 2 | 8 | 177.38 | 0.003 | 0.28 |
| % | 2.9% | 0.0% | 0.0% | 0.0% | 0.0% | 33.3% | 14.3% | 8.3% | 0.0% | 0.0% | 0.0% | 0.0% | 0.0% | 20.0% | 28.6% | 11.8% | 16.0% | ||||
| Rest | -1.74 | -0.72 | -0.87 | -0.95 | -1.06 | 3.26 | 0.65 | 0.1 | -0.82 | -0.78 | -0.47 | -0.72 | -0.72 | 1.02 | 2.03 | 0.64 | 2.19 | ||||
| PLD | n | 7 | 0 | 0 | 1 | 0 | 1 | 0 | 1 | 0 | 2 | 0 | 0 | 0 | 1 | 1 | 1 | 5 | |||
| % | 6.7% | 0.0% | 0.0% | 8.3% | 0.0% | 8.3% | 0.0% | 8.3% | 0.0% | 25.0% | 0.0% | 0.0% | 0.0% | 20.0% | 14.3% | 5.9% | 10.0% | ||||
| Rest | -0.06 | -0.69 | -0.83 | 0.2 | -1.01 | 0.2 | -0.69 | 0.2 | -0.78 | 1.97 | -0.45 | -0.69 | -0.69 | 1.13 | 0.76 | -0.15 | 0.86 | ||||
| Tumor | n | 18 | 1 | 1 | 0 | 2 | 0 | 0 | 2 | 4 | 0 | 0 | 0 | 2 | 0 | 0 | 3 | 4 | |||
| % | 17.1% | 14.3% | 10.0% | 0.0% | 13.3% | 0.0% | 0.0% | 16.7% | 44.4% | 0.0% | 0.0% | 0.0% | 28.6% | 0.0% | 0.0% | 17.6% | 8.0% | ||||
| Rest | 1.3 | 0.12 | -0.23 | -1.23 | 0.08 | -1.23 | -0.94 | 0.39 | 2.69 | -1.01 | -0.62 | -0.94 | 1.19 | -0.79 | -0.94 | 0.58 | -0.92 | ||||
| Atelectasis | n | 4 | 0 | 0 | 2 | 1 | 0 | 0 | 0 | 0 | 0 | 0 | 2 | 1 | 0 | 0 | 0 | 2 | |||
| % | 3.8% | 0.0% | 0.0% | 16.7% | 6.7% | 0.0% | 0.0% | 0.0% | 0.0% | 0.0% | 0.0% | 28.6% | 14.3% | 0.0% | 0.0% | 0.0% | 4.0% | ||||
| Rest | -0.14 | -0.54 | -0.64 | 2.15 | 0.49 | -0.7 | -0.54 | -0.7 | -0.61 | -0.57 | -0.35 | 3.2 | 1.33 | -0.45 | -0.54 | -0.83 | -0.03 | ||||
| Pulmonary edema | n | 0 | 0 | 0 | 0 | 0 | 0 | 0 | 0 | 0 | 0 | 0 | 0 | 0 | 0 | 0 | 0 | 1 | |||
| % | 0.0% | 0.0% | 0.0% | 0.0% | 0.0% | 0.0% | 0.0% | 0.0% | 0.0% | 0.0% | 0.0% | 0.0% | 0.0% | 0.0% | 0.0% | 0.0% | 2.0% | ||||
| Rest | -0.6 | -0.15 | -0.18 | -0.2 | -0.23 | -0.2 | -0.15 | -0.2 | -0.18 | -0.17 | -0.1 | -0.15 | -0.15 | -0.13 | -0.15 | -0.24 | 2.01 | ||||
| Metastasis | n | 23 | 1 | 1 | 2 | 2 | 0 | 3 | 1 | 2 | 0 | 0 | 0 | 1 | 0 | 0 | 5 | 3 | |||
| % | 21.9% | 14.3% | 10.% | 16.7% | 13.3% | 0.0% | 42.9% | 8.3% | 22.2% | 0.0% | 0.0% | 0.0% | 14.3% | 0.0% | 0.0% | 29.40% | 6.0% | ||||
| Rest | 1.82 | -0.05 | -0.41 | 0.15 | -0.17 | -1.34 | 1.9 | -0.6 | 0.56 | -1.1 | -0.67 | -1.03 | -0.05 | -0.87 | -1.03 | 1.53 | -1.65 | ||||
| Pneumonia | n | 47 | 4 | 8 | 7 | 9 | 7 | 3 | 4 | 3 | 6 | 3 | 5 | 3 | 3 | 3 | 6 | 22 | |||
| % | 44.8% | 57.1% | 80.% | 58.3% | 60.0% | 58.3% | 42.9% | 33.3% | 33.3% | 75.0% | 100.0% | 71.4% | 42.9% | 60.0% | 42.9% | 35.3% | 44.0% | ||||
| Rest | -0.59 | 0.32 | 1.41 | 0.47 | 0.62 | 0.47 | -0.23 | -0.77 | -0.66 | 1.06 | 1.27 | 0.86 | -0.23 | 0.36 | -0.23 | -0.8 | -0.49 | ||||
| PTE | n | 3 | 0 | 0 | 0 | 1 | 0 | 0 | 3 | 0 | 0 | 0 | 0 | 0 | 0 | 1 | 0 | 5 | |||
| % | 2.9% | 0.0% | 0.0% | 0.0% | 6.7% | 0.0% | 0.0% | 25.0% | 0.0% | 0.0% | 0.0% | 0.0% | 0.0% | 0.0% | 14.3% | 0.0% | 10.0% | ||||
| Rest | -0.77 | -0.56 | -0.67 | -0.73 | 0.41 | -0.73 | -0.56 | 3.38 | -0.63 | -0.6 | -0.36 | -0.56 | -0.56 | -0.47 | 1.24 | -0.87 | 1.87 | ||||
| Granuloma | n | 0 | 1 | 0 | 0 | 0 | 0 | 0 | 0 | 0 | 0 | 0 | 0 | 0 | 0 | 0 | 0 | 0 | |||
| % | 0.0% | 14.3% | 0.0% | 0.0% | 0.0% | 0.0% | 0.0% | 0.0% | 0.0% | 0.0% | 0.0% | 0.0% | 0.0% | 0.0% | 0.0% | 0.0% | 0.0% | ||||
| Rest | -0.6 | 6.32 | -0.18 | -0.2 | -0.23 | -0.2 | -0.15 | -0.2 | -0.18 | -0.17 | -0.1 | -0.15 | -0.15 | -0.13 | -0.15 | -0.24 | -0.41 | ||||
Abbreviations: 1. Mixbreed; 2. Beagle; 3. Border Collie; 4. French Bulldog; 5. Cavalier King Charles Spaniel; 6. Chihuahua; 7. Jack Russell Terrier; 8. Dachshund; 9. Labrador Retriever; 10. Maltanese; 11. Maltipoo; 12. Pug; 13. German Shepard; 14. Miniature Pincher; 15. Shih Tzu; 16. Miniature Schnauzer; 17. Yorkshire Terrier; CHF- congestive heart failure; n - number of observations; p - statistical significance; PLD – parenchymal lung disease; PTE – pulmonary thromboembolic disease; Vc - effect size; χ2 - chi square test result.
Table 7.
Comparison of dog breeds in terms of the frequency of occurrence of individual complex lesions.
Table 7.
Comparison of dog breeds in terms of the frequency of occurrence of individual complex lesions.
| Dogs breeds | |||||||||||||||||||||
| Diagnosis | 1. | 2. | 3. | 4. | 5. | 6. | 7. | 8. | 9. | 10. | 11. | 12. | 13. | 14. | 15. | 16. | 17. | χ2 | p | Vc | |
| Tumor/Atelectasis | n | 8 | 1 | 1 | 1 | 0 | 0 | 1 | 2 | 0 | 0 | 0 | 0 | 2 | 0 | 1 | 1 | 2 | 345.01 | <0.001 | 0.33 |
| % | 11.1% | 25.0% | 20.0% | 12.5% | 0.0% | 0.0% | 10.0% | 33.3% | 0.0% | 0.0% | 0.0% | 0.0% | 50.0% | 0.0% | 8.3% | 16.7% | 4.7% | ||||
| Rest | 0.53 | 1.04 | 0.79 | 0.31 | -1.36 | -0.86 | 0.08 | 1.95 | -0.3 | -0.8 | -0.68 | -0.53 | 2.69 | -0.53 | -0.1 | 0.6 | -0.99 | ||||
| Tumor/Metastasis | n | 14 | 0 | 0 | 1 | 0 | 0 | 0 | 1 | 1 | 1 | 0 | 0 | 0 | 0 | 0 | 0 | 1 | |||
| % | 19.4% | 0.0% | 0.0% | 12.5% | 0.0% | 0.0% | 0.0% | 16.7% | 100.0% | 14.3% | 0.0% | 0.0% | 0.0% | 0.0% | 0.0% | 0.0% | 2.3% | ||||
| Rest | 3.07 | -0.59 | -0.66 | 0.36 | -1.32 | -0.84 | -0.94 | 0.65 | 3.08 | 0.49 | -0.66 | -0.51 | -0.59 | -0.51 | -1.03 | -0.72 | -1.42 | ||||
| Tumor/Granuloma | n | 1 | 0 | 0 | 0 | 0 | 0 | 0 | 0 | 0 | 0 | 0 | 0 | 0 | 0 | 0 | 0 | 0 | |||
| % | 1.4% | 0.0% | 0.0% | 0.0% | 0.0% | 0.0% | 0.0% | 0.0% | 0.0% | 0.0% | 0.0% | 0.0% | 0.0% | 0.0% | 0.0% | 0.0% | 0.0% | ||||
| Rest | 1.16 | -0.14 | -0.15 | -0.19 | -0.3 | -0.19 | -0.21 | -0.17 | -0.07 | -0.18 | -0.15 | -0.12 | -0.14 | -0.12 | -0.24 | -0.17 | -0.45 | ||||
| Atelectasis/Pneumonia | n | 1 | 0 | 2 | 0 | 0 | 0 | 0 | 0 | 0 | 0 | 0 | 0 | 0 | 0 | 0 | 0 | 0 | |||
| % | 1.4% | 0.0% | 40.0% | 0.0% | 0.0% | 0.0% | 0.0% | 0.0% | 0.0% | 0.0% | 0.0% | 0.0% | 0.0% | 0.0% | 0.0% | 0.0% | 0.0% | ||||
| Rest | 0 | -0.24 | 7.34 | -0.33 | -0.53 | -0.33 | -0.37 | -0.29 | -0.12 | -0.31 | -0.26 | -0.2 | -0.24 | -0.2 | -0.41 | -0.29 | -0.77 | ||||
| Atelectasis/CHF | n | 3 | 1 | 0 | 0 | 0 | 0 | 0 | 0 | 0 | 0 | 0 | 0 | 0 | 0 | 0 | 0 | 2 | |||
| % | 4.2% | 25.0% | 0.0% | 0.0% | 0.0% | 0.0% | 0.0% | 0.0% | 0.0% | 0.0% | 0.0% | 0.0% | 0.0% | 00% | 0.0% | 0.0% | 4.7% | ||||
| Rest | 0.72 | 2.67 | -0.37 | -0.47 | -0.74 | -0.47 | -0.53 | -0.41 | -0.17 | -0.44 | -0.37 | -0.29 | -0.33 | -0.29 | -0.58 | -0.41 | 0.74 | ||||
| Metastasis/Atelectasis | n | 0 | 0 | 0 | 0 | 0 | 0 | 1 | 0 | 0 | 0 | 0 | 1 | 0 | 0 | 0 | 0 | 1 | |||
| % | 0.0% | 0.0% | 0.0% | 0.0% | 0.0% | 0.0% | 10.0% | 0.0% | 0.0% | 0.0% | 0.0% | 33.3% | 0.0% | 0.0% | 0.0% | 0.0% | 2.3% | ||||
| Rest | -1 | -0.24 | -0.26 | -0.33 | -0.53 | -0.33 | 2.32 | -0.29 | -0.12 | -0.31 | -0.26 | 4.71 | -0.24 | -0.2 | -0.41 | -0.29 | 0.53 | ||||
| Pneumonia/ARDS | n | 4 | 0 | 0 | 0 | 0 | 1 | 0 | 0 | 0 | 0 | 0 | 0 | 0 | 0 | 0 | 0 | 6 | |||
| % | 5.6% | 0.0% | 0.0% | 0.0% | 0.0% | 12.5% | 0.0% | 0.0% | 0.0% | 0.0% | 0.0% | 0.0% | 0.0% | 0.0% | 0.0% | 0.0% | 14.0% | ||||
| Rest | 0.18 | -0.45 | -0.5 | -0.64 | -1.01 | 0.93 | -0.71 | -0.55 | -0.23 | -0.6 | -0.5 | -0.39 | -0.45 | -0.39 | -0.78 | -0.55 | 2.59 | ||||
| Pneumonia/PLD | n | 2 | 0 | 0 | 0 | 0 | 0 | 5 | 0 | 0 | 0 | 2 | 0 | 0 | 0 | 0 | 0 | 8 | |||
| % | 2.8% | 0.0% | 0.0% | 0.0% | 0.0% | 0.0% | 50.0% | 0.0% | 0.0% | 0.0% | 40.0% | 0.0% | 0.0% | 0.0% | 0.0% | 0.0% | 18.6% | ||||
| Rest | -1.53 | -0.56 | -0.63 | -0.79 | -1.25 | -0.79 | 4.76 | -0.69 | -0.28 | -0.74 | 2.57 | -0.48 | -0.56 | -0.48 | -0.97 | -0.69 | 2.52 | ||||
| Pneumonia/Atelectasis | n | 15 | 0 | 2 | 6 | 5 | 1 | 1 | 0 | 0 | 0 | 1 | 2 | 2 | 1 | 1 | 2 | 11 | |||
| % | 20.8% | 0.0% | 40.0% | 75.0% | 25.0% | 12.5% | 10.0% | 0.0% | 0.0% | 0.0% | 20.0% | 66.7% | 50.0% | 33.3% | 8.3% | 33.3% | 25.6% | ||||
| Rest | -0.39 | -0.96 | 0.79 | 3.06 | 0.18 | -0.62 | -0.86 | -1.18 | -0.48 | -1.27 | -0.14 | 1.57 | 1.12 | 0.37 | -1.06 | 0.53 | 0.35 | ||||
| Pneumonia/Atelectasis/CHF | n | 1 | 0 | 0 | 0 | 0 | 0 | 0 | 0 | 0 | 0 | 0 | 0 | 0 | 0 | 1 | 1 | 1 | |||
| % | 1.4% | 0.0% | 0.0% | 0.0% | 0.0% | 0.0% | 0.0% | 0.0% | 0.0% | 0.0% | 0.0% | 0.0% | 0.0% | 0.0% | 8.3% | 16.7% | 2.3% | ||||
| Rest | -0.28 | -0.27 | -0.3 | -0.38 | -0.61 | -0.38 | -0.43 | -0.33 | -0.14 | -0.36 | -0.3 | -0.24 | -0.27 | -0.24 | 1.66 | 2.67 | 0.23 | ||||
| Pneumonia/PTE | n | 1 | 0 | 0 | 0 | 0 | 0 | 0 | 1 | 0 | 0 | 2 | 0 | 0 | 1 | 1 | 0 | 3 | |||
| % | 1.4% | 0.0% | 0.0% | 0.0% | 0.0% | 0.0% | 0.0% | 167% | 0.0% | 0.0% | 40.0% | 0.0% | 0.0% | 33.3% | 8.3% | 0.0% | 7.0% | ||||
| Rest | -1.15 | -0.41 | -0.46 | -0.58 | -0.91 | -0.58 | -0.64 | 1.51 | -0.2 | -0.54 | 3.94 | -0.35 | -0.41 | 2.48 | 0.71 | -0.5 | 0.91 | ||||
| Pneumonia/PTE/ARDS | n | 1 | 0 | 0 | 0 | 0 | 0 | 0 | 0 | 0 | 0 | 0 | 0 | 0 | 0 | 0 | 0 | 0 | |||
| % | 1.4% | 0.0% | 0.0% | 0.0% | 0.0% | 0.0% | 0.0% | 0.0% | 0.0% | 0.0% | 0.0% | 0.0% | 0.0% | 0.0% | 0.0% | 0.0% | 0.0% | ||||
| Rest | 1.16 | -0.14 | -0.15 | -0.19 | -0.3 | -0.19 | -0.21 | -0.17 | -0.07 | -0.18 | -0.15 | -0.12 | -0.14 | -0.12 | -0.24 | -0.17 | -0.45 | ||||
| Pneumonia/Granuloma | n | 2 | 0 | 0 | 0 | 0 | 0 | 0 | 0 | 0 | 0 | 0 | 0 | 0 | 0 | 0 | 0 | 0 | |||
| % | 2.8% | 0.0% | 0.0% | 0.0% | 0.0% | 0.0% | 0.0% | 0.0% | 0.0% | 0.0% | 0.0% | 0.0% | 0.0% | 0.0% | 0.0% | 0.0% | 0.0% | ||||
| Rest | 1.64 | -0.19 | -0.21 | -0.27 | -0.43 | -0.27 | -0.3 | -0.24 | -0.1 | -0.25 | -0.21 | -0.17 | -0.19 | -0.17 | -0.33 | -0.24 | -0.63 | ||||
| Pneumonia/CHF | n | 19 | 2 | 0 | 0 | 14 | 4 | 2 | 2 | 0 | 6 | 0 | 0 | 0 | 1 | 8 | 2 | 6 | |||
| % | 26.4% | 50.0% | 0.0% | 0.0% | 70.0% | 50.0% | 20.0% | 33.3% | 0.0% | 85.7% | 0.0% | 0.0% | 0.0% | 33.3% | 66.7% | 33.3% | 14.0% | ||||
| Rest | -0.62 | 0.71 | -1.23 | -1.56 | 3.21 | 1 | -0.6 | 0.13 | -0.55 | 2.65 | -1.23 | -0.96 | -1.1 | 0.09 | 2.28 | 0.13 | -1.96 | ||||
| PTE/ARDS | n | 0 | 0 | 0 | 0 | 1 | 1 | 0 | 0 | 0 | 0 | 0 | 0 | 0 | 0 | 0 | 0 | 2 | |||
| % | 0.0% | 0.0% | 0.0% | 0.0% | 5.0% | 12.5% | 0.0% | 0.0% | 0.0% | 0.0% | 0.0% | 0.0% | 0.0% | 0.0% | 0.0% | 0.0% | 4.7% | ||||
| Rest | -1.15 | -0.27 | -0.3 | -0.38 | 1.04 | 2.22 | -0.43 | -0.33 | -0.14 | -0.36 | -0.3 | -0.24 | -0.27 | -0.24 | -0.47 | -0.33 | 1.36 | ||||
| PTE/Atelectasis | n | 0 | 0 | 0 | 0 | 0 | 1 | 0 | 0 | 0 | 0 | 0 | 0 | 0 | 0 | 0 | 0 | 0 | |||
| % | 0.0% | 0.0% | 0.0% | 0.0% | 0.0% | 12.5% | 0.0% | 0.0% | 0.0% | 0.0% | 0.0% | 0.0% | 0.0% | 0.0% | 0.0% | 0.0% | 0.0% | ||||
| Rest | -0.58 | -0.14 | -0.15 | -0.19 | -0.3 | 5.02 | -0.21 | -0.17 | -0.07 | -0.18 | -0.15 | -0.12 | -0.14 | -0.12 | -0.24 | -0.17 | -0.45 | ||||
Abbreviations: 1. Mixbreed; 2. Beagle; 3. Border Collie; 4. French Bulldog; 5. Cavalier King Charles Spaniel; 6. Chihuahua; 7. Jack Russell Terrier; 8. Dachshund; 9. Labrador Retriever; 10. Maltanese; 11. Maltipoo; 12. Pug; 13. German Shepard; 14. Miniature Pincher; 15. Shih Tzu; 16. Miniature Schnauzer; 17. Yorkshire Terrier; CHF- congestive heart failure; n - number of observations; p - statistical significance; PLD – parenchymal lung disease; PTE – pulmonary thromboembolic disease; Vc - effect size; χ2 - chi square test result.
Table 8.
Comparison of cat breeds in terms of the frequency of occurrence of individual simple lesions.
Table 8.
Comparison of cat breeds in terms of the frequency of occurrence of individual simple lesions.
| Cat breeds | |||||||||||||||
| Diagnosis | Mixbreed | DSH | BSH | Oriental | RBC | Maine Coon | Ragdoll | Persian | Syberian | NFC | Sphinkx | χ2 | p | Vc | |
| ARDS | n | 2 | 1 | 0 | 0 | 0 | 1 | 0 | 0 | 1 | 0 | 0 | 84.48 | 0.345 | 0.23 |
| % | 4.5% | 1.2% | 0.0% | 0.0% | 0.0% | 4.0% | 0.0% | 0.0% | 10.0% | 0.0% | 0.0% | ||||
| Rest | 0.9 | -0.7 | -0.5 | -0.3 | -0.3 | 0.5 | -0.3 | -0.6 | 1.5 | -0.2 | -0.3 | ||||
| PLD | n | 0 | 2 | 0 | 1 | 0 | 1 | 0 | 1 | 0 | 0 | 0 | |||
| % | 0.0% | 2.4% | 0.0% | 25.0% | 0.0% | 4.0% | 0.0% | 7.1% | 0.0% | 0.0% | 0.0% | ||||
| Rest | -1 | 0 | -0.5 | 2.8 | -0.3 | 0.5 | -0.3 | 1.1 | -0.5 | -0.2 | -0.3 | ||||
| Tumor | n | 11 | 16 | 2 | 1 | 0 | 5 | 1 | 3 | 3 | 0 | 1 | |||
| % | 25.0% | 19.5% | 20.0% | 25.0% | 0.0% | 20.0% | 33.3% | 21.4% | 30.0% | 0.0% | 33.3% | ||||
| Rest | 0.5 | -0.4 | -0.1 | 0.2 | -0.8 | -0.2 | 0.4 | 0 | 0.6 | -0.7 | 0.4 | ||||
| Atelectasis | n | 6 | 8 | 0 | 0 | 2 | 3 | 0 | 3 | 2 | 1 | 0 | |||
| % | 13.6% | 9.8% | 0.0% | 0.0% | 66.7% | 12.0% | 0.0% | 21.4% | 20.0% | 50.0% | 0.0% | ||||
| Rest | 0.2 | -0.7 | -1.1 | -0.7 | 2.7 | -0.1 | -0.6 | 0.9 | 0.7 | 1.5 | -0.6 | ||||
| Metastasis | n | 2 | 6 | 0 | 1 | 0 | 1 | 0 | 1 | 0 | 0 | 0 | |||
| % | 4.5% | 7.3% | 0.0% | 25.0% | 0.0% | 4.0% | 0.0% | 7.1% | 0.0% | 0.0% | 0.0% | ||||
| Rest | -0.3 | 0.7 | -0.7 | 1.7 | -0.4 | -0.3 | -0.4 | 0.3 | -0.7 | -0.3 | -0.4 | ||||
| Pneumonia | n | 23 | 41 | 8 | 1 | 0 | 14 | 2 | 6 | 4 | 1 | 2 | |||
| % | 52.3% | 50.0% | 80.0% | 25.0% | 0.0% | 56.0% | 66.7% | 42.9% | 40.0% | 50.0% | 66.7% | ||||
| Rest | 0.1 | -0.1 | 1.3 | -0.7 | -1.2 | 0.4 | 0.4 | -0.4 | -0.5 | 0 | 0.4 | ||||
| PTE | n | 0 | 3 | 0 | 0 | 0 | 0 | 0 | 0 | 0 | 0 | 0 | |||
| % | 0.0% | 3.7% | 0.0% | 0.0% | 0.0% | 0.0% | 0.0% | 0.0% | 0.0% | 0.0% | 0.0% | ||||
| Rest | -0.8 | 1.6 | -0.4 | -0.2 | -0.2 | -0.6 | -0.2 | -0.5 | -0.4 | -0.2 | -0.2 | ||||
| Granuloma | n | 0 | 1 | 0 | 0 | 1 | 0 | 0 | 0 | 0 | 0 | 0 | |||
| % | 0.0% | 1.2% | 0.0% | 0.0% | 33.3% | 0.0% | 0.0% | 0.0% | 0.0% | 0.0% | 0.0% | ||||
| Rest | -0.7 | 0.2 | -0.3 | -0.2 | 5.6 | -0.5 | -0.2 | -0.4 | -0.3 | -0.1 | -0.2 | ||||
| CHF | n | 0 | 4 | 0 | 0 | 0 | 0 | 0 | 0 | 0 | 0 | 0 | |||
| % | 0.0% | 4.9% | 0.0% | 0.0% | 0.0% | 0.0% | 0.0% | 0.0% | 0.0% | 0.0% | 0.0% | ||||
| Rest | -0.9 | 1.8 | -0.4 | -0.3 | -0.2 | -0.7 | -0.2 | -0.5 | -0.4 | -0.2 | -0.2 | ||||
Abbreviations: BSH- British shorthair; CHF- congestive heart failure; DSH- domestic shorthair; n - number of observations; NFC – Norwegian forest cat; p - statistical significance; PLD – parenchymal lung disease; PTE – pulmonary thromboembolic disease; RBC - Russian blue cat; Vc - effect size; χ2 - chi square test result.
Table 9.
Comparison of cat breeds in terms of the frequency of occurrence of individual complex lesions.
Table 9.
Comparison of cat breeds in terms of the frequency of occurrence of individual complex lesions.
| Cats breeds | |||||||||||||||
| Diagnosis | Mixbreed | DSH | BSH | Oriental | RBC | Maine Coon | Ragdoll | Persian | Syberian | NFC | Sphinx | χ2 | p | Vc | |
| Tumor/Atelectasis | n | 8 | 7 | 1 | 0 | 1 | 1 | 0 | 0 | 1 | 0 | 0 | 145.55 | 0.787 | 0.32 |
| % | 16.7% | 13.2% | 7.1% | 0.0% | 100.0% | 16.7% | 0.0% | 0.0% | 25.0% | 0.0% | 0.0% | ||||
| Rest | 0.6 | -0.1 | -0.7 | -0.4 | 2.3 | 0.2 | -0.5 | -0.9 | 0.6 | -0.6 | -0.5 | ||||
| Tumor/Metstasis | n | 2 | 1 | 0 | 0 | 0 | 0 | 0 | 1 | 0 | 0 | 0 | |||
| % | 4.2% | 1.9% | 0.0% | 0.0% | 0.0% | 0.0% | 0.0% | 16.7% | 0.0% | 0.0% | 0.0% | ||||
| Rest | 0.5 | -0.4 | -0.6 | -0.2 | -0.2 | -0.4 | -0.2 | 2 | -0.3 | -0.3 | -0.2 | ||||
| Tumor/CHF | n | 1 | 2 | 0 | 0 | 0 | 0 | 0 | 0 | 0 | 0 | 0 | |||
| % | 2.1% | 3.8% | 0.0% | 0.0% | 0.0% | 0.0% | 0.0% | 0.0% | 0.0% | 0.0% | 0.0% | ||||
| Rest | 0 | 0.8 | -0.5 | -0.1 | -0.1 | -0.4 | -0.2 | -0.4 | -0.3 | -0.3 | -0.2 | ||||
| Atelectasis/CHF | n | 7 | 7 | 4 | 0 | 0 | 0 | 0 | 0 | 0 | 0 | 0 | |||
| % | 14.6% | 13.2% | 28.6% | 0.0% | 0.0% | 0.0% | 0.0% | 0.0% | 0.0% | 0.0% | 0.0% | ||||
| Rest | 0.3 | 0.1 | 1.6 | -0.4 | -0.4 | -0.9 | -0.5 | -0.9 | -0.7 | -0.6 | -0.5 | ||||
| Atelectasis/CHF/PLD | n | 0 | 1 | 0 | 0 | 0 | 0 | 0 | 0 | 0 | 0 | 0 | |||
| % | 0.0% | 1.9% | 0.0% | 0..0% | 0.0% | 0.0% | 0.0% | 0.0% | 0.0% | 0.0% | 0.0% | ||||
| Rest | -0.6 | 1 | -0.3 | -0.1 | -0.1 | -0.2 | -0.1 | -0.2 | -0.2 | -0.1 | -0.1 | ||||
| Metastasis/Atelectasis | n | 1 | 2 | 0 | 0 | 0 | 0 | 0 | 0 | 0 | 0 | 0 | |||
| % | 2.1% | 3.8% | 0.0% | 0.0% | 0.0% | 0.0% | 0.0% | 0.0% | 0.0% | 0.0% | 0.0% | ||||
| Rest | 0 | 0.8 | -0.5 | -0.1 | -0.1 | -0.4 | -0.2 | -0.4 | -0.3 | -0.3 | -0.2 | ||||
| Absces/Cyst | n | 0 | 1 | 0 | 0 | 0 | 0 | 0 | 0 | 0 | 0 | 0 | |||
| % | 0.0% | 1.9% | 0.0% | 0.0% | 0.0% | 0.0% | 0.0% | 0.0% | 0.0% | 0.0% | 0.0% | ||||
| Rest | -0.6 | 1 | -0.3 | -0.1 | -0.1 | -0.2 | -0.1 | -0.2 | -0.2 | -0.1 | -0.1 | ||||
| Pneumonia/ARDS | n | 1 | 0 | 0 | 0 | 0 | 1 | 0 | 1 | 0 | 0 | 0 | |||
| % | 2.1% | 0.0% | 0.0% | 0.0% | 0.0% | 16.7% | 0.0% | 16.7% | 0.0% | 0.0% | 0.0% | ||||
| Rest | 0 | -1.1 | -0.5 | -0.1 | -0.1 | 2.4 | -0.2 | 2.4 | -0.3 | -0.3 | -0.2 | ||||
| Pneumonia/PLD | n | 0 | 0 | 0 | 0 | 0 | 0 | 0 | 0 | 0 | 1 | 0 | |||
| % | 0.0% | 0.0% | 0.0% | 0.0% | 0.0% | 0.0% | 0.0% | 0.0% | 0.0% | 33.3% | 0.0% | ||||
| Rest | -0.6 | -0.6 | -0.3 | -0.1 | -0.1 | -0.2 | -0.1 | -0.2 | -0.2 | 6.7 | -0.1 | ||||
| Pneumonia/Atelectasis | n | 18 | 18 | 4 | 0 | 0 | 0 | 2 | 2 | 1 | 1 | 1 | |||
| % | 37.5% | 34.0% | 28.6% | 0.0% | 0.0% | 0.0% | 100.0% | 33.3% | 25.0% | 33.3% | 50.0% | ||||
| Rest | 0.5 | 0 | -0.3 | -0.6 | -0.6 | -1.4 | 1.6 | 0 | -0.3 | 0 | 0.4 | ||||
| Pneumonia/Atelectasis/CHF | n | 1 | 3 | 1 | 0 | 0 | 0 | 0 | 0 | 0 | 1 | 0 | |||
| % | 2.1% | 5.7% | 7.1% | 0.0% | 0.0% | 0.0% | 0.0% | 0.0% | 0.0% | 33.3% | 0.0% | ||||
| Rest | -0.7 | 0.5 | 0.5 | -0.2 | -0.2 | -0.5 | -0.3 | -0.5 | -0.4 | 2.4 | -0.3 | ||||
| Pneumonia/Absces | n | 0 | 2 | 0 | 0 | 0 | 1 | 0 | 0 | 0 | 0 | 0 | |||
| % | 0.0% | 3.8% | 0.0% | 0.0% | 0.0% | 16.7% | 0.0% | 0.0% | 0.0% | 0.0% | 0.0% | ||||
| Rest | -1 | 0.8 | -0.5 | -0.1 | -0.1 | 2.4 | -0.2 | -0.4 | -0.3 | -0.3 | -0.2 | ||||
| Pneumonia/PTE | n | 2 | 0 | 0 | 0 | 0 | 0 | 0 | 0 | 1 | 0 | 0 | |||
| % | 4.2% | 0.0% | 0.0% | 0.0% | 0.0% | 0.0% | 0.0% | 0.0% | 25.0% | 0.0% | 0.0% | ||||
| Rest | 1 | -1.1 | -0.5 | -0.1 | -0.1 | -0.4 | -0.2 | -0.4 | 3.1 | -0.3 | -0.2 | ||||
| Pneumonia/CHF | n | 5 | 8 | 4 | 1 | 0 | 2 | 0 | 2 | 1 | 0 | 1 | |||
| % | 10.4% | 15.1% | 28.6% | 100.0% | 0.0% | 33.3% | 0.0% | 33.3% | 25.0% | 0.0% | 50.0% | ||||
| Rest | -1.1 | -0.4 | 1 | 2 | -0.4 | 1 | -0.6 | 1 | 0.4 | -0.7 | 1.1 | ||||
| PTE/Atelectasis | n | 1 | 0 | 0 | 0 | 0 | 0 | 0 | 0 | 0 | 0 | 0 | |||
| % | 2.1% | 0.0% | 0.0% | 0.0% | 0.0% | 0.0% | 0.0% | 0.0% | 0.0% | 0.0% | 0.0% | ||||
| Rest | 1.1 | -0.6 | -0.3 | -0.1 | -0.1 | -0.2 | -0.1 | -0.2 | -0.2 | -0.1 | -0.1 | ||||
| PTE/Metastasis | n | 0 | 1 | 0 | 0 | 0 | 0 | 0 | 0 | 0 | 0 | 0 | |||
| % | 0.0% | 1.9% | 0.0% | 0.0% | 0.0% | 0.0% | 0.0% | 0.0% | 0.0% | 0.0% | 0.0% | ||||
| Rest | -0.6 | 1 | -0.3 | -0.1 | -0.1 | -0.2 | -0.1 | -0.2 | -0.2 | -0.1 | -0.1 | ||||
| PTE/CHF | n | 1 | 0 | 0 | 0 | 0 | 1 | 0 | 0 | 0 | 0 | 0 | |||
| % | 2.1% | 0.0% | 0.0% | 0.0% | 0.0% | 16.7% | 0.0% | 0.0% | 0.0% | 0.0% | 0.0% | ||||
| Rest | 0.4 | -0.9 | -0.4 | -0.1 | -0.1 | 3.1 | -0.2 | -0.3 | -0.2 | -0.2 | -0.2 | ||||
Abbreviations: BSH- British shorthair; CHF- congestive heart failure; DSH- domestic shorthair; n - number of observations NFC – Norwegian forest cat; p - statistical significance; PLD – parenchymal lung disease; PTE – pulmonary thromboembolic disease; RBC - Russian Blue Cat; Vc - effect size; χ2 - chi square test result.
Table 10.
Comparison of heart diseases in terms of diagnosis.
| ACVIM classification | |||||||||||||||
| B2 | C | D | Heart Tumor | ||||||||||||
| Diagnosis | n | % | Rest | n | % | Rest | n | % | Rest | n | % | Rest | χ2 | p | Vc |
| ARDS | 6 | 8.0% | 2.34 | 4 | 2.0% | -0.9 | 0 | 0.0% | -0.93 | 0 | 0.0% | -0.71 | 344.08 | <0.001 | 0.6 |
| PLD | 3 | 4.0% | 1.65 | 1 | 0.5% | -1.2 | 1 | 3.7% | 0.87 | 0 | 0.0% | -0.5 | |||
| Tumor | 9 | 12.0% | 2.45 | 8 | 4.1% | -0.8 | 0 | 0.0% | -1.21 | 0 | 0.0% | -0.93 | |||
| Tumor/Atelectasis | 3 | 4.0% | 1.03 | 1 | 0.5% | -1.61 | 0 | 0.0% | -0.78 | 3 | 18.8% | 4.43 | |||
| Tumor/Metastasis | 4 | 5.3% | 1.04 | 0 | 0.0% | -2.5 | 0 | 0.0% | -0.93 | 6 | 37.5% | 7.69 | |||
| Tumor/granuloma | 1 | 1.3% | 1.56 | 0 | 0.0% | -0.79 | 0 | 0.0% | -0.29 | 0 | 0.0% | -0.23 | |||
| Tumor/CHF | 0 | 0.0% | -0.85 | 3 | 1.5% | 0.82 | 0 | 0.0% | -0.51 | 0 | 0.0% | -0.39 | |||
| Atelectasis | 2 | 2.7% | 1.52 | 1 | 0.5% | -0.64 | 0 | 0.0% | -0.51 | 0 | 0.0% | -0.39 | |||
| Atelectasis/CHF | 0 | 0.0% | -2.39 | 10 | 5.1% | -1.29 | 14 | 51.9% | 8.31 | 0 | 0.0% | -1.11 | |||
| Atelectasis/CHF/PLD | 0 | 0.0% | -0.49 | 1 | 0.5% | 0.48 | 0 | 0.0% | -0.29 | 0 | 0.0% | -0.23 | |||
| PE | 0 | 0.0% | -0.49 | 1 | 0.5% | 0.48 | 0 | 0.0% | -0.9 | 0 | 0.0% | -0.23 | |||
| Metastasis | 6 | 8.0% | 1.11 | 5 | 2.6% | -1.58 | 0 | 0.0% | -1.17 | 5 | 31.3% | 4.63 | |||
| Metastasis/Atelectasis | 0 | 0.0% | -0.85 | 2 | 1.0% | 0.09 | 0 | 0.0% | -0.51 | 1 | 6.3% | 2.17 | |||
| Pneumonia/ARDS | 2 | 2.7% | 1.52 | 1 | 0.5% | -0.64 | 0 | 0.0% | -0.51 | 0 | 0.0% | -0.39 | |||
| Pneumonia | 22 | 29.3% | 1.95 | 33 | 16.8% | -0.82 | 5 | 18.5% | -0.11 | 1 | 6.3% | -1.2 | |||
| Pneumonia/PLD | 2 | 2.7% | 1.07 | 2 | 1.0% | -0.31 | 0 | 0.0% | -0.59 | 0 | 0.0% | -0.45 | |||
| Pneumonia/Atelectasis | 12 | 16...0% | 3.71 | 6 | 3.1% | -1.56 | 0 | 0.0% | -1.24 | 0 | 0.0% | -0.96 | |||
| Pneumonia/Atelectasis/CHF | 2 | 2.7% | -0.25 | 8 | 4.1% | 0.7 | 0 | 0.0% | -0.93 | 0 | 0.0% | -0.71 | |||
| Pneumonia/PTE | 0 | 0.0% | -0.85 | 2 | 1.0% | 0.09 | 1 | 3.7% | 1.46 | 0 | 0.0% | -0h.39 | |||
| Pneumonia/PTE/ARDS | 1 | 1.3% | 1.56 | 0 | 0.0% | -0.79 | 0 | 0.0% | -0.29 | 0 | 0.0% | -0.23 | |||
| Pneumonia/CHF | 0 | 0..0% | -4.96 | 100 | 51.0% | 4.45 | 3 | 11.1% | -1.97 | 0 | 0.0% | -2.29 | |||
| Pneumonia/CHF/ARDS | 0 | 0.0% | -0.49 | 1 | 0.5% | 0.48 | 0 | 0.0% | -0.29 | 0 | 0.0% | -0.23 | |||
| PTE | 0 | 0.0% | -0.85 | 1 | 0.5% | -0.64 | 2 | 7.4% | 3.43 | 0 | 0.0% | -0.39 | |||
| PTE/CHF | 0 | 0.0% | -0.69 | 1 | 0.5% | -0.22 | 1 | 3.7% | 2 | 0 | 0.0% | -0.32 | |||
| CHF | 0 | 0.0% | -0.98 | 4 | 2.0% | 0.95 | 0 | 0.0% | -0.59 | 0 | 0.0% | -0.45 | |||
Abbreviations: CHF- congestive heart failure; n - number of observations; p - statistical significance; PLD – parenchymal lung disease; PTE – pulmonary thromboembolic disease; Vc - effect size; χ2 - chi square test result.
Disclaimer/Publisher’s Note: The statements, opinions and data contained in all publications are solely those of the individual author(s) and contributor(s) and not of MDPI and/or the editor(s). MDPI and/or the editor(s) disclaim responsibility for any injury to people or property resulting from any ideas, methods, instructions or products referred to in the content. |
© 2024 by the authors. Licensee MDPI, Basel, Switzerland. This article is an open access article distributed under the terms and conditions of the Creative Commons Attribution (CC BY) license (http://creativecommons.org/licenses/by/4.0/).
Copyright: This open access article is published under a Creative Commons CC BY 4.0 license, which permit the free download, distribution, and reuse, provided that the author and preprint are cited in any reuse.


